Indications of Suppression of Excited Upsilon States in Pb-Pb Collisions at sNN=2.76TeV
Upload
khangminh22Category
view
3download
0
[© 2007 Lily Chin, all rights reserved]
Investigations into Lead (Pb) Accumulation in
Symphytum officinale L.:
A Phytoremediation Study
A thesis
submitted in fulfilment
of the requirements for the degree
of
Doctor of Philosophy in Plant Biotechnology
by
Lily Chin
School of Biological Sciences
2007
i
ABSTRACT
Lead (Pb) is the number one heavy metal pollutant in the environment. The high cost
and environmental concerns of conventional remediation technologies has led to an
emerging alternative technology for heavy metal remediation: phytoremediation. This
study was set out to advance Pb phytoremediation by investigating plant-associated
factors (e.g. polyphenol levels, Pb-tannin chelation, and superoxide dismutase activity)
and chemical-based factors (e.g. concentration of Pb, and the type and dosage of
chelating agents in treatments) that may affect Pb accumulation.
Using a hydroponic system, sand-grown Symphytum officinale L. plants were
exposed to nutrient solutions with or without lead nitrate (Pb(NO3)2) and
ethylenediamine tetraacetic acid (EDTA). Using flame atomic absorption spectroscopy
(to measure Pb content) and bovine serum albumin-protein precipitation (to measure
polyphenol and tannin levels), a significant in vivo correlation between tannin level and
Pb accumulation level was observed in roots of plants exposed to all Pb treatments.
Higher tannin containing-lateral roots accumulated significantly more Pb than lower-
tannin main roots. Transmission electron micrographs of unchelated Pb-treated plants
supported these findings, whilst dialysis-based in vitro Pb-chelation studies with crude
S. officinale root polyphenol extracts did not. The dialysis method was likely to be
subject to fructan interference. A new, more accurate and simple method based on
tannin immobilisation was consequently developed. Results using this method
supported the hydroponic trends. This new method was also verified with purified
tannic acid (from Sigma). Together, these findings demonstrate that S. officinale root
tannins have the ability to chelate Pb. This may be a mechanism to cope with Pb stress
(adaptive tolerance). Despite the typical signs of Pb stress at root level (e.g. root growth
inhibition, and degraded cytoplasms), shoots showed no signs of stress under any Pb
treatments. Most importantly, since this chelation-based tolerance mechanism also
influences the accumulation levels, the phytochemical composition of plants should also
be considered when screening plants for phytoremediation.
The level of Pb accumulated in the shoots depended on the concentration of
Pb(NO3)2 and presence of chelating agents (EDTA or N-[2 acetamido] iminodiacetic
acid (ADA)) in the nutrient solution. The highest level of Pb in shoots was between
0.05-0.06% (d.w. on average) using EDTA or ADA, well short of the 1% (d.w.) shoot
accumulation target for Pb phytoextraction. The highest level of Pb in the roots (and of
ii
all measurements) was with unchelated 500 μM Pb(NO3)2; on average 2% (d.w.)
accumulated in root. Overall, since S. officinale accumulated Pb predominately in the
roots, it is most suited for rhizofiltration and phytostabilisation. Whilst chelating agents
enhanced Pb accumulation in shoots, root levels were unexpectedly reduced compared
to unchelated Pb treatments. The level of Pb translocated did not completely account for
this loss. Minor factors relating to EDTA desorption of roots, EDTA specificity, and
charge repulsion of the PbEDTA complex may account for some of the loss, but the
main cause remains unclear.
In vitro S. officinale cultures were developed and somaclonal variation (involving
Pb pre-treatment of petioles) was used as a tool to further investigate, and attempt to
improve its Pb phytoremediation potential. The shoots and roots of plants produced
from petioles pre-treated with Pb(NO3)2 appeared more stressed than those without Pb
pre-treatment. After re-treatment with Pb (Pb(NO3)2 or PbADA), plants developed from
most Pb pre-treated petioles appeared to have reduced Pb accumulation and polyphenol
levels, and increased superoxide dismutase activity in roots (although no statistically
significant trends were found). Overall, plants produced from Pb pre-treated petioles in
this study may have less phytoremediation potential.
iv
TABLE OF CONTENTS
Page
ABSTRACT………………………………………………………….…………...…….
TABLE OF CONTENTS……………………………………………….……….…..
LIST OF FIGURES……………………...…………………………………….…...
LIST OF PLATES……………………………………………………….……...…..
LIST OF TABLES………………………………………………………………......
ABBREVIATIONS……………………………………………………………....…
ACKNOWLEDGEMENTS………………………………………………….…....
CHAPTER 1: INTRODUCTION
1 HEAVY METALS..............................................................................................1
1.1 Definitions................................................................................................1
1.2 Sources of heavy metal pollution ..............................................................2
2 LEAD..................................................................................................................2
2.1 Lead pollution...........................................................................................2
2.2 Effect of lead on human health..................................................................3
2.3 Effect of lead on plant growth ...................................................................3
3 HEAVY METAL REMEDIATION TECHNOLOGIES..................................5
3.1 Conventional remediation technologies.....................................................5
3.2 Alternative remediation technologies (I) – Micro-organisms .....................6
3.3 Alternative remediation technologies (II) − Phytoremediation...................7
3.3.1 Origin of phytoremediation concept ..............................................7
3.3.2 Phytoremediation: definition and classes .......................................7
3.3.3 ‘Pros and cons’ of phytoremediation..............................................8
3.3.4 Ideal attributes of phytoextraction plants .......................................9
3.3.5 Plants used for lead phytoextraction ............................................10
i
iii
xiv
xix
xxi
xxii
xxiv
iv
4 HEAVY METAL UPTAKE BY PLANTS ......................................................11
4.1 Factors influencing heavy metal bioavailability.......................................11
4.1.1 Physical and biological factors ....................................................12
4.1.2 Chemical factors (I): soil chemistry .............................................12
4.1.3 Chemical factors (II): chelating agents.........................................12
4.2 Heavy metal uptake, transport and accumulation.....................................13
4.2.1 Metal uptake and transport ..........................................................13
4.2.2 Movement route and accumulation of lead in plant tissues...........15
5 HEAVY METAL STRESS AND TOLERANCE IN PLANTS ......................16
5.1 Positive effects of reactive oxygen species (ROS) ...................................17
5.2 Negative effects of ROS and the antioxidative defence system................17
5.3 Lead and oxidative stress ........................................................................18
6 HEAVY METAL TOLERANCE MECHANISMS ........................................18
7 MECHANISM 1 (PART I): CONTROLLING METAL-ION LEVELS .......19
7.1 Tissue isolation.......................................................................................19
7.2 Cellular isolation.....................................................................................19
7.3 Detoxification by ligand chelation...........................................................20
8 MECHANISM 1 (PART II): METAL-POLYPHENOL CHELATION........21
8.1 Polyphenols: class and structure..............................................................21
8.1.1 Classes of polyphenols ................................................................21
8.1.2 Tannins .......................................................................................22
8.2 General roles of plant polyphenols ..........................................................22
8.3 Location of polyphenols in plants............................................................24
8.3.1 Polyphenols at cellular level ........................................................24
8.3.2 Polyphenols at tissue level...........................................................25
8.4 Heavy metal tolerance: chelation to polyphenols? ...................................26
9 MECHANISM 2: THE ANTIOXIDATIVE DEFENCE SYSTEM (ADS) ....27
9.1 Superoxide dismutase (SOD) ..................................................................27
9.2 Role of SOD in heavy metal tolerance ....................................................27
10 TISSUE CULTURE AND PHYTOREMEDIATION.....................................28
Chapter 2 − Materials and methods 67
11 MUTANT STUDIES AND PHYTOREMEDIATION………..……...………
11.1 Somaclonal variation approach………………………………………...
11.1.1 Type and advantages…………………………………………...
11.1.2 Induced somaclonal variation…………………………………..
11.1.3 Developing heavy metal tolerant plants………………...……..
11.2 Genetic modification approach…………………………………………
11.2.1 Transgenic plants……………………………………………….
11.2.2 Risks associated with genetic engineering……………………..
11.3 Chemical mutagenesis and Arabidopsis thaliana………………...……
12 SYMPHYTUM OFFICINALE L. (COMFREY)……………………………..
13 AIM AND OBJECTIVES………………………………………………...…...
CHAPTER 2: MATERIALS AND METHODS
OBJECTIVE 1
1 PLANT PROPAGATION ................................................................................38
1.1 Root stock ............................................................................................38
1.2 Vegetative plant propagation ................................................................38
2 POLYPHENOL STUDIES...............................................................................39
2.1 Histochemical studies...........................................................................39
2.1.1 Detection of polyphenols ..........................................................39
2.1.2 Class of tannins.........................................................................39
2.2 Factors affecting polyphenol analysis ...................................................39
2.3 Polyphenol and tannin extraction..........................................................40
2.3.1 Sample preparation ...................................................................40
2.3.2 Extraction methods ...................................................................40
2.4 Polyphenol quantification.....................................................................40
2.4.1 Folin-Ciocalteu assay for polyphenols ......................................42
2.4.2 BSA-protein precipitation assay for polyphenols.......................42
2.4.3 Folin-Ciocalteu assay for tannins ..............................................42
2.4.4 BSA-protein precipitation assay for tannins ..............................43
3 LEAD ACCUMULATION STUDIES (I) ........................................................43
32
33
34
35
35
29
29
29
30
31
31
v
Chapter 2 − Materials and methods 68
3.1 Lead effects..........................................................................................43
3.2 Lead accumulation – hydroponic experiments ......................................43
3.2.1 Lead treatment in hydroponic nutrient solution .........................43
3.2.2 Preparation of plant material for lead analysis...........................44
3.2.3 Measurement of lead level in samples.......................................46
4 TRANSMISSION ELECTRON MICROSCOPY ...........................................46
4.1 Preparation of ultra-thin sections ..........................................................46
4.1.1 Fixation ....................................................................................46
4.1.2 Post-fixation .............................................................................47
4.1.3 Dehydration..............................................................................47
4.1.4 Infiltration ................................................................................47
4.1.5 Embedding ...............................................................................47
4.1.6 Sectioning.................................................................................47
4.2 Microscopy ..........................................................................................47
5 IN VITRO LEAD CHELATION TO POLYPHENOLS .................................48
5.1 Established protocol: Lavid’s dialysis method ......................................48
5.2 Developing a new method: PVPP-immobilised tannin method .............48
5.2.1 Plant material............................................................................49
5.2.2 Polyphenol extraction and assay ...............................................49
5.2.3 Preparation of immobilised root tannins....................................49
5.2.4 Lead chelation to immobilised root tannins...............................51
5.3 Lead chelation to immobilised lateral root tannins................................51
5.4 Lead chelation to immobilised purified tannic acid...............................52
OBJECTIVE 2
6 LEAD ACCUMULATION STUDIES (II).......................................................52
6.1 Effect of EDTA level on lead accumulation..........................................53
6.2 Effect of 500 µM Pb(NO3)2 level on lead accumulation........................53
7 LEAD UPTAKE STUDIES (III): EDTA STUDIES........................................53
7.1 EDTA pre-treatment studies .................................................................54
7.1.1 Root segment test......................................................................54
vi
Chapter 2 − Materials and methods 69
7.1.2 Whole plant test........................................................................54
7.2 Lead accumulation: alternative chelators (ADA) ..................................55
8 DEVELOPING SYMPHYTUM OFFICINALE IN TISSUE CULTURE.......55
8.1 Explant selection ..................................................................................55
8.2 Sterilisation regime ..............................................................................56
8.3 Media development ..............................................................................56
8.3.1 Callus induction media (CIM)...................................................56
8.3.2 Callus growth media (CGM).....................................................57
8.3.3 Root and whole plant induction media (RIM, WPIM) ...............57
8.3.4 Propagation of Symphytum officinale plant lines .......................58
OBJECTIVE 3
9 IN VITRO LEAD-TREATED PLANTS ..........................................................58
9.1 Whole plants pre-treated with lead .......................................................58
9.1.1 Pre-treatment # 1: 0, 500 µM PbEDTA, pH 4.5 ........................59
9.1.2 Pre-treatment # 2: 0, 500 µM PbEDTA, pH 7.0 ........................59
9.1.3 Pre-treatment # 3: 0, 500 µM PbEDTA and PbADA, pH 7.0.....60
9.2 Shoots from sand-grown plants pre-treated with lead............................60
9.3 Petioles from in vitro shoots pre-treated with lead ................................60
9.3.1 Pre-treatment # 4: 0 to 500 µM Pb(NO3)2, pH 4.5 .....................60
9.3.2 Pre-treatment # 5: 0, 500 µM Pb(NO3)2 and PbADA, pH 4.5 ....60
9.4 Propagation of plants pre-treated with lead...........................................61
9.5 Re-treatment regime.............................................................................61
10 INDICATOR TESTS FOR POTENTIAL MUTANTS...................................62
10.1 Histochemical localisation of superoxide anions...................................63
10.1.1 Leaf discs ...............................................................................63
10.1.2 Petiole sections .......................................................................64
10.1.3 Roots of intact whole plants ....................................................64
10.2 Superoxide dismutase (SOD) activity ...................................................64
10.2.1 Extraction ...............................................................................64
10.2.2 Superoxide dismutase assay....................................................65
vii
10.2.3 Total protein assay………………………………………………66
11 STATISTICAL ANALYSIS……………………………………………….….. 66
CHAPTER 2: RESULTS AND DISCUSSION
OBJECTIVE 1
1 PLANT PROPAGATION................................................................................... 67
2 POLYPHENOL STUDIES ................................................................................. 67
2.1 Histochemical detection of polyphenols................................................. 67
2.2 Class of tannins....................................................................................... 68
2.3 Factors affecting polyphenol analysis..................................................... 68
2.3.1 Tannin recovery after freeze-drying............................................ 71
2.3.2 Number of extraction rounds....................................................... 71
2.3.3 Extraction solvent........................................................................ 71
2.3.4 Type of quantitative assay........................................................... 75
2.3.5 Extraction method and time ........................................................ 76
2.3.6 Overall methods chosen .............................................................. 80
2.4 Distribution of polyphenol and tannins in Symphytum officinale........... 80
3 LEAD ACCUMULATION STUDIES (I) .......................................................... 83
3.1 Ashing temperature................................................................................. 83
3.2 Lead effect on plants: visual observations.............................................. 83
4 ROLE OF POLYPHENOLS IN LEAD ACCUMULATION.......................... 85
4.1 Hydroponic conditions............................................................................ 85
4.2 Pb uptake and accumulation ................................................................... 86
4.3 Effect of lead treatments on polyphenol and tannin levels ..................... 89
4.4 Transmission electron microscopy (TEM) ............................................. 92
5 CORRELATION BETWEEN TANNIN AND LEAD ACCUMULATION 113
5.1 Other possible factors for lead accumlation trends............................... 113
5.1.1 Root volume .............................................................................. 113
viii

5.1.2 Root age..................................................................................... 113
6 IN VITRO LEAD CHELATION TO TANNINS ............................................ 114
6.1 Lavid’s dialysis method (I) ................................................................... 114
6.1.1 Established protocol .................................................................. 114
6.1.2 Modified protocol...................................................................... 115
6.1.3 Fructan interference (I).............................................................. 121
6.1.4 Fructan interference (II): Direct experimental evidence ........... 122
6.2 New appproach: Lead chelation to immobilised tannins...................... 124
6.2.1 Approach to experimental design.............................................. 124
6.2.2 In vitro lead chelation by lateral and main root tannins ............ 125
6.2.3 Linear in vitro chelation ............................................................ 133
6.3 Lead chelation to immobilised tannins: general points ........................ 133
6.4 Validating immobilised tannin method: purified tannins ..................... 136
6.4.1 In vitro lead chelation: purified tannic acid............................... 136
6.4.2 In vitro lead chelation: fructan-spiked purified tannic acid ...... 139
6.4.3 In vitro chelation observations .................................................. 143
OBJECTIVE 2
7 LEAD ACCUMULATION STUDIES (II) ...................................................... 145
7.1 Effect of increasing EDTA concentration on lead accumulation ......... 145
7.2 Effect of 500 μM Pb(NO3)2 exposure level ......................................... 147
8 WHY DOES EDTA REDUCE LEAD ACCUMULATION IN ROOTS?.... 150
8.1 EDTA pre-treated root segments .......................................................... 151
8.1.1 Effect of EDTA pre-treatment on lead accumulation level....... 151
8.1.2 Effect of EDTA pre-treatment on root appearance ................... 151
8.2 EDTA pre-treated whole plants ............................................................ 155
8.2.1 Effect of EDTA pre-treatment on lead accumulation level....... 155
8.2.2 Effect of EDTA pre-treatment on root appearance ................... 155
ix
8.3 Alternative chelating agents.................................................................. 159
8.3.1 Why choose ADA?.................................................................... 159
8.3.2 EDTA vs. ADA: comparison of chelating agents ..................... 163
8.4 Explanations for reduction of lead in roots treated with PbEDTA....... 163
8.4.1 Explanation 1: root charge repulsion......................................... 163
8.4.2 Explanation 2: EDTA is not a lead specific chelating agent ..... 169
8.4.3 Other explanations..................................................................... 171
OBJECTIVE 3
9 DEVELOPING IN VITRO SYMPHYTUM OFFICINALE CULTURES ..... 174
9.1 Somaclonal variation approach............................................................. 174
9.2 Explant and sterilisation........................................................................ 174
9.2.1 Explant choice ........................................................................... 174
9.2.2 Sterilization and placement on media ....................................... 174
9.3 Media development............................................................................... 175
9.3.1 Callus induction media (CIM): sterilised petiole explants........ 175
9.4 Callus growth media (CGM): in vitro petiole tissue............................. 176
9.5 Root and whole plant induction media (RIM, WPIM) ......................... 182
9.5.1 Root induction media (RIM): in vitro shoots ............................ 182
9.5.2 Whole plant induction media (WPIM): in vitro crown tissue ... 182
9.6 MS N(0)/ F(0) liquid media .................................................................. 183
10 DEVELOPING SYMPHYTUM OFFICINALE LEAD MUTANTS.............. 194
10.1 Lead treatment of whole in vitro plants ................................................ 194
10.1.1 Pre-treatment # 1: 0, 500 μM PbEDTA (no sucrose, pH 4.5)... 194
10.1.2 Pre-treatment # 2: 0, 500 μM PbEDTA (no sucrose, pH 7.0)... 194
10.1.3 Pre-treatment # 3: 0, 500 μM PbEDTA and 500μM PbADA,
(2% (w/v) sucrose, pH 7.0) ....................................................... 195
10.2 Regeneration ability of stock plant tissues ........................................... 195
x
10.3 Lead pre-treatment of shoot cuttings .................................................... 200
10.3.1 Pre-treatment of sand-grown (non-sterile) petioles................... 200
10.3.2 Pre-treatment # 4: 0, 100, 250 and 500 μM Pb(NO3)2 (pH 4.5)
(in vitro petioles) ....................................................................... 200
10.3.3 Pre-treatment # 5: 0, 500 μM Pb(NO3)2 and 500 μM PbADA
(pH 4.5) (in vitro petioles)......................................................... 203
10.4 Lead levels in pre-treated in vitro shoot cuttings.................................. 204
10.4.1 Pre-treatment # 4: 0, 100, 250 and 500 μM Pb(NO3)2, pH 4.5..204
10.4.2 Pre-treatment # 5: 0, 500 μM Pb(NO3)2 and 500 μM PbADA,
pH 4.5 ........................................................................................ 204
11 INDICATOR TESTS FOR POTENTIAL MUTANTS.................................. 212
11.1 Histochemical detection of superoxide anions ..................................... 212
11.1.1 Plant segments (preliminary NBT protocol design).................. 212
11.1.2 Whole plants: root tissue staining patterns................................ 213
11.1.3 Overall interpretations............................................................... 213
11.2 Analysis of superoxide dismutase (SOD) activity................................ 217
11.2.1 Extract stability.......................................................................... 217
11.2.2 Extraction buffer........................................................................ 217
11.2.3 Distribution of SOD in Symphytum officinale........................... 218
12 LEAD RE-TREATMENT................................................................................. 222
12.1 Pre-treatment # 4................................................................................... 222
12.1.1 Effect of pre-treatment on lead, polyphenol and SOD levels
upon re-treatment with 500 μM PbADA................................... 222
12.1.2 Effect of pre-treatment on lead, polyphenol and SOD levels
upon re-treatment with 500 μM Pb(NO3)2 ................................ 223
12.2 Pre-treatment # 5................................................................................... 230
12.2.1 Effect of pre-treatment on lead, polyphenol and SOD levels.... 230
xi
CHAPTER 4: FURTHER DISCUSSION AND CONCLUSIONS
1 OBJECTIVE 1................................................................................................... 234
1.1 Plant selection.......................................................................................... 234
1.2 Polyphenols in Symphytum officinale...................................................... 235
1.3 Determining tolerance and accumulation for objective 1........................ 235
1.3.1. Evidence for role of tannins in lead accumulation and adaptive
tolerance in Symphytum officinale.............................................. 236
1.3.2. Significance of lead-tannin chelation to phytoremediation........ 237
1.3.3. The immobilised tannin protocol................................................ 239
2 OBJECTIVE 2................................................................................................... 240
2.1 Phytoremediation potential...................................................................... 240
2.1.1. Phytoextraction potential of Symphytum officinale .................... 240
2.1.2. Rhizofilitration and phytostabilisation potential ........................ 242
2.2 Why did EDTA reduce lead accumulation in roots?............................... 243
2.2.1. Other possible factors: root exodermis....................................... 244
3 OBJECTIVE 3................................................................................................... 246
3.1 Development of in vitro Symphytum officinale lines .............................. 246
3.2 Somaclonal variation and phytoremediation ........................................... 246
3.3 Plants grown from lead pre-treated petioles............................................ 248
3.3.1. Developing plants from lead pre-treated petioles....................... 248
3.3.2. Effect of lead treatment on in vitro plants .................................. 248
3.3.3. Effect of lead pre-treatment and re-treatment with lead............. 248
4 FUTURE STUDIES .......................................................................................... 250
4.1 Objective 1............................................................................................... 250
4.1.1. Microscopy ................................................................................. 250
4.1.2. In vitro lead-tannin chelation ..................................................... 252
4.2 Objective 2............................................................................................... 252
4.2.1. Pb accumulation studies ............................................................. 252
4.2.2. Polyphenol polymerisation......................................................... 254
4.3 Objective 3............................................................................................... 254
xii
4.3.1. Symphytum officinale tissue culture ........................................... 254
4.3.2. Trends based on levels................................................................ 255
4.3.3. Engineered phytoremediators ..................................................... 256
REFERENCES……………………………………………………..………………….…...
APPENDIX A………………………………………………………………………...
APPENDIX B…………………………………………………………………...……
APPENDIX C………………………………………………………………………...
APPENDIX D………………………………………………………………………...
APPENDIX E…………………………………………………………………...……
APPENDIX F………………………………………………………………………...
APPENDIX G…………………………………………………………………..…….
APPENDIX H……………………………………………………………………...…
APPENDIX I………….……………………………………………………...…....….
APPENDIX J…………………………………………………………………………
APPENDIX K……………………………………...…………………………………
258
285
287
288
289
290
291
292
293
294
295
296
xiii
xiv
LIST OF FIGURES
Figure Page
1. ROS production………………………………………………………... 17
2. Example of condensed (A) and hydrolysable tannins (B)…………….. 23
3. In vitro Pb-tannin chelation method…………………………………... 50
4. Overall Pb pre-treatment and re-treatment protocol for in vitro Symphytum officinale tissues and plants……………………………….
62
5. Polyphenol level after first (R1) and second (R2) round of extraction... 72
6. A. Effect of 70% (v/v) acetone and 50% (v/v) methanol solvents on polyphenol levels extracted from 3-4 month-old Symphytum officinale roots……………………………………………………………………
B. Effect of 70% (v/v) acetone and 50% (v/v) methanol solvents on tannin levels extracted from 3-4 month-old Symphytum officinale roots………………………………………………………….………...
73
74
7. Comparison of two assays for determination of tannin levels extracted from root tissue of 3-4 month-old Symphytum officinale……………...
77
8. A. Effect of extraction method on polyphenol levels extracted from 3-4 month-old Symphytum officinale main root tissue. ……………….
B. Effect of extraction method on tannin levels extracted from 3-4 month-old Symphytum officinale main root tissue...…………………..
78
79
9. A. Distribution of polyphenols in 3-4 month-old Symphytum officinale.………………………………………………………………
B. Distribution of tannins in 3-4 month-old Symphytum officinale……
……….81
82 10. A. Distribution and accumulation of Pb in 10-month-old Symphytum
officinale shoots after whole plants were treated for seven days in modified HC nutrient solution (pH 4.5) containing 0 (control), or 250 µM Pb(NO3)2 with or without 125 µM EDTA solution..……………..
B. Distribution and accumulation of Pb in 10-month-old Symphytum officinale roots after whole plants were treated for seven days in modified HC nutrient solution (pH 4.5) containing 0 (control), or 250 µM Pb(NO3)2 with or without 125 µM EDTA solution..…...….……..
87
88
11. A. Polyphenol levels extracted from 10-month-old Symphytum officinale roots after whole plants were treated for seven days in modified HC nutrient solution (pH 4.5) containing 0 (control), or 250 µM Pb(NO3) solution with or without 125 µM EDTA solution……...
………………. 90 ……
xv
B. Tannin levels extracted from 10-month-old Symphytum officinale roots after whole plants were treated for seven days in modified HC nutrient solution (pH 4.5) containing 0 (control), or 250 µM Pb(NO3)2 solution with or without 125 µM EDTA solution.. …….…………….
91
12. Region of TEM section in lateral and main root……………………… 93
13. Surface area and volume of roots……………………………………... 114
14. In vitro Pb-polyphenol chelation (Lavid’s dialysis method): Polyphenol levels extracted from10-month-old Symphytum officinale root tissues.…………………………………………………………….
116
15. In vitro Pb-polyphenol chelation (Lavid’s dialysis method): Level of Pb trapped in dialysis tubes (containing Symphytum officinale polyphenols) after 48 hours in 250 µM Pb(NO3)2 salt solution at pH 4.5.……………
117
16. In vitro Pb-polyphenol chelation (modified Lavid’s dialysis protocol): Polyphenol levels extracted from 3-4 month-old Symphytum officinale root tissues..……………………………………………………………
118
17. In vitro Pb-polyphenol chelation (modified Lavid’s dialysis protocol): Level of Pb trapped in dialysis tubes (containing Symphytum officinale polyphenols) after 48 hours in 250 mg/L Pb(NO3)2 salt solution at pH 4.5..……………...…………...…………………………
119
18. In vitro Pb-inulin chelation (Lavid’s dialysis protocol): Level of Pb trapped in dialysis tubes (containing purified chicory inulin) after 48 hours in 250 mg/L Pb(NO3)2 salt solution at pH 4.5..…………………
123
19. In vitro Pb-tannin chelation (immobilised tannin method): Polyphenol and tannin levels extracted from 3-month-old Symphytum officinale root tissue...….…………………………………………………………
126
20. In vitro Pb-tannin chelation (immobilised tannin method): Level of Pb remaining in the upper layer after treatment with PVPP, with or without immobilised tannins from 3-month-old Symphytum officinale lateral root or main root tissues, after four hours. …………….……….
127
21. A and B. In vitro Pb-tannin chelation: Ratio of Pb to tannin…………. 132
22. In vitro Pb-tannin chelation (immobilised tannin method): Level of Pb removed from the upper layer of 50 mg/L Pb(NO3)2 salt solution (pH 4.5) after treatment with increasing concentrations of 3-month-old Symphytum officinale lateral root tannins immobilised to PVPP for two hours…………………..……………………………………….
134
23. Pb:tannin ratio trend from in vitro Pb chelation experiment using tannins from 3-month-old Symphytum officinale lateral root immobilised to PVPP (Figure 22). ……………………………………
135
24. In vitro Pb-tannin chelation (immobilised tannin method): Percentage of Pb (element) in the upper layer of 100 mg/L Pb(NO3)2 salt solution (pH 4.5) removed by chelation to increasing concentrations of purified tannic acid (tannin) immobilised to PVPP..…………………….……..
137
xvi
25. In vitro Pb-tannin chelation (immobilised tannin method): Level of purified tannic acid (tannin) bound to 0.02g of PVPP pellet...………...
138
26. In vitro Pb-tannin chelation (immobilised tannin method): Level of Pb remaining in the upper layer of 50 mg/L Pb(NO3)2 salt solution (pH 4.5) after two hours of treatment with increasing concentrations of purified tannins immobilised to PVPP..…………….………………
140
27. In vitro Pb-tannin chelation (immobilised tannin method): Exponential decrease in Pb:tannin ratio (mg Pb:mg tannic acid) of values from Figure 26. ..……………………………………………….
141
28. In vitro Pb-tannin chelation (immobilised tannin method): Level of Pb remaining in the upper layer of 50 mg/L Pb(NO3)2 salt solution (pH 4.5) after two hours of treatment with increasing concentrations of purified tannins immobilised to PVPP and spiked with purified chicory inulin……………….………………………………………….
142
29. Effect of increasing EDTA concentrations on Pb accumulation level in 3-month-old Symphytum officinale roots and shoots of whole plants treated for seven days in modified HC nutrient solution (pH 4.5) containing 0 (control), or 250 µM Pb(NO3)2 with 250, 500 or 750 µM EDTA……………………………………………………...
146
30. A. Pb accumulation level in 3-month-old Symphytum officinale shoots of whole plants treated for seven days in modified HC nutrient solution (pH 4.5) containing 0 (control), or 500 µM Pb(NO3)2 with or without 500 µM EDTA solution…………………………...…………..
B. Pb accumulation level in 3-month-old Symphytum officinale roots of whole plants treated for seven days in modified HC nutrient solution (pH 4.5) containing 0 (control), or 500 µM Pb(NO3)2 with or without 500 µM EDTA solution……………………….………………
148
149
31. Pb accumulation level in Symphytum officinale lateral root segments after the three and seven day test with Pb(NO3)2………………..…….. 152
32. Pb accumulation level in Symphytum officinale lateral root segments after the three and seven day test with PbEDTA...……………………. 153
33. A. Colour of Symphytum officinale lateral root segments roots after 72 hours pre-treatment in modified HC nutrient solution (pH 4.5) with or without 500 µM EDTA (part of seven day test).
B. Polyphenol levels extracted from Symphytum officinale lateral root segments after the three day test..……………………………………...
154
34. A. Pb accumulation levels in 3-month-old Symphytum officinale roots of whole plants pre-treated for three days in modified HC nutrient solution (pH 4.5), with or without 500 µM EDTA, followed by four days in modified HC nutrient solution (pH 4.5) containing 0 (control), or 500 µM Pb(NO3)2 with or without 500 µM EDTA…..……………..
156
xvii
B. Pb accumulation levels in 3-month-old Symphytum officinale shoots of whole plants pre-treated for three days in modified HC nutrient solution (pH 4.5), with or without 500 µM EDTA, followed by four days in modified HC nutrient solution (pH 4.5) containing 0 (control), or 500 µM Pb(NO3)2 with or without 500 µM EDTA………
157
35. Polyphenol levels (A) and tannin levels (B) extracted from 3-month-old Symphytum officinale roots of whole plants pre-treated for three days in modified HC nutrient solution (pH 4.5), with or without 500 µM EDTA, followed by four days in modified HC nutrient solution (pH 4.5) containing 0 (control), or 500 µM Pb(NO3)2 with or without 500 µM EDTA…………………………………………………………
161
36. Fe levels in 3-month-old Symphytum officinale roots of whole plants pre-treated for three days in modified HC nutrient solution (pH 4.5), with or without 500 µM EDTA, followed by four days in modified HC nutrient solution (pH 4.5) containing 0 (control), or 500 µM Pb(NO3)2 with or without 500 µM EDTA………….………………….
162
37. A. Pb accumulation levels in 3-month-old Symphytum officinale roots of whole plants treated for seven days in modified HC nutrient solution (pH 7.0) containing 0 (control), 500 µM Pb(NO3)2 with 500 µM EDTA or ADA………………….…………………………………
B. Pb accumulation levels in 3-month-old Symphytum officinale shoots of whole plants treated for seven days in modified HC nutrient solution (pH 7.0) containing 0 (control), 500 µM Pb(NO3)2 with 500 µM EDTA or ADA………………….…………………………………
164
165
38. Effect of different chelating agents on Fe levels in 3-month-old Symphytum officinale roots of whole plants pre-treated for seven days in modified HC nutrient solution (pH 7.0) containing 0 (control), or 500 µM Pb(NO3)2 with 500 µM EDTA or 500 µM ADA…………….
166
39. A. [PbEDTA]2- ion repulsion by polyphenols. B and C. [PbEDTA]2- interaction with iron oxides. ……….………….
168
40. How increased polyphenol polymerization in the root may reduce both Pb2+ and [PbEDTA]2- accumulation: decreased binding sites for Pb2+ and more repulsion at the root surface [PbEDTA]2-…………………...
169
41. Chelation of free Pb ions to iron oxides (A) and polyphenols (B).….... 172
42. A. Pb accumulation level in 3-week-old Symphytum officinale roots of whole plants pre-treated for 14 days in modified HC nutrient solution (pH 7.0) containing 2% (w/v) sucrose with 0 (control), or 500 µM Pb(NO3)2 with or without 500 µM EDTA or ADA…..…...………….
B. and C. Pb accumulation level in 3-week-old Symphytum officinale (B) blade and (C) petiole tissue of whole plants pre-treated for 14 days in modified HC nutrient solution (pH 7.0) containing 2% (w/v) sucrose with 0 (control), or 500 µM Pb(NO3)2 with or without 500 µM EDTA or ADA. ………..…………….……………………...…………
198
199
xviii
43. Pb accumulation level in 4-week-old Symphytum officinale (A) petiole and (B) blade tissue of shoot cuttings after pre-treatment for seven days in modified HC nutrient solution (pH 4.5) containing 2% (w/v) sucrose with 0 (control) to 500 µM Pb(NO3)2………………………...
210
44. Pb accumulation level in 3-week-old Symphytum officinale shoot cuttings (blade and petiole) after pre-treatment for seven days in modified HC nutrient solution (pH 4.5) containing 2% (w/v) sucrose with 0 (control), 500 µM Pb(NO3)2 (Pb), 500 µM Pb(NO3)2 and 500 µM ADA (PbADA 1:1), or 500 µM Pb(NO3)2 and 1000 µM ADA (PbADA 1:2)……………………………….…………………………..
211
45. A. Root tip zones affected by treatments in Table 8…..……..………...
B. Possible superoxide anion levels during treatment and NBT stain....
213
216
46. Stability of SOD extracts from blade tissue after fresh extraction and storage at -80ºC………………………………………………………...
219
47. Comparison of different extraction buffers on SOD activity in blade tissue of in vitro grown Symphytum officinale………………………...
220
48. Distribution of SOD in in vitro grown Symphytum officinale plant tissues…….……………………………………………………………
221
49. A. Morphological measurements of visibly different 4-week-old Symphytum officinale roots of prior to Pb re-treatment (under non-sterile conditions)…..…………………………………………………...
B and C. Morphological measurements of visibly different 4-week-old Symphytum officinale shoot (B) blade and (C) petiole after Pb re-treatment of plants……………………………………………………..
225
226
50. Pb accumulation levels in (A) shoots and (B) roots of 4-week-old Symphytum officinale.………………………………………………....
228
51. Polyphenol levels (A) and SOD activity (B) in roots of 4-week-old Symphytum officinale. ……………………………………………..…..
229
52. Pb accumulation levels in (A) roots and (B) shoots of 4-week-old Symphytum officinale…………………………………………………
231
53. Polyphenol levels (A) and SOD activity (B) in roots of Symphytum officinale. ……………………………………………………………...
232
xix
LIST OF PLATES
Plate Page
1. Lateral and main root of 2-month-old Symphytum officinale…………... 41
2. Hydroponic lead treatment apparatus showing 10-month-old Symphytum officinale (whole plants) after seven days of treatment……. 45
3. Class of tannin in roots of Symphytum officinale (determined by the FeCl3 spot test on polyphenol extracts from root).……………………… 70
4. Effect of increasing Pb(NO3)2 concentrations on 2-month-old Symphytum officinale root growth after three weeks…………………… 84
5. A. Transmission electron micrograph at 30,000 X magnification of an ultra-thin section of Symphytum officinale lateral root treated with 0 µM Pb(NO3)2 (control) for seven days.
B. Transmission electron micrograph at 10,000 X magnification of an ultra-thin section of Symphytum officinale main root treated with 0 µM Pb(NO3)2 (control) for seven days…..………………………….……….
96
6. Transmission electron micrograph at 20,000 X magnification of an ultra-thin section of Symphytum officinale lateral root treated with 250 µM Pb(NO3)2 for seven days……………………….…………………...
98
7. Transmission electron micrograph at 20,000 X magnification of an ultra-thin section of Symphytum officinale lateral root treated with 250 µM Pb(NO3)2 for seven days……………………………………………
100
8. Transmission electron micrograph at 10,000 X magnification of an ultra-thin section of Symphytum officinale lateral root treated with 250 µM Pb(NO3)2 for seven days……………………………………………
102
9. Transmission electron micrograph at 6,000 X magnification of an ultra-thin section of Symphytum officinale main root treated with 250 µM Pb(NO3)2 for seven days………………………………………………...
104
10. Transmission electron micrograph at 7,500 X magnification of an ultra-thin section of Symphytum officinale main root treated with 250 µM Pb(NO3)2 for seven days……………………………………………
……… … 106
11. Transmission electron micrograph at 15,000 X magnification of an ultra-thin section of Symphytum officinale lateral root treated with 250 µM Pb(NO3)2 plus 125 µM EDTA for seven days……………………...
………… 108
12. Transmission electron micrograph at 7500 X magnification of an ultra-thin section of Symphytum officinale lateral root treated with 250 µM Pb plus 125 µM EDTA for seven days………………………………….
110
13. Transmission electron micrograph at 10,000 X magnification of an ultra-thin section of Symphytum officinale main root treated with 250 µM Pb plus 125 µM EDTA for seven days……………………………..
112
xx
14. In vitro Pb-polyphenol chelation (modified Lavid dialysis protocol).….. 120
15. The colour of 3-month-old Symphytum officinale root powder, polyphenol extracts and immobilised root tannins…..…………………. 144
16. A. Structure of 3-month-old Symphytum officinale roots after whole plants were pre-treated for three days in modified HC nutrient solution (pH 4.5), with or without 500 µM EDTA, followed by four days in modified HC nutrient solution (pH 4.5) containing 0 (control), or 500 µM Pb(NO3)2 with or without 500 µM EDTA.…………………….…...
B. Colour of 3-month-old Symphytum officinale roots after whole plants were pre-treated for three days in modified HC nutrient solution (pH 4.5), with or without 500 µM EDTA, followed by four days in modified HC nutrient solution (pH 4.5) containing 0 (control), or 500 µM Pb(NO3)2 with or without 500 µM EDTA……………………....….
158
160
17. MS-based callus induction media (CIM) trials after four weeks (petiole explants from sand-grown plants).……………………………………… 179
18. Callus and shoot growth (from in vitro petiole tissue) after four weeks..
19. Callus growth (from in vitro callus tissue) after four weeks..………….. 181
20. Shoot induction media (SIM) trials after four weeks (from in vitro crown issue)…………………………………………………………….. 185
21. Root growth from shoot induction media (SIM) trials after four weeks (from in vitro crown tissue)..…………………………….……………... 187
22. Shoot and crown growth (from in vitro crown tissue)………………….. 189
23. Overall steps in the generation of in vitro Symphytum officinale plants.. 191
24. Liquid media trials……………………………………………………… 193
25. Shoot generation from in vitro petioles (from Pb pre-treated whole plants)…………………………………………………………………….
197
26. Regeneration ability of petioles from stock plants……………………… 197
27. Pre-treatment # 4: Shoot generation from in vitro petioles (from Pb pre-treated shoots).……………...…………………………………………... 202
28. Pre-treatment # 5: Effect of Pb exposure on petioles and shoot regeneration from petioles……………………………………………….
207
29. Pre-treatment # 5: Whole plant generation……………………………... 209
30. NBT localization of superoxide anions (purple staining) in roots……… 215
31. In vitro Symphytum officinale plants that were all re-treated with modified HC nutrient solution (pH 4.5) containing 500 µM Pb(NO3)2, for seven days (under non-sterile conditions)…………………………...
227
181
xxi
LIST OF TABLES
Table Page
1. Polyphenol parameters tested.…………………………………………… 39
2. Pb pre-treatment of in vitro Symphytum officinale whole plants or shoot cuttings…………………………………………………………………..... 59
3. Effect of Pb(NO3)2 on new root growth after one week………………….. 84
4. In vitro Pb-tannin chelation (immobilised tannin method): Level of Pb in the lower layer after treatment with PVPP, with or without immobilised tannins from 3-month-old Symphytum officinale lateral root or main root tissues, after four hours..……………………………………………….....
128
5. Incorrect usage of Pb:tannin ratio of data from in vitro Pb-tannin chelation experiment using tannins from 3-month-old Symphytum officinale lateral root or main root tissues immobilised to PVPP...………
130
6. Schematic of data and ratios from Figure 21A and B……………………. 131
7. Effect of EDTA desorption on Pb accumulation levels in 3-4 month-old Symphytum officinale roots of whole plants treated with modified HC nutrient solution (pH 4.5) containing 0 (control) or 500 µM Pb(NO3)2, with or without 500 µM EDTA for seven days. …..……………………...
……...
173
8. Effect of various treatments on superoxide anion levels in roots of in vitro Symphytum officinale plants (also see Plate 30). All tissues were from S. officinale plants grown under in vitro conditions and treated for 24 hours under non-sterile conditions…………………………………….
214
9. Pb, polyphenol and SOD activity trends in Pb pre-treated plants compared to plants without Pb pre-treatment. All plants were exposed (in re-treatment) to modified HC nutrient solution (pH 7.0) containing 500 µM PbADA..………….…………………………...……………………...
…………...
223….
10. Pb accumulation levels in roots of plant species exposed to Pb(NO3)2 in hydroponic solution………………………………………………………. 242
xxii
LIST OF ABBREVIATIONS
2,4 D 2,4-dichlorophenoxyacetic acid
AA ascorbic acid
AAS (flame) atomic absorption spectroscopy/spectrometer
ABC ATP-binding cassette
ADA N-[2 acetamido] iminodiacetic acid
ADS antioxidative defence system
ATPases adenosine 5'-triphosphatases
ATSDR Agency for Toxic Substances and Disease Registry
BA 6-benzyladenine
BSA bovine serum albumin
CAT catalase
CEC cation exchange capacity
CGM callus growth media
CIM callus induction media
d.w. dry weight
DNA deoxyribose nucleic acid
DPTA diethylenetriamine pentaacetic acid
DTT dithiothreitol (also known as Cleland's reagent)
DTZ distal-transition zone
EDDHA ethylenediaminedi (o-hydroxyphenylacetic) acid
EDDS ethylenediamine dissuccinate
EDTA ethylenediamine tetraacetic acid
EGTA ethylene glycol bis-2-aminoethyl ether-n,n',n'',n'-tetraacetic acid
EMS ethyl methanesulfonate
ERMA Environmental Risk Management Authority
EZ elongation zone
f.w. fresh weight
F/C Folin-Ciocalteu
FAO/IAEA Food and Agriculture Organization/International Atomic Energy
Agency
GMOs genetically modified organisms
HBH 4-hydroxybenzyl hydrazine
HC Huang and Cunningham (nutrient solution)
xxiii
HEDTA hydroxyethyl ethylenediamine triacetic acid
IBA indole-3-butyric acid
LR lateral root
MR main root
MS Murashige and Skoog
MT(s) metallothionine(s)
MZ meristematic zone
Na2EDTA disodium ethylenediamine tetraacetic acid
NAA α-naphthaleneacetic acid
NADPH mono-hydrogen nicotinamide adenine dinucleotide phosphate
NBT nitro blue tetrazolium
NR nitrate reductase
NtCBP4∆C truncated version Ni transporter gene (from tobacco) encoding of
camodulin binding protein
o/n overnight (shaking)
PC(s) phytochelation(s)
PDR physician’s desk reference
POX peroxidase
ppm parts per million
PPM plant preservative mixture
PVPP polyvinyl polypyrrolidone
RIM root induction media
ROS reactive oxygen species
S.E. standard error
SDS sodium dodecyl sulfate
SMT selenocysteine methyl transferase
SOD superoxide dismutase
TA tannic acid
TEA triethanolamine
TEM transmission electron microscope/microscopy
TI tolerance index
u/w ultrasonic water-bath
US(A) United States (of America)
WPIM whole plant induction media
YCF1 yeast protein from ATP-binding casette transporter family

xxiv
ACKNOWLEDGEMENTS
I greatly appreciate and am most grateful for the support of my supervisor, Dr. David
Leung. His supervising style of warm-hearted patience, enthusiasm, encouragement and
very regular laughing is something that is positively rare and count very lucky to have
been guided by. He creates a study environment that nurtures the true style of education
in all his students. I also greatly appreciate and thank my co-supervisor, Associate
Professor Taylor, for his technical know-how and training on the AAS instrument.
Together their caring attitude has made my studies here enjoyable and encouraged my
mind to be challenged.
Many thanks the School of Biological Sciences, especially the technical staff;
Bruce Boon and Dave Condor (glasshouses), Jackie Healy, Manfred Ingerfeld (TEM)
and Maggie Tisch. Special thanks Nicole Lauren-Manuera (our lab’s technician) and
Matt Walters (photographer). They were always knowledgeable, patient, and caring.
I would also like to acknowledge all my lab mates and friends, both past and
present (Ali, Anna, Archana, Aruni, David, Greta, Julenne, Kenny, Kitti, Lisa, Malini,
Margaret, Naomi, Seetha, Shugai, Ying) for their company, friendship and support over
the years. Special thanks too to all my family for their support and encouragement,
especially to my parents who always instilled the importance of learning – it is one of
the few things in life that is gained and never lost.
And finally, I am also very grateful to Charles Alma Baker and his charitable trust
for their support of a doctoral scholarship, and to the Royal Society of New Zealand
(RSNZ Canterbury Branch) and the School of Biological Sciences for their support in
making conference participation possible.
Chapter 1 − Introduction 1
CHAPTER 1
INTRODUCTION
Heavy metal pollution is a global environmental and health safety issue. The high cost
and environmental concerns of conventional remediation technologies has fuelled the
need for alternative remediation methods – phytoremediation, the use of plants to
remove or detoxify pollutants, is one such emerging technology. The present study is
directed towards advancing phytoremediation by understanding how plants take up,
tolerate and accumulate heavy metals like lead (Pb). This section is devoted to
reviewing: (i) heavy metals (particularly Pb), (ii) remediation methods, (iii) heavy metal
uptake and tolerance mechanisms in plants and finally, (iv) the objectives of this study.
1 HEAVY METALS
1.1 Definitions
Heavy metals are a group of metals with an atomic density greater than 6g cm-3
(Alloway and Ayres, 1997). Although it is a widely recognised word, its definition is
not useful in the biological field. Heavy metals are better described as ‘trace metals’ -
metals found at low concentrations, usually less than one ppm or less, in a specified
source, e.g. soil, plant tissue or ground water (Phillips, 1981). In this thesis, the term
‘heavy metals’ will be used, as it is the most widely recognised, but the description will
be that of trace metals.
At low or background concentrations, heavy metals are not pollutants. They are
naturally in the environment due to their presence in bedrocks. Some heavy metals in
the environment, such as zinc and copper, are also essential micronutrients for living
organisms. Therefore, the term ‘heavy metal pollution’ refers to when heavy metal
levels are abnormally high relative to normal background levels; presence of the metal
is insufficient evidence of pollution (Alloway and Ayres, 1997).

Chapter 1 − Introduction 2
1.2 Sources of heavy metal pollution
There are two main sources of heavy metal pollution: nature and human activity.
Naturally occurring pollution originates from excessive weathering of rocks with
surface metal deposits and can equal or, in rare instances, exceed man-made pollution
levels. Human activity is the main contributor to heavy metal pollution. The main man-
made sources of heavy metal pollution are: (i) metal smelters and refineries, (ii)
industrial wastes (e.g. electroplating) (iii) military operations, (iv) mining, (v) landfill
run-offs, (vi) agricultural chemicals such as pesticides, herbicides and fertilisers, and
(vii) automobile emissions (Saxena et al., 1999).
In most developed countries, current heavy metal pollution cases are localised and
are declining due to cleaner industrial practices and conversion to non-heavy metal-
based products like unleaded fuel. However in Eastern Europe and developing regions
of the world, namely India and China, heavy metal contamination of the environment is
still widespread (Krämer, 2005). Globally, historically polluted environments (i.e. those
from the 1800s industrial era) will also be a continuing problem because of the long-
term persistence of heavy metals in the environment (Martin and Coughtrey, 1981).
2 LEAD
2.1 Lead pollution
Lead (Pb) is a very malleable, heavy and non-corrosive metal (Csuros, 1994). Past and
present products containing Pb include solder, paints, plumbing, batteries, ammunition
and petrol (Csuros, 1994; Alloway and Ayres, 1997). Lead pollution arises from the use
of these products (particularly in the past) and the human activities listed above.
It is the focus of this study because of its toxic effect on living organisms, and
widespread occurrence and persistence in the environment. Lead is ranked the number
one heavy metal pollutant (and number two of all hazardous substances) by the Agency
for Toxic Substances and Disease Registry (ATSDR, 2005). In the 1980s, global
emission of Pb into soils was at least 36 times higher than the next two most toxic heavy
metals, mercury (Hg) and cadmium (Cd)(Alloway and Ayres, 1997; ATSDR, 2005). In
USA soils, Pb levels are between 1- 6,900 mg kg-1; the regulatory limit in the USA is
600 mg kg-1 (twice the regulatory limit in New Zealand) (Salt et al., 1998). Furthermore
Chapter 1 − Introduction 3
without intervention, Pb in these soils will continue to be present today as it persists in
the environment for 150-5000 years (Kumar et al., 1995).
2.2 Effect of lead on human health
The main entry routes of Pb into humans are through consumption of contaminated food
and water. Inhalation of Pb particles from the air, soil and Pb-based products such as
paints and batteries also occurs. Ingestion of Pb-based paint chips and swallowing soil
or dust contaminated with Pb are the main sources of Pb poisoning in children. When
ingested or inhaled, Pb is absorbed by the gastrointestinal tract and then accumulates in
the blood stream and central nervous system. Once sufficient amounts of Pb accumulate
in the body (0.3-0.8 ppm), it can cause permanent brain and nerve damage, kidney
dysfunction, and disrupt heame synthesis causing anaemia (Csuros, 1994; Yang et al.,
2000). Children are especially susceptible to its effects − about 50% of the ingested Pb
is absorbed into a child’s body, compared to between 10 to 15% in adults (Csuros,
1994).
2.3 Effect of lead on plant growth
Before hyperaccumulators were discovered in the late 1970s, the effect, accumulation
and tolerance of heavy metals in plants were already under investigation because of
their release into the environment from the industrial era (Koeppe, 1981). Presently,
studying the effects of Pb on non-hyperaccumulating plants is important for two
reasons: (i) plants are an entry path for Pb into the food chain and (ii) phytoremediation.
The most common symptoms of Pb toxicity are root and shoot growth inhibition
(Huang et al., 1974; Wierzbicka, 1987 and 1995; Vassil et al., 1998; Huang and
Cunningham 1996; Sobotik et al., 1998; Geebelen et al., 2002; Grčman et al., 2003).
These symptoms may occur because Pb binds strongly to a large number of bio-
molecules like cell wall pectic acids, amino acids, enzymes, DNA and RNA (Xiong et
al., 2006; Kabata-Pendias, 2001) and in turn may cause:
(i) Disruption to cell elongation and reducing cell wall elasticity (Lane et al., 1978
Breckle, 1991; Kabata-Pendias, 2001).
(ii) Disruption to microtubule alignment during cell division (Yang et al., 2000).

Chapter 1 − Introduction 4
(iii) Accelerated aging/senescence of tissues as reflected by an increase in acid
phosphatase, amylase and peroxidase activity (Lee et al., 1976; Schützendübel et
al., 2001).
(iv) Oxidative stress (Malecka et al., 2001; Pilon-Smits, 2005)
(v) Decrease in protein and carbohydrate content required for normal growth (Xiong
et al., 2006)
(vi) Reduced photosynthesis and transpiration rates due to inhibition of the electron
transport chain in mitochondria and chloroplasts (Bazzaz et al., 1974; Carlson et
al., 1975; Koeppe, 1981). A reduction in grana stacks, stroma and an absence of
starch grains in chloroplasts has also been observed (Koeppe, 1981). These events
lead to leaf chlorosis.
Lead-induced toxicity symptoms may also be due to interference in ion uptake and
translocation (Bazzaz et al., 1974). Replacement of essential ions has also been reported
(Pilon-Smits, 2005). Pb is also known to reduce uptake and accumulation of ions that
are critical to the plant health such as calcium, phosphorous (Huang and Cunningham
1996) and nitrogen (particularly in nitrogen fixing bean-root nodules) (Huang et al.,
1974; Lee et al., 1976; Xiong et al., 2006). The reduction in nitrogen (N) is particularly
problematic, as it is the most required element in plants, comprising 1.5-2% of plant dry
matter. Nitrate (NO3-) is the most important form of N in plants. Once inside root cells,
NO3- is reduced to NO2
- by nitrate reductase (the key enzyme in nitrate assimilation,
NR), and NO2- converted to NH4-N. This product is then assimilated into an organic
form such as glutamate and glutamine. These amino acids are involved in the synthesis
of all other amino acids, nucleic acids, chlorophylls and hormones (Xiong et al., 2006).
Pb is known to reduce nitrogen levels in plants by inhibiting NR activity (Huang et al.,
1974; Bharti and Singh, 1993; Xiong et al., 2006). Lead may directly inhibit its activity
by binding to sulfydryl groups on the enzyme or by reducing its production at a genetic
level (by reducing the level of the NR gene inducer, nitrate)(Xiong et al., 2006).
Whilst the above symptoms typically occur under laboratory conditions, there is a
lack or actually no observable symptoms of Pb toxicity under natural conditions, even
when plants contain 350 mg kg-1 Pb (d.w.) (Wierzbicka, 1995). Perhaps, one of the few
reports of toxicity in the natural environment was evidence of decreased crop
productivity by Pb and other heavy metals from a zinc smelter (Yang et al., 2000). The

Chapter 1 − Introduction 5
lack of observable effects may be due to: (i) irreversible binding of Pb to soil particles,
leading to low Pb availability to plants (Koeppe, 1981; Eltrop et al., 1991), (ii) binding
of Pb to root tissue, leading to a lack of observable toxicity at shoot level, and (iii) plant
species (e.g. hyperaccumulators vs. non-hyperaccumulator Alyssum species) and age
(Koeppe, 1981), and (iv) not reaching the threshold Pb concentration for observable
damage; this may be as low as 30-300 mg kg-1 Pb (d.w.) (Zheljazkov and Fair, 1996) to
500 to 1000 mg kg-1 Pb (d.w.) (Wierzbicka, 1995) (tissue unspecified in articles).
Additionally, the bioavailable ambient concentrations of Pb are usually lower than the
Pb treatment concentration used in laboratory studies. Higher Pb treatment
concentrations in laboratory studies are often necessary to test, for example, if plants
can effectively clean-up heavy metals from polluted water and within the time
limitations of phytoremediation.
3 HEAVY METAL REMEDIATION TECHNOLOGIES
It was once thought that the passage of water through the soil exerted a purifying effect
and that wastes dumped into the ground could be cleansed from the system (Suthersan,
1997). For organic pollutants, this view may contain some truth as some organic
pollutants can be degraded into less harmful products by soil microbes. However,
inorganic pollutants cannot be degraded. Inorganic pollutants such as heavy metals are
persistent; Pb for example can persist in the environment for 150-5000 years (Kumar et
al., 1995). Remediation of such polluted environments therefore requires physical
removal or conversion to non-toxic forms.
3.1 Conventional remediation technologies
Colloquially, conventional remediation technologies are generally termed as ‘pump and
treat’ and ‘dig and dump’ techniques (Saxena et al., 1999). They can be divided into
either in situ or ex situ remediation. Some of the most commonly used technologies
(summarised from Saxena et al., 1999) include:
(i) Soil washing (in situ): The soil is washed with a chemical solution to
separate metals bound to the soil. The subsequent liquid is then removed for
treatment or disposal.
Chapter 1 − Introduction 6
(ii) Chemical oxidation/reduction (in situ): The metals in the contaminated sites
are chemically converted to less mobile or less hazardous forms.
(iii) Stabilisation (in situ): The metals are physically enclosed in a stabilised
mass.
(iv) Excavation and off-site disposal (ex situ): The contaminated soil is removed
and transported off-site for treatment or disposal. The area is then replaced
with clean soil.
The environmental impact of such technologies can be very high. For example, soil-
washing methods may render the soil infertile or spread the contaminant, and
excavation methods can produce high waste volumes. Additionally, these remediation
methods are often limited to small areas and depend on accessibility to the polluted site
(Saxena et al., 1999).
However, the most limiting factor is the high cost of these technologies. In the
USA alone, heavy metal remediation has been estimated at US$ 7.1 billion (Salt et al.,
1995a). Conventional excavation and disposal methods would cost US$ 400,000 per
acre of land with a remediation depth of 50 cm compared to US$ 60,000-100,000 for
phytoremediation (Salt et al., 1995a). These costs are particularly uneconomical when
used to remediate sites with pollution levels just above safety regulations.
3.2 Alternative remediation technologies (I) – Micro-organisms
Bioremediation uses microbes to remediate the subsurface of soils contaminated with
hazardous chemicals. It is applied most effectively for organic pollutants (such as
benzene, toluene and phenols) where, depending on the microbe and pollutant, it can
result in the complete mineralisation of the pollutant. For example, benzene and phenols
can be converted to products such as carbon dioxide and water (Suthersan, 1997;
Davison, 2005).
For inorganic pollutants like heavy metals, this form of remediation is less
effective. Microbes may immobilise pollutants by converting the elemental state of
heavy metals, but ultimately they are not capable of removing them from the medium.
One exception to this is the conversion of elemental Hg2+ (mercury) in the soil to
volatile Hg0, which is released hazardously into the atmosphere (Suthersan, 1997;
Davison, 2005).
Chapter 1 − Introduction 7
3.3 Alternative remediation technologies (II) −−−− Phytoremediation
3.3.1 Origin of phytoremediation concept
There are three types of metal-tolerant plants which are classified according to their
tolerance and accumulation response on metal contaminated soils: (i) excluders - restrict
metal uptake into roots except at extreme metal concentrations (ii) indicator plants -
metal level accumulated in the shoot is relative to metal levels in soil and (iii)
hyperaccumulators – concentrate metals in shoots, regardless of soil metal
concentrations (Greger, 1999; Ghosh and Singh, 2005).
In the late 1970s, Brooks and Jaffre (Jaffre et al., 1976) were one of the first to
highlight the presence of plants that hyperaccumulate nickel (Robinson et al., 2003).
With the growing concerns of heavy metal pollution in the environment and
inadequacies of conventional remediation technologies, this hyperaccumulator
phenotype was used to introduce the idea of phytoextraction (Salt et al., 1998) and
eventually phytoremediation.
3.3.2 Phytoremediation: definition and classes
Phytoremediation is defined as the use of green plants to remove pollutants from the
environment or render them harmless (Garbisu and Alkorta, 2001). The phytoextraction
and rhizofiltration technologies are the most useful branches for heavy metal removal
from soil and water respectively. The five classes of phytoremediation are outlined
below.
(i) Phytoextraction: Metal-accumulating plants are used to transport and
concentrate metals from the soil into above ground shoots (Kumar et al.,
1995). There are two types of phytoextraction:
a. Chelate-assisted phytoextraction − high biomass crops are induced to
accumulate high concentrations of heavy metals (> 1% d.w. of shoot) by
application of chelating agents (e.g. EDTA) to soils after plants have
grown to maximum biomass (Salt et al ., 1998).
b. Continuous phytoextraction − the natural ability of plants to accumulate
and survive high metal concentrations over the entire growth cycle (i.e.
hyperaccumulators) (Sas-Nowosielska et al., 2004).
Chapter 1 − Introduction 8
(ii) Rhizofiltration: Use of plant roots to absorb, precipitate and concentrate
toxic metals from polluted effluents (Dushenkov et al., 1995).
(iii) Phytostabilisation: Metal-tolerant plants are used to reduce the mobility of
metals (via root uptake, precipitation or reduction), thereby reducing entry
into waterways and airborne spread (Salt et al., 1995a). Plant roots are also
used to stabilise soil, thereby preventing erosion.
(iv) Phytodegradation: Degradation of complex organic contaminants by root
microbes (Saxena et al., 1999).
(v) Phytovolatilisation: This uses plant uptake and respiration mechanisms to
remove volatile metals such as Hg from the soil. However, this is not
desirable because this method relocates the pollutant from the soil into the
air (Saxena et al., 1999).
3.3.3 ‘Pros and cons’ of phytoremediation
Although phytoremediation is still at its initial stages of research and development,
there are several potentially significant advantages of this approach over conventional
remediation technologies. These include:
(i) Cost: It is estimated to be least two to four fold less expensive than
conventional remediation techniques (Cunningham and Ow, 1996).
(ii) Application scale: Plants can be sown or translocated on a large scale.
(iii) Impact on the environment: Since plants are able to concentrate the
contaminant in their tissues, comparatively low waste volumes are produced.
Furthermore, several plausible methods of reducing and recycling heavy
metal contaminated plant tissues are available: pre-treatment steps e.g.
composting can be used to reduce biomass, followed by incineration or
ashing and liquid extraction (recycling) (Sas-Nowosielska et al., 2004). In
addition, plant roots will be able to prevent soil erosion and increase
microbial communities.
Chapter 1 − Introduction 9
However, phytoremediation also has a number of limitations and criticisms, as
explained below:
(i) Remediation depth: In order for the plant to absorb the contaminant, roots
must be in the contamination zone. Most herbaceous plants are relatively
shallow rooting, reaching only 0.5-1 m deep. Thus if the contamination is
deeper than this, remediation can be limited (Pilon-Smits, 2005).
Alternatively, in such cases deep-rooting (3 m deep) poplar or willow trees
may be used instead (Suthersan, 1997; Pilon-Smits, 2005).
(ii) Bioavailability: In the case of chelate-assisted phytoextraction, the use of
chelating agents can cause metals to leach and spread into the groundwater
below (Wenzel et al., 2003). There is also uncertainty as to whether plants
can remove enough of the bioavailable fraction to meet safety regulations
(Pilon-Smits, 2005).
(iii) Time: Phytoremediation can take up to ten years, which is more time
consuming than conventional pump-and-treat methods (Pilon-Smits, 2005).
(iv) Multiple contaminants: Some plants tolerate only certain types of heavy
metals. Thus the presence of multiple types of heavy metals (e.g. Pb, Cd,
Cr) and organic contaminants (e.g. PCB, TNT) may pose a challenge
(Saxena et al., 1999).
(v) Entry to the food chain: There is also the possibility that wind dispersal of
metal-laden dead leaves or animal feeding may be problematic. However, if
the contaminated area has barriers and harvesting of contaminated plants is
regulated, these problems may not be significant.
3.3.4 Ideal attributes of phytoextraction plants
For a plant to be considered as a hyperaccumulator of Pb, Ni, Cu, Cr, and Co, the plant
shoot must accumulate more than 0.1% (d.w.) of these metals or 1% d.w. for Mn and Zn
(Baker and Brooks, 1989). Of the over 400 plant species which have been identified as
hyperaccumulators, 75% have been Ni hyperaccumulators (Clemens, 2001). Pb
hyperaccumulators have been comparatively rare. To date 14 have been identified,
although the exact number is controversial because some plants may have been
mistakenly identified due to aerial contamination (Ghosh and Singh, 2005). Known Pb
Chapter 1 − Introduction 10
hyperaccumulators include Polycarpaea synandra, Minuartia verna, Ameria martima,
Thlaspi alpsetre and T. rotundifolium (Huang et al., 1997a).
Initial phytoextraction research began with hyperaccumulators, such as Thlapsi
caerulesences and Alyssum bertoloni (Keller et al., 2003). Whilst these plants are useful
for studying metal tolerance and accumulation mechanisms, their slow growth rate and
small biomass may limit their application in phytoremediation (Ebbs and Kochian,
1998). This is because the total amount of metals extracted (a measure of
phytoremediation potential) is the product of biomass and tissue concentration (Kayser
et al., 2000).
The goal of phytoextraction is to reduce heavy metal levels in the soil to
acceptable levels within three to ten years (Huang and Cunningham et al., 1996). In
order to achieve this goal, plants must be screened and selected for certain attributes.
The ideal plant for phytoextraction would have: (i) a rapid growth rate, even under
harsh conditions, (ii) a high shoot biomass (20 metric tones dry weight ha-1 yr-1) (Saxena
et al., 1999; Huang et al., 1997b), and (iii) a capacity to accumulate high amounts of
metals in shoots; in the case of Pb, 10,000 mg kg-1 d.w. (1% d.w.) (Brooks, 1998). With
regards to the latter point, this level of Pb in shoots is likely to be fatal to the plant, but
it does not preclude it from harvesting (Wu et al., 1999).
3.3.5 Plants used for lead phytoextraction
At this stage, no fully-grown (mature) plant has been found to meet all three attributes
(above) on its own at a field scale – i.e. there is no evidence of a natural, high biomass
Pb hyperaccumulator. However, in controlled bench and field-scale experiments, all
three attributes have been apparently met, often by using seedlings or very young plants
of high biomass plants and chelating agents like EDTA to artificially induce
hyperaccumulation (see section 4.1.3).
In hydroponic phytoextraction studies, Sesbania drummondii (a high biomass
leguminous shrub, which is found naturally on Pb contaminated sites) accumulated
greater than 4% (d.w.) Pb in shoots (Sahi et al., 2002). Similarly, Brassica juncea (L.)
Czern.var. 426308 accumulated 3.5% (d.w.) Pb in plant shoots after 14 days in a
sand/perlite mixture fed with 500 mg L-1 Pb(NO3)2 (Kumar et al., 1995). Both studies
used seedlings and did not involve chelating agents or genetic modification. In
hydroponic studies, the same B. juncea cultivar accumulated 1.1% Pb (d.w.) in shoots
Chapter 1 − Introduction 11
after 14 days in Hoagland’s nutrient solution containing 0.5 mM Pb(NO3)2 with 1 mM
EDTA. This concentration was 400-fold higher than treatments without EDTA (Vassil
et al., 1998). Other plants investigated in bench-scale experiments include varieties of
sunflower, scented geranium, and tree species such as poplar and willows (Saxena et al.,
1999).
Field-scale phytoextraction trials have also been conducted, although relatively
few in comparison to bench-scale studies. Lesage et al., (2005) showed that EDTA
increased Pb accumulation in sunflower (Helinathus annus) shoots, but only to a
maximum of 0.007% (d.w.). The ability to extract Pb was hampered by the severe
reduction in plant growth at higher EDTA concentrations (7-10 mmol kg-1 soil). Using
field-lysimeter studies, Wenzel et al., (2003) demonstrated that canola (Brassica napus
L.) could accumulate 0.385% (d.w.) Pb in shoots after 30 days in mildly contaminated
soil and addition of EDTA in increments of 1g per kg of soil. The authors concluded
that this is in contrast to field studies using Indian mustard (Blaylock et al., 1997) and
corn (Huang et al., 1997b), where Pb levels in shoots were greater than 1% (d.w.) upon
addition of chelating agents. However, this may in part be due to variations in the
degree of soil contamination, plant species and age.
4 HEAVY METAL UPTAKE BY PLANTS
Heavy metal uptake by plants follows three key events: (i) bioavailability/mobilisation
of metals, (ii) root uptake and xylem transport, and (iii) detoxification/tolerance (Saxena
et al., 1999; Clemens et al., 2002). For enhancing the phytoremediation potential of
plants, aspects from each of these events will be investigated in this study.
4.1 Factors influencing heavy metal bioavailability
One of the key factors that can influence the success of phytoremediation is metal
bioavailability (Huang et al., 1997b; Lasat, 2002). Metal bioavailability is the
concentration of metals in the solution fraction of the contaminated soil that is available
for root uptake. It is strongly affected by physical, biological and chemical factors*.
* This is a simplistic definition. Soils are a complex and dynamic matrix. The overall metal bioavailability also takes account of other factors such as the ability of the soil solid phase to re-supply metals to the soil
solution once removed by plants.
Chapter 1 − Introduction 12
Lead binds tightly to soil particles and exists in insoluble forms such as lead phosphate,
carbonate and hydroxide. Thus, unlike Cd and Zn, the metal bioavailability of Pb is low
(Alloway and Ayres, 1997; Lasat, 2002). However understanding and manipulating
three factors, as detailed below, can improve Pb bioavailability and thus
phytoremediation.
4.1.1 Physical and biological factors
Physical factors relate to the texture of soils. High organic matter content for example,
would reduce metal bioavailability because metals are known to bind strongly to
organic matter (Saxena et al., 1999).
The biological factors include plant genotype and root-associated microbes.
Dicots are thought to accumulate higher heavy metal concentrations than monocots
because they have a higher number of negatively charged-metal attracting sites (cation
exchange capability, CEC) in the cell wall than monocots (Saxena et al., 1999).
However, Huang and Cunningham (1996) suggested that monocots, such as corn, are
superior in Pb translocation. They found that corn accumulated similar or more Pb in
shoots than two of the best Pb-accumulating cultivars of B. juncea (a dicot). Root-
associated microbes can influence metal uptake abilities of plants by modifying the pH
around roots (Marschner, 1995).
4.1.2 Chemical factors (I): soil chemistry
Soil chemical factors that affect metal bioavailability include pH, cation exchange
capability and redox potential. Of all the factors, pH is the most easily manipulated
using soil acidifiers and ammonium containing fertilisers. The H+ ions have a higher
affinity for negative sites on soil particles. Thus at low pH, metal bioavailability
increases as more metals are released into the soil solution due to competition with H+
ions (Saxena et al., 1999).
4.1.3 Chemical factors (II): chelating agents
Another chemical factor influencing metal bioavailability is the presence of chelating
agents. Chelating agents increase metal bioavailability by removing metals from soil
particle surfaces, forming metal-chelate complexes that are then taken up by plants
Chapter 1 − Introduction 13
(Geebelen et al., 2002). These compounds are naturally made by the roots (e.g.
phytosiderophores such as mugenic acid, organic acids, and amino acids) or are
synthetic and applied to the soil (e.g. ethylenediamine tetraacetic acid, EDTA) (Saxena
et al., 1999; Lasat, 2002). In phytoremediation, the latter is called chelate-assisted
phytoextraction.
Translocation is considered as the other major hurdle in phytoextraction because
there are no plants that can transport large quantities of Pb naturally to the shoots
(Huang et al., 1997b). This is important for soil phytoextraction because Pb
accumulation is targeted at the harvestable above ground shoots of high biomass plants.
EDTA has been used to address this hurdle. In addition to increasing bioavailability,
EDTA has been reported to increase shoot accumulation of Pb in mesquite (Prosopis
spp.) (Aldrich et al., 2004), mustard plants varieties (Blaylock et al., 1997; Salt et al.,
1998; Vassil et al., 1998), corn (Zea mays L.cv. Fiesta) and pea (Pisum sativum) from
less than 500 mg kg-1 to more than 10, 000 mg kg-1 (>1% d.w. Pb in shoots) (Huang et
al., 1997b). Vassil et al., (1998) suggested that the mechanism of this translocation may
involve the destabilisation of the plasma membrane (the primary physiological barrier in
the root that controls ion uptake and movement to shoots) via EDTA removal of Zn2+
and Ca2+ plasma membrane stabilising ions. Increased translocation due to transpiration
was not supported as these authors found that PbEDTA reduced water loss in shoots.
Although EDTA is not Pb specific, it is the most effective chelating agent of those
tested (EDTA> HEDTA>DTPA>EGTA>EDDHA) (Huang et al., 1997b). However, its
use may be limited as EDTA can cause substantial leaching and spread of heavy metals
(McGrath and Zhao, 2003). However, this may be alleviated with agronomic
management. For example, incremental addition of EDTA as opposed to a single high
dose may be employed to reduce leaching (Barcosi et al., 2003 and Wenzel et al.,
2003).
4.2 Heavy metal uptake, transport and accumulation
4.2.1 Metal uptake and transport
Although there are many gaps in the details of how plants uptake and transport metals,
there is a consensus that four key steps in metal accumulation are involved.
Chapter 1 − Introduction 14
(i) Mobilisation and uptake: To increase the bioavailability of metals, the
rhizosphere is acidified (by H+ ion release from plasma membrane H+-
ATPases) and metal chelators are released from the root (e.g.
phytosiderophores, organic acids) (Clemens et al., 2002). During uptake of
metals, a high metal concentration gradient forms along the cell wall (a low
affinity and unspecific ion-exchanger). Unless chelated, metals are thought
to either remain in the negatively charged sites of the cell wall, or are
transported apoplastically (between cells via cell walls and intracellular
fluid) to the endodermis (Greger, 1999). There is also a fraction of metals
that enters the root cytoplasm. This is thought to occur via:
a. Passive transport: A high metal concentration in the cell wall promotes
mass flow/diffusion of metals through the plasma membrane into the cell
cytoplasm (Greger, 1999; Clemens et al., 2002).
b. Active transport via plasma membrane transport proteins: These are
required because metals cannot flow freely across the lipophilic plasma
membrane at low concentrations (Lasat, 2002). Although, over 150
different cation transporters have been identified in Arabidposis thaliana,
presently little is known about the inorganic ion transporters (Salt et al.,
1998; Pilon-Smits, 2005). Inorganic transporters may include channel
proteins (e.g. Ca2+-channels) and H+-coupled carrier proteins (e.g. H+-
ATPases) (Greger, 1999; Clemens et al., 2002).
(ii) Compartmentalisation and chelation within roots: Once inside the root
cytoplasm, metals are chelated to organic acids (e.g. citrate, malate,
histidine), thiol rich peptides (e.g. phytochelatins [PCs]), or cysteine rich
metallothioneins (MTs) (Pilon-Smits, 2005). These are stored in root
vacuoles or exported to the shoots (Salt et al., 1998).
(iii) Xylem loading and transport to shoots: To enter the xylem, metals must pass
through the endodermis with the suberised Casparian strip. Since this is
difficult, the younger parts of the root, where Casparian strips are not fully
developed, are thought to be mostly responsible for metal uptake into the
xylem (Greger, 1999). During this process (movement towards the xylem),
metals are sequestered inside the root cells (cytoplasm) and are
Chapter 1 − Introduction 15
symplastically transported to the stele. The transport of these ions into the
xylem is a tightly controlled process mediated by membrane transport
proteins, which are yet to be identified (Greger, 1999; Clemens et al., 2002;
Ghosh and Singh, 2005). Once in the xylem, metals are chelated (e.g. with
citrate, histidine, or as hydrated ions) to avoid adhesion to the high CEC
capability of the xylem cell wall (Salt et al., 1998). Transport to the shoots is
driven by transpiration (Pilon-Smits, 2005).
(iv) Sequestration and storage in leaf cells: Metals from the xylem reach the
apoplast of leaves (Clemens et al., 2002). From here, metals are transported
into the leaf cell via membrane transporter proteins such as ABC-type
transporters in the vacuole and P-type ATPase pumps (Greger, 1999; Pilon-
Smits, 2005). Once inside the leaf cells, their levels are also regulated by
accumulation in the vacuole, cell walls, or at a tissue level (in the epidermis
and trichomes). Within cells they are typically bound to chelators such as
GSH, PCs, organic acids, and MTs.
4.2.2 Movement route and accumulation of lead in plant tissues
The accumlation site (root, shoot and cellular location) and movement route (apoplastic
or symplastic route) of Pb once absorbed by the root is still controversially debated.
However, it appears to be influenced by whether or not Pb is chelated.
For unchelated Pb-treated plants, most of the unchelated Pb is trapped in the root
tissue, in root cell walls; very little is transported to the above ground shoot tissue. For
example, Kumar et al., (1995) found that B. juncea L. (Cern.) accumulated 10,300 mg
kg-1 Pb in the shoot (d.w.) compared to 103,300 mg kg-1 Pb in the root (d.w.). The
location of Pb in the root cell wall may be due to direct binding upon entry into the root
tissue (Wierzbicka, 1987) or as the result of Pb from the cytoplasm being transported to
the cell wall (via vesicles) (Malone et al., 1974). Thus due to its deposition sites,
unchelated Pb is considered to travel the apoplastic route in the root tissue (Blaylock et
al., 1997; Wierzbicka, 1995).
In chelated Pb studies, the root tissue absorbs the entire complex (PbEDTA) as
most of the Pb in xylem fluid of B. juncea was found to be co-ordinated with EDTA
(Vassil et al., 1998). Once absorbed by the roots, the majority of this Pb is then
Chapter 1 − Introduction 16
translocated and accumulated in the shoot tissue. Transmission electron micrographs of
Chamaecytisus proliferus treated with PbEDTA showed that Pb was found in the shoot
cell mitochondria, chloroplast and plasmodesmata. A small amount was also found in
these organelles of root cells (Jarvis and Leung, 2001). Due to the location of Pb in the
cytoplasm, chelated Pb is considered to travel the symplastic route (i.e. through cells via
the plasmodesmata) from root to the shoot.
5 HEAVY METAL STRESS AND TOLERANCE IN PLANTS
In the previous section, understanding the factors that influence Pb bioavailability can
improve phytoremediation. Another approach is to understand the mechanisms behind
the plants’ ability to tolerate Pb in the tissue as some notable, but not all, cases of heavy
metal tolerance translate into greater metal accumulation ability. Examples include
transgenic A. thaliana overexpressing a tobacco channel protein NtCBP4∆C (Cherian
and Oliveira 2005) or a vacuolar yeast transport gene YCF1 (Song et al., 2003), natural
hyperaccumulators such as Thlaspi caerulescens (Yang et al., 2004), and B. juncea after
application of incremental doses (as opposed to one high dose) of chelating agents
(Barcosi et al., 2003). Moreover, some of the ways of how plants tolerate heavy metals
(e.g. chelation) are also how they accumulate them. In this respect, tolerance is linked to
accumulation.
This research will emphasise on phytoextraction, rhizofiltration and
phytostabilisation technologies. In this introduction section, ‘tolerance’ will be reviewed
in the context of how indicator and hyperaccumulator plants survive and avoid,
(respectively) the effects of heavy metal stress. There are two types of plant tolerance
mechanisms involved: Mechanism 1 and Mechanism 2. An indepth review on
particular parts of these mechanisms will be presented as they will feature in the key
objectives of this thesis: (i) Mechanism 1 − complex polyphenols and their role in
chelating metal-ions (sections 7 and 8) and (ii) Mechanism 2 − superoxide dismutase
(SOD), the first line of antioxidant enzymes in the antioxidative defence system and
their role in decreasing metal-induced ROS levels (namely superoxide anions) and
polyphenol polymerisation.
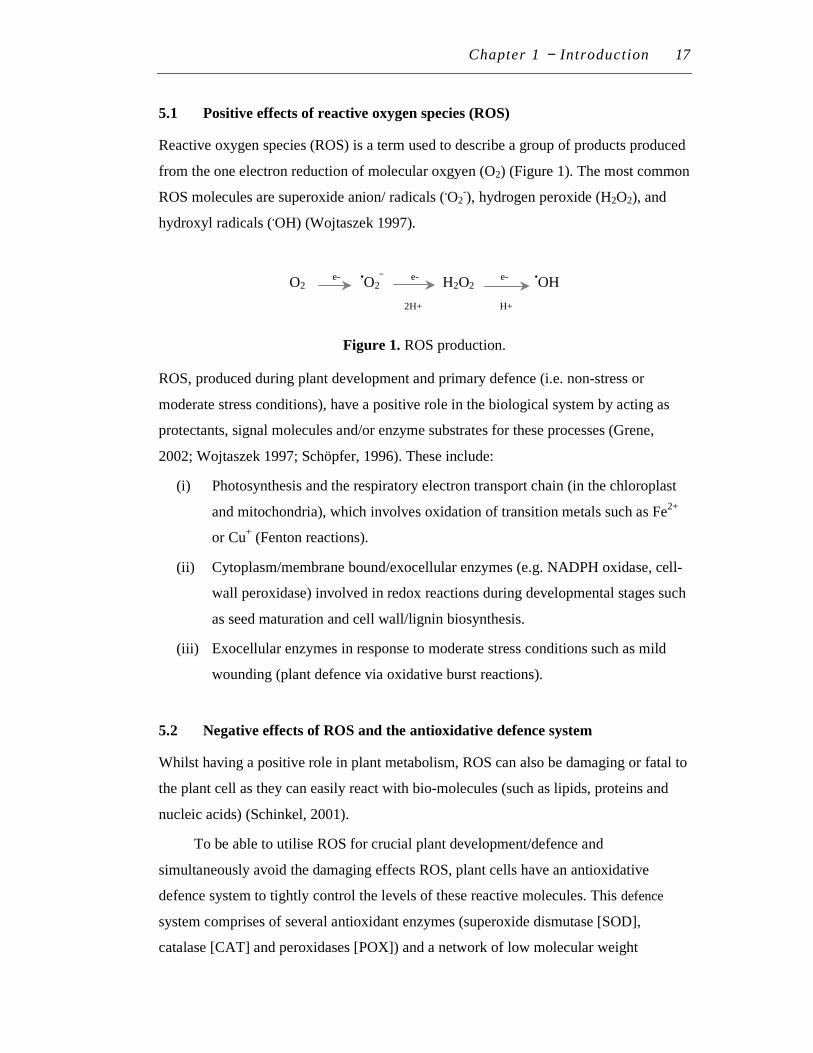
Chapter 1 − Introduction 17
5.1 Positive effects of reactive oxygen species (ROS)
Reactive oxygen species (ROS) is a term used to describe a group of products produced
from the one electron reduction of molecular oxgyen (O2) (Figure 1). The most common
ROS molecules are superoxide anion/ radicals (.O2-), hydrogen peroxide (H2O2), and
hydroxyl radicals (.OH) (Wojtaszek 1997).
O2 e- •O2 e- H2O2
e- •OH
2H+ H+
Figure 1. ROS production.
ROS, produced during plant development and primary defence (i.e. non-stress or
moderate stress conditions), have a positive role in the biological system by acting as
protectants, signal molecules and/or enzyme substrates for these processes (Grene,
2002; Wojtaszek 1997; Schöpfer, 1996). These include:
(i) Photosynthesis and the respiratory electron transport chain (in the chloroplast
and mitochondria), which involves oxidation of transition metals such as Fe2+
or Cu+ (Fenton reactions).
(ii) Cytoplasm/membrane bound/exocellular enzymes (e.g. NADPH oxidase, cell-
wall peroxidase) involved in redox reactions during developmental stages such
as seed maturation and cell wall/lignin biosynthesis.
(iii) Exocellular enzymes in response to moderate stress conditions such as mild
wounding (plant defence via oxidative burst reactions).
5.2 Negative effects of ROS and the antioxidative defence system
Whilst having a positive role in plant metabolism, ROS can also be damaging or fatal to
the plant cell as they can easily react with bio-molecules (such as lipids, proteins and
nucleic acids) (Schinkel, 2001).
To be able to utilise ROS for crucial plant development/defence and
simultaneously avoid the damaging effects ROS, plant cells have an antioxidative
defence system to tightly control the levels of these reactive molecules. This defence
system comprises of several antioxidant enzymes (superoxide dismutase [SOD],
catalase [CAT] and peroxidases [POX]) and a network of low molecular weight
Chapter 1 − Introduction 18
antioxidant compounds (simple phenolic compounds, α-tocopherols) or reductants for
antioxidant enzymes (ascorbate in ascorbate peroxidase and glutathione in glutathione
peroxidase). ROS, such as •O2, are detoxified to H2O2 by superoxide dismutase (SOD)
or by low molecular weight antioxidant compounds (above). The H2O2 is then converted
into H2O and O2 by CAT or POX (that use either ascorbate or glutathione as
reductants). In addition, a group of enzymes (dehydroascorbate reductase or
mondehydroascorbate reductase and glutathione reductase) are involved in the
regeneration of these reductants (Schinkel, 2001; Blokhina et al., 2003).
5.3 Lead and oxidative stress
Elevated levels of lead ions (Pb2+) can enhance ROS formation by binding to SH-groups
of enzymes (such as those in the electron transport chain), substituting metal co-factors
of membrane enzymes (causing electron leakage from the plasma membrane) or by
binding directly to nucleic acids (Malecka et al., 2001; Geebelen et al., 2002). When
ROS generation under such heavy metal stress cannot be controlled, the antioxidative
defence system fails, resulting in lipid peroxidation, protein denaturation, DNA
mutations and eventually cell death – a condition known as oxidative stress (Schinkel,
2001; Blokhina et al., 2003). Some of these effects were reviewed in section 2.3 above.
6 HEAVY METAL TOLERANCE MECHANISMS
Plants can avoid or survive oxidative stress by: (i) controlling the concentration of
metal-ion (i.e free metal ion) in the cell or tissue by isolation or chelation (Mechanism
1), or (ii) detoxifying ROS (produced by elevated levels of metals) using the
antioxidative defence system (Mechanism 2).
Mechanisms 1 and 2 have been seen as two separate pathways - one focusing on
prevention, the other focusing on repair. However, an increasing body of evidence
suggests that the two are interlinked at certain metabolic points. In cadmium-exposed B.
juncea, glutathione has not only been shown to be an antioxidant of Mechanism 2 but
also a precursor to the phytochelatin chelator of Mechanism 1 (Navari-Izzo and
Quartacci, 2001). After exposure to cadmium, nickel tolerant Alyssum argenteum
showed higher antioxidant enzyme activity than nickel non-tolerant A. maritimum,
Chapter 1 − Introduction 19
suggesting that the antioxidative defence system (Mechanism 2) plays a role in Cd
tolerance (Schickler, 1999). In waterlilies, the role of the antioxidative defence system
(specifically peroxidases) in heavy metal tolerance was suggested. The experimental
results from this research suggest that increased peroxidase levels (Mechanism 2)
induced polymerisation of phenolics, and that this polymerisation served to trap/chelate
metal ions in the salt glands (Mechanism 1) (Lavid et al., 2001b).
7 MECHANISM 1 (PART I): CONTROLLING METAL-ION LEVELS
Plants exhibiting metal tolerance or survival under stress are known to control and/or
have the ability to reduce the effects of high free metal-ion concentrations. These can be
categorised into two methods (not completely separate of each other): (i) to avoid
uptake and build-up of toxic metals in the cytosol and (ii) detoxify metals that has
entered the cytosol. The first method is achieved by tissue or cellular isolation and the
second method involves metal-ion chelation to ligands.
7.1 Tissue isolation
The main heavy metal tolerance mechanism at whole plant level is the isolation of
heavy metals to external plant structures, such as trichomes. Using electron microprobe
techniques, Blamey et al. (1986) showed that Mn accumulated in and around leaf
trichomes of sunflowers (Helianthus annuus L.). Using radioactively labelled Cd, Salt
et al., (1995b) showed that Cd preferentially accumulated in the leaf trichomes of Indian
mustard plants (B. juncea L.). Isolation of metals to the root (and thus restriction to the
shoot tissue) is also another possible mechanism (Thurman, 1981; Krämer et al., 1997)
7.2 Cellular isolation
To control free metal-ion levels and protect cellular sites, metals are isolated by
entrapment in the apoplast (cell wall and intracellular space), or are isolated in vacuoles
or vesicles. Heavy metal entrapment in the cell wall has been observed in a variety of
plant tissues including epidermal tissues of Silene vulgaris spp. humulis (Bringezu et
al., 1999), roots of Allium cepa (Wierzbicka, 1995) and protallium of Lygodium
japonicum (Konno et al., 2005). Heavy metals can also be detoxified by isolation in
Chapter 1 − Introduction 20
vesicles and vacuoles (Clemens, 2001; Hall, 2002; Wierzbicka, 1995). In transmission
electron micrographs of onion root cells, Pb deposits where found in vesicles fusing
with the plasma membrane (Wierzbicka, 1998). In Zn-tolerant ecotypes of Silene
vulgaris, Zn transport into vesicles was 2.5 times higher than sensitive ecotypes (Hall,
2002).
7.3 Detoxification by ligand chelation
Chelation of metal-ions to ligands is the third method of heavy metal tolerance in
Mechanism 1. Chelation is thought to reduce metal toxicity and their ability to bind and
disrupt cellular processes.
Both inorganic and organic ligands have been implicated in heavy metal
tolerance, though the emphasis has been on the latter. The main inorganic compounds
include phosphates (Cotter-Howells et al., 1999) and silicates (Lichtenberger and
Neumann, 1997; Neumann and zur Nieden, 2001). In terms of organic compounds
(phytochemicals), PCs, MTs, organic acids and amino acids (reviewed by Clemens et
al., 2002 and Neumann et al., 1995; Prasad, 1999), cell wall proteins (Lichtenberger and
Neumann 1997; Bringezu et al., 1999), cell wall pectins (Thurman, 1981), and
polyphenols (Lavid et al., 2001b) have been implicated in the tolerance of specific
metals. Chelation of metals by these ligands is a result of the orientation and presence of
N, O, or S atoms present in these compounds. Phytochelatins (PCs), which are cysteine
rich polypeptides, has been extensively studied. In A. thaliana mutants, Cd tolerance
was correlated with the amount of PCs (Howden et al., 1995). Using B. juncea, it was
shown that Cd accumulation resulted in a rapid induction of PC synthesis (Haag-Kerwer
et al., 1999). Phytochelatins have been shown to bind to Cu and Cd in Silene vulargis
cell cultures but not Zn or Pb (Leopold et al., 1999). However, Leopold et al., (1999)
highlighted that the role of PCs is controversial. They also showed that in the case of
Cu, PC-Cu complexation was only an initial and temporary response and that Cu was
later found to complex with other unidentified compounds. Furthermore using A.
thaliana mutants, Lee et al., (2003) demonstrated that high levels of PCs lead to Cd
hypersensitivity. Organic acids, such as citrate and malate, have also been implicated in
heavy metal tolerance through the metal binding abilities of their carboxyl groups
(Clemens, 2001). The carboxyl group (COO-) of cell wall pectins has been implicated in
metal tolerance because of their ability to chelate metals. In Cu-tolerant Agrostis tenius
Chapter 1 − Introduction 21
(Thurman, 1981) and Lygodium japonicum fern (Konno et al., 2005) it has been
suggested that cell wall pectins, may be responsible for heavy metal tolerance as this
fraction contained the highest concentration of metals. However, Thurman (1981) also
cast doubt on the role of pectins. The pectin fraction of the Zn-tolerant Agrostis
stolonifera was shown to accumulate five times more Zn than other cell wall fractions.
He queried why this plant was also not Cu-tolerant given that Cu (according to Gurd
and Wilcox, 1956) binds to carboxyl groups of pectins with a higher affinity than Zn.
He also highlighted that the CEC of Zn-tolerant and non-tolerant roots of a number of
plants were similar, which is not expected if pectic acids contribute to Zn tolerance.
The possible role of polyphenols has also been implicated (see section 8). Since
polyphenols is the focus of this thesis, the next section is devoted to these compounds.
8 MECHANISM 1 (PART II): METAL-POLYPHENOL CHELATION
8.1 Polyphenols: class and structure
The basic structure of polyphenols consists of a 6-C aromatic ring with one or more
hydroxyl group bound to it (Waterman and Mole, 1994). In a majority of scientific
literature the term ‘polyphenol’ is interchangeable with the term ‘phenolic compound’
or ‘phenols’. However, a distinction between them is sometimes made (based on
molecular weight), leading to confusion of the polyphenol definition. The term
‘phenolic acid’ however, is not interchangeable as it refers to one class of polyphenols.
In this thesis, the term ‘polyphenols’ will be used to encompass all types of phenol-
based compounds.
8.1.1 Classes of polyphenols
There is a wide range of polyphenols, ranging from simple structures with one aromatic
ring to highly complex polymeric substances such as tannins and lignins. There are
eight classes of polyphenols: (1) simple phenolics compounds, (2) tannins, (3)
coumarins and their glycosides, (5) nathoquinones, (6) flavones and related flavonoid
glycosides, (7) anthocyanidins and anthocyanins, (8) lignans and lignin. All polyphenols
are formed via the shikimic acid pathway, also known as the phenylpropanoid pathway
Chapter 1 − Introduction 22
(Evans, 1996). The thesis will focus on the extractable polyphenol levels and specific
polyphenols called tannins.
8.1.2 Tannins
Tannins are the fourth most abundant phytochemical made by vascular plants, after
cellulose, hemicellulose and lignin (Kraus et al., 2003). Together with lignins, tannins
are the most widespread and abundant polyphenols in plants (Scalbert et al., 1999). One
of the most satisfactory definitions of tannins is that of Horvath (Brown, 2001):
“Any phenolic compound of sufficiently high molecular weight and containing a
sufficient number of hydroxyl or other suitable groups (i.e. carboxyls) to form
effectively strong complexes with proteins and other macromolecules under the
particular environmental condition being studied”.
This definition emphasises the character of tannins that sets it apart from all other
polyphenols: their ability to bind and precipitate proteins (Hagerman, 1998).
The two groups of tannins are hydrolysable tannins and condensed tannins.
Condensed tannins are more widespread than hydrolysable tannins. Hydrolysable
tannins are as their name suggests, easily hydrolysed by acids or enzymes such as
tannase (Evans, 1996). They are formed from several molecules of phenolic acids,
commonly gallic acid or ellagic acids, which are united by ester linkages to a central
glucose molecule. Unlike hydrolysable tannins, condensed tannins (proanthocyanidins)
are not readily hydrolysable and do not contain a sugar moiety. They are related to
flavonoid pigments and have a polymeric flavon-3-ol structure with A, B and C rings
(Evans, 1996; Kraus et al., 2003) (Figure 2).
8.2 General roles of plant polyphenols
The biological roles of polyphenols in plants are diverse. They are thought to help
plants: (i) attract pollinators and seed dispersal agents, (ii) regulate growth and
development, (iii) protect against herbivores, pathogens and environmental stress, (v)
provide structural support at cellular and tissue level and (vi) serve as antioxidants
(Chalker-Scott and Krahmer, 1989; Jackson et al., 1996; Lozovaya et al., 1999;
Blokhina et al., 2003).
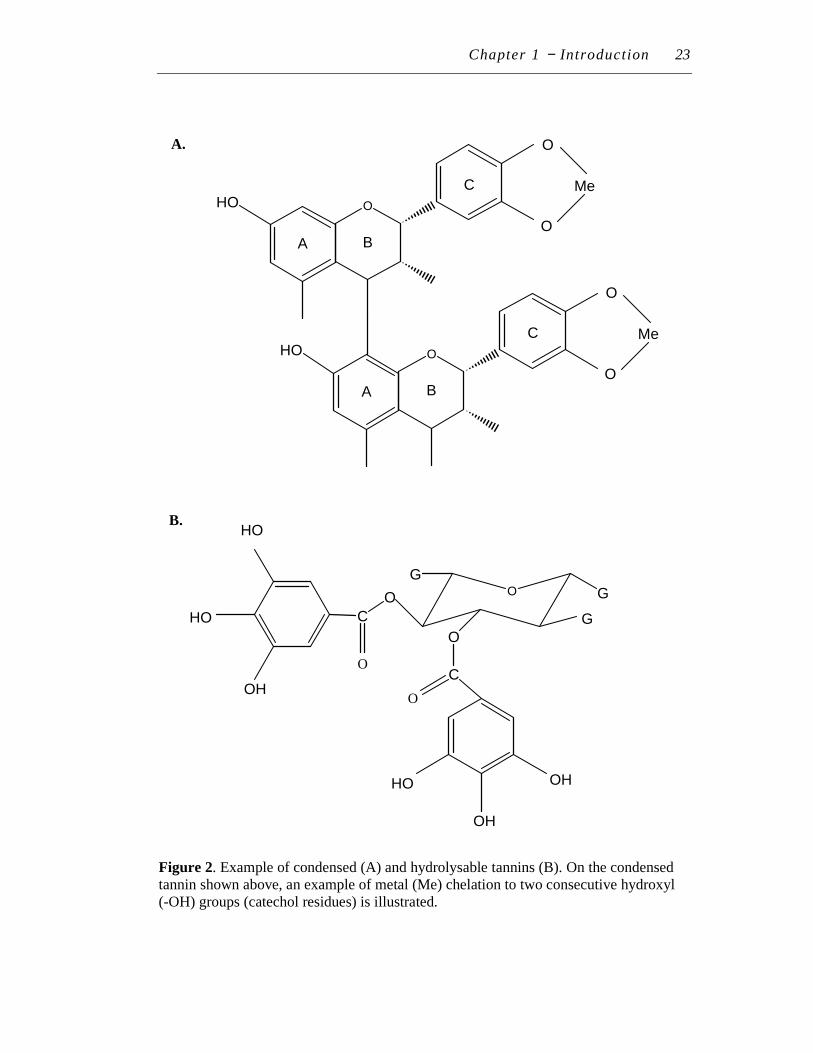
Chapter 1 − Introduction 23
OHO
O
O
Me
A B
C
O
G
G
C
O
O
OH
OH
HO
C
O
O
OH
HO
HO
G
OHO
O
O
Me
A B
C
Figure 2. Example of condensed (A) and hydrolysable tannins (B). On the condensed tannin shown above, an example of metal (Me) chelation to two consecutive hydroxyl (-OH) groups (catechol residues) is illustrated.
B.
A.
Chapter 1 − Introduction 24
Tannins are known to be involved in all these roles, except for role (i), which is
fulfilled by the anthocyanidin class of polyphenols. As growth regulators, tannins have
been shown to regulate certain plant tissues by inhibiting enzyme activities or acting as
barriers to growth (Chalker-Scott and Krahmer, 1989). In terms of defence, the high
concentration of tannins in protective tissues, such as bark, acts as ready-made anti-
microbial agents and barriers to microorganisms for underlying living tissue (Scalbert,
1991). In a study on the bacterium Erwinia chyrsanthumi, which causes rot in a wide
range of plants, tannins inhibited the bacterium’s growth by causing iron deprivation
through iron-tannin complexation (Scalbert et al., 1999). If underlying plant tissues are
wounded a protective cover can also be produced by oxidative cross-linking of
polyphenols (polymerisation). This process is also well known to influence the structure
and extensibility of cell walls (McCallum, 1989). The high tannin content of plants also
deters herbivores from foraging because of the astringent taste produced when plant
tannins chelate to herbivore salivary proteins (Scalbert et al., 1999; Fickel et al., 1999).
Polyphenols are also excellent antioxidants because they possess the ideal structure for
free radical scavenging. Their antioxidative property is due to their ability to: (i) be
hydrogen and electron donors, (ii) stabilise and delocalise the unpaired electron of ROS
(in their radical form), (iii) chelate transition metal-ions (e.g. Cu and Fe) involved in
ROS generation, (iv) alter lipid packing order and fluidity of membranes that could
hinder the diffusion of free radicals, and (v) be involved in hydrogen peroxide
scavenging cascade in plant cells (Blokhina et al., 2003; Jung et al., 2003).
8.3 Location of polyphenols in plants
8.3.1 Polyphenols at cellular level
Polyphenols are mostly detoxified by esterification with sugars moieties in the cell wall
and in vacuoles (Parham and Kaustinen, 1977; Chalker-Scott and Krahmer, 1989). A
disruption to the cell by pathogens or environmental stress releases these compounds
from their ester linkages and location (Bussotti et al., 1998; Chalker-Scott and Krahmer,
1989). They then become oxidised and quickly modify cell components such as
enzymes and proteins in the plant or pathogen. In other cases they are synthesised and
accumulate in the stressed tissue. The result is either a physical barrier or active
antibiotic compounds (Chalker-Scott and Krahmer, 1989).
Chapter 1 − Introduction 25
Polyphenols are present in the secondary and primary cell walls. In the secondary
cell wall, condensed tannins and catechins are thought to be precursors of lignin
biosynthesis due to their structural similarity to lignin precursors, and their ability to be
proton acceptors during lignin synthesis reactions (Chalker-Scott and Krahmer, 1989;
Lavid et al., 2001b). Tannins in the primary cell wall, when complexed with pectin,
cellulose or cell wall proteins, might form the initial matrix for lignin deposition
(Chalker-Scott and Krahmer, 1989). The primary cell wall not only consists of cellulose
and other sugars, but also phenolic acids (e.g. ferulic acids, p-coumaric acid) that are
normally associated with the secondary cell wall) to control the extensibility of the cell
wall (Chalker-Scott and Krahmer, 1989; Lozovaya et al., 1999). Polyphenols in
vacuoles of root and shoot tissue has been also reported (Mueller and Beckman, 1976;
Scarlet et al., 1989; Getachew et al., 1998; Hutzler et al., 1998).
Some phenolic compounds are also covalently linked to waxes (Hutzler et al.,
1998). An example is the waxy suberin layer, between the cell wall and plasma
membrane, which may contain condensed tannins. It has been suggested that these
polyphenols could stabilise the membrane-cell wall interface by providing a bridge
between the two layers; hydrophilic polyphenols attachments to the cell wall and
hydrophobic (suberin-wax fraction) attachments to the membrane (Chalker-Scott and
Krahmer, 1989).
8.3.2 Polyphenols at tissue level
Polyphenols are found in all tissues: bud, leaf, stem, bark, trichome, seed and root
(Chalker-Scott and Krahmer, 1989; Scalbert, 1991, Lavid et al., 2001b).
The root tissue was the main focus in this study because this tissue of the
experimental plant contained the highest level of polyphenols (see results section).
There are few histochemical studies on the location of tannins in the root tissue. In
cotton roots, catechins and gallocatechins have been reported in the hypodermis,
endodermis, xylem, and root cap. In Rheum roots, tannins have been found in cork cells,
particularly those close to the outside of the root (Chalker-Scott and Krahmer, 1989). In
general, tannins are mostly found in the hypodermis. Such external distribution of
polyphenols in the root tissue may serve as a chemical barrier to penetration and
colonisation of roots by plant pathogens (Mace and Howell, 1974).
Chapter 1 − Introduction 26
8.4 Heavy metal tolerance: chelation to polyphenols?
Polyphenols, especially tannins, are well known for their in vitro ability to chelate
metals, such as iron (Fe) and Pb (Lavid et al., 2001a; Evans, 1996). Virtually all tannins
and most polyphenols have a catechol residue (two consecutive -OH groups on an
aromatic ring) that makes them excellent metal-ion chelators.
These metal-chelating properties have formed the basis of a number of industrial
products such as, Cu agents in wood preservation, writing inks, and foliar sprays
(McDonald et al., 1996; Laks and McKaig et al., 1988). Polyphenol-metal chelation has
also been an important factor in human and cattle nutritional studies (Bravo, 1998;
Lavid et al., 2001b). In cattle nutritional studies, it was found that high intake of tannin-
rich foods inhibited Fe absorption, resulting in dietary deficiencies (Terrill et al., 1992).
Similarly, in humans the consumption of polyphenol-rich foods such as tea and coffee is
known to decrease Fe absorption. In severe cases, this has led to Fe deficiency-related
illnesses such as anaemia (Scalbert et al., 1999).
Investigating the role of polyphenol-metal chelation in heavy metal tolerance may
be important in developing successful phytoremediation. However, the biological
importance of metal chelation by polyphenols (especially tannins) in plants towards
heavy metal tolerance is not well known. Loponen et al., (2001) suggested that
polyphenols (e.g. catechin) in white birch leaves (Betula pubescens) may be involved in
heavy metal tolerance as higher levels of these compounds were found in these plants at
(and closer to) polluted sites (e.g. Ni-Cu smelter). An increase in amino acids precursors
in these plants that make polyphenols (e.g. phenylalanine) (Moreno et al., 2003), and
soluble polyphenol levels (Schützendübel et al., 2001; Tripathi and Tripathi 1999; Ruso
et al., 2001) has also been reported.
Studies in which tannins are thought to be involved in heavy metal accumulation
and tolerance include: epidermal glands of Nymphaea auroa upon exposure to Cd, Pb
and Cr (Lavid et al., 2001a), root apices of Lotus pendunculatus Cav. during exposure
to Al (Stoutjesdijk et al., 2001), tannin cells of Armeria maritima with Cu exposure
(Lichtenberger and Neumann, 1997). With respect to Pb, reports into the role of tannin-
metal chelation in tolerance and phytoremediation are rare. The involvement of
condensed tannins in Pb accumulation in Athyrium yokoscense (fern) gametophytes has
also been suggested (Kamachi et al., 2005). The role of polyphenols in chelated Pb
Chapter 1 − Introduction 27
tolerance (as opposed to the above examples which all involve unchelated metals) is
unknown.
9 MECHANISM 2: THE ANTIOXIDATIVE DEFENCE SYSTEM (ADS)
If the metal-ion concentration cannot be controlled with Mechanism 1, ROS formation
will increase. The role of the antioxidative defence system is to remove excess ROS
produced in order to avoid a build-up of ROS that will eventually cause oxidative stress.
The role of this defence system in heavy metal tolerance is scant, especially in regard to
the presence of chelating agents like EDTA. Of the ADS components that could be
involved in heavy metal tolerance, the superoxide dismutase (SOD) enzyme will be the
focus of this study.
9.1 Superoxide dismutase (SOD)
Superoxide dismutase (SOD, EC 1.15.11) is the first and sole enzyme of the
antioxidative defence system which catalyses the destruction of the superoxide anion
(.O2-) into hydrogen peroxide (H2O2) and elemental oxygen (O2). There are three types
of SOD, each differentiated by their metal ion co-factor and location in the cell: Fe-
SOD (choloroplast), MnSOD (mitochondrion and peroxisomes) and Cu/ZnSOD
(chloroplast and cell wall) (Del Rio et al., 2003; Alscher et al., 2002). SODs are found
at these sites because they are where superoxide anions production and accumulation
occurs (Grene, 2002).
Equation: 2 •O2 + 2H+ H2O2 + O2
9.2 Role of SOD in heavy metal tolerance
The role of the plants’ antioxidative defence enzymes in heavy metal tolerance is a
relatively new branch of study. Superoxide dismutase may contribute to Pb tolerance in
two ways: (i) by detoxifying superoxide anions into H2O2, and (ii) by producing a
substrate (H2O2) which is involved in creating polymerised (also known as oxidised)
SOD
Chapter 1 − Introduction 28
polyphenols that chelate metals. Overall, the trend in SOD activity on polyphenol levels
is of interest in this study.
In most reported studies, the direction of SOD activity is variable (Gratao et al.,
2005). This is partly due to differences in experimental factors such as plant species,
tissue type, metal type, metal concentration, and duration of metal exposure.
However, most papers (using seedlings) report an increase in activity upon heavy metal
exposure (Ali et al., 2003; Ruley et al., 2004; Reddy et al., 2005). For example, in roots
of peas (Pisum sativum) treated with 0.5-1 mM Pb(NO3)2, SOD activity increased by
three-fold (Malecka et al., 2001). After 15 days in the same concentrations of Pb, SOD
activity increased by 87-100% in rice seedlings (Oryza sativa) (Verma and Dubey,
2003). However, onions (Allium cepa) exposed to wastewater containing 167.3 ppm Pb
showed a steep decline in SOD (Fatima and Ahmad, 2005). The same decreasing trend
(indicating oxidative stress) was also observed in peas exposed to Cd (Sandalio et al.,
2001).
10 TISSUE CULTURE AND PHYTOREMEDIATION
Tissue culture has been used as a tool to propagate and investigate tolerance
mechanisms, such as those relating to the antioxidative defence system, in heavy metal
tolerant plants. For example, shoot explants of Acer psuedoplatanus L. (sycamore)
(Watmough and Dickinson, 1996) and A. rubum L. (red maple) (Watmough and
Hutchinson, 1998) trees growing near metal smelters were cultured and callus tissues
generated. Exposure of the callus tissues to Zn for example, showed that callus or cell
lines generated from the most heavily contaminated Zn site, also exhibited the highest
Zn tolerance (in terms of fresh weight and lethal dosage of metal). Similarly, in cell
suspension cultures of Sesbania drummondii, tolerance was related to a positive
correlation between Pb accumulation levels (0-500 mg L-1 Pb(NO3)2) and induction of
antioxidative enzyme activities (SOD and CAT) (Sharma et al., 2005). Whilst the role
of elevated antioxidative enzyme activity to heavy metal tolerance was demonstrated in
this study, it is not true in all studies. Using heavy metal tolerant and sensitive clones of
Salix viminalis, Landberg and Greger (2002) showed that there was no difference in
antioxidative enzyme activities upon heavy metal exposure. However, they suggested
Chapter 1 − Introduction 29
that Salix tolerance could be attributed to the elevated SOD level in tolerant clones prior
to exposure to heavy metals. On average, SOD levels were 11% higher in shoots and
24% higher in roots of tolerant clones, suggesting that tolerant Salix species required
less SOD production to achieve the same SOD level as the sensitive clones upon heavy
metal exposure.
11 MUTANT STUDIES AND PHYTOREMEDIATION
There are four approaches to obtaining mutants for heavy metal tolerance and
accumulation studies: (i) cultivar screening, (ii) somaclonal variation, (iii) genetic
modification, and (iv) chemical mutageneisis. This section will review the last three
approaches because they involve tissue culture; an example of cultivar screening is
indicated in section 3.35 above.
11.1 Somaclonal variation approach
Somaclonal variations are mutations in plant tissue cultures that occur randomly, or are
induced under in vitro selective pressures. The technique is often exploited to develop
plants with desirable traits such as larger plant size, new flower and fruit colours, and
resistance to stress conditions such as pathogens and salinity (Remotti, 1998). In this
thesis, induced somaclonal variations in tissue culture will be used as a tool to
investigate and attempt to improve the phytoremediation properties of our experimental
plant growing under heavy metal (Pb) stress.
11.1.1 Types and advantages
There are three main types of somaclonal variations: (i) genetic variation - change in
nucleotide sequence of DNA and chromosome number or structure (inheritable), (ii)
epigenetic variation - change in gene expression (but not inheritable) and can be
expressed without the presence of the stress condition, and (iii) physiological or
adaptive variation - change in gene expression (not inheritable), but only present under
stress conditions. The latter two forms of mutations occur frequently, whereas genetic
variations are rare and reflect why only a few new cultivars developed via somaclonal
mutations have been released to date (Tal, 1990).
Chapter 1 − Introduction 30
The advantage of tissue culture-based somaclonal variation is in the flexibility and
public acceptance of the technique when compared to genetic engineering. Tissue
culture allows a wide range of plant materials to be examined; from whole plants to
selected tissues such as bud, leaf or just root tissue, to undifferentiated cells in callus
tissues and cell suspension cultures. It also allows a large population to be handled,
selected and cloned. From a public acceptance stance, plants derived from somaclonal
variations are more acceptable compared to transgenic plants (a genetically modified
organism) as no genetic information has been deliberately inserted into the original
plant genome; all variations rely on chance, which is not different from natural
evolution (Predieri, 2001).
11.1.2 Induced somaclonal variation
The cell culture environment can be manipulated to enhance the rate of somaclonal
mutations. Whole plants, tissues, or more commonly callus (undifferentiated cells) are
exposed to the stress factor in a one-step high-dose approach (shock treatment) or via a
more gradual incremental dosage approach. The surviving cells are then selected for
regeneration with and without the stress factor to determine if the mutation is genetic or
adaptive. Besides stress factor exposure, the normal nutrient media can also be altered.
Mineral deficiencies in magnesium, calcium, phosphorous, nitrogen and sulphur, and
the addition of the 2,4 D (a plant growth regulator) have been reported to induce
chromosomal breakages and double mutation rates (Conner and Meredith, 1984a and b).
There are two debates within the approach of somaclonal mutation. Firstly, which
plant tissue should be used for somaclonal variation: callus tissue or a differentiated
tissue such as leaves. This is debated because mutations observed at callus level do not
necessarily occur in differentiated tissues. Secondly, the duration of stress factor
exposure: ‘shock’ treatment or gradual exposure approach. Genetic, heritable variations
are said to increase with the one-step approach, but it is argued that this fast approach
does not allow the cell or tissue to fully develop their tolerance capabilities (Tal, 1990;
Remotti, 1998).
Chapter 1 − Introduction 31
11.1.3 Developing heavy metal tolerant plants
In heavy metal tolerance studies, somaclonal variation has been rarely used to develop
plants or tissues with heavy metal sensitivity or tolerance. In vitro Al tolerance has been
developed in the plantlets of Oryza sativa and Daucus carota and Cd tolerance in the
callus tissue of Datura innoxia and Nicotiana tabacum (Remotti, 1998). Gallego et al.,
(2002) demonstrated an involvement of the antioxidative defence system in the
adaptation of Helianthus annuus L. callus to heavy metals. In Cd- and Cr-adapted
callus, all antioxidative enzymes except GR, (SOD, CAT, POX), were elevated relative
to controls (non-heavy metal exposed callus). Somaclonal variation has also been
applied to understanding salt tolerance mechanisms in crop plants such as B. juncea
(Remotti, 1998) and Lycopersicon esculentum Mill. (Rus et al., 2000).
11.2 Genetic modification approach
Another approach to develop metal-tolerant plant species is to use genetic modification.
The goal of this approach is to develop fast growing, high-biomass plants with the metal
accumulation traits of natural small biomass hyperaccumulators: ‘engineered
phytoremediators’ (Ow, 1996). The advantage of this technique is the relatively short
space of time and selective targeting of genes for improvement.
The possible areas of genetic manipulation include: (i) metallothioneins,
phytochelatins and other natural metal chelators, (ii) metal transporters, (iii) alteration
of metabolic pathways and (iv) alteration of oxidative stress mechanisms (v) alteration
of root structure and shoot biomass (Kärenlampi et al., 2000; Eapen and D’Souza 2005;
Yang et al., 2005).
Over the last few years, the genetic modification approach has gained significant
momentum. Until recently, most metal or metalloid (semi-metals) tolerant genes used
for engineering phytoremediators have been of microbial origin. Other genes used
originated from non-hyperaccumulating plant genes, and mammalian metallothionein
and phytochelatin synthase (Tong et al., 2004; Eapen and D’Souza 2005). More
recently, insertion of metal and metalloid tolerant genes from hyperaccumulating plants
into non-hyperaccumulators has been reported (LeDuc et al., 2004, see below).
Chapter 1 − Introduction 32
11.2.1 Transgenic plants
The development of engineered phytoremediators began with the phytovolatilisation
form of phytoremediation. Mercuric-ion reductase (Mer protein), a bacterial protein
which reduces Hg2+ to volatile Hg0, was inserted into Arabidopsis, tobacco and poplar
plants. These transgenic plants were found to be more tolerant of organic mercury (Song
et al., 2003; Krämer, 2005). Other notable examples of transgenic plants modified with
genes of microbial origin include those that detoxify arsenic (As) and selenium (Se)
metalloids (reviewed in Eapen and D’Souza 2005).
The first high biomass engineered phytoremediator involved selenium (Se)
(achieved at a laboratory scale). Although it is a metalloid and not a heavy metal, Se
was the first contaminant where insertion and overexpression of a hyperaccumulator
plant gene (SMT from Astragalus bisulatus) into a fast growing plant (Brassica juncea)
resulted in increased tolerance, accumulation and volatilisation of selenate (the
predominant form Se in soils) (LeDuc et al., 2004). In field-scale studies, Se-
transformed plants (inserted with E. coli genes which enhanced selenate assimilation
and glutathione synthesis) have been shown to enhance Se phytoremediation (Bañuelos
et al., 2005). Most recently, Cd accumulation was enhanced when a metallothionein
gene from Silene vulgaris L. was overexpressed in the high biomass Nicotiana tabacum
L. (tobacco) (Gorinova et al., 2006).
Recent developments in Hg and As transgenic plants have also included targeting
the tolerant genes to specific cell sites and tissues or expressing a transgene only under
certain conditions (Krämer, 2005; Pilon-Smits, 2005). In the case of Hg, targeting the
Mer protein to the cell wall or endoplasmic reticulum (where non-votalile forms of
mercury accumulate) enhanced the effectiveness of this transgene. Transgenic A.
thaliana plants with the ArsC gene targeted downstream of the soybean promoter
(which confers shoot-specific and light-induced expression), reduced root accumulation
and increased As translocation (Krämer, 2005).
However, currently there are no transgenic plants adequate for commercial
phytoextraction (Krämer, 2005). Furthermore, there is currently no fast growing, high
biomass engineered phytoremediator for Pb. This may be because there is no known
function of Pb in plants and thus there are very few genes conferring Pb tolerance and or
accumulation. The exception to this is Saccharomyces cerevisiae (yeast) protein YCF1,
Chapter 1 − Introduction 33
(a transporter protein which pumps Cd and Pb into vacuoles) and TaPCS1 (which
encodes PCs). Overexpression of YCF1 protein in transgenic A. thaliana and yeast
resulted in enhanced tolerance and accumulation to these heavy metals. Deletion of
YCF1 protein from yeast cells resulted in hypersensitivity to Pb (Song et al., 2003). The
overexpression of TaPCS1 (involved in PC synthesis) in Nicotiana glauca also
increased Pb accumulation and root growth under Pb treatment (Martinez et al., 2006).
11.2.2 Risks associated with genetic engineering
The potential risks associated with using engineered phytoremediators include: (i)
transgene flow, (ii) use of antibiotic resistance markers, (iii) cross contamination of
human and animal foods, and (iv) effect on rhizosphere ecology. Of these risks, the
most concerning is transgene flow because it may lead to the possible loss of genetic
diversity and extinction of wild plants if genes flow from cultivated plants to wild
relatives (Davison, 2005). To decrease the chances of spreading the transgene from
engineered phytoremediators to natural plant populations, biological encapsulation has
been proposed. This is where the gene(s) are inserted into the chloroplast genome
instead of the nuclear genome (Krämer, 2005; Pilon-Smits, 2005). The use of
conditional suicide genes may also be possible (Davison, 2005). For example, upon
depletion of a certain pollutant or escape of the plant to non-contaminated soils, suicide
genes could be activated. Another example is designing suicide genes that are activated
upon an external environmental stimulus such as ethanol (Davison, 2005). However,
this could be a concern if the suicide gene is transferred to non-target plants.
Currently in New Zealand, the Environmental Risk Management Authority
(ERMA) strictly controls the use and release of genetically modified organisms
(GMOs). At the time of this thesis, there was a moratorium (part of the Hazardous
Substance and New Organism Act, 1996 and Biosecurity Act, 1993) on releasing
GMOs in New Zealand (Ministry for the Environment – online, 2006). Consequently,
since this situation led to an uncertain future for GM crops in New Zealand, the genetic
modification approach was not the focus in this study.
Chapter 1 − Introduction 34
11.3 Chemical mutagenesis approach and Arabidopsis thaliana
Whilst somaclonal mutations occur under heavy metal exposure, they are unlikely to be
inheritable. For this reason, selection and analysis of chemically induced (EMS)
Arabidopsis thaliana mutants is useful in understanding heavy metal tolerance
mechanisms, especially in terms of Mechanism 1 and 2, or identifying specific
inheritable genes involved in heavy metal accumulation and tolerance.
Since the 1960s, A. thaliana has been widely used as a model plant species to
study basic plant processes and responses to conditions, such as nutrient deficiency and
metal toxicity. It is used as a model plant system mainly because of its small well-
characterised genome, short life cycle, large seed set and small seed size (Delhaize et
al., 1993). Its familial links with natural hyperaccumulators from the Brassicaceae
family, such as Thlapsi caerulescens, has been cited as another reason for its use in
metal toxicity studies.
Numerous Arabidopsis studies have increased the understanding of plant
metabolism. These include the identification and analysis of mutants showing enhanced
iron accumulation, defective phosphate translocation, and nitrate metabolism (Chen et
al., 1997). In metal toxicity studies isolation of mutants has enhanced the understanding
of heavy metal toxicity, tolerance and accumulation. For example, callose was thought
to be responsible for Al root inhibition, but isolation of mutants rejected this idea
(Larsen et al., 1996). Phytochelatins are thought to be involved in heavy metal tolerance
and studies to test this have been made possible by isolating the PC synthase gene from
Cd-sensitive mutants with deficient PC synthesis (Cobbett, 2003). In Pb-related studies,
Chen et al., 1997 initiated a research programme to identify A. thaliana Pb mutants to
similarly enhance the understanding of Pb accumulation and tolerance in plants. It was
envisaged that identification of genes controlling Pb accumulation and tolerance in
Arabidopsis mutants, could be useful for engineering better phytoextraction plants. In
the initial experiments over 500,000 seedlings were screened for Pb mutants, using root
length indicators. Three mutants, APb2, APb7, APb8 were isolated. These mutants not
only had elevated Pb shoot accumulation levels (three fold on a dry weight basis)
relative to wild type plants, but also elevated accumulation levels of Cu, Mg, Zn and S.
A possible mutation in the man 1 gene controlling metal-ion uptake or levels in the
mutant has been suggested as the basis for increased Pb accumulation and tolerance.
Chapter 1 − Introduction 35
Isolating such genes may lead to genes for genetic engineering to enhance Pb
phytoremediation.
12 SYMPHYTUM OFFICINALE L. (COMFREY)
Comfrey or knitbone (Symphytum officinale L.) is an erect, hairy perennial, native to
Europe and temperate Asia, and naturalised in many countries such as New Zealand. It
is a terrestrial plant that grows easily in damp, shady places, particularly near streams
(Chevalier, 1996). S. officinale is an important animal feed in parts of the world such as
Europe and Africa, and has been an important medicinal herb in healing fractures
(Chevalier, 1996; Lawerence, 1976).
Symphytum officinale was selected for this project as an experimental plant for the
following reasons. Firstly, it has a fast growth rate and high biomass (on average, some
species of comfrey are able to produce 73 metric tones dry matter ha-1 yr-1) (Lawerence,
1976), three times that of corn which has been selected as a possible phytoremediation
plant (Saxena et al., 1999). Secondly, it has not been tested for phytoremediation.
Finally, it contains the compounds under investigation: polyphenols and tannins.
According to the PDR (1998) this plant contains 8-9% (d.w.) of tannins in shoots and 4-
6% (d.w.) in roots. Additionally, S. officinale also has other features that could be
beneficial to phytoremediation. These include: (i) a long and dense root system, (ii)
regenerable shoots, well suited for continuous phytoextraction, (iii) abundance of
trichomes which is a possible factor in metal tolerance (see above), (iv) its ability to
withstand high salt environments, like near streams, may be advantageous for
rhizofiltration, and finally (v) a high protein content (33% of dry matter) which could
indicate an ability to produce protein-based metal chelators (e.g. PCs, MTs or transport
proteins).
13 AIM AND OBJECTIVES
Due to its widespread distribution, persistence, and toxicity to human health (Csuros,
1994), lead (Pb) is often considered as the primary target for remediation studies, such
as phytoremediation (Chen et al., 1997).
Chapter 1 − Introduction 36
Over the past decade, advances in phytoremediation have been a result of several
research initiatives. These include the:
(i) study of metal uptake, transport, tolerance and accumulation mechanisms
(ii) study of metal solubility, and the concentration and type of chelating agents
(iii) selection of plant varieties (ecotypes, cultivars, and transgenic plants)
In this study, three objectives in line with these initiatives were developed to advance
Pb phytoremediation (using S. officinale as the experimental plant).
(i) Objective 1: Association of plant polyphenols (particularly tannins) with the
chelation-based heavy metal tolerance mechanism (tolerance mechanism 1)
and Pb accumulation.
(ii) Objective 2: Phytoremediation potential of S. officinale based on chemical-
based variations to Pb concentrations and chelating agents.
(iii) Objective 3: Use somaclonal variation to develop and screen for Pb mutants
in S. officinale (sensitive or tolerant).
Recent studies have shown that plant polyphenols may be involved in heavy metal
tolerance via its ability to chelate to metal ions (tolerance Mechanism 1) (Lavid et al.,
2001b). This is important for non-chelator based phytoremediation and for chelated-
assisted phytoextraction where up to 40% of chelated Pb (PbEDTA) may dissociate into
free Pb ions (Geebelen et al., 2002). However, no studies to date have directly
correlated the role of Pb-tannin chelation to Pb tolerance and accumulation in
phytoremediation. Thus, the research began with the main objective of this project,
objective 1. Central to this objective was to determine if there was a correlation between
extractable polyphenol levels and Pb uptake/accumulation using in vivo and in vitro
experiments. In vivo experiments firstly began with determining the distribution of
polyphenols and tannins in S. officinale and the best possible experimental parameters
for their analysis (e.g. assay type and extraction method). After hydroponic exposure to
Pb(NO3)2 with or without EDTA, the extractable polyphenol and tannin levels of roots
were analysed (because polyphenols were the highest in these tissues) All tissues (shoot
and root) were used to determine Pb accumulation (and thus phytoremediation
potential). Moreover, the large in vivo difference in polyphenol levels between the two
root types of S. officinale (lateral and main roots), were utilised for Pb-polyphenol
Chapter 1 − Introduction 37
correlation experiments. To further support the in vivo findings, transmission electron
micrographs of roots with and without Pb treatment were examined to locate Pb
accumulation at a cellular level and ultimately determine if they could be co-localised
with known tannin sites in the cell. To consolidate the in vivo findings (i.e. to reduce the
possibility that non-tannin factors were involved in Pb accumulation and tolerance) in
vitro studies demonstrating that S. officinale tannins have the ability to chelate Pb ions
under in vitro conditions were performed. However, the method employed for this
purpose gave a completely contrary finding to the in vivo hydroponic experiments
because the method was subject to interferences from other compounds in the extracts.
Since there was no other established method, a new in vitro Pb-tannin chelation method
had to be designed.
The second objective assessed the phytoextraction potential of S. officinale using
increasing Pb and EDTA concentrations and testing a different chelating agent. In
performing these experiments an unexpected trend in these experiments was observed.
This led to an additional experimental question: “Why did the addition of EDTA to
feeding solutions have a negative effect on accumulation of Pb in roots (which was not
accounted for by the level translocated to the shoots)?” The effects of EDTA pre-
treatment and alternative chelating agents (ADA) on polyphenol levels and Pb
accumulation were subsequently assessed to elucidate an answer.
The final objective was to use somaclonal variation in tissue culture to develop S.
officinale Pb mutants in order to further investigate and attempt to improve the Pb
phytoremediation potential of this experimental plant. Firstly, in vitro tissue culture
stocks of S. officinale were established. Secondly, plants from Pb-treated petioles were
developed under in vitro conditions. Finally, these plants were re-treated with Pb (under
non-sterile conditions). Changes to morphology, Pb accumulation, polyphenols levels,
and SOD activity were assessed to determine if and how mutations may have occurred.
Histochemical localisation of superoxide anions in any Pb-tolerant mutant was also
planned. Since mutations in S. officinale may not be heritable, selection and similar
assessment of genetically altered Pb-tolerant A. thaliana mutants was also to be
performed (see Appendix K).
Chapter 2 − Materials and methods 38
CHAPTER 2
MATERIALS and METHODS
Objective 1
Association of polyphenols with chelation-based tolerance mechanism and Pb
accumulation: Hydroponic studies with sand-grown Symphytum officinale
1 PLANT PROPAGATION
1.1 Root stock
Symphytum officinale root-stocks (approximately 10-years-old) were obtained from
Millstream Gardens, Napier. All roots were stored at room temperature in the dark and
kept moist.
1.2 Vegetative plant propagation
S. officinale plants were propagated using guidelines from Gardiner (1997), Seitz (1996)
and Thompson (1992). Plants were established using root sections that were four cm
long and one cm in diameter. The entire root section was placed vertically until the head
was only 0.5 cm below the surface of the sand-based growth medium (consisting of
approximately five grams of Nutricote™ 8-9 month slow-release fertiliser granules
sprinkled on the top for every one litre of fine sand). All plants were grown in
greenhouses for approximately 2-10 months depending on the experiment.
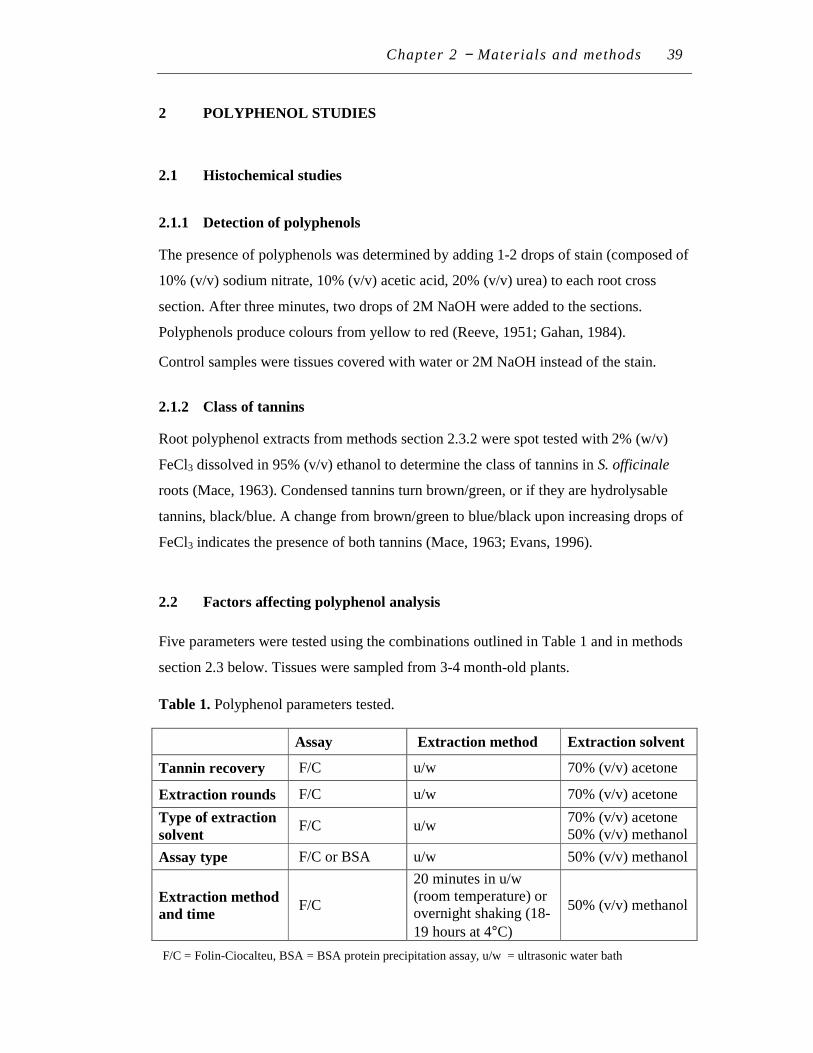
Chapter 2 − Materials and methods 39
2 POLYPHENOL STUDIES
2.1 Histochemical studies
2.1.1 Detection of polyphenols
The presence of polyphenols was determined by adding 1-2 drops of stain (composed of
10% (v/v) sodium nitrate, 10% (v/v) acetic acid, 20% (v/v) urea) to each root cross
section. After three minutes, two drops of 2M NaOH were added to the sections.
Polyphenols produce colours from yellow to red (Reeve, 1951; Gahan, 1984).
Control samples were tissues covered with water or 2M NaOH instead of the stain.
2.1.2 Class of tannins
Root polyphenol extracts from methods section 2.3.2 were spot tested with 2% (w/v)
FeCl3 dissolved in 95% (v/v) ethanol to determine the class of tannins in S. officinale
roots (Mace, 1963). Condensed tannins turn brown/green, or if they are hydrolysable
tannins, black/blue. A change from brown/green to blue/black upon increasing drops of
FeCl3 indicates the presence of both tannins (Mace, 1963; Evans, 1996).
2.2 Factors affecting polyphenol analysis
Five parameters were tested using the combinations outlined in Table 1 and in methods
section 2.3 below. Tissues were sampled from 3-4 month-old plants.
Table 1. Polyphenol parameters tested.
F/C = Folin-Ciocalteu, BSA = BSA protein precipitation assay, u/w = ultrasonic water bath
Assay Extraction method Extraction solvent
Tannin recovery F/C u/w 70% (v/v) acetone
Extraction rounds F/C u/w 70% (v/v) acetone
Type of extraction
solvent F/C u/w
70% (v/v) acetone 50% (v/v) methanol
Assay type F/C or BSA u/w 50% (v/v) methanol
Extraction method
and time F/C
20 minutes in u/w (room temperature) or overnight shaking (18-
19 hours at 4°C)
50% (v/v) methanol
Chapter 2 − Materials and methods 40
2.3 Polyphenol and tannin extraction
The following methods were performed using a combination of methods (some with
modifications) from Lavid et al., (2001b), FAO/IAEA manual (2002), and Waterman
and Mole (1994). For mainly practical reasons, the use of dried tissue is the preferred
method of sample preparation for polyphenol studies (Waterman and Mole, 1994;
Brown, 2001), especially when the sample size is greater than three grams (d.w.).
2.3.1 Sample preparation
In a 4°C cold room, different plant parts (leaf blade, petiole, lateral root, main root)
were cut into small pieces. Tissues were frozen and crushed into smaller pieces with
liquid nitrogen before they were stored overnight at -80°C. Samples were freeze-dried
(ThermoSavant, Super Modulyo 230) for at least two days, and then the dried samples
were stored in capped glass vials enclosed in an airtight container with silica crystals.
In this study, the lateral roots were less than one mm wide in diameter and
branching from a main root. The main roots were at least two mm wide in diameter
from which lateral roots extended (Plate 1).
2.3.2 Extraction methods
To avoid condensation onto dried samples, vials were equilibrated to room temperature
prior to opening. For method section 2.2 (testing extraction factors), freeze-dried tissues
were ground to a fine powder (with a mortar and pestle). Approximately 0.2 g of tissue
was extracted for polyphenols and the tissue extracted with 25 mL of 70% (v/v)
aqueous acetone or 50% (v/v) aqueous methanol in an ultrasonic water bath (for 20
minutes at room temperature), or overnight on a shaker (for 18-19 hours at 4°C). Unless
indicated in the methods or results, the extraction method was then standardised as
follows. Dried tissues were ground with a ball mill (Retscher MM300) and extracted
with 50% (v/v) methanol in an ultrasonic water bath (for 20 minutes at room
temperature). Samples were centrifuged at 11,000g for 15 minutes, at 4°C. The
supernatant volume was measured prior to each polyphenol/tannin assay.
2.4 Polyphenol quantification
In the preliminary experiments, pigments and fats from leaf and root extracts were
removed by extraction with diethyl ether containing 1% (v/v) acetic acid prior to the
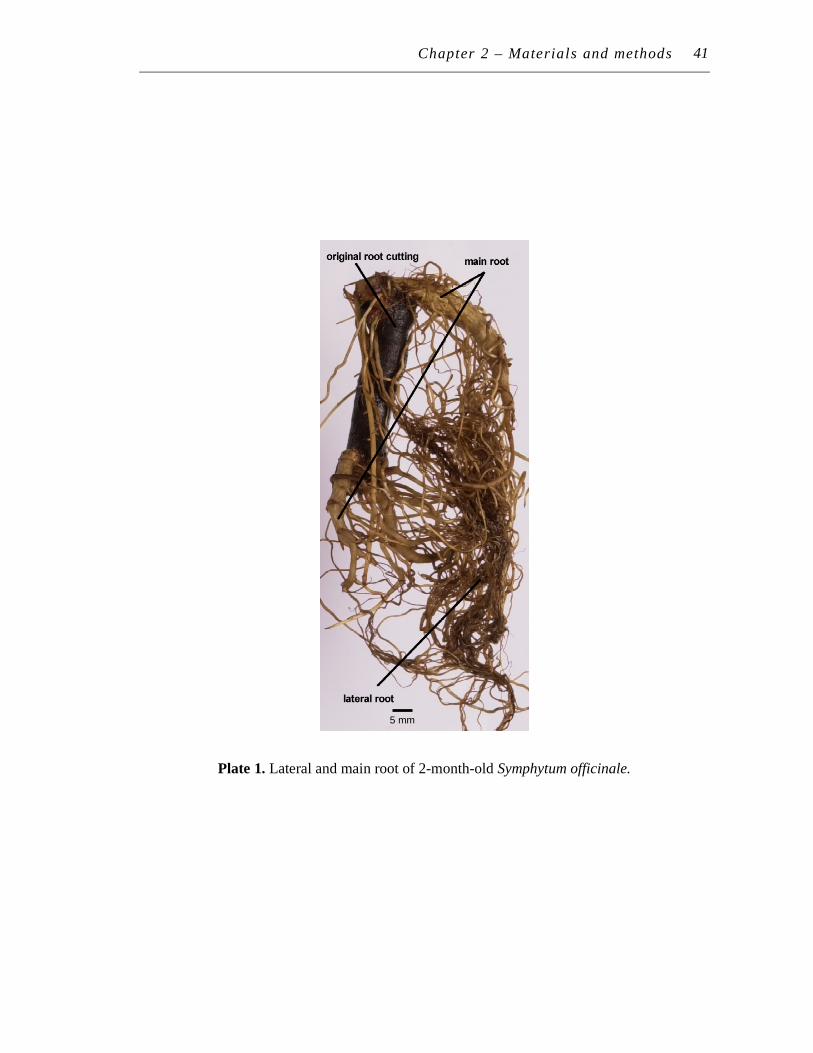
Chapter 2 – Materials and methods 45
5 mm
Plate 1. Lateral and main root of 2-month-old Symphytum officinale.
41
Chapter 2 − Materials and methods 42
Folin-Ciocalteu or BSA assay. When necessary, extracts were diluted to obtain readings
within the calibration curve. For the Folin-Ciocalteu and BSA assays, the standards
were prepared with stock solutions of purified tannic acid (Sigma) at 0.1 mg mL-1 and
0.5 mg mL-1 respectively.
2.4.1 Folin-Ciocalteu assay for polyphenols
The following ingredients were added to 5-mL-capacity test tubes: 0.04 mL of
polyphenol extract (from methods section 2.3.2), 0.36 mL of dH2O, and 0.2 mL of 1 M
Folin-Ciocalteu reagent (BDH). Samples were vortexed and stood for 3-4 minutes prior
to addition of one mL of 7.91% (w/v) anhydrous sodium carbonate. Samples were
vortexed again, stood for five minutes in a 45°C water bath (for polyphenol studies in
results section 2) or 40 minutes at room temperature (in all other experiments).
Absorbancy of all samples were read at 725 nm.
2.4.2 BSA-protein precipitation assay for polyphenols
The following ingredients were added to 3-mL-capacity test tubes: Increasing volumes
of polyphenol extracts from methods section 2.3.2 (0-0.25 mL) adjusted to a total of
0.25 mL with 1% (w/v) SDS, 0.75 mL of 1% (w/v) SDS-7% (v/v) TEA and 0.25 mL of
FeCl3 reagent (0.01 M FeCl3 in 0.1 M HCl). Vortexed samples were stood at room
temperature for 30 minutes and then read at 510 nm.
2.4.3 Folin-Ciocalteu assay for tannins
The following ingredients were added to 1.8-mL-capacity-Eppendorf centrifuge tubes:
0.03 g of PVPP, 0.3 mL of dH2O, and 0.3 mL of polyphenol extract from methods
section 2.3.2. Tubes were then vortexed before and after standing for 15 minutes at
4°C, then centrifuged at 10,000g for 10 minutes at 4°C. The supernatant contains
polyphenols without tannins. Polyphenols in this supernatant were measured as per
methods section 2.4.1 except 0.12-0.15 mL of this supernatant was used. The tannin
level is the loss in polyphenol levels after PVPP treatment. This is calculated by
subtracting the polyphenol levels obtained in methods section 2.4.1 from those
measured here (2.4.3).
Chapter 2 − Materials and methods 43
2.4.4 BSA-protein precipitation assay for tannins
The following ingredients were added to 1.8-mL-capacity-Eppendorf centrifuge tubes:
0.5 mL of BSA (BDH) (1mg mL-1 in 0.2 M acetate buffer, pH 4.8) and increasing
volumes of polyphenol extract from methods section 2.3.2 (0-0.25 mL) that were
adjusted to a total volume of 0.25 mL with 50% (v/v) methanol. Samples were vortexed
and stood overnight at 4°C, then centrifuged at 12,000g for 15 minutes, at 4°C. The
supernatant was discarded and the remaining BSA-tannin pellet gently washed with 0.2
M acetate buffer (pH 4.8). Pellets were dissolved in 0.25 mL of 1% (w/v) SDS and 0.75
mL of 1% (w/v) SDS (BDH)-7% (v/v) TEA (BDH) solution with vortexing. After 0.25
mL of FeCl3 reagent (0.01 M FeCl3 in 0.1 M HCl) was added, samples were stood at
room temperature for 30 minutes and then absorbance read at 510 nm.
3 LEAD ACCUMULATION STUDIES (I)
3.1 Lead effects
Approximately 2-month-old plants (from methods section 1.2) were gently washed in
tap water once to remove sand and then three times in dH2O over a 10-minute period.
Using a hydroponic system, plants were treated with four concentrations of Pb(NO3)2
salt solution (0, 100, 250, and 500 µM Pb(NO3)2 ), with dH2O as a control. Three
replicates were used for each level of Pb(NO3)2, and placed randomly on a table under
growth room conditions (16 hour photoperiod at 26.5 µmol m-2 s-1, 22°C). Effects of the
Pb treatments were observed over three weeks and solutions were changed every three
days because no aeration unit was available at this stage.
3.2 Lead accumulation – hydroponic experiments
3.2.1 Lead treatment in hydroponic nutrient solution
For each replicate, approximately three uniform 10-month-old S. officinale L. plants,
propagated from root cuttings, were washed to remove the growth medium. Plants were
placed in a modified version of Huang and Cunningham (HC) low phosphate
hydroponic nutrient solution (Appendix A1) for seven days, to adjust roots to the acidic
(pH 4.5) solution. In this thesis, this solution is referred to as the modified HC nutrient
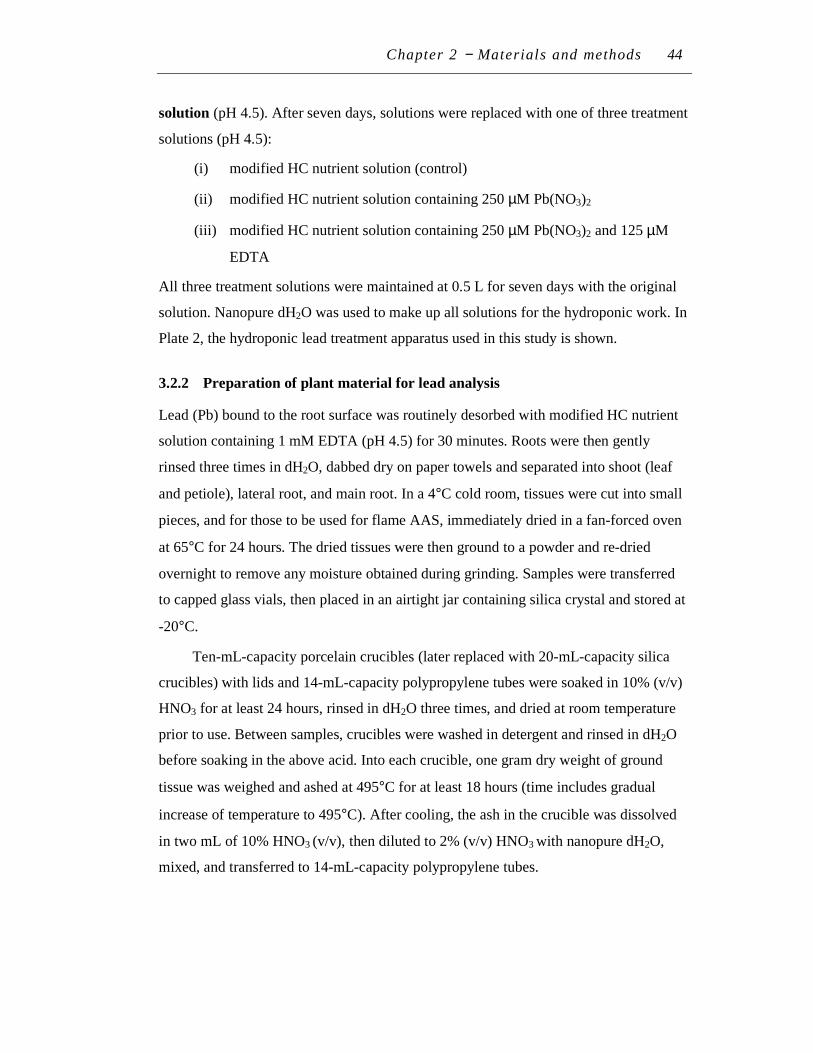
Chapter 2 − Materials and methods 44
solution (pH 4.5). After seven days, solutions were replaced with one of three treatment
solutions (pH 4.5):
(i) modified HC nutrient solution (control)
(ii) modified HC nutrient solution containing 250 µM Pb(NO3)2
(iii) modified HC nutrient solution containing 250 µM Pb(NO3)2 and 125 µM
EDTA
All three treatment solutions were maintained at 0.5 L for seven days with the original
solution. Nanopure dH2O was used to make up all solutions for the hydroponic work. In
Plate 2, the hydroponic lead treatment apparatus used in this study is shown.
3.2.2 Preparation of plant material for lead analysis
Lead (Pb) bound to the root surface was routinely desorbed with modified HC nutrient
solution containing 1 mM EDTA (pH 4.5) for 30 minutes. Roots were then gently
rinsed three times in dH2O, dabbed dry on paper towels and separated into shoot (leaf
and petiole), lateral root, and main root. In a 4°C cold room, tissues were cut into small
pieces, and for those to be used for flame AAS, immediately dried in a fan-forced oven
at 65°C for 24 hours. The dried tissues were then ground to a powder and re-dried
overnight to remove any moisture obtained during grinding. Samples were transferred
to capped glass vials, then placed in an airtight jar containing silica crystal and stored at
-20°C.
Ten-mL-capacity porcelain crucibles (later replaced with 20-mL-capacity silica
crucibles) with lids and 14-mL-capacity polypropylene tubes were soaked in 10% (v/v)
HNO3 for at least 24 hours, rinsed in dH2O three times, and dried at room temperature
prior to use. Between samples, crucibles were washed in detergent and rinsed in dH2O
before soaking in the above acid. Into each crucible, one gram dry weight of ground
tissue was weighed and ashed at 495°C for at least 18 hours (time includes gradual
increase of temperature to 495°C). After cooling, the ash in the crucible was dissolved
in two mL of 10% HNO3 (v/v), then diluted to 2% (v/v) HNO3 with nanopure dH2O,
mixed, and transferred to 14-mL-capacity polypropylene tubes.
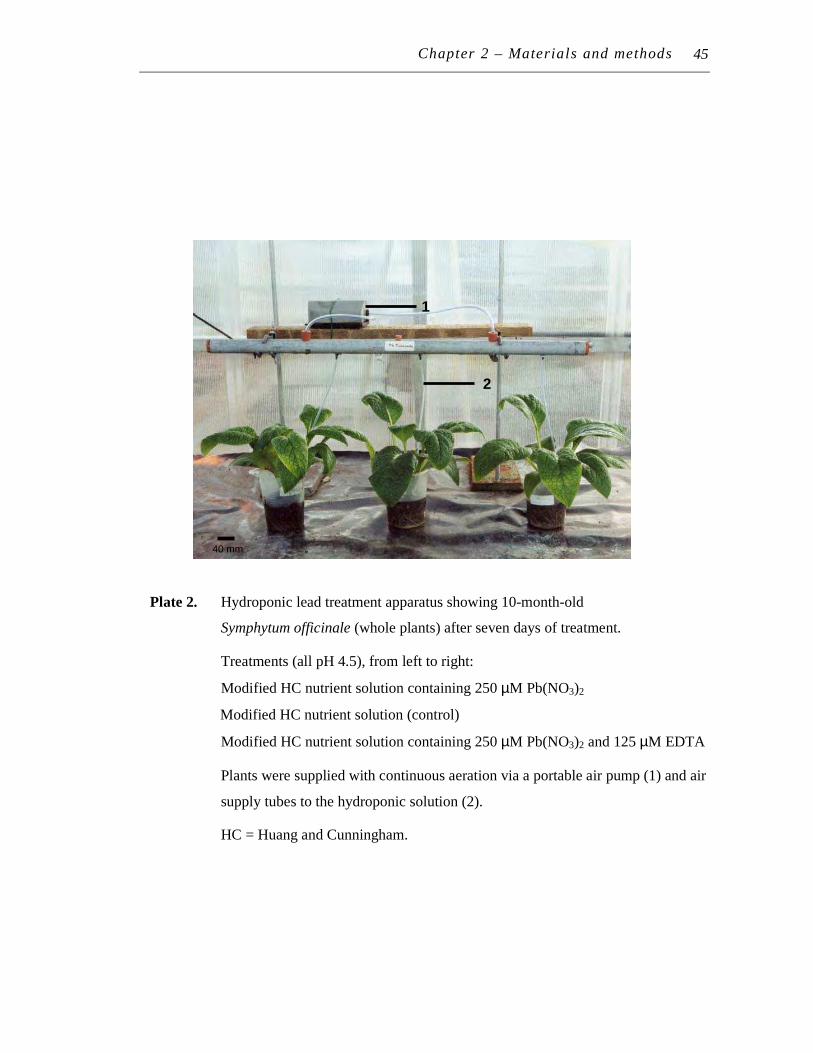
Chapter 2 – Materials and methods 45
Plate 2. Hydroponic lead treatment apparatus showing 10-month-old
Symphytum officinale (whole plants) after seven days of treatment.
Treatments (all pH 4.5), from left to right:
Modified HC nutrient solution containing 250 µM Pb(NO3)2
Modified HC nutrient solution (control)
Modified HC nutrient solution containing 250 µM Pb(NO3)2 and 125 µM EDTA
Plants were supplied with continuous aeration via a portable air pump (1) and air
supply tubes to the hydroponic solution (2).
HC = Huang and Cunningham.
1
2
40 mm
45
Chapter 2 − Materials and methods 46
3.2.3 Measurement of lead level in samples
All flame-atomic-absorption spectroscopy (flame AAS) analysis was conducted using a
GBC Avanta Σ flame-atomic-absorption spectrometer with SDS-270 cletic auto-
sampler. The instrument was calibrated with 0, 5, 10, 15 and 20 mg L-1 Pb, made from
1000 mg L-1 Pb (element) standard solution (nitrate-based analytical grade BDH) and
diluted with 1% (v/v) HNO3. The instrument was zeroed with 1% (v/v) HNO3, and
readings taken at 217 nm using a superlamp, with instrument settings set to a slit width
of 1 nm, lamp current of 5 mA and, after optimisation with 15 or 20 mg L-1 Pb, set to:
gas flow rate 2, burner angle 0, working height 13 mm, working center -0.2 mm. For all
tissue samples three replicate absorbance values were measured. The mean Pb
concentration (in mg L-1) was calculated automatically using the GBC Avanta version
1.33 computer program. When necessary, samples were diluted with 1% (v/v) HNO3 to
obtain readings within the calibration curve. Lead levels in tissue were calculated on the
mg kg-1 dry weight (d.w.) basis.
4 TRANSMISSION ELECTRON MICROSCOPY
All the TEM methods outlined below followed the methods from Jarvis (2001) and
Ruzin (1999).
4.1 Preparation of ultra-thin sections
4.1.1 Fixation
Young lateral root and main root tissue sections of Pb-exposed and non-Pb exposed
plants (methods section 3.2.1) were selected for observations. Tissue located about two
mm above the root tip were cut into sections no thicker than one mm, and fixed for
three hours in freshly made 3% (v/v) glutaldehyde in 0.075 M sodium phosphate buffer
(pH 7.2) (under partial vacuum, at room temperature). The samples, in the same
fixative, were then stored overnight at 4°C.
Chapter 2 − Materials and methods 47
4.1.2 Post-fixation
After the fixative was removed, samples were washed in 0.075 M sodium phosphate
buffer (pH 7.2) three times over a 30 minute period, then post-fixed in 1% (w/v)
osmium textroxide in 0.075 M phosphate buffer (pH 7.2) for three hours.
4.1.3 Dehydration
The samples were dehydrated in a series of acetone from 20, 40, 60 to 80% (v/v) for 10
minutes at each acetone concentration, followed by 100% acetone, three times, for 15
minutes each.
4.1.4 Infiltration
In step one of the infiltration, one part of Spurrs resin to two parts of 100% acetone was
added to samples in vials, then placed on a slowly rotating wheel overnight.
In the second infiltration step, the resin was replaced with three parts of Spurs resin to
one part of 100% acetone and placed on a rotating wheel for at least three hours.
4.1.5 Embedding
Samples were transferred to shallow plastic caps (in a Petri dish) containing 100%
Spurrs resin, covered in a glass perti dish, and heated in a fan forced oven set at 60°C
overnight.
4.1.6 Sectioning
Specimens cut from resin blocks were glued to ‘stubs’ (empty pill capsules filled with
hardened epoxy resin). These were set for one hour in a 60°C fan force oven. The stubs
were then trimmed to remove excess resin and to obtain desired sections of the tissue.
Once trimmed, the sections were mounted in an ultramicrotome (LKB 212B Ultratome)
and approximately 90-100 nm ultra thin sections were cut and placed on copper TEM
grids.
4.2 Microscopy
Ultra thin sections were viewed in a transmission electron microscope (Joel-1200 EX)
at an accelerating voltage of 80 kV. Micrographs of cellular sites of interest were taken
on Kodak Ester microscopy sheet film (8.3 x 10.2 cm).
Chapter 2 − Materials and methods 48
5 IN VITRO LEAD CHELATION TO POLYPHENOLS
In this section, polyphenol extracts from lateral and main roots were used to determine
if they could chelate Pb ions and to confirm the in vivo hydroponic trends.
5.1 Established protocol: Lavid’s dialysis method
Following the method outlined in Lavid et al., (2001b), approximately five grams fresh
weight of lateral or main roots (from three 10-month-old plants, grown as per methods
section 1.2 above) were ground to a powder with liquid nitrogen, then extracted for two
hours with 50 mL of 50% (v/v) methanol (bubbled with N2) at 4°C. Homogenates were
centrifuged at 11,000g for 15 minutes at 4°C and the polyphenol supernatant used for
Pb chelation studies. Excess polyphenol supernatant was assayed for polyphenols using
the BSA-protein precipatation method. Dialysis tubes containing five mL of polyphenol
extract were placed in 100 mL of 250 µM Pb(NO3)2 solution (pH 5.3) for 48 hours with
gentle shaking at 4°C . The entire content of the tube at t = 0 hours and t = 48 hours was
collected, dried at room temperature, then dry ashed at 500ºC for 18 hours and used for
Pb analysis as described above.
To make a better comparison with between the Lavid dialysis method and the new
Pb chelation protocol outlined below, the Lavid dialysis method was repeated with
some modifications – plant material and polyphenols were used and analysed as per
5.2.1 to 5.2.2 and 50 mL of 250 mg L-1 Pb(NO3)2 was used. Since fructans were
suspected to interfere with this method, additional dialysis tubes containing five mL of
0, 0.15, 0.3% (w/v) purified fructan (chicory inulin) were also tested for Pb chelation.
This was equivalent to approximately 0, 15, 30% (w/w) fructans − the level of fructans
in comfrey root tissue if (although unlikely) completely extracted into the polyphenol
extract. After 48 hours, the entire volume of each tube was measured, and two mL of
this was digested with 30% (v/v) HNO3 in a 60°C water bath overnight (18 hours). This
is the modified protocol of the Lavid dialysis method.
5.2 Developing a new method: PVPP-immobilised tannin method
The general PVPP-immobilsed tannin method is illustrated in Figure 3 and detailed in
the sections below.
Chapter 2 − Materials and methods 49
5.2.1 Plant material
Three-month-old S. officinale plants were grown from root cuttings in North-end sand
supplemented with NutricoteTM 8-9-month slow-release fertiliser (as per methods
section 1.2). All plants were grown under growth room conditions (16 hour photoperiod
at 26.5 µmol m-2 s-1, 22°C).
5.2.2 Polyphenol extraction and assay
Ball-mill ground freeze-dried root powder from 3-month-old S. officinale (methods
section 5.2.1) was used for all polyphenol extractions. Polyphenols were extracted at a
ratio of 0.2 g of tissue to 15 mL of 50% (v/v) methanol with an ultrasonic water bath for
30 minutes. Samples were centrifuged at 10,000g for 30 minutes at 4°C and
supernatants were used for polyphenol assays. Polyphenol and tannins were quantified
using the Folin-Ciocalteu assay (methods section 2.4.1 and 2.4.3).
5.2.3 Preparation of immobilised root tannins
Insoluble polyvinyl polypyrrolidone (PVPP) was used to bind and immobilise tannins
from extracts. For each of the three replicates, the following ingredients were added in
the following order:
(i) For each Pb treatment level (50, 250, and 500 mg L-1 Pb(NO3)2), 0.1 g of
insoluble PVPP was weighed into five 14-mL-capacity PEG tubes.
(ii) Polyphenol extracts or methanol was added to the tubes. Tube 1 contained
five mL of 50% (v/v) methanol, tubes 2 and 3 contained five mL of lateral
root polyphenol extract, and tubes 4-5 contained five mL of main root
polyphenol extract.
(iii) All five tubes were then shaken horizontally for 20 minutes and then
centrifuged at 10,000g at 10°C for 15 minutes. This cool temperature was
selected to keep any fructans soluble in the polyphenol extract; 4°C may
result in fructan precipitation (Megazyme, 2004; Massardo et al., 2002) and
contamination of PVPP-tannin pellet after centrifugation. The liquid
polyphenol extract was removed for the tannin assay and the remaining
tannin bound-PVPP (PVPP-immobilised root tannin) pellet rinsed two times
with nanopure dH2O.
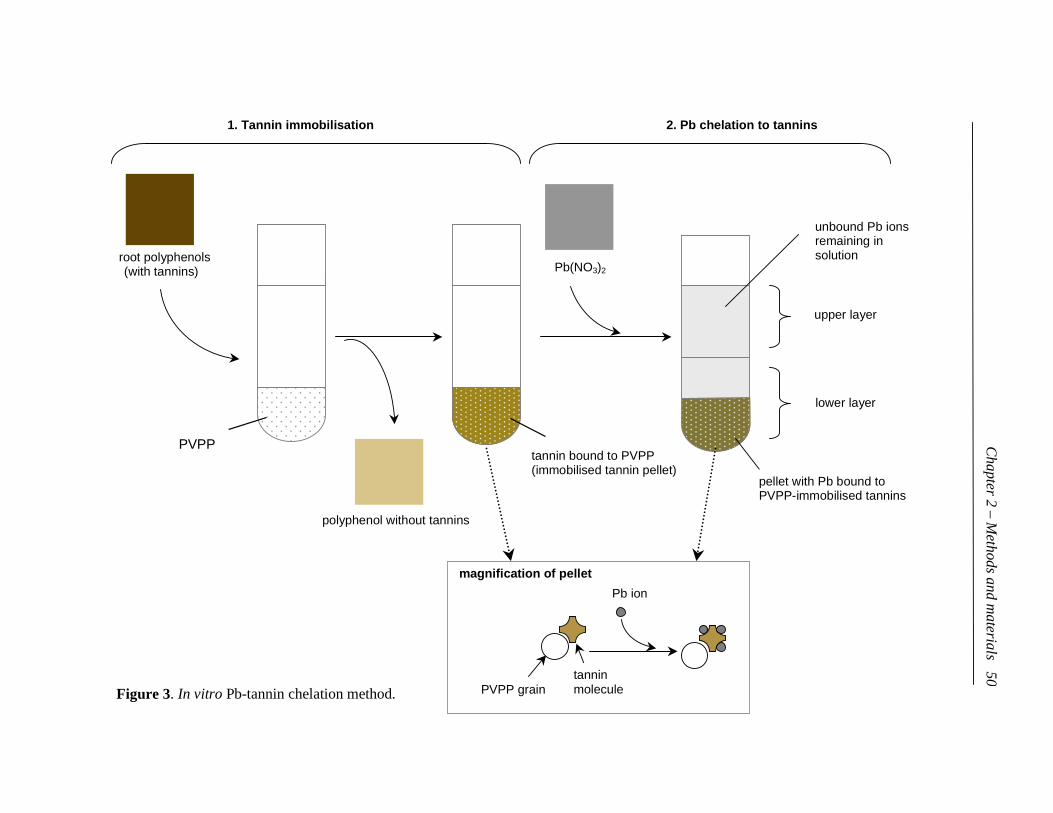
unbound Pb ions remaining in solution root polyphenols
(with tannins)
Pb(NO3)2
Pb ion
magnification of pellet
1. Tannin immobilisation
Figure 3. In vitro Pb-tannin chelation method.
PVPP
polyphenol without tannins
tannin bound to PVPP (immobilised tannin pellet)
pellet with Pb bound to PVPP-immobilised tannins
upper layer
lower layer
PVPP grain tannin molecule
2. Pb chelation to tannins
Chapte
r 2 –
Meth
ods a
nd m
ate
rials 5
0
Chapter 2 − Materials and methods 51
5.2.4 Lead chelation to immobilised root tannins
Tube 1 (control 1): PVPP (50% (v/v) methanol) + Pb(NO3)2
Tube 2 (control 2): PVPP-immobilised lateral root tannins + HNO3
Tube 3 (sample 1): PVPP-immobilised lateral root tannins + Pb(NO3)2
Tube 4 (control 3): PVPP-immobilised main root tannins + HNO3
Tube 5 (sample 2): PVPP immobilised main root tannins + Pb(NO3)2
Tubes 1, 3 and 5 contained five mL of 50 mg L-1 Pb(NO3)2 solution (pH 4.5); tubes 2, 4
contained 2% (v/v) HNO3. All five tubes were shaken for four hours at room
temperature under low light conditions, and then centrifuged for 15 minutes at 10,000g
at 10°C. To determine if Pb was removed by the immobilised tannins, each five mL
solution was quantitatively divided into two halves (about 2.5 mL each): the upper layer
(UL, Pb solution only) and the lower layer (LL, Pb solution + PVPP pellet). Total Pb
recovery from wet acid digestion was determined by comparing the Pb level in the
upper layer of tube 1 with level of Pb in the prepared Pb solutions (i.e. prior to the
addition to tubes). Each tube (containing the UL or LL) was digested with 30% (v/v)
HNO3 in a 60°C water bath overnight (18 hours). The experiment was repeated for 250
and 500 mg L-1 Pb(NO3)2 levels. The concentration of Pb was determined using a
flame-atomic-absorption spectrometer (model GBC Avanta Σ) with analytical grade
Pb(NO3)2 (BDH) as the standard.
Note that the Pb treatment level in the methods and results section refers to X mg
L-1 lead nitrate (Pb(NO3)2) for Pb solution preparation purposes. In the results section,
the actual mean elemental Pb values (X mg L-1) of these solutions are also indicated
because this was the form and level of Pb measured in the upper and lower layers of the
control (tube 1) by AAS.
5.3 Lead chelation to immobilised lateral root tannins
In this section, S. officinale polyphenols from only lateral roots were used in Pb
chelation studies. This was to confirm that the Pb chelation trends observed in results
section 6 were due to differences in polyphenol concentrations, as opposed to root-
associated factors (e.g. root type or age). Purified tannic acid (Sigma) and purified
fructan (chicory inulin) were also used to validate the design and need for a new in vitro
Pb-tannin chelation protocol.
Chapter 2 − Materials and methods 52
The same protocol was applied as methods section 5.2, but in a micro-scale
version and with the following modifications: (i) extraction of polyphenols was at a
ratio of 0.05 g root powder to five mL of 50% (v/v) methanol, (ii) tannins were
immobilised using 0.02 g PVPP with one mL of polyphenol extract at increasing
concentrations (0, 12.5, 25, 50, and 100% (v/v) of initial extract), (iii) one mL of 50 mg
L-1 Pb(NO3)2 (pH 4.5) was added to immobilised tannins and Pb chelation period
reduced to two hours at room temperature, (iv) the level of Pb removed from solution
was directly determined by AAS after diluting 0.5 mL of the top layer solution with two
mL of 1% (v/v) HNO3. No wet acid digestion was necessary to determine Pb levels in
this solution as 100% of initial Pb solution was recovered without digestion (data not
shown).
5.4 Lead chelation to immobilised purified tannic acid
The experiment was repeated exactly as methods section 5.3 except purified tannin and
fructan (from Sigma and not S. officinale) were used. Tannin concentrations ranged
from 0-0.4 mg mL-1 to 0-10 mg mL-1. Tannins were also spiked with 0-9 mg mL-1
purified fructan (chicory inulin) – to reflect the level of fructans (expressed as the
tannin:inulin ratio) expected in the polyphenol extracts.
Objective 2
Phytoremediation potential of Symphytum officinale:
Hydroponic studies with sand-grown S. officinale
Unless indicated, all plants used in this section were 3-4 month-old plants grown under
growth room conditions (16 hour photoperiod at 26.5 µmol m-2 s-1, 22°C) in sand-based
growth media (methods section 5.2.1) to avoid whitefly problems in greenhouses.
6 LEAD ACCUMULATION STUDIES (II)
In some plants a threshold concentration of Pb(NO3)2 or chelating agent (e.g. EDTA) is
required before Pb can be adsorbed by the roots and/or translocated to the shoots. Thus,
in order to determine the phytoremediation potential of S. officinale, the effect of EDTA
and Pb(NO3)2 concentrations were investigated.
Chapter 2 − Materials and methods 53
6.1 Effect of EDTA level on lead accumulation
Roots of plants were washed to remove sand and held overnight in aerated tap water.
Plants were then transferred to modified HC nutrient solution (pH 4.5) for one week and
then replaced with 300 mL of one of four treatment solutions (pH 4.5):
(i) modified HC nutrient solution (control)
(ii) modified HC nutrient solution containing 250 µM Pb(NO3)2 and 250 µM
EDTA (1:1 molar ratio of Pb to EDTA)
(iii) modified HC nutrient solution containing 250 µM Pb(NO3)2 and 500 µM
EDTA (1:2 molar ratio of Pb to EDTA)
(iv) modified HC nutrient solution containing 250 µM Pb(NO3)2 and 750 µM
EDTA (1:3 molar ratio of Pb to EDTA)
All solutions were aerated and topped up with the original solution daily. After seven
days in treatment solution, plants were harvested and roots desorbed for 30 minutes in
300 mL of modified HC nutrient solution containing 1 mM EDTA (pH 4.5), then rinsed
with nanopure dH2O. Plants were divided into roots and shoots, frozen in liquid
nitrogen and freeze-dried. All samples were ground to a fine powder with a ball mill
(Retscher MM300) and Pb levels measured as per methods section, 3.2.2 and 3.2.3.
6.2 Effect of 500 µµµµM Pb(NO3)2 level on lead accumulation
The effect of Pb concentration on the level of Pb accumulation in tissues were
conducted as per methods section 6.1 except the treatment solutions (all pH 4.5) were:
(ii) modified HC nutrient solution (control)
(iii) modified HC nutrient solution containing 500 µM Pb(NO3)2
(iv) modified HC nutrient solution containing 500 µM Pb(NO3)2 and 500 µM
EDTA (1:1 molar ratio of Pb to EDTA)
7 LEAD UPTAKE STUDIES (III): EDTA STUDIES
Surprisingly, increased EDTA concentrations decreased Pb accumulation levels in roots
(that could not be accounted for by translocation) of S. officinale (see results section 7
and 8). The following experiments were performed to further investigate this finding.
Chapter 2 − Materials and methods 54
7.1 EDTA pre-treatment studies
7.1.1 Root segment test
For each replicate, 3-4 month-old lateral roots were divided into six 1.2 g f.w. portions
and each portion placed in mesh-like ‘tea bags’. Three ‘tea bags’ were pre-treated with
modified HC nutrient solutions (pH 4.5) containing 500 µM EDTA and three without
500 µM EDTA. After 18 hours, the root containing ‘tea bags’ were rinsed in dH2O and
one ‘tea bag’ from each half transferred to one of three solutions (all pH 4.5): (i)
modified HC nutrient solution, (ii) modified HC nutrient solution with 500 µM
Pb(NO3)2 or, (iii) modified HC nutrient solution with 500 µM Pb(NO3)2 and 500 µM
EDTA. After 24 hours, roots were harvested and washed in dH2O. One portion of the
roots (0.2 g f.w.) was removed and freeze dried for total polyphenol analysis whilst the
remaining one gram was used for Pb analysis as per methods section 3.2.2 and 3.2.3. Pb
levels in Pb treatments were corrected against controls. In total, the experiment took
three days (18 hours for pre-treatment and 24 hours for treatment). A concurrent seven
day test (72 hours for pre-treatment and 96 hours for treatment) was also performed,
except only Pb data was collected as roots segments were entirely browned after day
seven. All solutions were aerated.
7.1.2 Whole plant test
For each replicate, six sand-grown plants were used. The first set of three plants were
treated with modified HC nutrient solution (pH 4.5) for three days whilst the remaining
set of three plants were treated with modified HC nutrient solution plus 500 µM EDTA
(pH 4.5). On day four, one plant from each set was then treated for four days in one of
three new solutions: (i) fresh modified HC nutrient solution (pH 4.5), (ii) modified HC
nutrient solution containing 500 µM Pb(NO3)2, and (iii) modified HC nutrient solution
containing 500 µM Pb(NO3)2 and 500 µM EDTA. All solutions were constantly aerated
and topped up to 200 mL with the matching solution every second day. Plants were
harvested after four days. Roots (lateral and main roots combined) were washed three
times with dH2O, separated into shoot and roots, frozen in liquid nitrogen and freeze-
dried. Polyphenol and Pb levels were measured as outlined in methods section 2.4.2,
3.2.2 and 3.2.3 respectively. Fe levels were similarly measured with analytical grade
Fe(NO3)2 (BDH) as the standard.
Chapter 2 − Materials and methods 55
7.2 Lead accumulation: alternative chelators (ADA)
The same hydroponic method outlined in methods section 6.2 was conducted, but with
the following treatment solutions set at pH 7.0 (the optimal working pH for ADA):
(i) modified HC nutrient solution (control)
(ii) modified HC nutrient solution containing 500 µM Pb(NO3)2 and 500 µM
EDTA (1:1 molar ratio of Pb to EDTA)
(iii) modified HC nutrient solution containing 500 µM Pb(NO3)2 and 500 µM
ADA (1:1 molar ratio of Pb to ADA)
Except for the root Pb desorption step with EDTA, Pb levels were measured as per
methods section 3.2.2 and 3.2.3 respectively. Fe levels were also measured. Instead,
roots were carefully washed three times in nanopure dH2O to avoid mixing the two
different chelating agents in treatments.
Objective 3 Pb mutant plant studies:
Symphytum officinale tissue culture
8 DEVELOPING SYMPHYTUM OFFICINALE IN TISSUE CULTURE
8.1 Explant selection
Symphytum officinale root division clumps with only one central crown were washed to
remove soil and pruned to ten cm in length. Roots were planted in two litres pots
containing North-end sand supplemented with about ten grams (two teaspoons) of 8-9
month NutricoteTM fertiliser. Plants were also propagated via singular root cuttings
(methods section 1.2). All plants were grown under growth room conditions as
described previously.
Petioles of 2-month-old S. officinale plants grown from root divisions (a clump of
roots attached to a shoot crown) and cuttings (just a root section, see Plate 1) were
collected as explants for tissue culture. The petioles selected were attached to open leaf
blades of between 15 and 20 cm long.
Chapter 2 − Materials and methods 56
8.2 Sterilisation regime
Following a combination of methods (Huizing, 1983; Hall, 1999, Gamborg and Phillips,
1995), two sets of tissue culture sterilisation regimes were tested:
Set I: 10, 20 and 100% (v/v) commercial bleach for 10 and 20 minutes
Set II: 5, 10 and 20% (v/v) commercial bleach for 10 and 20 minutes
For each sterilisation treatment, six petiole segments (two cm long) were rinsed in tap
water for 15 minutes and then sterilised with one of the treatments regimes above (in a
laminar air flow cabinet). Each treatment regime contained Tween 20 at a rate of two
drops per 100 mL of bleach. Explants were rinsed three times with sterile distilled
water, before two mm was cut off the petiole section ends and placed on MS B media
(methods section 8.3.1). The petiole sterilisation regime for subsequent experiments
involved the initial water-rinsing step and 10% (v/v) bleach with Tween 20 (as above)
for 10 minutes.
8.3 Media development
General tissue culture media preparation instructions followed that of Sutter (1996) and
Gamborg and Phillips (1995).
8.3.1 Callus induction media (CIM)
Petiole tissue from 2-month-old root cutting and division plants were sterilised using the
protocol established above. Callus and shoot induction response from these petiole
sections on six types of media were investigated to determine the best media for plant
propagation in vitro. All media were based around the Murashige and Skoog medium
(MS, Murashige and Skoog, 1962) supplemented with plant growth regulators (BA or
IBA) (Appendix A2).
In these cultures, the petioles of plants grown from root divisions (older explant)
and root cuttings (younger explant) were not cut longitudinally for several reasons: (i) to
determine the necessity of this step, (ii) to compare the response to longitudinally cut
sections, and (iii) to avoid browning of thinner petioles harvested from plants
developed from root cuttings.
(i) MS A: MS basal nutrients (pH 5.8)
(ii) MS B: MS basal nutrients + 2% (w/v) sucrose
Chapter 2 − Materials and methods 57
(iii) MS C: MS B + BA (1 mg L-1)
(iv) MS D: MS B + BA (1 mg L-1) + IBA (0.01 mg L-1)
(v) MS E: MS B + BA (1 mg L-1) + IBA (0.1 mg L-1)
(vi) MS F(0): MS B + BA (1 mg L-1) + IBA (1 mg L-1)
In vitro generated shoots and callus formed on MS F(0) media (using petioles from 2-
month-old root cutting plants) were used for subsequent root, shoot, and callus growth
media (RIM, SIM, CGM) trials. MS F(0) liquid and agar media was also tested.
8.3.2 Callus growth media (CGM)
Six types of CGM were tested, all based around the Murashige and Skoog media
(1962):
(i) MS F(0): MS B + BA (1 mg L-1) + IBA (1 mg L-1)
(ii) MS F(1): MS B + BA (2.5 mg L-1) + IBA (2.5 mg L-1)
(iii) MS F(2): MS B + BA (3.5 mg L-1) + IBA (3.5 mg L-1)
(iv) MS F(3): MS B + BA (5.5 mg L-1) + IBA (5.5 mg L-1)
(v) MS G: MS B + kinetin (0.3 mg L-1) + NAA (4 mg L-1)
(vi) MS J: MS B + BA (2 mg L-1) + 2,4 D (0.5 mg L-1)
8.3.3 Root and whole plant induction media (RIM, WPIM)
Four types of RIM were tested using in vitro shoot tissue (shoot blade with petiole).
When crown tissues were of a sufficient quantity, six types of WPIM were tested using
in vitro crown tissue. All in vitro tissues used in this section emerged from petiole
explants on MS F(0). All media were based around the Murashige and Skoog (MS)
media (1962). The best medium was determined by the speed and formation of roots
and shoots from the shoot or crown tissue.
RIM media were:
(i) MS A: MS basal nutrients (pH 4.5)
(ii) MS B: MS basal nutrients + 2% (w/v) sucrose
(iii) MS H: MS A + IBA (1 mg L-1)
(iv) MS L: MS B + IBA (1 mg L-1)
Chapter 2 − Materials and methods 58
WPIM media were:
(i) MS L: MS B + IBA (1 mg L-1)
(ii) MS M: MS B + IBA (0.1 mg L-1)
(iii) MS N(0): MS B + IBA (1 mg L-1) + BA (0.1 mg L-1)
(iv) MS N(1): MS B + IBA (1 mg L-1) + BA (0.2 mg L-1)
(v) MS N(2): MS B + IBA (1 mg L-1) + BA (0.4 mg L-1)
(vi) MS E: MS B + IBA (0.1 mg L-1) + BA (1 mg L-1)
8.3.4 Propagation of Symphytum officinale plant lines
The MS N(0) media formed excellent root and shoot tissue, thus it was also an excellent
whole plant propagation media. Thus, every 4-5 weeks, whole plants were cut back to
leave just the crown; the shoots were cut back to leave one cm of petiole attached to the
crown, all roots and dead tissue surrounding the crown were removed. Depending on
the size of the crown, most crown tissue were divided longitudinally in half and placed
three mm into the MS N(0) media. MS N(0) liquid was also tested.
9 IN VITRO LEAD-TREATED PLANTS
A variety of Pb treatments were performed on whole plants and shoot cuttings (shoot
blade with petiole) before the ‘Pb pre-treated’ petioles were harvested for shoot and
whole plant generation (Figure 4). The chelating agent (EDTA and ADA) used were at
the same concentration as Pb(NO3)2, and therefore are abbreviated as X µM PbEDTA
and PbADA. Each treatment was performed successively and according to the previous
treatment results. Table 2 below outlines all the treatments.
9.1 Whole plants pre-treated with lead
Petioles from whole plants pre-treated with PbEDTA and PbADA (c.f. just shoots in
subsequent experiments) were initially chosen for shoot generation to mimic ‘normal’
plant uptake of Pb. All pre-treatments were performed under sterile conditions.
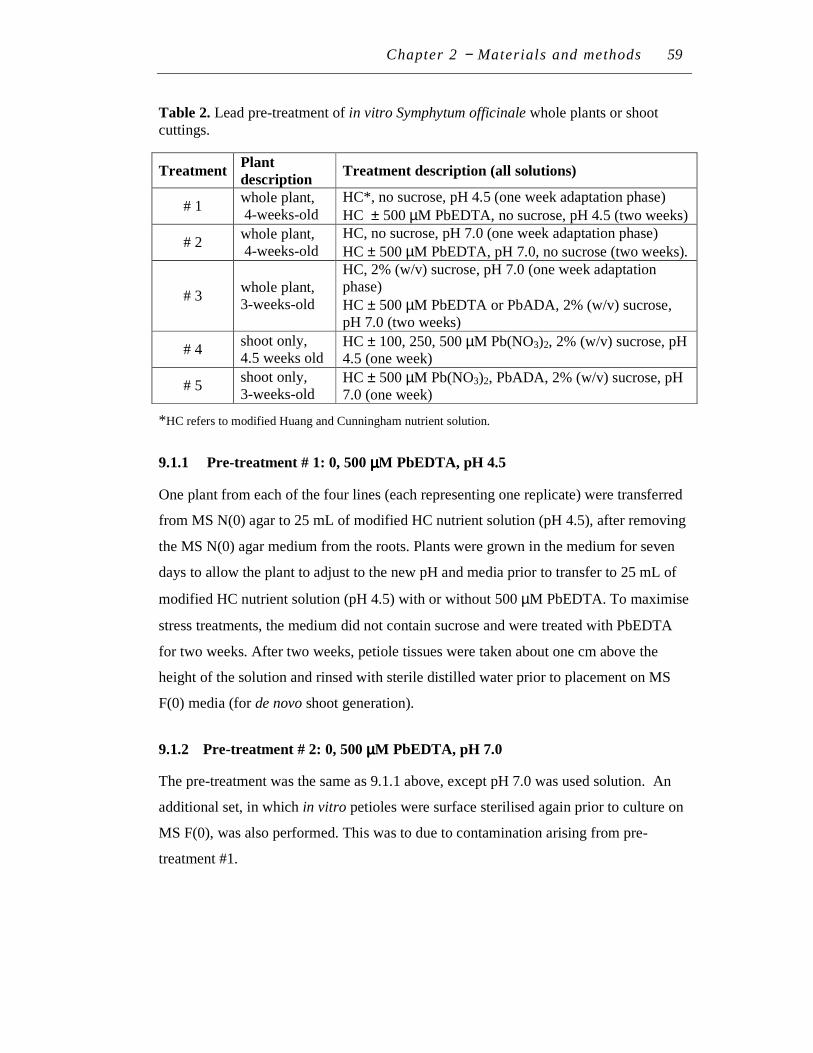
Chapter 2 − Materials and methods 59
Table 2. Lead pre-treatment of in vitro Symphytum officinale whole plants or shoot cuttings.
*HC refers to modified Huang and Cunningham nutrient solution.
9.1.1 Pre-treatment # 1: 0, 500 µµµµM PbEDTA, pH 4.5
One plant from each of the four lines (each representing one replicate) were transferred
from MS N(0) agar to 25 mL of modified HC nutrient solution (pH 4.5), after removing
the MS N(0) agar medium from the roots. Plants were grown in the medium for seven
days to allow the plant to adjust to the new pH and media prior to transfer to 25 mL of
modified HC nutrient solution (pH 4.5) with or without 500 µM PbEDTA. To maximise
stress treatments, the medium did not contain sucrose and were treated with PbEDTA
for two weeks. After two weeks, petiole tissues were taken about one cm above the
height of the solution and rinsed with sterile distilled water prior to placement on MS
F(0) media (for de novo shoot generation).
9.1.2 Pre-treatment # 2: 0, 500 µµµµM PbEDTA, pH 7.0
The pre-treatment was the same as 9.1.1 above, except pH 7.0 was used solution. An
additional set, in which in vitro petioles were surface sterilised again prior to culture on
MS F(0), was also performed. This was to due to contamination arising from pre-
treatment #1.
Treatment Plant
description Treatment description (all solutions)
# 1 whole plant, 4-weeks-old
HC*, no sucrose, pH 4.5 (one week adaptation phase)
HC ± 500 µM PbEDTA, no sucrose, pH 4.5 (two weeks)
# 2 whole plant, 4-weeks-old
HC, no sucrose, pH 7.0 (one week adaptation phase)
HC ± 500 µM PbEDTA, pH 7.0, no sucrose (two weeks).
# 3 whole plant, 3-weeks-old
HC, 2% (w/v) sucrose, pH 7.0 (one week adaptation phase)
HC ± 500 µM PbEDTA or PbADA, 2% (w/v) sucrose, pH 7.0 (two weeks)
# 4 shoot only, 4.5 weeks old
HC ± 100, 250, 500 µM Pb(NO3)2, 2% (w/v) sucrose, pH 4.5 (one week)
# 5 shoot only, 3-weeks-old
HC ± 500 µM Pb(NO3)2, PbADA, 2% (w/v) sucrose, pH 7.0 (one week)

Chapter 2 − Materials and methods 60
9.1.3 Pre-treatment # 3: 0, 500 µµµµM PbEDTA and PbADA, pH 7.0
Similar to pre-treatment # 1, whole plants were pre-treated in modified HC nutrient
solution with or without PbEDTA and PbADA (1:1 molar ratio), but with pH 7.0
solution and 2% (w/v) sucrose. The in vitro petioles were not re-sterilised.
9.2 Shoots from sand-grown plants pre-treated with lead
The in vitro petioles from tissue-cultured plants exposed to Pb failed to produce
adequate de novo shoot tissue (see results section). Since one possibility was a loss in
shoot regeneration ability, Pb-pre-treated petioles from 2-week-old sand-grown shoot
cuttings were attempted as an alternative approach to developing Pb mutants. Shoots
were treated with 35 mL of modified HC nutrient solution (pH 7.0) with or without 500
µM PbADA. Solutions were constantly aerated for seven days. The leaf blade and the
water-rinsed shoot base (i.e. petiole) were discarded. The remaining petioles were
sterilised as per methods section 8.2, cut into one cm sections and placed on MS F(0)
media with or without 0.05% (v/v) PPM (Plant Preservative Mixture, Bio-Strategy
Distribution Ltd, Auckland, NZ). The addition of PPM, an anti-microbial agent, was
tested as the petioles could be difficult to sterilise after exposure to PbADA in a non-
sterile environment.
9.3 Petioles from in vitro shoots pre-treated with lead
9.3.1 Pre-treatment # 4: 0 to 500 µµµµM Pb(NO3)2, pH 4.5
In vitro shoots (4.5-week-old) were pre-treated with modified HC nutrient solution (pH
4.5) containing 0, 100, 250 or 500 µM Pb(NO3)2 and 2% (w/v) sucrose. Shoots were
dried overnight at 70ºC, ashed, and Pb levels analysed as per methods section: 3.2.2 and
3.2.3.
9.3.2 Pre-treatment # 5: 0, 500 µµµµM Pb(NO3)2 and PbADA, pH 4.5
Approximately uniform in vitro shoots (shoot blade with petiole) were excised from 3-
week-old whole plants grown on MS N(0) media. Shoots were cut to approximately the
same petiole length and placed in a 30 mL culture vial containing three mL of one of the
following treatment solutions:
Modified HC nutrient solution (pH 4.5) with 2% (w/v) sucrose plus:
Chapter 2 − Materials and methods 61
(i) netiher Pb(NO3)2 nor ADA (control)
(ii) 500 µM Pb(NO3)2
(iii) 500 µM Pb(NO3)2 with 500 µM ADA
(iv) 500 µM Pb(NO3)2 with 1000 µM ADA
After seven days, shoots were harvested and the base of the petiole (about one cm
immersed in the treatment solution) rinsed, excised and discarded. After the blade was
removed, the remaining petiole section was divided into two sections (between 0.5-1 cm
in length) and placed on MS F(0) media for shoot /callus induction. Shoots were
selected from four lines, each representing one replicate. To determine the Pb level in
the petiole and blade tissue, a separate second set of shoots was treated for Pb analysis.
Tissues pieces were dried overnight at 70ºC, then ashed and analysed as per methods
section 3.2.2 and 3.2.3.
9.4 Propagation of plants pre-treated with lead
After one or two months (see results section), de novo shoot/crown tissue from pre-
treatments 2, 4, and 5 petioles were transferred to MS N(0) media for rooting and whole
plant propagation. To obtain a minimum of four plants per pre-treatment (two stock
plants, two for re-treatment), three to four subcultures (each subculture 4-5 weeks long)
were required. This was because only a maximum of two shoots were large enough for
culture to MS N(0) and the shoots/crown from the first two subcultures were not large
enough to be divided into two plants.
9.5 Re-treatment regime
Plants were subcultured at least three times to obtain sufficient plant numbers. Lead pre-
treated plants were fully grown (adequate shoot and root growth) in MS N(0) media
within four weeks of subculture. Two plants from each pre-treatment, (0, PbEDTA,
unchelated Pb or PbADA) were used for re-treatment tests; one plant was used as a
control and fed with modified HC nutrient solution (pH 7.0, control), while the second
plant was treated with modified HC nutrient solution (pH 7.0) containing either
Pb(NO3)2 or PbADA.
Under non-sterile conditions, whole plants were transferred to a semi-enclosed
container (i.e. covered with a perforated plastic bag) with water to minimise transplant
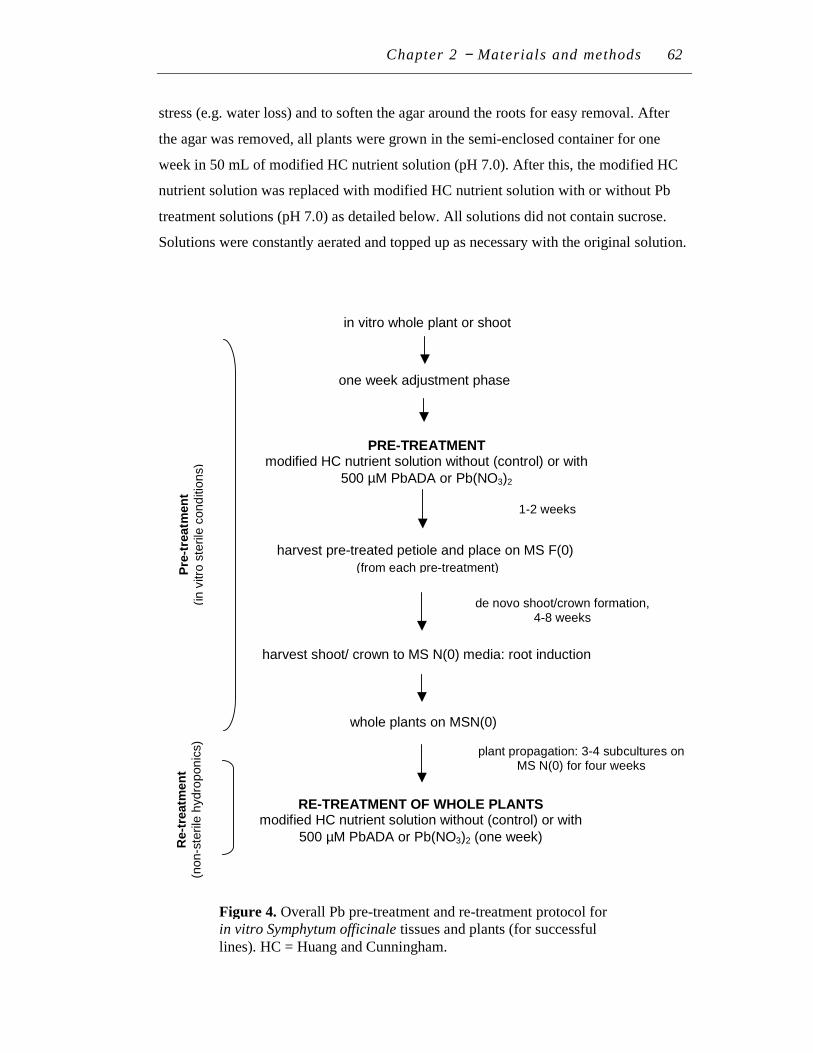
Chapter 2 − Materials and methods 62
stress (e.g. water loss) and to soften the agar around the roots for easy removal. After
the agar was removed, all plants were grown in the semi-enclosed container for one
week in 50 mL of modified HC nutrient solution (pH 7.0). After this, the modified HC
nutrient solution was replaced with modified HC nutrient solution with or without Pb
treatment solutions (pH 7.0) as detailed below. All solutions did not contain sucrose.
Solutions were constantly aerated and topped up as necessary with the original solution.
Figure 4. Overall Pb pre-treatment and re-treatment protocol for in vitro Symphytum officinale tissues and plants (for successful lines). HC = Huang and Cunningham.
Pre
-tre
atm
en
t (in
vitro
ste
rile
con
ditio
ns)
Re-t
reatm
en
t (n
on-s
terile
hydro
pon
ics)
de novo shoot/crown formation, 4-8 weeks
plant propagation: 3-4 subcultures on MS N(0) for four weeks
in vitro whole plant or shoot
PRE-TREATMENT modified HC nutrient solution without (control) or with
500 µM PbADA or Pb(NO3)2
harvest pre-treated petiole and place on MS F(0)
whole plants on MSN(0)
harvest shoot/ crown to MS N(0) media: root induction
RE-TREATMENT OF WHOLE PLANTS modified HC nutrient solution without (control) or with
500 µM PbADA or Pb(NO3)2 (one week)
(from each pre-treatment)
one week adjustment phase
1-2 weeks
Chapter 2 − Materials and methods 63
10 INDICATOR TESTS FOR POTENTIAL MUTANTS
After the plants were re-treated with Pb solutions in hydroponics (methods section 10.5)
three tests were perfomed on the plants to determine if and how mutants formed:
(i) Pb level in shoots and roots (d.w.)
(ii) Polyphenol level in roots (f.w.)
(iii) Superoxide dismutase (SOD) activity in roots (per mg protein or f.w.)
The Pb and polyphenol analysis were performed as in objective 1 except polyphenols
were extracted at a rate of 0.1 g (f.w.) tissue to one mL of 50% (v/v) methanol. Both
histochemical and quantitative assays developed for superoxide dismutase (SOD)
activity and superoxide anions localisation are outlined below.
10.1 Histochemical localisation of superoxide anions
A histochemical test for superoxide anions was developed because it would be a useful
in vivo visual tool should Pb mutants be developed or identified. The superoxide anion
(•O2 ) is one type of free radical that is increased under heavy metal stress. NBT (nitro
blue tetrazolium) is a positive purple stain for the superoxide anion. Under heavy metal
stress, increased antioxidative defence system reduces the level of this free radical and
the degree of purple staining. Therefore this staining allows: (i) the degree of stress to
be visualised and (ii) the generation and/or diffusion sites of superoxide anion to be
localised in vivo. It is also an indirect indicator of possible SOD enzyme levels; specific
indication of SOD levels is not possible with NBT as there may be other non-enzyme
antioxidants involved in superoxide anion removal.
10.1.1 Leaf discs
Leaf discs (0.5 cm in diameter bored from young leaf tissues) were vacuum infiltrated,
up to 24 hours in the dark at room temperature in one mL of water-based treatment
solutions (due to the presence of Pb). This was to aid penetration of the treatment
solution and subsequent NBT stain solution. After treatment, leaf discs were washed
three times with distilled water. Except for controls (no-NBT), all discs were placed
under vacuum in one mL of 0.1-0.2% (w/v) NBT (in potassium phosphate buffer, pH
7.8) initially for five minutes. This was extended to 1.5 hours when uneven staining was
observed. Discs were rinsed in potassium phosphate buffer (pH 7.8) and chlorophyll
Chapter 2 − Materials and methods 64
removed with boiling in 70% (v/v) ethanol for 5-10 minutes (as heating for up to one
hour in 96% (v/v) ethanol at 40°C was ineffective at chlorophyll removal).
10.1.2 Petiole sections
Petiole sections (one mm cross sections) were tested in a similar manner except: (i)
sections were incubated in 0.1 M potassium phosphate buffer (pH 7.8) for one hour
before exposure to treatment solution to reduce wound-related superoxide production,
and (ii) the vacuum infiltration and chlorophyll removal steps were omitted. This was
because boiling in ethanol turned the petiole section a light crimson colour and severely
reduced the initial contrast between NBT purple staining and light green petioles.
The treatments for 10.1.1 and this section were dH2O, 500 µM and 1000 µM of
Pb(NO3)2, H2O2, EDTA, and PbEDTA (at equal concentrations).
10.1.3 Roots of intact whole plants
For each treatment set, cloned in vitro propagated plants were exposed to one of seven
water-based treatment solutions for 24 hours in a growth room (16 hour photoperiod at
26.5 µmol m-2 s-1, 22°C):
(i) dH2O, pH 3.5
(ii) dH2O, pH 6.0
(iii) 5 mM H2O2
(iv) 250 µM EDTA
(v) 250 µM Pb(NO3)2
(vi) 250 µM Pb(NO3)2 and 250 µM EDTA
(vii) 250µM Pb(NO3)2 and 500 µM EDTA
All plant roots were then rinsed three times with dH2O, stained with two mL of 0.1%
(w/v) NBT (dissolved in 0.1 M potassium phosphate buffer, pH 7.8) for one hour in the
dark and rinsed three times again with the same buffer.
Chapter 2 − Materials and methods 65
10.2 Superoxide dismutase (SOD) activity
10.2.1 Extraction
Fresh tissue (blade, petiole, or roots) were homogenised in ice cold 0.1 M potassium
phosphate buffer (pH 7.8) containing 1% (w/v) PVPP*. All tissues were homogenised
at a ratio of 0.2 g (f.w.) to two mL of this extraction buffer (with a small amount of fine
sand) for two minutes on ice. Tissue weights and supernatant volumes were recorded
for quantification of SOD activity.
*Before determining this as the best SOD extraction buffer, the potassium
phosphate buffer containing one or more of the following reagents were tested: (i) 0.625
mM Na2EDTA (to ensure the EDTA level would exceed the Pb level in tissue), (ii) 0-
0.25% (v/v) Triton X-100, (iii) 10% (v/v) glycerol, (iv) 0.2 mM ADA, (v) 2 mM DTT.
These tests are recommended when tissues contain membrane-bound enzymes and
heavy metals (Bollag et al., 1996).
10.2.2 Superoxide dismutase assay
The SOD assay does not follow typical enzyme assays based on the Beer-Lambert law.
The nitro blue tetrazolium (NBT) assay for SOD is an inhibition-based photochemical
assay. In this assay, superoxide ions (generated from the redox reaction between
photon-excited-riboflavin and methionine) converts NBT (originally a clear yellow
solution) to formazan. Formazan is a blue-purple coloured product that is measured at
560 nm. Being a scavenger of superoxide anions, SOD reduces the concentration of
superoxide anions (the NBT substrate) and thus the level of formazan produced. The
extent of loss in formazan production is a measure of the SOD activity in the sample
(Beyer and Fridovich, 1987).
Following Malecka et al., (2001), the one mL reaction mixture contained enzyme
extract volumes up to 0.2 mL, 0.05 M potassium phosphate buffer (pH 7.8), 13 mM
methionine, 63 µM NBT and 13 µM riboflavin. All samples were illuminated in growth
room lights (26.5 µmol m-2 s-1, 22°C) for 15 minutes (or for seven minutes with buffer
containing Triton X-100), and absorbance measured at 560 nm. Two controls, boiled
SOD enzyme and buffer-only samples were performed, but only the former was
factored into the SOD activity calculation (Asada et al ., 1974). The latter control
Chapter 2 − Materials and methods 66
served to compare and check SOD assays between experiments. An inhibition curve
was made against the fresh weight of tissue in the volume of extract. SOD activity was
expressed as units per mg protein, where one unit was defined as the amount of tissue
(mg f.w.) in the extract that caused 50% inhibition of NBT photo-reduction.
Prior to analysis of SOD activity in plant tissues, absorbance readings of
potassium phosphate buffer solutions (all pH 7.8) spiked with four separately tested
reagents (500 µM PbEDTA, 1000 µM PbEDTA, 26 mg L-1 FeEDTA, or 260 mg L-1
FeEDTA) were measured at the wavelength for SOD analysis (560 nm).
10.2.3 Total protein assay
Total protein was measured using the micro-assay version (1.1 mL assay volume) of the
Bradford Assay (Bradford, 1976). Bradford reagent (0.1 mL) was added to the enzyme
extract (1 mL), vortexed and stood for five minutes before the absorbance was
measured at 595 nm. A range (0-25 µg mL-1) of bovine serum albumin (BSA, from
BDH) solutions was used as the standard.
11 STATISTICAL ANALYSIS
To ensure homogeneity of variances, the F (max) values of all data were calculated to
determine if the data required transformation prior to ANOVA analysis. When the
experimental F (max) values were greater than the corresponding tabular value, data
were log 10/ log 10+1 transformed and F (max) re-tested prior to ANOVA. All data
presented in this thesis (unless indicated) passed the F (max) test. One way ANOVA on
data were significant at the 95% or 99% level if P values were less than or equal to 0.05
or 0.01 respectively. Statistically significant treatments were determined using the
Tukey test and indicated as different letters in graphs or tables.
Chapter 3 − Results and discussion 67
CHAPTER 3
RESULTS AND DISCUSSION
Objective 1 Association of polyphenols with chelation-based tolerance mechanism and Pb
accumulation: Hydroponic studies with sand-grown Symphytum officinale
1 PLANT PROPAGATION
Vegetative root cutting was the fastest and most successful propagation method for
Symphytum officinale. Within one month, at least 90% of the cuttings started to develop
shoots and roots. Hydroponic studies used only approximately uniform plants.
2 POLYPHENOL STUDIES
In this thesis, polyphenols refers to both simple and complex phenolic compounds.
Tannin is one class of complex polyphenols that was investigated.
2.1 Histochemical detection of polyphenols
Free hand horizontal cross-sections of fresh roots and petioles stained red with nitrous
acid, indicating the presence of catechol-type polyphenols in these tissues. The heaviest
red staining was observed in the epidermal and casparian strip region of the root. In the
petiole cross-sections, unicellular trichomes, head of glandular trichomes, epidermis and
vascular bundle also stained red, though lighter in intensity than roots. No red staining
was observed in controls (preliminary observations and no photos shown).
It was difficult to be certain of the location of polyphenols in these tissues because
the red stain appeared to smear throughout the tissue – most probably because
polyphenol-containing vacuoles were ruptured during free hand sectioning. However,
the results are consistent with previous histochemical observations on S. officinale by
Chapter 3 − Results and discussion 68
De Padua and Pantastisco (1976). In their studies, tannins were found to be more
abundant in roots than shoots.
2.2 Class of tannins
The lateral and main root contained condensed tannins as both root polyphenol extracts
turned olive-green upon addition of iron chloride. No green colour was observed in
controls. The lateral root extracts were a darker green than main roots, reflecting a
higher level of tannins in the lateral root. No blue/ black colour, which is indicative of
hydrolysable tannins, was observed upon further addition of iron chloride (Plate 3). This
supports the fact that condensed tannins are found most commonly in angiosperms (e.g.
S. officinale), gymnosperms and ferns (Harborne and Baxter, 1993).
2.3 Factors affecting polyphenol analysis
A single recommended protocol for quantifying polyphenols in plants does not exist
because polyphenol and tannin levels can vary significantly depending on the plant
species and how the tissue is handled from sample preparation to assay (Silanikove et
al., 1996; Waterman and Mole, 1994).
In the present study, factors concerning polyphenol extraction and analysis were
conducted to determine the most suitable method for this project. These factors were:
• tannin recovery after freeze-drying
• number of extraction rounds
• type of extraction solvent
• extraction method and time
• type of quantitative assay
It is important to note that the objective of this experiment was to assess only trends
relating to Pb accumulation and polyphenol levels, ‘total’ polyphenol levels were not
necessary. Thus, the polyphenol level measured in S. officinale represents (and was
limited to) the ‘extractable’ polyphenol fraction from the first round of extraction, not
the total polyphenol content. Extractable polyphenols will be referred to with the
shortened phrase ‘polyphenol level’. Total polyphenol analysis would involve at least
two extraction rounds and boiling the residue in 1% (w/v) SDS and 5% (w/v)
mercaptoethanol for 75-90 minutes. This is required to extract all the fiber and protein
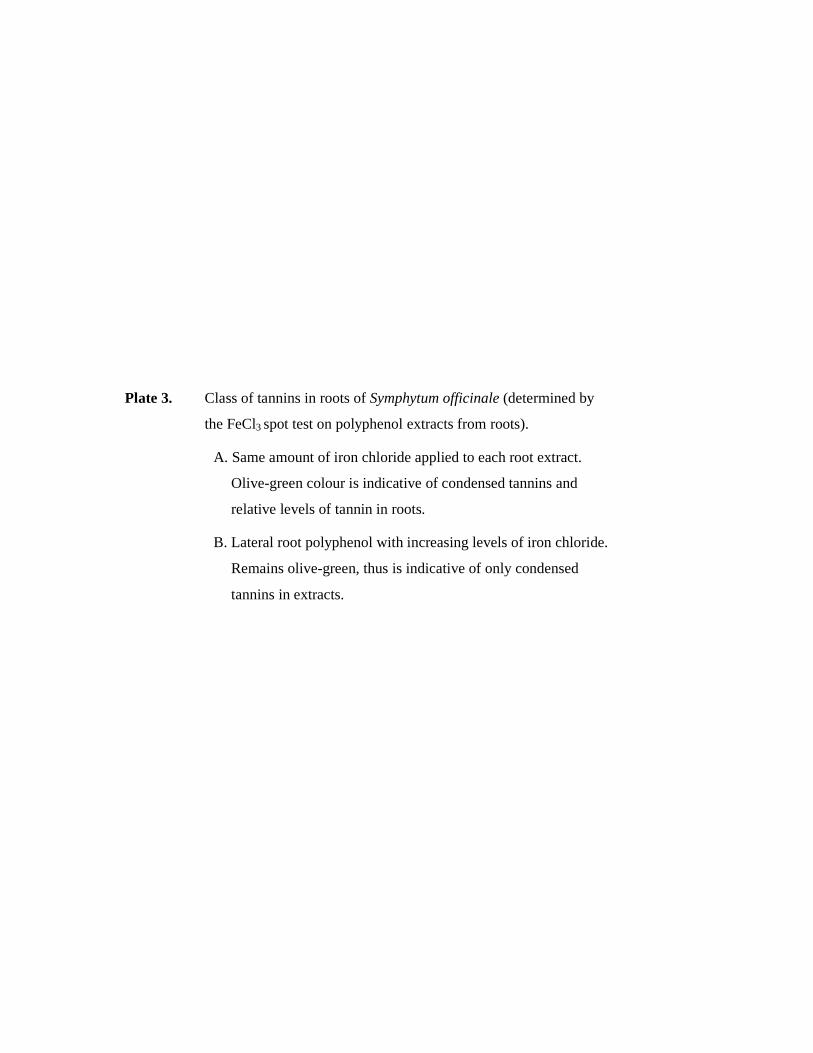
Chapter 3 - Results and discussion 69
Plate 3. Class of tannins in roots of Symphytum officinale (determined by
the FeCl3 spot test on polyphenol extracts from roots).
A. Same amount of iron chloride applied to each root extract.
Olive-green colour is indicative of condensed tannins and
relative levels of tannin in roots.
B. Lateral root polyphenol with increasing levels of iron chloride.
Remains olive-green, thus is indicative of only condensed
tannins in extracts.
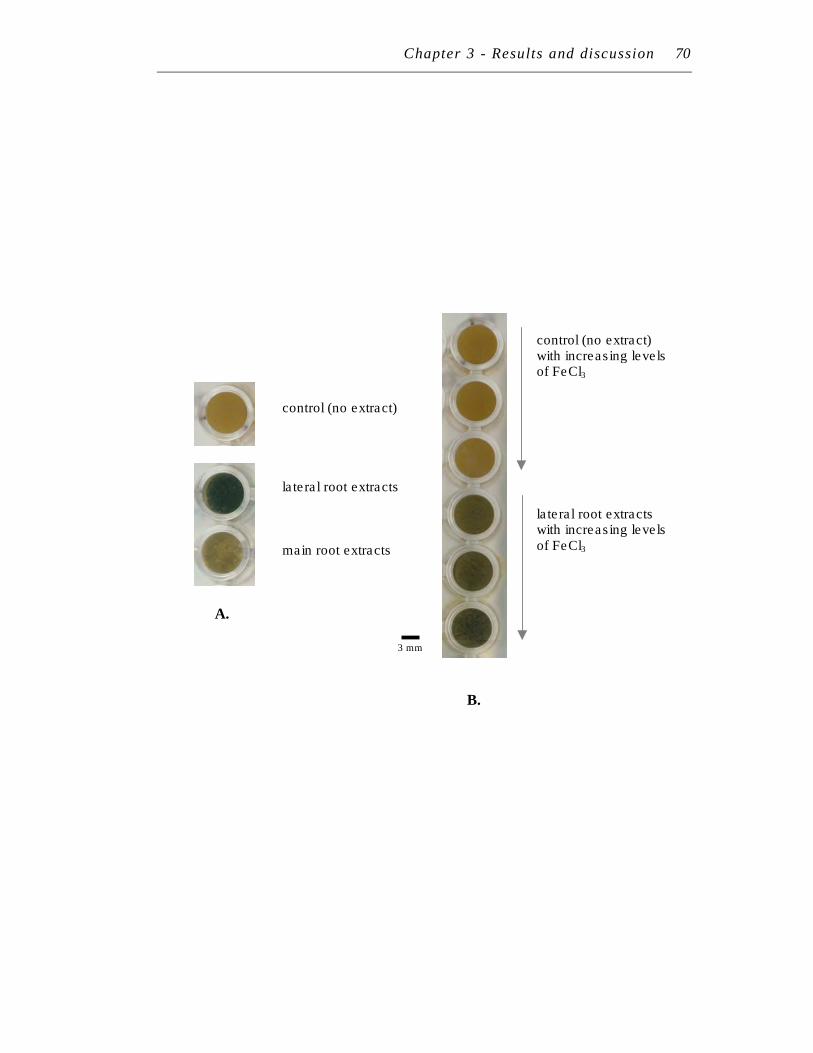
Chapter 3 - Results and discussion 70
control (no extract) lateral root extracts
main root extracts
control (no extract) with increasing levels of FeCl3 lateral root extracts with increasing levels of FeCl3
A.
B.
3 mm

Chapter 3 − Results and discussion 71
bound condensed tannins (which can make up at least 30% of the total polyphenols in
some plants) (Jackson et al., 1996).
2.3.1 Tannin recovery after freeze-drying
As recommended by Waterman and Mole (1994), and the FAO/IAEA laboratory
manual (2002), all plant tissues were freeze-dried due to the large sample sizes involved
in this section. To determine tannin recovery after freeze-drying, lateral root tissues
were spiked with 0.1 mg mL-1 tannic acid. No tannin was lost due to this drying process
as 100% of the tannic acid spike was recovered (Appendix B).
2.3.2 Number of extraction rounds
Two rounds of extraction were performed on four types of S. officinale tissues: leaf
blade, petiole, lateral root, and main root. In all tissues, the first round of extraction (R1)
released more than 80% of the total (R1 plus R2) polyphenols (P≤0.05) (Figure 5).
Thus, only one extraction round was performed in subsequent experiments.
2.3.3 Extraction solvent
In this section, polyphenols were more effectively extracted from root tissues using 70%
(v/v) acetone than 50% (v/v) methanol because only acetone resulted in significantly
different polyphenol levels (P≤0.05) between the lateral and main root. Although not
statistically significant (P≥0.05), this difference appears to be because acetone is more
effective in extracting lateral root (not main root) polyphenols than methanol (Figure
6A). These trends were also true for the tannin levels measured (Figure 6B). Why only
the lateral root? One reason could be the differences in biochemical composition
between the lateral root and main root extracts. For example, acetone is known to
prevent polyphenol-protein precipitation (Brown, 2001). If lateral roots (although not
tested) have more protein-precipitable tannins than main roots, this could explain why
acetone was more effective in extracting polyphenols from only the lateral root.
However, the precise reason is unknown.
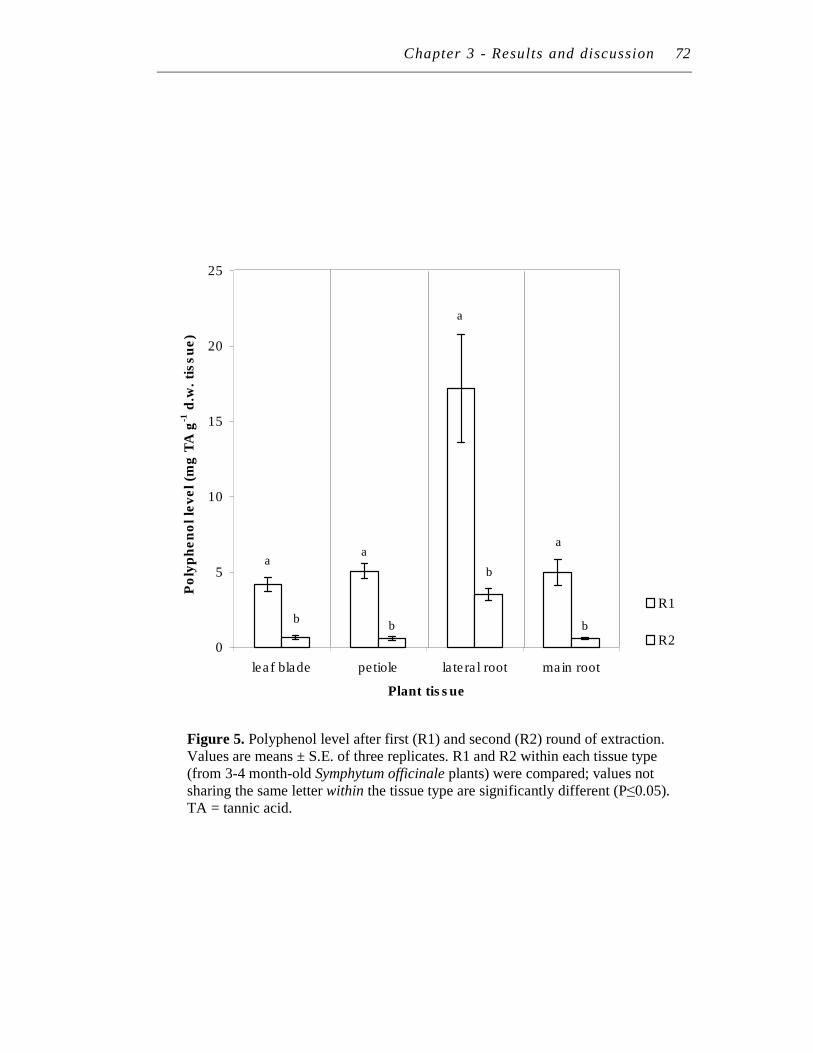
Chapter 3 - Results and discussion 72
Figure 5. Polyphenol level after first (R1) and second (R2) round of extraction. Values are means ± S.E. of three replicates. R1 and R2 within each tissue type (from 3-4 month-old Symphytum officinale plants) were compared; values not sharing the same letter within the tissue type are significantly different (P≤0.05). TA = tannic acid.
aa
a
a
b
b
bb
0
5
10
15
20
25
leaf blade petiole lateral root main root
Plant tissue
Po
lyp
he
no
l le
ve
l (m
g T
A g
-1 d
.w.
tis
su
e).
..
R1
R2
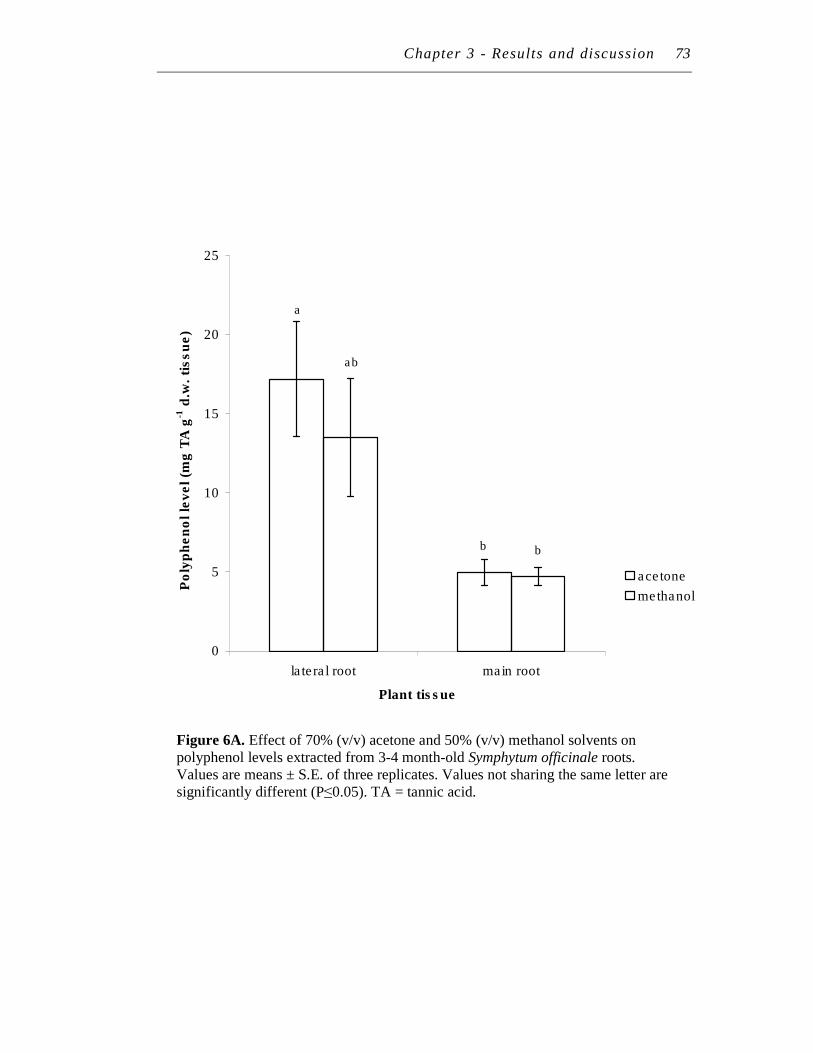
Chapter 3 - Results and discussion 73
Figure 6A. Effect of 70% (v/v) acetone and 50% (v/v) methanol solvents on polyphenol levels extracted from 3-4 month-old Symphytum officinale roots. Values are means ± S.E. of three replicates. Values not sharing the same letter are significantly different (P≤0.05). TA = tannic acid.
a
b
ab
b
0
5
10
15
20
25
lateral root main root
Plant tissue
Po
lyp
he
no
l le
ve
l (m
g T
A g
-1 d
.w.
tis
su
e).
..
acetone
methanol
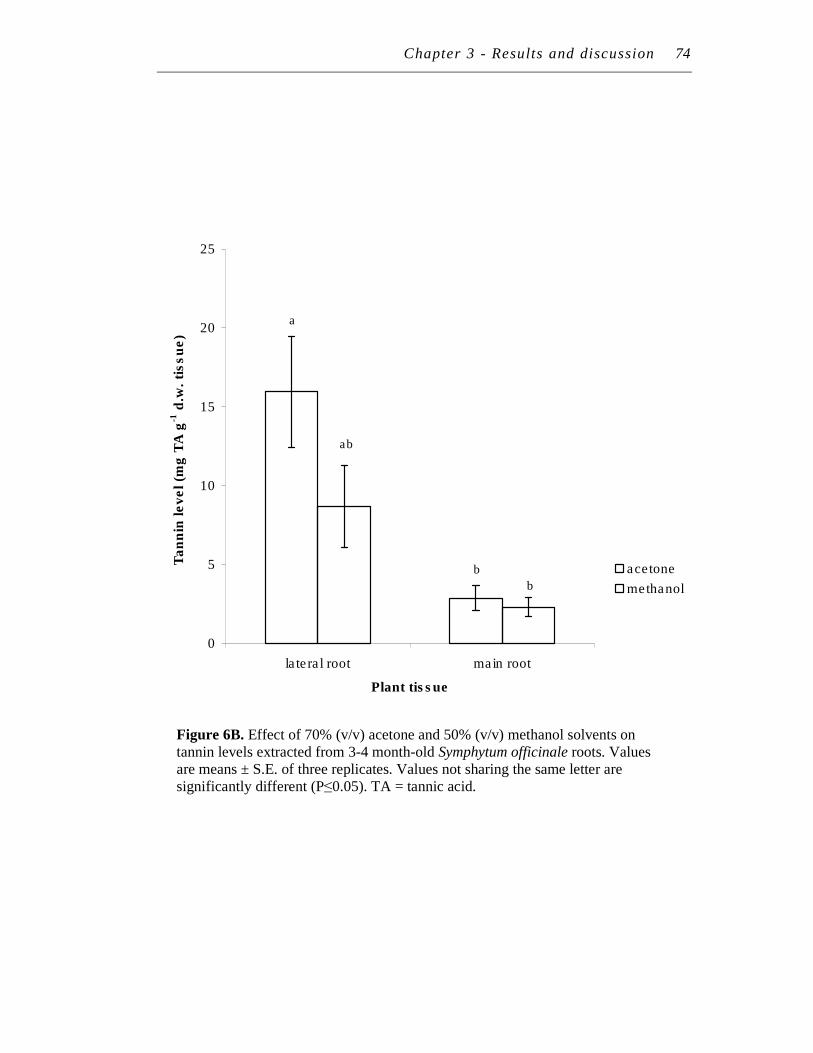
Chapter 3 - Results and discussion 74
Figure 6B. Effect of 70% (v/v) acetone and 50% (v/v) methanol solvents on tannin levels extracted from 3-4 month-old Symphytum officinale roots. Values are means ± S.E. of three replicates. Values not sharing the same letter are significantly different (P≤0.05). TA = tannic acid.
a
b
ab
b
0
5
10
15
20
25
lateral root main root
Plant tissue
Tan
nin
level (m
g T
A g
-1 d
.w. ti
ssu
e).
..
acetone
methanol

Chapter 3 − Results and discussion 75
In subsequent experiments only 50% (v/v) methanol was used for polyphenol
extraction because: (i) in order to compare the Folin-Ciocalteu assay to the BSA-protein
precipitation assay, an extra step was required to remove acetone (otherwise it would
inhibit the protein-tannin precipitation reaction of the assay, and (ii) in subsequent
experiments, longer methanol-based extraction (overnight) resulted in significant
differences in polyphenol/tannin levels between these root types.
After 50% (v/v) methanol was selected, additives were added to this solvent to
determine if the polyphenol and tannin yield could be further improved. In numerous
publications, the 0.1% (w/v) ascorbic acid additive was added to methanol (without pH
adjustment) for overnight extractions to reduce the loss of polyphenols by oxidation and
increase condensed tannin yields (Dalzell and Kerven, 1998; Terrill et al., 1992). To
avoid tannin precipitation by Pb in polyphenol extracts of Pb-treated tissue, 1.5 mM
EDTA was also added as an additive. However, it was found that both these additives
inhibited root-tannin extraction when compared to plain 50% (v/v) methanol. Five
minutes into extraction and at the end of the extraction period, the brown intensity of
both the extracts (indicative of polyphenol levels) was much lower. The BSA-protein
precipitation assay for tannin levels supported this observation (Appendix C). The
acidity of these additives may have inhibited effective tannin extraction. The pH of 50%
(v/v) methanol was about 5.4, compared to pH 4.2 for 50% (v/v) methanol plus 0.1%
(w/v) ascorbic acid, and pH 3.6 for 50% (v/v) methanol plus 0.1% (w/v) ascorbic acid
and 1.5 mM EDTA. This is consistent with beer production methods in which tannin
extraction is avoided by maintaining pH well below 6.0 (Scandrett, 1997), but the
precise reason for this effect is unknown. Ascorbic acid was also found to interfere with
the Folin-Ciocalteu assay (see 2.3.4 below).
2.3.4 Type of quantitative assay
Two types of assays were performed on root polyphenol extracts: radial diffusion
(Hagerman, 1998) and colorimetric assays (FAO/IAEA laboratory manual, 2002;
Hagerman and Butler, 1978). Radial diffusion did not detect tannins from the extracts as
a cloudy ring (indicative of tannins bound to the BSA-protein in the radial diffusion
medium) was not observed (preliminary observations). However, both the Folin-
Ciocalteu and BSA-protein precipitation colorimetric assays successfully detected
polyphenols and tannins in the root extracts. In the case of the Folin-Ciocalteu assay,
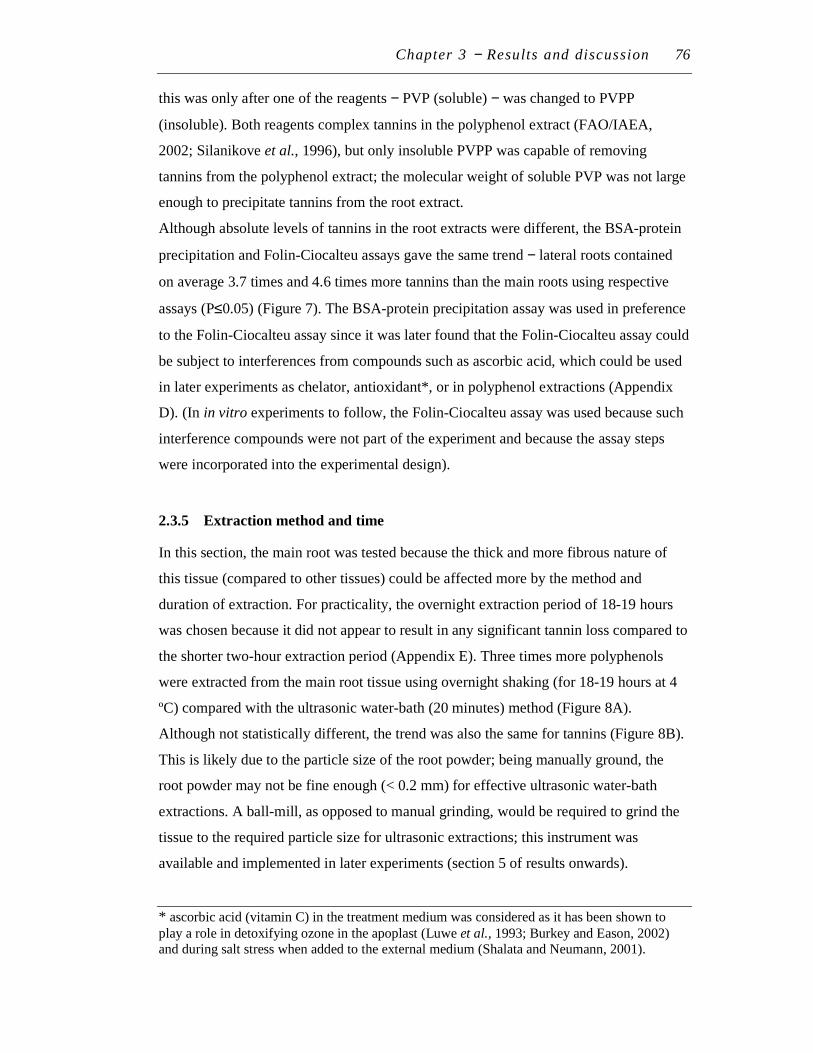
Chapter 3 − Results and discussion 76
this was only after one of the reagents − PVP (soluble) − was changed to PVPP
(insoluble). Both reagents complex tannins in the polyphenol extract (FAO/IAEA,
2002; Silanikove et al., 1996), but only insoluble PVPP was capable of removing
tannins from the polyphenol extract; the molecular weight of soluble PVP was not large
enough to precipitate tannins from the root extract.
Although absolute levels of tannins in the root extracts were different, the BSA-protein
precipitation and Folin-Ciocalteu assays gave the same trend − lateral roots contained
on average 3.7 times and 4.6 times more tannins than the main roots using respective
assays (P≤0.05) (Figure 7). The BSA-protein precipitation assay was used in preference
to the Folin-Ciocalteu assay since it was later found that the Folin-Ciocalteu assay could
be subject to interferences from compounds such as ascorbic acid, which could be used
in later experiments as chelator, antioxidant*, or in polyphenol extractions (Appendix
D). (In in vitro experiments to follow, the Folin-Ciocalteu assay was used because such
interference compounds were not part of the experiment and because the assay steps
were incorporated into the experimental design).
2.3.5 Extraction method and time
In this section, the main root was tested because the thick and more fibrous nature of
this tissue (compared to other tissues) could be affected more by the method and
duration of extraction. For practicality, the overnight extraction period of 18-19 hours
was chosen because it did not appear to result in any significant tannin loss compared to
the shorter two-hour extraction period (Appendix E). Three times more polyphenols
were extracted from the main root tissue using overnight shaking (for 18-19 hours at 4
ºC) compared with the ultrasonic water-bath (20 minutes) method (Figure 8A).
Although not statistically different, the trend was also the same for tannins (Figure 8B).
This is likely due to the particle size of the root powder; being manually ground, the
root powder may not be fine enough (< 0.2 mm) for effective ultrasonic water-bath
extractions. A ball-mill, as opposed to manual grinding, would be required to grind the
tissue to the required particle size for ultrasonic extractions; this instrument was
available and implemented in later experiments (section 5 of results onwards).
* ascorbic acid (vitamin C) in the treatment medium was considered as it has been shown to play a role in detoxifying ozone in the apoplast (Luwe et al., 1993; Burkey and Eason, 2002) and during salt stress when added to the external medium (Shalata and Neumann, 2001).

Chapter 3 - Results and discussion 77
Figure 7. Comparison of two assays for determination of tannin levels extracted from root tissue of 3-4 month-old Symphytum officinale. Values are means ± S.E. of three replicates. Values not sharing the same letter are significantly different (P≤0.05). TA = tannic acid.
c
ab
bc
a
0
5
10
15
20
25
30
lateral root main root
Plant tissue
Ta
nn
in l
ev
el
(mg
TA
g-1
d.w
. ro
ot)
..
Folin
BSA
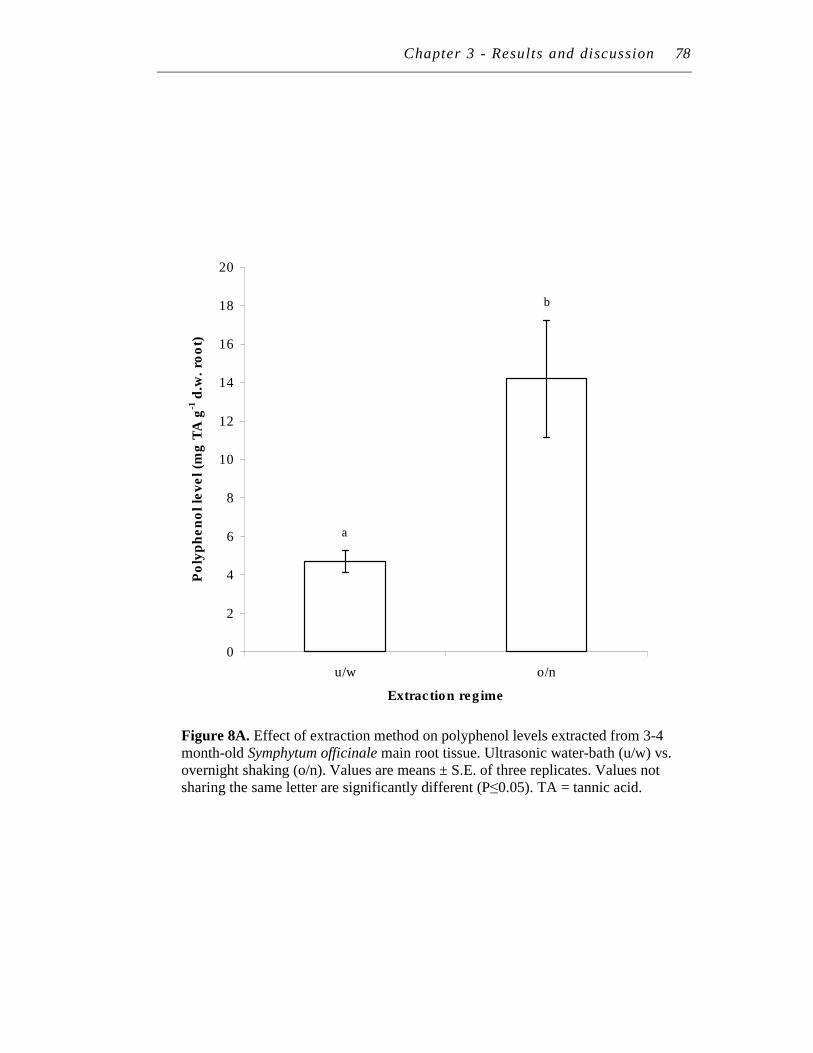
Chapter 3 - Results and discussion 78
Figure 8A. Effect of extraction method on polyphenol levels extracted from 3-4 month-old Symphytum officinale main root tissue. Ultrasonic water-bath (u/w) vs. overnight shaking (o/n). Values are means ± S.E. of three replicates. Values not sharing the same letter are significantly different (P≤0.05). TA = tannic acid.
b
a
0
2
4
6
8
10
12
14
16
18
20
u/w o/n
Extraction regime
Po
lyp
he
no
l le
ve
l (m
g T
A g
-1 d
.w.
roo
t) .
.
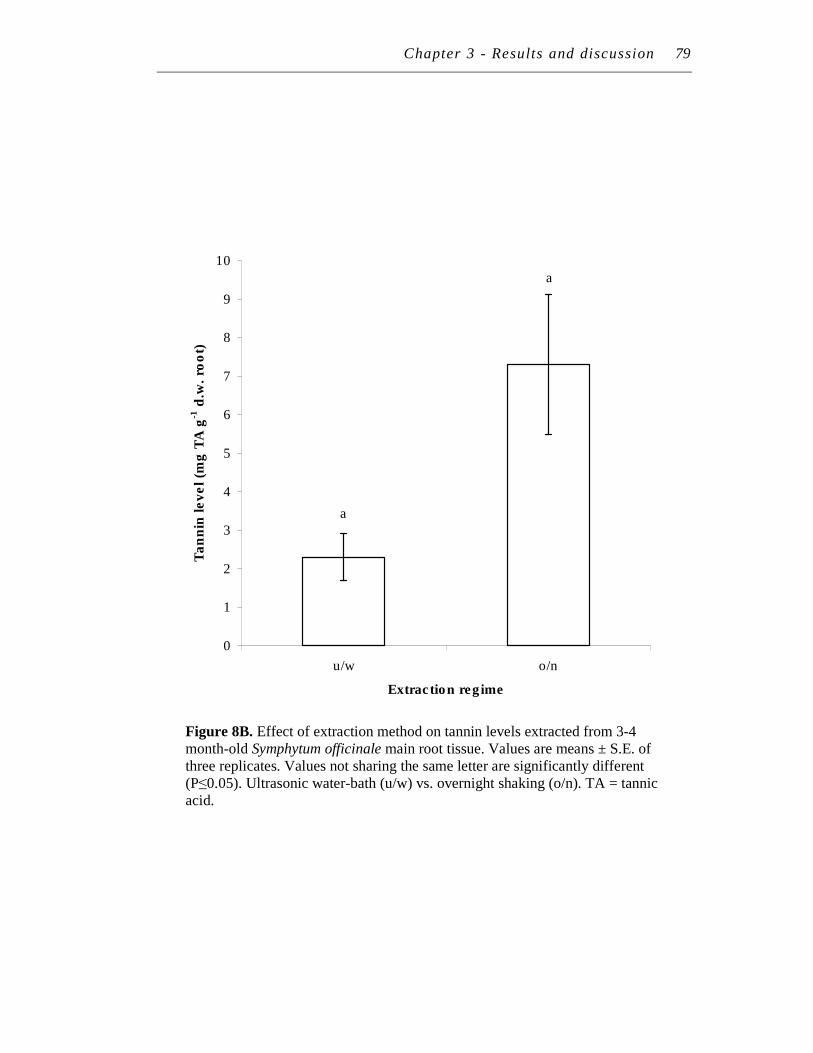
Chapter 3 - Results and discussion 79
Figure 8B. Effect of extraction method on tannin levels extracted from 3-4 month-old Symphytum officinale main root tissue. Values are means ± S.E. of three replicates. Values not sharing the same letter are significantly different (P≤0.05). Ultrasonic water-bath (u/w) vs. overnight shaking (o/n). TA = tannic acid.
a
a
0
1
2
3
4
5
6
7
8
9
10
u/w o/n
Extraction regime
Tan
nin
level (m
g T
A g
-1 d
.w. ro
ot)
..
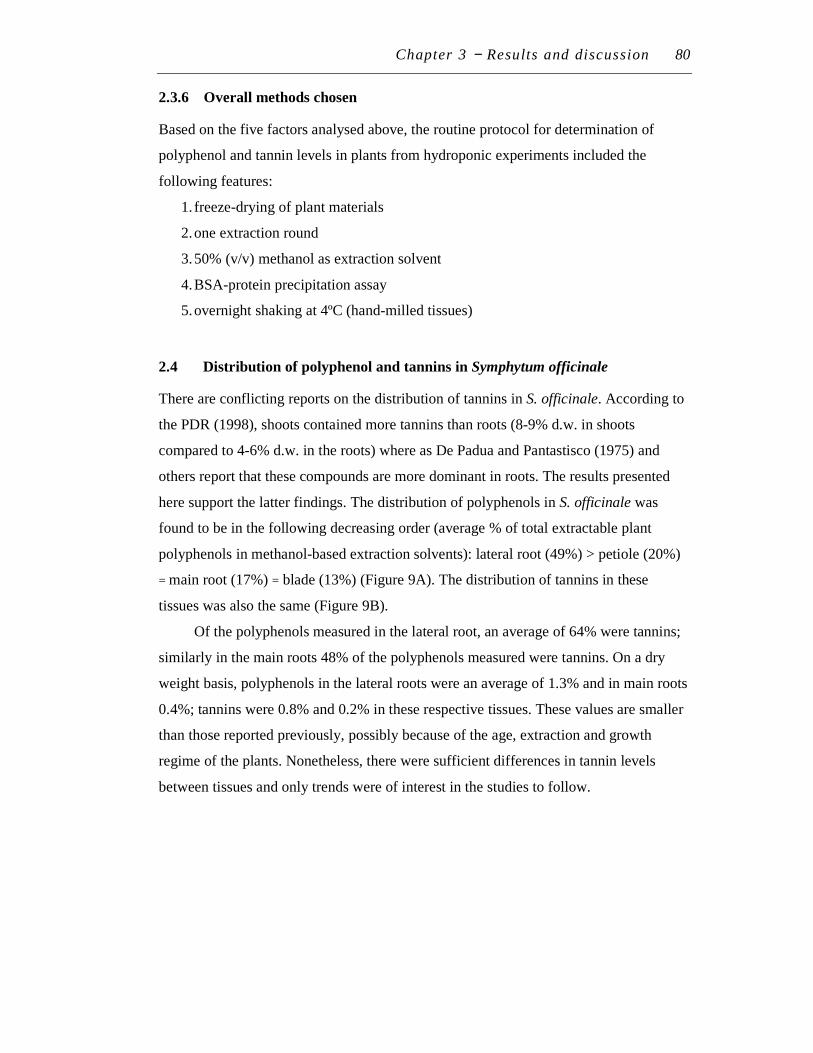
Chapter 3 − Results and discussion 80
2.3.6 Overall methods chosen
Based on the five factors analysed above, the routine protocol for determination of
polyphenol and tannin levels in plants from hydroponic experiments included the
following features:
1. freeze-drying of plant materials
2. one extraction round
3. 50% (v/v) methanol as extraction solvent
4. BSA-protein precipitation assay
5. overnight shaking at 4ºC (hand-milled tissues)
2.4 Distribution of polyphenol and tannins in Symphytum officinale
There are conflicting reports on the distribution of tannins in S. officinale. According to
the PDR (1998), shoots contained more tannins than roots (8-9% d.w. in shoots
compared to 4-6% d.w. in the roots) where as De Padua and Pantastisco (1975) and
others report that these compounds are more dominant in roots. The results presented
here support the latter findings. The distribution of polyphenols in S. officinale was
found to be in the following decreasing order (average % of total extractable plant
polyphenols in methanol-based extraction solvents): lateral root (49%) > petiole (20%)
= main root (17%) = blade (13%) (Figure 9A). The distribution of tannins in these
tissues was also the same (Figure 9B).
Of the polyphenols measured in the lateral root, an average of 64% were tannins;
similarly in the main roots 48% of the polyphenols measured were tannins. On a dry
weight basis, polyphenols in the lateral roots were an average of 1.3% and in main roots
0.4%; tannins were 0.8% and 0.2% in these respective tissues. These values are smaller
than those reported previously, possibly because of the age, extraction and growth
regime of the plants. Nonetheless, there were sufficient differences in tannin levels
between tissues and only trends were of interest in the studies to follow.
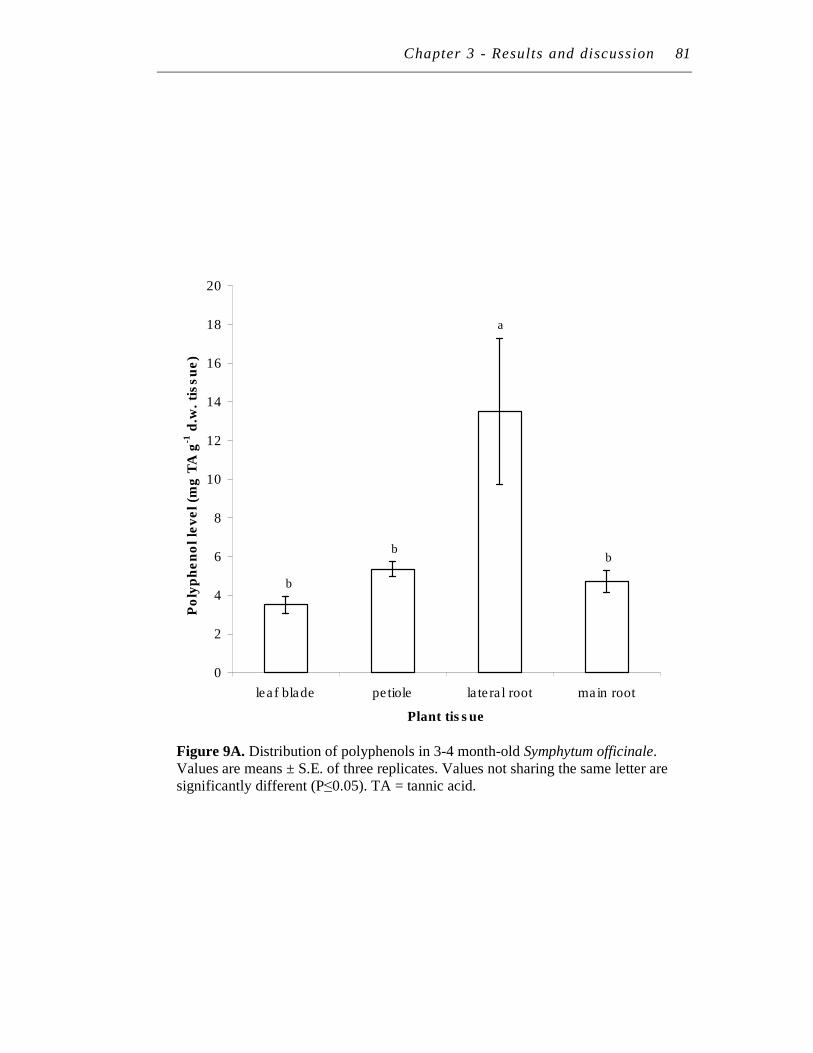
Chapter 3 - Results and discussion 81
Figure 9A. Distribution of polyphenols in 3-4 month-old Symphytum officinale. Values are means ± S.E. of three replicates. Values not sharing the same letter are significantly different (P≤0.05). TA = tannic acid.
bb
b
a
0
2
4
6
8
10
12
14
16
18
20
leaf blade petiole lateral root main root
Plant tissue
Po
lyp
he
no
l le
ve
l (m
g T
A g
-1 d
.w.
tis
su
e)
..
Chapter 3 - Results and discussion 82
Figure 9B. Distribution of tannins in 3-4 month-old Symphytum officinale. Values are means ± S.E. of three replicates. Values not sharing the same letter are significantly different (P≤0.05). TA = tannic acid.
a
b
bb
0
2
4
6
8
10
12
leaf blade petiole lateral root main root
Plant tissue
Ta
nn
in l
ev
el
(mg
TA
g-1
d.w
. ti
ss
ue
) ..
Chapter 3 − Results and discussion 83
3 LEAD ACCUMULATION STUDIES (I)
3.1 Ashing temperature
To determine the effect of the ashing temperature on Pb recovery, one g (d.w.) of S.
officinale root tissue was spiked with 12 mg L-1 Pb (element) (from analytical grade Pb,
BDH standard) and ashed at three different temperatures (480°C, 495-500°C, 550°C).
Control tissue was spiked with 1% (v/v) HNO3.
The 480°C and 495-500°C ashing temperatures were the best temperatures for Pb
recovery as least 85% of the 12 mg L-1 Pb spike solution was recovered; there was no
difference between the two temperatures (Appendix F). However, of these two
temperatures, the 495-500°C ashing temperature was selected for subsequent Pb
analysis as it resulted in the most complete ashing (as determined by the ‘whiteness’ of
the ash). Only 75% of the Pb was recovered at the 550°C ashing temperature (as used in
previous publications such as Dushenkov et al., 1995); the loss of Pb is presumably due
to Pb volatilisation above 500°C.
3.2 Lead effect on plants: visual observations
Root growth and health of 2-month-old S. officinale plants decreased with increasing
Pb(NO3)2 concentrations (Table 3). After one week, root growth of plants exposed to
100 µM Pb(NO3)2 did not appear to be affected when compared to the control; new
roots up to five cm long were observed in both control (no Pb(NO3)2) and 100 µM
Pb(NO3)2 solutions. From 250 µM to 1000 µM Pb(NO3)2, new root growth was visibly
inhibited; at 500 to 1000 µM roots appeared severely stunted and thick compared to
other Pb concentrations. This root growth inhibition is a typical effect of Pb plant
growth (Sobotik et al., 1998). With increasing Pb concentrations, the colour of the roots
appeared to change from white/yellow to brown (indicative of cell death and/or
polyphenol polymerisation), particularly when comparing the control to 250-1000 µM
Pb(NO3)2. These effects were maintained over the three-week duration of this
experiment (Plate 4).
In all treatments, shoot growth appeared to be relatively green and healthy after
one week. By the end of week two some yellowing of leaves, particularly around the
edges, could be seen in all plants (no chlorophyll measurements were taken). However,
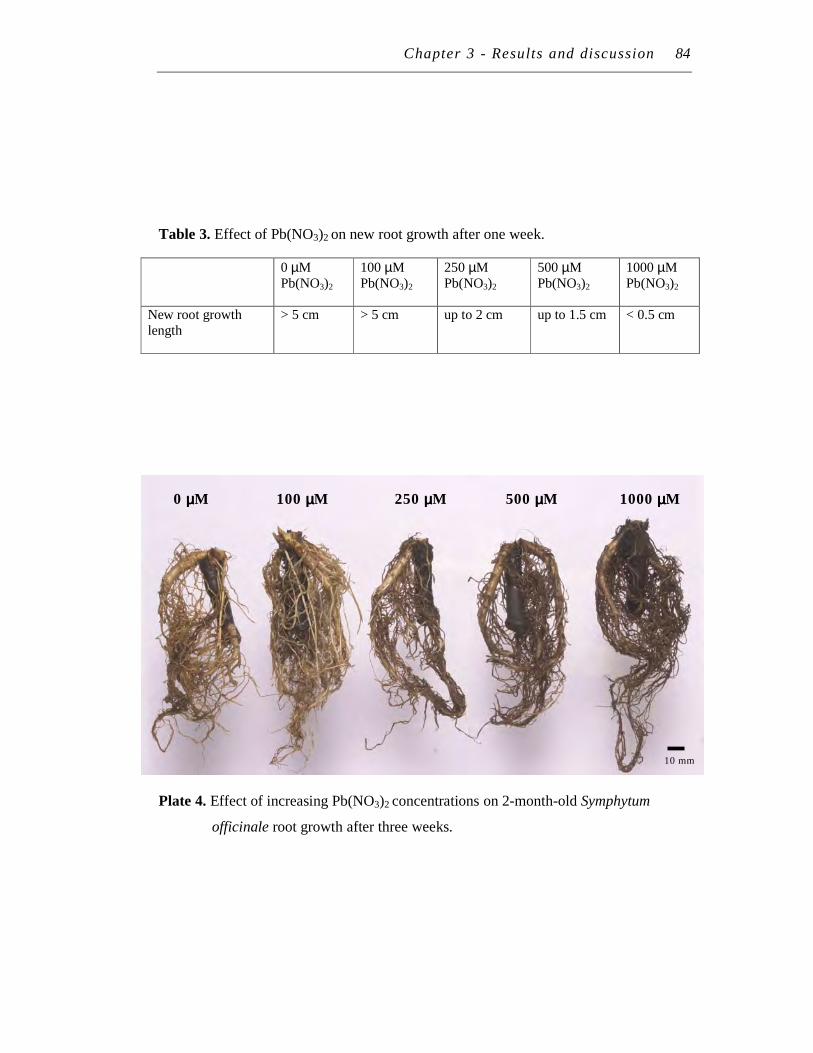
Chapter 3 - Results and discussion 84
Table 3. Effect of Pb(NO3)2 on new root growth after one week.
0 µM Pb(NO3)2
100 µM Pb(NO3)2
250 µM Pb(NO3)2
500 µM Pb(NO3)2
1000 µM Pb(NO3)2
New root growth length
> 5 cm > 5 cm up to 2 cm up to 1.5 cm < 0.5 cm
Plate 4. Effect of increasing Pb(NO3)2 concentrations on 2-month-old Symphytum
officinale root growth after three weeks.
0 µµµµM 100 µµµµM 250 µµµµM 500 µµµµM 1000 µµµµM
10 mm
Chapter 3 − Results and discussion 85
one or two new shoots still formed after week two in all Pb(NO3)2 treatments. By week
three, significant leaf yellowing was observed for all plants, probably due to a lack of
nutrients from the Pb(NO3)2 salt solution. Throughout the three-week duration of this
experiment, there were no observable differences in shoot health between any of the Pb
treatments and the control. This is consistent with AAS data from Figure 10A, which
show that very little Pb is transported to the shoots.
Interesting in this study, this suggests that root growth inhibition had little
consequence on shoot growth and health. Presumably, root-shoot ‘communication’ went
on as usual, with or without Pb. The age of the plant and Pb treatment concentration
may have some bearing on this observation. Previous studies showing shoot stress
(Vassil et al., 1998; Huang and Cunningham 1996; Geebelen et al., 2002) used
seedlings or very young plants. Sobotik et al., (1998) showed that partial root inhibition
was only observed at Pb concentrations starting at 0.01 M, while at 0.1 M shoot and root
growth were severely inhibited.
4 ROLE OF POLYPHENOLS IN LEAD ACCUMULATION
The possible role of polyphenols in the metal-chelation based tolerance mechanism and
Pb accumulation in S. officinale was investigated at root level for two reasons. Firstly,
the above experiment established that lateral root tissues contained the highest level of
polyphenols such as tannins. Secondly, there was an in vivo difference in polyphenol
and tannin levels between the lateral and main root tissues; lateral roots contained about
three times more polyphenols and four times more tannins than main root tissue (on a
dry weight basis). This difference forms the basis of the following in vivo studies (Pb,
polyphenol and TEM analysis of tissues after Pb treatment). The basic question here
was: “does the root with more polyphenols/tannins accumulate more Pb?”
4.1 Hydroponic conditions
To ensure that all plants used in the experiments were uniformly treated, the initial
hydroponic Pb experiments (result section 4.2) were re-started because the plants
required spraying to control an unexpected infestation of whiteflies.
Another hurdle was the unexpected precipitation of Pb in the nutrient solution.
This would not only reduce Pb bioavailability but also may result in contamination of
Chapter 3 − Results and discussion 86
the root tissue. Acid washing of all glassware, to remove any phosphate contaminants,
did not solve the problem. For Pb concentrations up to 100 µM, adjusting the pH of the
nutrient solution prior to Pb addition removed Pb precipitation. However above this
concentration, precipitation was still observed − this was due to the phosphate levels of
the nutrient solution. When the phosphate level of the HC nutrient solution was lowered
by 50% (to 5 µM KH2PO4; see Appendix A1), precipitation was almost eliminated. The
plants grown in this HC nutrient solution (referred to as modified HC nutrient solution)
did not exhibit any phosphate deficiencies.
4.2 Pb uptake and accumulation
Each level of treatment (modified HC nutrient solution containing 0 µM Pb(NO3)2
(control), 250 µM Pb(NO3)2 (unchelated Pb form), and 250 µM Pb(NO3)2 with 125 µM
EDTA (chelated Pb form) was replicated three times.
After seven days in nutrient solution containing 250 µM Pb(NO3)2 with and
without 125 µM EDTA, new root growth was significantly reduced compared to the
control plant. Of the two Pb treatments, the degree of root growth inhibition was
slightly less with EDTA, which was consistent with the slightly lower Pb levels in the
roots. At the shoot level there were no observable Pb effects (Plate 2, methods section).
This is consistent with AAS data, which show that very little Pb is in the shoots (Figure
10A).
Under the conditions of this experiment, S. officinale appears to accumulate Pb
primarily in its roots. The distribution of Pb (for both unchelated and chelated Pb forms)
in S. officinale plant tissues, from highest to lowest was: lateral root > main root > shoot
(Figure 10A and B). For both unchelated and chelated Pb-exposed plants, most of the
Pb accumulated in the root tissue. In both forms of Pb-exposed plants, only a small but
significant (P≤0.05) amount of Pb was translocated from the root to shoot tissue. For
chelated Pb-treated plants, the Pb shoot level was on average 12 times higher compared
to unchelated Pb-treated plants. This is consistent with the function of EDTA, which is
to increase Pb translocation (Figure 10A).
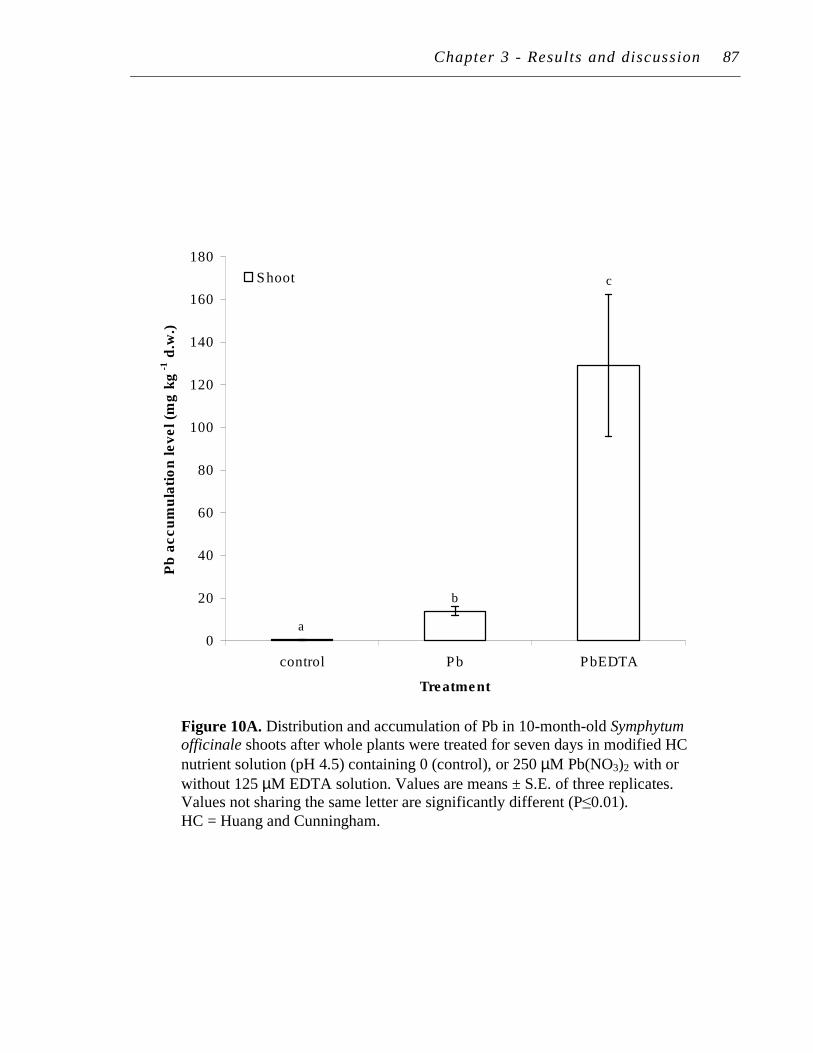
Chapter 3 - Results and discussion 87
Figure 10A. Distribution and accumulation of Pb in 10-month-old Symphytum
officinale shoots after whole plants were treated for seven days in modified HC
nutrient solution (pH 4.5) containing 0 (control), or 250 µM Pb(NO3)2 with or
without 125 µM EDTA solution. Values are means ± S.E. of three replicates. Values not sharing the same letter are significantly different (P≤0.01). HC = Huang and Cunningham.
c
b
a0
20
40
60
80
100
120
140
160
180
control Pb PbEDTA
Treatment
Pb
accu
mu
lati
on
level (m
g k
g-1
d.w
.) …
.
Shoot
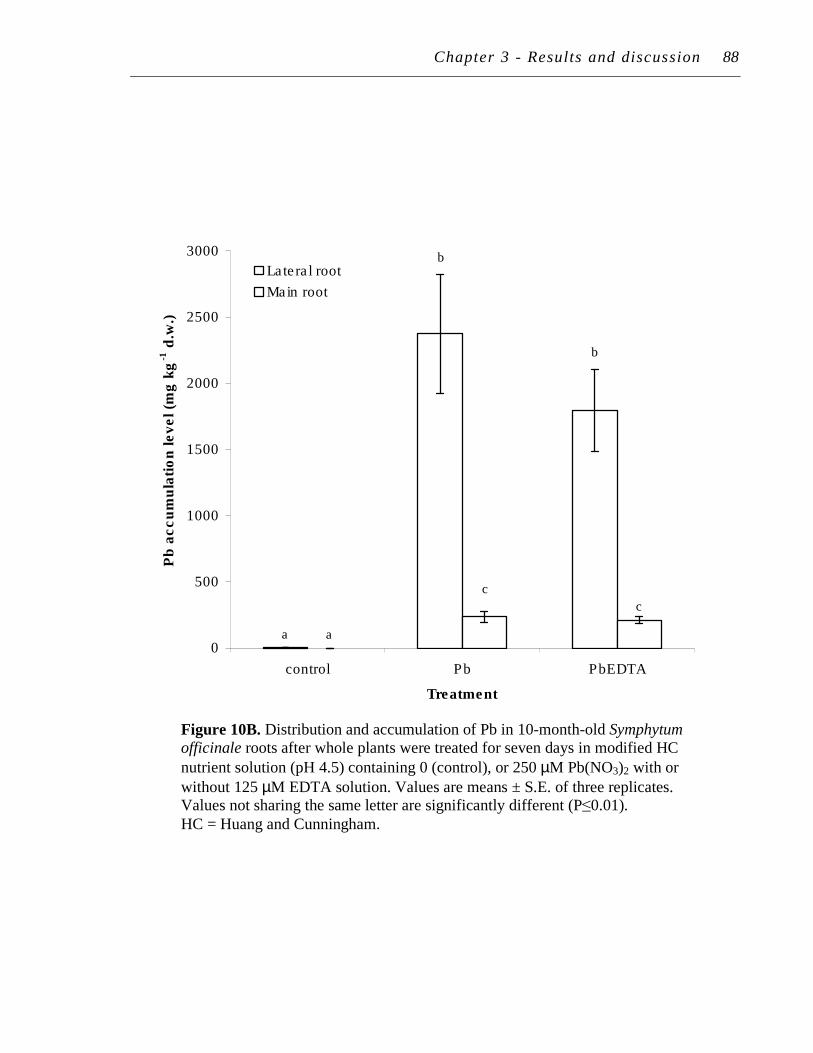
Chapter 3 - Results and discussion 88
a
b
b
a
c
c
0
500
1000
1500
2000
2500
3000
control Pb PbEDTA
Treatment
Pb
ac
cu
mu
lati
on
le
ve
l (m
g k
g-1
d.w
.)…
.. .. Lateral root
Main root
Figure 10B. Distribution and accumulation of Pb in 10-month-old Symphytum
officinale roots after whole plants were treated for seven days in modified HC
nutrient solution (pH 4.5) containing 0 (control), or 250 µM Pb(NO3)2 with or
without 125 µM EDTA solution. Values are means ± S.E. of three replicates. Values not sharing the same letter are significantly different (P≤0.01). HC = Huang and Cunningham.
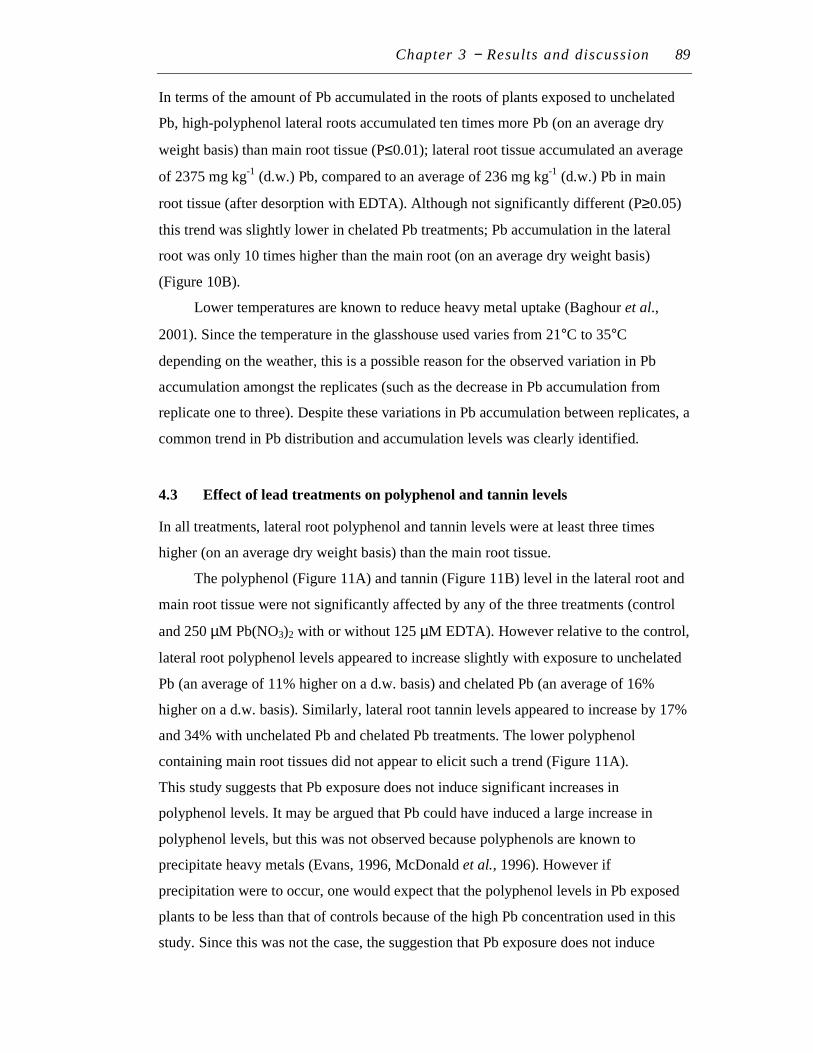
Chapter 3 − Results and discussion 89
In terms of the amount of Pb accumulated in the roots of plants exposed to unchelated
Pb, high-polyphenol lateral roots accumulated ten times more Pb (on an average dry
weight basis) than main root tissue (P≤0.01); lateral root tissue accumulated an average
of 2375 mg kg-1 (d.w.) Pb, compared to an average of 236 mg kg-1 (d.w.) Pb in main
root tissue (after desorption with EDTA). Although not significantly different (P≥0.05)
this trend was slightly lower in chelated Pb treatments; Pb accumulation in the lateral
root was only 10 times higher than the main root (on an average dry weight basis)
(Figure 10B).
Lower temperatures are known to reduce heavy metal uptake (Baghour et al.,
2001). Since the temperature in the glasshouse used varies from 21°C to 35°C
depending on the weather, this is a possible reason for the observed variation in Pb
accumulation amongst the replicates (such as the decrease in Pb accumulation from
replicate one to three). Despite these variations in Pb accumulation between replicates, a
common trend in Pb distribution and accumulation levels was clearly identified.
4.3 Effect of lead treatments on polyphenol and tannin levels
In all treatments, lateral root polyphenol and tannin levels were at least three times
higher (on an average dry weight basis) than the main root tissue.
The polyphenol (Figure 11A) and tannin (Figure 11B) level in the lateral root and
main root tissue were not significantly affected by any of the three treatments (control
and 250 µM Pb(NO3)2 with or without 125 µM EDTA). However relative to the control,
lateral root polyphenol levels appeared to increase slightly with exposure to unchelated
Pb (an average of 11% higher on a d.w. basis) and chelated Pb (an average of 16%
higher on a d.w. basis). Similarly, lateral root tannin levels appeared to increase by 17%
and 34% with unchelated Pb and chelated Pb treatments. The lower polyphenol
containing main root tissues did not appear to elicit such a trend (Figure 11A).
This study suggests that Pb exposure does not induce significant increases in
polyphenol levels. It may be argued that Pb could have induced a large increase in
polyphenol levels, but this was not observed because polyphenols are known to
precipitate heavy metals (Evans, 1996, McDonald et al., 1996). However if
precipitation were to occur, one would expect that the polyphenol levels in Pb exposed
plants to be less than that of controls because of the high Pb concentration used in this
study. Since this was not the case, the suggestion that Pb exposure does not induce
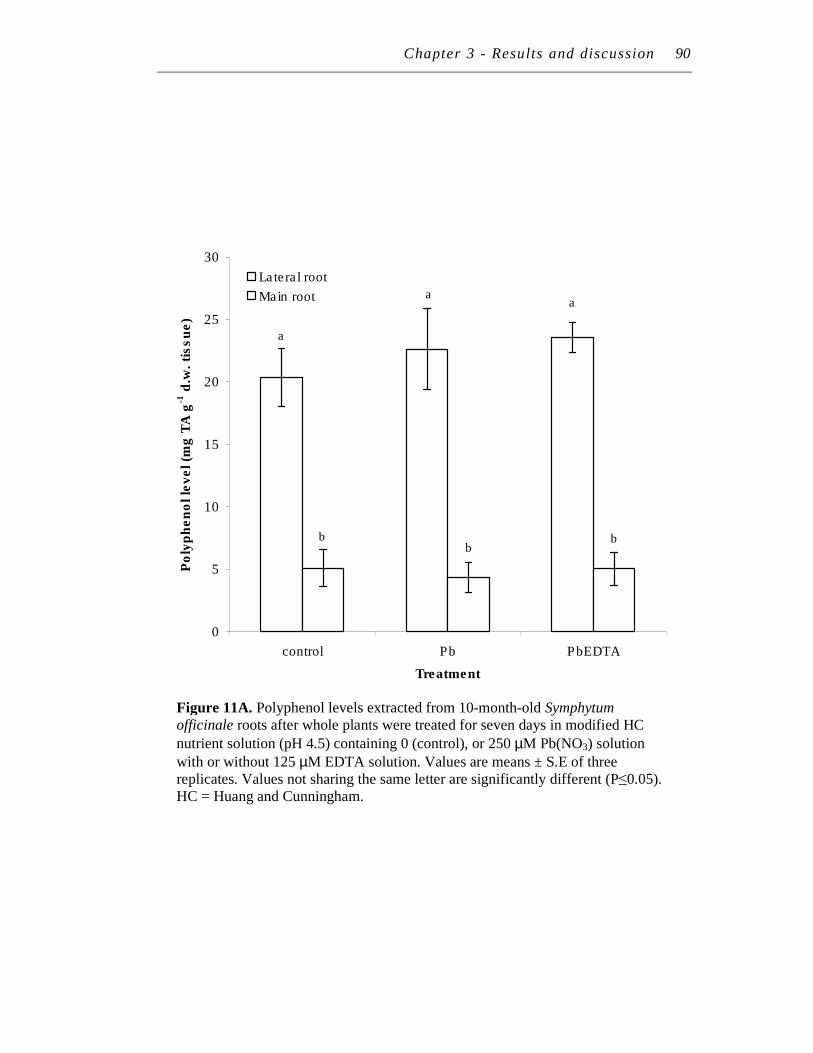
Chapter 3 - Results and discussion 90
Figure 11A. Polyphenol levels extracted from 10-month-old Symphytum
officinale roots after whole plants were treated for seven days in modified HC
nutrient solution (pH 4.5) containing 0 (control), or 250 µM Pb(NO3) solution
with or without 125 µM EDTA solution. Values are means ± S.E of three replicates. Values not sharing the same letter are significantly different (P≤0.05). HC = Huang and Cunningham.
a
aa
bb
b
0
5
10
15
20
25
30
control Pb PbEDTA
Treatment
Po
lyp
he
no
l le
ve
l (m
g T
A g
-1 d
.w. ti
ss
ue
) ..
Lateral root
Main root
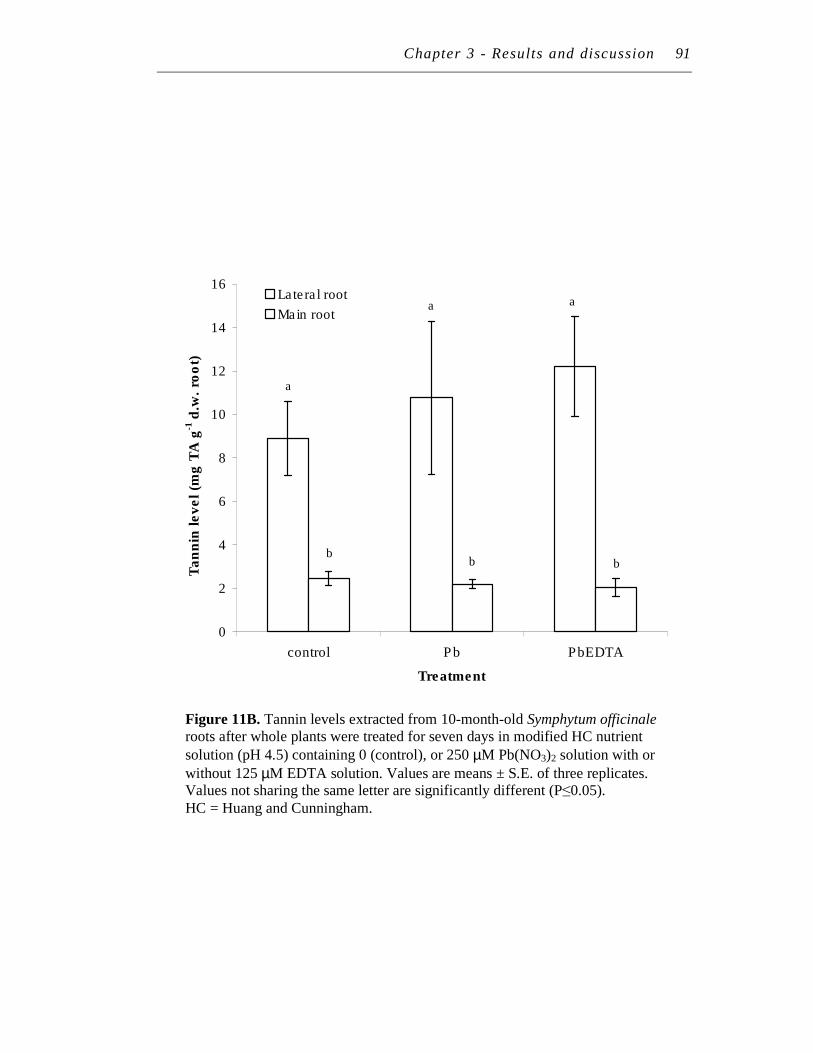
Chapter 3 - Results and discussion 91
Figure 11B. Tannin levels extracted from 10-month-old Symphytum officinale
roots after whole plants were treated for seven days in modified HC nutrient
solution (pH 4.5) containing 0 (control), or 250 µM Pb(NO3)2 solution with or
without 125 µM EDTA solution. Values are means ± S.E. of three replicates. Values not sharing the same letter are significantly different (P≤0.05). HC = Huang and Cunningham.
aa
a
bbb
0
2
4
6
8
10
12
14
16
control Pb PbEDTA
Treatment
Ta
nn
in l
evel
(mg
TA
g-1
d.w
. ro
ot)
..
Lateral root
Main root
Chapter 3 − Results and discussion 92
significant increases in polyphenol levels still holds well. Another reason is that after
seven days of Pb treatment, polyphenol polymerisation may occur, causing a reduction
in the extractability of polyphenols. The observation of stunted root growth and
browning of roots after Pb treatment support this.
4.4 Transmission electron microscopy (TEM)
Sections for transmission electron microscopy were made from the entire lateral root
cross-section or, in the case of the large main roots, towards the epidermis (Figure 12).
All the TEM observations were performed on unstained root sections, as Pb particles
were sufficiently electron dense to contrast with the tissue. Pb particles generally
appeared as distinctive dark fine grains or as dark heavy deposits. In control plants, no
Pb particles were seen (Plates 5A and B).
In the lateral root of plants exposed to unchelated Pb, Pb particles were easily
found in sections. Most of the fine Pb grains were found in the middle lamella region
(Plates 6, 7, 8), possibly due to chelation to the pectin carboxyl groups. Interestingly in
contrast, all the dark heavy Pb deposits were found along (and some fusing to) the
primary cell wall region/plasma membrane interface (Plates 7 and 8). Such locality is
consistent with Pb deposits observed by TEM and confirmed by X-ray microanalysis in
Sesbania drumondii root cells (Sahi et al., 2002). Similar observations of Pb-laden
dictyosomes vesicles fusing and discharing Pb into extracellular space have been
reported (Malone et al., 1974; Qureshi et al.,1986). In main root tissues of unchelated
Pb-treated plants, very little or no Pb could be detected in the primary cell wall region
of the sections observed (Plate 9). However, a rare section did show the same location
and level of Pb deposits as the lateral roots (Plate 10). Since the main root TEM sections
were taken in from the epidermis region, it is likely that the heavy Pb deposits in this
plate were from the root epidermis (where most polyphenols are found), whilst the
observations with a lack of Pb were made from cells towards the inner root tissues
(Figure 12). Overall, more Pb appeared to accumulate in each lateral root TEM section
when compared to the main root tissue. This supports the Pb levels found in these
tissues.
The apparent outward flow of Pb from the cytoplasm is supported by TEM
micrographs as: (i) in unchelated Pb treatments, small vesicles containing heavy Pb
deposits appeared to fuse or pass through the plasma membrane, into the primary cell

Chapter 3 − Results and discussion 93
wall region of lateral roots (Plates 7 and 8) and (ii) this fusion appeared only in highly
vacuolated cells with little cytoplasmic content remaining (Plate 10).
In chelated Pb treatments, Pb in both root types was more difficult to find (despite
having similar Pb levels in roots as the unchelated Pb treatments). Malone et al., (1974)
also reported this observation. In their study with corn, no Pb precipitate was ever
observed on the root’s surface when EDTA was added to the medium, regardless of the
amount of Pb in the solution. One possible reason is that in chelated form, less Pb
particles coagulate into easily detectable heavy deposits.
This more soluble Pb form would also be more effective for translocation to the shoots;
Pb may have also moved deeper into the root tissue towards, or as supported by the Pb
levels in shoots, into the xylem. Of the observations made, Pb appeared as fine particles
in the middle lamella and cytoplasmic layer against the cell wall (Plate 11). Possible Pb
particles were also observed in the vacuole (Plate 12) and in the cell wall (Plate 13).
What about tannin observations? Given their strong affinity to bind to proteins
(Getachew and Becker 1998), tannins are mostly in the vacuole of cells and bound as
esters in the primary cell wall/plasma membrane (see introduction section) in living
plant tissues. As the cell ages (in this case due to Pb stress) and loses its cytoplasmic
contents, tannins commonly become adsorbed onto the cell wall (Ximenes, 1998).
Given their strong affinity for osmium, tannins usually appear as a continuous black
layer along the cell wall or as large black shades in the vacuole in transmission electron
micrographs (Parham and Kaustinen, 1976; Mueller and Beckman, 1976). In these
results, heavy black staining was only observed in vesicles fusing to the primary cell
wall/ plasma membrane interface. But as already mentioned earlier these were identified
as Pb deposits. Definitive location of tannins, even in the controls, was not observed in
Root epidermis
lateral root main root
TEM section region
Figure 12. Region of TEM section in lateral and main root.
Chapter 3 − Results and discussion 94
the root sections despite being clearly present in assays. This may be because (i) the
concentration of the tannins were too low for microscopy detection without staining
(lateral roots contained 0.8% d.w. tannins; main roots 0.4% d.w.) and/or (ii) the ethanol
and acetone based dehydration step during TEM sample preparation may have reduced
the tannin content of the roots prior to observation. However, we cannot exclude the
possibility that the dark matter enclosed in vesicles is tannins or cytoplasmic Pb-tannin
complexes fusing with cell wall. This confirmation would require transmission electron
microscope with an EDX or X-ray microanaylsis attachment and mass spectroscopy
facilities, neither of which was available at the time of this experiment.
Although tannins were not clearly visible on the TEM micrographs, condensed
tannins are known to occur in the primary cell wall and suberin layer (between the cell
wall and plasma membrane) of plant cells (Fry 1984; Chalker-Scott and Krahmer,
1989). Thus, the location of heavy Pb deposits in this region could suggest that
polyphenols (in addition to other compounds such as pectins) chelate Pb ions and is
involved in accumulation and tolerance of Pb (chelation-based tolerance mechanism 1;
see introduction).
Pb appears to be transported both apoplastically and symplastically in both forms
of Pb treatment. The location of Pb in the cell wall, indicative of apoplastic Pb
transport, is consistent with Pb exposure in Allium cepa L. (Wierzbicka, 1998) and
Chamecytisus proliferus (L.f.) (Jarvis and Leung, 2001). The occurrence of Pb in
vesicles and vacuoles supports symplastic transport. Additionally, Pb in vacuoles and
vesicles is consistent with isolation-based tolerance mechanism 1 (Clemens, 2001; Hall,
2002; Wierzbicka, 1995).
Overall these observations are meaningful as (i) TEM observations in other
publications (see above) showed similar results and (ii) studies by Antosiewicz and
Wierzbicka (1999) and Qureshi et al.,(1986) showed that Pb loss, and thus artifactual
re-distribution of Pb during tissue preparation for TEM observations, was minimal
during chemical (glutaldehyde and osmium tetroxide) or physical (freeze drying)
sample fixation for TEM.

Plate 5. A.
Transmission electron micrograph at 30,000 X magnification of
an ultra-thin section of Symphytum officinale lateral root treated
with 0 µM Pb(NO3)2 (control) for seven days.
Key:
1 Plasmalemma
2 Middle lamella free of Pb particles
3 Intercellular space
B.
Transmission electron micrograph at 10,000 X magnification of an
ultra-thin section of Symphytum officinale main root treated with 0
µM Pb(NO3)2 (control) for seven days.
Key:
1 Plasmalemma
2 Middle lamella
3 Intercellular space

Chapter 3 - Results and discussion 112
30x 200 nm
10x 500 nm
1
2
3
1
2
3
96
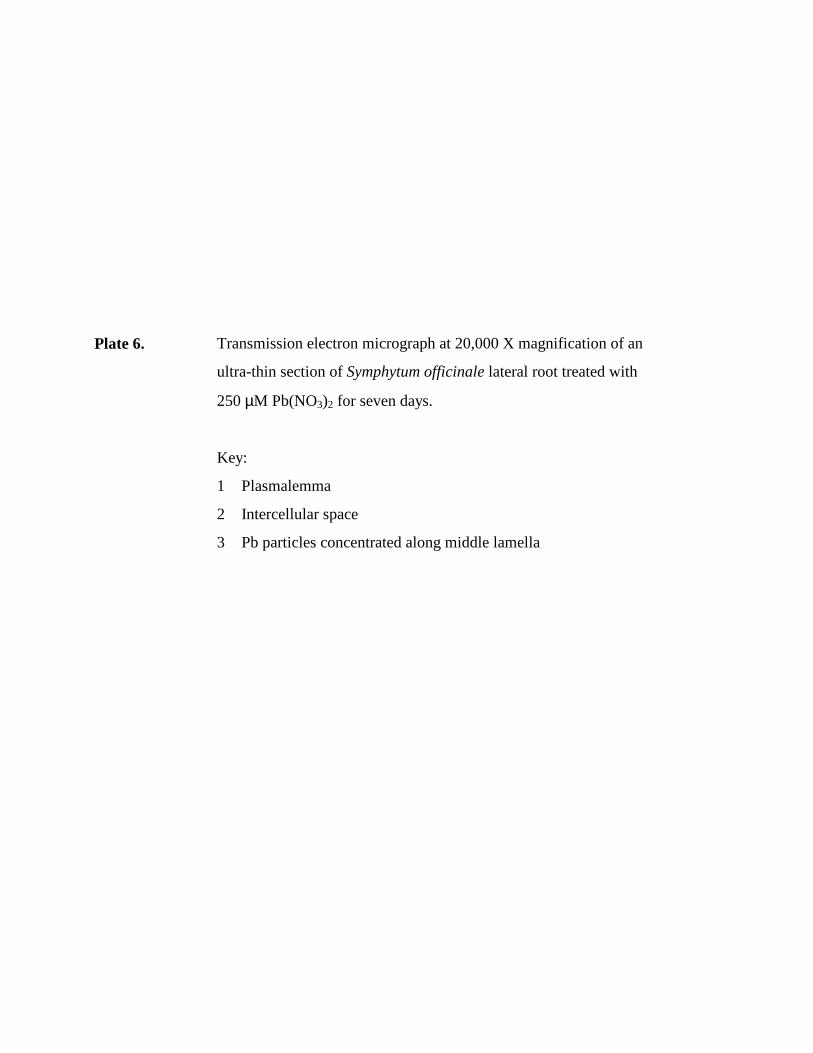
Plate 6.
Transmission electron micrograph at 20,000 X magnification of an
ultra-thin section of Symphytum officinale lateral root treated with
250 µM Pb(NO3)2 for seven days.
Key:
1 Plasmalemma
2 Intercellular space
3 Pb particles concentrated along middle lamella
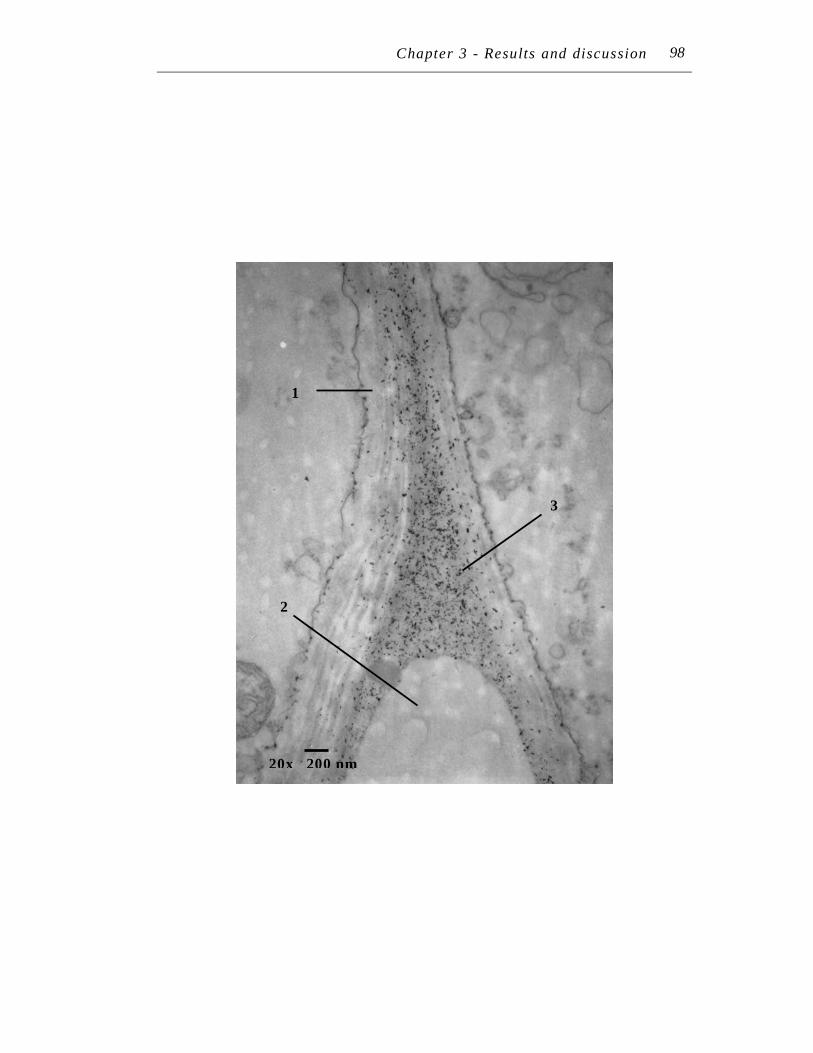
Chapter 3 - Results and discussion 108
20x 200 nm
3
1
2
98
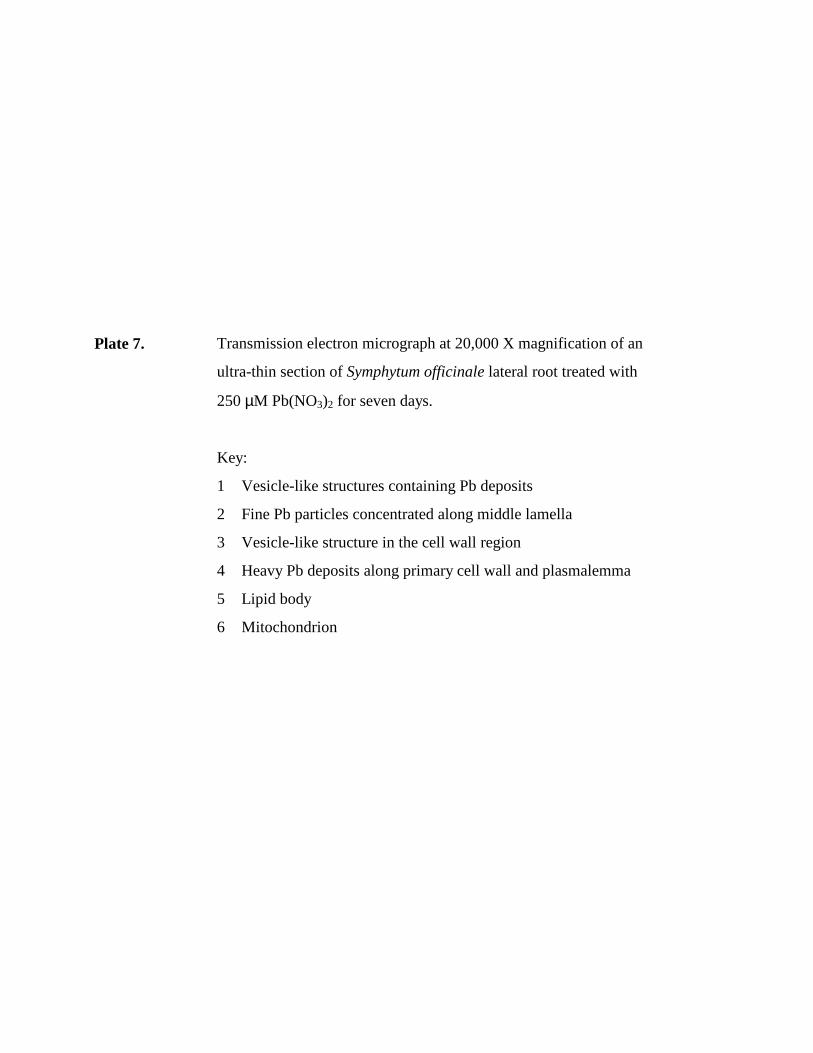
Plate 7.
Transmission electron micrograph at 20,000 X magnification of an
ultra-thin section of Symphytum officinale lateral root treated with
250 µM Pb(NO3)2 for seven days.
Key:
1 Vesicle-like structures containing Pb deposits
2 Fine Pb particles concentrated along middle lamella
3 Vesicle-like structure in the cell wall region
4 Heavy Pb deposits along primary cell wall and plasmalemma
5 Lipid body
6 Mitochondrion
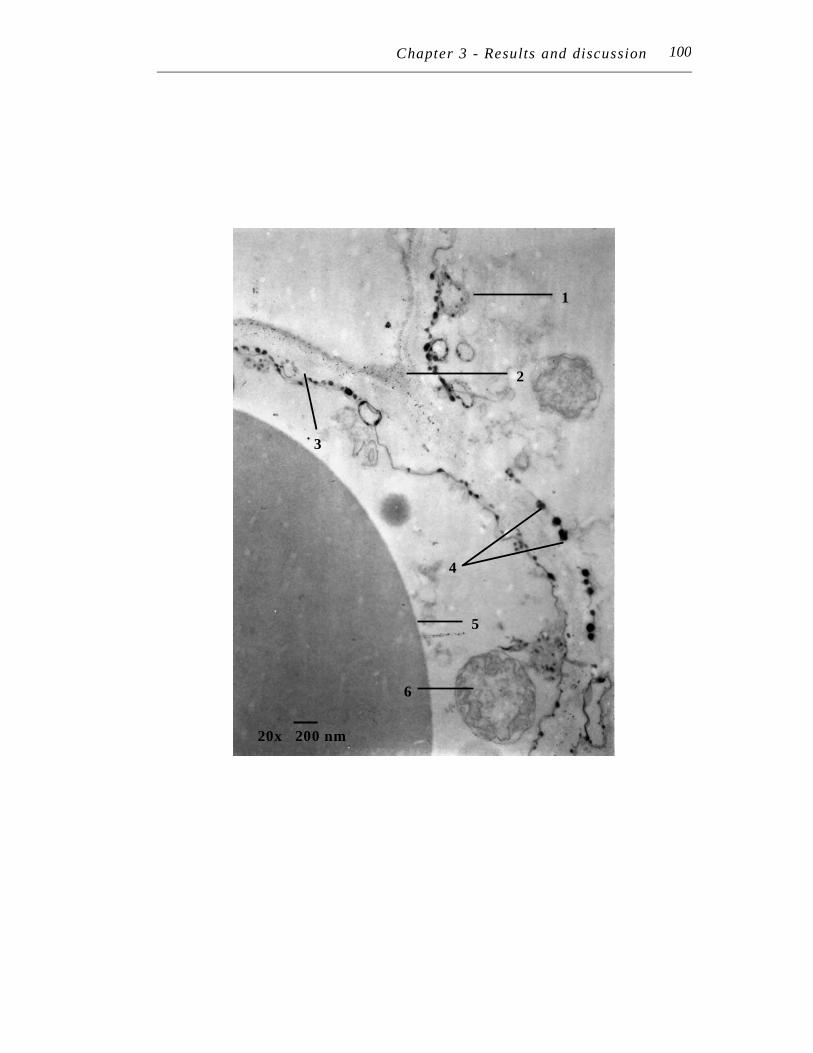
Chapter 3 - Results and discussion 108
20x 200 nm
3
5
6
1
4
2
100
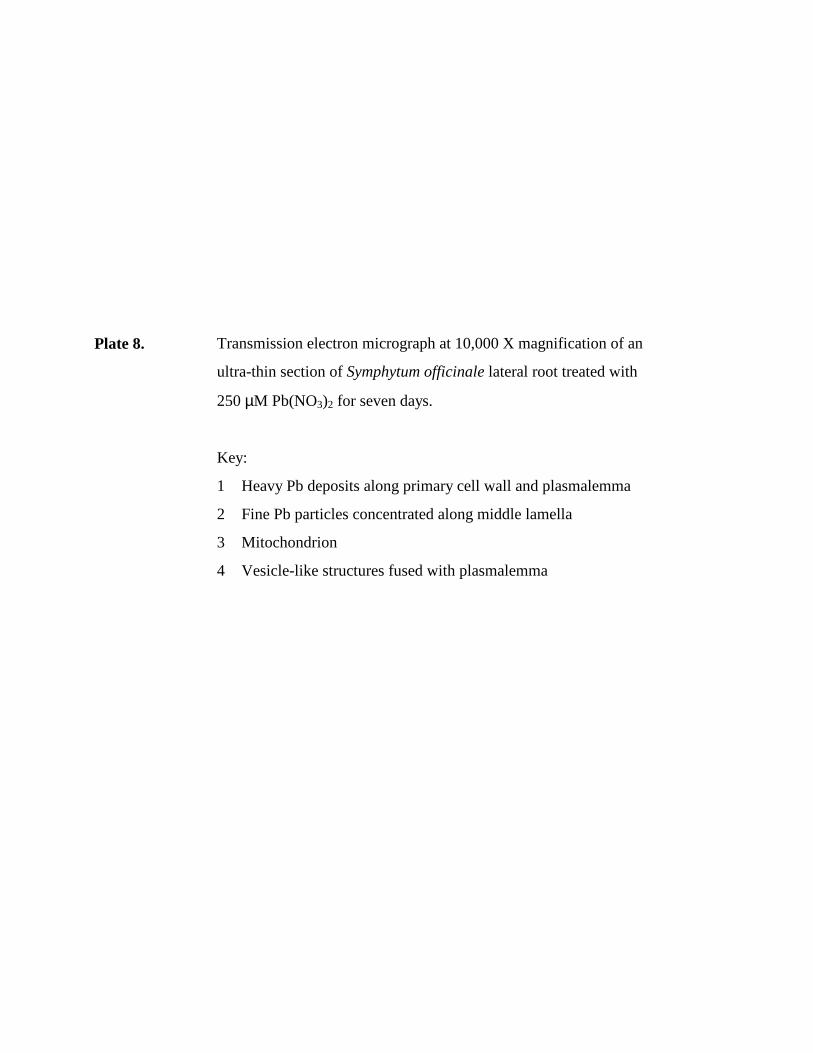
Plate 8.
Transmission electron micrograph at 10,000 X magnification of an
ultra-thin section of Symphytum officinale lateral root treated with
250 µM Pb(NO3)2 for seven days.
Key:
1 Heavy Pb deposits along primary cell wall and plasmalemma
2 Fine Pb particles concentrated along middle lamella
3 Mitochondrion
4 Vesicle-like structures fused with plasmalemma
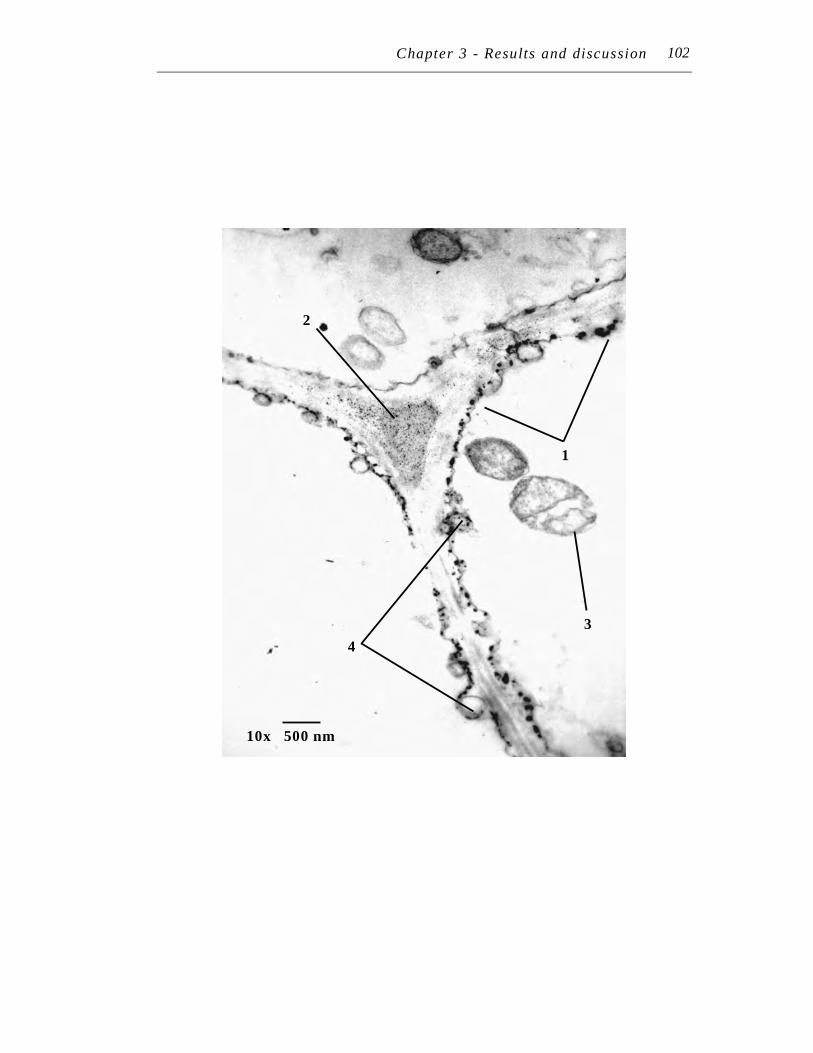
Chapter 3 - Results and discussion 108
10x 500 nm
3
1
4
2
102

Plate 9.
Transmission electron micrograph at 6,000 X magnification of an
ultra-thin section of Symphytum officinale main root treated with
250 µM Pb(NO3)2 for seven days.
Key:
1 Starch grain
2 Lipid body
3 Pb particles along primary cell wall and plasmalemma
4 Middle lamella free of Pb particles
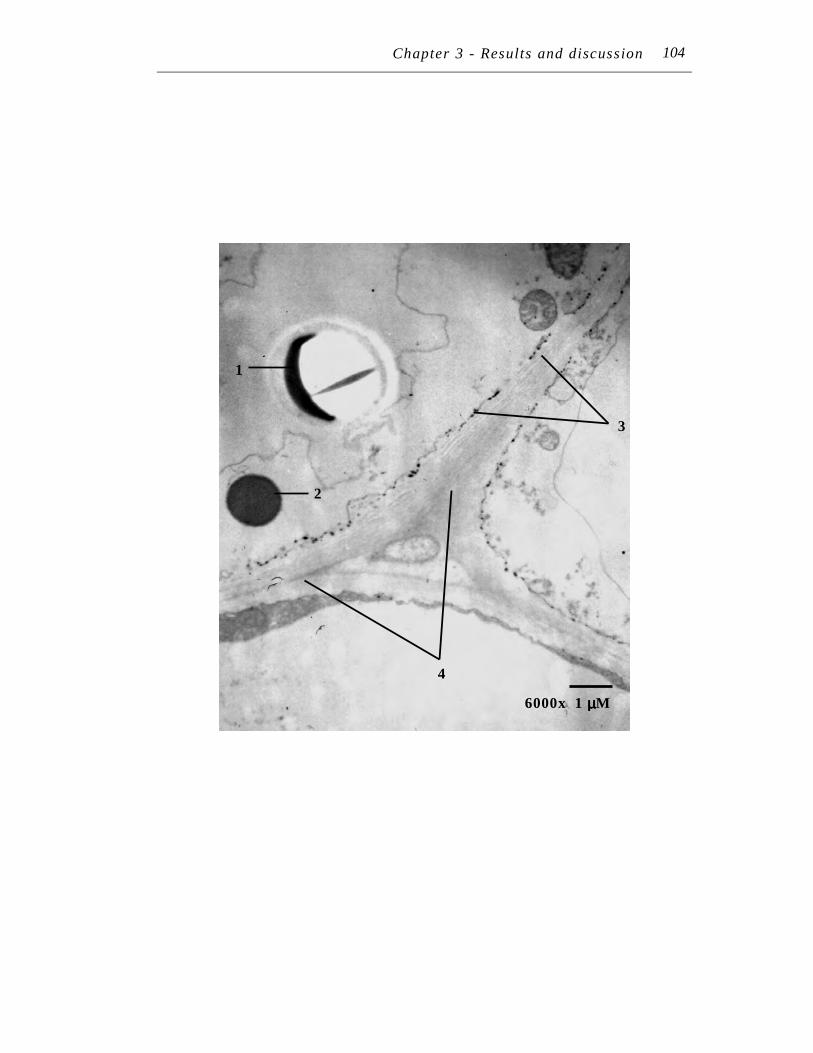
Chapter 3 - Results and discussion 112
6000x 1 µµµµM
3
1
4
2
104
Plate 10.
Transmission electron micrograph at 7,500 X magnification of an
ultra-thin section of Symphytum officinale main root treated with
250 µM Pb(NO3)2 for seven days.
Key:
1 Primary cell wall
2 Heavy Pb particles in middle lamella
3 Plasma membrane of cell with cytoplasmic contents
4 Plastid
5 Vacuole (larger circle) and vesicle (smaller circle)
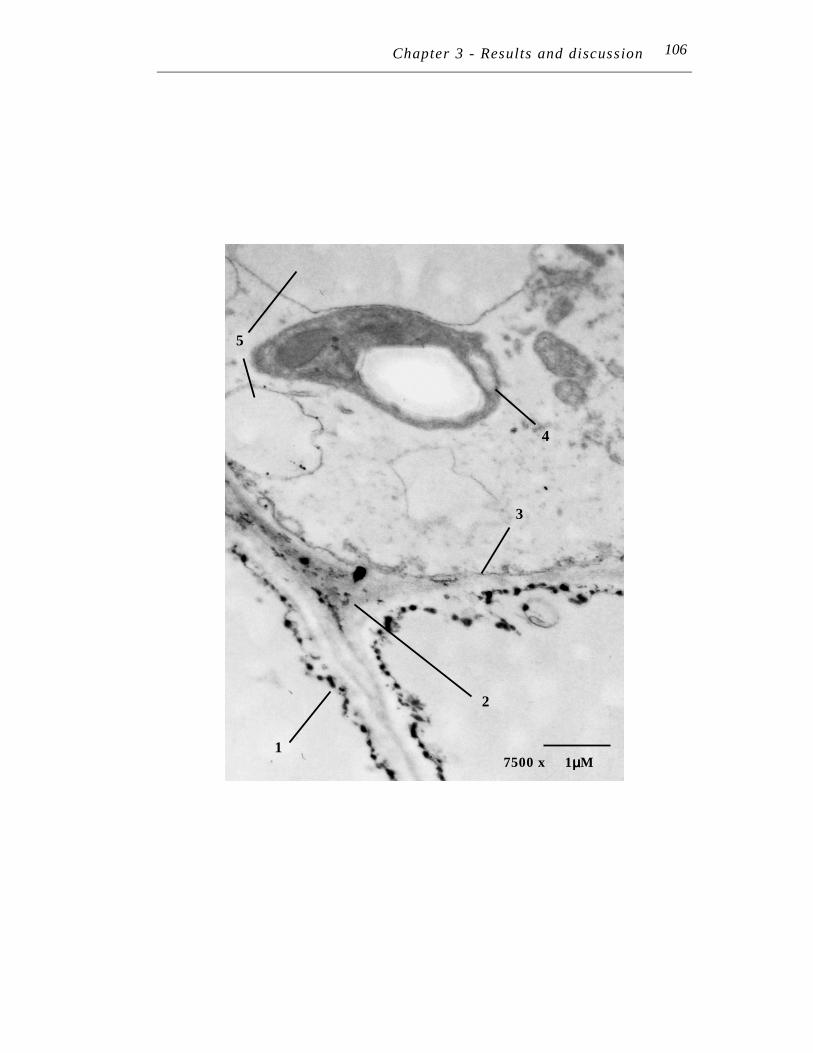
Chapter 3 - Results and discussion 112
2
5
4
3
7500 x 1µµµµM 1
106
Plate 11.
Transmission electron micrograph at 15,000 X magnification of an
ultra-thin section of Symphytum officinale lateral root treated with
250 µM Pb(NO3)2 plus 125 µM EDTA for seven days.
Key:
1 Intercellular space
2 Vesicle-like structures in middle lamella
3 Pb particles deposited in middle lamella
4 Cytoplasmic material against cell wall; very fine Pb particles
present
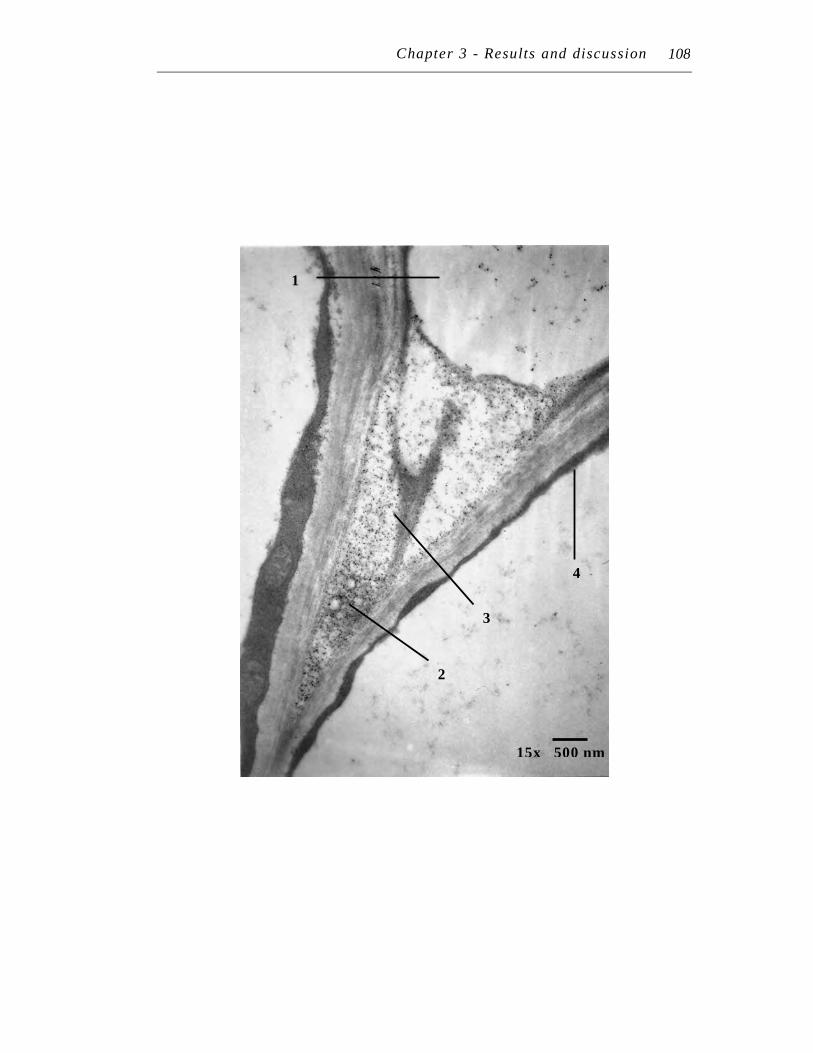
Chapter 3 - Results and discussion 108
15x 500 nm
3
1
4
2
108
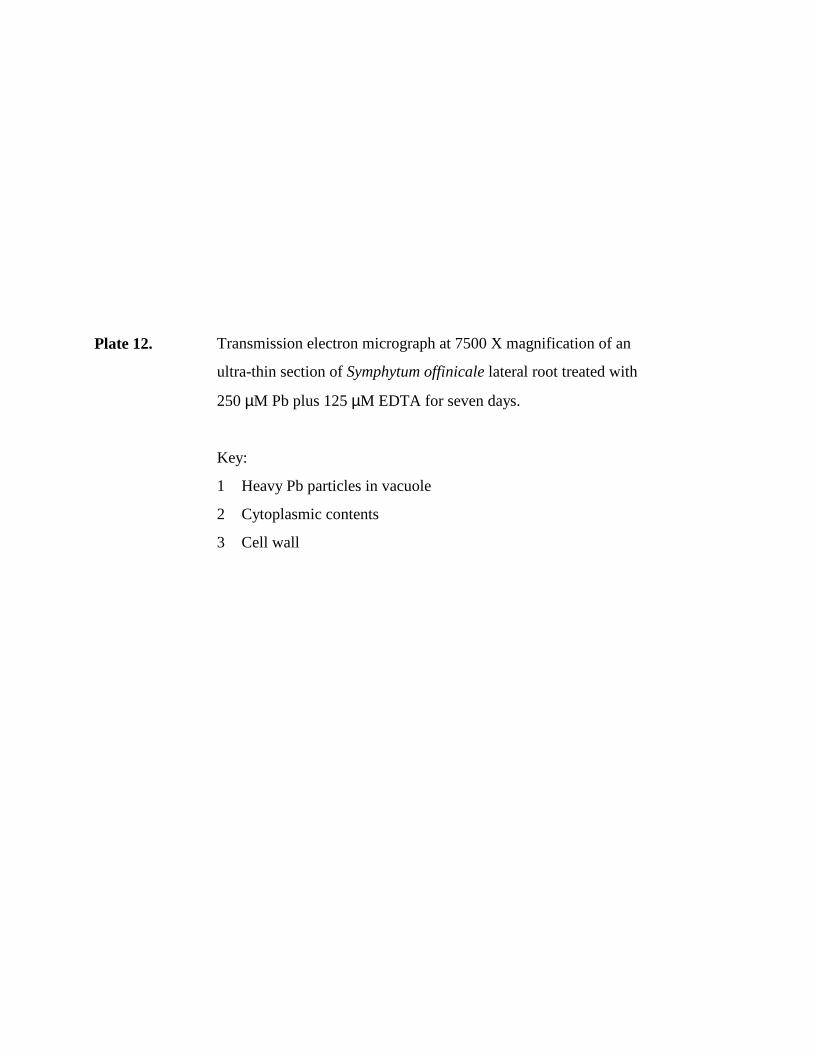
Plate 12.
Transmission electron micrograph at 7500 X magnification of an
ultra-thin section of Symphytum offinicale lateral root treated with
250 µM Pb plus 125 µM EDTA for seven days.
Key:
1 Heavy Pb particles in vacuole
2 Cytoplasmic contents
3 Cell wall
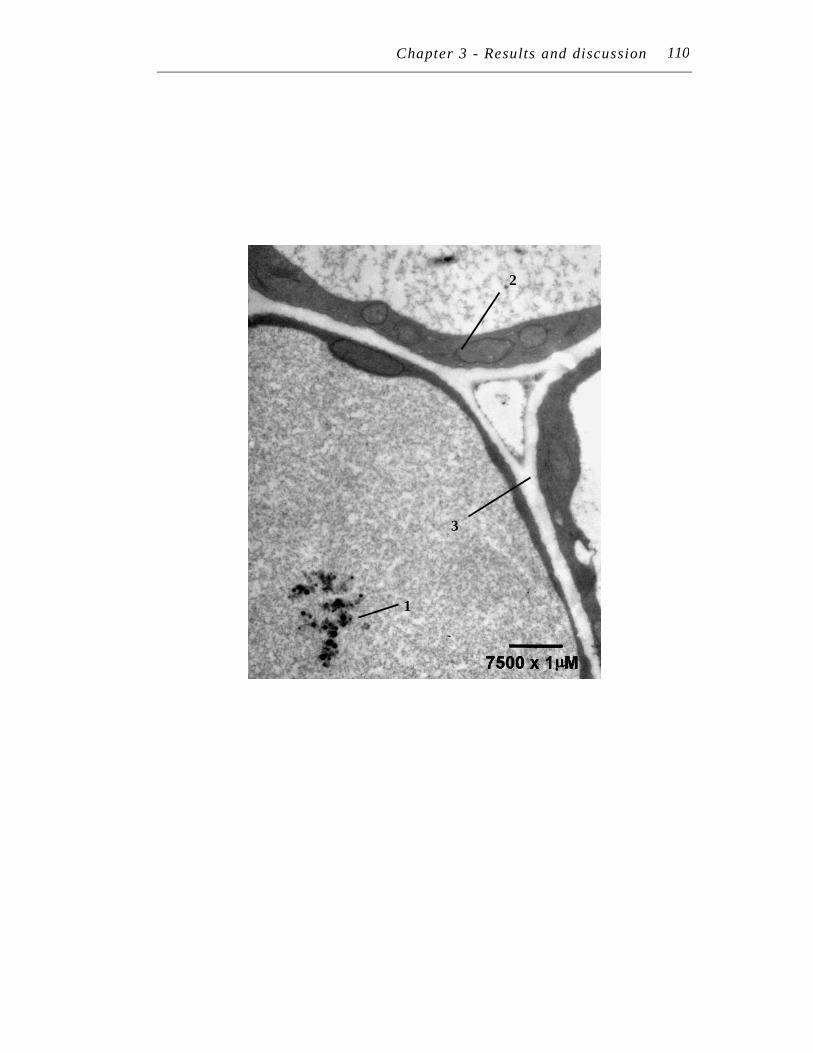
Chapter 3 - Results and discussion 108
1
3
2
110
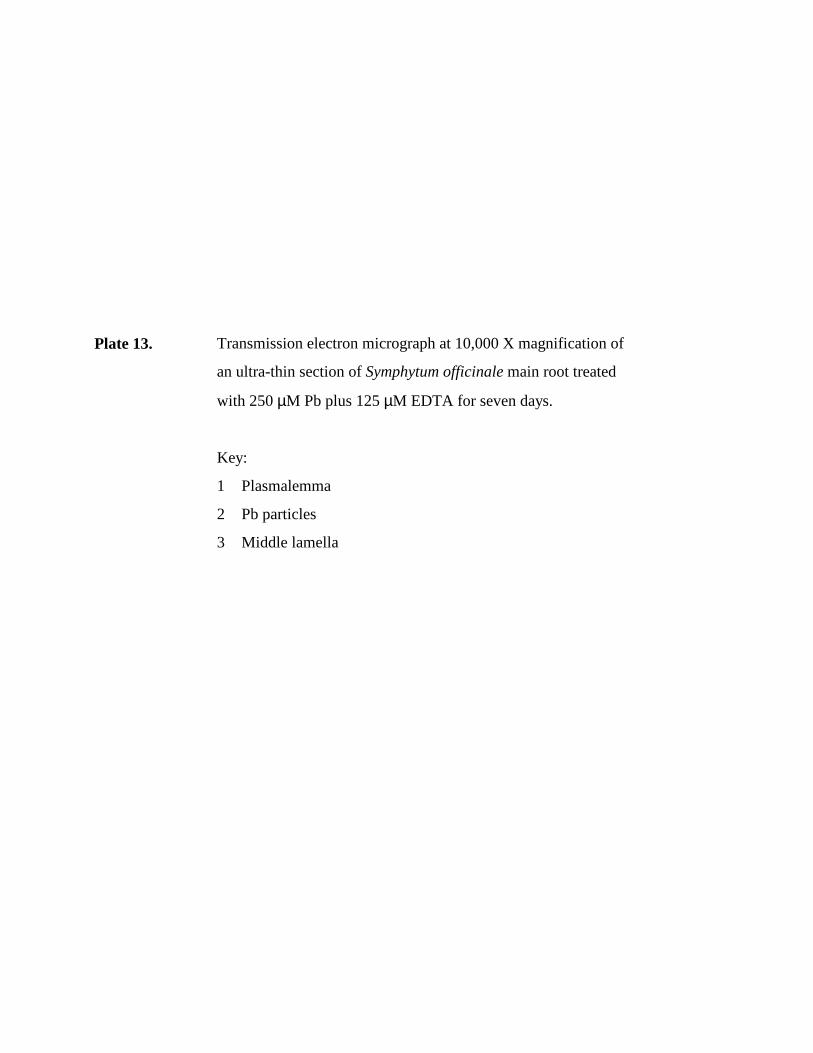
Plate 13.
Transmission electron micrograph at 10,000 X magnification of
an ultra-thin section of Symphytum officinale main root treated
with 250 µM Pb plus 125 µM EDTA for seven days.
Key:
1 Plasmalemma
2 Pb particles
3 Middle lamella
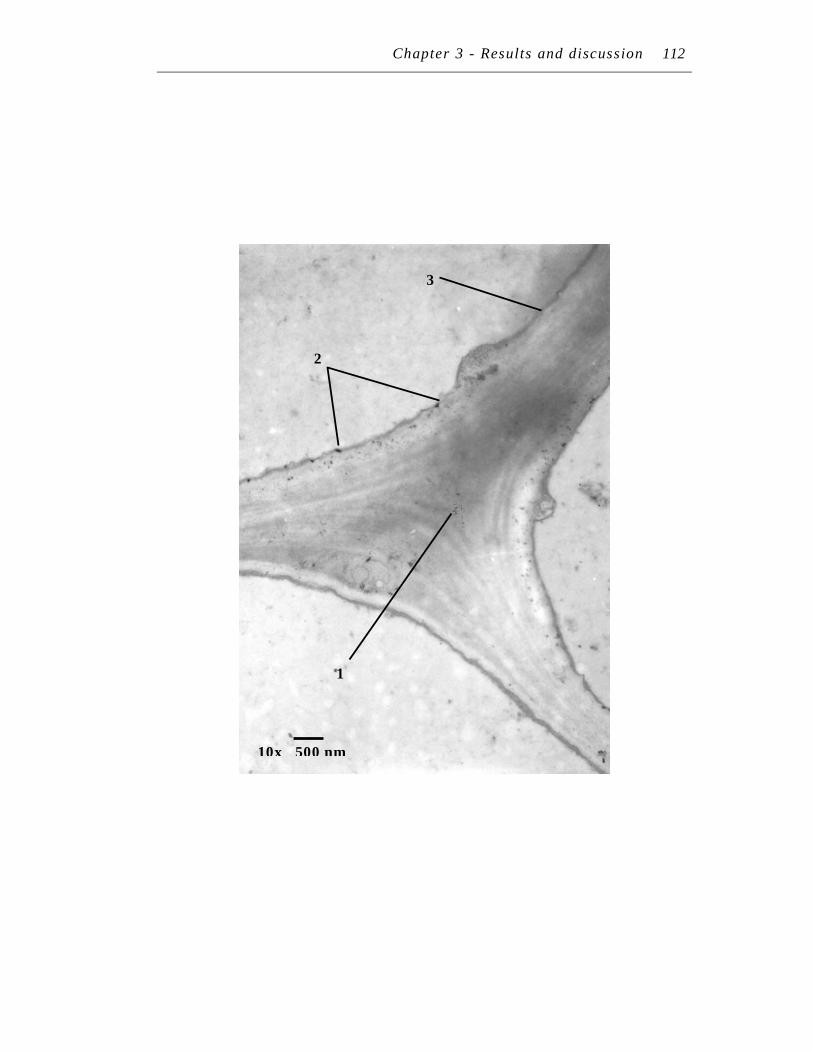
Chapter 3 - Results and discussion 112
10x 500 nm
3
1
2
112
Chapter 3 − Results and discussion 113
5 CORRELATION BETWEEN TANNIN AND LEAD ACCUMULATION
Taking the Pb, polyphenol and TEM findings into consideration, it is tempting to
conclude that there is an in vivo trend between pre-existing polyphenol and tannin levels
with Pb accumulation; the root with the more polyphenols has more Pb-polyphenol
chelating sites, and hence higher Pb levels. However, it is important to note that whilst
this trend supports the idea that chelation of Pb to tannins may play an important role in
Pb accumulation and tolerance, there is a possibility that other (perhaps more
significant) factor(s) were responsible for the higher level of Pb found in the lateral
roots. These include root volume in a hydroponic system, relative age of root tissue and
other chelating compounds.
5.1 Other possible factors for lead accumulation trends
5.1.1 Root volume
At the whole plant level, the domination of lateral roots in the hydroponic system may
lead to higher Pb accumulation in lateral roots than main roots. However if volume was
a factor, one would have expected more Pb dilution and therefore lower Pb
accumulation in the lateral root tissue (on a per gram dry weight basis). Dushenkov et
al., (1995) also showed that Pb accumulation in root tissue was not dependent on root
mass: only the rate of removal was affected. From an opposing perspective, if the same
volume of the roots was compared, the surface area of the lateral root is greater than the
main root because of the smaller diameter of the roots (Figure 13). Since the surface
area of the root (i.e. epidermal tissue) appears to be the prominent location for
polyphenols, this would result in higher Pb levels in the lateral roots. Thus from this
perspective, it is impossible to distinguish between the surface area and the polyphenol
factor.
5.1.2 Root age
Young roots are often considered responsible for efficient nutrient uptake. They have
root hairs and living epidermal cells that increase surface area and absorption of
nutrients. Thus, this could be another reason why the younger lateral roots accumulated
more Pb than the older main root (Maschner, 1995).
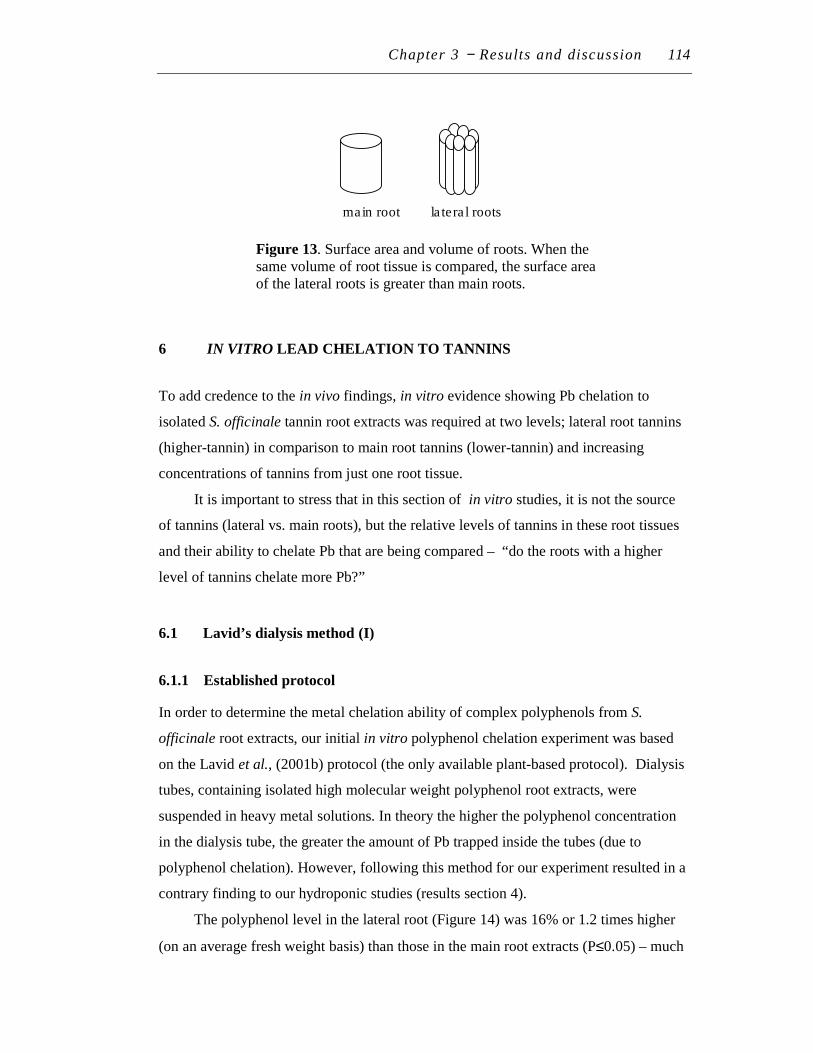
Chapter 3 − Results and discussion 114
6 IN VITRO LEAD CHELATION TO TANNINS
To add credence to the in vivo findings, in vitro evidence showing Pb chelation to
isolated S. officinale tannin root extracts was required at two levels; lateral root tannins
(higher-tannin) in comparison to main root tannins (lower-tannin) and increasing
concentrations of tannins from just one root tissue.
It is important to stress that in this section of in vitro studies, it is not the source
of tannins (lateral vs. main roots), but the relative levels of tannins in these root tissues
and their ability to chelate Pb that are being compared – “do the roots with a higher
level of tannins chelate more Pb?”
6.1 Lavid’s dialysis method (I)
6.1.1 Established protocol
In order to determine the metal chelation ability of complex polyphenols from S.
officinale root extracts, our initial in vitro polyphenol chelation experiment was based
on the Lavid et al., (2001b) protocol (the only available plant-based protocol). Dialysis
tubes, containing isolated high molecular weight polyphenol root extracts, were
suspended in heavy metal solutions. In theory the higher the polyphenol concentration
in the dialysis tube, the greater the amount of Pb trapped inside the tubes (due to
polyphenol chelation). However, following this method for our experiment resulted in a
contrary finding to our hydroponic studies (results section 4).
The polyphenol level in the lateral root (Figure 14) was 16% or 1.2 times higher
(on an average fresh weight basis) than those in the main root extracts (P≤0.05) – much
Figure 13. Surface area and volume of roots. When the same volume of root tissue is compared, the surface area of the lateral roots is greater than main roots.
main root lateral roots

Chapter 3 − Results and discussion 115
smaller than compared with hydroponic experiments. This is possibly because tannins
were extracted from fresh roots (following the Lavid dialysis method) and not freeze-
dried roots. Despite the difference in extraction and tannin levels, the trend – higher
polyphenol concentration in lateral roots – was the same. However unexpectedly, the
dialysis tube with the least polyphenols (main root extracts) trapped four times more Pb
(P≤0.05) than the tube with the most polyphenols (lateral root extracts) (Figure 15). An
opposite trend was expected if high molecular weight polyphenols like tannins were
involved in Pb accumulation. As discussed in results section 6.1.2, it is likely that
interfering compounds, more of which were in the main root extracts, may be
responsible for the observed trend.
6.1.2 Modified protocol
To make a better comparison between the Lavid dialysis method and the new in vitro
chelation method designed below, the Lavid dialysis method was repeated so that the
root tissue age (three months), method of extraction (using ball-mill ground freeze-dried
tissues), and Pb concentration were approximately the same.
The polyphenol and tannin level in 3-month-old lateral roots were six times higher
(on a dry weight basis) than in the main root tissue respectively (P≤0.05) (Figure 16).
Dialysis tubes with main root polyphenol extracts accumulated on average 24% (or 1.2
times) more Pb than those from the lateral root, despite having six times less tannins
than the lateral root (Figure 17). This was a smaller trend than the above experiment,
possibly because there was less interference compound (fructan), as they were harder to
extract from dry issue, or because of age, sample size, or natural variation between
plants. Another possibility for this trend is that lateral roots contained more low-
molecular weight polyphenols than main roots. Their accumulation and polymerisation
outside the tube could have chelated to Pb ions, thus reducing the amount of Pb
available for entry into the dialysis tube. This idea is supported by observations where,
at the end of the experiment, the Pb solution surrounding dialysis tubes (containing
lateral root polyphenols) were browner than those with main roots. However, it is likely
to be only a small factor as most of the polyphenols (based on the intensity of the
extracts) remained inside the tube (Plate 14). Despite this, the results were consistent
with the first Lavid dialysis experiment (results section 6.1.1) in which the tannin level
did not correlate to the Pb accumulation level.
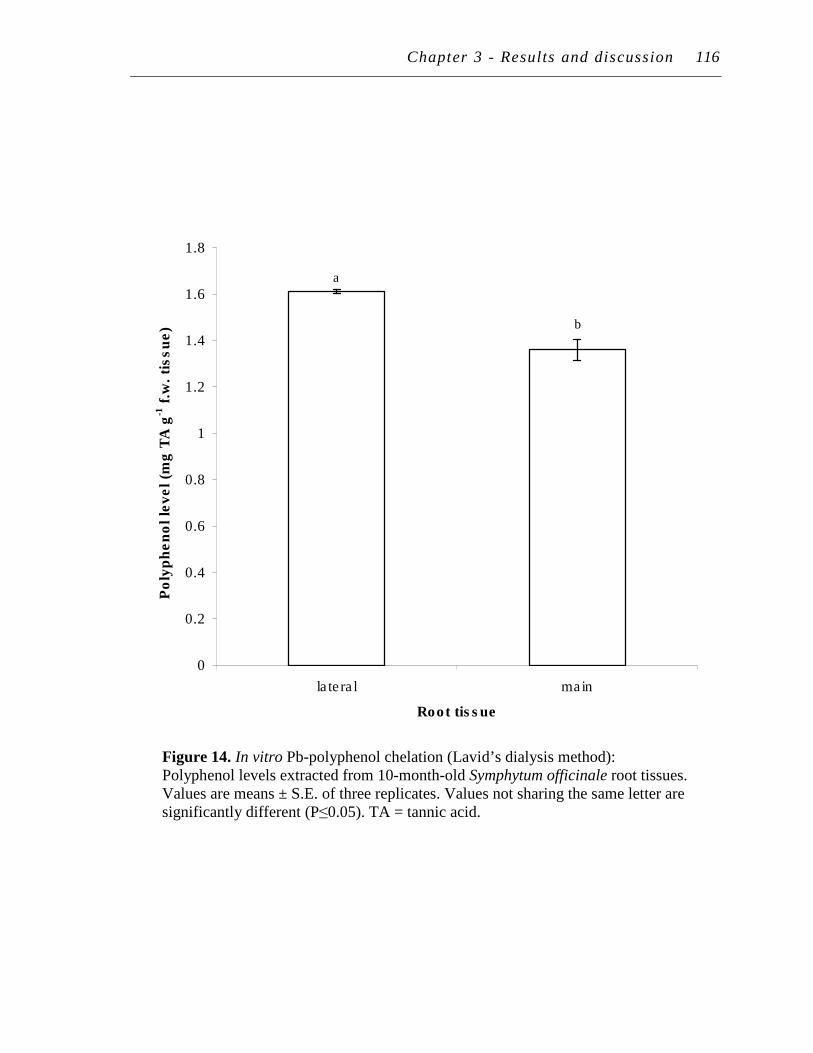
Chapter 3 - Results and discussion 116
b
a
0
0.2
0.4
0.6
0.8
1
1.2
1.4
1.6
1.8
lateral main
Root tissue
Po
lyp
hen
ol
level
(mg
TA
g-1
f.w
. ti
ssu
e)
..
Figure 14. In vitro Pb-polyphenol chelation (Lavid’s dialysis method): Polyphenol levels extracted from 10-month-old Symphytum officinale root tissues. Values are means ± S.E. of three replicates. Values not sharing the same letter are significantly different (P≤0.05). TA = tannic acid.
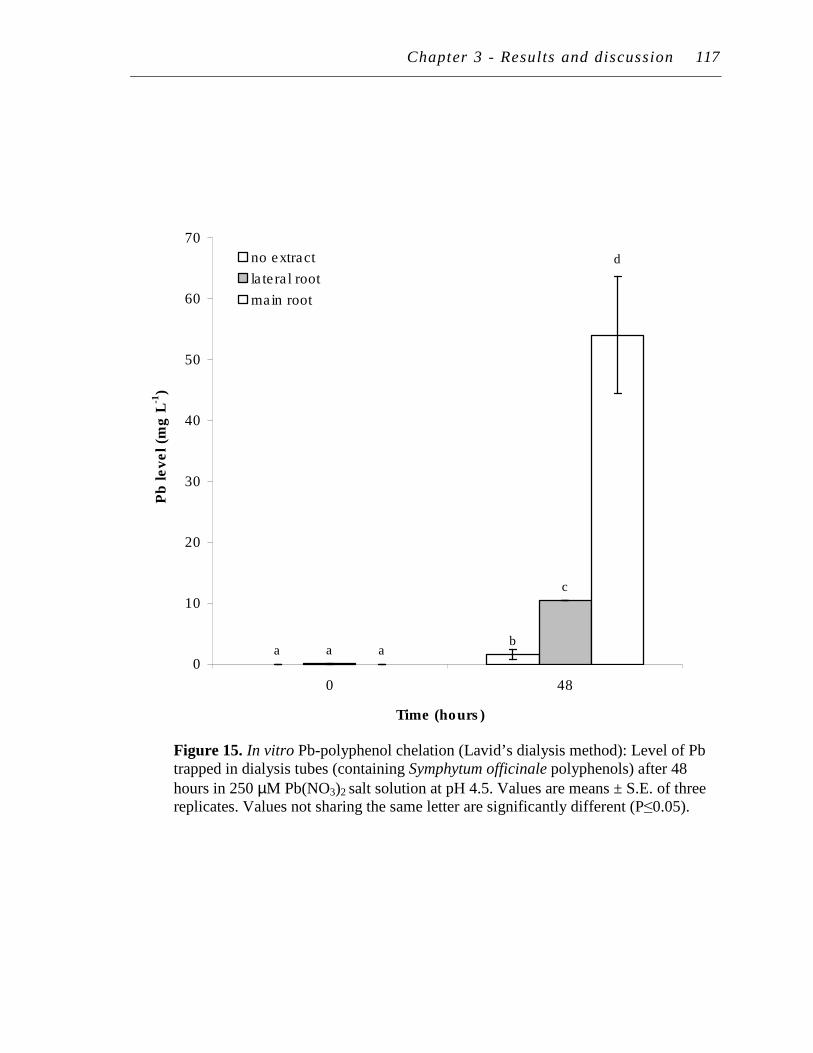
Chapter 3 - Results and discussion 117
Figure 15. In vitro Pb-polyphenol chelation (Lavid’s dialysis method): Level of Pb trapped in dialysis tubes (containing Symphytum officinale polyphenols) after 48
hours in 250 µM Pb(NO3)2 salt solution at pH 4.5. Values are means ± S.E. of three replicates. Values not sharing the same letter are significantly different (P≤0.05).
No extract
Lateral root
Main root
ba
c
a
d
a0
10
20
30
40
50
60
70
0 48
Time (hours)
Pb
level
(mg
L-1
)
no extract
lateral root
main root
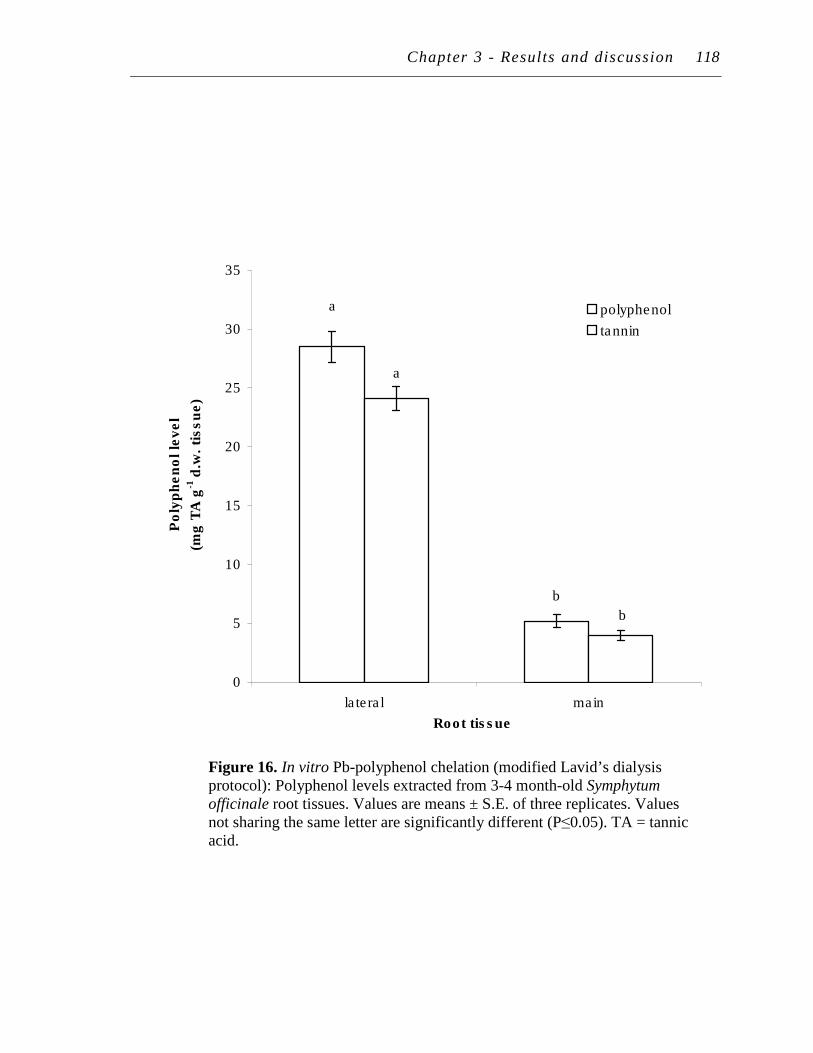
Chapter 3 - Results and discussion 118
Figure 16. In vitro Pb-polyphenol chelation (modified Lavid’s dialysis protocol): Polyphenol levels extracted from 3-4 month-old Symphytum
officinale root tissues. Values are means ± S.E. of three replicates. Values not sharing the same letter are significantly different (P≤0.05). TA = tannic acid.
b
a
b
a
0
5
10
15
20
25
30
35
lateral main
Root tissue
Po
lyp
he
no
l le
ve
l
(mg
TA
g-1
d.w
. ti
ss
ue
)
polyphenol
tannin
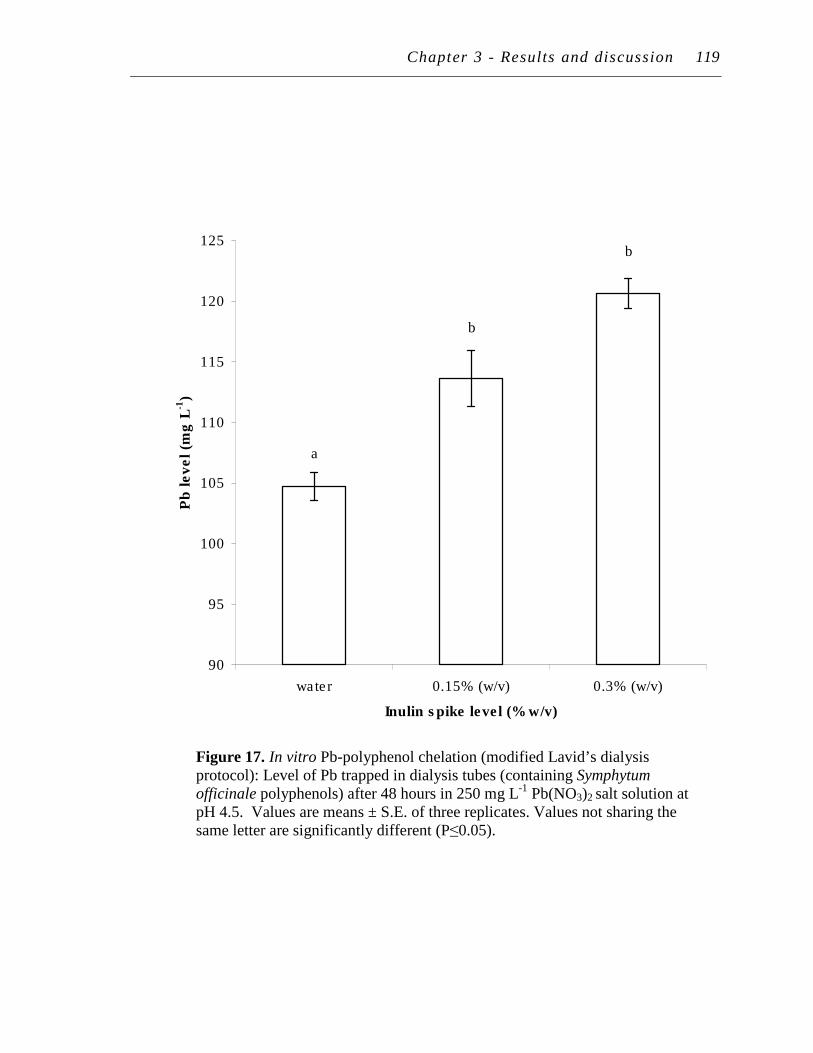
Chapter 3 - Results and discussion 119
Figure 17. In vitro Pb-polyphenol chelation (modified Lavid’s dialysis protocol): Level of Pb trapped in dialysis tubes (containing Symphytum
officinale polyphenols) after 48 hours in 250 mg L-1 Pb(NO3)2 salt solution at pH 4.5. Values are means ± S.E. of three replicates. Values not sharing the same letter are significantly different (P≤0.05).
a
b
b
90
95
100
105
110
115
120
125
water 0.15% (w/v) 0.3% (w/v)
Inulin spike level (% w/v)
Pb
level
(mg
L-1
)
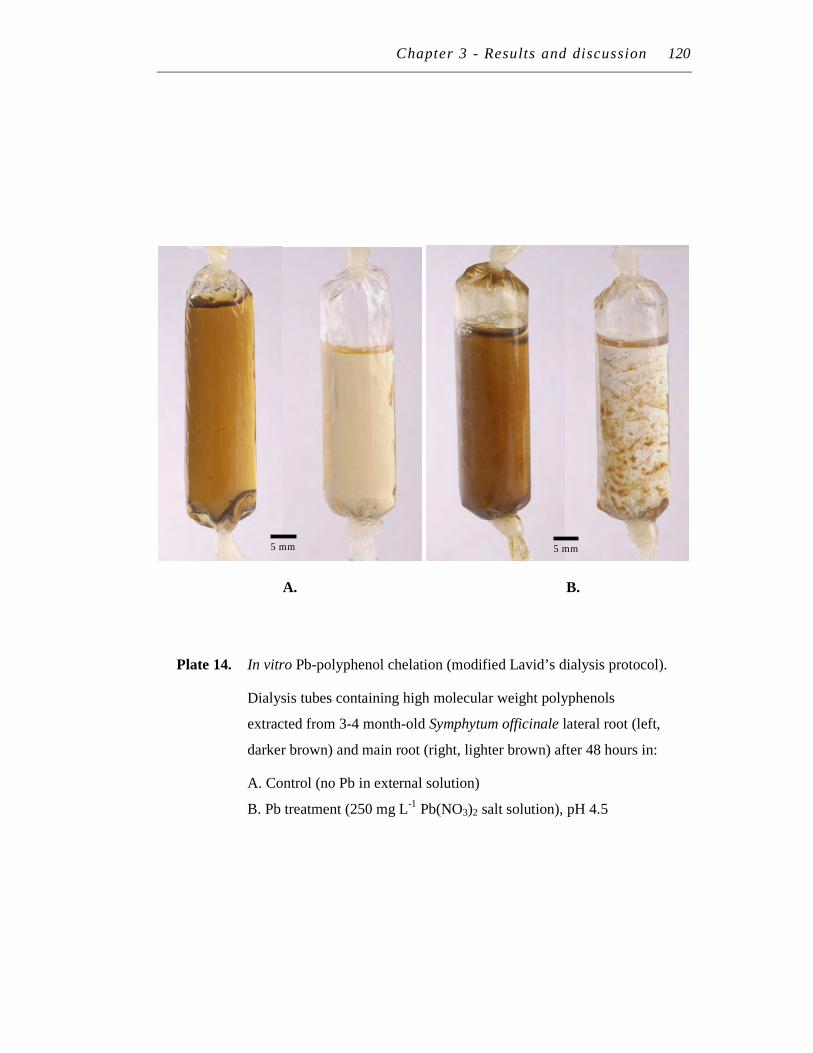
Chapter 3 - Results and discussion 120
A. B.
Plate 14. In vitro Pb-polyphenol chelation (modified Lavid’s dialysis protocol).
Dialysis tubes containing high molecular weight polyphenols
extracted from 3-4 month-old Symphytum officinale lateral root (left,
darker brown) and main root (right, lighter brown) after 48 hours in:
A. Control (no Pb in external solution)
B. Pb treatment (250 mg L-1 Pb(NO3)2 salt solution), pH 4.5
5 mm 5 mm
Chapter 3 − Results and discussion 121
6.1.3 Fructan interference (I)
The Lavid dialysis method above may be subject to interferences from other high
molecular weight Pb chelating compound(s) in the root (especially main root)
polyphenol extracts; the most obvious being fructans.
Fructans are fructose-based polysaccharides (Koster, 1996; Ritsema and
Smeekens, 2003) with numerous potential Pb-chelating hydroxyl groups. Quantitatively
fructans are typically between 10 to < 29% d.w. (AbouMandour et al., 1987), which is
up to five times higher than tannin levels (4-6% d.w) in S. officinale roots. However,
their location in planta suggests that their role in Pb accumulation and tolerance may be
smaller compared to polyphenols. Unlike polyphenols that are in the cell wall and
vacuole of most cells, fructans are reserve polysaccharides, which are found in vacuoles
of only photosynthetic and storage cells (Cairns, 2003). During the polyphenol
extraction process fructans may be released from vacuoles of these specific cells,
allowing fructans to be more readily available for Pb chelation in vitro than in vivo.
Thus, the content of the dialysis tubes could reflect the total concentration of high
molecular weight Pb-chelating compounds extracted and trapped in the dialysis tube
(e.g. fructans and complex polyphenols), rather than a particular type of chelating
compound (i.e. complex polyphenols) and their true level of availability for Pb
chelation in planta.
In terms of the two root tissues, it is suspected that main root extracts may have a
higher concentration of these interfering fructans (but lower tannin level) than lateral
root extracts. If so, this would explain why a greater level of Pb chelation was observed
in the lower-tannin main root polyphenol extracts. Observations supporting the presence
of fructans, especially in main root tissues, were:
� Main root tissues were much thicker in appearance than lateral roots,
indicating their role as polysaccharide storage roots.
� A gelatinous layer (possibly indicative of polysaccharides) was only observed
along the dialysis membrane containing the main root extracts.
� Pb chelation within the dialysis tube was noticeably different: Pb chelation to
lateral root polyphenols appeared to be colloidal, whereas Pb chelation to main
root polyphenols appeared as sheets (Plate 14).
� Using the HBH glucose assay and KI/I2 spot plate test (data not shown), both
main and lateral root polyphenol extracts gave a negative test for starch and
Chapter 3 − Results and discussion 122
other glucose-based polysaccharides. Starch was not detected because these
compounds were removed by centrifugation.
6.1.4 Fructan interference (II): Direct experimental evidence
To add credence to the possibility of fructan interference above (6.1.2), dialysis bags
containing purified chicory inulin (Sigma) was tested. Inulin is a fructan made from a
linear chain of fructose units bound to a glucose starter molecule (Ritsema and
Smeekens, 2003). It was used as a model fructan in this experiment as it was the most
common and only purified fructan available from our suppliers. Inulin levels were set at
0.15% and 0.30% (w/v) to represent the level of fructans expected if 50-100% of the
known S. officinale root fructan content was released into the polyphenol extract. At this
inulin level, the Pb level trapped in the dialysis bag increased by an average of 8-15%
(P≤0.05) compared to the control (water). There was no statistical difference between
the two levels of inulin (Figure 18). The elevated levels of Pb trapped in the dialysis
tube containing inulin, indicates that fructans is an interfering factor in the Lavid
dialysis method.
However, if the Pb accumulation levels (6.1.1) were corrected against this level of
interference, the higher tannin lateral roots would still have less Pb trapped in the tube
than the lower tannin main roots (in this case by 8-16%). This is still not consistent with
the hydroponic trends. What if higher concentrations of inulin were used in the dialysis
tube? It is possible that (similar to section 6.4.1. with tannins) a higher threshold
concentration of inulin is required before significantly more Pb can be trapped in the
dialysis tube. However, if this type of inulin were the main fructan in S. officinale, such
concentrations would exceed the known amount of fructan in S. officinale (as tested in
this study). Thus higher concentrations of inulin are unlikely to produce a meaningful
result. It seems more likely that other unidentified compounds or different fructans (in
size and structure) in S. officinale may be involved. Inulin from chicory is the simplest
linear fructan, made of 35 units of fructose units linked in a β (1-2) manner. Fructans,
with a chain length of a few hundred fructose units long linked in β (1-2) and/or β (2-6)
manner also exist (Ritsema and Smeekens, 2003; Koster, 1996). For example, inulin
from globe artichoke is made of 200 units of fructose (Velisek and Cejpek, 2005). The
types of fructans in S. officinale is unknown, but it is likely that these larger and
structurally different fructans are present in S. officinale roots and may better reflect the

Chapter 3 - Results and discussion 123
Figure 18. In vitro Pb-inulin chelation (Lavid’s dialysis protocol): Level of Pb trapped in dialysis tubes (containing purified chicory inulin) after 48 hours in 250 mg L-1 Pb(NO3)2 salt solution at pH 4.5. Values are means ± S.E. of three replicates. Values not sharing the same letter are significantly different (P≤0.05).
b
b
a
0
20
40
60
80
100
120
140
water 0.15% (w/v) 0.3% (w/v)
Inulin spike level (% w/v)
Pb
level (m
g L
-1)
Chapter 3 − Results and discussion 124
degree of interference observed in the Lavid dialysis results above. The lack of viscosity
observed in the 0.15%-0.30% (w/v) chicory inulin solution when compared to the
highly viscose main root polyphenol extracts supports this possibility. A smaller
difference may be also due to the mg tannin:mg Pb ratio, as explained in 6.2.2 below.
6.2 New approach: Lead chelation to immobilised tannins
6.2.1 Approach to experimental design
To minimise or avoid the possible interferences, particularly from the main root,
alternative approaches were considered. These included removing polysaccharides after
extraction and isolating tannins from the polyphenol extracts. Firstly, enzymatic
treatment was considered as this method has been used to remove polysaccharide
contaminants from DNA extracts (Barnwell et al., 1998). However, enzymatic treatment
of polyphenol extracts to degrade co-extracted polysaccharides was not deemed possible
because the methanol and polyphenol content of the extracts would inhibit the
polysaccharide-degrading enzymes. Secondly, investing in the cost of endo- and exo-
inulinase enzymes to degrade polysaccharides could not be justified (over 150 Euros),
especially if it was the incorrect type of fructans or was not the sole interference
compound. The use of purified S. officinale tannin extracts from each of the roots in the
Lavid dialysis method may be plausible if the purification process was not a time-
consuming process.
The best approach was to try to isolate tannins from the polyphenol extracts and
the interfering factor. This idea came from a similar problem encountered with DNA
extraction from starchy plant tissue (Wulff et al., 2002). In order to isolate DNA, they
used a combination of ethanol and salt solutions to keep starch in the supernatant whilst
precipitating DNA. In this experiment, possible fructan interferences were kept in
solution by keeping the polyphenol extracts above 4ºC, whilst the tannins were isolated
and separated. Insoluble PVPP is a synthetic polyproline polymer that binds to tannins
via numerous hydrogen bonds, between the carbonyl groups on PVPP (C=O) and
polyphenolic hydrogen of the hydroxyl (-OH) functional groups. It is routinely used to
bind tannins in the Folin-Ciocalteu assay for tannins and during enzyme extractions to
reduce enzyme inhibition by polyphenols. Tannins bound to PVPP, called PVPP-
immobilised tannins, would allow separation from interfering compounds. The only
Chapter 3 − Results and discussion 125
question remaining was if the immobilised tannin still had enough OH functional
groups to bind Pb after being bound to PVPP; the preliminary investigation using 50 mg
L-1 Pb(NO3)2 showed that up to 86% of the available Pb in the solution chelated to the
PVPP-immoblised tannins from the root extracts. Clearly, this Pb chelation ability was
sufficient for further studies.
6.2.2 In vitro lead chelation by lateral and main root tannins
Figure 19 shows the extractable polyphenol and tannin level in 3-month-old S.
officinale roots; on a dry weight basis, lateral root tissue contained 8 times more
polyphenols and 13 times more tannins than main root tissue. Based on the tannin assay
results and the volume of extract used per tube, the amount of immobilised tannin in
each tube (expressed as mg tannic acid-TA) was calculated to be on average 2.618 mg
TA and 0.1907 mg TA for the lateral and main root polyphenol extracts respectively.
In contrast to the Lavid dialysis method, the trend presented here correlated well
with the hydroponic experiments; the higher tannin lateral roots removed more Pb than
the lower-tannin main roots. At 50, 250 and 500 mg L-1 Pb(NO3)2 concentrations, an
average of 1.1, 3.0 and 3.5 times more Pb was removed from the upper layer Pb solution
respectively by chelation to lateral root immobilised tannins (Figure 20). The level of
Pb gained by chelation to the PVPP-immobilised tannin pellet (lower layer) was also
higher in the lateral root than the main root samples (Table 4). However, the lower layer
data were more variable (i.e. did not pass F (max) test) because two different matrices
were involved; one solid, one liquid. Hence only the upper layer was assessed in
subsequent experiments.
In terms of percentages, the highest percentage of Pb chelated occurred at the 50
mg L-1 Pb(NO3)2 concentration. At this concentration 86% (on average) of the total Pb
(element) chelated to PVPP-immobilised lateral root tannins.

Chapter 3 - Results and discussion 126
Figure 19. In vitro Pb-tannin chelation (immobilised tannin method): Polyphenol and tannin levels extracted from 3-month-old Symphytum
officinale root tissue. Values are means ± S.E. of three replicates. Values not sharing the same letter are significantly different (P≤0.05). TA = tannic acid.
c
a
d
b
0
10
20
30
40
50
60
70
lateral main
Root tissue
Po
lyp
he
no
l le
ve
l (m
g T
A g
-1 d
.w.
tis
su
e)
Polyphenol
Tannin

Chapter 3 - Results and discussion 127
a
cd
f
bc
e
hI
ab
d
gI
0
50
100
150
200
250
300
0 50 250 500
Pb(NO3)2 treatment level (mg L-1
)
Pb
le
ve
l in
up
pe
r la
ye
r (m
g L
-1)
no extract
lateral root
main root
`
Figure 20. In vitro Pb-tannin chelation (immobilised tannin method): Level of Pb remaining in the upper layer after treatment with PVPP, with or without immobilised tannins from 3-month-old Symphytum officinale lateral root or main root tissues, after four hours. Solutions were all at pH 4.5. Values are means ± S.E. of three replicates. Values not sharing the same letter are significantly different (P≤0.05).
NB: Pb treatment level (x-axis) refers to mg L-1 of Pb(NO3)2 . The Pb level in the upper layer refers to mean level of Pb element (mg L-1) measured by AAS.
Average elemental Pb level removed from upper layer (relative to no extract) (mg L
-1)
PVPP-immobilised tannin Pb(NO3)2 treatment level
(mg L-1
) Lateral root Main root
50 17.7 15.8
250 67.8 22.4
500 74.1 20.7
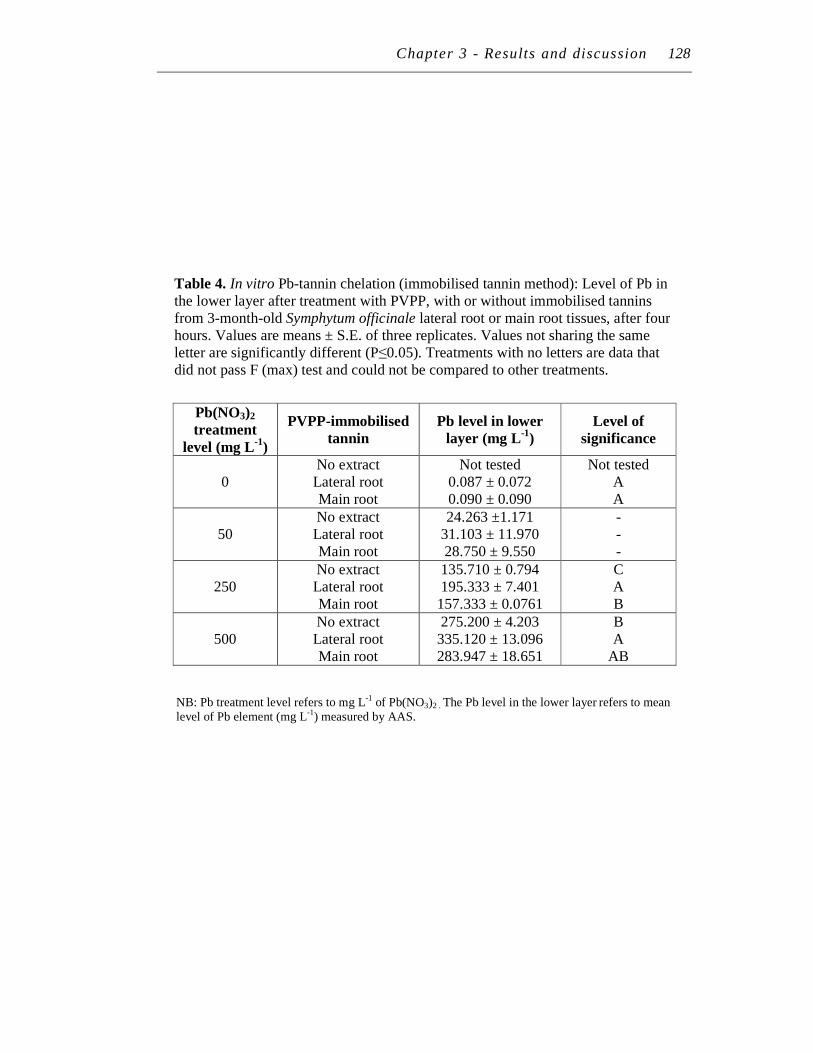
Chapter 3 - Results and discussion 128
Pb(NO3)2
treatment
level (mg L-1
)
PVPP-immobilised
tannin
Pb level in lower
layer (mg L-1
)
Level of
significance
0 No extract Lateral root Main root
Not tested 0.087 ± 0.072 0.090 ± 0.090
Not tested A A
50 No extract Lateral root Main root
24.263 ±1.171 31.103 ± 11.970 28.750 ± 9.550
- - -
250 No extract Lateral root Main root
135.710 ± 0.794 195.333 ± 7.401
157.333 ± 0.0761
C A B
500 No extract Lateral root Main root
275.200 ± 4.203 335.120 ± 13.096 283.947 ± 18.651
B A
AB
Table 4. In vitro Pb-tannin chelation (immobilised tannin method): Level of Pb in the lower layer after treatment with PVPP, with or without immobilised tannins from 3-month-old Symphytum officinale lateral root or main root tissues, after four hours. Values are means ± S.E. of three replicates. Values not sharing the same letter are significantly different (P≤0.05). Treatments with no letters are data that did not pass F (max) test and could not be compared to other treatments.
NB: Pb treatment level refers to mg L-1 of Pb(NO3)2 . The Pb level in the lower layer refers to mean level of Pb element (mg L-1) measured by AAS.
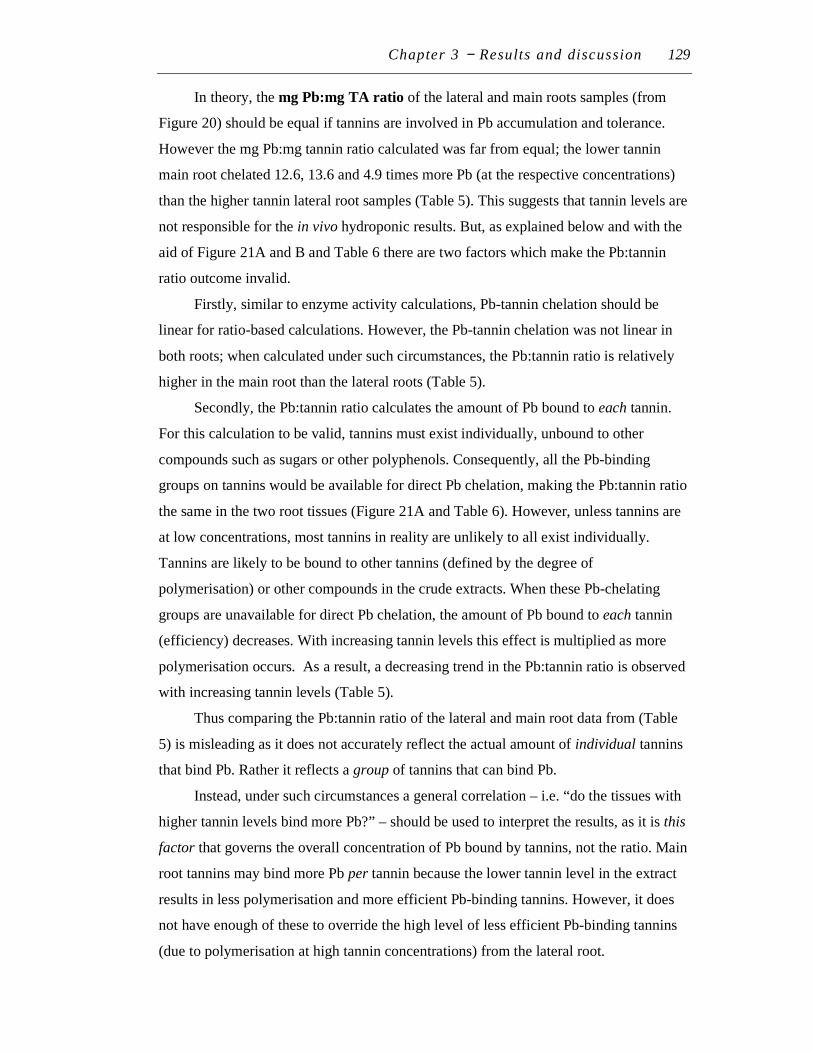
Chapter 3 − Results and discussion 129
In theory, the mg Pb:mg TA ratio of the lateral and main roots samples (from
Figure 20) should be equal if tannins are involved in Pb accumulation and tolerance.
However the mg Pb:mg tannin ratio calculated was far from equal; the lower tannin
main root chelated 12.6, 13.6 and 4.9 times more Pb (at the respective concentrations)
than the higher tannin lateral root samples (Table 5). This suggests that tannin levels are
not responsible for the in vivo hydroponic results. But, as explained below and with the
aid of Figure 21A and B and Table 6 there are two factors which make the Pb:tannin
ratio outcome invalid.
Firstly, similar to enzyme activity calculations, Pb-tannin chelation should be
linear for ratio-based calculations. However, the Pb-tannin chelation was not linear in
both roots; when calculated under such circumstances, the Pb:tannin ratio is relatively
higher in the main root than the lateral roots (Table 5).
Secondly, the Pb:tannin ratio calculates the amount of Pb bound to each tannin.
For this calculation to be valid, tannins must exist individually, unbound to other
compounds such as sugars or other polyphenols. Consequently, all the Pb-binding
groups on tannins would be available for direct Pb chelation, making the Pb:tannin ratio
the same in the two root tissues (Figure 21A and Table 6). However, unless tannins are
at low concentrations, most tannins in reality are unlikely to all exist individually.
Tannins are likely to be bound to other tannins (defined by the degree of
polymerisation) or other compounds in the crude extracts. When these Pb-chelating
groups are unavailable for direct Pb chelation, the amount of Pb bound to each tannin
(efficiency) decreases. With increasing tannin levels this effect is multiplied as more
polymerisation occurs. As a result, a decreasing trend in the Pb:tannin ratio is observed
with increasing tannin levels (Table 5).
Thus comparing the Pb:tannin ratio of the lateral and main root data from (Table
5) is misleading as it does not accurately reflect the actual amount of individual tannins
that bind Pb. Rather it reflects a group of tannins that can bind Pb.
Instead, under such circumstances a general correlation – i.e. “do the tissues with
higher tannin levels bind more Pb?” – should be used to interpret the results, as it is this
factor that governs the overall concentration of Pb bound by tannins, not the ratio. Main
root tannins may bind more Pb per tannin because the lower tannin level in the extract
results in less polymerisation and more efficient Pb-binding tannins. However, it does
not have enough of these to override the high level of less efficient Pb-binding tannins
(due to polymerisation at high tannin concentrations) from the lateral root.
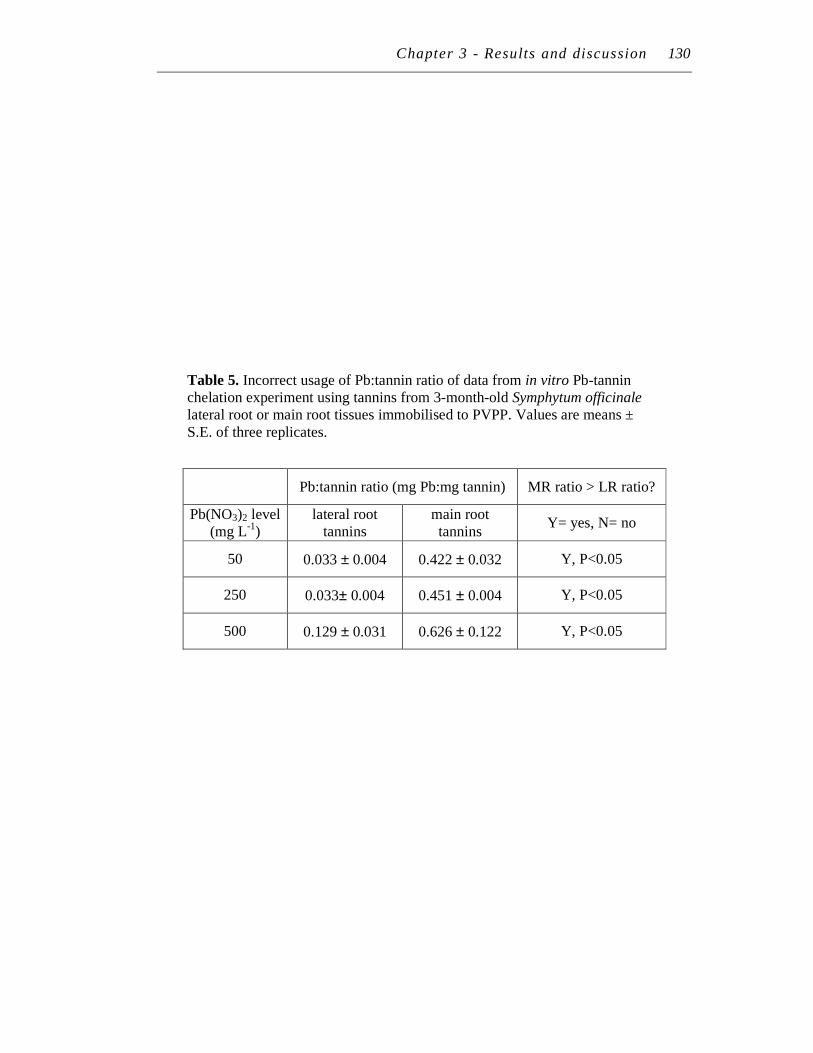
Chapter 3 - Results and discussion 130
Pb:tannin ratio (mg Pb:mg tannin) MR ratio > LR ratio?
Pb(NO3)2 level (mg L-1)
lateral root tannins
main root tannins
Y= yes, N= no
50 0.033 ± 0.004 0.422 ± 0.032 Y, P<0.05
250 0.033± 0.004 0.451 ± 0.004 Y, P<0.05
500 0.129 ± 0.031 0.626 ± 0.122 Y, P<0.05
Table 5. Incorrect usage of Pb:tannin ratio of data from in vitro Pb-tannin chelation experiment using tannins from 3-month-old Symphytum officinale lateral root or main root tissues immobilised to PVPP. Values are means ± S.E. of three replicates.
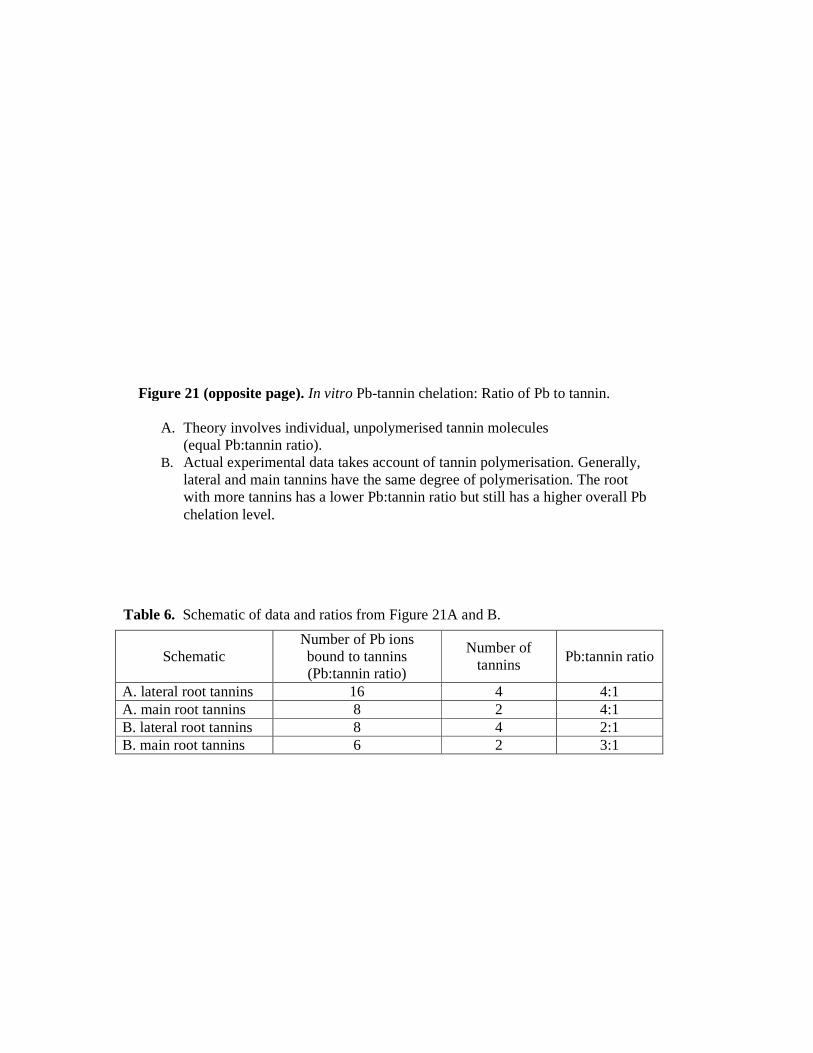
Table 6. Schematic of data and ratios from Figure 21A and B.
Schematic Number of Pb ions bound to tannins (Pb:tannin ratio)
Number of tannins
Pb:tannin ratio
A. lateral root tannins 16 4 4:1
A. main root tannins 8 2 4:1
B. lateral root tannins 8 4 2:1 B. main root tannins 6 2 3:1
Figure 21 (opposite page). In vitro Pb-tannin chelation: Ratio of Pb to tannin.
A. Theory involves individual, unpolymerised tannin molecules (equal Pb:tannin ratio).
B. Actual experimental data takes account of tannin polymerisation. Generally, lateral and main tannins have the same degree of polymerisation. The root with more tannins has a lower Pb:tannin ratio but still has a higher overall Pb chelation level.
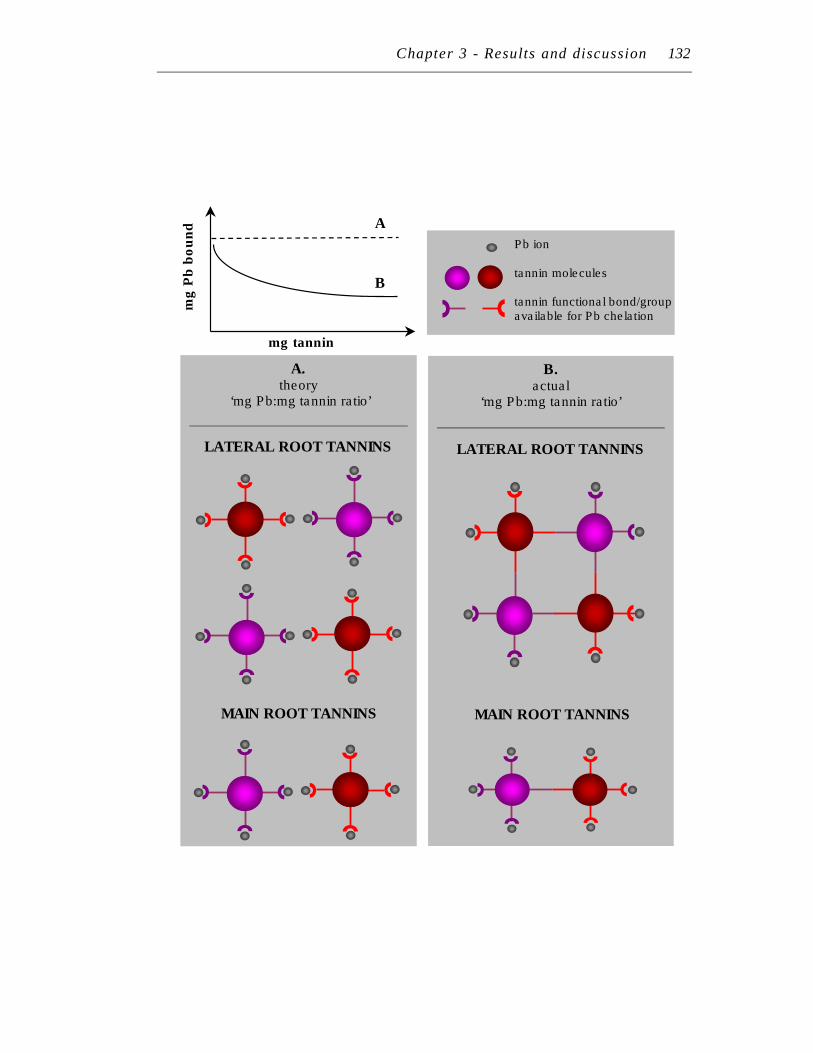
Chapter 3 - Results and discussion 132
Pb ion tannin molecules tannin functional bond/group available for Pb chelation
A. theory
‘mg Pb:mg tannin ratio’
LATERAL ROOT TANNINS
B. actual
‘mg Pb:mg tannin ratio’
LATERAL ROOT TANNINS
mg tannin
mg
Pb
bo
un
d
A
B
MAIN ROOT TANNINS MAIN ROOT TANNINS
Chapter 3 − Results and discussion 133
Using this general correlation, the immobilised lateral root tannins (with higher-
tannin levels) did bind more Pb than the lower tannin main roots, suggesting that
tannins are involved in the chelation-based tolerance mechanism, Pb accumulation and
the trends observed in the in vivo hydroponic experiment.
6.2.3 Linear in vitro chelation
Using a micro-scale version of the experiment above (6.2.2), increasing concentrations
of immobilised tannins were prepared from only the lateral root polyphenol extracts.
This was to provide evidence of tannin involvement in the observed Pb chelation (i.e
removal from solution) trends, rather than factors related to the differences in root tissue
e.g. interference compound in main roots compared to lateral roots. Additionally, the
Pb:tannin ratio can be applied here because the Pb-chelation trends were linear.
The same trend as 6.2.2 was observed, except linearity in Pb chelation was
observed; the higher the tannin concentration, the greater the level of Pb removal from
solution (P≤0.05). In this case, 0, 6, 10, 24 and 60% of the initial Pb in 50 mg L-1
Pb(NO3)2 (23 mg L-1 Pb on average recovered by AAS) was removed by increasing
concentrations of the lateral root immobilised tannins (0, 12.5, 25, 50, and 100% (v/v)
of the initial extract containing an average of 0, 0.028, 0.058, 0.113 and 0.225 mg TA
respectively) (Figure 22).
Whilst not significantly different (P≥0.05), a slight increase in the Pb:tannin ratio,
indicative of a small amount of interference from the crude tannin extracts, was also
apparent (Figure 23). However, the degree of error due to the low tannin concentrations
used (to achieve linearity in Pb chelation) or small amount of fructan interference (see
below) may have also contributed to this apparent trend. Overall under these linear Pb-
chelation trends, this ratio-based analysis further supports the idea that tannins are
involved in the chelation-based tolerance mechanism and Pb accumulation in S.
officinale.
6.3 Lead chelation to immobilised tannins: general points
In this chelation method, there are two important points relating to the functional groups
involved in Pb-tannin chelation. Firstly, whilst the immobilisation of tannins to PVPP
would remove some chelating functional groups, clearly enough remained to allow a
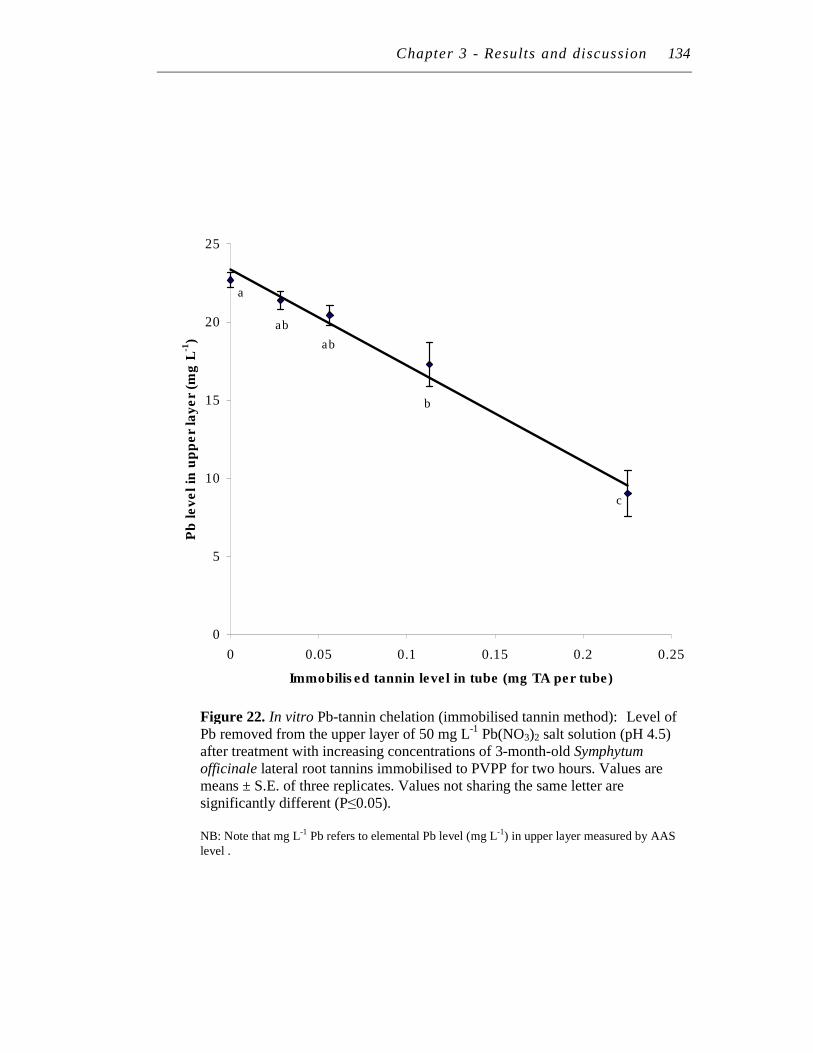
Chapter 3 - Results and discussion 134
Figure 22. In vitro Pb-tannin chelation (immobilised tannin method): Level of Pb removed from the upper layer of 50 mg L-1 Pb(NO3)2 salt solution (pH 4.5) after treatment with increasing concentrations of 3-month-old Symphytum
officinale lateral root tannins immobilised to PVPP for two hours. Values are means ± S.E. of three replicates. Values not sharing the same letter are significantly different (P≤0.05). NB: Note that mg L-1 Pb refers to elemental Pb level (mg L-1) in upper layer measured by AAS
level .
a
ab
ab
b
c
0
5
10
15
20
25
0 0.05 0.1 0.15 0.2 0.25
Immobilised tannin level in tube (mg TA per tube)
Pb
level in
up
per
layer
(mg
L-1
)
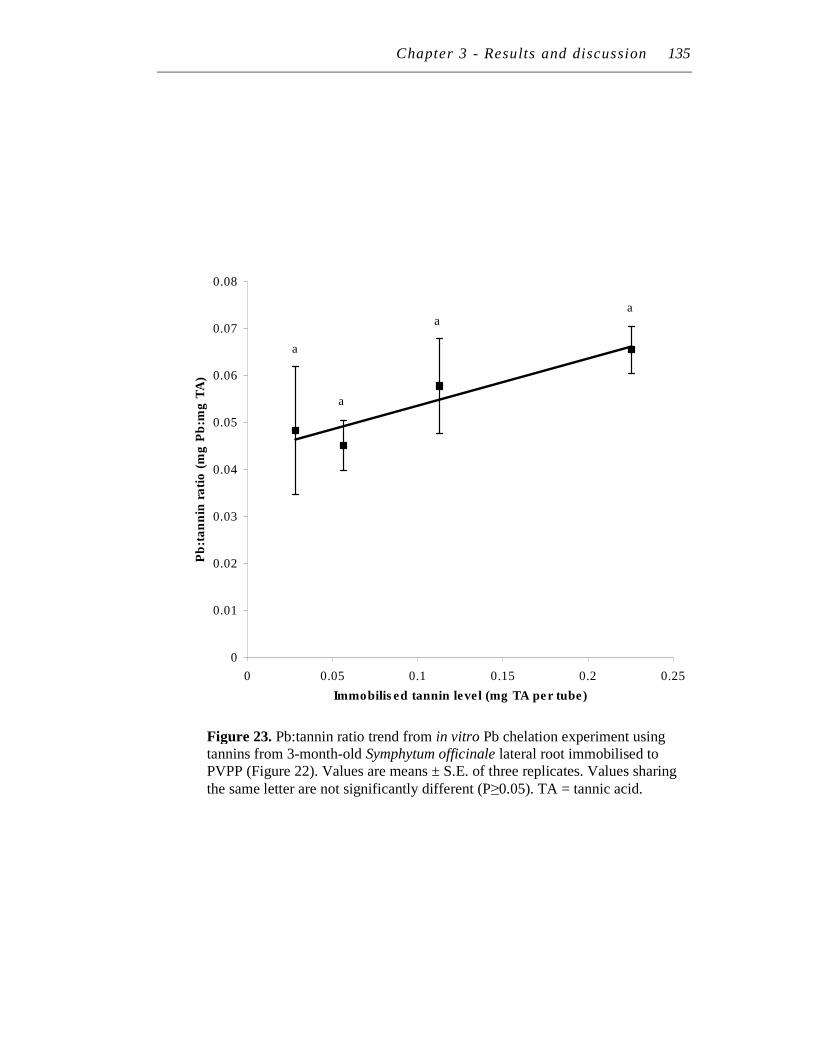
Chapter 3 - Results and discussion 135
Figure 23. Pb:tannin ratio trend from in vitro Pb chelation experiment using tannins from 3-month-old Symphytum officinale lateral root immobilised to PVPP (Figure 22). Values are means ± S.E. of three replicates. Values sharing the same letter are not significantly different (P≥0.05). TA = tannic acid.
aa
a
a
0
0.01
0.02
0.03
0.04
0.05
0.06
0.07
0.08
0 0.05 0.1 0.15 0.2 0.25
Immobilised tannin level (mg TA per tube)
Pb
:tan
nin
rati
o (
mg
Pb
:mg
TA
)

Chapter 3 − Results and discussion 136
significant difference in Pb chelation between high tannin-lateral and low tannin-main
roots to be observed. Secondly, some Pb could chelate to tannins indirectly. Since a
crude extract was used, it is possible that Pb chelation to tannins occurred via a bridge
with other compounds such as iron oxides (indirect Pb-tannin chelation). As lateral
roots had higher tannin levels than main roots, the amount of bridging in the lateral root
immobilised tannins would be greater than the main root. However, despite this
additional variable, the over-riding point is that for Pb to be removed from the solution
(via direct or indirect chelation), immobilised tannins must be involved in the first
instance.
6.4 Validating immobilised tannin method: purified tannins
6.4.1 In vitro lead chelation: purified tannic acid
Using purified tannic acid (tannins) from Sigma and the micro-scale in vitro chelation
method, this section demonstrates that PVPP-immobilised tannins have the ability to
directly chelate and remove Pb from solution.
A range finding experiment was conducted to determine: (i) the Pb-binding
capacity of purified tannin immobilised to PVPP, and (ii) how these levels reflect the
trends observed with the S. officinale Pb-tannin chelation studies.
Initially, a purified tannin concentration between 0-0.4 mg mL-1 was immobilised
to PVPP to reflect the level of S. officinale lateral root tannins immobilised to PVPP
(i.e. between about 0.2 to 0.4 mg tannic acid). Since immobilised S. officinale lateral
root tannins (results section 6.2) were already capable of removing up to 86% the Pb in
a solution of 50 mg L-1 Pb(NO3)2, the Pb concentration used here needed to be higher
than this to ensure enough Pb remained in the solution for any additional Pb chelation
by fructan spikes (see 6.4.2 below). Hence, the immobilised purified tannins were
initially exposed to 100 mg L-1 Pb(NO3)2. The maximum immobilised tannin
concentration in this range, 0.4 mg mL-1, removed only 7% of the Pb (element) found in
100 mg L-1 solution of Pb(NO3)2. When the immobilised tannin concentration range was
multiplied 10 times to 0-4 mg mL-1, only 34% of the Pb (element) found in 100 mg L-1
Pb(NO3)2 solution was removed. When the tannin concentration range was further
increased (up to 20 mg mL-1), the highest level of Pb removed from the 100 mg L-1
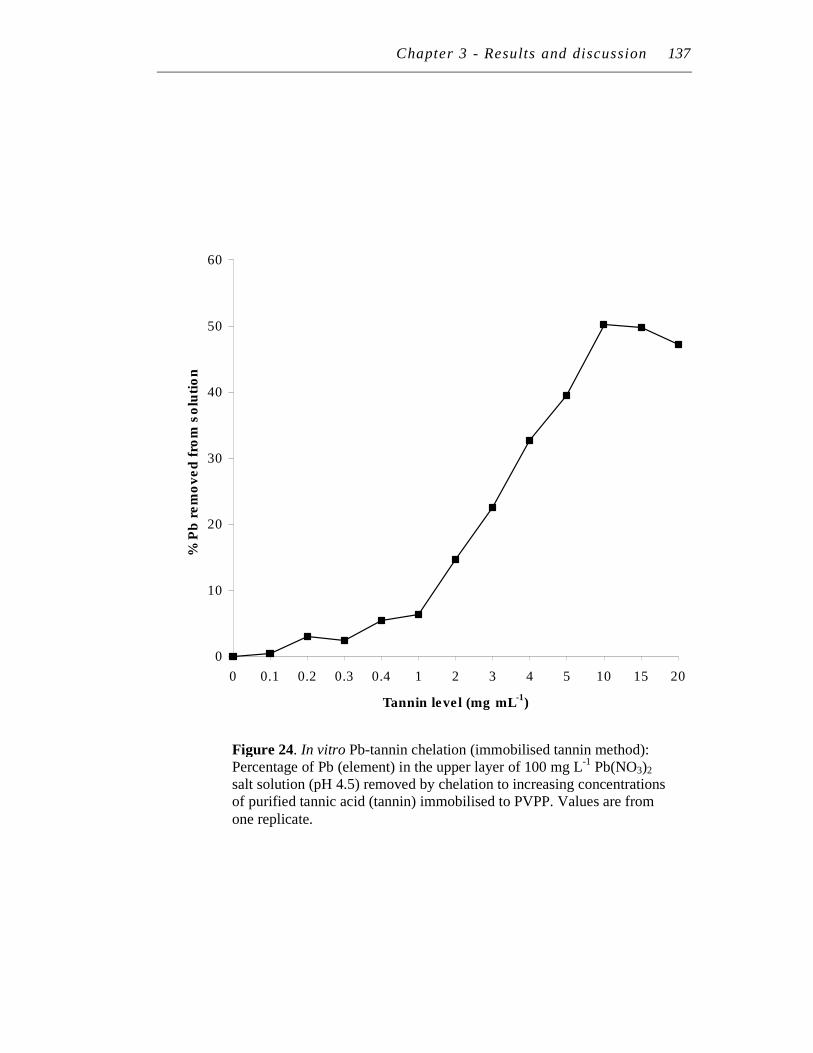
Chapter 3 - Results and discussion 137
Figure 24. In vitro Pb-tannin chelation (immobilised tannin method): Percentage of Pb (element) in the upper layer of 100 mg L-1 Pb(NO3)2
salt solution (pH 4.5) removed by chelation to increasing concentrations of purified tannic acid (tannin) immobilised to PVPP. Values are from one replicate.
0
10
20
30
40
50
60
0 0.1 0.2 0.3 0.4 1 2 3 4 5 10 15 20
Tannin level (mg mL-1
)
% P
b r
em
ov
ed
fro
m s
olu
tio
n
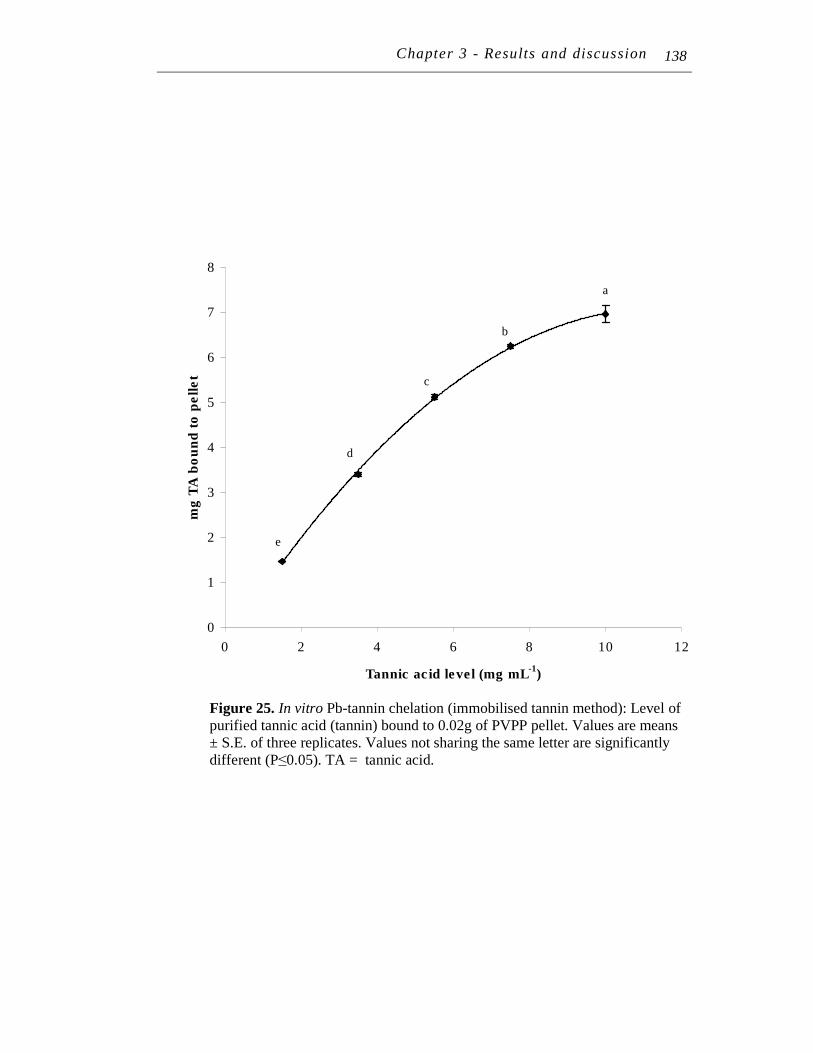
Chapter 3 - Results and discussion 140
d
e
c
b
a
0
1
2
3
4
5
6
7
8
0 2 4 6 8 10 12
Tannic acid level (mg mL-1
)
mg
TA
bo
un
d t
o p
ell
et
Figure 25. In vitro Pb-tannin chelation (immobilised tannin method): Level of purified tannic acid (tannin) bound to 0.02g of PVPP pellet. Values are means ± S.E. of three replicates. Values not sharing the same letter are significantly different (P≤0.05). TA = tannic acid.
138
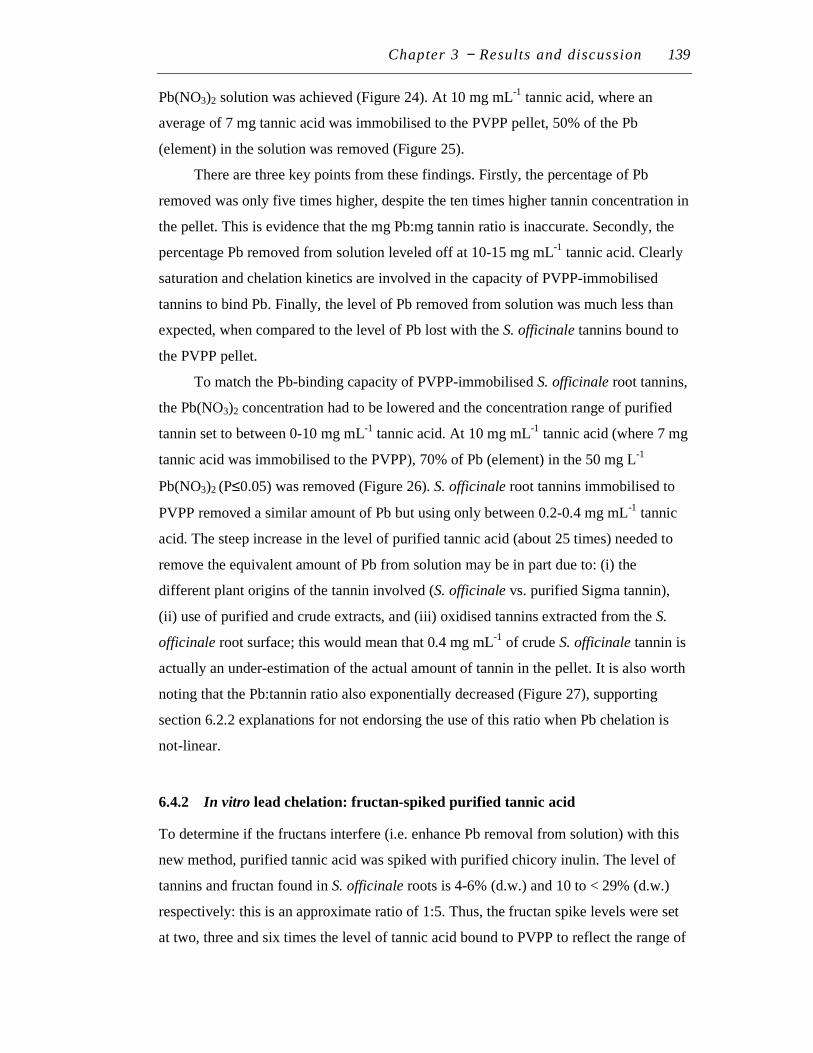
Chapter 3 − Results and discussion 139
Pb(NO3)2 solution was achieved (Figure 24). At 10 mg mL-1 tannic acid, where an
average of 7 mg tannic acid was immobilised to the PVPP pellet, 50% of the Pb
(element) in the solution was removed (Figure 25).
There are three key points from these findings. Firstly, the percentage of Pb
removed was only five times higher, despite the ten times higher tannin concentration in
the pellet. This is evidence that the mg Pb:mg tannin ratio is inaccurate. Secondly, the
percentage Pb removed from solution leveled off at 10-15 mg mL-1 tannic acid. Clearly
saturation and chelation kinetics are involved in the capacity of PVPP-immobilised
tannins to bind Pb. Finally, the level of Pb removed from solution was much less than
expected, when compared to the level of Pb lost with the S. officinale tannins bound to
the PVPP pellet.
To match the Pb-binding capacity of PVPP-immobilised S. officinale root tannins,
the Pb(NO3)2 concentration had to be lowered and the concentration range of purified
tannin set to between 0-10 mg mL-1 tannic acid. At 10 mg mL-1 tannic acid (where 7 mg
tannic acid was immobilised to the PVPP), 70% of Pb (element) in the 50 mg L-1
Pb(NO3)2 (P≤0.05) was removed (Figure 26). S. officinale root tannins immobilised to
PVPP removed a similar amount of Pb but using only between 0.2-0.4 mg mL-1 tannic
acid. The steep increase in the level of purified tannic acid (about 25 times) needed to
remove the equivalent amount of Pb from solution may be in part due to: (i) the
different plant origins of the tannin involved (S. officinale vs. purified Sigma tannin),
(ii) use of purified and crude extracts, and (iii) oxidised tannins extracted from the S.
officinale root surface; this would mean that 0.4 mg mL-1 of crude S. officinale tannin is
actually an under-estimation of the actual amount of tannin in the pellet. It is also worth
noting that the Pb:tannin ratio also exponentially decreased (Figure 27), supporting
section 6.2.2 explanations for not endorsing the use of this ratio when Pb chelation is
not-linear.
6.4.2 In vitro lead chelation: fructan-spiked purified tannic acid
To determine if the fructans interfere (i.e. enhance Pb removal from solution) with this
new method, purified tannic acid was spiked with purified chicory inulin. The level of
tannins and fructan found in S. officinale roots is 4-6% (d.w.) and 10 to < 29% (d.w.)
respectively: this is an approximate ratio of 1:5. Thus, the fructan spike levels were set
at two, three and six times the level of tannic acid bound to PVPP to reflect the range of
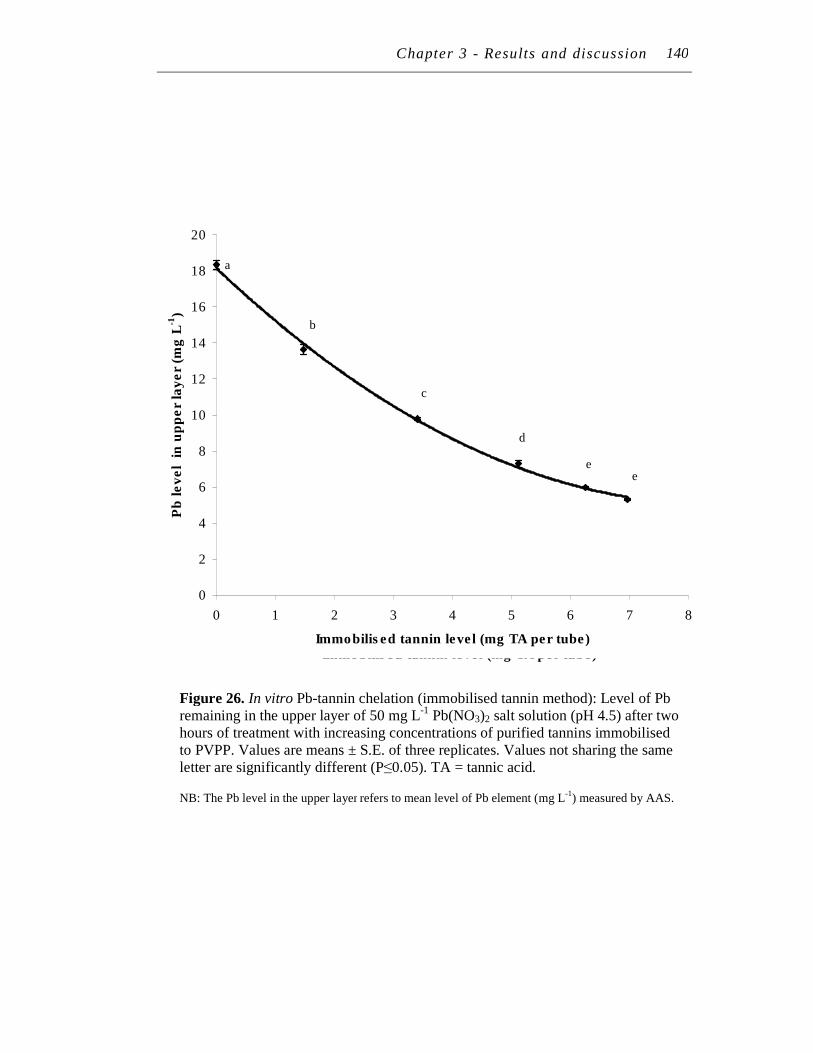
Chapter 3 - Results and discussion 142
Figure 27. In vitro Pb-tannin chelation (immobilised tannin method): Exponential decrease in Pb:tannin ratio (mg Pb:mg TA) of values from Figure 26. Values are means ± S.E. of three replicates. Values not sharing the same letter are significantly different (P≤0.05). TA = tannic acid.
Figure 26. In vitro Pb-tannin chelation (immobilised tannin method): Level of Pb remaining in the upper layer of 50 mg L-1 Pb(NO3)2 salt solution (pH 4.5) after two hours of treatment with increasing concentrations of purified tannins immobilised to PVPP. Values are means ± S.E. of three replicates. Values not sharing the same letter are significantly different (P≤0.05). TA = tannic acid.
NB: The Pb level in the upper layer refers to mean level of Pb element (mg L-1
) measured by AAS.
a
b
c
d
ee
0
2
4
6
8
10
12
14
16
18
20
0 1 2 3 4 5 6 7 8
Immobilised tannin level (mg TA per tube)
Pb
level in
up
per
layer
(mg
L-1
)
`
a
b
c
d
ee
0
2
4
6
8
10
12
14
16
18
20
0 1 2 3 4 5 6 7 8
Immobilised tannin level (mg TA per tube)
Pb
level in
up
per
layer
(mg
L-1
)
140
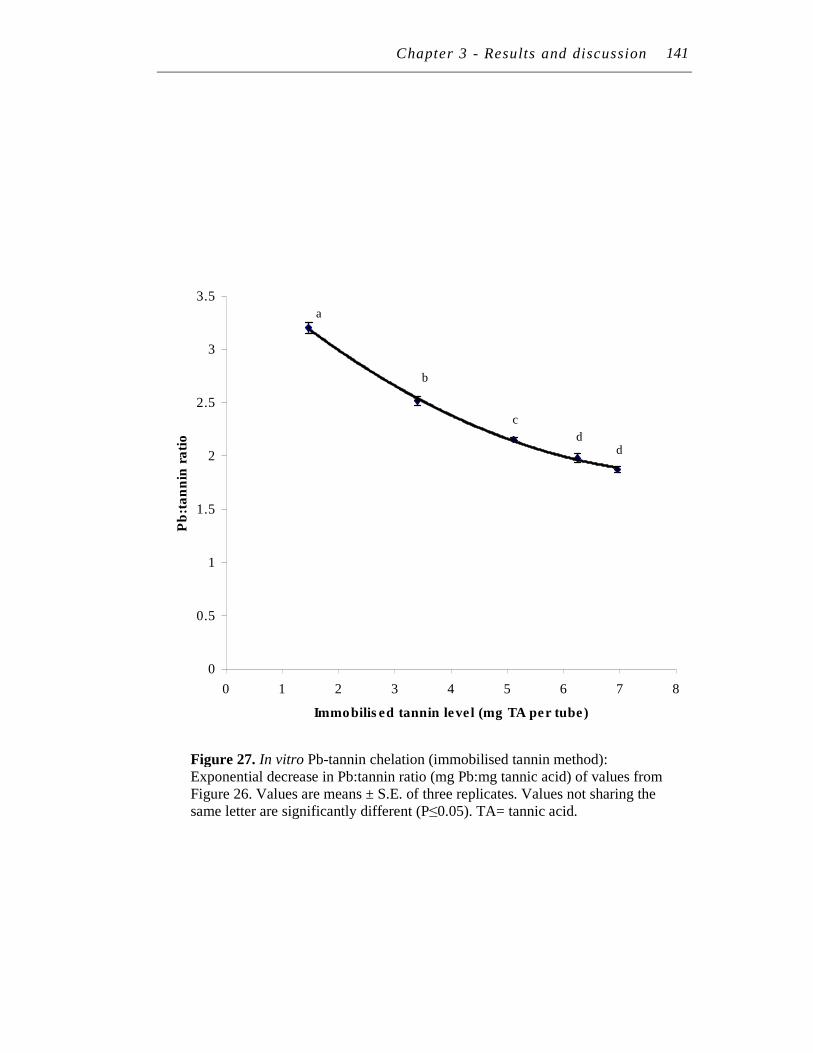
Chapter 3 - Results and discussion 142
Figure 27. In vitro Pb-tannin chelation (immobilised tannin method): Exponential decrease in Pb:tannin ratio (mg Pb:mg tannic acid) of values from Figure 26. Values are means ± S.E. of three replicates. Values not sharing the same letter are significantly different (P≤0.05). TA= tannic acid.
141
a
b
c
dd
0
0.5
1
1.5
2
2.5
3
3.5
0 1 2 3 4 5 6 7 8
Immobilised tannin level (mg TA per tube)
Pb
:tan
nin
rati
o
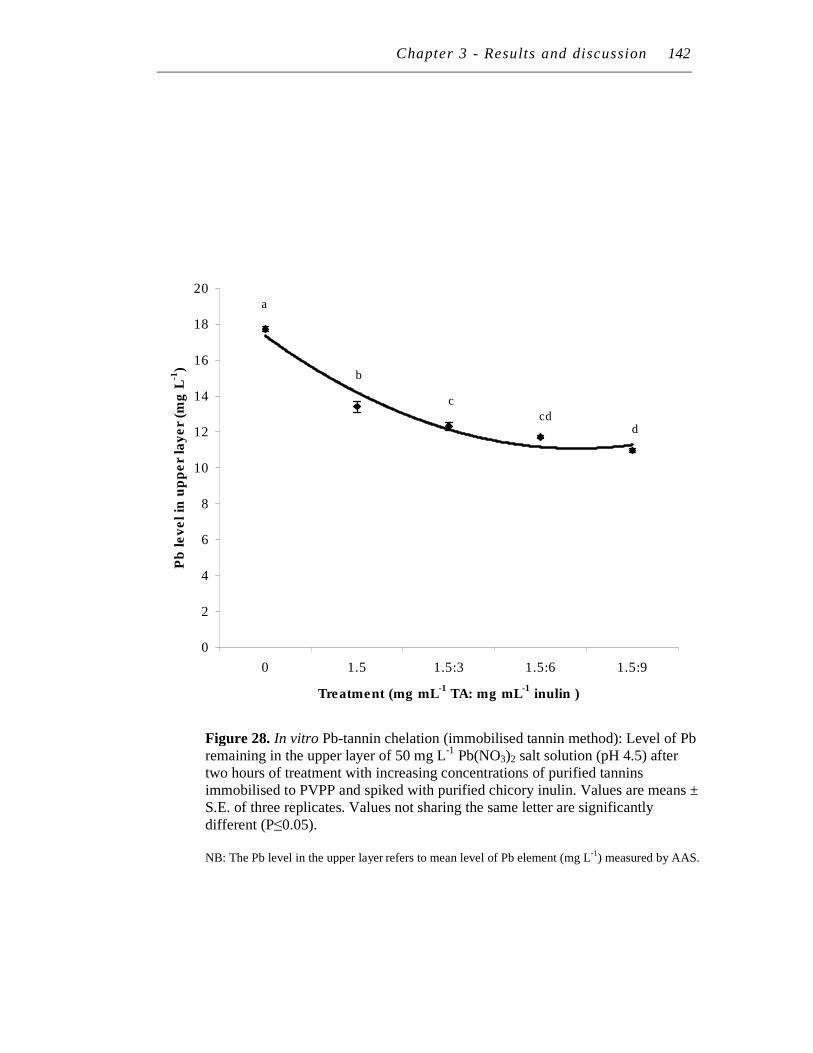
Chapter 3 - Results and discussion 142
Figure 28. In vitro Pb-tannin chelation (immobilised tannin method): Level of Pb remaining in the upper layer of 50 mg L-1 Pb(NO3)2 salt solution (pH 4.5) after two hours of treatment with increasing concentrations of purified tannins immobilised to PVPP and spiked with purified chicory inulin. Values are means ± S.E. of three replicates. Values not sharing the same letter are significantly different (P≤0.05). NB: The Pb level in the upper layer refers to mean level of Pb element (mg L
-1) measured by AAS.
dcd
c
b
a
0
2
4
6
8
10
12
14
16
18
20
0 1.5 1.5:3 1.5:6 1.5:9
Treatment (mg mL-1
TA: mg mL-1
inulin )
Pb
level in
up
per
layer
(mg
L-1
)
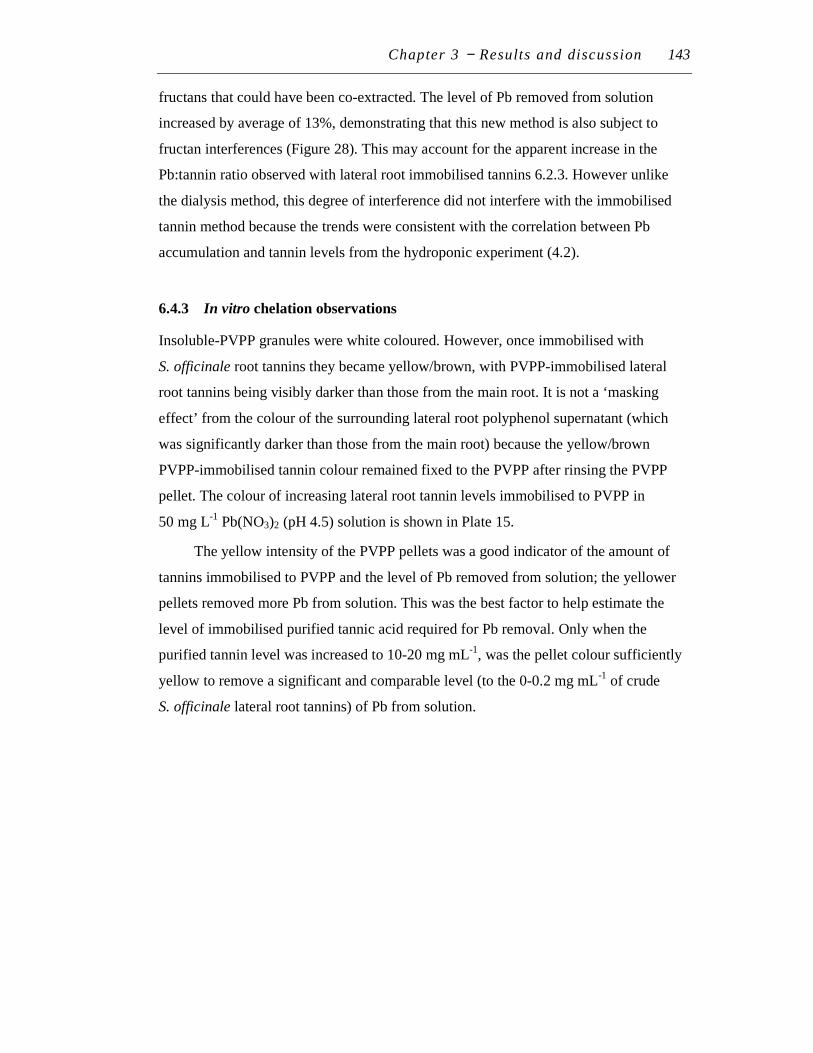
Chapter 3 − Results and discussion 143
fructans that could have been co-extracted. The level of Pb removed from solution
increased by average of 13%, demonstrating that this new method is also subject to
fructan interferences (Figure 28). This may account for the apparent increase in the
Pb:tannin ratio observed with lateral root immobilised tannins 6.2.3. However unlike
the dialysis method, this degree of interference did not interfere with the immobilised
tannin method because the trends were consistent with the correlation between Pb
accumulation and tannin levels from the hydroponic experiment (4.2).
6.4.3 In vitro chelation observations
Insoluble-PVPP granules were white coloured. However, once immobilised with
S. officinale root tannins they became yellow/brown, with PVPP-immobilised lateral
root tannins being visibly darker than those from the main root. It is not a ‘masking
effect’ from the colour of the surrounding lateral root polyphenol supernatant (which
was significantly darker than those from the main root) because the yellow/brown
PVPP-immobilised tannin colour remained fixed to the PVPP after rinsing the PVPP
pellet. The colour of increasing lateral root tannin levels immobilised to PVPP in
50 mg L-1 Pb(NO3)2 (pH 4.5) solution is shown in Plate 15.
The yellow intensity of the PVPP pellets was a good indicator of the amount of
tannins immobilised to PVPP and the level of Pb removed from solution; the yellower
pellets removed more Pb from solution. This was the best factor to help estimate the
level of immobilised purified tannic acid required for Pb removal. Only when the
purified tannin level was increased to 10-20 mg mL-1, was the pellet colour sufficiently
yellow to remove a significant and comparable level (to the 0-0.2 mg mL-1 of crude
S. officinale lateral root tannins) of Pb from solution.
Chapter 3 - Results and discussion 144
A. B.
C.
5 m
m
5 m
m
5 m
m
Plate 15. The colour of 3-month-old Symphytum officinale root powder, polyphenol
extracts and immobilised root tannins.
A. Colour of lateral and main root powder prior to polyphenol
extraction (left to right).
B. Colour of lateral and main root polyphenol extract. The same colour
trend was observed immediately after addition of 50% (v/v) methanol
(left to right).
C. In vitro Pb-tannin chelation using micro-scale method: Increasing
levels of lateral root tannins (left to right: 0, 0.028, 0.058, 0.113, 0.225
mg tannic acid per tube) immobilised to PVPP in 50 mg L-1 Pb(NO3)2
solution. Increasing yellow colour was indicative of immobilised
tannin level.
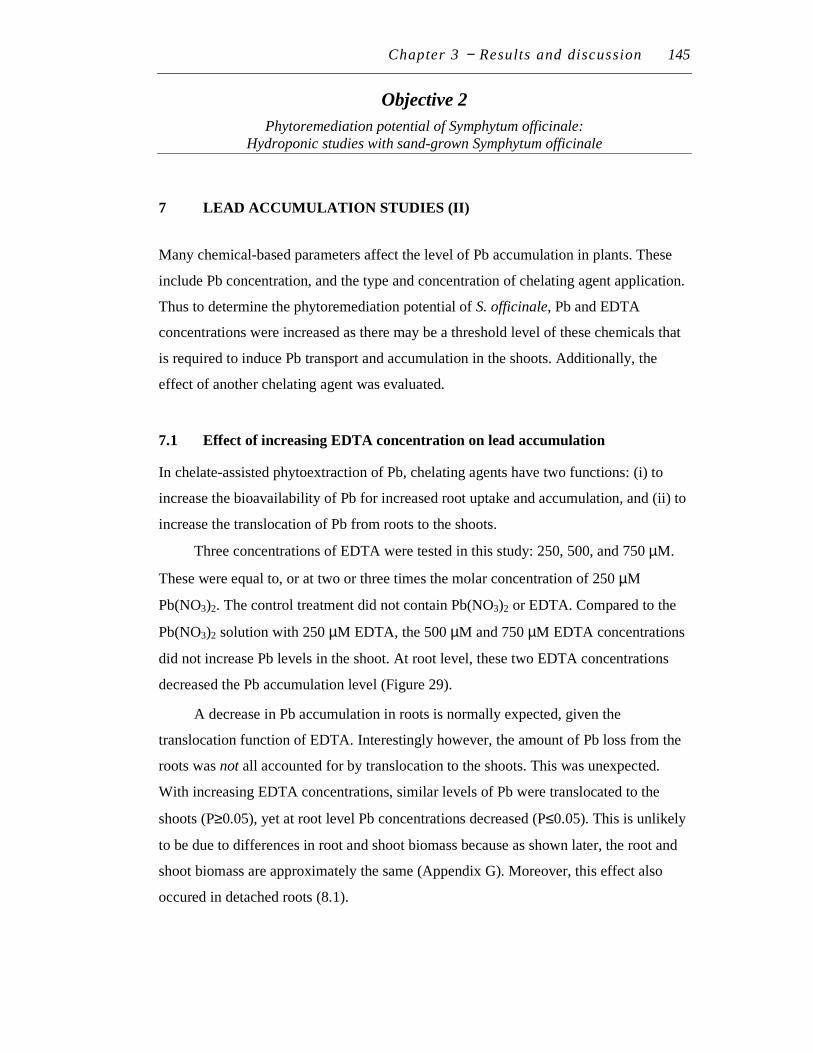
Chapter 3 − Results and discussion 145
Objective 2
Phytoremediation potential of Symphytum officinale:
Hydroponic studies with sand-grown Symphytum officinale
7 LEAD ACCUMULATION STUDIES (II)
Many chemical-based parameters affect the level of Pb accumulation in plants. These
include Pb concentration, and the type and concentration of chelating agent application.
Thus to determine the phytoremediation potential of S. officinale, Pb and EDTA
concentrations were increased as there may be a threshold level of these chemicals that
is required to induce Pb transport and accumulation in the shoots. Additionally, the
effect of another chelating agent was evaluated.
7.1 Effect of increasing EDTA concentration on lead accumulation
In chelate-assisted phytoextraction of Pb, chelating agents have two functions: (i) to
increase the bioavailability of Pb for increased root uptake and accumulation, and (ii) to
increase the translocation of Pb from roots to the shoots.
Three concentrations of EDTA were tested in this study: 250, 500, and 750 µM.
These were equal to, or at two or three times the molar concentration of 250 µM
Pb(NO3)2. The control treatment did not contain Pb(NO3)2 or EDTA. Compared to the
Pb(NO3)2 solution with 250 µM EDTA, the 500 µM and 750 µM EDTA concentrations
did not increase Pb levels in the shoot. At root level, these two EDTA concentrations
decreased the Pb accumulation level (Figure 29).
A decrease in Pb accumulation in roots is normally expected, given the
translocation function of EDTA. Interestingly however, the amount of Pb loss from the
roots was not all accounted for by translocation to the shoots. This was unexpected.
With increasing EDTA concentrations, similar levels of Pb were translocated to the
shoots (P≥0.05), yet at root level Pb concentrations decreased (P≤0.05). This is unlikely
to be due to differences in root and shoot biomass because as shown later, the root and
shoot biomass are approximately the same (Appendix G). Moreover, this effect also
occured in detached roots (8.1).
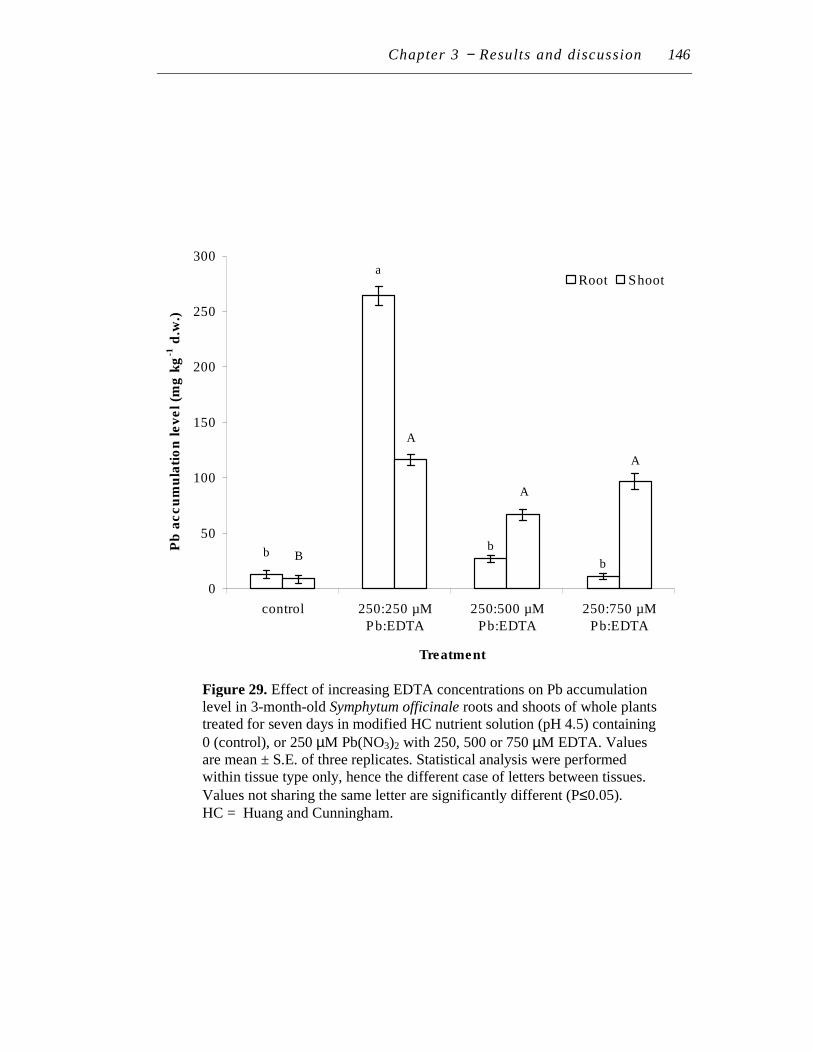
Chapter 3 − Results and discussion 146
b
b
a
b
A
A
A
B
0
50
100
150
200
250
300
control 250:250 µM
Pb:EDTA
250:500 µM
Pb:EDTA
250:750 µM
Pb:EDTA
Treatment
Pb
accu
mu
lati
on
level (m
g k
g-1
d.w
.)
...
Root Shoot
Figure 29. Effect of increasing EDTA concentrations on Pb accumulation level in 3-month-old Symphytum officinale roots and shoots of whole plants treated for seven days in modified HC nutrient solution (pH 4.5) containing
0 (control), or 250 µM Pb(NO3)2 with 250, 500 or 750 µM EDTA. Values are mean ± S.E. of three replicates. Statistical analysis were performed within tissue type only, hence the different case of letters between tissues.
Values not sharing the same letter are significantly different (P≤0.05). HC = Huang and Cunningham.
Chapter 3 − Results and discussion 147
7.2 Effect of 500 µµµµM Pb(NO3)2 exposure level
In unchelated Pb treatments (500 µM Pb(NO3)2), most of the Pb accumulated in the root
tissue; a mean of 21,319 mg kg-1 (d.w.) of Pb accumulated in the root tissue (after root
desorption with 1 mM EDTA), compared to just a mean of 71 mg kg-1 (d.w.) in the
shoot tissue (Figure 30A and 30B). Of all the unchelated Pb treatments performed thus
far, these were the highest shoot and root Pb accumulation levels recorded after seven
days of treatment.
In chelated Pb treatments containing 500 µM Pb(NO3)2 and 500 µM EDTA (1:1
PbEDTA), shoots accumulated over seven times the amount of Pb compared to the
unchelated Pb treatment (on an average dry weight basis, P≤0.05). In the chelator
treatment, shoots contained twice the concentration of Pb than roots (Figure 30A and
30B). This confirms our previous 250 µM Pb(NO3)2 uptake studies with EDTA, where
EDTA increases translocation of Pb to shoots.
However similar to section 7.1, Pb accumulation levels in roots with PbEDTA
were drastically reduced to only 18% of the unchelated Pb treatments. The majority of
the reduction of Pb level in the roots was also not accounted for by translocation to
shoots (Figure 30B).
Chapter 3 - Results and discussion 148
Figure 30A. Pb accumulation level in 3-month-old Symphytum officinale
shoots of whole plants treated for seven days in modified HC nutrient
solution (pH 4.5) containing 0 (control), or 500 µM Pb(NO3)2 with or without
500 µM EDTA solution. Values are mean ± S.E. of three replicates. Values
not sharing the same letter are significantly different (P≤0.05). HC = Huang and Cunningham.
c
558.374
b
70.690
a
2.851
0
100
200
300
400
500
600
700
800
control Pb PbEDTA
Treatment
Pb
ac
cu
mu
lati
on
le
ve
l (m
g k
g-1
d.w
.)
Shoot
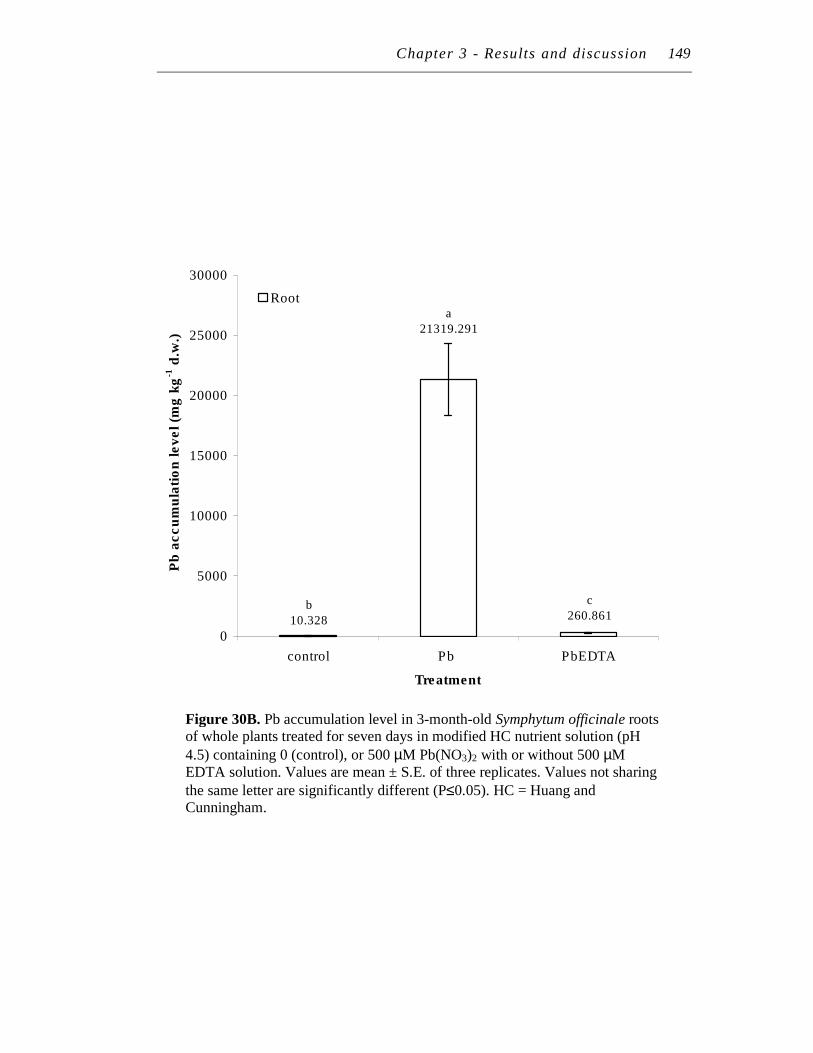
Chapter 3 - Results and discussion 149
Figure 30B. Pb accumulation level in 3-month-old Symphytum officinale roots of whole plants treated for seven days in modified HC nutrient solution (pH
4.5) containing 0 (control), or 500 µM Pb(NO3)2 with or without 500 µM EDTA solution. Values are mean ± S.E. of three replicates. Values not sharing
the same letter are significantly different (P≤0.05). HC = Huang and Cunningham.
a
21319.291
b
10.328
c
260.861
0
5000
10000
15000
20000
25000
30000
control Pb PbEDTA
Treatment
Pb
accu
mu
lati
on
level (m
g k
g-1
d.w
.)
Root
Chapter 3 − Results and discussion 150
8 WHY DOES EDTA REDUCE LEAD ACCUMULATION IN ROOTS?
The majority of phytoextraction studies published to date (e.g. Huang et al., 1997b;
Vassil et al., 1998) reported that EDTA increased or had no effect on heavy metal
accumulation in roots and shoots. In our studies, EDTA similarly increased Pb levels in
shoots. However, contrary to Vassil et al., (1998), increasing EDTA concentrations had
no additional positive effect on Pb shoot levels. Additionally, compared to unchelated
Pb treatments, all Pb levels in the roots of PbEDTA treatments decreased. Movement of
Pb to the shoots (translocation) did not account for most of the Pb lost from the roots*.
This section attempted to address why EDTA has this effect on Pb accumulation
(in the PbEDTA form) in S. officinale. This is important for phytoextraction because,
perceivably, if the concentration of Pb in the roots of chelated Pb-treated plants (at a 1:1
molar concetration) were higher, more Pb would accumulate in the shoots.
From the above Pb studies (results section 7.1 and 7.2) addition of EDTA to Pb
treatments resulted in a distinct loss in root colour, from dark to light brown. Did this
EDTA-induced colour loss contribute to a reduction in Pb accumulation at root level,
and consequently limit Pb accumulation in shoots? To address this question, pre-
treatment of root segments and whole plants with EDTA prior to Pb treatments (results
section 8.2 and 8.3) was planned. An alternative chelator (ADA) (results section 8.4)
was also planned.
Two possible explanations arose from these experiments:
(i) Replusion of PbEDTA complex (by root polyphenols)
(ii) EDTA is not a lead specific chelating agent
Only explaination (ii) appeared to directly involve the role of colour loss in reduction of
Pb accumulation. Since a combination of experiments are involved in these
explanations, experimental results are presented first followed by a discussion of how
these experiments relate to each of the two explanations above.
* Note that root and shoot values are comparable as separate tissues as the biomass of these tissues are approximately the same (Appendix G).
Chapter 3 − Results and discussion 151
8.1 EDTA pre-treated root segments
Two tests were performed on excised lateral roots (root segments) from 3-4 month-old
S. officinale plants: (i) a three day test: 18 hours EDTA pre-treatment followed by 24
hours Pb (with or without EDTA) treatment, and (ii) a seven day test: 72 hours EDTA
pre-treatment followed by 96 hours Pb treatment (with or without EDTA). After three
days the root segments appeared alive, but by seven days they were visibly dead (i.e.
browned throughout root section).
8.1.1 Effect of EDTA pre-treatment on lead accumulation level
Lead accumulation in the root segments treated with 500 µM Pb(NO3)2 (unchelated Pb)
appeared to increase over time (from the three day to seven day test), reaching over
80,000 mg kg-1 (8% d.w.) (Figure 31). Pre-treatment with 500 µM EDTA had no effect
on Pb accumulation (Figure 31). However, a completely opposite trend was observed
for 500 µM PbEDTA treatments (Figure 32). With time Pb accumulation decreased
further. The EDTA pre-treatment of roots exacerbated this effect. All Pb levels were
corrected against controls. It was also interesting to note that regardless of EDTA pre-
treatment, the level of Pb accumulated in PbEDTA root tissue (Figure 32) was at least
six times lower at day three and 37 times lower at day seven than unchelated Pb
treatments (Figure 31). Although only root segments were used, this trend was also the
same as experiments on whole plants (section 7.1 and 7.2 above). This is contrary to
Crist et al., (2004), who observed a reduction in Pb accumulation in excised root
segments but not intact whole seedlings of Brassica juncea with PbEDTA treatments.
8.1.2 Effect of EDTA pre-treatment on root appearance
Pre-treatment of root segments with 500 µM EDTA resulted in a loss of brown colour
from the roots (Figure 33A), leaving light brown roots that darkened slightly with time
(24 to 72 hours). This effect of EDTA was not as apparent after Pb treatments (photo
not shown).
The initial lightening of root colour may represent the loss of polyphenols due to
EDTA. However, quantitative analysis of polyphenol levels after the three day test
(Figure 33B) showed no significant loss in polyphenol levels to support this observation

Chapter 3 - Results and discussion 152
Figure 31. Pb accumulation level in Symphytum officinale lateral root segments after the three and seven day test with Pb(NO3)2. In the three day test, lateral root segments were pre-treated for 18 hours in modified HC nutrient solution (pH 4.5),
with or without 500 µM EDTA, followed by 24 hours in modified HC nutrient
solution (pH 4.5) containing 0 (control) or 500 µM Pb(NO3)2. The seven day test was the same, except the hours were extended to 72 hours for the EDTA pre-treatment and 96 hours for the Pb(NO3)2 treatment. Values are mean ± S.E. of three replicates and corrected with controls. Values sharing the same letter are not
significantly different (P≤0.05). HC = Huang and Cunningham.
ab
a
a
b
0
10000
20000
30000
40000
50000
60000
70000
80000
90000
100000
3 day test 7 day test
Treatment time
Pb
accu
mu
lati
on
level (m
g k
g-1
d.w
.)
Pb (without EDTA pre-treatment)
Pb (with EDTA pre-treatment)
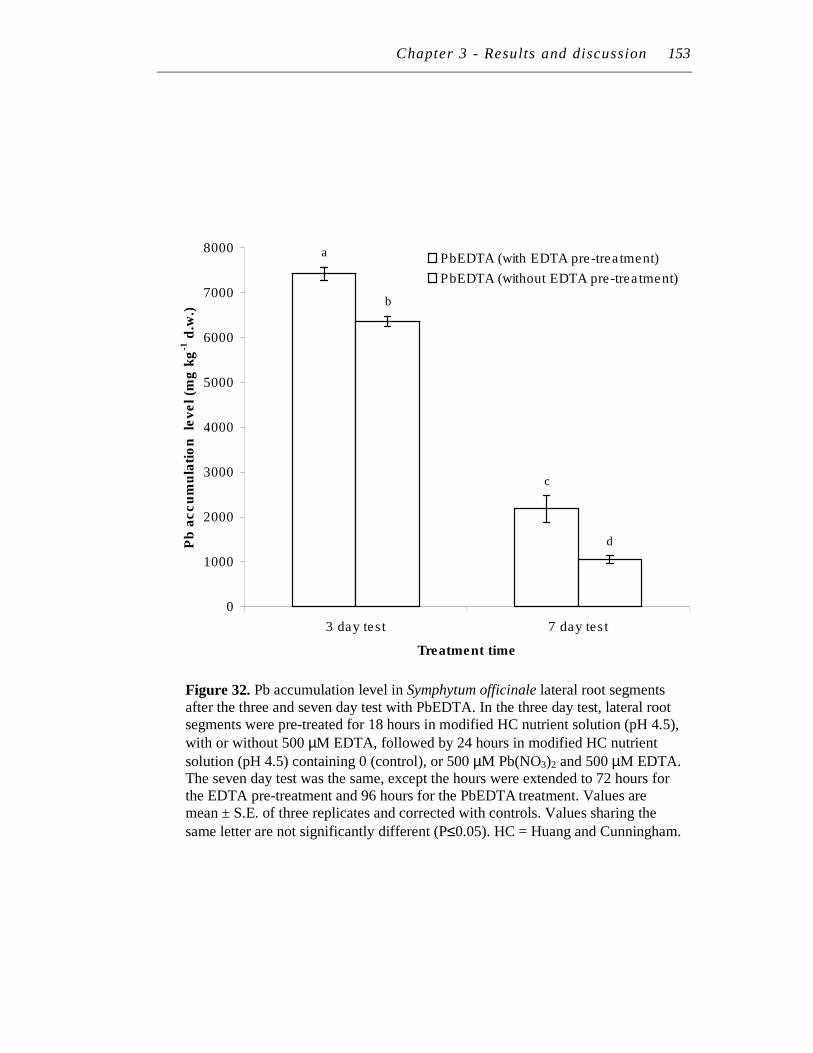
Chapter 3 - Results and discussion 153
Figure 32. Pb accumulation level in Symphytum officinale lateral root segments after the three and seven day test with PbEDTA. In the three day test, lateral root segments were pre-treated for 18 hours in modified HC nutrient solution (pH 4.5),
with or without 500 µM EDTA, followed by 24 hours in modified HC nutrient
solution (pH 4.5) containing 0 (control), or 500 µM Pb(NO3)2 and 500 µM EDTA. The seven day test was the same, except the hours were extended to 72 hours for the EDTA pre-treatment and 96 hours for the PbEDTA treatment. Values are mean ± S.E. of three replicates and corrected with controls. Values sharing the
same letter are not significantly different (P≤0.05). HC = Huang and Cunningham.
a
c
b
d
0
1000
2000
3000
4000
5000
6000
7000
8000
3 day test 7 day test
Treatment time
Pb
accu
mu
lati
on
le
vel (m
g k
g-1
d.w
.)
PbEDTA (with EDTA pre-treatment)
PbEDTA (without EDTA pre-treatment)
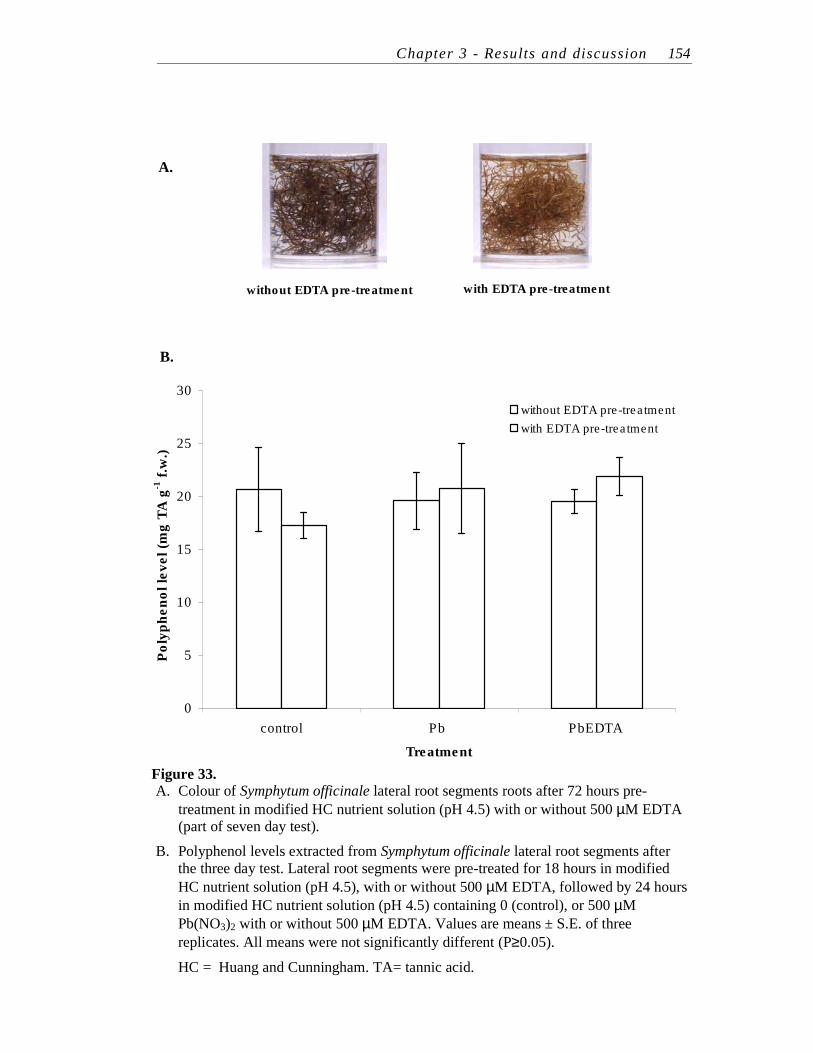
Chapter 3 - Results and discussion 154
0
5
10
15
20
25
30
control Pb PbEDTA
Treatment
Po
lyp
he
no
l le
ve
l (m
g T
A g
-1 f
.w.)
...
without EDTA pre-treatment
with EDTA pre-treatment
with EDTA pre-treatment
Figure 33. A. Colour of Symphytum officinale lateral root segments roots after 72 hours pre-
treatment in modified HC nutrient solution (pH 4.5) with or without 500 µM EDTA (part of seven day test).
B. Polyphenol levels extracted from Symphytum officinale lateral root segments after the three day test. Lateral root segments were pre-treated for 18 hours in modified
HC nutrient solution (pH 4.5), with or without 500 µM EDTA, followed by 24 hours
in modified HC nutrient solution (pH 4.5) containing 0 (control), or 500 µM
Pb(NO3)2 with or without 500 µM EDTA. Values are means ± S.E. of three
replicates. All means were not significantly different (P≥0.05).
HC = Huang and Cunningham. TA= tannic acid.
without EDTA pre-treatment
A.
B.
Chapter 3 − Results and discussion 155
(P≥0.05). Root wounding may have masked any effect of EDTA. No polyphenol levels
were measured after 96 hours because the roots were visibly dead.
8.2 EDTA pre-treated whole plants
The root segment test provided valuable information on the effect of EDTA pre-
treatment and time on Pb accumulation. However with respect to polyphenol levels,
trends could not be observed because root wounding may have masked EDTA treatment
effects. Thus the goal of this experiment was to run a similar test but using roots (lateral
and main roots) from non-wounded living plants. S. officinale plants were pre-treated
with 500 µM EDTA for three days before treatment with 500 µM Pb(NO3)2 (unchelated
Pb) or PbEDTA (chelated Pb), for four days.
8.2.1 Effect of EDTA pre-treatment on lead accumulation level
Despite an apparent decreasing trend, EDTA pre-treatment did not statistically (P≥0.05)
affect root accumulation of Pb in either Pb treatments (500 µM Pb(NO3)2 and PbEDTA)
(Figure 34A).
Interestingly, Pb reduction in shoots of EDTA pre-treated plants treated with 500
µM PbEDTA was significant (P≤0.05) and was only observed in this experiment. In this
treatment, the level of Pb in the shoot decreased by 35% on an average dry weight basis
(P≤0.05) (Figure 34B). It is important to note that the comparison of the relative Pb
concentration in roots and shoots separately was possible as root and shoot biomass
were not significantly (P≥0.05) different (Appendix G).
8.2.2 Effect of EDTA pre-treatment on root appearance
The EDTA pre-treatment appeared to increase the number of lateral roots in plants
treated with 500 µM Pb(NO3)2. However, this EDTA pre-treatment effect was not
apparent in 500 µM PbEDTA treatments. Even without EDTA pre-treatment, PbEDTA
caused more lateral roots to form compared to plants treated with 500 µM Pb(NO3)2. All
Pb treatments appeared to reduce root growth when compared to the control (Plate
16A). These observations resulting from EDTA exposure, in pre-treatment or part of Pb
treatment, seem to reflect the effect of EDTA on Pb levels in the root tissues. The
EDTA pre-treated and PbEDTA-treated roots appeared to accumulate less Pb,
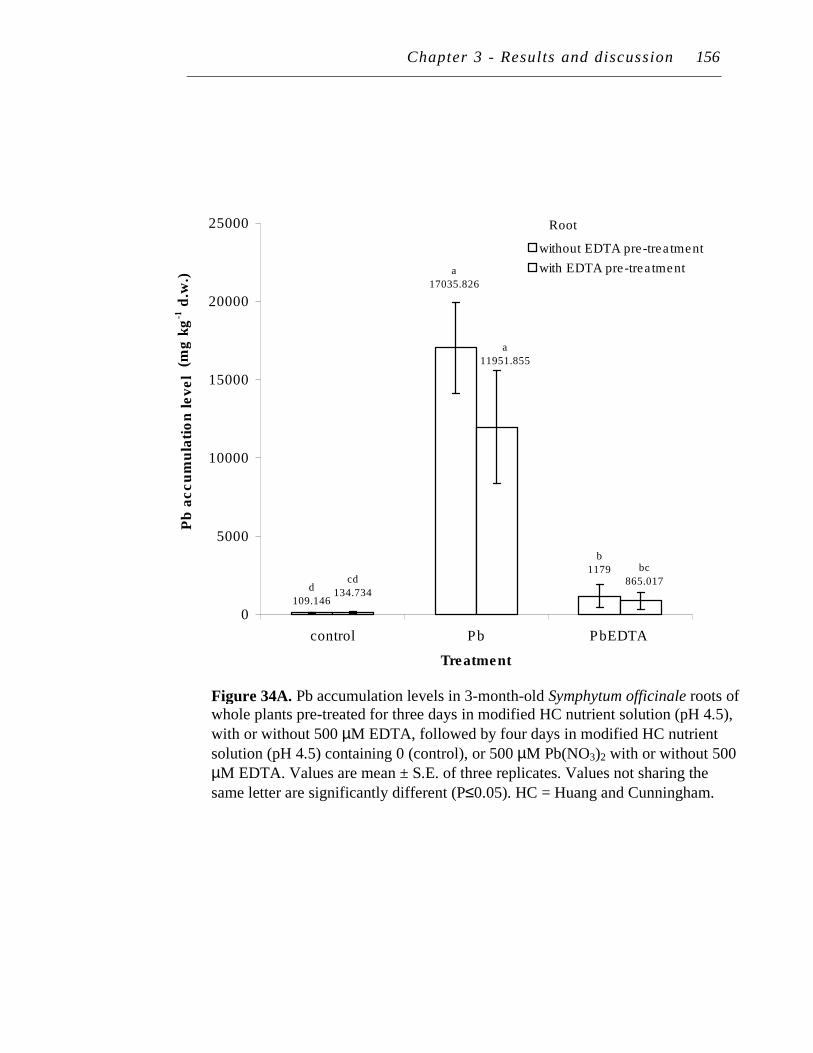
Chapter 3 - Results and discussion 156
b
1179
a
17035.826
d
109.146
bc
865.017
a
11951.855
cd
134.734
0
5000
10000
15000
20000
25000
control Pb PbEDTA
Treatment
Pb
accu
mu
lati
on
level
(mg
/kg
d.w
.)..
.
without EDTA pre-treatment
with EDTA pre-treatment
Figure 34A. Pb accumulation levels in 3-month-old Symphytum officinale roots of whole plants pre-treated for three days in modified HC nutrient solution (pH 4.5),
with or without 500 µM EDTA, followed by four days in modified HC nutrient
solution (pH 4.5) containing 0 (control), or 500 µM Pb(NO3)2 with or without 500
µM EDTA. Values are mean ± S.E. of three replicates. Values not sharing the
same letter are significantly different (P≤0.05). HC = Huang and Cunningham.
Root
(mg
kg
-1 d
.w.)
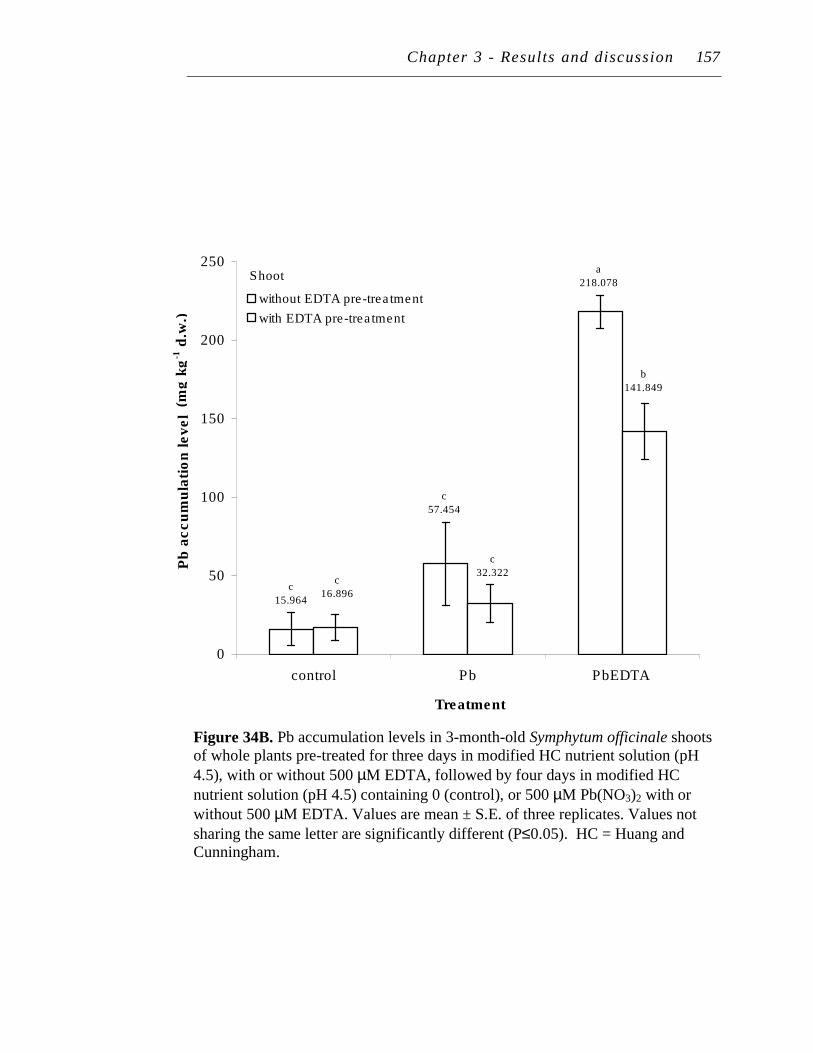
Chapter 3 - Results and discussion 157
Figure 34B. Pb accumulation levels in 3-month-old Symphytum officinale shoots of whole plants pre-treated for three days in modified HC nutrient solution (pH
4.5), with or without 500 µM EDTA, followed by four days in modified HC
nutrient solution (pH 4.5) containing 0 (control), or 500 µM Pb(NO3)2 with or
without 500 µM EDTA. Values are mean ± S.E. of three replicates. Values not
sharing the same letter are significantly different (P≤0.05). HC = Huang and Cunningham.
a
218.078
c
57.454
c
15.964
b
141.849
c
32.322c
16.896
0
50
100
150
200
250
control Pb PbEDTA
Treatment
Pb
accu
mu
lati
on
level
(mg
/kg
d.w
.)..
.
without EDTA pre-treatment
with EDTA pre-treatment
Shoot
(mg
kg
-1 d
.w.)
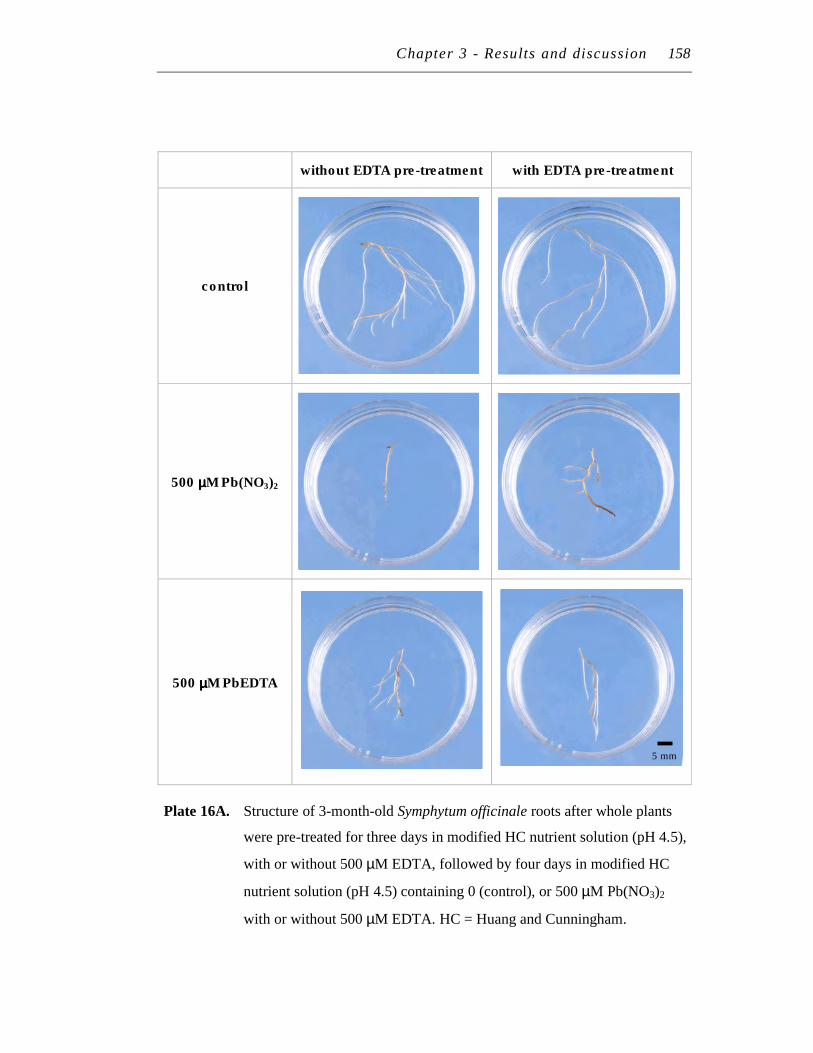
Chapter 3 - Results and discussion 158
without EDTA pre-treatment with EDTA pre-treatment
control
500 µµµµM Pb(NO3)2
500 µµµµM PbEDTA
Plate 16A. Structure of 3-month-old Symphytum officinale roots after whole plants
were pre-treated for three days in modified HC nutrient solution (pH 4.5),
with or without 500 µM EDTA, followed by four days in modified HC
nutrient solution (pH 4.5) containing 0 (control), or 500 µM Pb(NO3)2
with or without 500 µM EDTA. HC = Huang and Cunningham.
5 mm

Chapter 3 − Results and discussion 159
thus reducing root growth inhibition.
In terms of root colour, EDTA pre-treatment clearly resulted in a loss of brown
colour from the roots, with the most pronounced effect in PbEDTA treatments (Plate
16B). However despite the clear loss in root colour, the apparent reducing trend in
polyphenol levels was not significant (Figure 35A). There were no trends in tannin
levels (Figure 35B). The other and more significant reason for the loss in root colour
was Fe. When analysed, a decrease in Fe levels was also apparent, but again was not
significant at a statistical level (Figure 36).
8.3 Alternative chelating agents
8.3.1 Why choose ADA?
In the present work, EDTA pre-treatment appeared to reduce Pb, Fe and polyphenol
levels at root level. However despite the apparent trends, the results were not significant
(P≥0.05). Thus a strong link between the role of polyphenols and Fe reduction with how
EDTA may have reduced Pb accumulation in roots could not be drawn.
Polyphenol levels were not measured in this experiment as the changes between
the chelated Pb and control plants from the previous experiments were not large enough
to warrant further investigation. Instead the possible role of polyphenols in charge
repulsion of the PbEDTA complex was investigated by changing to a chelating agent
with a neutrally charged chelated Pb complex. Since there was quite a strong decrease
in Fe levels, the Fe levels in this section were re-tested. Co-incidentally, ADA (N-[2
acetamido] iminodiacetic acid) was able to test both of these factors. At equimolar
Pb:ADA concentrations, PbADA is neutrally charged (Chen and Hong, 1995). The
same authors also note that ADA is a better Pb chelating agent than EDTA because it
favours chelation with Pb ions over other competing cations, such as Fe and Ca in the
soil. Additionally, ADA also had a comparable Pb soil extraction ability. It ranked a
close second to EDTA in its ability to extract Pb from soils; 84% of Pb in soil is
solubilised vs. 86% for EDTA (Steele and Pitchel, 1998). Moreover, ADA is not an
entirely different chelator to EDTA. Both are analogs of iminodiacetic acid (IDA) (Xie
and Marshall, 2001).
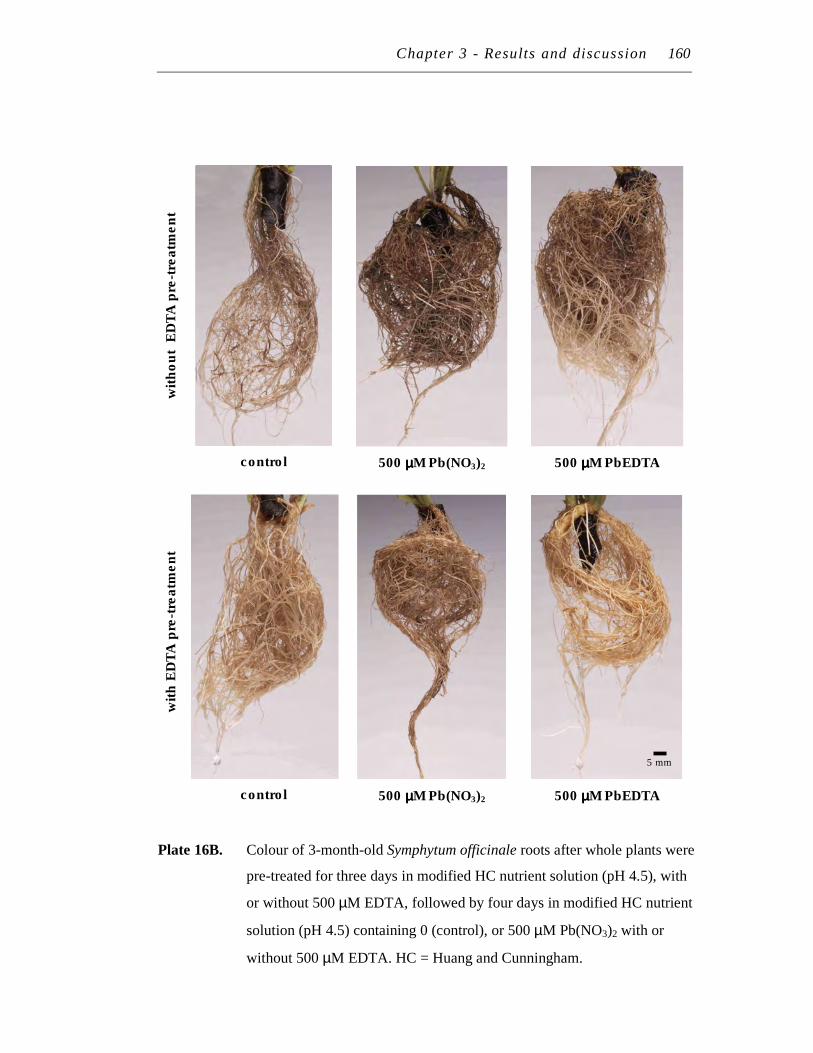
Chapter 3 - Results and discussion 160
w
ith
ou
t E
DT
A p
re-t
reatm
en
t
control
500 µµµµM Pb(NO3)2
500 µµµµM PbEDTA
w
ith
ED
TA
pre
-tre
atm
en
t
control
500 µµµµM Pb(NO3)2
500 µµµµM PbEDTA
Plate 16B. Colour of 3-month-old Symphytum officinale roots after whole plants were
pre-treated for three days in modified HC nutrient solution (pH 4.5), with
or without 500 µM EDTA, followed by four days in modified HC nutrient
solution (pH 4.5) containing 0 (control), or 500 µM Pb(NO3)2 with or
without 500 µM EDTA. HC = Huang and Cunningham.
5 mm
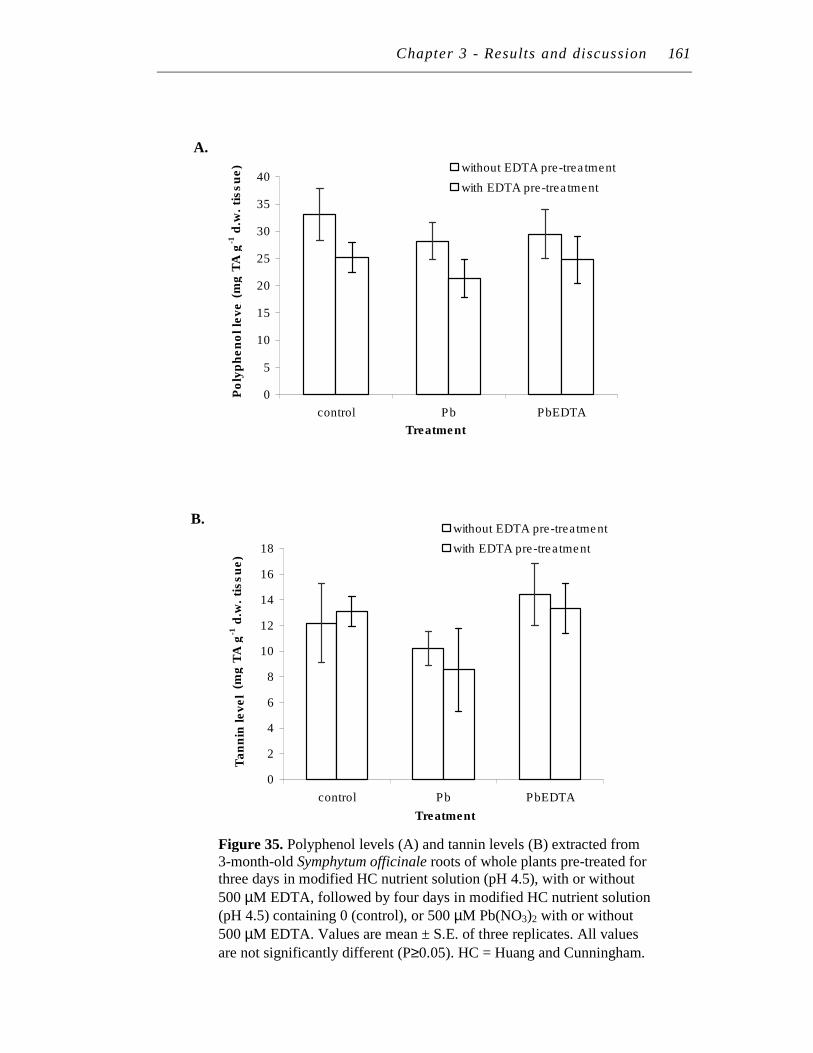
Chapter 3 - Results and discussion 161
0
5
10
15
20
25
30
35
40
control Pb PbEDTA
Treatment
Po
lyp
hen
ol
level
(mg
TA
/g d
.w.
tissu
e) without EDTA pre-treatment
with EDTA pre-treatment
0
2
4
6
8
10
12
14
16
18
control Pb PbEDTA
Treatment
Tan
nin
level
(mg
TA
/g d
.w.
tissu
e)
without EDTA pre-treatment
with EDTA pre-treatment
Figure 35. Polyphenol levels (A) and tannin levels (B) extracted from 3-month-old Symphytum officinale roots of whole plants pre-treated for three days in modified HC nutrient solution (pH 4.5), with or without
500 µM EDTA, followed by four days in modified HC nutrient solution
(pH 4.5) containing 0 (control), or 500 µM Pb(NO3)2 with or without
500 µM EDTA. Values are mean ± S.E. of three replicates. All values
are not significantly different (P≥0.05). HC = Huang and Cunningham.
A.
B.
(mg
TA
g-1
d.w
. ti
ss
ue)
(mg
TA
g-1
d.w
. ti
ssu
e)
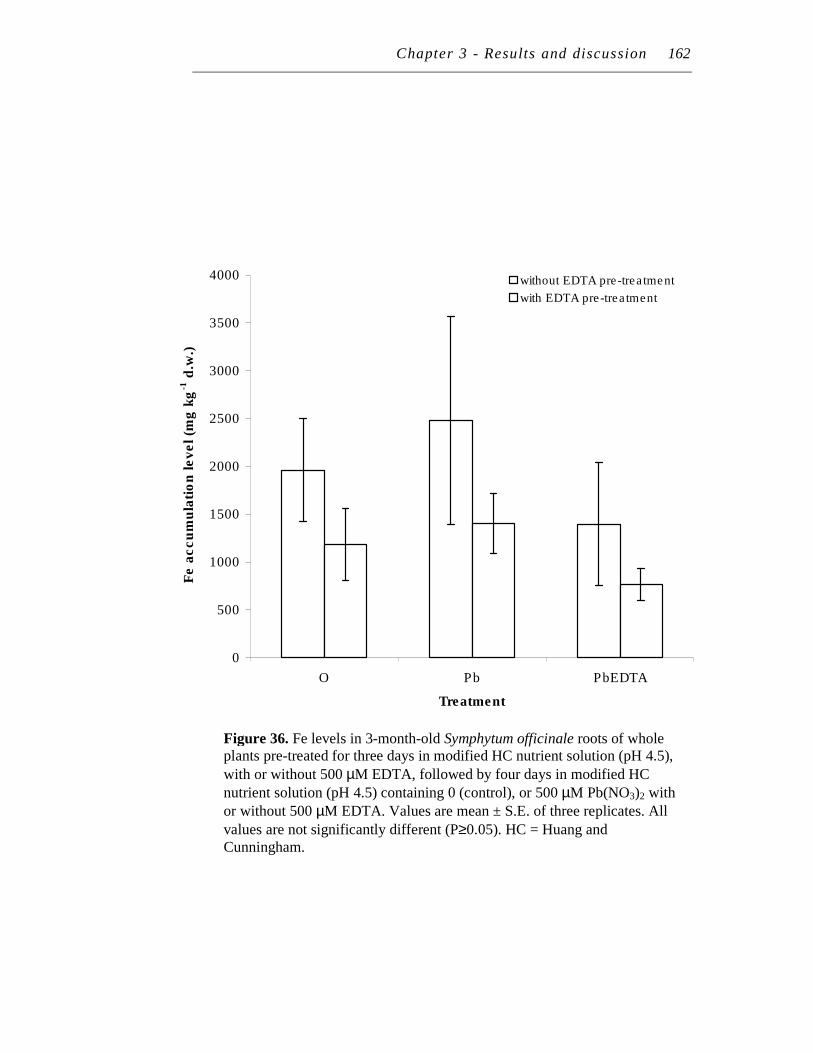
Chapter 3 - Results and discussion 162
Figure 36. Fe levels in 3-month-old Symphytum officinale roots of whole plants pre-treated for three days in modified HC nutrient solution (pH 4.5),
with or without 500 µM EDTA, followed by four days in modified HC
nutrient solution (pH 4.5) containing 0 (control), or 500 µM Pb(NO3)2 with
or without 500 µM EDTA. Values are mean ± S.E. of three replicates. All
values are not significantly different (P≥0.05). HC = Huang and Cunningham.
0
500
1000
1500
2000
2500
3000
3500
4000
O Pb PbEDTA
Treatment
Fe
ac
cu
mu
lati
on
le
ve
l (m
g k
g-1
d.w
.)
without EDTA pre-treatment
with EDTA pre-treatment
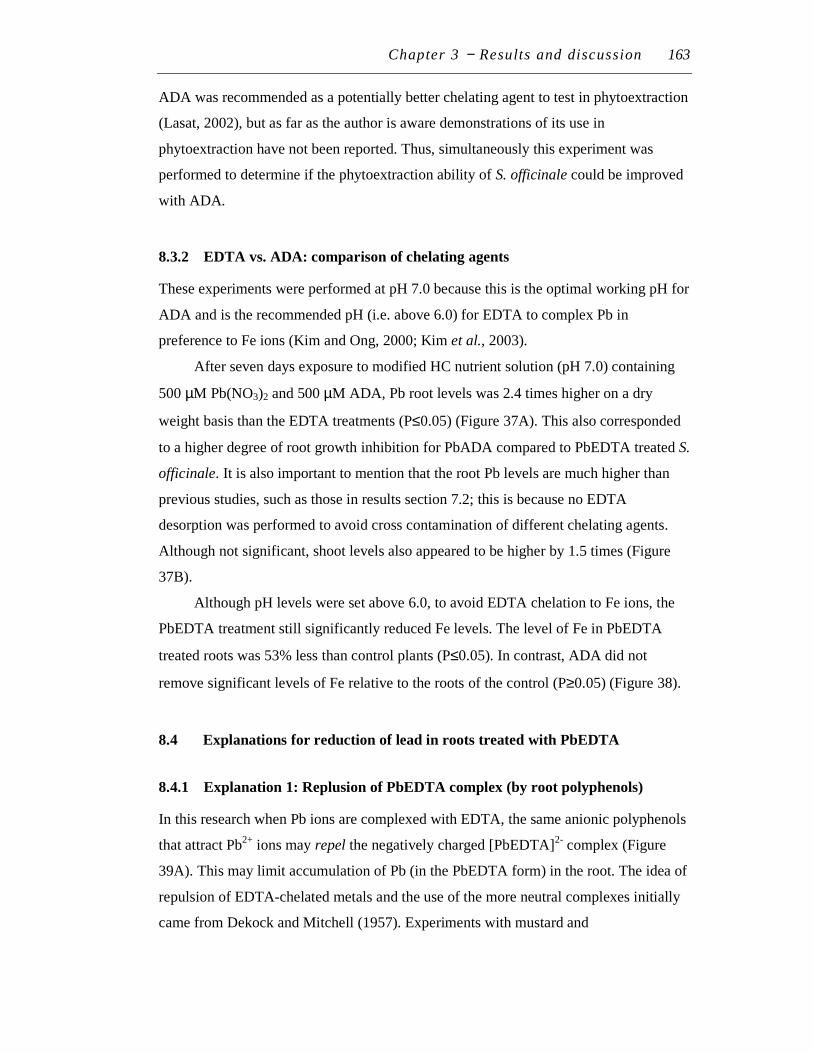
Chapter 3 − Results and discussion 163
ADA was recommended as a potentially better chelating agent to test in phytoextraction
(Lasat, 2002), but as far as the author is aware demonstrations of its use in
phytoextraction have not been reported. Thus, simultaneously this experiment was
performed to determine if the phytoextraction ability of S. officinale could be improved
with ADA.
8.3.2 EDTA vs. ADA: comparison of chelating agents
These experiments were performed at pH 7.0 because this is the optimal working pH for
ADA and is the recommended pH (i.e. above 6.0) for EDTA to complex Pb in
preference to Fe ions (Kim and Ong, 2000; Kim et al., 2003).
After seven days exposure to modified HC nutrient solution (pH 7.0) containing
500 µM Pb(NO3)2 and 500 µM ADA, Pb root levels was 2.4 times higher on a dry
weight basis than the EDTA treatments (P≤0.05) (Figure 37A). This also corresponded
to a higher degree of root growth inhibition for PbADA compared to PbEDTA treated S.
officinale. It is also important to mention that the root Pb levels are much higher than
previous studies, such as those in results section 7.2; this is because no EDTA
desorption was performed to avoid cross contamination of different chelating agents.
Although not significant, shoot levels also appeared to be higher by 1.5 times (Figure
37B).
Although pH levels were set above 6.0, to avoid EDTA chelation to Fe ions, the
PbEDTA treatment still significantly reduced Fe levels. The level of Fe in PbEDTA
treated roots was 53% less than control plants (P≤0.05). In contrast, ADA did not
remove significant levels of Fe relative to the roots of the control (P≥0.05) (Figure 38).
8.4 Explanations for reduction of lead in roots treated with PbEDTA
8.4.1 Explanation 1: Replusion of PbEDTA complex (by root polyphenols)
In this research when Pb ions are complexed with EDTA, the same anionic polyphenols
that attract Pb2+ ions may repel the negatively charged [PbEDTA]2- complex (Figure
39A). This may limit accumulation of Pb (in the PbEDTA form) in the root. The idea of
repulsion of EDTA-chelated metals and the use of the more neutral complexes initially
came from Dekock and Mitchell (1957). Experiments with mustard and
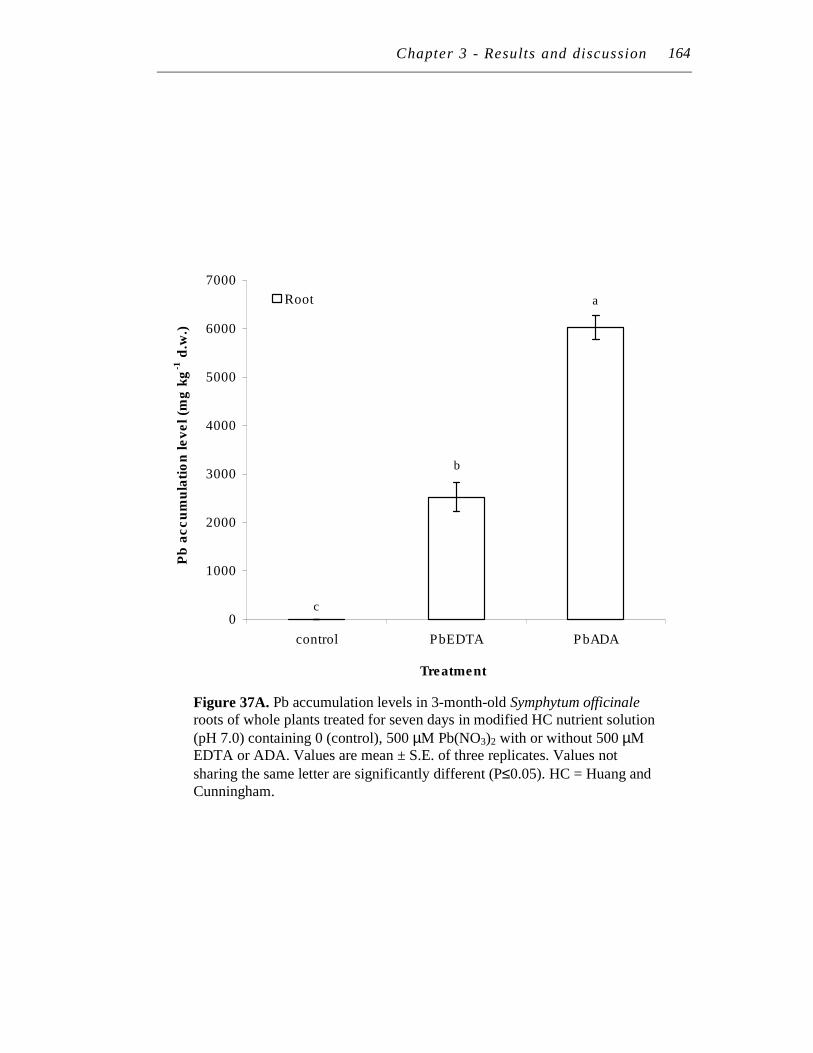
Chapter 3 - Results and discussion 165
164
c
a
b
0
1000
2000
3000
4000
5000
6000
7000
control PbEDTA PbADA
Treatment
Pb
accu
mu
lati
on
level (m
g k
g-1
d.w
.)
Root
Figure 37A. Pb accumulation levels in 3-month-old Symphytum officinale roots of whole plants treated for seven days in modified HC nutrient solution
(pH 7.0) containing 0 (control), 500 µM Pb(NO3)2 with or without 500 µM EDTA or ADA. Values are mean ± S.E. of three replicates. Values not
sharing the same letter are significantly different (P≤0.05). HC = Huang and Cunningham.

Chapter 3 - Results and discussion 165 165
a
a
b
0
100
200
300
400
500
600
700
800
control PbEDTA PbADA
Treatment
Pb
accu
mu
lati
on
level (m
g k
g-1
d.w
.)
Shoot
Figure 37B. Pb accumulation levels in 3-month-old Symphytum officinale shoots of whole plants teated for seven days in modified HC nutrient
solution (pH 7.0) containing 0 (control), 500 µM Pb(NO3)2 with or without
500 µM EDTA or ADA. Values are mean ± S.E. of three replicates. Values
not sharing the same letter are significantly different (P≤0.05). HC = Huang and Cunningham.
Chapter 3 - Results and discussion 166
Figure 38. Effect of different chelating agents on Fe levels in 3-month-old Symphytum officinale roots of whole plants pre-treated for seven days in
modified HC nutrient solution (pH 7.0) containing 0 (control), or 500 µM
Pb(NO3)2 with or without 500 µM EDTA or 500 µM ADA.Values are mean ± S.E. of three replicates. Values not sharing the same letter are
significantly different (P≤0.05). HC = Huang and Cunningham.
a
b
a
0
500
1000
1500
2000
2500
control PbEDTA PbADA
Treatment
Fe l
evel
(mg
kg
-1 d
.w.)
Roots
Chapter 3 − Results and discussion 167
tomatoes suggested that EDTA complexes of trivalent ions (e.g. Fe3+) facilitate uptake
of the cations, where as EDTA complexes with divalent cations (e.g. Cu2+) has the
opposite effect. This is because of the difference in overall charge of the complexes.
Trivalent ions form complexes with no charge or a single negative charge and can be
taken up, whilst divalent cations form EDTA complexes with two negative charges and
are repelled. From a medical standpoint Shulman and Dwyer (1964) stated that EDTA
and some of its analogs form hydrophilic anions, and as a result penetrate cells poorly.
Sattelmacher (2001) also stated that negative charges of the root cell wall favoured the
accumulation of cations and repelled anions.
EDTA pre-treatment may exacerbate this charge-based repulsion by increasing
polyphenol polymerisation, a reaction that creates a more concentrated region/barrier
of anionic charge. Polymerisation may also reduce the number of ionic binding sites and
the rate of Pb accumulation (Figure 40).
The mechanism for such polymerisation activation is unknown, but it is possible
that EDTA induced a loss in polyphenols and/or removed cations (e.g. Ca2+) stabilising
the cell wall. Although at much higher concentrations (0.1M), EDTA has been
documented to cause separation of root cell tips by removing cell wall/plasma
membrane stabilising ions (e.g. Mg2+ and Ca2+) during the development of TEM sample
preparation methods (Klein and Ginzburg; 1959). Vassil et al., (1998) also suggested
that EDTA could remove these plasma membrane stabilising ions. But in this
phytoextraction study it was suggested that this may induce [PbEDTA]2- access to roots.
Additionally, PbEDTA may also induce oxidative stress (Geebelen et al., 2002), a
process that can also lead to polymerisation.
In the results above, this like-charge repulsion due to increased polyphenol levels
or polymerisation was possibly supported by:
(i) Whole plant test: The polyphenol trends from this section were slightly
clearer. EDTA pre-treatment appeared to reduce the polyphenol levels
possibly reflecting polyphenol polymerisation. Polyphenol polymerisation
reduces polyphenol extraction and levels (Strycharz and Shetty 2002a and b
b), a part of the lignification process that is involved in root growth
inhibition (Hose et al., 2001, see Chapter 4 for more discussion). This could
explain the reduction in Pb accumulation levels in EDTA pre-treated plants.
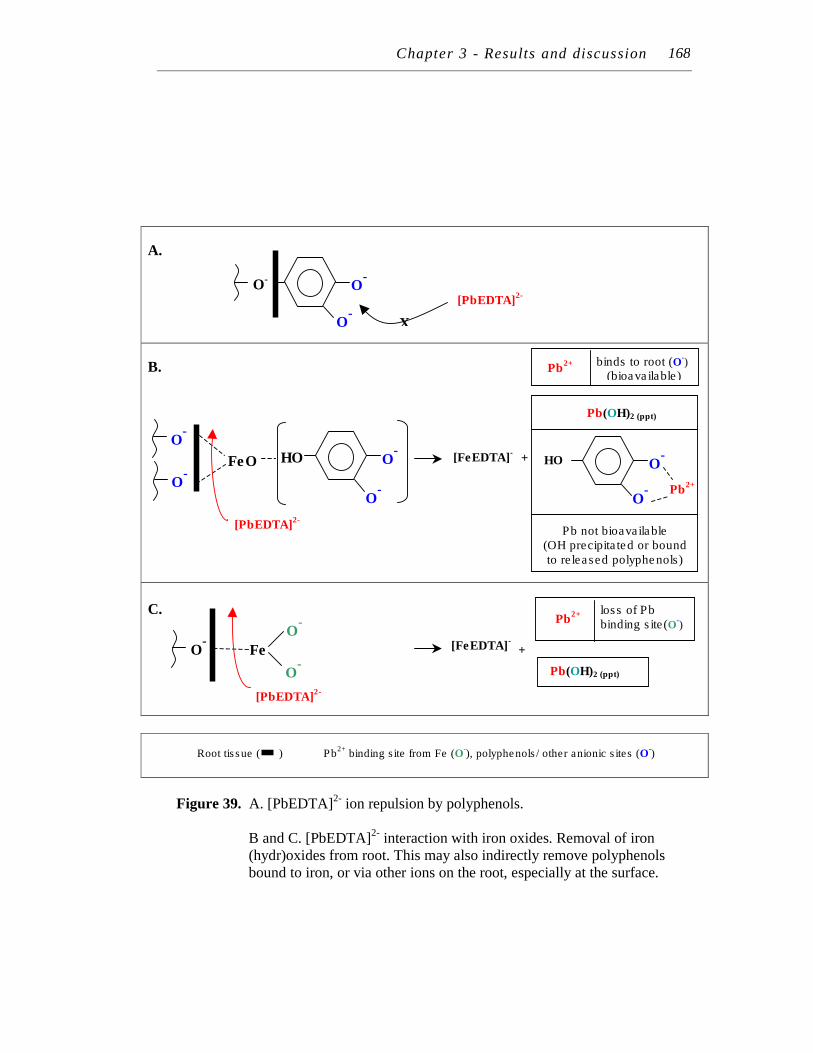
Chapter 3 - Results and discussion 172
A.
B.
C.
Root tissue ( ) Pb2+
binding site from Fe (O-), polyphenols/ other anionic sites (O
-)
Figure 39. A. [PbEDTA]2- ion repulsion by polyphenols.
B and C. [PbEDTA]2- interaction with iron oxides. Removal of iron (hydr)oxides from root. This may also indirectly remove polyphenols bound to iron, or via other ions on the root, especially at the surface.
loss of Pb binding site(O-
)
binds to root (O-)
(bioavailable)
Pb not bioavailable (OH precipitated or bound to released polyphenols)
[PbEDTA]2-
O-
O-
O-
X
[FeEDTA]- HO
Pb2+
O
-
O-
Pb2+
FeO
O-
O-
+
Pb(OH)2 (ppt)
[PbEDTA]2-
HO
O-
O-
O-
O-
Fe
O-
[PbEDTA]2-
Pb(OH)2 (ppt)
Pb2+
[FeEDTA]- +
168
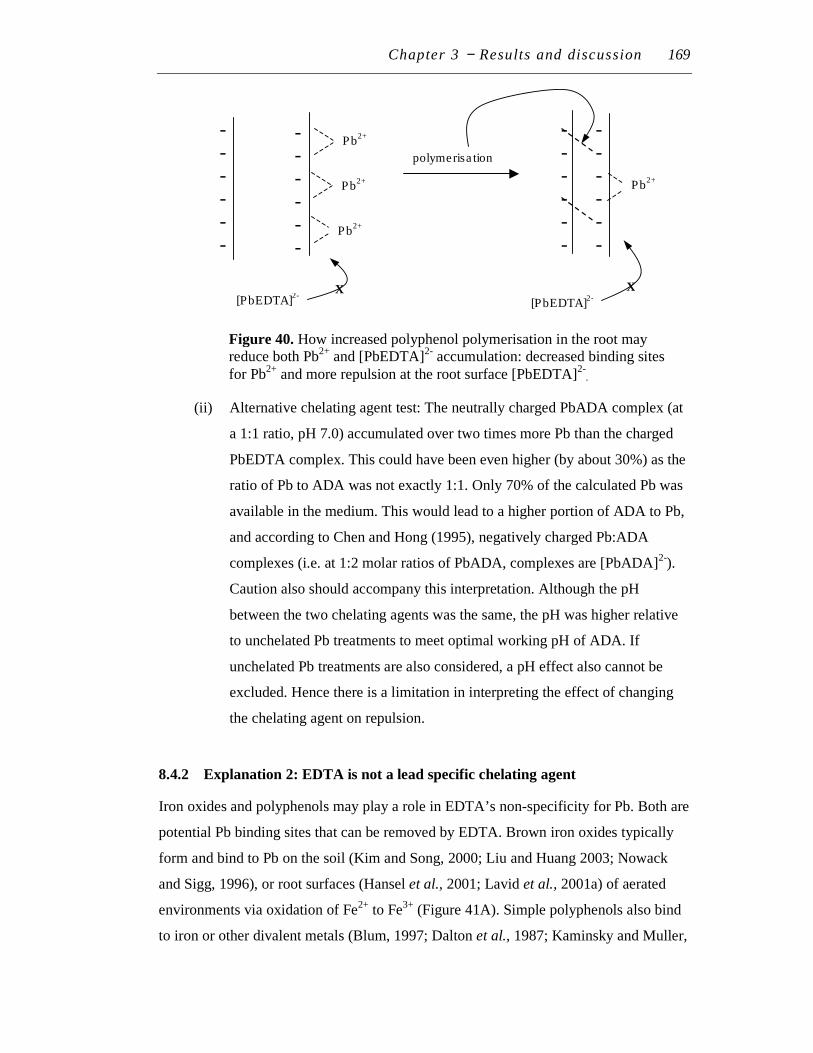
Chapter 3 − Results and discussion 169
(ii) Alternative chelating agent test: The neutrally charged PbADA complex (at
a 1:1 ratio, pH 7.0) accumulated over two times more Pb than the charged
PbEDTA complex. This could have been even higher (by about 30%) as the
ratio of Pb to ADA was not exactly 1:1. Only 70% of the calculated Pb was
available in the medium. This would lead to a higher portion of ADA to Pb,
and according to Chen and Hong (1995), negatively charged Pb:ADA
complexes (i.e. at 1:2 molar ratios of PbADA, complexes are [PbADA]2-).
Caution also should accompany this interpretation. Although the pH
between the two chelating agents was the same, the pH was higher relative
to unchelated Pb treatments to meet optimal working pH of ADA. If
unchelated Pb treatments are also considered, a pH effect also cannot be
excluded. Hence there is a limitation in interpreting the effect of changing
the chelating agent on repulsion.
8.4.2 Explanation 2: EDTA is not a lead specific chelating agent
Iron oxides and polyphenols may play a role in EDTA’s non-specificity for Pb. Both are
potential Pb binding sites that can be removed by EDTA. Brown iron oxides typically
form and bind to Pb on the soil (Kim and Song, 2000; Liu and Huang 2003; Nowack
and Sigg, 1996), or root surfaces (Hansel et al., 2001; Lavid et al., 2001a) of aerated
environments via oxidation of Fe2+ to Fe3+ (Figure 41A). Simple polyphenols also bind
to iron or other divalent metals (Blum, 1997; Dalton et al., 1987; Kaminsky and Muller,
Figure 40. How increased polyphenol polymerisation in the root may reduce both Pb2+ and [PbEDTA]2- accumulation: decreased binding sites for Pb2+ and more repulsion at the root surface [PbEDTA]2-
.
- - - - - -
- - - - - -
- - - - - -
- - - - - -
polymerisation
Pb2+
Pb2+
Pb2+
Pb2+
[PbEDTA]2-
[PbEDTA]2-
X X
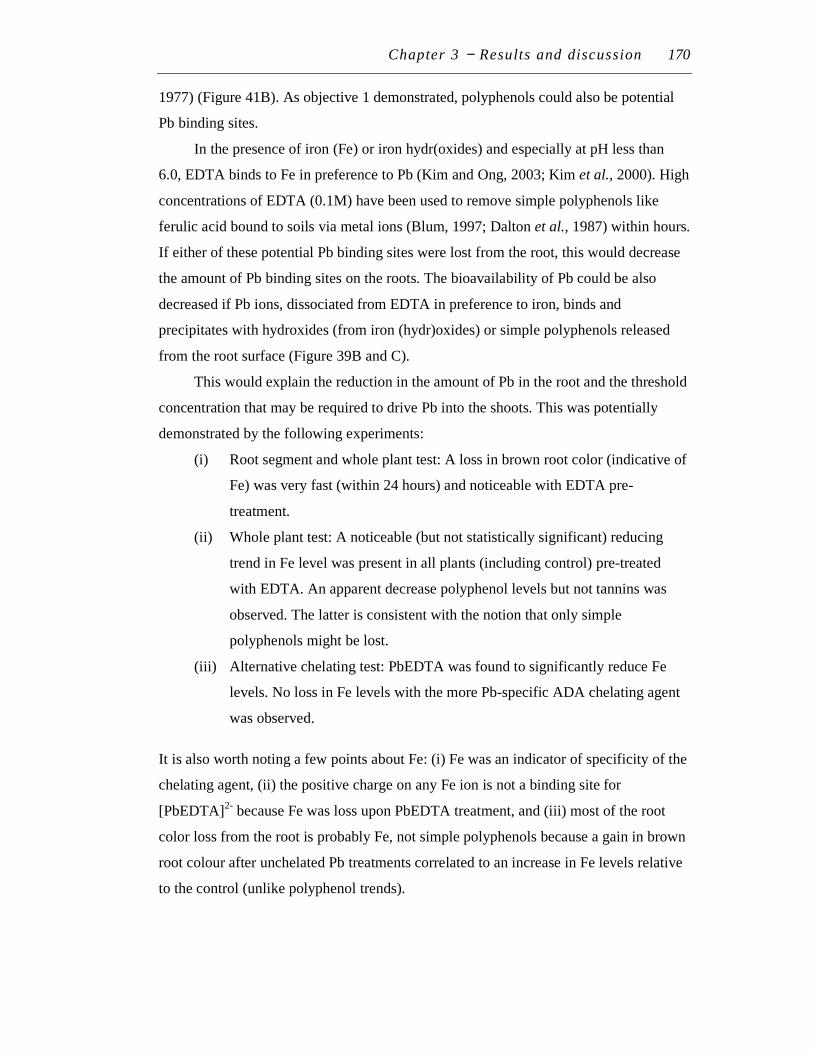
Chapter 3 − Results and discussion 170
1977) (Figure 41B). As objective 1 demonstrated, polyphenols could also be potential
Pb binding sites.
In the presence of iron (Fe) or iron hydr(oxides) and especially at pH less than
6.0, EDTA binds to Fe in preference to Pb (Kim and Ong, 2003; Kim et al., 2000). High
concentrations of EDTA (0.1M) have been used to remove simple polyphenols like
ferulic acid bound to soils via metal ions (Blum, 1997; Dalton et al., 1987) within hours.
If either of these potential Pb binding sites were lost from the root, this would decrease
the amount of Pb binding sites on the roots. The bioavailability of Pb could be also
decreased if Pb ions, dissociated from EDTA in preference to iron, binds and
precipitates with hydroxides (from iron (hydr)oxides) or simple polyphenols released
from the root surface (Figure 39B and C).
This would explain the reduction in the amount of Pb in the root and the threshold
concentration that may be required to drive Pb into the shoots. This was potentially
demonstrated by the following experiments:
(i) Root segment and whole plant test: A loss in brown root color (indicative of
Fe) was very fast (within 24 hours) and noticeable with EDTA pre-
treatment.
(ii) Whole plant test: A noticeable (but not statistically significant) reducing
trend in Fe level was present in all plants (including control) pre-treated
with EDTA. An apparent decrease polyphenol levels but not tannins was
observed. The latter is consistent with the notion that only simple
polyphenols might be lost.
(iii) Alternative chelating test: PbEDTA was found to significantly reduce Fe
levels. No loss in Fe levels with the more Pb-specific ADA chelating agent
was observed.
It is also worth noting a few points about Fe: (i) Fe was an indicator of specificity of the
chelating agent, (ii) the positive charge on any Fe ion is not a binding site for
[PbEDTA]2- because Fe was loss upon PbEDTA treatment, and (iii) most of the root
color loss from the root is probably Fe, not simple polyphenols because a gain in brown
root colour after unchelated Pb treatments correlated to an increase in Fe levels relative
to the control (unlike polyphenol trends).
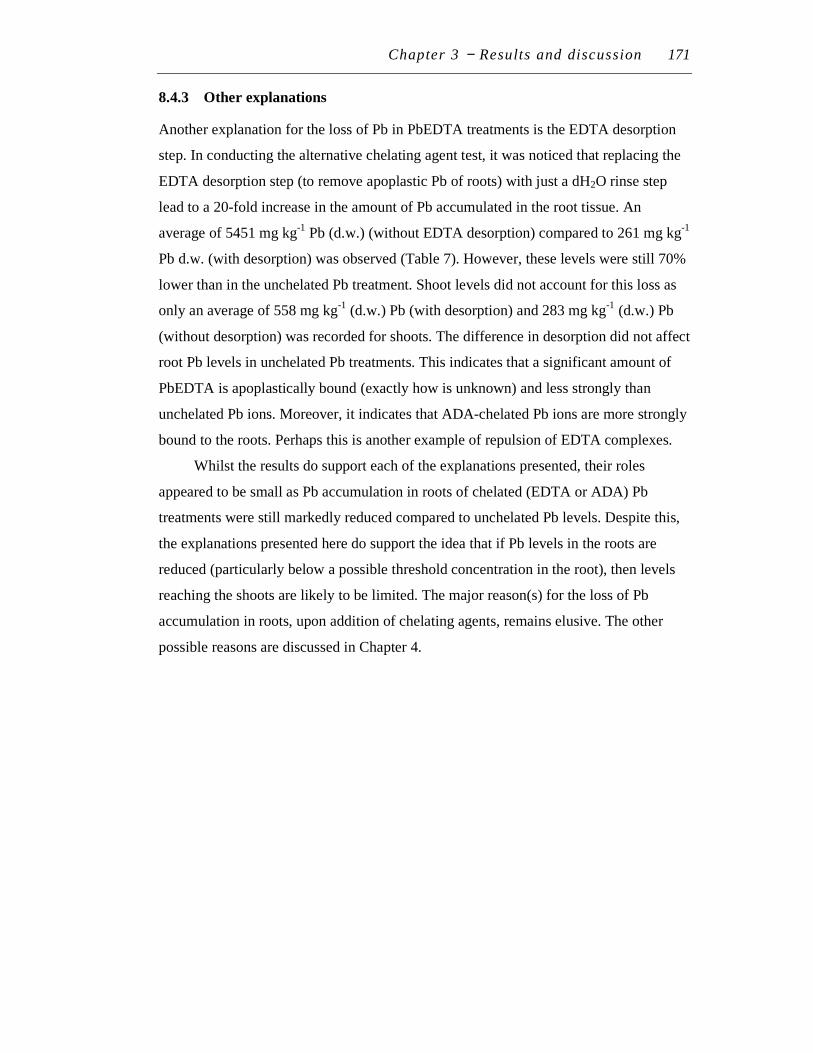
Chapter 3 − Results and discussion 171
8.4.3 Other explanations
Another explanation for the loss of Pb in PbEDTA treatments is the EDTA desorption
step. In conducting the alternative chelating agent test, it was noticed that replacing the
EDTA desorption step (to remove apoplastic Pb of roots) with just a dH2O rinse step
lead to a 20-fold increase in the amount of Pb accumulated in the root tissue. An
average of 5451 mg kg-1 Pb (d.w.) (without EDTA desorption) compared to 261 mg kg-1
Pb d.w. (with desorption) was observed (Table 7). However, these levels were still 70%
lower than in the unchelated Pb treatment. Shoot levels did not account for this loss as
only an average of 558 mg kg-1 (d.w.) Pb (with desorption) and 283 mg kg-1 (d.w.) Pb
(without desorption) was recorded for shoots. The difference in desorption did not affect
root Pb levels in unchelated Pb treatments. This indicates that a significant amount of
PbEDTA is apoplastically bound (exactly how is unknown) and less strongly than
unchelated Pb ions. Moreover, it indicates that ADA-chelated Pb ions are more strongly
bound to the roots. Perhaps this is another example of repulsion of EDTA complexes.
Whilst the results do support each of the explanations presented, their roles
appeared to be small as Pb accumulation in roots of chelated (EDTA or ADA) Pb
treatments were still markedly reduced compared to unchelated Pb levels. Despite this,
the explanations presented here do support the idea that if Pb levels in the roots are
reduced (particularly below a possible threshold concentration in the root), then levels
reaching the shoots are likely to be limited. The major reason(s) for the loss of Pb
accumulation in roots, upon addition of chelating agents, remains elusive. The other
possible reasons are discussed in Chapter 4.
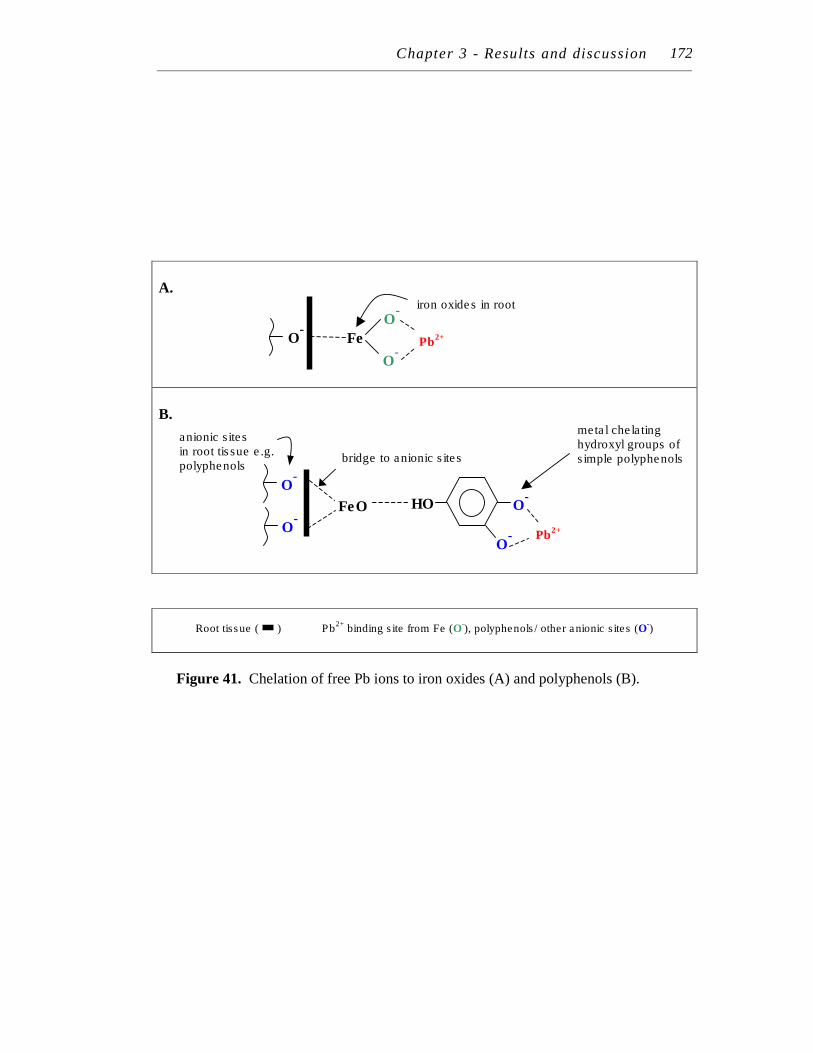
Chapter 3 - Results and discussion 171
A.
B.
Root tissue ( ) Pb2+
binding site from Fe (O-), polyphenols/ other anionic sites (O
-)
Figure 41. Chelation of free Pb ions to iron oxides (A) and polyphenols (B).
FeO
O-
O-
HO
O-
O-
Pb2+
metal chelating hydroxyl groups of simple polyphenols bridge to anionic sites
anionic sites in root tissue e.g. polyphenols
O-
O-
Fe
O-
Pb2+
iron oxides in root
172
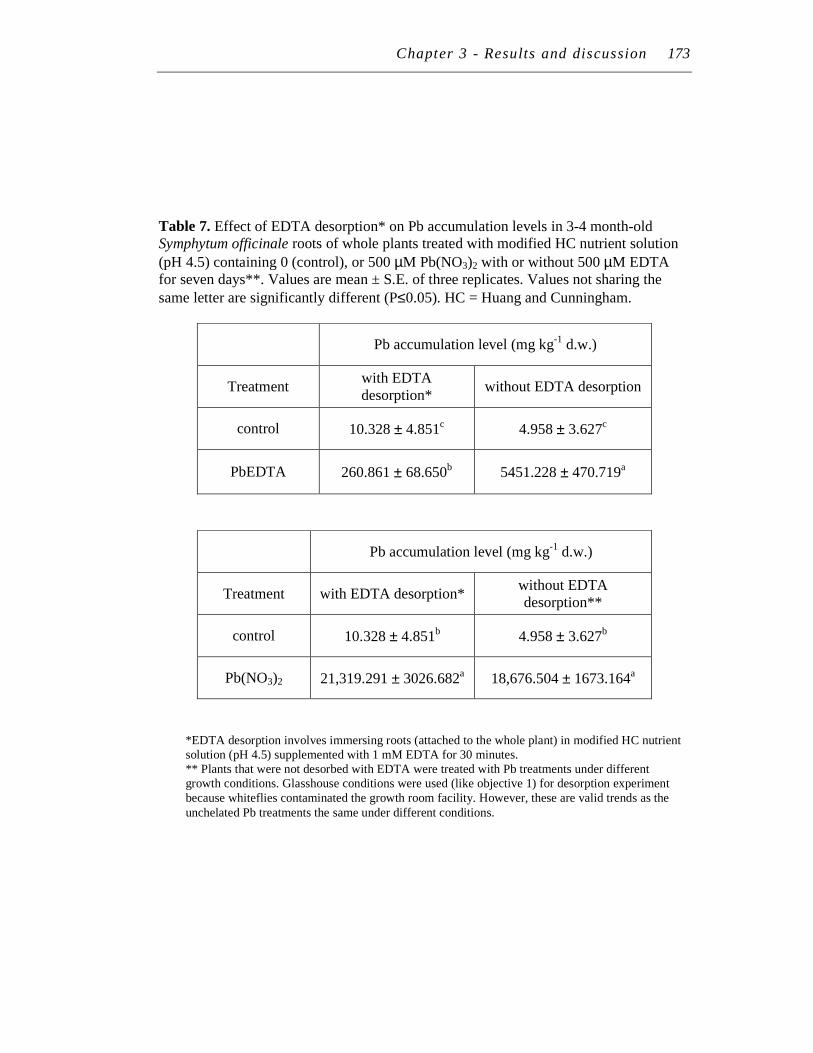
Chapter 3 - Results and discussion 173
Table 7. Effect of EDTA desorption* on Pb accumulation levels in 3-4 month-old Symphytum officinale roots of whole plants treated with modified HC nutrient solution
(pH 4.5) containing 0 (control), or 500 µM Pb(NO3)2 with or without 500 µM EDTA for seven days**. Values are mean ± S.E. of three replicates. Values not sharing the
same letter are significantly different (P≤0.05). HC = Huang and Cunningham.
Pb accumulation level (mg kg-1 d.w.)
Treatment with EDTA desorption*
without EDTA desorption
control 10.328 ± 4.851c 4.958 ± 3.627c
PbEDTA 260.861 ± 68.650b 5451.228 ± 470.719a
Pb accumulation level (mg kg-1 d.w.)
Treatment with EDTA desorption* without EDTA desorption**
control 10.328 ± 4.851b 4.958 ± 3.627b
Pb(NO3)2 21,319.291 ± 3026.682a 18,676.504 ± 1673.164a
*EDTA desorption involves immersing roots (attached to the whole plant) in modified HC nutrient solution (pH 4.5) supplemented with 1 mM EDTA for 30 minutes. ** Plants that were not desorbed with EDTA were treated with Pb treatments under different growth conditions. Glasshouse conditions were used (like objective 1) for desorption experiment because whiteflies contaminated the growth room facility. However, these are valid trends as the unchelated Pb treatments the same under different conditions.
Chapter 3 − Results and discussion 174
Objective 3 Pb mutant plant studies:
Symphytum officinale tissue culture
9 DEVELOPING IN VITRO SYMPHYTUM OFFICINALE CULTURES
9.1 Somaclonal variation approach
In order to develop somaclonal variants, the traditional callus approach was initially
followed. This involved:
(i) developing a sterile line of undifferentiated callus tissue
(ii) exposing the callus tissue to Pb
(iii) inducing shoot growth from the Pb-exposed callus (to develop whole plants)
However as discussed below, the callus approach was later replaced with inducing shoot
growth directly from Pb-exposed petioles. Sections below discuss the development of
in vitro S. officinale tissues and whole plants.
9.2 Explant and sterilisation
9.2.1 Explant choice
Petioles of S. officinale plants were used for sterilisation tests due to:
(i) abundance
(ii) uniformity of tissue
(iii) callus induction speed (within two weeks of culture)
(iv) ease of tissue handling and robust nature after sterilisation
Sterile cultures from root explants were unsuccessful. The contamination was likely to
stem from internal mycorrhiza fungi, which was observed within the stained roots (not
shown).
9.2.2 Sterilisation and placement on media
Two sets of petiole sterilisation solutions were tested:
Set I: 10, 20, and 100% (v/v) commercial bleach for 10 and 20 minutes
Set II: 5, 10, and 20% (v/v) commercial bleach for 10 and 20 minutes
Chapter 3 − Results and discussion 175
At all concentrations of bleach, callus and shoots developed within four weeks on
MS (Murashige and Skoog, 1962) basal media. Shoots developed the best with the 10%
(v/v) bleach sterilisation regime. Callus and shoots developed mostly on the petiole
explants with polarity; callus developed on the petiole closest to the root, whilst shoots
formed on the opposite end. Roots developed from the callus end after three weeks.
Even after surface sterilisation with commercial bleach at 100% (v/v) (equivalent to 5%
(w/v) sodium hypochlorite as used by Huizing et al., 1983), surprisingly shoot and
callus were still formed, but was the slowest. Overall 10% (v/v) bleach for 10 minutes
was the chosen sterilisation regime for subsequent experiments as it achieved 95-100%
sterile explants with the ability to produce de novo tissue.
Over the course of the sterilisation tests, two additional observations were made
relating to explant handling: (i) 95-100% sterile cultures were achieved without
removing the hairy epidermal tissue, (ii) after one week, the longitudinal cut face of
explants (placed down on the MS media) turned black (probably due to polyphenols)
and no callus/shoot developed along this face, and (iii) if the explant half was thin or
was completely immersed in the media, callus and shoot development was either too
slow or failed to develop. Considering all these observations, the hairy epidermal tissue
on petiole explants was not removed in subsequent experiments. Petioles were also not
cut longitudinally and care was taken not to immerse petioles deeply into the media.
This method produced a consistently strong growth response with minimal steps.
9.3 Media development
9.3.1 Callus induction media (CIM): sterilised petiole explants
(i) MS A: MS basal nutrients
(ii) MS B: MS basal nutrients + 2% (w/v) sucrose
(iii) MS C: MS B + BA (1 mg L-1)
(iv) MS D: MS B + BA (1 mg L-1) + IBA (0.01 mg L-1)
(v) MS E: MS B + BA (1 mg L-1) + IBA (0.1 mg L-1)
(vi) MS F(0): MS B + BA (1 mg L-1) + IBA (1 mg L-1)
Of the initial six MS-based media above [MS A to F(0)], MS F(0) was
consistently the standout medium for callus generation from sand-grown petiole
explants (grown from root cuttings). This medium comprised of MS basal nutrients, 2%
Chapter 3 − Results and discussion 176
(w/v) sucrose and 1 mg L-1 each of BA and IBA. For all media tested, callus formed
with polarity, at the petiole end closest to the root. The callus tissues were compact and
had a light to dark green colour. Incidentally, it was also excellent for shoot induction
from petiole explants (Plate 17A1-A2). After two weeks in each media (except for MS
basal medium), shoots also started to develop at the opposing end to the callus tissue.
The in vitro generated shoot tissues also had a crown segment (base of shoot emerging
from petiole explant) (Plate 17A1). Shoot tissue developed from the vascular bundle of
sterilised petiole explants (Plate 17B). Also worth noting is that unlike the sterilisation
regime, petioles on the MS basal medium in this experiment did not produce callus or
shoots. The different outcomes could be because the longitudinal cut petioles used in
the sterilisation experiment absorbed nutrients (to support callus or shoot formation)
more effectively from the basal medium. All callus, shoot, and root tissue are de novo as
petiole explants were cut well above the meristematic crown of the sand-grown plants.
Concurrently, petiole explants from plants grown from root divisions were tested
because of the number of available petioles and the good response from sterilisation
trials. However from these trials, these petioles were far less consistent and vigorous in
generating in vitro callus and shoot tissue. This is possibly because these petioles were
older than those from root cuttings (Plate 17C1-C2).
The differing response of MS C to MS F(0) was in contrast to that reported by
Huizing et al., (1983) who ranked shoot and callus growth from these media as the
same. This is possibly because of differences in petiole explant origin, age or
sterilisation regime.
9.4 Callus growth media (CGM): in vitro petiole tissue
(i) MS F(0): MS B + BA (1 mg L-1) + IBA (1 mg L-1)
(ii) MS F(1): MS B + BA (2.5 mg L-1) + IBA (2.5 mg L-1)
(iii) MS F(2): MS B + BA (3.5 mg L-1) + IBA (3.5 mg L-1)
(iv) MS F(3): MS B + BA (5.5 mg L-1) + IBA (5.5 mg L-1)
Unlike petiole explants on MS F(0), callus formation in in vitro explants occurred along
the edge of the petiole and at the cut end. Some parts of these calli, differentiated into
root and shoots (Plate 18A). Since undifferentiated callus tissue was initially the target
tissue type for somaclonal variation studies, other plant growth regulator-based media
were tested to determine if only callus tissue could be generated from petioles. It has
Chapter 3 − Results and discussion 177
been documented that increasing concentrations of plant growth regulators such as IBA
and BA may inhibit shoot and root development from the callus tissue (Haaß et al.,
1991). Thus, using in vitro grown petiole segments, three variations to the MS F(0)
media for generating undifferentiated callus from petioles were tested. These were MS
F(1,2,3) (listed above). On these three media, callus tissue appeared larger than on the
MS F(0) medium and root generation was perturbed. However, shoot production was
not inhibited (Plate 18B).
Consequently, the focus was on inhibiting differentiation of callus after formation.
Calli generated from petiole on MS F(0) medium were transferred to fresh MS F(0)
medium to continue callus growth. However, it still could not maintain its
undifferentiated callus state. After four weeks, shoot tissue clearly developed from the
callus tissue (Plate 19A). Using in vitro callus tissue and petiole segments, two other
callus growth media were tested:
(i) MS J [MS B + Kinetin (0.3 mg L-1) + NAA (4 mg L-1)]
(ii) MS G [MS B + 2,4 D (0.5 mg L-1) + BA (2 mg L-1)]
The MS J medium (from Abou-Mandour, 1983) successfully inhibited both shoot
and root organogenesis from the callus tissue (Plate 19B). On the MS G medium (from
Huizing et al., 1987) the callus tissue formed was similar in appearance to those formed
on MS J medium, except that only shoot development was inhibited. Thick, stunted root
tissue still developed after four weeks on MS G medium (not shown). However, the
callus morphology generated from both these media indicated that the callus tissues
were unsuitable for subculture as they were very soft, friable and died upon subculture
to the same media (not shown).
Given the lack of undifferentiated callus tissue that could be subcultured, the
callus approach was abandoned in favour of de novo shoot formation from Pb-treated
petioles (see results section 10.1 below).
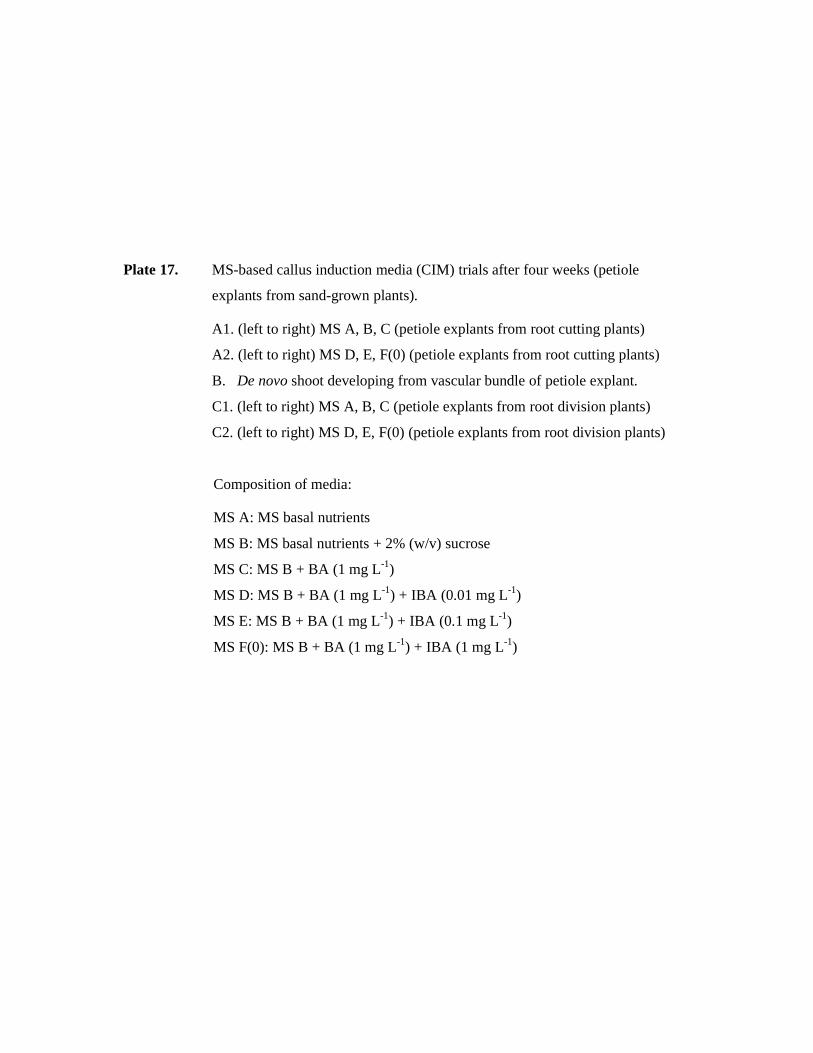
Plate 17. MS-based callus induction media (CIM) trials after four weeks (petiole
explants from sand-grown plants).
A1. (left to right) MS A, B, C (petiole explants from root cutting plants)
A2. (left to right) MS D, E, F(0) (petiole explants from root cutting plants)
B. De novo shoot developing from vascular bundle of petiole explant.
C1. (left to right) MS A, B, C (petiole explants from root division plants)
C2. (left to right) MS D, E, F(0) (petiole explants from root division plants)
Composition of media:
MS A: MS basal nutrients
MS B: MS basal nutrients + 2% (w/v) sucrose
MS C: MS B + BA (1 mg L-1)
MS D: MS B + BA (1 mg L-1) + IBA (0.01 mg L-1)
MS E: MS B + BA (1 mg L-1) + IBA (0.1 mg L-1)
MS F(0): MS B + BA (1 mg L-1) + IBA (1 mg L-1)
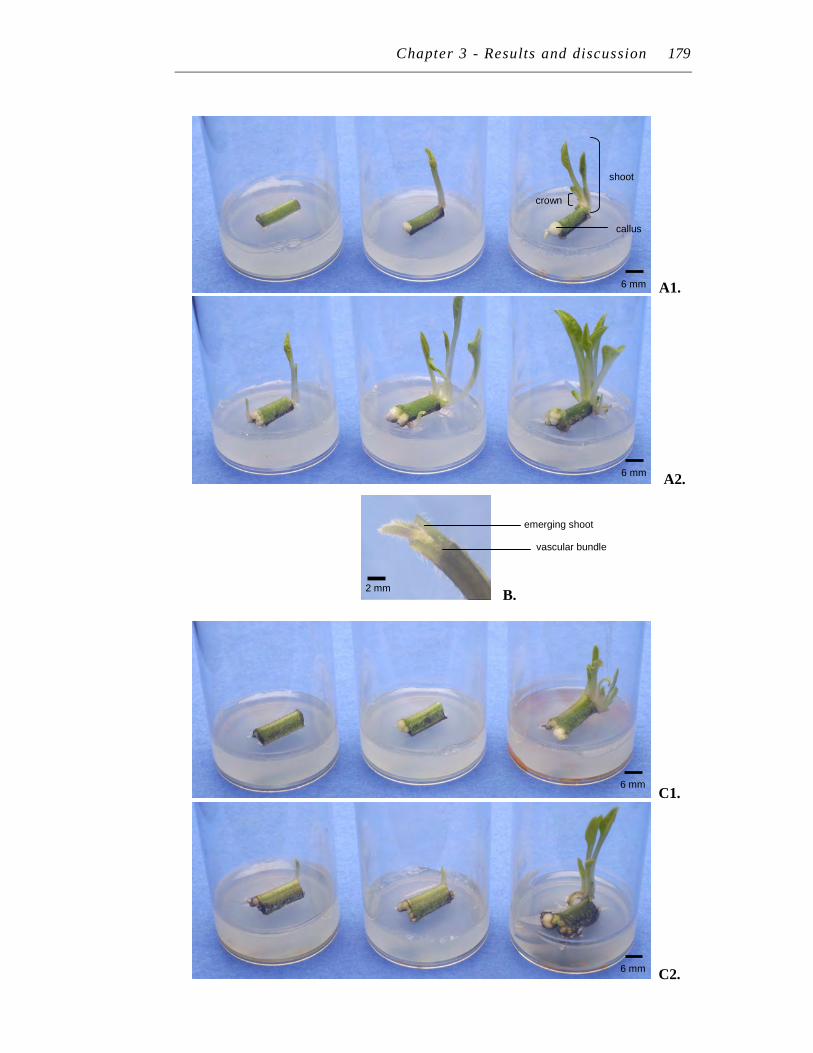
Chapter 3 - Results and discussion 179
A1.
A2.
C1.
C2.
6 mm
B. 2 mm
6 mm
6 mm
6 mm
shoot
crown
vascular bundle
emerging shoot
callus
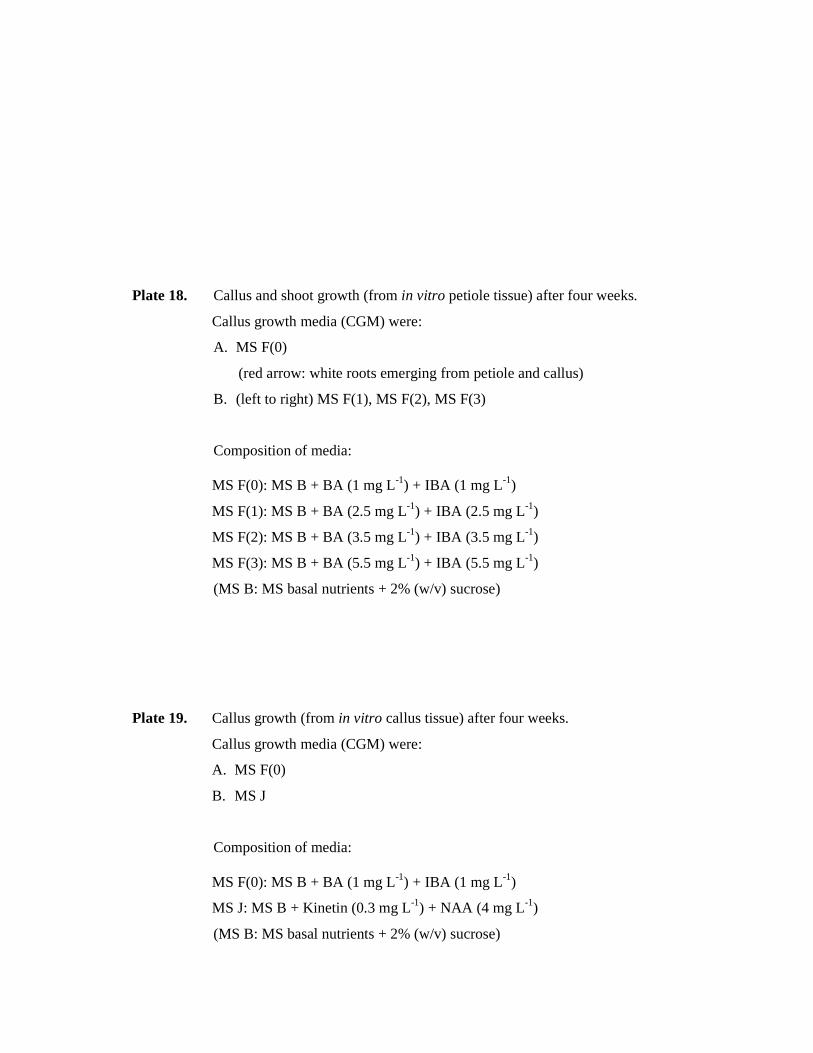
Plate 18. Callus and shoot growth (from in vitro petiole tissue) after four weeks.
Callus growth media (CGM) were:
A. MS F(0)
(red arrow: white roots emerging from petiole and callus)
B. (left to right) MS F(1), MS F(2), MS F(3)
Composition of media:
MS F(0): MS B + BA (1 mg L-1) + IBA (1 mg L-1)
MS F(1): MS B + BA (2.5 mg L-1) + IBA (2.5 mg L-1)
MS F(2): MS B + BA (3.5 mg L-1) + IBA (3.5 mg L-1)
MS F(3): MS B + BA (5.5 mg L-1) + IBA (5.5 mg L-1)
(MS B: MS basal nutrients + 2% (w/v) sucrose)
Plate 19. Callus growth (from in vitro callus tissue) after four weeks.
Callus growth media (CGM) were:
A. MS F(0)
B. MS J
Composition of media:
MS F(0): MS B + BA (1 mg L-1) + IBA (1 mg L-1)
MS J: MS B + Kinetin (0.3 mg L-1) + NAA (4 mg L-1)
(MS B: MS basal nutrients + 2% (w/v) sucrose)
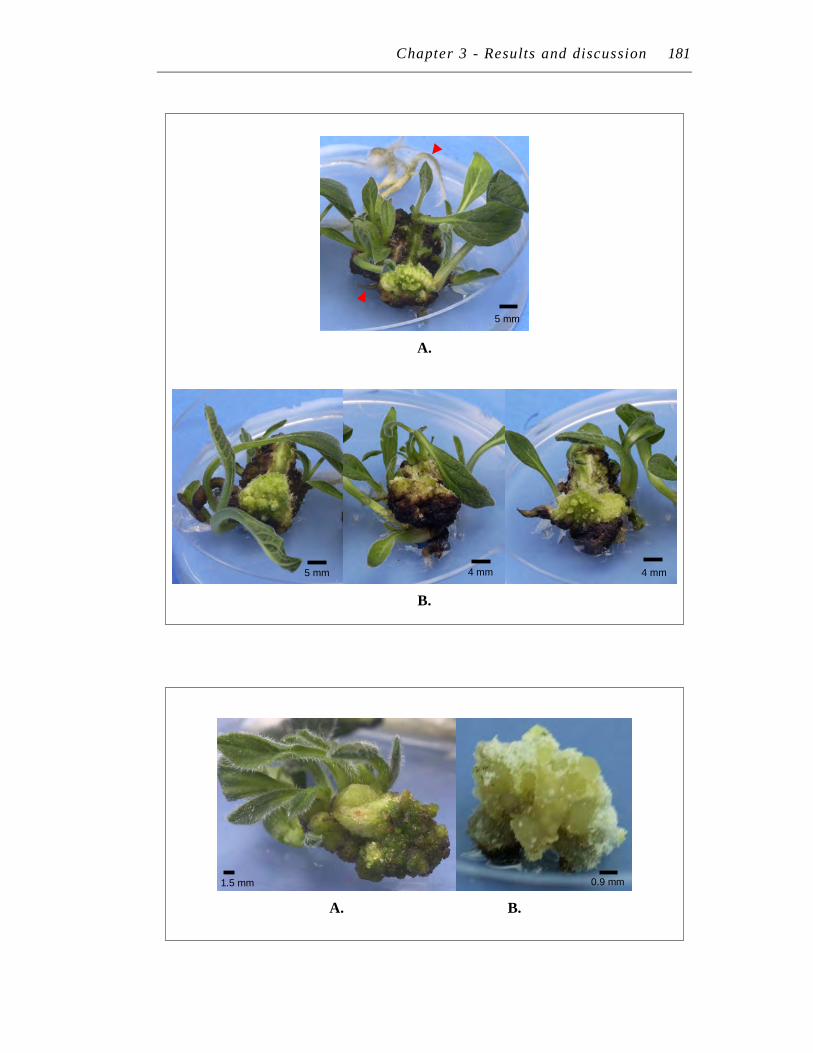
Chapter 3 - Results and discussion 181
A.
B.
A. B.
0.9 mm 1.5 mm
4 mm
5 mm
4 mm 5 mm

Chapter 3 − Results and discussion 182
9.5 Root and whole plant induction media (RIM, WPIM)
9.5.1 Root induction media (RIM): in vitro shoots
(i) MS A: MS basal nutrients
(ii) MS B: MS basal nutrients + 2% (w/v) sucrose
(iii) MS H: MS A + IBA (1 mg L-1)
(iv) MS L: MS B + IBA (1 mg L-1)
Since there was not enough crown tissue at this stage of experimentation, shoots (leaf
blade attached to petiole) were used instead to test the RIM media. They were immersed
approximately 0.5 cm into four types of media; MS A, B, H and L (listed above). Roots
readily formed in all media, but were the best on MS L (not shown).
9.5.2 Whole plant induction media (WPIM): in vitro crown tissue
(i) MS L: MS B + IBA (1 mg L-1)
(ii) MS M: MS B + IBA (0.1 mg L-1)
(iii) MS N(0): MS B + IBA (1 mg L-1) + BA (0.1 mg L-1)
(iv) MS N(1): MS B + IBA (1 mg L-1) + BA (0.2 mg L-1)
(v) MS N(2): MS B + IBA (1 mg L-1) + BA (0.4 mg L-1)
(vi) MS E: MS B + IBA (0.1 mg L-1) + BA (1 mg L-1)
Both roots and shoots were induced from in vitro crown tissue on the MS L medium.
Thus for the crown tissue, this RIM medium was also a good whole plant induction
medium (WPIM). However, petioles generated were very long. Modifications to the MS
L medium were performed to determine if the abnormally long in vitro petioles could be
shortened to better reflect non-tissue cultured plant structure and possibly the shoot:root
distribution of Pb. In order to decrease the petiole length, the plant growth regulator
composition of the MS L medium was modified and in vitro crown tissue on six
different media were tested (listed above). Auxins (e.g. IBA) cause developmental
changes such as cell elongation and formation of roots. Cytokinins (e.g. BA), the
‘opposite’ plant growth regulator to auxins, promotes opening of existing or generating
new buds (Gamborg and Phillips, 1995). Decreasing IBA levels or increasing the
cytokinin (BA) level was tested to reduce the petiole/cell elongation effect of IBA.
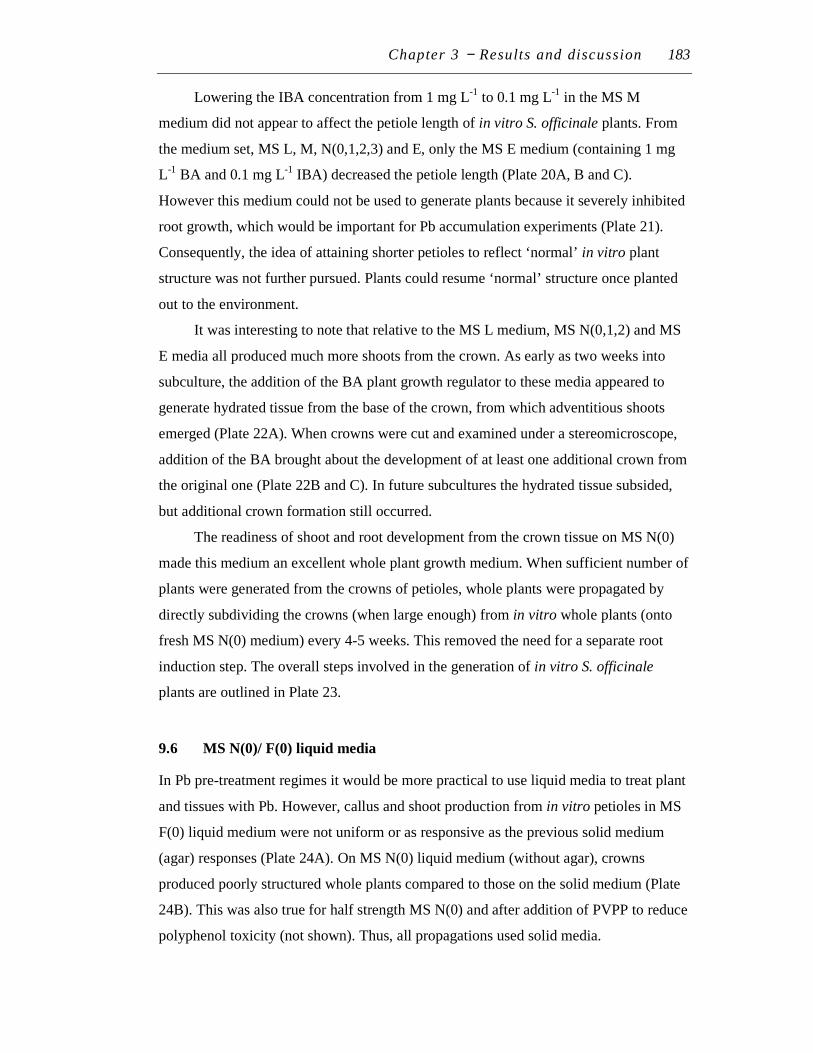
Chapter 3 − Results and discussion 183
Lowering the IBA concentration from 1 mg L-1 to 0.1 mg L-1 in the MS M
medium did not appear to affect the petiole length of in vitro S. officinale plants. From
the medium set, MS L, M, N(0,1,2,3) and E, only the MS E medium (containing 1 mg
L-1 BA and 0.1 mg L-1 IBA) decreased the petiole length (Plate 20A, B and C).
However this medium could not be used to generate plants because it severely inhibited
root growth, which would be important for Pb accumulation experiments (Plate 21).
Consequently, the idea of attaining shorter petioles to reflect ‘normal’ in vitro plant
structure was not further pursued. Plants could resume ‘normal’ structure once planted
out to the environment.
It was interesting to note that relative to the MS L medium, MS N(0,1,2) and MS
E media all produced much more shoots from the crown. As early as two weeks into
subculture, the addition of the BA plant growth regulator to these media appeared to
generate hydrated tissue from the base of the crown, from which adventitious shoots
emerged (Plate 22A). When crowns were cut and examined under a stereomicroscope,
addition of the BA brought about the development of at least one additional crown from
the original one (Plate 22B and C). In future subcultures the hydrated tissue subsided,
but additional crown formation still occurred.
The readiness of shoot and root development from the crown tissue on MS N(0)
made this medium an excellent whole plant growth medium. When sufficient number of
plants were generated from the crowns of petioles, whole plants were propagated by
directly subdividing the crowns (when large enough) from in vitro whole plants (onto
fresh MS N(0) medium) every 4-5 weeks. This removed the need for a separate root
induction step. The overall steps involved in the generation of in vitro S. officinale
plants are outlined in Plate 23.
9.6 MS N(0)/ F(0) liquid media
In Pb pre-treatment regimes it would be more practical to use liquid media to treat plant
and tissues with Pb. However, callus and shoot production from in vitro petioles in MS
F(0) liquid medium were not uniform or as responsive as the previous solid medium
(agar) responses (Plate 24A). On MS N(0) liquid medium (without agar), crowns
produced poorly structured whole plants compared to those on the solid medium (Plate
24B). This was also true for half strength MS N(0) and after addition of PVPP to reduce
polyphenol toxicity (not shown). Thus, all propagations used solid media.
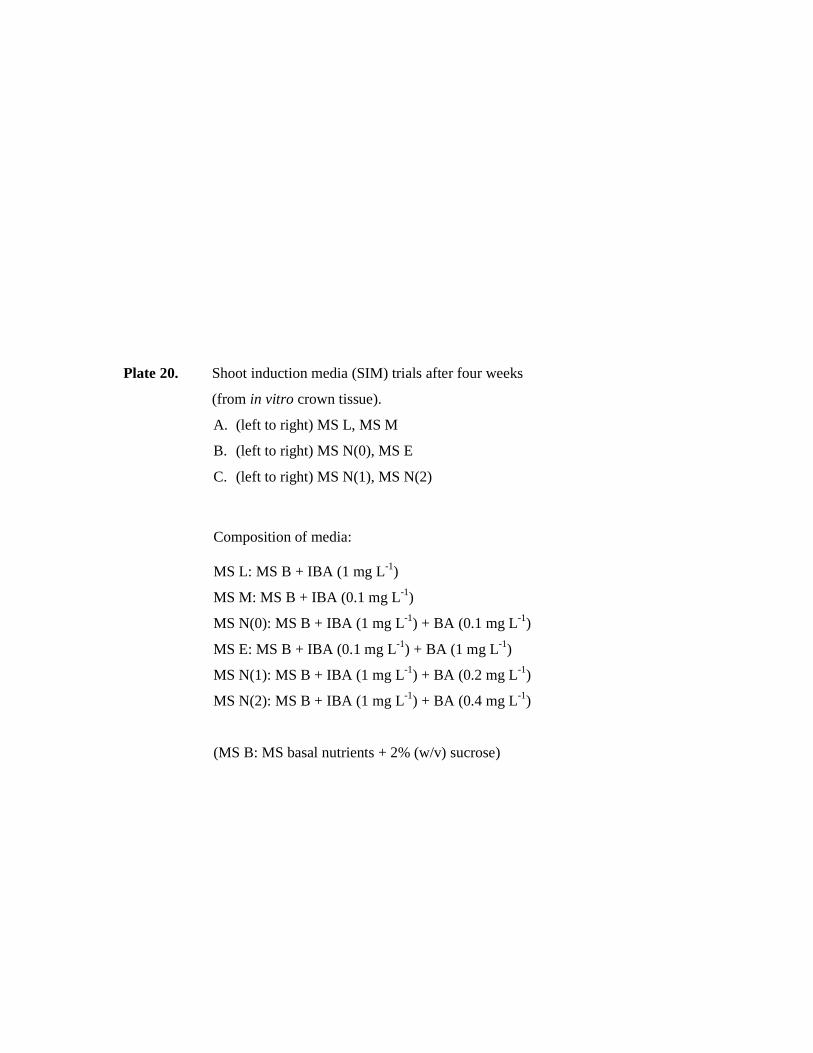
Plate 20. Shoot induction media (SIM) trials after four weeks
(from in vitro crown tissue).
A. (left to right) MS L, MS M
B. (left to right) MS N(0), MS E
C. (left to right) MS N(1), MS N(2)
Composition of media:
MS L: MS B + IBA (1 mg L-1)
MS M: MS B + IBA (0.1 mg L-1)
MS N(0): MS B + IBA (1 mg L-1) + BA (0.1 mg L-1)
MS E: MS B + IBA (0.1 mg L-1) + BA (1 mg L-1)
MS N(1): MS B + IBA (1 mg L-1) + BA (0.2 mg L-1)
MS N(2): MS B + IBA (1 mg L-1) + BA (0.4 mg L-1)
(MS B: MS basal nutrients + 2% (w/v) sucrose)
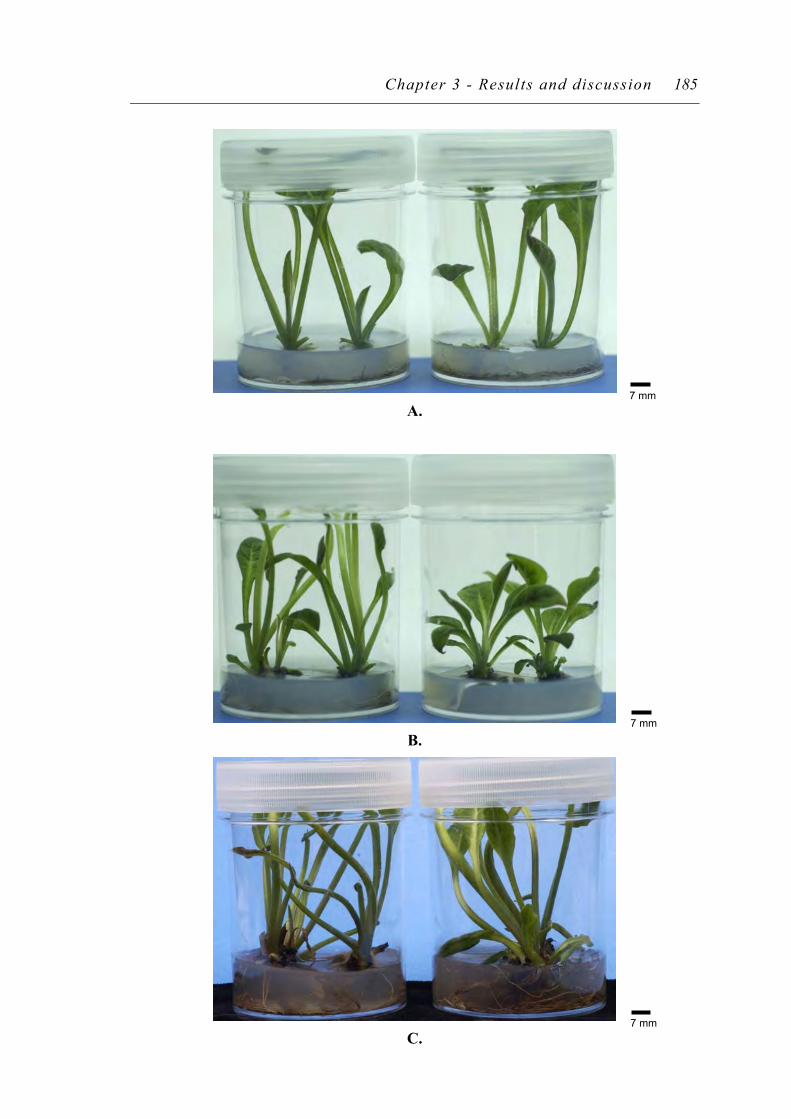
Chapter 3 - Results and discussion 185
A.
B.
C.
7 mm
7 mm
7 mm
Plate 21. Root growth from shoot induction media (SIM) trials after four weeks
(from in vitro crown tissue).
A. MS L
B. MS M
C. MS N(0)
D. MS E
Composition of media:
MS L: MS B + IBA (1 mg L-1)
MS M: MS B + IBA (0.1 mg L-1)
MS N(0): MS B + IBA (1 mg L-1) + BA (0.1 mg L-1)
MS E: MS B + IBA (0.1 mg L-1) + BA (1 mg L-1)
(MS B: MS basal nutrients + 2% (w/v) sucrose)
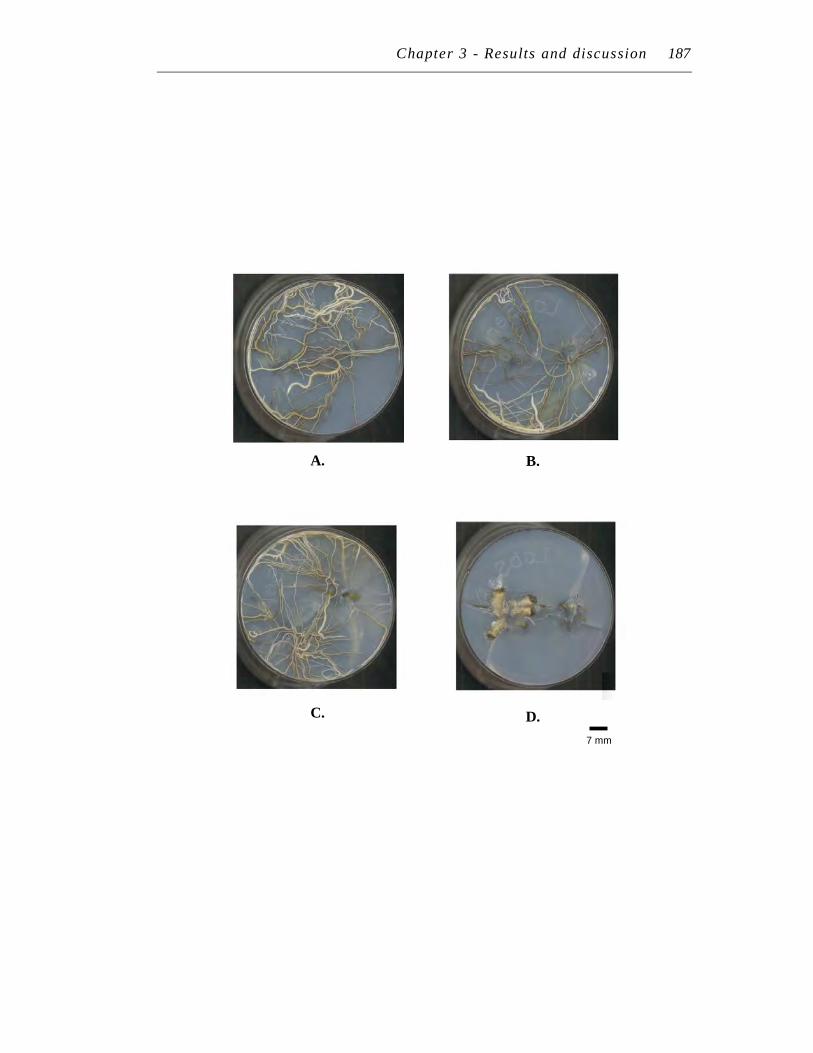
Chapter 3 - Results and discussion 187
A.
B.
C.
D.
7 mm
Plate 22. Shoot and crown growth (from in vitro crown tissue).
A. Adventitious shoot growth after two weeks on MS N(0)
B. Crown development on MS L medium after four weeks
C. Crown development on MS N(0) medium after four weeks
Composition of media:
MS L: MS B + IBA (1 mg L-1)
MS N(0): MS B + IBA (1 mg L-1) + BA (0.1 mg L-1)
(MS B: MS basal nutrients + 2% (w/v) sucrose)
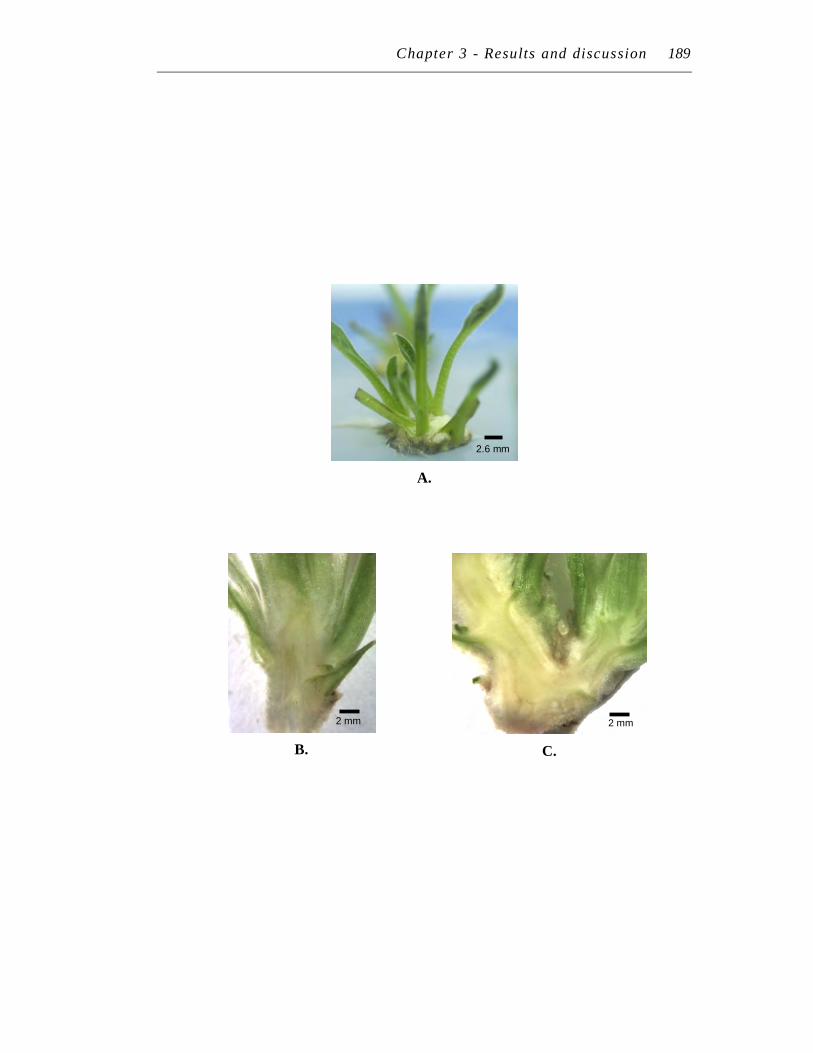
Chapter 3 - Results and discussion 189
A.
B.
C.
2.6 mm
2 mm 2 mm
Plate 23. Overall steps in the generation of in vitro Symphytum officinale plants.
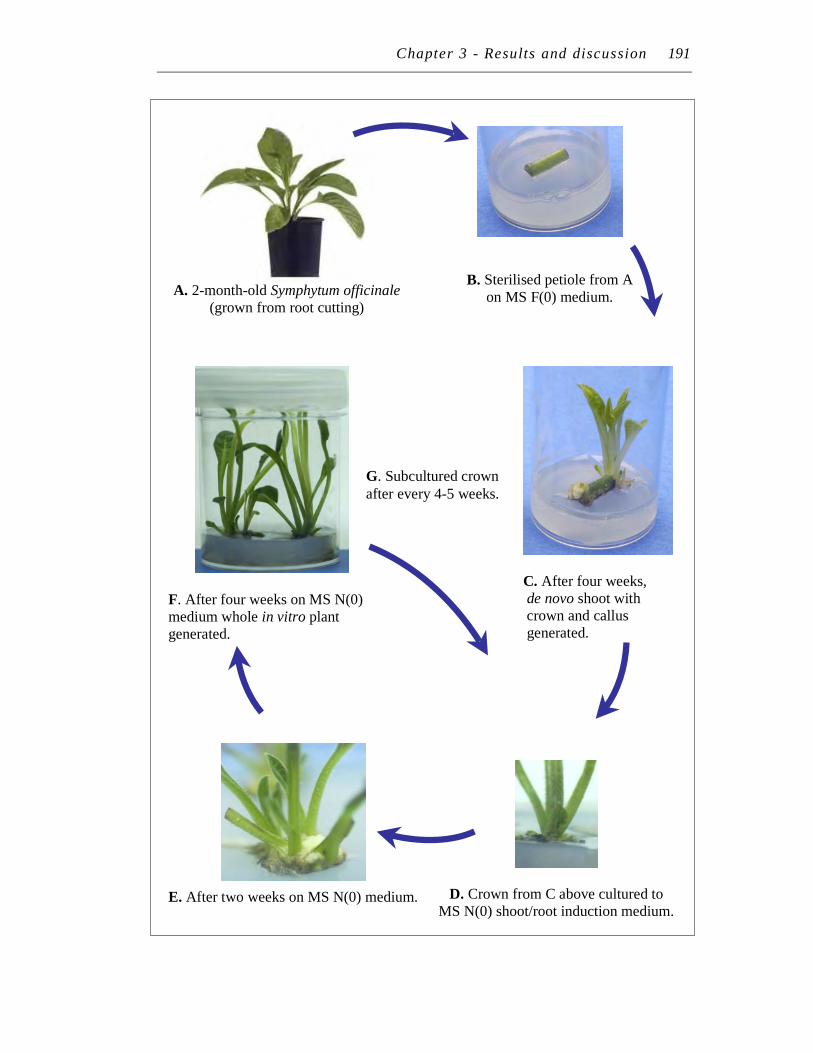
Chapter 3 - Results and discussion 191
A. 2-month-old Symphytum officinale
(grown from root cutting)
B. Sterilised petiole from A on MS F(0) medium.
F. After four weeks on MS N(0) medium whole in vitro plant generated.
C. After four weeks, de novo shoot with crown and callus generated.
E. After two weeks on MS N(0) medium.
D. Crown from C above cultured to MS N(0) shoot/root induction medium.
G. Subcultured crown after every 4-5 weeks.
Chapter 3 - Results and discussion 194
Plate 24. Liquid media trials.
A. Differing responses of in vitro Symphytum officinale petioles
(from one plant line) to MS F(0) liquid medium.
B. Shoot and root growth from in vitro Symphytum officinale crown
tissue in liquid (left) and solid agar-based (right) MS N(0) medium.
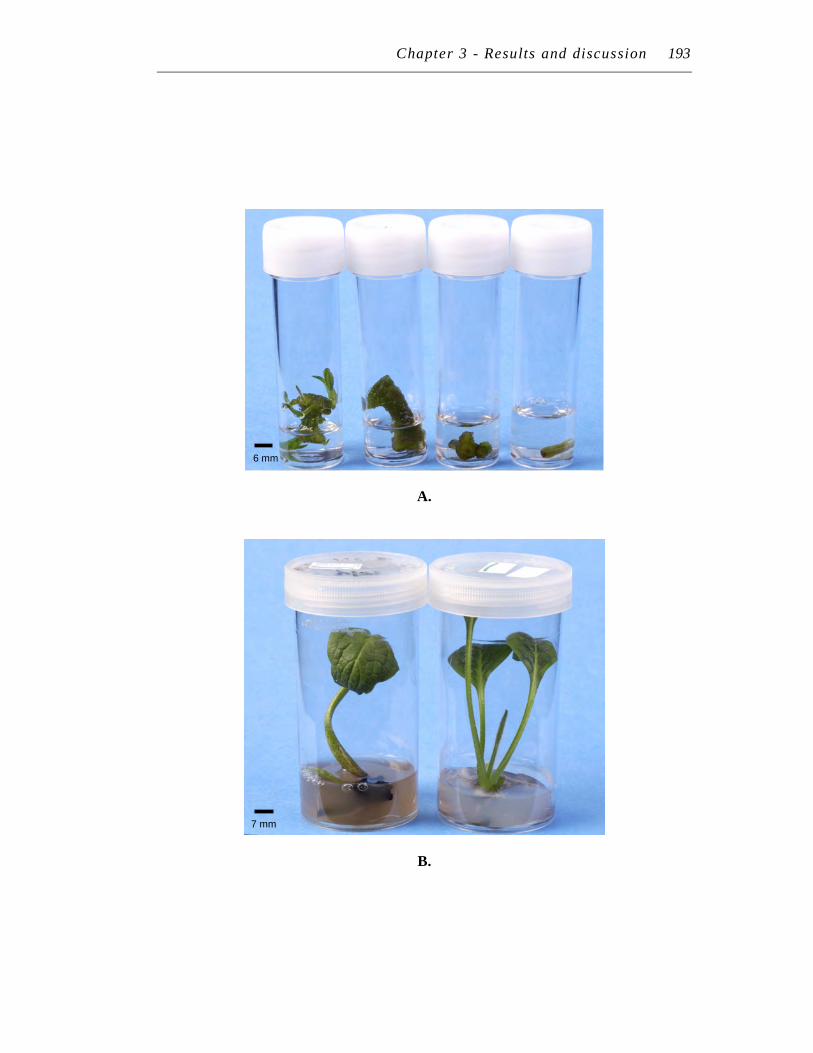
Chapter 3 - Results and discussion 193
A.
B.
6 mm
7 mm
Chapter 3 − Results and discussion 194
10 DEVELOPING SYMPHYTUM OFFICINALE LEAD MUTANTS
In this section the somaclonal variation approach was to directly generate de novo shoot
tissue from Pb-treated petioles (from whole plants or shoot cuttings). The ideal outcome
of this ‘pulse/gradual treatment’ was to generate plants with higher Pb accumulation
ability through increased Pb tolerance. The Pb accumulation level, polyphenol level and
superoxide dismutase activity of S. officinale plants (generated from Pb pre-treated
petioles) after re-treatment with Pb were assessed to determine if and how mutation(s)
occurred. Histochemical localisation for superoxide radicals and indirect assay of SOD
activity (using NBT tissue staining) was also envisaged.
10.1 Lead treatment of whole in vitro plants
Petioles from whole plants pre-treated with chelated Pb (500 µM PbEDTA and
PbADA) were initially chosen for culture to closely resemble normal Pb accumulation
and translocation conditions. No sucrose was initially added to the media to maximise
stress. Considering that Pb toxicity in plants occurs in a range of 30-300 mg kg-1 (d.w.)
Pb (Zheljazkov and Fair, 1996) to 500 to 1000 mg kg-1 Pb (d.w.) (Wierzbicka, 1995)
(tissue unspecified), the levels of Pb in in vitro petioles and roots from PbEDTA or
PbADA treatments (see 10.1.3 below) may be sufficiently toxic to generate mutants.
10.1.1 Pre-treatment # 1: 0, 500 µµµµM PbEDTA (no sucrose, pH 4.5)
Only one of the four lines (Line green) developed shoots from both control and
PbEDTA treatments. These shoots developed very slowly compared to petioles from
plants without any pre-treatment (i.e. directly from MS N(0)). Two months (compared
to one month) was required to develop shoots sufficient for culture. In other lines,
petiole contamination was evident at the surface and cut ends of the petiole explant,
possibly due to HC treatment stress (both control and Pb) (Plate 25A).
10.1.2 Pre-treatment # 2: 0, 500 µµµµM PbEDTA (no sucrose, pH 7.0)
A similar experiment was performed, but in this case petioles were re-sterilised after
pre-treatment. Surface contamination was still evident after one week (both control and
Pb treatment), but in this case, it did not preclude the development of shoots in any of
Chapter 3 − Results and discussion 195
the lines. Similar to pre-treatment #1, shoots still developed, though much slower than
petioles directly from MS N(0) media.
10.1.3 Pre-treatment # 3: 0, 500 µµµµM PbEDTA and 500µµµµM PbADA, (2% (w/v)
sucrose, pH 7.0)
Pre-treated petioles were visibly healthy for up to three weeks, indicating that the
nutritional stress (due to the omission of sucrose in the previous pre-treatments) may be
partly responsible for the lower regeneration capacity of the petiole. However, no shoots
developed. Instead, roots developed along the petiole length but mainly towards the
root-facing end of the petiole. Very small or no callus formed in the cultures.
Unexpectedly after three weeks, the healthy-looking petiole and roots appeared to
release white exudates from the cut ends and roots. These are likely to be endogenous
microbes because it appeared to engulf and contaminate the culture over time (Plate
25B).
In terms of Pb accumulation from pre-treatments, plants exposed to PbADA
appeared to accumulate more Pb in roots than those exposed to PbEDTA treatment
(although not significantly different), supporting the findings in objective 2 (8.3.2). The
levels of Pb in the shoots from both treatments were about 100-200 mg kg-1 (d.w.). The
lack of statistical significance between these treatments may be due to lower
transpiration rates in the enclosed tissue culture system. Both PbEDTA and PbADA had
significantly higher levels of Pb than control plants (Figure 42A, B and C)
10.2 Regeneration ability of stock plant tissues
Petioles from pre-treated whole plants did not develop shoots adequately (even in
control treatments). Consequently, the shoot regeneration ability of stock plants (after
ten subcultures) was re-checked to confirm that the treatment regime (and not the stock
culture) caused the lack of shoot regeneration. Shoot generation from petioles of stock
plants were re-tested and were still excellent after ten subcultures (Plate 26). Thus, the
petiole contamination and lack of shoot regeneration appears to be due to the stress of
the treatment regime on whole plants. The omission of sucrose (initially) and the
response of roots to the liquid medium used may be responsible. At the completion of
the pre-treatment regime, the liquid medium had started to turn slightly brown (possibly
due to polyphenols).
Chapter 3 - Results and discussion 198
Plate 25. Shoot generation from in vitro petioles (from Pb pre-treated whole
plants). HC = Huang and Cunningham.
A. Pre-treatment # 1
Shoot regeneration from in vitro petioles after two months on MS F
(0) medium. Petioles were from 4-week-old in vitro Symphytum
officinale plants pre-treated with modified HC nutrient solution (pH
4.5) containing 0 (left) or 500 µM PbEDTA (no sucrose) for
one week.
B. Pre-treatment # 3
Progression of contamination of in vitro petioles on MS F(0) medium
after three weeks in culture. Petioles were from 3-week-old in vitro
Symphytum officinale plants pre-treated with modified HC nutrient
solution (pH 7.0) with PbADA (2% (w/v) sucrose) for two weeks.
Plate 26. Regeneration ability of petioles from stock plants.
Test for shoot regeneration ability of in vitro Symphytum officinale
petioles from stock plants (untreated, directly from MS N(0) medium).
Shoot growth after six weeks on MS F(0) medium.
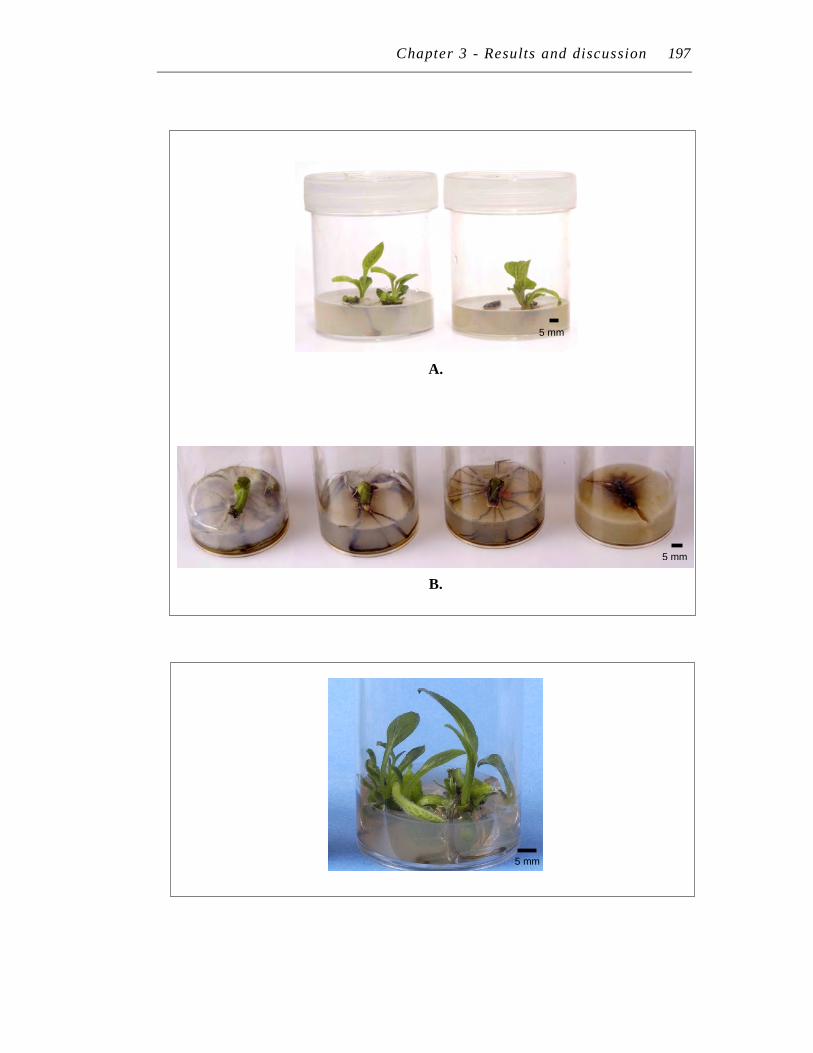
Chapter 3 - Results and discussion 197
A.
B.
5 mm
5 mm
5 mm
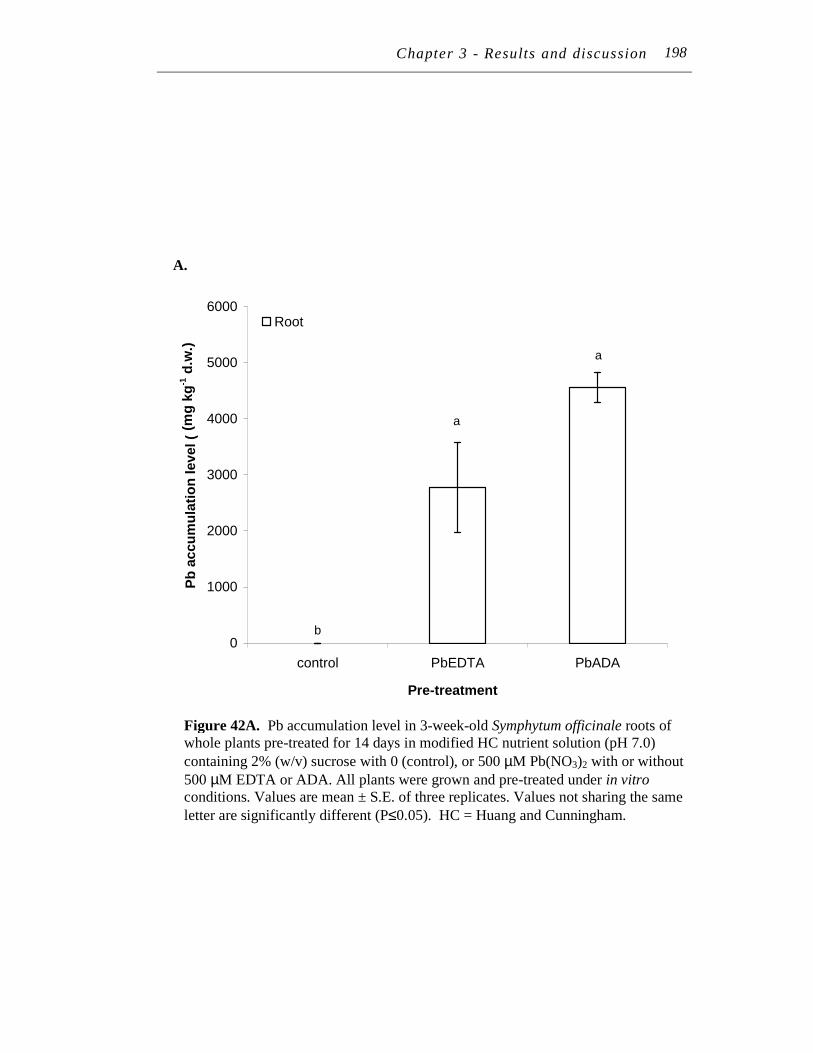
Chapter 3 - Results and discussion 210
Figure 42A. Pb accumulation level in 3-week-old Symphytum officinale roots of whole plants pre-treated for 14 days in modified HC nutrient solution (pH 7.0)
containing 2% (w/v) sucrose with 0 (control), or 500 µM Pb(NO3)2 with or without
500 µM EDTA or ADA. All plants were grown and pre-treated under in vitro conditions. Values are mean ± S.E. of three replicates. Values not sharing the same
letter are significantly different (P≤0.05). HC = Huang and Cunningham.
a
a
b0
1000
2000
3000
4000
5000
6000
control PbEDTA PbADA
Pre-treatment
Pb
ac
cu
mu
lati
on
le
ve
l (m
g/k
g d
.w.)
Root
A.
198
(mg
kg
-1 d
.w.)
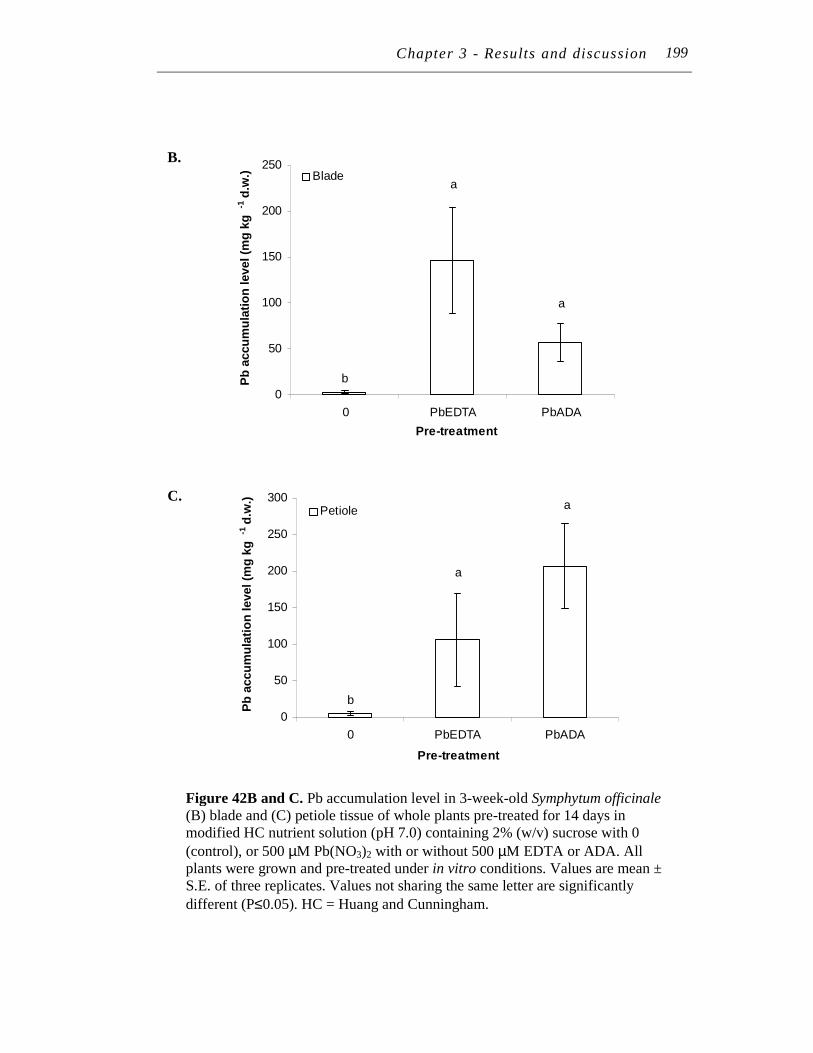
Chapter 3 - Results and discussion 210
Figure 42B and C. Pb accumulation level in 3-week-old Symphytum officinale (B) blade and (C) petiole tissue of whole plants pre-treated for 14 days in modified HC nutrient solution (pH 7.0) containing 2% (w/v) sucrose with 0
(control), or 500 µM Pb(NO3)2 with or without 500 µM EDTA or ADA. All plants were grown and pre-treated under in vitro conditions. Values are mean ± S.E. of three replicates. Values not sharing the same letter are significantly
different (P≤0.05). HC = Huang and Cunningham.
B.
C.
199
b
a
a
0
50
100
150
200
250
300
0 PbEDTA PbADA
Pre-treatment
Pb
accu
mu
lati
on
level (m
g k
g-1
d.w
.)
Petiole
a
a
b
0
50
100
150
200
250
0 PbEDTA PbADA
Pre-treatment
Pb
accu
mu
lati
on
level (m
g k
g-1
d.w
.) Blade
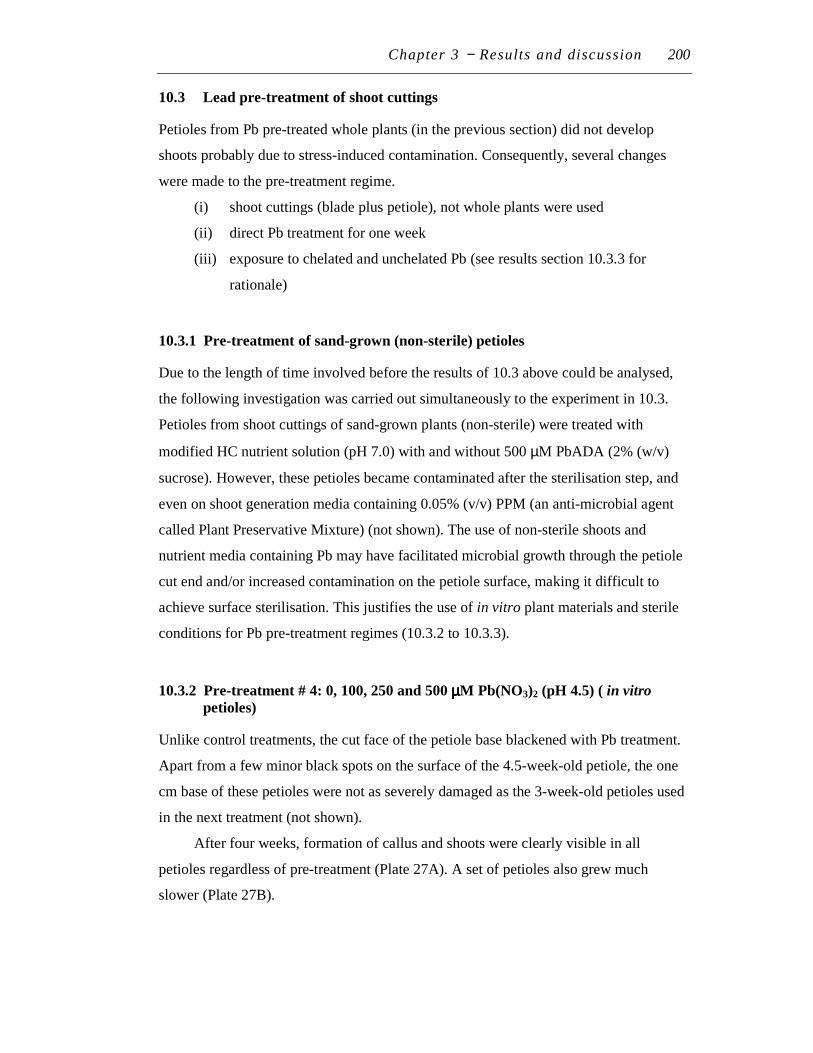
Chapter 3 − Results and discussion 200
10.3 Lead pre-treatment of shoot cuttings
Petioles from Pb pre-treated whole plants (in the previous section) did not develop
shoots probably due to stress-induced contamination. Consequently, several changes
were made to the pre-treatment regime.
(i) shoot cuttings (blade plus petiole), not whole plants were used
(ii) direct Pb treatment for one week
(iii) exposure to chelated and unchelated Pb (see results section 10.3.3 for
rationale)
10.3.1 Pre-treatment of sand-grown (non-sterile) petioles
Due to the length of time involved before the results of 10.3 above could be analysed,
the following investigation was carried out simultaneously to the experiment in 10.3.
Petioles from shoot cuttings of sand-grown plants (non-sterile) were treated with
modified HC nutrient solution (pH 7.0) with and without 500 µM PbADA (2% (w/v)
sucrose). However, these petioles became contaminated after the sterilisation step, and
even on shoot generation media containing 0.05% (v/v) PPM (an anti-microbial agent
called Plant Preservative Mixture) (not shown). The use of non-sterile shoots and
nutrient media containing Pb may have facilitated microbial growth through the petiole
cut end and/or increased contamination on the petiole surface, making it difficult to
achieve surface sterilisation. This justifies the use of in vitro plant materials and sterile
conditions for Pb pre-treatment regimes (10.3.2 to 10.3.3).
10.3.2 Pre-treatment # 4: 0, 100, 250 and 500 µµµµM Pb(NO3)2 (pH 4.5) ( in vitro
petioles)
Unlike control treatments, the cut face of the petiole base blackened with Pb treatment.
Apart from a few minor black spots on the surface of the 4.5-week-old petiole, the one
cm base of these petioles were not as severely damaged as the 3-week-old petioles used
in the next treatment (not shown).
After four weeks, formation of callus and shoots were clearly visible in all
petioles regardless of pre-treatment (Plate 27A). A set of petioles also grew much
slower (Plate 27B).
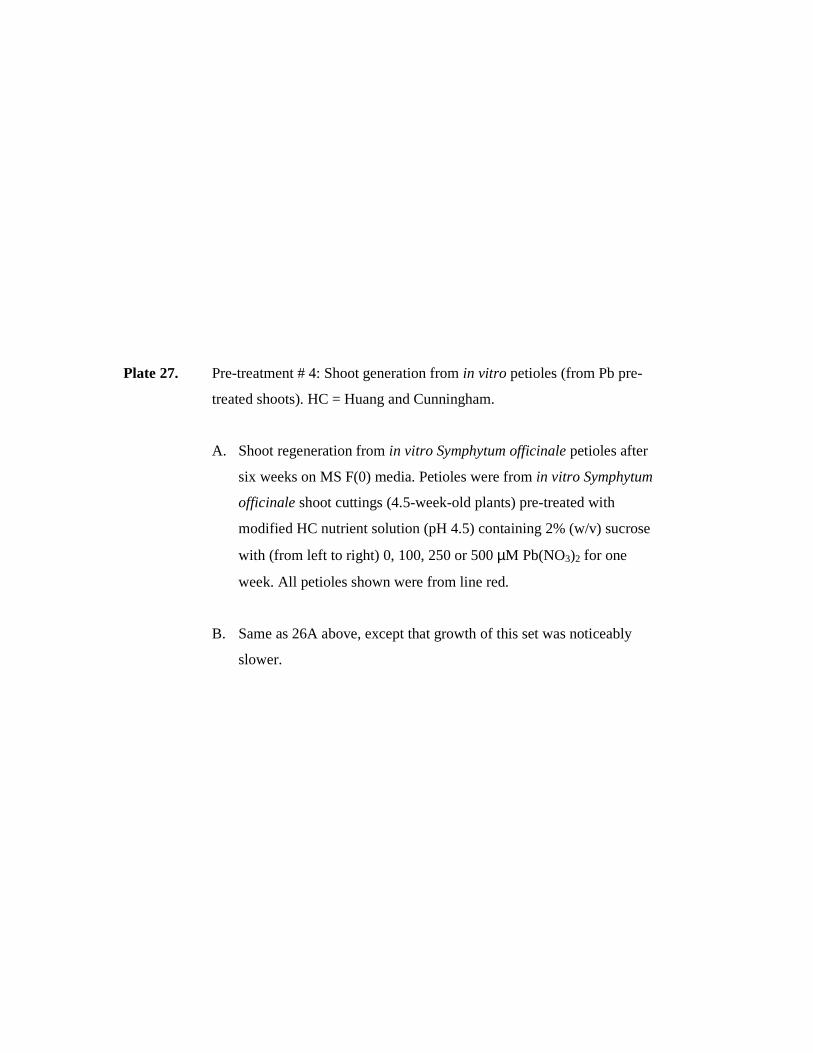
Chapter 3 - Results and discussion 203
Plate 27. Pre-treatment # 4: Shoot generation from in vitro petioles (from Pb pre-
treated shoots). HC = Huang and Cunningham.
A. Shoot regeneration from in vitro Symphytum officinale petioles after
six weeks on MS F(0) media. Petioles were from in vitro Symphytum
officinale shoot cuttings (4.5-week-old plants) pre-treated with
modified HC nutrient solution (pH 4.5) containing 2% (w/v) sucrose
with (from left to right) 0, 100, 250 or 500 µM Pb(NO3)2 for one
week. All petioles shown were from line red.
B. Same as 26A above, except that growth of this set was noticeably
slower.
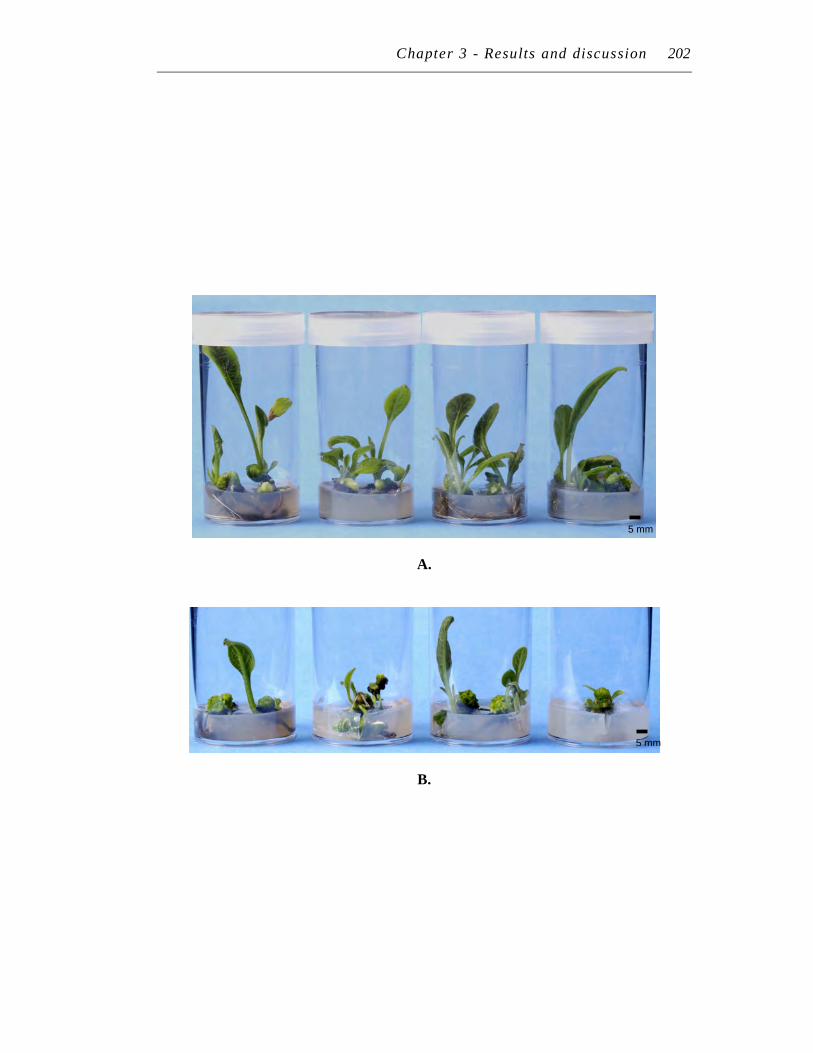
Chapter 3 - Results and discussion 202
A.
B.
5 mm
5 mm

Chapter 3 − Results and discussion 203
10.3.3 Pre-treatment # 5: 0, 500 µµµµM Pb(NO3)2 and 500 µµµµM PbADA (pH 4.5) ( in
vitro petioles)
Two forms of Pb (unchelated and chelated with ADA) were used as the stress factors
for somaclonal variation. The unchelated form was used because metals in this form,
such as Al and Fe, are more toxic in culture than its chelated counterpart (Conner and
Meredith, 1985a and b). The likely reason is that unchelated metals generate more free
radicals that can increase the chances of mutations. According to Levine (2000), ROS
can cause DNA breaks and increase mutation rates, a major driving force in plant
evolution. Additionally, it would be of interest to test the recognition of Pb pre-
treatment form (chelated vs. unchelated) upon re-treatment.
After one week of pre-treatment, Pb stress was observed at the petiole base of the
shoot tissue (Plate 28A). In control solution, the one cm petiole base of shoots rooted
and turned red, possibly reflecting active antioxidative defence activity at the cut end.
Shoots in all Pb solutions did not root. In unchelated Pb treatments, two out of the three
petiole bases blackened severely. Based on the Pb levels in the petiole (see results
section 12.1.1), only the first three pre-treatments were chosen for shoot regeneration: 0
(control), 500 µM Pb(NO3)2 , 500 µM Pb(NO3)2 with 500 µM ADA (Pb:ADA, 1:1
molar ratio).
Within two weeks all petioles, regardless of treatment, developed callus of
varying sizes at the root pole end. After six weeks, shoots developed from the callus
ends, along the petiole length and sometimes at the shoot end. The development of a
callus largely depended on the size of the petiole cut end; the larger the petiole width,
the larger the callus. Examples of the best growth responses are shown in Plates 28B
and C; the photos shown are not representative of the trend observed across the
treatments. Across treatments, there appeared to be no consistent visible differences in
shoot size, callus size or morphology. Two months on the MS F(0) medium were
required to obtain a sufficient number of shoots in all treatments, before transferring to
MS N(0) medium. This took twice as long than anticipated. Despite this, more
importantly no contamination such as those observed in pre-treated whole plants (results
section 10.1), occurred. Shoot and callus growth were successfully generated from Pb-
pre-treated petioles of shoot cuttings. The shoot cuttings also successful developed into
whole plants on the MS N(0) medium (Plate 29). The question of whether there was
enough Pb in the cultured petiole to induce somaclonal variation is discussed in
Chapter 4.
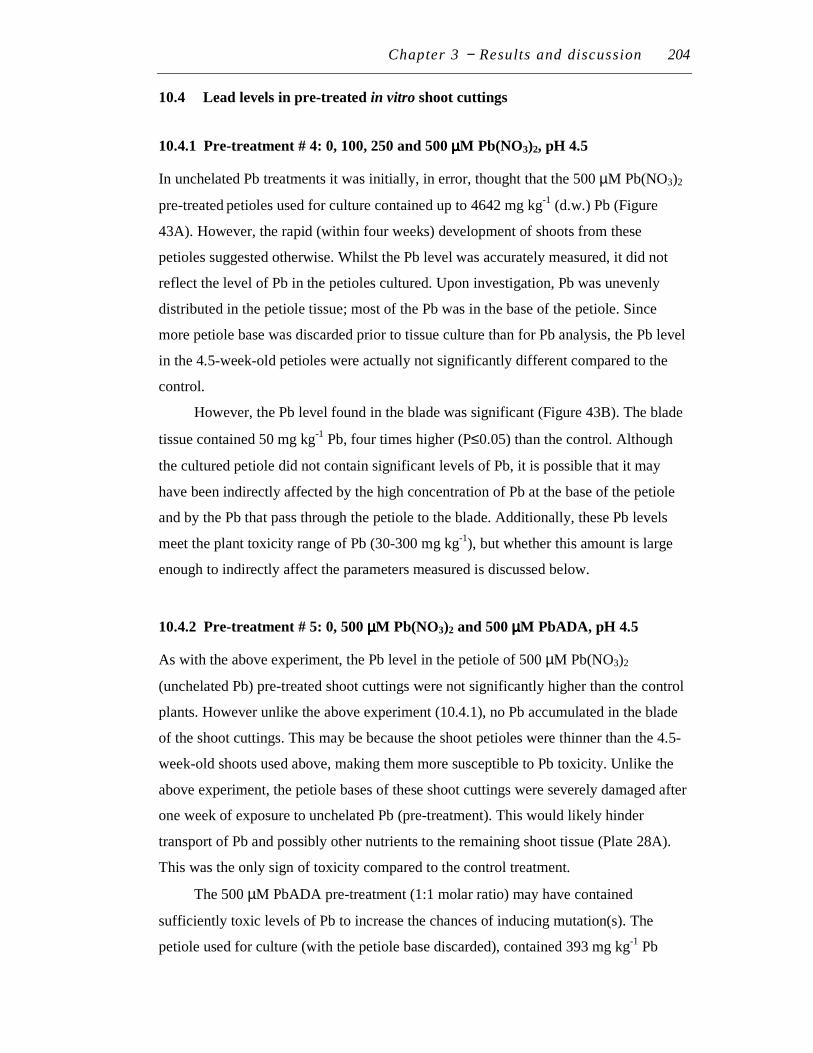
Chapter 3 − Results and discussion 204
10.4 Lead levels in pre-treated in vitro shoot cuttings
10.4.1 Pre-treatment # 4: 0, 100, 250 and 500 µµµµM Pb(NO3)2, pH 4.5
In unchelated Pb treatments it was initially, in error, thought that the 500 µM Pb(NO3)2
pre-treated petioles used for culture contained up to 4642 mg kg-1 (d.w.) Pb (Figure
43A). However, the rapid (within four weeks) development of shoots from these
petioles suggested otherwise. Whilst the Pb level was accurately measured, it did not
reflect the level of Pb in the petioles cultured. Upon investigation, Pb was unevenly
distributed in the petiole tissue; most of the Pb was in the base of the petiole. Since
more petiole base was discarded prior to tissue culture than for Pb analysis, the Pb level
in the 4.5-week-old petioles were actually not significantly different compared to the
control.
However, the Pb level found in the blade was significant (Figure 43B). The blade
tissue contained 50 mg kg-1 Pb, four times higher (P≤0.05) than the control. Although
the cultured petiole did not contain significant levels of Pb, it is possible that it may
have been indirectly affected by the high concentration of Pb at the base of the petiole
and by the Pb that pass through the petiole to the blade. Additionally, these Pb levels
meet the plant toxicity range of Pb (30-300 mg kg-1), but whether this amount is large
enough to indirectly affect the parameters measured is discussed below.
10.4.2 Pre-treatment # 5: 0, 500 µµµµM Pb(NO3)2 and 500 µµµµM PbADA, pH 4.5
As with the above experiment, the Pb level in the petiole of 500 µM Pb(NO3)2
(unchelated Pb) pre-treated shoot cuttings were not significantly higher than the control
plants. However unlike the above experiment (10.4.1), no Pb accumulated in the blade
of the shoot cuttings. This may be because the shoot petioles were thinner than the 4.5-
week-old shoots used above, making them more susceptible to Pb toxicity. Unlike the
above experiment, the petiole bases of these shoot cuttings were severely damaged after
one week of exposure to unchelated Pb (pre-treatment). This would likely hinder
transport of Pb and possibly other nutrients to the remaining shoot tissue (Plate 28A).
This was the only sign of toxicity compared to the control treatment.
The 500 µM PbADA pre-treatment (1:1 molar ratio) may have contained
sufficiently toxic levels of Pb to increase the chances of inducing mutation(s). The
petiole used for culture (with the petiole base discarded), contained 393 mg kg-1 Pb

Chapter 3 − Results and discussion 205
(d.w.) whilst the blade contained an average of 317 mg kg-1 Pb (d.w.) The Pb level in
500 µM PbADA (1:2 molar ratio) pre-treated shoots were slightly higher, but not
significantly different. The 1:1 molar ratio of PbADA treatment was chosen for culture
because there was more Pb in the petiole due to less Pb translocation to the blade
(compared to the 1:2 molar ratio pre-treatment) (Figure 44).

Chapter 3 - Results and discussion 208
Plate 28. Pre-treatment # 5: Effect of Pb exposure on petioles and shoot
regeneration from petioles. HC = Huang and Cunningham.
A. Petiole base from 3-week-old in vitro shoots treated for one week
with modified HC nutrient solution (pH 4.5) containing 2% (w/v)
sucrose with (from top to bottom):
0 (control)
500 µM Pb(NO3)2 (Pb)
500 µM Pb(NO3)2 and 500 µM ADA (PbADA 1:1)
500 µM Pb(NO3)2 and 1000 µM ADA (PbADA 1:2)
B. Shoot regeneration from in vitro petioles after two weeks on MS
F(0). Petioles were from in vitro Symphytum officinale shoot
cuttings (from 3-week-old plants) pre-treated for one week with
modified HC nutrient solution (pH 4.5) containing 2% (w/v)
sucrose with (from left to right):
0 (control)
500 µM Pb(NO3)2 (Pb)
500 µM Pb(NO3)2 and 500 µM ADA (PbADA 1:1)
C. Same as 28A, except at six weeks on MS F(0).
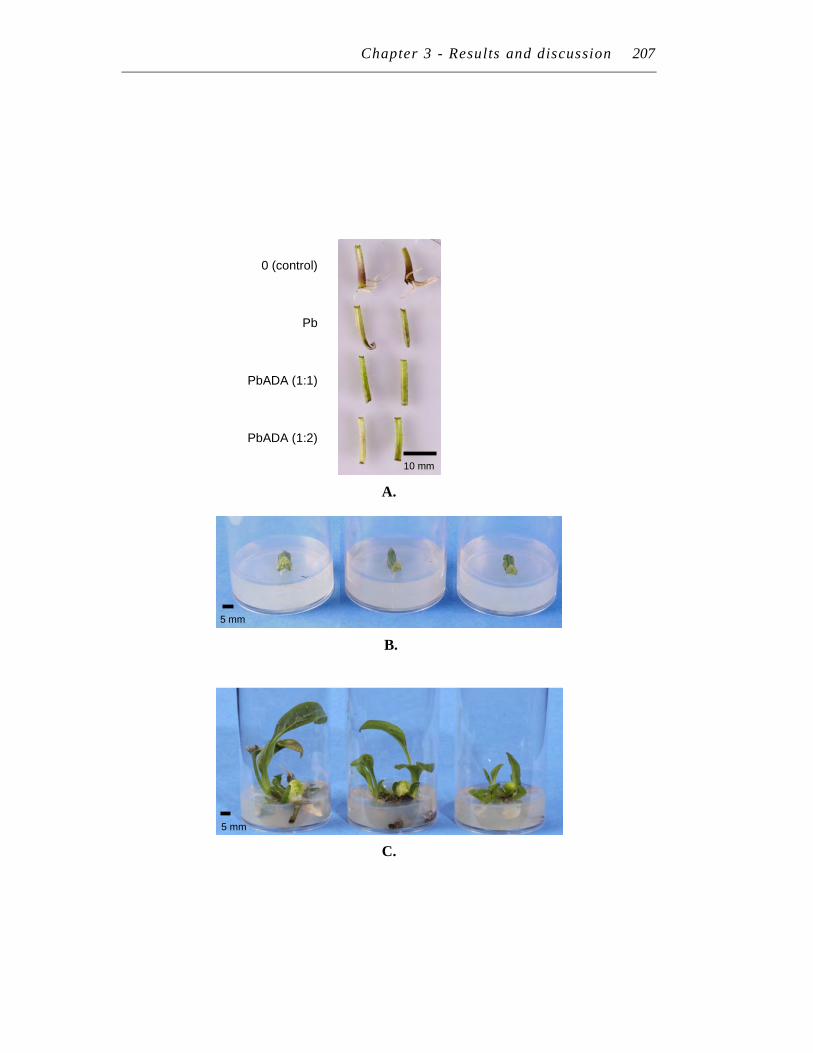
Chapter 3 - Results and discussion 207
A.
B.
C.
0 (control)
Pb
PbADA (1:1)
PbADA (1:2)
10 mm
5 mm
5 mm
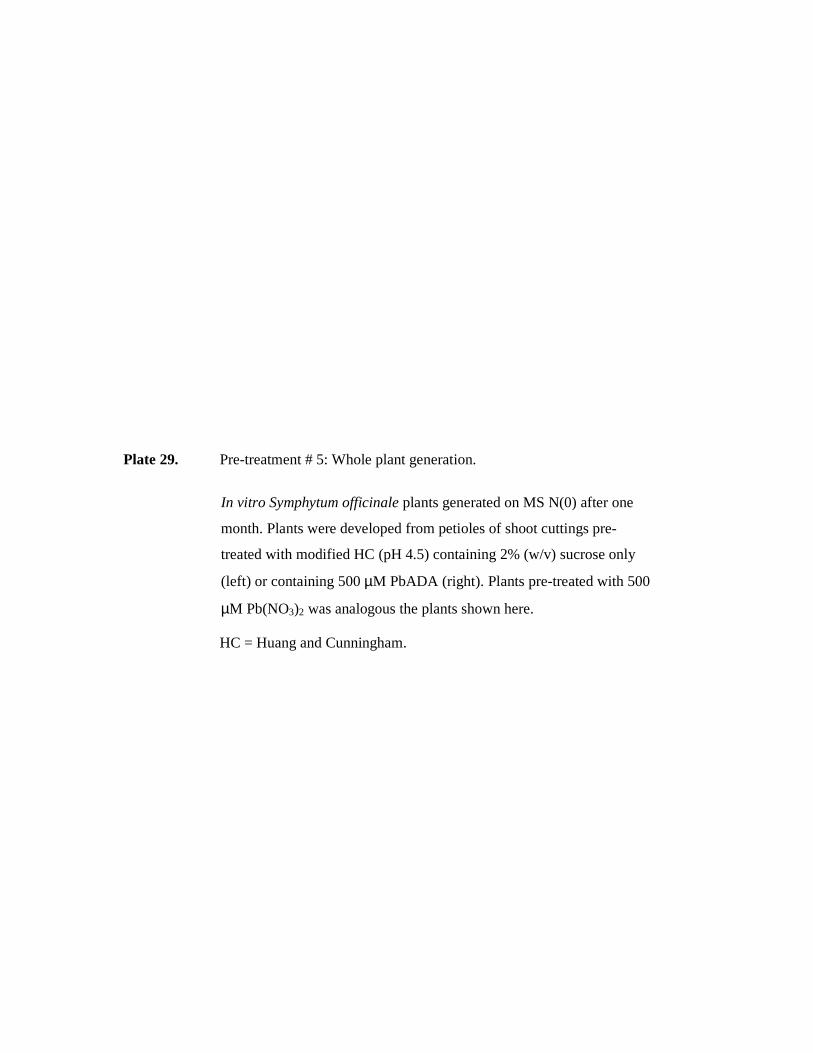
Chapter 3 - Results and discussion 209
Plate 29. Pre-treatment # 5: Whole plant generation.
In vitro Symphytum officinale plants generated on MS N(0) after one
month. Plants were developed from petioles of shoot cuttings pre-
treated with modified HC (pH 4.5) containing 2% (w/v) sucrose only
(left) or containing 500 µM PbADA (right). Plants pre-treated with 500
µM Pb(NO3)2 was analogous the plants shown here.
HC = Huang and Cunningham.
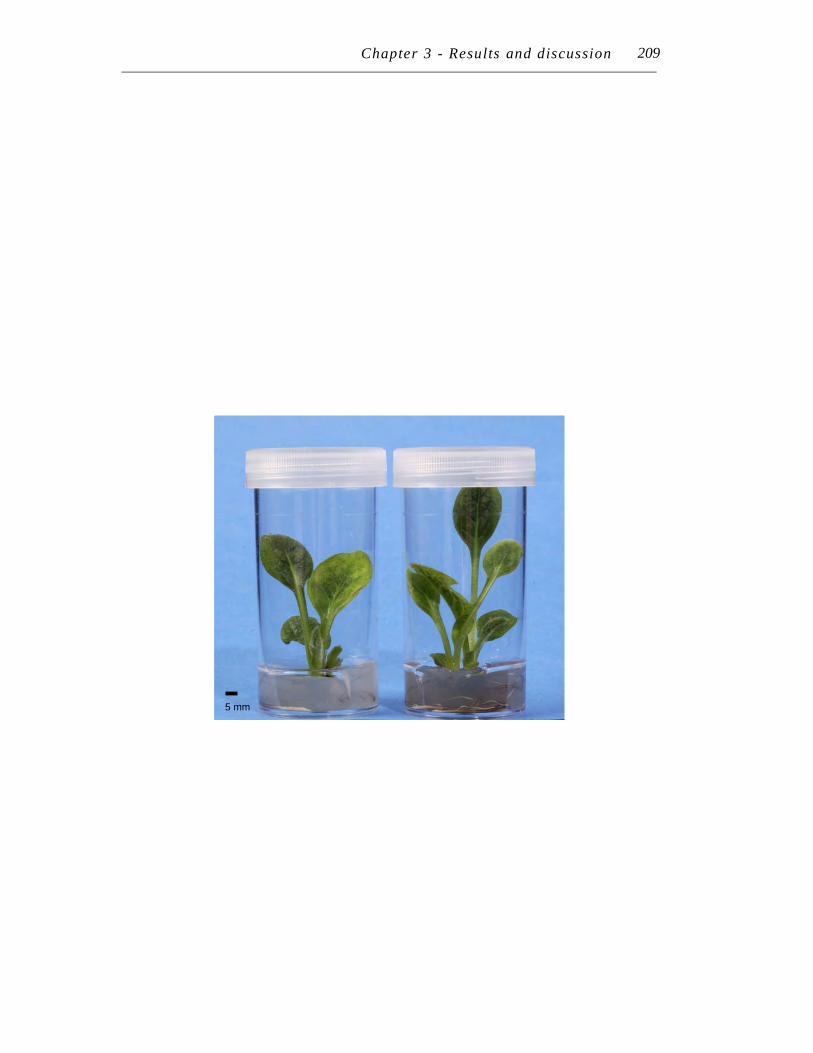
Chapter 3 - Results and discussion 210
5 mm
209
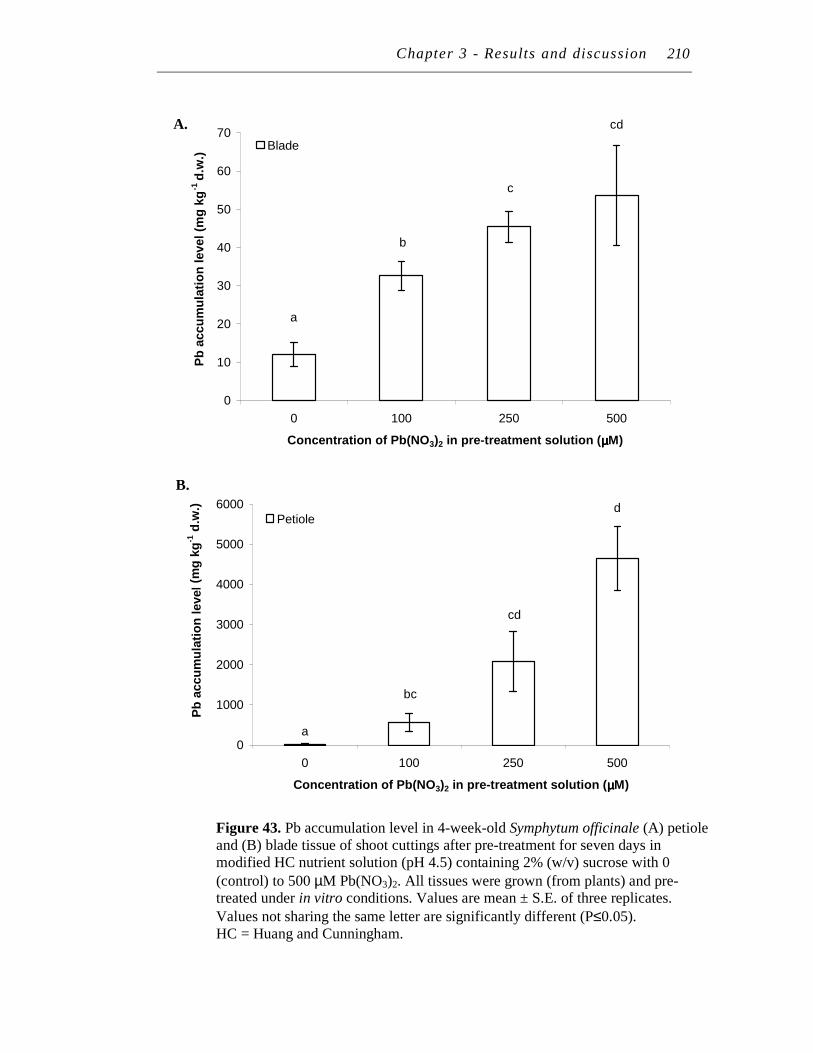
Chapter 3 - Results and discussion 210
cd
c
b
a
0
10
20
30
40
50
60
70
0 100 250 500
Concentration of Pb(NO3)2 in pre-treatment solution (µµµµM)
Pb
accu
mu
lati
on
level
(mg
kg
-1 d
.w.)
Blade
A.
210
a
bc
cd
d
0
1000
2000
3000
4000
5000
6000
0 100 250 500
Concentration of Pb(NO3)2 in pre-treatment solution (µµµµM)
Pb
accu
mu
lati
on
level
(mg
kg
-1)
Petiole
Figure 43. Pb accumulation level in 4-week-old Symphytum officinale (A) petiole and (B) blade tissue of shoot cuttings after pre-treatment for seven days in modified HC nutrient solution (pH 4.5) containing 2% (w/v) sucrose with 0
(control) to 500 µM Pb(NO3)2. All tissues were grown (from plants) and pre-treated under in vitro conditions. Values are mean ± S.E. of three replicates.
Values not sharing the same letter are significantly different (P≤0.05). HC = Huang and Cunningham.
(mg
kg
-1 d
.w.)
B.
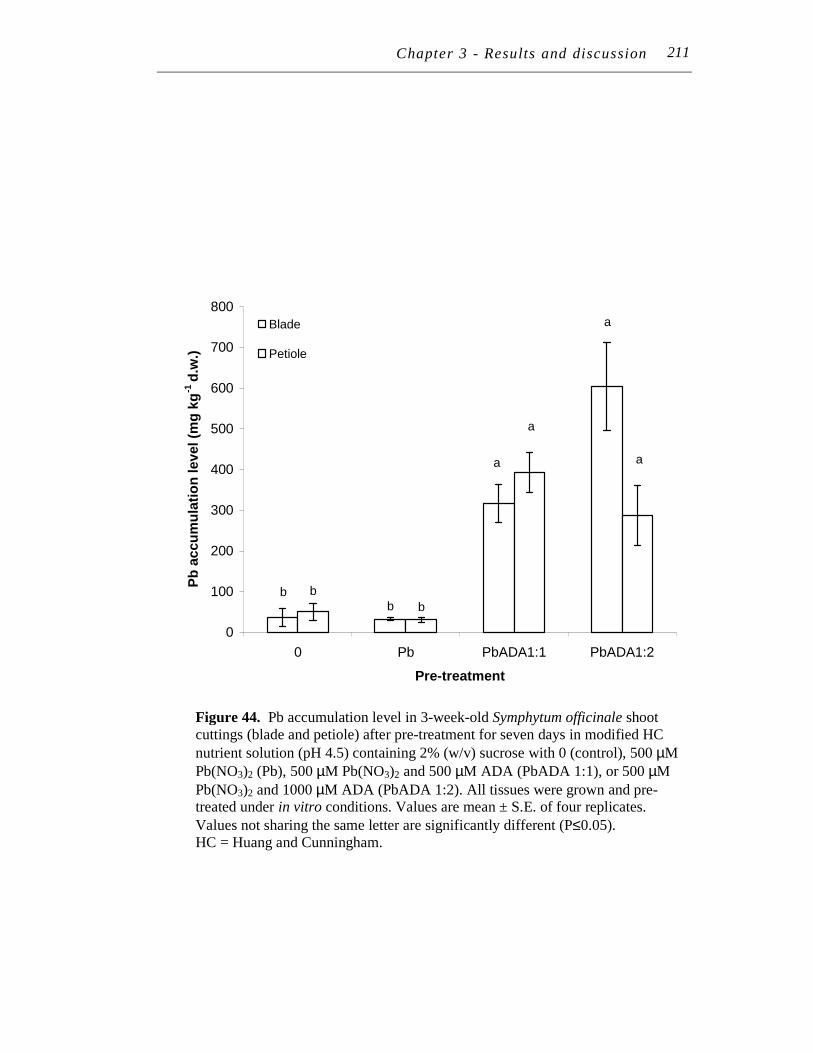
Chapter 3 - Results and discussion 210
Figure 44. Pb accumulation level in 3-week-old Symphytum officinale shoot cuttings (blade and petiole) after pre-treatment for seven days in modified HC
nutrient solution (pH 4.5) containing 2% (w/v) sucrose with 0 (control), 500 µM
Pb(NO3)2 (Pb), 500 µM Pb(NO3)2 and 500 µM ADA (PbADA 1:1), or 500 µM
Pb(NO3)2 and 1000 µM ADA (PbADA 1:2). All tissues were grown and pre-treated under in vitro conditions. Values are mean ± S.E. of four replicates.
Values not sharing the same letter are significantly different (P≤0.05). HC = Huang and Cunningham.
211
b
a
a
b
b
a
a
b
0
100
200
300
400
500
600
700
800
0 Pb PbADA1:1 PbADA1:2
Pre-treatment
Pb
accu
mu
lati
on
level (m
g k
g-1
d.w
.)
Blade
Petiole
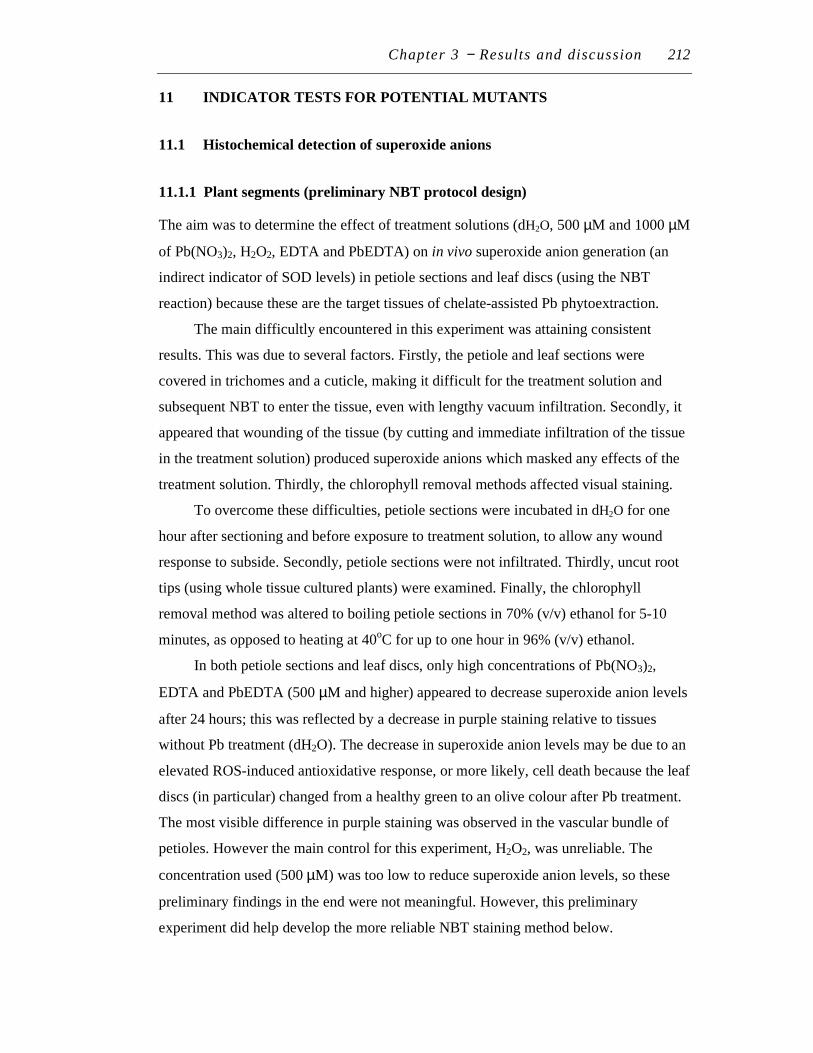
Chapter 3 − Results and discussion 212
11 INDICATOR TESTS FOR POTENTIAL MUTANTS
11.1 Histochemical detection of superoxide anions
11.1.1 Plant segments (preliminary NBT protocol design)
The aim was to determine the effect of treatment solutions (dH2O, 500 µM and 1000 µM
of Pb(NO3)2, H2O2, EDTA and PbEDTA) on in vivo superoxide anion generation (an
indirect indicator of SOD levels) in petiole sections and leaf discs (using the NBT
reaction) because these are the target tissues of chelate-assisted Pb phytoextraction.
The main difficultly encountered in this experiment was attaining consistent
results. This was due to several factors. Firstly, the petiole and leaf sections were
covered in trichomes and a cuticle, making it difficult for the treatment solution and
subsequent NBT to enter the tissue, even with lengthy vacuum infiltration. Secondly, it
appeared that wounding of the tissue (by cutting and immediate infiltration of the tissue
in the treatment solution) produced superoxide anions which masked any effects of the
treatment solution. Thirdly, the chlorophyll removal methods affected visual staining.
To overcome these difficulties, petiole sections were incubated in dH2O for one
hour after sectioning and before exposure to treatment solution, to allow any wound
response to subside. Secondly, petiole sections were not infiltrated. Thirdly, uncut root
tips (using whole tissue cultured plants) were examined. Finally, the chlorophyll
removal method was altered to boiling petiole sections in 70% (v/v) ethanol for 5-10
minutes, as opposed to heating at 40oC for up to one hour in 96% (v/v) ethanol.
In both petiole sections and leaf discs, only high concentrations of Pb(NO3)2,
EDTA and PbEDTA (500 µM and higher) appeared to decrease superoxide anion levels
after 24 hours; this was reflected by a decrease in purple staining relative to tissues
without Pb treatment (dH2O). The decrease in superoxide anion levels may be due to an
elevated ROS-induced antioxidative response, or more likely, cell death because the leaf
discs (in particular) changed from a healthy green to an olive colour after Pb treatment.
The most visible difference in purple staining was observed in the vascular bundle of
petioles. However the main control for this experiment, H2O2, was unreliable. The
concentration used (500 µM) was too low to reduce superoxide anion levels, so these
preliminary findings in the end were not meaningful. However, this preliminary
experiment did help develop the more reliable NBT staining method below.
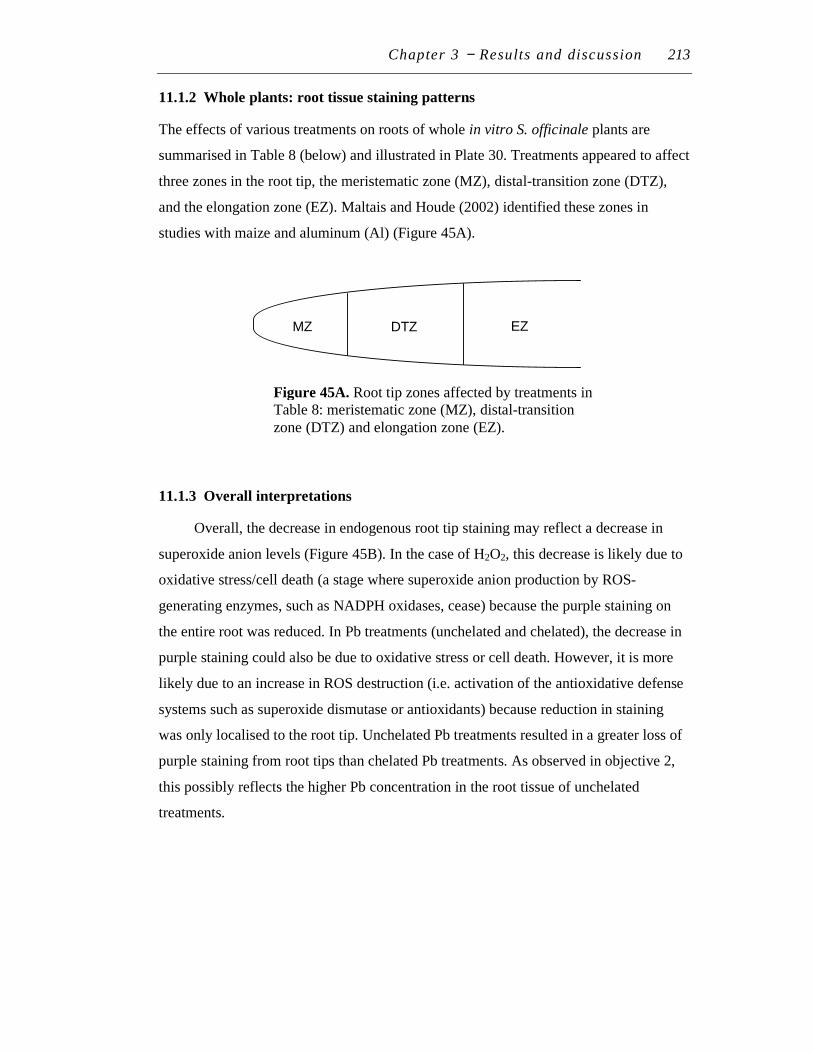
Chapter 3 − Results and discussion 213
11.1.2 Whole plants: root tissue staining patterns
The effects of various treatments on roots of whole in vitro S. officinale plants are
summarised in Table 8 (below) and illustrated in Plate 30. Treatments appeared to affect
three zones in the root tip, the meristematic zone (MZ), distal-transition zone (DTZ),
and the elongation zone (EZ). Maltais and Houde (2002) identified these zones in
studies with maize and aluminum (Al) (Figure 45A).
11.1.3 Overall interpretations
Overall, the decrease in endogenous root tip staining may reflect a decrease in
superoxide anion levels (Figure 45B). In the case of H2O2, this decrease is likely due to
oxidative stress/cell death (a stage where superoxide anion production by ROS-
generating enzymes, such as NADPH oxidases, cease) because the purple staining on
the entire root was reduced. In Pb treatments (unchelated and chelated), the decrease in
purple staining could also be due to oxidative stress or cell death. However, it is more
likely due to an increase in ROS destruction (i.e. activation of the antioxidative defense
systems such as superoxide dismutase or antioxidants) because reduction in staining
was only localised to the root tip. Unchelated Pb treatments resulted in a greater loss of
purple staining from root tips than chelated Pb treatments. As observed in objective 2,
this possibly reflects the higher Pb concentration in the root tissue of unchelated
treatments.
MZ EZDTZ
Figure 45A. Root tip zones affected by treatments in Table 8: meristematic zone (MZ), distal-transition zone (DTZ) and elongation zone (EZ).
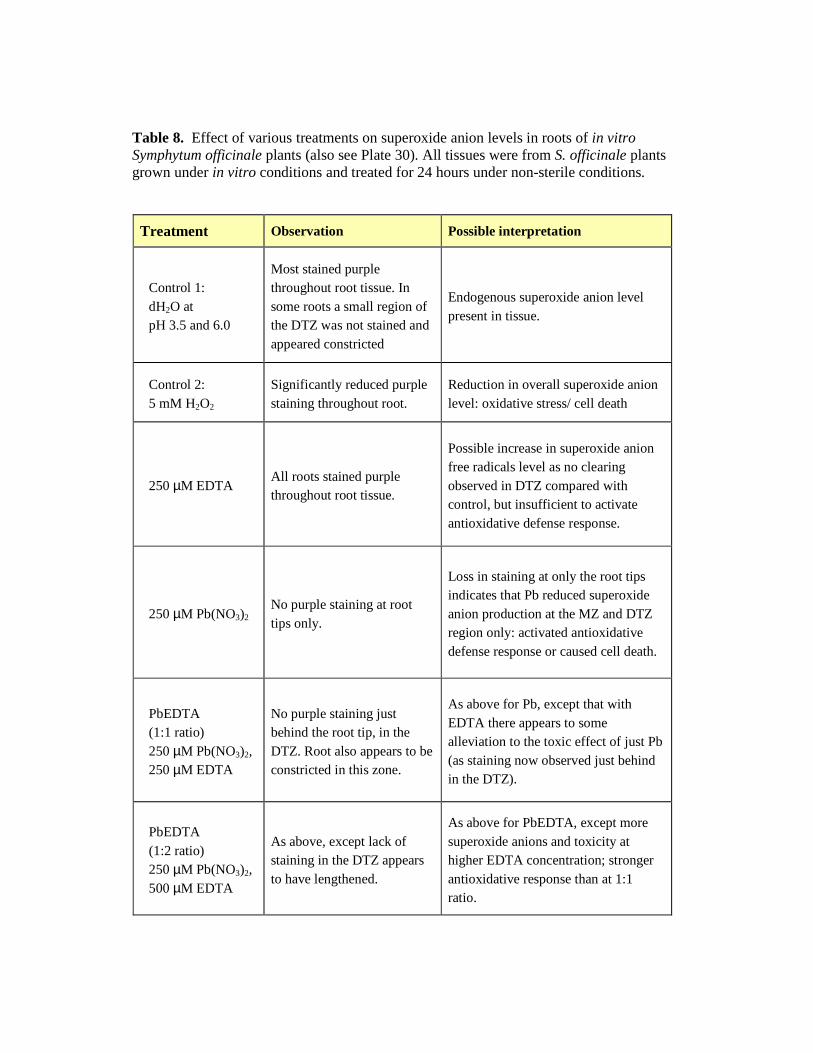
Table 8. Effect of various treatments on superoxide anion levels in roots of in vitro Symphytum officinale plants (also see Plate 30). All tissues were from S. officinale plants grown under in vitro conditions and treated for 24 hours under non-sterile conditions.
Treatment Observation Possible interpretation
Control 1:
dH2O at
pH 3.5 and 6.0
Most stained purple
throughout root tissue. In
some roots a small region of
the DTZ was not stained and
appeared constricted
Endogenous superoxide anion level
present in tissue.
Control 2:
5 mM H2O2
Significantly reduced purple
staining throughout root.
Reduction in overall superoxide anion
level: oxidative stress/ cell death
250 µM EDTA All roots stained purple
throughout root tissue.
Possible increase in superoxide anion
free radicals level as no clearing
observed in DTZ compared with
control, but insufficient to activate
antioxidative defense response.
250 µM Pb(NO3)2 No purple staining at root
tips only.
Loss in staining at only the root tips
indicates that Pb reduced superoxide
anion production at the MZ and DTZ
region only: activated antioxidative
defense response or caused cell death.
PbEDTA
(1:1 ratio)
250 µM Pb(NO3)2,
250 µM EDTA
No purple staining just
behind the root tip, in the
DTZ. Root also appears to be
constricted in this zone.
As above for Pb, except that with
EDTA there appears to some
alleviation to the toxic effect of just Pb
(as staining now observed just behind
in the DTZ).
PbEDTA
(1:2 ratio)
250 µM Pb(NO3)2,
500 µM EDTA
As above, except lack of
staining in the DTZ appears
to have lengthened.
As above for PbEDTA, except more
superoxide anions and toxicity at
higher EDTA concentration; stronger
antioxidative response than at 1:1
ratio.

dH2O H2O2 EDTA Pb(NO3)2 PbEDTA (1:1) PbEDTA (1:2)
pH 6.0 5 mM 250 µM 250 µM 250 µM Pb(NO3)2 250 µM Pb(NO3)2
250 µM EDTA 500 µM EDTA
Plate 30. NBT localisation of superoxide anions (purple staining) in roots. Red arrows indicate region devoid of purple NBT stain
(reflecting a decrease in superoxide anion levels relative to the dH2O control).
215
0.5 mm
Chapter 3 − Results and discussion 216
Interestingly however, this does not apply when the two chelated Pb treatments are
compared to each other. EDTA at twice the molar ratio of Pb(NO3)2 appeared to induce
a stronger antioxidative defence response (more loss in purple staining) than at the 1:1
molar ratio of these reagents. This was unexpected given that less Pb in the root tissue
(due to the higher EDTA concentration, see objective 2) should in theory lead to less
superoxide anion production and therefore less antioxidative defence activity. The
observed results may be because 500 µM EDTA (alone or in synergy with Pb ions)
actually increased superoxide anions and consequently a stronger antioxidative
Figure 45B. Possible superoxide anion levels during treatment and NBT stain.
decreased •O2- levels
decreased purple staining in root
superoxide anions (•O2
-) and degree of purple staining on roots
cell death decreased purple
staining in root
return to endogenous
levels of •O2
-
endogenous level of superoxide anions
excessive •O2- levels
leads to oxidative stress more purple stain
compared to control
Pb or EDTA
treatment
antioxidative defense system activated e.g.
increased SOD activity
antioxidative defence
system fails
NBT
Formazan
(purple stain)
•O2-
increased •O2
- levels
more purple stain
compared to control
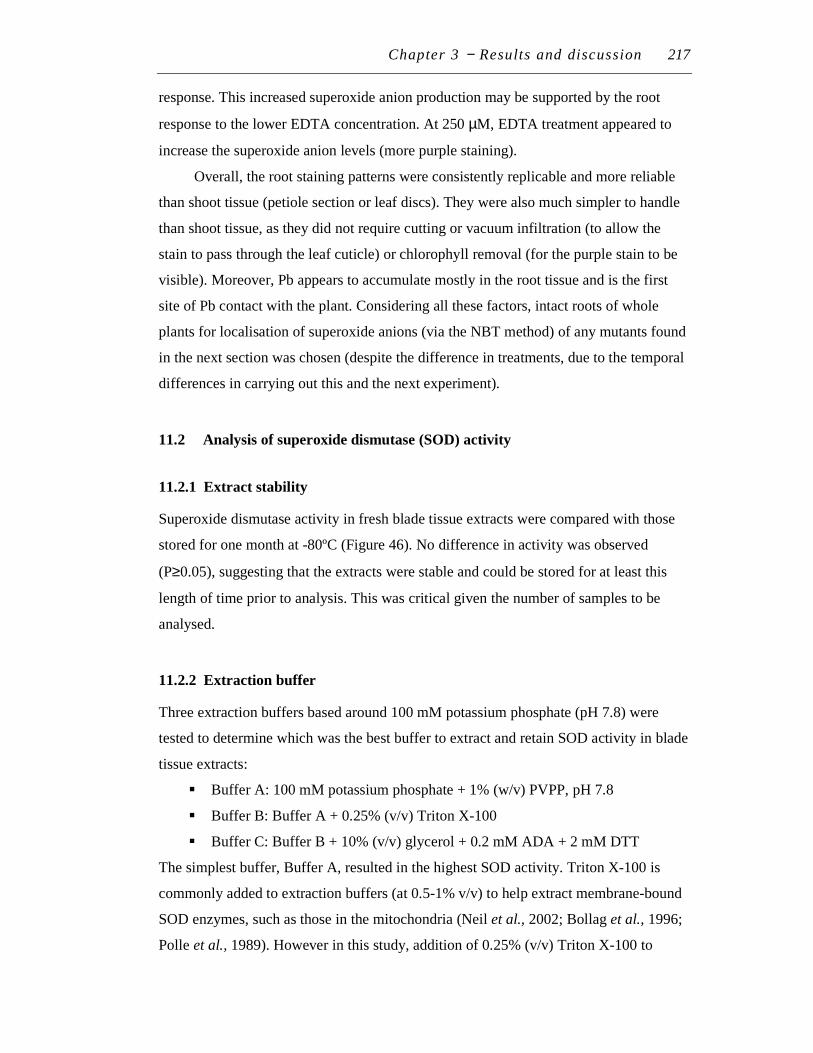
Chapter 3 − Results and discussion 217
response. This increased superoxide anion production may be supported by the root
response to the lower EDTA concentration. At 250 µM, EDTA treatment appeared to
increase the superoxide anion levels (more purple staining).
Overall, the root staining patterns were consistently replicable and more reliable
than shoot tissue (petiole section or leaf discs). They were also much simpler to handle
than shoot tissue, as they did not require cutting or vacuum infiltration (to allow the
stain to pass through the leaf cuticle) or chlorophyll removal (for the purple stain to be
visible). Moreover, Pb appears to accumulate mostly in the root tissue and is the first
site of Pb contact with the plant. Considering all these factors, intact roots of whole
plants for localisation of superoxide anions (via the NBT method) of any mutants found
in the next section was chosen (despite the difference in treatments, due to the temporal
differences in carrying out this and the next experiment).
11.2 Analysis of superoxide dismutase (SOD) activity
11.2.1 Extract stability
Superoxide dismutase activity in fresh blade tissue extracts were compared with those
stored for one month at -80ºC (Figure 46). No difference in activity was observed
(P≥0.05), suggesting that the extracts were stable and could be stored for at least this
length of time prior to analysis. This was critical given the number of samples to be
analysed.
11.2.2 Extraction buffer
Three extraction buffers based around 100 mM potassium phosphate (pH 7.8) were
tested to determine which was the best buffer to extract and retain SOD activity in blade
tissue extracts:
� Buffer A: 100 mM potassium phosphate + 1% (w/v) PVPP, pH 7.8
� Buffer B: Buffer A + 0.25% (v/v) Triton X-100
� Buffer C: Buffer B + 10% (v/v) glycerol + 0.2 mM ADA + 2 mM DTT
The simplest buffer, Buffer A, resulted in the highest SOD activity. Triton X-100 is
commonly added to extraction buffers (at 0.5-1% v/v) to help extract membrane-bound
SOD enzymes, such as those in the mitochondria (Neil et al., 2002; Bollag et al., 1996;
Polle et al., 1989). However in this study, addition of 0.25% (v/v) Triton X-100 to
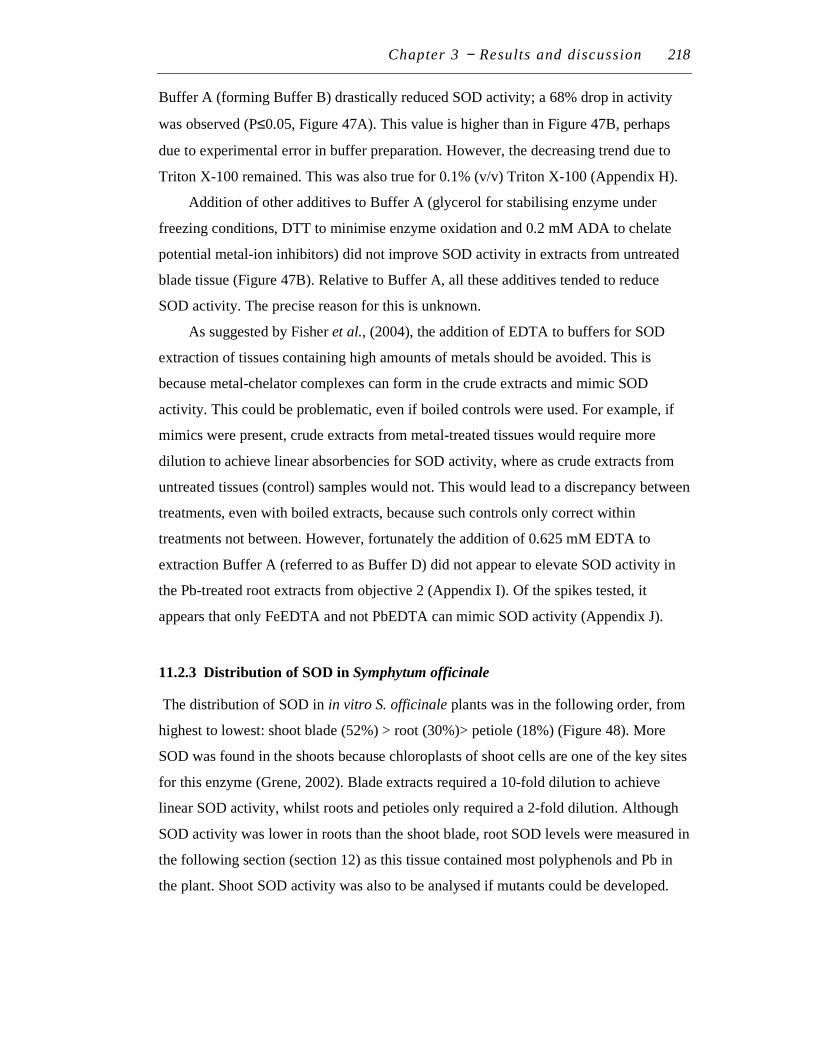
Chapter 3 − Results and discussion 218
Buffer A (forming Buffer B) drastically reduced SOD activity; a 68% drop in activity
was observed (P≤0.05, Figure 47A). This value is higher than in Figure 47B, perhaps
due to experimental error in buffer preparation. However, the decreasing trend due to
Triton X-100 remained. This was also true for 0.1% (v/v) Triton X-100 (Appendix H).
Addition of other additives to Buffer A (glycerol for stabilising enzyme under
freezing conditions, DTT to minimise enzyme oxidation and 0.2 mM ADA to chelate
potential metal-ion inhibitors) did not improve SOD activity in extracts from untreated
blade tissue (Figure 47B). Relative to Buffer A, all these additives tended to reduce
SOD activity. The precise reason for this is unknown.
As suggested by Fisher et al., (2004), the addition of EDTA to buffers for SOD
extraction of tissues containing high amounts of metals should be avoided. This is
because metal-chelator complexes can form in the crude extracts and mimic SOD
activity. This could be problematic, even if boiled controls were used. For example, if
mimics were present, crude extracts from metal-treated tissues would require more
dilution to achieve linear absorbencies for SOD activity, where as crude extracts from
untreated tissues (control) samples would not. This would lead to a discrepancy between
treatments, even with boiled extracts, because such controls only correct within
treatments not between. However, fortunately the addition of 0.625 mM EDTA to
extraction Buffer A (referred to as Buffer D) did not appear to elevate SOD activity in
the Pb-treated root extracts from objective 2 (Appendix I). Of the spikes tested, it
appears that only FeEDTA and not PbEDTA can mimic SOD activity (Appendix J).
11.2.3 Distribution of SOD in Symphytum officinale
The distribution of SOD in in vitro S. officinale plants was in the following order, from
highest to lowest: shoot blade (52%) > root (30%)> petiole (18%) (Figure 48). More
SOD was found in the shoots because chloroplasts of shoot cells are one of the key sites
for this enzyme (Grene, 2002). Blade extracts required a 10-fold dilution to achieve
linear SOD activity, whilst roots and petioles only required a 2-fold dilution. Although
SOD activity was lower in roots than the shoot blade, root SOD levels were measured in
the following section (section 12) as this tissue contained most polyphenols and Pb in
the plant. Shoot SOD activity was also to be analysed if mutants could be developed.
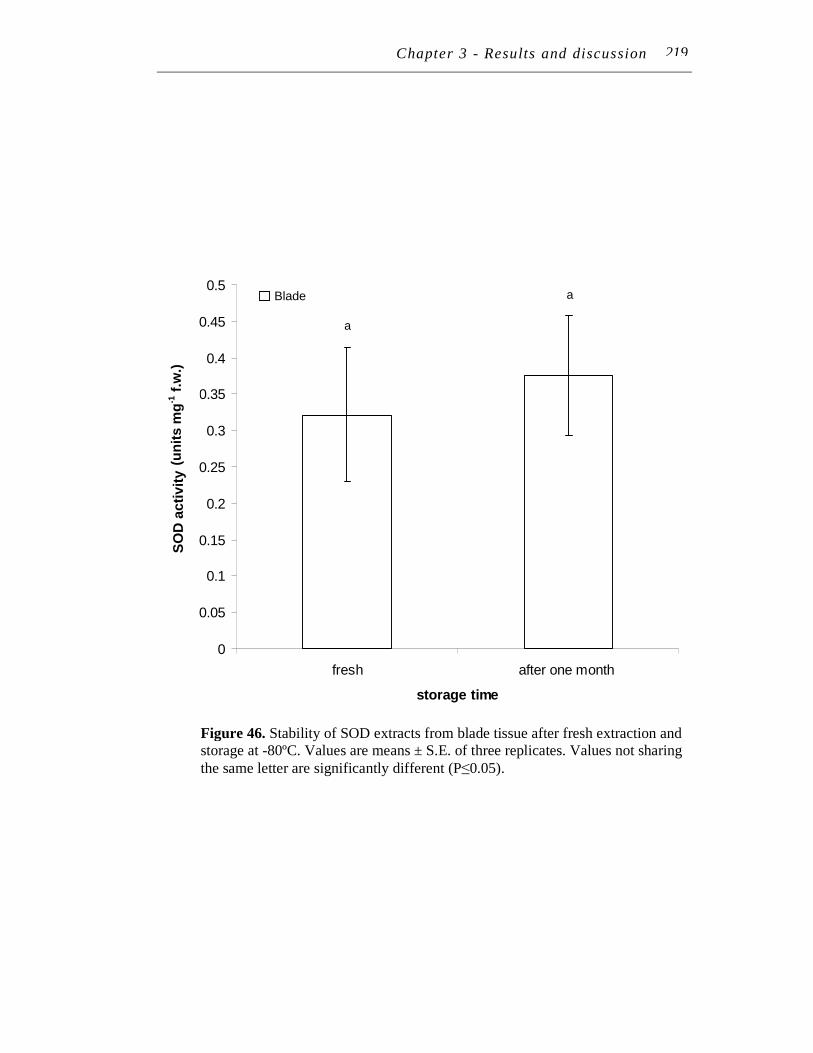
Chapter 3 - Results and discussion 221
a
a
0
0.05
0.1
0.15
0.2
0.25
0.3
0.35
0.4
0.45
0.5
fresh after one month
storage time
SO
D a
cti
vit
y (
un
its
/mg
f.w
.)
Figure 46. Stability of SOD extracts from blade tissue after fresh extraction and storage at -80ºC. Values are means ± S.E. of three replicates. Values not sharing the same letter are significantly different (P≤0.05).
Blade
f.w
.)
219
(un
its m
g-1
f.w
.)
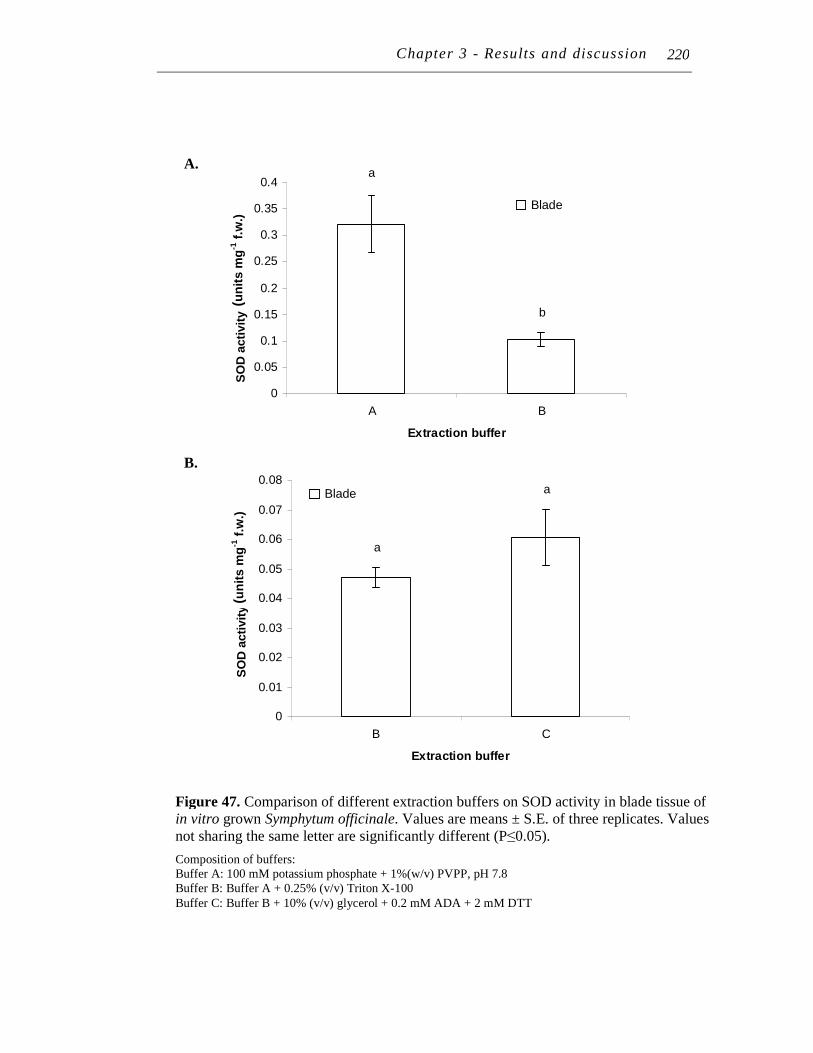
Chapter 3 - Results and discussion 221
B.
A.
b
a
0
0.05
0.1
0.15
0.2
0.25
0.3
0.35
0.4
A B
Extraction buffer
SO
D a
cti
vit
y (
un
its S
OD
/mg
f.w
.)
a
a
0
0.01
0.02
0.03
0.04
0.05
0.06
0.07
0.08
B C
Extraction buffer
SO
D a
cti
vit
y (
un
its/m
g f
.w.)
Figure 47. Comparison of different extraction buffers on SOD activity in blade tissue of in vitro grown Symphytum officinale. Values are means ± S.E. of three replicates. Values not sharing the same letter are significantly different (P≤0.05).
Composition of buffers: Buffer A: 100 mM potassium phosphate + 1%(w/v) PVPP, pH 7.8 Buffer B: Buffer A + 0.25% (v/v) Triton X-100
Buffer C: Buffer B + 10% (v/v) glycerol + 0.2 mM ADA + 2 mM DTT
Blade
Blade
220
(un
its m
g-1
f.w
.)
(un
its
mg
-1 f
.w.)
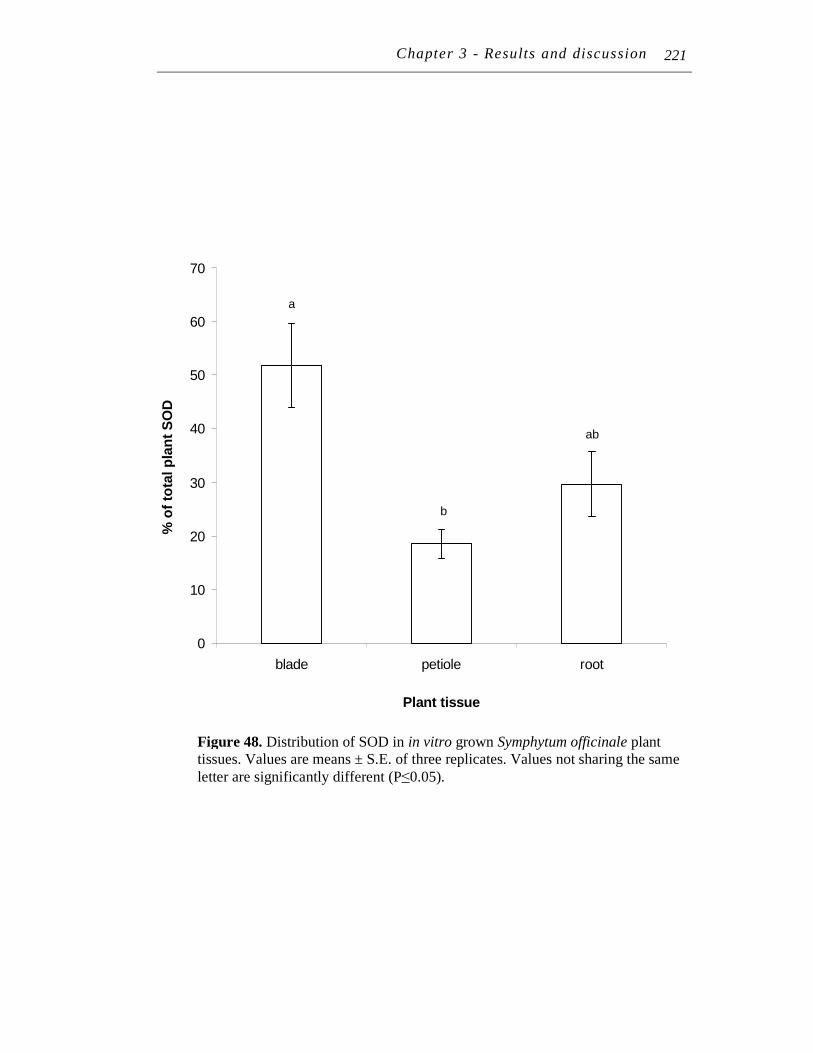
Chapter 3 - Results and discussion 221
ab
b
a
0
10
20
30
40
50
60
70
blade petiole root
Plant tissue
% o
f to
tal p
lan
t S
OD
Figure 48. Distribution of SOD in in vitro grown Symphytum officinale plant tissues. Values are means ± S.E. of three replicates. Values not sharing the same letter are significantly different (P≤0.05).
221
Chapter 3 − Results and discussion 222
12 LEAD RE-TREATMENT
Significant differences due to Pb pre-treatment were observed in the morphology of
plants pre-treated with unchelated Pb (12.1.3). Pb pre-treatments did not significantly
affect other parameters (Pb, SOD and polyphenol levels) measured (P≥0.05). However,
some promising trends were observed. These are discussed below.
(Note that all pre-treatments on in vitro plant material were performed under sterile
conditions, whilst all re-treatments on in vitro plant material were performed in non-
sterile conditions. All re-treatments used the modified HC nutrient solution).
12.1 Pre-treatment # 4
In this section, plants from petioles pre-treated with 0 or 500 µM Pb(NO3)2 (pH 4.5)
(pre-treatment # 4), were re-treated with 0, 500 µM PbADA (pH 7.0) or 0, 500 µM
Pb(NO3)2 (pH 4.5).
12.1.1 Effect of pre-treatment on lead, polyphenol and SOD levels upon re-
treatment with 500 µµµµM PbADA
In order to compare with 12.2 below, only trends in the form of percentages are
discussed here rather than the actual Pb accumulation values because, unexpectedly, Pb
was lost (via volatilisation) due to the furnace over heating (above 550oC).
In terms of trends, the levels (expressed as percentage) of the Pb, polyphenol and
SOD parameters in Pb pre-treated plants were close to 100% of those without pre-
treatment (Table 9). Hence pre-treatment appeared to have no effect on these
parameters. In contrast to 12.2, the lack of a pre-treatment effect could be due to a lack
of direct or indirect Pb stress, strong recovery from Pb stress or perhaps a shorter
culture time (one month in this case compared to two months in the other re-treatments).
The plants used were generated from those illustrated in Plate 27A. A lack of
recognition to PbADA also cannot be ruled out because upon 500 µM Pb(NO3)2
(unchelated Pb) re-treatment (12.1.3), more defined trends were apparent.
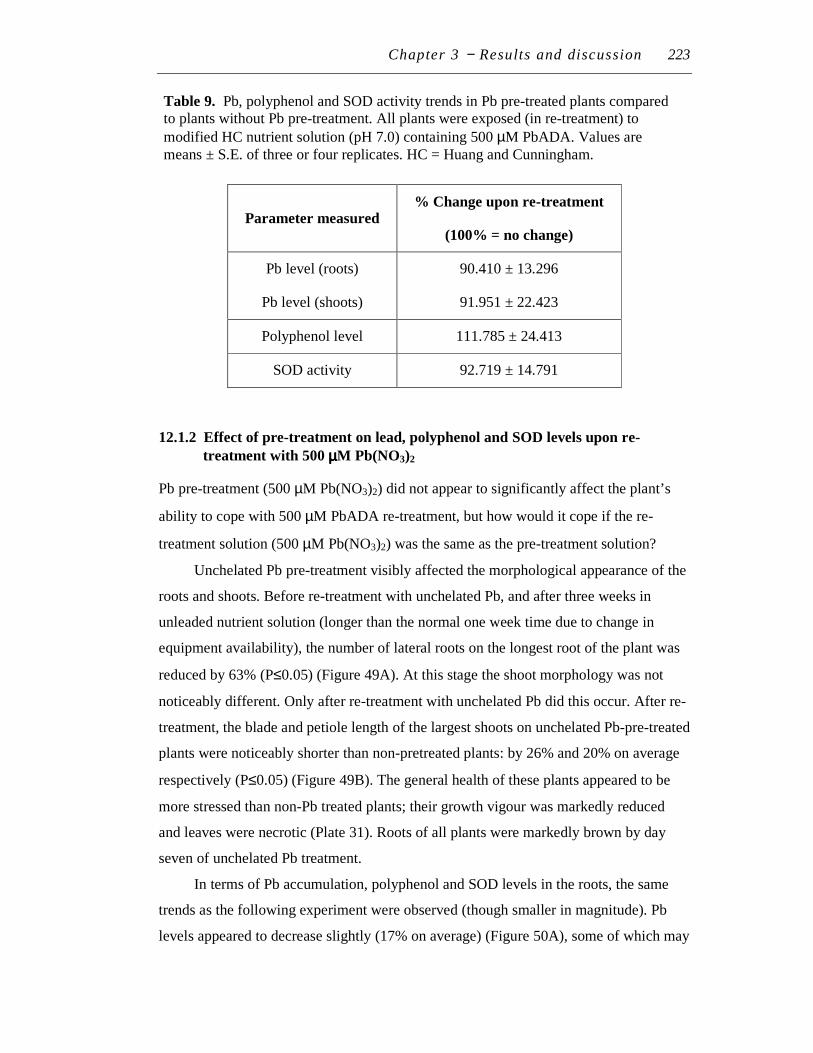
Chapter 3 − Results and discussion 223
12.1.2 Effect of pre-treatment on lead, polyphenol and SOD levels upon re-
treatment with 500 µµµµM Pb(NO3)2
Pb pre-treatment (500 µM Pb(NO3)2) did not appear to significantly affect the plant’s
ability to cope with 500 µM PbADA re-treatment, but how would it cope if the re-
treatment solution (500 µM Pb(NO3)2) was the same as the pre-treatment solution?
Unchelated Pb pre-treatment visibly affected the morphological appearance of the
roots and shoots. Before re-treatment with unchelated Pb, and after three weeks in
unleaded nutrient solution (longer than the normal one week time due to change in
equipment availability), the number of lateral roots on the longest root of the plant was
reduced by 63% (P≤0.05) (Figure 49A). At this stage the shoot morphology was not
noticeably different. Only after re-treatment with unchelated Pb did this occur. After re-
treatment, the blade and petiole length of the largest shoots on unchelated Pb-pre-treated
plants were noticeably shorter than non-pretreated plants: by 26% and 20% on average
respectively (P≤0.05) (Figure 49B). The general health of these plants appeared to be
more stressed than non-Pb treated plants; their growth vigour was markedly reduced
and leaves were necrotic (Plate 31). Roots of all plants were markedly brown by day
seven of unchelated Pb treatment.
In terms of Pb accumulation, polyphenol and SOD levels in the roots, the same
trends as the following experiment were observed (though smaller in magnitude). Pb
levels appeared to decrease slightly (17% on average) (Figure 50A), some of which may
Parameter measured % Change upon re-treatment
(100% = no change)
Pb level (roots)
Pb level (shoots)
90.410 ± 13.296
91.951 ± 22.423
Polyphenol level 111.785 ± 24.413
SOD activity 92.719 ± 14.791
Table 9. Pb, polyphenol and SOD activity trends in Pb pre-treated plants compared to plants without Pb pre-treatment. All plants were exposed (in re-treatment) to
modified HC nutrient solution (pH 7.0) containing 500 µM PbADA. Values are means ± S.E. of three or four replicates. HC = Huang and Cunningham.
Chapter 3 − Results and discussion 224
be due to a small increase in shoot Pb levels (Figure 50B). Similarly, polyphenol levels
appeared to decrease (35%) and there was an increase in SOD activity (56%) (Figure
51A and B). No control (without Pb) was performed here as previous experiments
showed that the Pb levels in re-treatment controls were the same, regardless of pre-
treatment.
Clearly although there was not a significant amount of Pb in the petiole segment
cultured, Pb, whether in the discarded petiole base, in the blade tissue or in the pre-
treatment solution did indirectly affect plant growth. At a biochemical level, oxidative
stress may have also occurred, considering the trends observed in the polyphenol and
SOD levels (see Chapter 4). The indirect effects could be due to one or more of the
other numerous documented effects of Pb on plant tissues. Examples include, reduced
photosynthesis and transpiration rates due to inhibition of the electron transport chain in
mitochondria and chloroplasts (Bazzaz et al., 1974; Carlson et al., 1975; Koeppe, 1981)
and reduction of uptake and accumulation of ions that are critical to the plant health like
calcium, phosphorous (Huang and Cunningham 1996) and nitrogen (Huang et al., 1974;
Lee et al., 1976; Xiong et al., 2006). Recognition of the form of Pb used in the pre-
treatment upon re-treatment and longer culture time (two months in this case, because of
the slower growth response of on MS F(0) media), could also be contributing factors.
The plants used in this section were generated from those illustrated in Plate 27B (page
202).
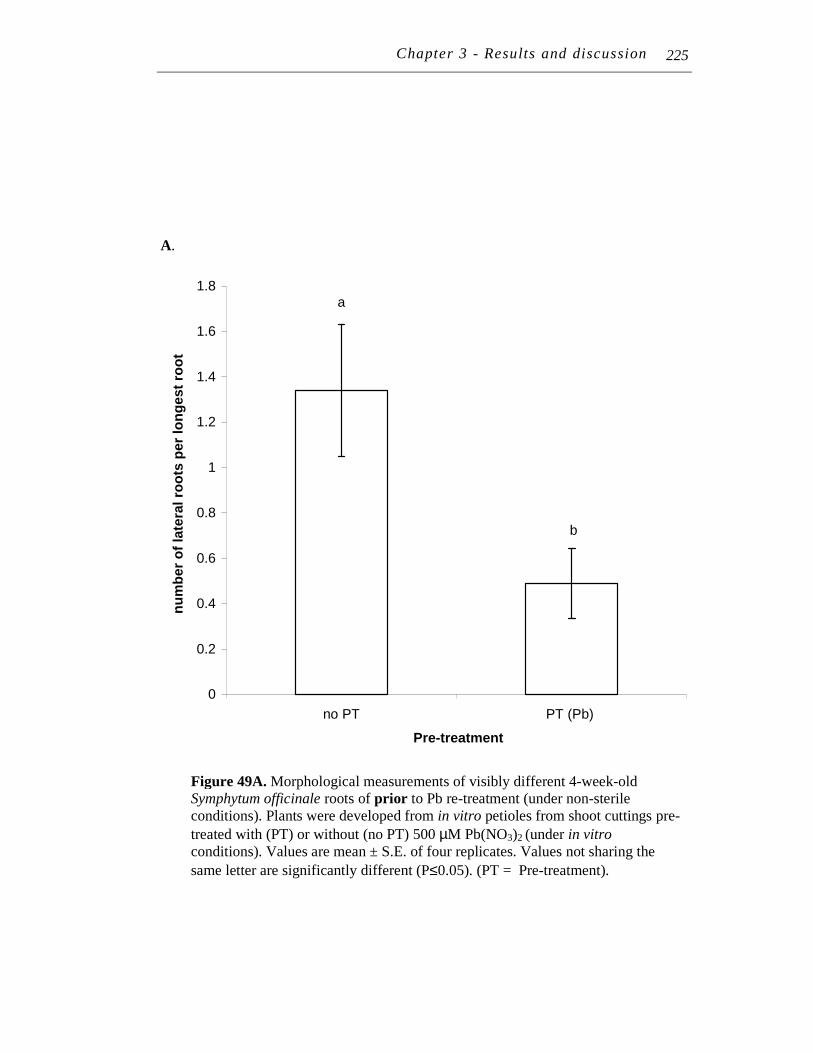
Chapter 3 - Results and discussion 228
b
a
0
0.2
0.4
0.6
0.8
1
1.2
1.4
1.6
1.8
no PT PT (Pb)
Pre-treatment
nu
mb
er
of
late
ral
roo
ts p
er
lon
ge
st
roo
t
Figure 49A. Morphological measurements of visibly different 4-week-old Symphytum officinale roots of prior to Pb re-treatment (under non-sterile conditions). Plants were developed from in vitro petioles from shoot cuttings pre-
treated with (PT) or without (no PT) 500 µM Pb(NO3)2 (under in vitro conditions). Values are mean ± S.E. of four replicates. Values not sharing the
same letter are significantly different (P≤0.05). (PT = Pre-treatment).
A.
225
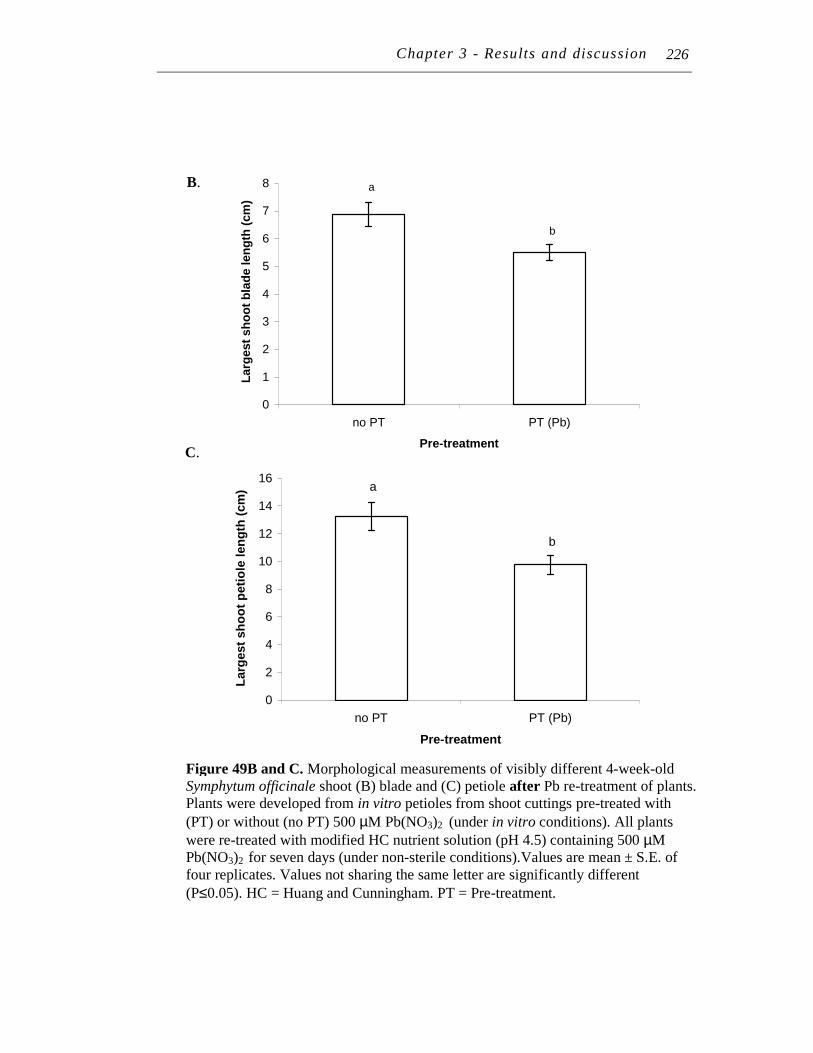
Chapter 3 - Results and discussion 228
b
a
0
1
2
3
4
5
6
7
8
no PT PT (Pb)
Pre-treatment
Larg
est
sh
oo
t b
lad
e len
gth
(cm
)
a
b
0
2
4
6
8
10
12
14
16
no PT PT (Pb)
Pre-treatment
Larg
est
sh
oo
t p
eti
ole
len
gth
(cm
)
Figure 49B and C. Morphological measurements of visibly different 4-week-old Symphytum officinale shoot (B) blade and (C) petiole after Pb re-treatment of plants. Plants were developed from in vitro petioles from shoot cuttings pre-treated with
(PT) or without (no PT) 500 µM Pb(NO3)2 (under in vitro conditions). All plants
were re-treated with modified HC nutrient solution (pH 4.5) containing 500 µM Pb(NO3)2 for seven days (under non-sterile conditions).Values are mean ± S.E. of four replicates. Values not sharing the same letter are significantly different
(P≤0.05). HC = Huang and Cunningham. PT = Pre-treatment.
B.
C.
226
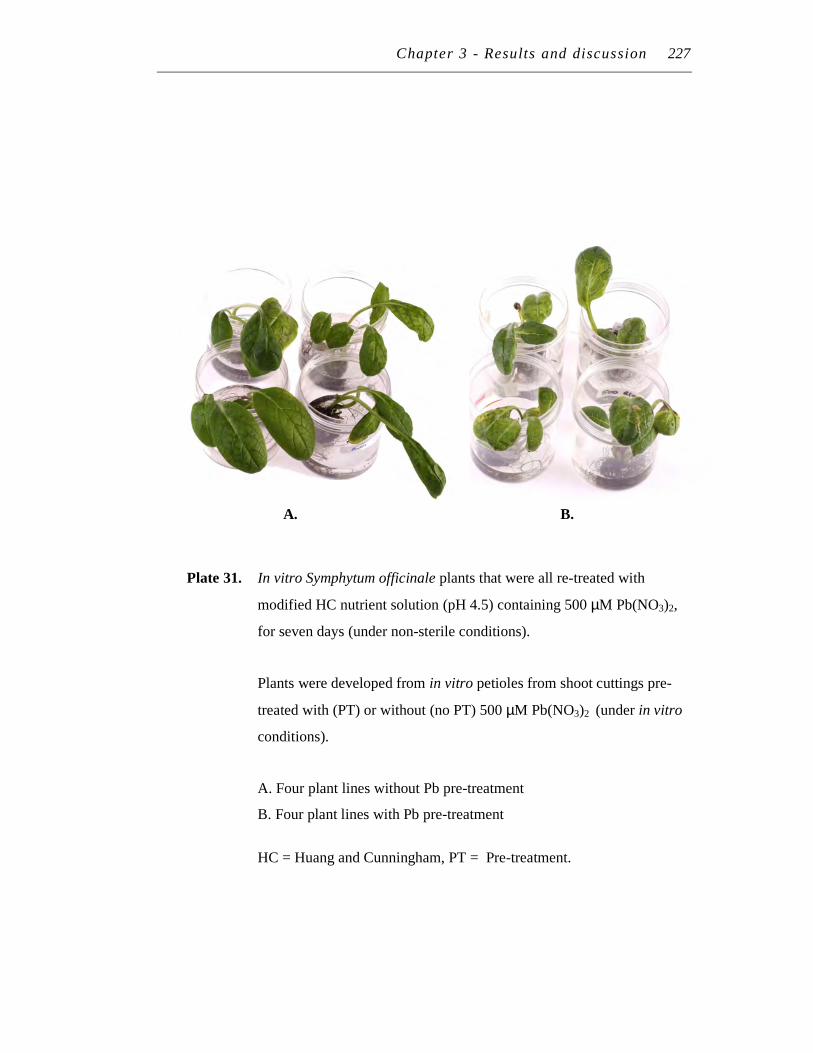
Chapter 3 - Results and discussion 227
Plate 31. In vitro Symphytum officinale plants that were all re-treated with
modified HC nutrient solution (pH 4.5) containing 500 µM Pb(NO3)2,
for seven days (under non-sterile conditions).
Plants were developed from in vitro petioles from shoot cuttings pre-
treated with (PT) or without (no PT) 500 µM Pb(NO3)2 (under in vitro
conditions).
A. Four plant lines without Pb pre-treatment
B. Four plant lines with Pb pre-treatment
HC = Huang and Cunningham, PT = Pre-treatment.
A. B.
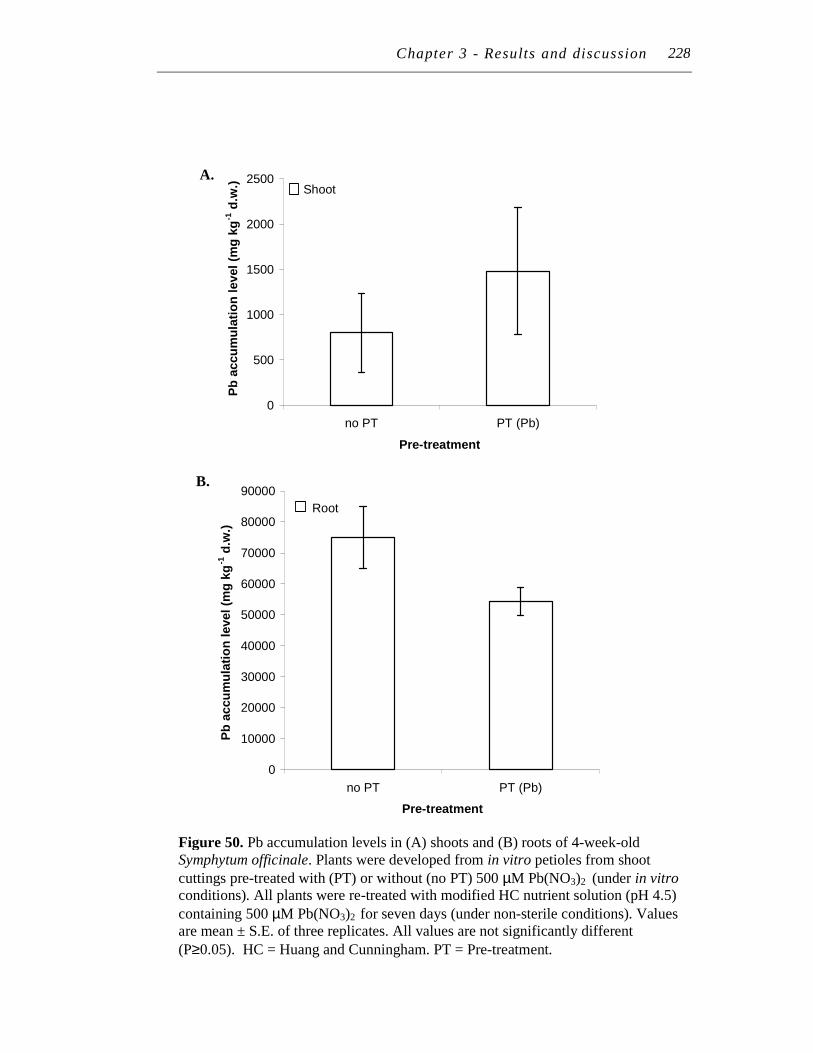
Chapter 3 - Results and discussion 228
Shoot
0
500
1000
1500
2000
2500
no PT PT (Pb)
Pre-treatment
Pb
accu
mu
lati
on
level
(mg
kg
-1 d
.w.)
Figure 50. Pb accumulation levels in (A) shoots and (B) roots of 4-week-old Symphytum officinale. Plants were developed from in vitro petioles from shoot
cuttings pre-treated with (PT) or without (no PT) 500 µM Pb(NO3)2 (under in vitro conditions). All plants were re-treated with modified HC nutrient solution (pH 4.5)
containing 500 µM Pb(NO3)2 for seven days (under non-sterile conditions). Values are mean ± S.E. of three replicates. All values are not significantly different
(P≥0.05). HC = Huang and Cunningham. PT = Pre-treatment.
Root
0
10000
20000
30000
40000
50000
60000
70000
80000
90000
no PT PT (Pb)
Pre-treatment
Pb
accu
mu
lati
on
level
(mg
kg
-1 d
.w.)
A.
B.
228
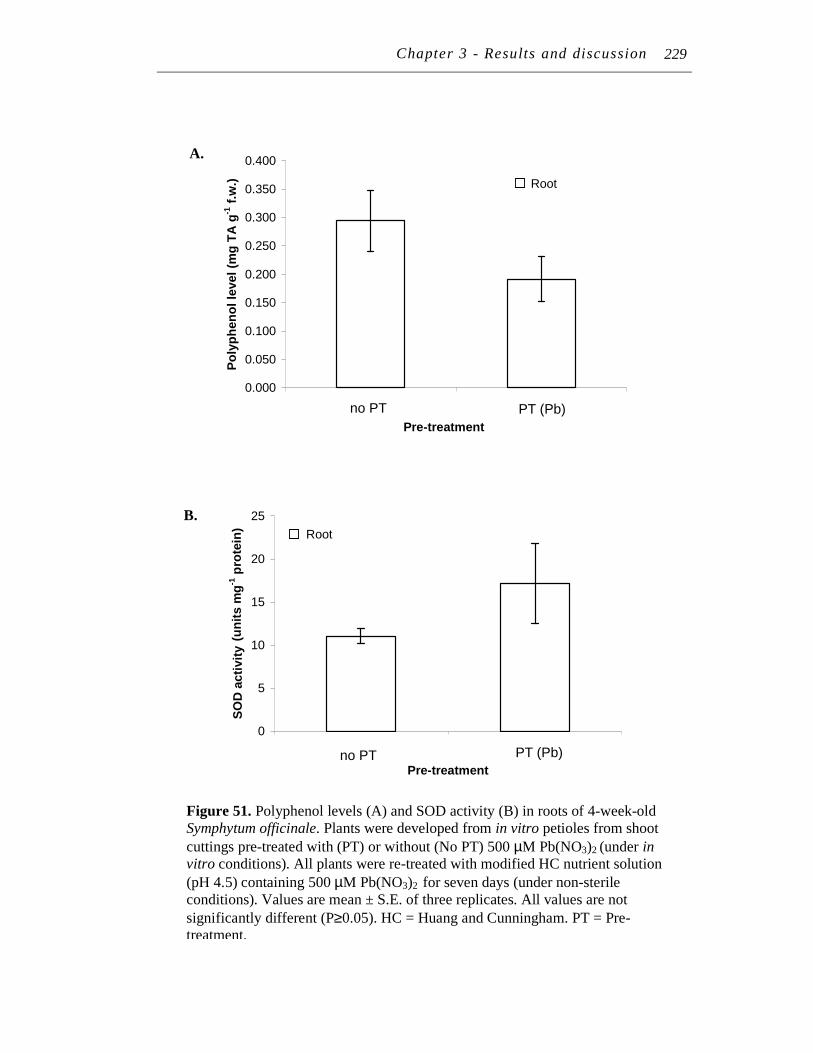
Chapter 3 - Results and discussion 228
0
5
10
15
20
25
O Pb
Pre-treatment
SO
D a
cti
vit
y (
un
its m
g p
rote
in-1
)
0.000
0.050
0.100
0.150
0.200
0.250
0.300
0.350
0.400
O Pb
Pre-treatment
Po
lyp
hen
ol
level
(mg
TA
g-1
f.w
.)
Figure 51. Polyphenol levels (A) and SOD activity (B) in roots of 4-week-old Symphytum officinale. Plants were developed from in vitro petioles from shoot
cuttings pre-treated with (PT) or without (No PT) 500 µM Pb(NO3)2 (under in
vitro conditions). All plants were re-treated with modified HC nutrient solution
(pH 4.5) containing 500 µM Pb(NO3)2 for seven days (under non-sterile conditions). Values are mean ± S.E. of three replicates. All values are not
significantly different (P≥0.05). HC = Huang and Cunningham. PT = Pre-treatment.
A.
B.
no PT PT (Pb)
no PT PT (Pb)
Root
Root
229
(un
its m
g-1
pro
tein
)

Chapter 3 − Results and discussion 230
12.2 Pre-treatment # 5
In this section, plants developed from petioles pre-treated with 0, 500 µM Pb(NO3)2 or
PbADA (pH 4.5) (pre-treatment # 5), were then re-treated with 0 or 500µM PbADA
(pH 7.0).
12.2.1 Effect of pre-treatment on lead, polyphenol and SOD levels
At root level, pre-treatment appeared to decrease Pb accumulation in roots; Pb levels
appeared to decrease by 64% and 58% (average d.w.) basis for unchelated Pb and
PbADA pre-treated plants (Figure 52A). The Pb root levels were much higher here
(over 25,000 mg kg-1 d.w. roots) than in 10.1.3 (only about 5,000 mg kg-1 d.w. roots).
This may be because whole plants were exposed to PbADA in a semi-enclosed system
with higher transpiration rates. Shoot levels did not exhibit noticeable trends (Figure
52B).
A noticeable decreasing trend was also observed in root polyphenol levels of pre-
treated plants in unleaded re-treatment solutions; an average drop of 21% and 46% was
observed with unchelated Pb and PbADA pre-treatments respectively. Re-treatment
with PbADA further reduced polyphenol levels of unchelated Pb and PbADA pre-
treated plants, but the variation in polyphenol levels were too large to state a trend
(Figure 53A). This decrease in polyphenol levels is more likely to reflect a decrease in
extractable polyphenol levels due to polymerisation (as opposed to a loss in polyphenol
production). This is because the levels of superoxide dismutase (SOD), one of the
enzymes involved in its polymerisation, appeared to be higher in plants pre-treated with
unchelated Pb or PbADA (by 87% and 48% on average respectively) than untreated.
PbADA re-treatment appeared to reduce SOD levels in all plants by around 32-36%
except for unchelated Pb pre-treated plants. These appeared to have a constant SOD
levels from control to PbADA re-treatments − however, this is likely due to higher
variation in PbADA re-treatments (Figure 53B).
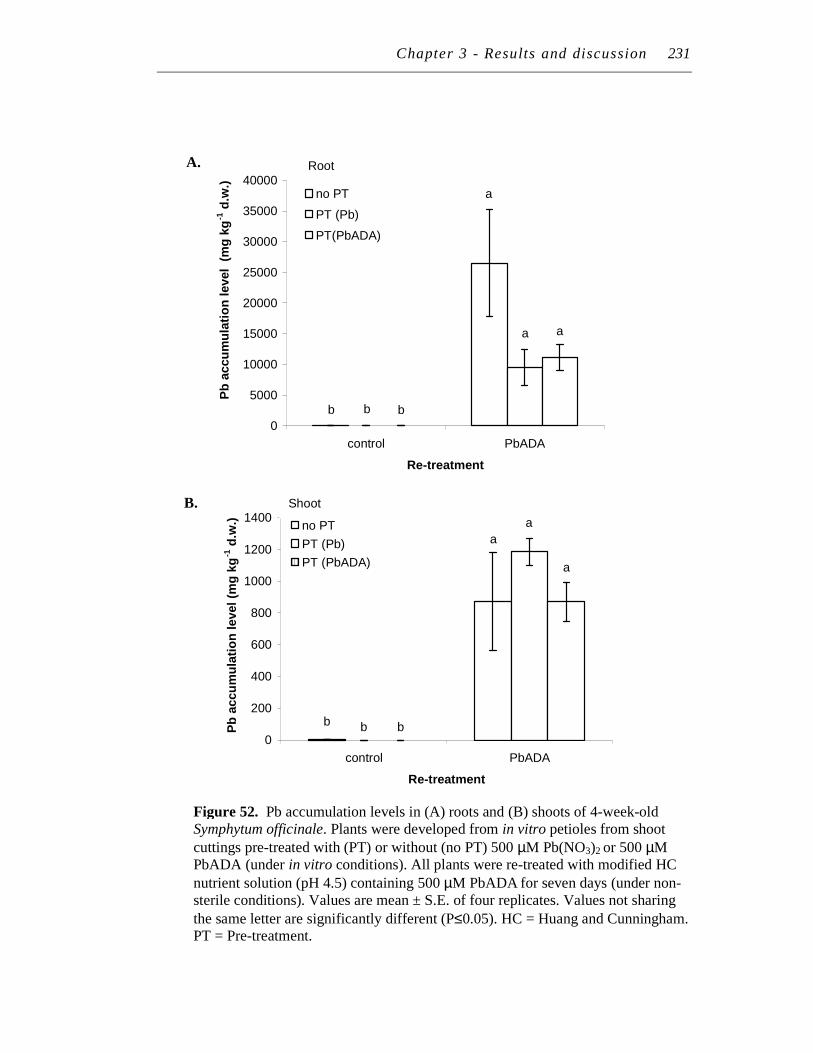
Chapter 3 - Results and discussion 231
a
b
a
b
a
b0
200
400
600
800
1000
1200
1400
control PbADA
Re-treatment
Pb
accu
mu
lati
on
level
(mg
kg
-1 d
.w.) no PT
PT (Pb)
PT (PbADA)
b
a
b
a
b
a
0
5000
10000
15000
20000
25000
30000
35000
40000
control PbADA
Re-treatment
Pb
accu
mu
lati
on
level
(m
g k
g-1
d.w
.)
no PT
PT (Pb)
PT(PbADA)
Figure 52. Pb accumulation levels in (A) roots and (B) shoots of 4-week-old Symphytum officinale. Plants were developed from in vitro petioles from shoot
cuttings pre-treated with (PT) or without (no PT) 500 µM Pb(NO3)2 or 500 µM PbADA (under in vitro conditions). All plants were re-treated with modified HC
nutrient solution (pH 4.5) containing 500 µM PbADA for seven days (under non-sterile conditions). Values are mean ± S.E. of four replicates. Values not sharing
the same letter are significantly different (P≤0.05). HC = Huang and Cunningham. PT = Pre-treatment.
A.
B. Shoot
Root
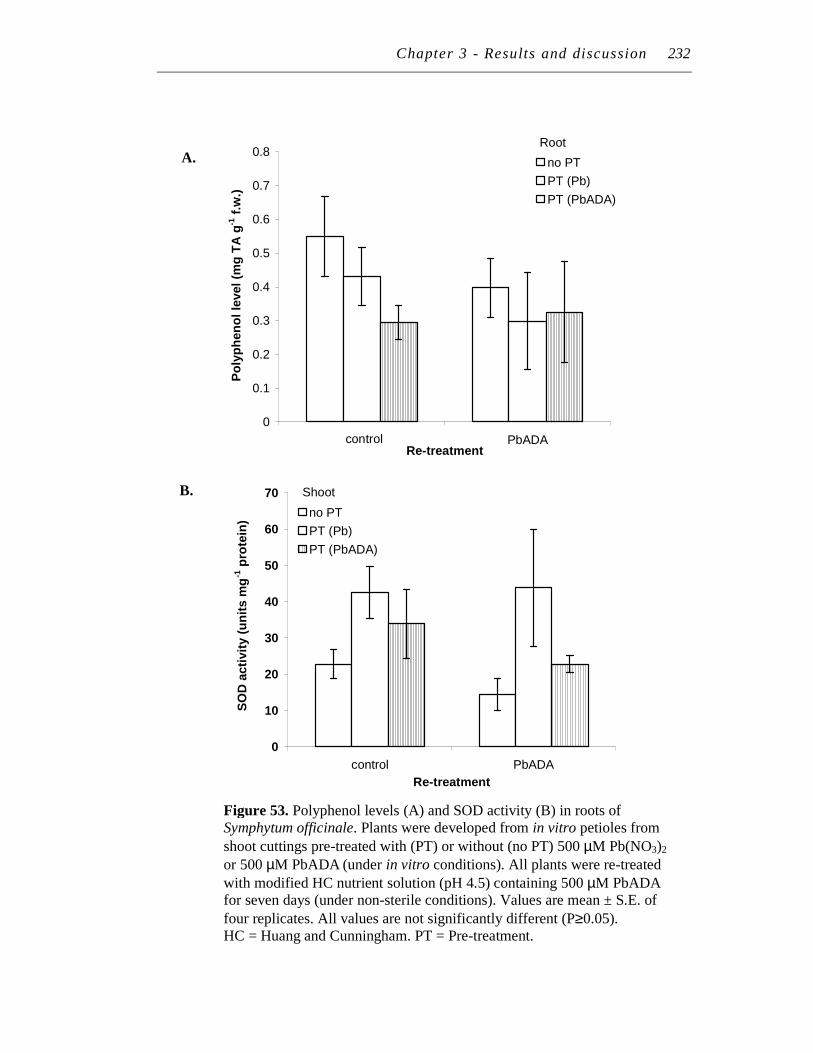
Chapter 3 - Results and discussion 232
0
0.1
0.2
0.3
0.4
0.5
0.6
0.7
0.8
O PbADARe-treatment
Po
lyp
hen
ol
level
(mg
TA
g-1
f.w
.)
no PT
PT (Pb)
PT (PbADA)
0
10
20
30
40
50
60
70
control PbADA
Re-treatment
SO
D a
cti
vit
y (
un
its m
g-1
pro
tein
)
no PT
PT (Pb)
PT (PbADA)
Figure 53. Polyphenol levels (A) and SOD activity (B) in roots of Symphytum officinale. Plants were developed from in vitro petioles from
shoot cuttings pre-treated with (PT) or without (no PT) 500 µM Pb(NO3)2
or 500 µM PbADA (under in vitro conditions). All plants were re-treated
with modified HC nutrient solution (pH 4.5) containing 500 µM PbADA
for seven days (under non-sterile conditions). Values are mean ± S.E. of
four replicates. All values are not significantly different (P≥0.05). HC = Huang and Cunningham. PT = Pre-treatment.
A.
B.
control
Root
Shoot
Chapter 3 − Results and discussion 233
Considering that there was very little Pb in the actual petiole of plants generated
from the unchelated Pb-treatment, the decreasing trends observed with Pb and
polyphenol levels may instead be due to stress (oxidative stress) imposed by the Pb
treatment (indirect Pb effect) rather than Pb itself (direct Pb effect). This was supported
by two observations (i) the same pre-treatment and re-treatment (12.1.1) did not affect
trends, possibly because the older and larger (4.5-week-old) shoots used was noticeably
less stressed (especially at the petiole base) than the younger and thinner (3-week-old)
shoots used here and (ii) shoot development (on MS F(0) media) from the thinner
petioles of these younger shoots was also twice as long, for the same reasons as (i)
above. Conversely, the trends from plants developed from PbADA pre-treatment could
be due to a direct effect of Pb because a significant amount of Pb (393 mg kg-1 d.w.)
was present in the petiole used to generate in vitro plants.
Chapter 4 – Further discussion and conclusions 234
CHAPTER 4
FURTHER DISCUSSION AND CONCLUSIONS
1 Objective 1
Increased metal accumulation ability does not necessarily require tolerance but it is a
desirable feature for phytoremediation purposes, in terms of improved vegetation on
contaminated soils (Hall, 2002; Huang et al., 1997b).
In this objective the focus was how the tolerance mechanism of chelation,
particularly by tannin-type polyphenols, may play a role in Pb accumulation and thus the
phytoremediation potential of plants. At the start of this study, very few papers suggest
the biological role of tannin-metal chelation in metal tolerance or accumulation in
plants. The exception to this includes studies on the copper hyperaccumulation in
Armeria maritima ssp halleri (Lictenberger and Neumann, 1997), and Al tolerance in
Lotus pedenculatus (Stoutjesdijk et al., 2001). Chelation studies to date also mostly
appear to focus on cadmium followed by zinc and copper; lead (Pb) studies on the other
hand have been comparatively rare. Moreover, there were no direct studies relating to
Pb-tannin chelation in high biomass plants with phytoremediation potential.
1.1 Plant selection
With respect to Brassica juncea and Pisum sativa, one potential criticism is that the area
of remediation can be limited. Whilst they have a high shoot biomass and have been
shown to accumulate high levels of Pb in shoots, their actual rooting system is
comparatively small. This was one reason why Symphytum officinale was so attractive
from the onset of this experiment; S. officinale was high in shoot and root biomass.
Additionally, reasonable amounts of the metabolites of interest (polyphenols) were
present in the roots and shoots of this plant.
In choosing this plant, months were invested in establishing it from rootstocks
because at the time no retailers in New Zealand sold comfrey in this form. Plants were
Chapter 4 – Further discussion and conclusions 235
grown to at least 3-4 month-old before Pb treatment. This was to obtain a sufficient
amount of plant material for analysis and to give a more accurate representation of Pb
accumulation and tolerance in mature plants used in field studies. Seeds were also not
available. Another plant with seedlings would have increased the number of initial
experiments such as fresh weight changes relative to Pb concentrations and would have
made the overall handling of plant material easier.
1.2 Polyphenols in Symphytum officinale
After developing a specific extraction and analysis regime for polyphenol and tannins in
S. officinale, the distribution and level of these metabolites were determined to help
decide which tissues should be targeted for analysis after Pb treatment. The most
important conclusion was that the content of polyphenols, particularly tannins, in 3-
month-old S. officinale, was the highest in root tissue. Moreover, the higher tannin
content of lateral roots (compared to main roots) formed the basis of comparing the role
of polyphenols and tannins in Pb accumulation and tolerance at an in vivo and in vitro
level.
1.3 Determining tolerance and accumulation for objective 1
At an anatomical level, tolerance was based on S. officinale remaining relatively alive
after Pb treatment (indicative at shoot level) and initial toxicity (root growth inhibition).
Essentially this is adaptive tolerance as it explains how plants cope/survive the toxic
effects from heavy metals like Pb (e.g. root growth inhibition and lipid peroxidation)
and why no symptoms of Pb stress at shoot level is apparent, despite the high Pb levels
in roots (Wierzbicka, 1995; Verma and Dubey, 2003). Heavy metal tolerance associated
with a lack of visible root and/or shoot stress was not realistic because this form of
tolerance is a feature that normally occurs in natural low-biomass hyperaccumulators or
engineered mutants, not high biomass plants such as S. officinale.
Tolerance (at a biochemical level) was tested against whether or not tannins from
S. officinale roots had the ability to chelate Pb (tolerance mechanism 1). This required
determining if there was an in vivo correlation between Pb accumulation and tannin
levels within S. officinale, and if S. officinale tannin extracts had an ability to chelate
meaningful amounts of Pb under in vitro conditions.
Chapter 4 – Further discussion and conclusions 236
1.3.1. Evidence for role of tannins in lead accumulation and adaptive tolerance in
Symphytum officinale
At an anatomical level, shoots of plants exposed to 250 µM Pb(NO3)2 appeared just as
healthy as the control plants because there were no observable signs of Pb stress in S.
officinale shoots (e.g. necrosis). Thus, despite the high concentrations of Pb in roots and
typical root growth inhibition, overall the plant appeared to cope with Pb stress. The
restriction of Pb to roots, a tolerance mechanism of some plants to heavy metals
(Thurman, 1981), may in part be due to Pb-tannin chelation at root level. Moreover at
root level, there may be a positive and important attribute for the predominant Pb
accumulation in the lateral roots − it may allow the polysaccharide (energy) reserves in
the main roots to aid shoot growth when the overall root capacity was reduced due to Pb
stress.
At a biochemical level, the results demonstrate that S. officinale root tannins have
the ability to chelate Pb. This may not only be an adaptive tolerance mechanism under
Pb stress, but also how plants accumulate Pb. There was no large increase in polyphenol
levels in the lateral or main roots of S. officinale upon treatment with modified HC
nutrient solution containing 250 µM Pb(NO3)2. This suggests that the pre-existing levels
of polyphenols might be involved in adaptive tolerance of Pb. This supports other
findings where only sensitive plants show large increases in polyphenol levels (and
enzymes related in its production) under heavy metal stress (Lavid et al., 2001a;
Constabel and Ryan, 1998). The most significant finding however, was that a strong
positive correlation between pre-existing root polyphenols (e.g. tannins) and Pb
accumulation in both in vivo (hydroponic studies) and in vitro (tannin extracts) studies
was observed. Firstly, the AAS and TEM results showed that higher-tannin lateral roots
accumulated more Pb than lower-tannin main roots. Secondly, large Pb deposits were
found in known tannin deposition sites of plant cells (i.e. the primary cell wall and
suberised region). Finally, in vitro studies showed that crude immobilised S. officinale
root tannins and the purified tannic acid (Sigma) had the ability chelate and remove
meaningful amounts of Pb. Under the conditions of the study, up to 74 mg L-1 Pb
(element) could be removed from the Pb(NO3)2 solution.
It is imperative to note that it would be impossible to test every potential Pb
chelating compound from S. officinale due to the time and resources required to identify

Chapter 4 – Further discussion and conclusions 237
them. Consequently, a limitation of this study was evaluating exactly how meaningful a
role tannins may play in plants with respect to other known potential Pb-binding
compounds (including phosphates (Cotter-Howells et al., 1999; Eltrop et al., 1991),
pectin (Lane et al., 1978; Moreno et al., 2003), hemicellulose (Lane et al., 1978) and
lignin (Marmiroli et al., 2005)) in Pb accumulation and tolerance. However, its function
is likely to be important if the following are considered: (i) their chemical structure has
an abundant amount of metal-chelating hydroxyl groups, (ii) tannins are the fourth most
abundant metabolite in vascular plants after cellulose, hemicellulose and lignin (Kraus
et al., 2003), (iii) they are precursors to a Pb-binding compound lignin, and (iv)
polyphenols in general are known to protect the living plant against environmental stress
(Chalker-Scott and Kramer, 1989).
To the best of my knowledge, this is the first report demonstrating Pb-tannin
chelation and its possible role in Pb accumulation, adaptive tolerance and Pb
phytoremediation. These results corroborate recent studies suggesting the role of
polyphenols in tolerance and accumulation to heavy metals and in non-
hyperaccumulating plants. For example, Lavid et al., (2001b) showed that Nymphaea
spp (waterlily) polyphenols and their polymerisation maybe involved in Cd and Cr
tolerance because these metabolites were associated with metal-ion chelation and
accumulation. Other examples include a correlation between Pb accumulation and total
soluble phenolics in sunflower and tobacco plants (Ruso et al., 2001) and the
involvement of condensed tannins in Pb accumulation in Athyrium yokoscense (fern)
gametophytes (Kamachi et al., 2005). Using SEM/EDX and EXAFS spectroscopy,
evidence of Pb-O bindings in Pb-exposed Juglans regia (European walnut) root powder
and Pb-impregnated cellulose and lignin (whose precursor are tannins) also suggested
that polyphenol compounds (in this case the cell wall) chelate Pb. No observations of Pb
stress at root or shoot level was conducted (Marmiroli et al., 2005).
1.3.2. Significance of lead-tannin chelation to phytoremediation
Chelation of Pb by tannins would be most important for chelate-assisted
phytoextraction, rhizofiltration and phytostabilisation.
In chelate-assisted phytoextraction, 40% of the PbEDTA complex formed
dissociates (Geebelen et al., 2002), producing free toxic Pb (at which stage is unknown).
Chapter 4 – Further discussion and conclusions 238
In this situation, Pb-tannin chelation in shoots would provide an important Pb tolerance
and accumulation mechanism for the following reasons: (i) increased detoxification of
free Pb ions, (ii) Pb can be removed from the more susceptible cytoplasm if Pb binds to
the cell wall, and (iii) compared to the synthesis of specific bio-molecules for chelation
(e.g. phytochelatins), it may be more energy efficient form of tolerance as it uses a more
permanent and pre-made bio-molecules for chelation (Marmiroli et al., 2005). Taking
these reasons into consideration, choosing plants with high tannin content in shoots may
be more beneficial for this form of phytoremediation, providing that can be transported
there in the first instance. This chelation may be particularly beneficial for recently
improved phytoextraction methods where EDTA is added in increments rather than in a
single dosage (Barcosi et al., 2003; Grĉman 2003). Such EDTA application would
require the plant to tolerate increasing amounts of PbEDTA in the shoot over a longer
phytoextraction period. However, there may be a “Catch-22” situation here if the
complex splits at root level (or if unchelated Pb phytoextraction is used). Roots with
high tannin levels may immobilise Pb at root level (i.e. create a sink for Pb in roots),
which is not ideal for chelate-assisted phytoextraction. Based on PbEDTA studies
however, there is every indication that the whole complex is intact at root level for Pb
transport to the shoots (Vassil et al., 1998; Jarvis and Leung, 2001) and therefore this
may not be an issue.
In phytostabilisation, tannins could act as a matrix for binding the Pb in the root or
contribute to the Pb-binding matrix in the soil after roots die. In rhizofiltration, plant
roots are used to remove metals from polluted waterways. Evidence of tannin
involvement in Pb chelation would be beneficial because: (i) of the same reasons stated
in the above paragraph (at shoot level), and (ii) enhanced rhizofiltration (i.e. increase Pb
accumulation at root level) by specifically selecting plants with roots that are high in
biomass and tannins. According to dietary studies by Jackson et al., (1996), low and
high tannin levels is considered to be 2.2% (d.w.) and 6.3% (d.w.) of the tissue
respectively.
Thus overall, when plants are selected for screening a particular type of
phytoremediation, the presence, levels and tissue distribution of phytochemicals (e.g.
tannins) should be considered, in addition to other factors such as biomass.
Chapter 4 – Further discussion and conclusions 239
1.3.3. The immobilised tannin protocol
The Lavid dialysis method could be a more reliable in vitro Pb-tannin chelation method
if only tannins from one root type or purified tannins were used. For the objectives of
this study, where the different levels of tannins between lateral and main roots were
being compared, the Lavid dialysis method was not suitable. The method was
susceptible to interferences (i.e. non-polyphenol high molecular weight Pb-chelating
compounds) because the dialysis tubes did not specifically trap high molecular weight
polyphenol compounds. Fructans appear to be an interference compound. Thus the
contrary trends of the Lavid dialysis method (compared to the hydroponic studies)
appeared to be because the main roots had more fructans (but lower tannin levels) than
lateral roots.
This research developed a new, simple and most importantly a more specific in
vitro Pb-tannin chelation method (using PVPP-immobilised tannins) to show that crude
S. officinale tannins chelate Pb ions under in vitro conditions. The idea was inspired by
the use of PVPP to bind tannins in the Folin-Ciocalteu assay for tannins. It also showed
that tannins bound to PVPP still had enough functional groups to bind meaningful
amounts of Pb. This could also reflect tannins bound in the cell wall. Whilst fructan
spiking (with inulin from chicory) showed that this method was not completely void of
fructan interferences, it did allow the in vitro trend between tannin level and Pb
chelation to be observed; higher tannin lateral roots chelated/removed more Pb from
solution than lower tannin main roots. This method was validated using solely lateral
root extracts at increasing levels and purified tannins (tannic acid from Sigma).
The use of immobilised tannins for binding pollutants is also not new. Numerous
papers have documented tannin immobilisation to various matrices including aldehyde
gels (Nakajima and Sakaguchi 2000), collagen fibres (Wang et al., 2005; Liao et al.,
2004), and matrices with amine groups - aminopolystyrene and poly VT (Nakajima and
Sakaguchi, 1990). In all the above papers, tannin immobilisation involved making the
tannin-binding matrix de novo, which is a very complex process. For example aldehyde
gels are formed from mixing tannins (e.g. from persimmons) with formaldehyde and
potassium peroxodisulfate. The resulting solid gel is then crushed into small pieces
(Nakajima and Sakaguchi, 2000). However, to the best of my knowledge none have
been immobilised in one simple step with PVPP for metal chelation studies, and none in
Chapter 4 – Further discussion and conclusions 240
particular for examining Pb-tannin chelation as a tolerance and accumulation
mechanism in plants.
2 OBJECTIVE 2
2.1 Phytoremediation potential
To address the issue of EDTA-induced metal-leaching from soils and to enhance
phytoremediation, studies into using transplanted plants (Wu et al., 1999), Pb
concentration (Kumar et al., 1995), conserving EDTA application dose (Barcosi et al.,
2003; Wenzel et al., 2003), chelating agent type (Wu et al., 1999; Grĉman 2003) and pH
of soil solution (Blaylock et al., 1997; Schor-Fumbarov et al., 2003; Li et al., 2003)
have been performed.
Following these chemical-based initiatives to enhance phytoremediation, this
objective set out to study the effects of Pb concentration, and the type and concentration
of chelating agents. With respect to chelating agent and pH, it was particularly
interesting to notice that in all the papers mentioned above, there was little or no
regard/attention to the effect of competing soil ions, particularly Fe, on Pb uptake and
accumulation. In soil extraction studies, a pH greater than 7.0 is strongly recommended
for soil extraction of Pb, especially when Fe levels are high (Kim et al., 2003; Kim and
Ong, 2000; Chen and Hong, 1995). However, in most EDTA-based phytoextraction
studies this is largely ignored because a pH < 5.0 is considered important for reducing
root adhesion and increasing translocation of Pb to shoots (Blaylock et al., 1997).
2.1.1. Phytoextraction potential of Symphytum officinale
From the phytoextraction studies performed, increased unchelated Pb concentrations
resulted in an increase in Pb accumulation at the shoot and root level. Thus Pb
accumulation took place in a concentration dependent manner.
In terms of the effect of chelating agents (EDTA), an expected increase in
accumulation of Pb in shoots (compared to Pb treatments without chelating agents) was
observed. Of all the chelated Pb phytoextraction studies performed at pH 4.5, the
Chapter 4 – Further discussion and conclusions 241
highest average concentration of Pb in S. officinale shoots was 558 mg kg-1 (d.w.) (after
treatment with modified HC nutrient solution containing 500 µM PbEDTA ). Although
this was seven times higher than without EDTA, it only equates to an average of 0.058%
Pb (d.w.) in shoots.
The use of EDTA is controversial. EDTA can spread Pb contamination, through
leaching (Wenzel et al., 2003; Kos and Lestan; 2003). From an environmental stance,
this is particularly concerning considering phytoremediation is at least three years long.
Moreover, EDTA is already discharged from the wastewater of industries such as textile
and paper manufacturing, reaching rivers and groundwater. Consequently, it is already
under scrutiny because of concerns on their influence on metal availability, mobility and
persistent in the environment (Nowack and Sigg, 1996; Nowack, 2002). Despite this,
EDTA is still considered the chelating agent benchmark (Meers et al., 2004). Two
alternative main chelating agents to EDTA were considered to determine if the
phytoextraction potential could be improved: EDDS and ADA. EDDS was initially
chosen because it was as effective as EDTA and yet biodegradable (Vandervivere et al.,
2001; Grĉman 2003; Kos and Lestan, 2003;). But unlike ADA, its Pb complex was
negatively charged and not suitable for assessing the repulsion hypothesis in results
section 2.2. However, despite the change in chelating agents and factors that may
increase its phytoremediation potential (e.g. a regenerable shoot system and a high shoot
and root biomass), the Pb levels in the shoot fell well short of the phytoextraction target
of 1% Pb (d.w.) in S. officinale shoots. At pH 7.0, Pb levels in shoots of plants treated
with modified HC nutrient solution containing 500 µM PbADA were not substantially
higher compared to PbEDTA at pH 4.5, reaching on average only 628 mg kg-1 (d.w.) Pb
(0.068% Pb d.w. in shoots). However, the level of Pb accumulated in the roots was 2.4
times higher than PbEDTA. Thus environmentally, at pH 7.0 ADA is better than EDTA
as more Pb uptake into the roots would lead to less Pb leaching through the soil.
At a laboratory scale, B. juncea (Blaylock et al., 1997; Vassil et al., 1998) and
Pisum sativa (Huang and Cunningham, 1996) plants were able to reach the Pb
phytoextraction target (1% Pb d.w. in shoots). In this study, the levels of Pb in the S.
officinale shoots were more comparable to phytoextraction studies conducted with
Brassica rapa (Grčman et al., 2003) and B. napus (Wenzel et al., 2003) in the field.
The Pb levels in shoots were similarly between 600-800 mg kg-1 d.w (0.06-0.08% d.w).
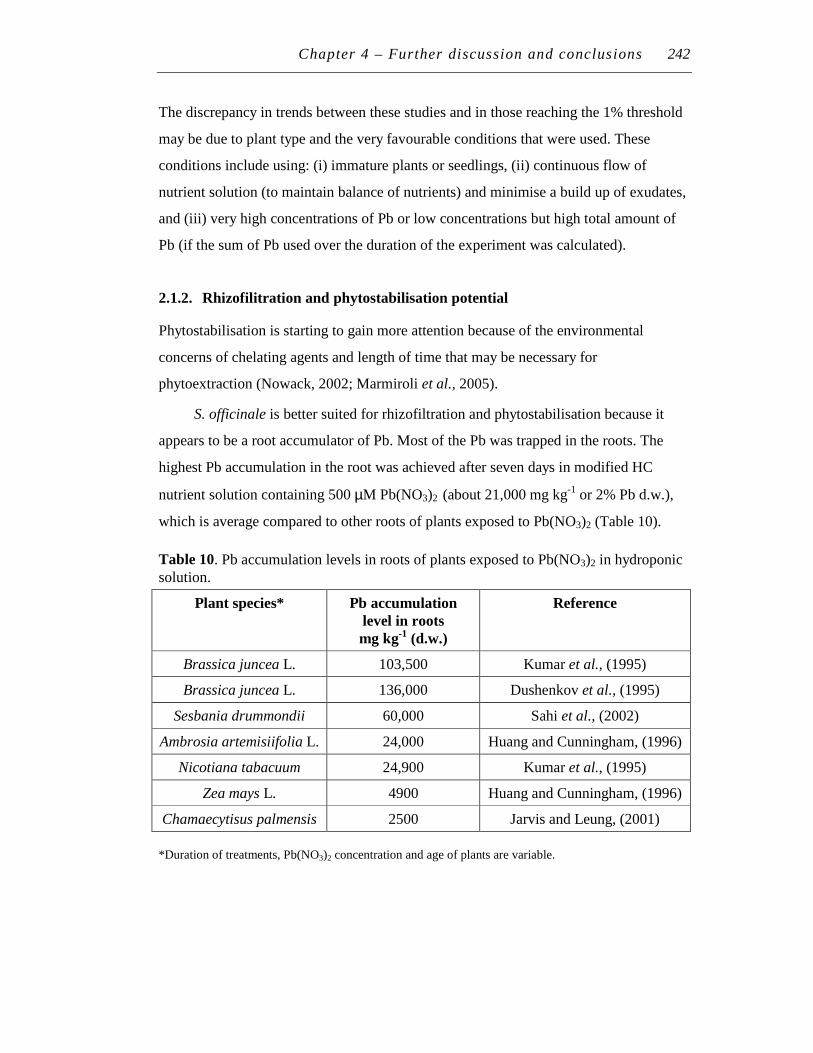
Chapter 4 – Further discussion and conclusions 242
The discrepancy in trends between these studies and in those reaching the 1% threshold
may be due to plant type and the very favourable conditions that were used. These
conditions include using: (i) immature plants or seedlings, (ii) continuous flow of
nutrient solution (to maintain balance of nutrients) and minimise a build up of exudates,
and (iii) very high concentrations of Pb or low concentrations but high total amount of
Pb (if the sum of Pb used over the duration of the experiment was calculated).
2.1.2. Rhizofilitration and phytostabilisation potential
Phytostabilisation is starting to gain more attention because of the environmental
concerns of chelating agents and length of time that may be necessary for
phytoextraction (Nowack, 2002; Marmiroli et al., 2005).
S. officinale is better suited for rhizofiltration and phytostabilisation because it
appears to be a root accumulator of Pb. Most of the Pb was trapped in the roots. The
highest Pb accumulation in the root was achieved after seven days in modified HC
nutrient solution containing 500 µM Pb(NO3)2 (about 21,000 mg kg-1 or 2% Pb d.w.),
which is average compared to other roots of plants exposed to Pb(NO3)2 (Table 10).
Table 10. Pb accumulation levels in roots of plants exposed to Pb(NO3)2 in hydroponic solution.
Plant species* Pb accumulation
level in roots
mg kg-1 (d.w.)
Reference
Brassica juncea L. 103,500 Kumar et al., (1995)
Brassica juncea L. 136,000 Dushenkov et al., (1995)
Sesbania drummondii 60,000 Sahi et al., (2002)
Ambrosia artemisiifolia L. 24,000 Huang and Cunningham, (1996)
Nicotiana tabacuum 24,900 Kumar et al., (1995)
Zea mays L. 4900 Huang and Cunningham, (1996)
Chamaecytisus palmensis 2500 Jarvis and Leung, (2001)
*Duration of treatments, Pb(NO3)2 concentration and age of plants are variable.
Chapter 4 – Further discussion and conclusions 243
2.2 Why did EDTA reduce lead accumulation in roots?
In this study, EDTA increased shoot levels of Pb, which supports its role in aiding Pb
translocation. Interestingly however, Pb accumulation at root level drastically decreased;
the level of Pb transported to shoots was only a fraction of the level of Pb lost from the
roots. Another fraction was due to EDTA desorption. However, much of the Pb
(compared to the unchelated Pb treatments) was still unaccounted for. Since the root and
shoot biomass are approximately the same, shoot translocation could not have accounted
for this reduction. This has important implications for phytoextraction because,
perceivably, if the concentration of Pb in the roots of chelated Pb-treated plants were
higher, more Pb would accumulate in the shoots.
When EDTA was added to the Pb-containing matrix in other studies, this trend
has never been noted. This may be because some articles only publish the Pb levels in
the shoot (Vassil et al., 1998; Grĉman 2003; Geeblen et al., 2003; Huang et al., 1997) or
show that EDTA in fact increased root accumulation of Pb (Barcosi et al., 2003; Wenzel
et al., 2003; Wu et al., 1999). Slight decreases in root Pb accumulation were also
present in experimental data by Blaylock et al., (1997) and Jarvis and Leung (2001) that
was not accounted for by translocation to shoot. However given the amount lost, this is
likely to be due to the root washing step (with dH2O or EDTA prior to Pb analysis) in
their experiments.
Clearly the results in this study were an exception to one of the main functions of
EDTA − to increase Pb bioavailability and thus the uptake and accumulation of Pb.
Although charge repulsion of the PbEDTA complex and Pb specificity (factors
investigated in this study) may play a role towards reducing the Pb accumulation level in
PbEDTA treatments, none of these factors appeared to play a large role because much of
the Pb loss (unchelated vs. chelated) remained unaccounted for. Thus, the main reasons
for the reduction are still unclear. Moreover the mechanism underpinning this reduction,
whether it is entirely due to effects at root level or due to effects at shoot level, is
unknown.
Chapter 4 – Further discussion and conclusions 244
2.2.1. Other possible factors: root exodermis
After combining these experimental findings with previous papers documenting a
decrease in metal uptake when metals were in chelated form (see below for references),
perhaps another factor not tested here – formation of the root exodermis – may play a
larger role.
The exodermis is the layer of cells behind the epidermis and is particularly a
feature of wetland plants. It is made of a mixture of suberin (wax-like substance) and
lignin (cross-linked or polymerised polyphenols). It helps conserve oxygen supplies in
roots of wetland plants grown hydroponically or on dry land (e.g. Oryza sativa). The
extent to which this layer is formed depends on the environment; stressed environments
such as drought, salinity, heavy metals or nutrient stress can increase its formation,
repelling the uptake of water and hydrophilic substances (Hose et al., 2001). In terms of
speed of synthesis, it appears that only a few days in hydroponics is sufficient for its
formation − exodermis analysis has been conducted on 8-10-day old monocot and dicot
seedlings grown in hydroponics (Schreiber et al., 1999).
S. officinale thrives in moist, marshy places (Chevalier, 1996) as well as in the
terrestrial environment. It is conceivable that such an exodermis layer may also be
present in S. officinale (although no attempt was made to determine this), particularly
under the 14-day hydroponic system used. Perhaps some indication of its presence
include: (i) the drop in polyphenol levels (due to polymerisation; see 3.3.4 below for
more details), and (ii) increased whitening of the distal zone in the root tip when
concentrations of EDTA were in excess of Pb during NBT localisation of superoxide
anions (which is also a potential indicator of increased SOD activity, one of the enzymes
involved in lignin and exodermis formation).
The stress of unchelated Pb and PbEDTA may increase the formation of the
exodermis. Pre-treatment with EDTA could exacerbate the formation of this layer by
destabilising ions in the cell wall (as discussed in Chapter 3). Ultimately, increased
formation of the exodermis may reduce ion uptake (e.g. Pb ions). Increased
polymerisation may also reduce the number of Pb binding sites. Most significantly,
increased formation of the exodermis layer may increase the hydrophobicity of the root
surface due to the suberin content of this layer. Suberin blocks hydrophilic compounds
(Degenhardt and Gimmler, 2000). Thus, since EDTA (and to a lesser extent ADA) is
Chapter 4 – Further discussion and conclusions 245
very hydrophilic (Wu et al., 1999), this could explain why there is a drastic decrease in
chelated Pb accumulation (whether in ADA or EDTA chelated form) compared to the
unchelated ion. Perhaps the most telling piece of evidence may be why all the papers
that documented a decrease in metal (Cd, Zn) uptake upon addition of EDTA, all
happened to be aquatic plants. In Nymphaea aurora, EDTA reduced Cd accumulation in
all the plant tissues; in lamina and petioles Cd decreased by 80%, whilst in roots a 50%
reduction was observed (Schor-Fumbarov et al., 2003). The lamina and petioles are not
known to contain an exodermis, but do have a similar layer to the roots: the lipophilic
cuticle (Schreiber et al., 1999). Huebert and Shay (1992) demonstrated that when EDTA
was in excess of Cd or Zn, metal accumulation in Lemna trisula (duckweed) was
drastically reduced by at least 80%. In the case of Lemna aequinoctialis, 8.9 µM CdCl2
with 10 µM EDTA reduced Cd accumulation by 18%, but at 100 µM EDTA, Cd was
reduced by 95% (Srivastava and Appenroth, 1995). Clearly in these examples, excess
concentrations of EDTA reduced Cd and Zn accumulation. In the case of Nymphaea the
authors suggested that Cd binding groups may compete with EDTA whereas in the
Lemna species, a preference for free Cd2+ ions as opposed to chelated forms was
suggested. Exactly why Lemna prefers this form of Cd was unknown.
In terms of phytoremediation, the exodermis feature of semi-aquatic plants could
limit the benefit of tannins in chelate-assisted phytoextraction. Choosing a high tannin
plant that does not habitat semi-aquatic environments (i.e. does not form a significant
exodermis) may be a very important feature for plant selection for this type of
phytoextraction. Alternatively, using a Pb-specific chelating agent that is less
hydrophilic may be important for its success. For phytostabilisation however, the
exodermis may be beneficial to help the plant survive; the exodermis may not only
reduce potential number of Pb binding sites (exclusion) but also trap Pb in the surface
root tissue.
Chapter 4 – Further discussion and conclusions 246
3 OBJECTIVE 3
3.1 Development of in vitro Symphytum officinale lines
There are only a few reports on the tissue culture of S. officinale. Of the in vitro S.
officinale studies to date, all have been for investigating secondary metabolite
production, namely alkaloids, fructans (Abou-Mandour et al., 1987; Huizing et al.,
1983; Haaβ et al., 1991) and glutamine (Tanaka et al., 1974). In these studies cell
suspension, callus cultures and whole plants were developed from shoot tissue, and all
subcultures were performed with callus or cell suspension cultures.
In this study, in vitro crown division was used to propagate and establish in vitro
S. officinale plants. The process developed was much simpler than those previously
documented. In short, the process involved:
(i) Attention to petiole size, placement on media and the type and number of
incisions all influenced the success of the culture. The hairy petiole epidermis
did not need to be removed to generate a sterile culture. A ten minute, 10%
(v/v) bleach sterilisation regime achieved a 100% sterile culture.
(ii) The best medium for shoot and callus induction from petiole explants was the
MS F(0) medium. This consisted of a MS basal nutrient medium
supplemented with 2% (w/v) sucrose and 1 mg L-1 each of IBA and BA.
(iii) The shoot/crown from the MS F(0) medium developed into a whole plant
(root and shoot) on the MS N(0) medium (MS basal medium supplemented
with 2% (w/v) sucrose and 1 mg L-1 IBA and 0.1 mg L-1 BA).
(iv) Plants were subcultured by subdividing the crown tissue from whole plants
grown on MS N(0), in a similar manner to sand-grown root divisions. Whole
plants were developed and subcultured via the shoot/crown every 4-5 weeks
onto fresh MS N(0).
3.2 Somaclonal variation and phytoremediation
There appears to be no reports on the tissue culture-oriented manipulation of S.
officinale or any other plants for improved Pb phytoremediation (without the use of
genetic engineering). Moreover, there are few reports using tissue culture to study the
Chapter 4 – Further discussion and conclusions 247
effects of Pb itself; two examples include Populus cell cultures (Ksiazek et al., 1984)
and Sesbania drummondii (Sharma et al., 2005).
Tissue culture has been used more commonly for phytoremediation-related studies
of other heavy metals. It has been used to: (i) propagate heavy metal tolerant plants such
as the Ni-tolerant Stackhousia tryonii Bailey, which is difficult to establish from seed
(Bhatia et al., 2002) and (ii) screen for heavy metal tolerant callus or cell lines
(somaclonal-based studies) and determine their effect during treatment or upon re-
exposure to the heavy metal. Recent examples of this include Cd tolerance in cell
suspension cultures of Cucumis sativa L. (cucumber) (Gzyl and Gwozdz, 2005) and Cd
stress in sugar cane callus cultures (Fornazier et al., 2002), and Cr and Ni tolerance in
Echinochloa colona L. callus cultures (Samantaray et al., 2001). Tissue culture is also
used for establishing in vitro plant lines for manipulation by genetic engineering.
In this objective, tissue culture was used to induce somaclonal variation in in vitro S.
officinale cultures to improve or at least understand certain processes behind Pb
tolerance and accumulation. The conventional ‘shock’ treatment approach was used
whereby the petiole was exposed to a high concentration of Pb for a short period and the
tissue used for the regeneration of shoot tissue with the stress factor. This was because
there are higher chances of genetic variations with the ‘shock’ treatment approach (Tal,
1990; Remotti, 1998). However, the method used for somaclonal variation was not
conventional in terms of the tissue used and method of Pb exposure (the stress agent).
Firstly, somaclonal variation occurring in callus tissue was not used because mutations
observed in this tissue do not necessarily occur in differentiated tissues (Tal, 1990;
Remotti, 1998). Secondly, it was novel to try to have Pb within the tissue (rather than in
the conventional external medium) to induce somaclonal variation. Additionally, there
was uncertainty surrounding the bioavailability of Pb in the solid agar medium and the
degree of effect it would have on petiole tissues covered by an epidermis with
trichomes.
To determine if somaclonal variation occurred in plants generated from Pb pre-
treated in vitro petioles the activity of the superoxide dismutase (SOD) and level of
polyphenols were assessed. These particular parts of the antioxidative defence system
were assessed because of their role associated with polyphenol polymerisation and Pb
chelation (respectively). Effects on Pb accumulation were also assessed.
Chapter 4 – Further discussion and conclusions 248
3.3 Plants grown from lead pre-treated petioles
3.3.1. Developing plants from lead pre-treated petioles
After a number of lengthy attempts, petioles of in vitro shoot cuttings pre-treated with
unchelated and chelated Pb, successfully developed de novo shoots on MS F(0).
However, de novo shoot production from pre-treated petioles (including control) was
slower than anticipated; 6-8 weeks was required as opposed to 4-5 weeks directly from
MS N(0). The pre-treated whole plant regime failed to produce any shoots because the
treatment was too severe to allow de novo shoot production.
3.3.2. Effect of lead treatment on in vitro plants
In recent years there have been numerous studies on the effect of heavy metals (mostly
unchelated) on the antioxidative defense system. Though the direction of SOD activity
is variable with different stress conditions (Gratao et al., 2005), most papers report an
increase in activity upon heavy metal exposure at or above concentrations used in this
study (Malecka et al., 2001; Ali et al., 2003; Ruley et al., 2004; Reddy et al., 2005).
Studies on the effect of heavy metals on polyphenol levels have been comparatively
few. Generally, heavy metals also lead to an increase in soluble polyphenol levels
(Schützendübel et al., 2001; Tripathi and Tripathi 1999; Ruso et al., 2001). In these
reports the increase in antioxidative defense activity was a reflection of adaptation and
ultimate survival during periods of oxidative stress.
In contrast to these reports, in this study 500 µM Pb or PbADA appeared to reduce
polyphenol levels and SOD activity relative to the control plants. This indicates
oxidative stress and a weakened antioxidative defense system. This contrast is possibly
because of the plant type, concentration of Pb and most probably the duration of the
treatment (seven days).
3.3.3. Effect of lead pre-treatment and re-treatment with lead
For phytoextraction, ideally pre-treatment would increase Pb accumulation by
increasing its tolerance threshold to Pb. The SOD activity and polyphenol trends under
such circumstances are unknown. However, according to hyperaccumulators this may
Chapter 4 – Further discussion and conclusions 249
involve higher polyphenol levels in pre-treated plants prior to re-treatment and
unchanged SOD activity; these factors would represent a plant that can accumulate more
metals by having intrinsically more chelating compounds to detoxify metal-ions or
control the metal-ion concentrations without activating its second line of defense: SOD
and the antioxidative defense system. Of course such large positive improvements are
not realistic, but trends indicating this would be of interest.
In this objective, Pb pre-treatment (either direct or indirectly) clearly did not
produce somaclonal variants with better Pb tolerance and accumulation abilities,
reflecting the difficult nature of such experiments. Instead, the opposite may have
occurred − pre-treatment appeared to produce S. officinale somaclonal variants with
reduced phytoremediation potential (i.e. more stressed plants may have been
developed).
When compared to the control (no Pb pre-treatment), this was particularly
apparent in plants that were generated from Pb pre-treated petioles with a significant
concentration of Pb (direct Pb stress with PbADA), or petioles with little Pb but with
significant observable stress (indirect Pb stress with unchelated Pb). In particular, the
morphology of plants developed from unchelated Pb pre-treated petioles appeared more
stressed upon re-exposure to unchelated Pb. Shoots were stunted and more necrotic. At
root level, root growth was also significantly more inhibited, as the number of lateral
roots of pre-treated plants was noticeably reduced, even prior to Pb re-treatment. Pb
tolerant plants should not have such observable signs of stress.
In terms of Pb, polyphenol levels and SOD activity, plants developed from all Pb-
based pre-treatments showed no statistically significant trends. However, some
discernible trends were present. In general, Pb accumulation in Pb pre-treated plant
roots was reduced upon re-exposed to Pb, compared with non-Pb pre-treated plants.
Shoot levels did not substantially increase. This decrease in Pb root accumulation may
be linked to a stress-related increase in root exodermis formation (as discussed in 2.2.1
above). The apparent decrease in polyphenol levels and an increase in SOD activity in
Pb pre-treated plants may be indicators of this formation*. Formation of the root
*However this trend only holds within re-treatment type, not between treatments (i.e. ‘0’ (control) and ‘PbADA’ re-treatments) because the degree of oxidative stress/cell death between the treatments is too great after seven days in leaded solution.
Chapter 4 – Further discussion and conclusions 250
exodermis, particularly under stress (e.g. heavy metal-induced oxidative stress),
involves increased lignin biosynthesis. Since lignin biosynthesis is a peroxidase-
mediated polyphenol polymerisation process (that uses polyphenols as precursors) a
reduction in polyphenol levels is expected and was observed here (Chalker-Scott and
Krahmer, 1989; Strycharz and Shetty 2002a and b). Superoxide dismutase (SOD)
enzyme is the first enzyme in the cascade involved in lignin biosynthesis − it is one of
the main producers of the peroxidase substrate, H2O2 (Wojtaszek, 1997; Lyons et al.,
2000; Schützendübel and Polle, 2002). Thus conceivably, an increase in SOD activity is
expected with increased lignin biosynthesis during increased exodermis formation.
Ultimately the increased formation of the exodermis would explain and support the
reduction in Pb accumulation in this study and in the EDTA studies in 2.2 above.
Despite the statistically non-significance data, the trends and effects of pre-
treatment on the parameters measured (Pb, polyphenol, SOD levels and plant growth)
do give some insights into possible events in Pb tolerance/stress. Additionally, trends
were still apparent after several subcultures, suggesting that some degree of genetic
variation as opposed to adaptive variation may have occurred.
4 FUTURE STUDIES
4.1 Objective 1
4.1.1. Microscopy
Up to now, transmission electron microscopy has been used to determine the cellular
distribution of Pb because of the high resolution and relative ease of detecting electron
dense Pb particles. Early ultrastructural studies of Pb in tissues (especially at cell wall
level) include Allium cepa seedlings (Wierzbicka, 1987), Populus callus cell cultures
(Ksiazek et al., 1984), Pistum sativa (Malone et al., 1974), and Raphanus sativus seeds
(Lane and Martin, 1982). More recently, transmission electron microscopes have EDX
(Energy Dispersive Analysis of X-rays) or X-ray microanalysis instrumentation attached
to confirm that the observations are Pb or other heavy metals (Sahi et al., 2002;
Neumann et al., 1995). In future studies, it would be of interest to use such
Chapter 4 – Further discussion and conclusions 251
instrumentation to confirm if the dark vesicles observed in this study are Pb or other
electron dense materials such as tannins. However it cannot exclude the possibility that
they are tannin-Pb complexes. To help determine this perhaps the TEM observations
should be paired with confocal microscopy. Polyphenols in the cell walls and vacuoles
can be viewed with confocal microscopy due to their autofluoresence (Hutzler et al.,
1998). It would be interesting to track if there is a ‘movement’ of tannins from the
vacuole to the cell wall, in response to Pb stress, with confocal microscopy. A similar
‘movement’ of tannins from the vacuole to the cell wall has been reported in
histochemical and ultrastructural studies of beech trees leaves (Fagus sylvatica) in
response to increasing ultra-violet radiation stress (Bussotti et al., 1998).
Other interesting microscopy studies could also include TEM of plant shoots
(from Pb treatments), in particular the crown section in between these tissues. More
work also needs to be conducted on how plants transport unchelated Pb or other heavy
metals. Although the plant used in this study was effective in retaining Pb in the roots,
other plants such as B. juncea and hyperaccumulators are capable of transporting
unchelated ions to the shoot. How some non-hyperaccumulating plants, without the aid
of chelating agents, can stop retention in the roots cell walls and aid translocation
(Blaylock et al., 1997) is of interest.
Maize plants can translocate endophytic bacteria via the xylem and colonise maize
stem intercellular spaces (Sattelmacher, 2001). It is conceivable that Pb-laden vesicles,
(observed in this experiment and which appear very similar in size to such endophytic
bacteria) may be another mechanism for unchelated Pb transport to shoots. Moreover, if
the Pb in the vesicles were bound to tannins, and this would support the suggestion by
Dahmani-Muller et al., (2000) of phenolic-metal transport to the shoots. The question
then is how is it transported at root level to reach the xylem?. It could be possible that
like the endophytes, such vesicles could enter the xylem via the numerous natural
openings in the root such as lateral root formation points. It is also possible that they can
flow through openings made by endophytes (which use cellulytic and pectinolytic cell
wall degradation enzymes to aid movement through the cell wall) (Sattelmacher, 2001)
and into then xylem. TEM and confocal studies of the cell wall, particularly at or along
the sites of lateral root initiation (pericycle of primary root) or at endophyte opening
points (Raven et al., 1992), would be of interest. It would be especially interesting to
Chapter 4 – Further discussion and conclusions 252
determine if Pb is seen in vesicle-like structures in the cell walls of shoots cells not
exhibiting Pb stress early on in the treatment.
If this apoplastic vesicle-based route into the xylem is proven true, this could
support the challenge made to the assumption that heavy metals, such as Zn, enter the
xylem only via the symplastic route (White et al., 2002). Although the method of
apoplastic entry into the xylem was not identified, White et al., (2002) suggested that
some of the Zn reaching the xylem must be through the apoplastic route, especially at
high concentrations. This was because the delivery of Zn into the xylem exceeded the
influx of Zn into the root cell (symplastic route) and the Zn following this route could
not supply sufficient amounts of Zn for hyperaccumulation.
4.1.2. In vitro lead-tannin chelation
There are several experiments using the in vitro chelation method that would be of
interest for future studies:
(i) Fructans in S. officinale roots could be isolated to determine the type of fructan in
S. officinale roots and their in vitro Pb chelation ability. Additionally higher
concentrations of purified chicory inulin or artichoke inulin (which has more units
of frutose than chicory inulin) could also be tested. This would add credence to the
findings in this study that suggest fructans interfered in our in vitro Pb-tannin
chelation studies.
(ii) Study of the tannin-Pb complex in more detail using electrospray ionisation mass
spectroscopy (Ross et al., 2000).
4.2 Objective 2
4.2.1. Pb accumulation studies
At the time, 250 µM Pb(NO3)2 treatment was performed to simultaneously test the
phytoremediation ability of S. officinale and chelation-based tolerance factors. Whilst
this may be considered high, it is a more realistic concentration in order to achieve the
time limits of phytoremediation. Numerous phytoremediation experiments have in fact
used Pb(NO3)2 concentrations up to 1000 µM (Dushenkov et al., 1995; Kumar et al.,
Chapter 4 – Further discussion and conclusions 253
1995; Blaylock et al., 1997; Sahi et al., 2002). Moreover it was necessary to test such
concentrations because there may be a threshold level before Pb translocation occurs
(Kumar et al., 1995).
Although it would not reflect a real phytoremediation situation, it would have
been interesting to test the tolerance and accumulation ability of this plant at lower Pb
concentrations (that are less inhibitory to root growth), such as 50 and 100 µM Pb
concentrations. The rationale for this is that the stress associated with high Pb
concentrations may lead to tannin (or tannin-Pb) absorption to the cell wall, creating a
more permanent sink for Pb in the roots. If less stress occurred, perhaps more tannin
would remain in the root vacuole, creating a more mobile phase for Pb to move to the
shoots. Martinez et al., (2006) also raised this possibility. Although not related to Pb
stress, similar examples of tannin retention in the vacuole or in the inner cell fraction
includes the leaves of Fagus sylvatica L. (to less ultraviolet radiation stress) (Bussotti et
al., 1998), and Vitis vinifera L. (in unripe grape berries) (Gagne et al., 2006). If this
were possible, it would be important for tannin-Pb chelation in the root vacuole to be
temporary for phytoextraction. According to Elbaz et al., (2006) sequestration in the
root vacuoles can inhibit xylem loading and consequently hyperaccumulation in the
shoots of the zinc hyperaccumulator, Thlapsi caerulescens.
Apart from testing lower concentrations of Pb, it would be of interest to increase
the duration of Pb exposure from 7 to 14 or 21 days (for unchelated Pb) to determine if
time, similar to studies by Huang and Cunningham (1996), would also influence the
amount of Pb translocated to the S. officinale shoots. If given the resources to safely
address the Pb liquid waste disposal issue, it would also be of interest to have a
continuous feeding solution set up for such longer durations. This is because longer
hydroponic durations may lead to an accumulation of Pb chelating compounds in the
solution over time, thus inhibiting the uptake and accumulation level of Pb. A similar
finding was found with rice seedlings (Yang et al., 2000).
In terms of chelating agents, ADA was able to match or supercede EDTA at lower
and higher pH (pH 7.0). Since, ADA also has benefits in terms of specificity for Pb and
ease of recycling and recovery, it should be tested in demonstrated phytoremediators
such as B. juncea and Sesbania drummondii.

Chapter 4 – Further discussion and conclusions 254
4.2.2. Polyphenol polymerisation
There are a number of experiments to prove if the formation (or increased formation) of
the root exodermis and/or polyphenol polymerisation leads to reduced chelated-Pb
accumulation.
(i) Confocal microscopy of root tip to observe exodermis formation in real time.
(ii) Study plants treated with only 500 µM EDTA (in terms of root length,
SOD/POD, exodermis formation etc)
(iii) Measure the POD activity, the enzyme directly involved in polyphenol
polymerisation (at low and high Pb concentrations).
(iv) Add external IAA (plant growth regulator) to the medium with and without
EDTA or PbEDTA, to determine if IAA can reduce polymerisation and/or
root exodermis formation and increase Pb accumulation. This idea comes
from studies on the involvement of IAA in polymerisation (or cross-linking).
Firstly, Jansen et al., (2001) found that UV tolerance in duckweed mutants
was associated with decreasing IAA levels caused by the peroxidase-
mediated breakdown of endogenous IAA and cross-linking of UV-B
absorbing phenolics. Secondly, binding of Pb to the cell wall is thought to
modify the normal cell wall cross-links into structures less susceptible to
IAA breakage and therefore elongation (Lane et al., 1978). Lane et al.,
(1978) showed that elevated levels of IAA are thought to reverse this
process. If IAA reduces polymerisation and increase Pb accumulation, this
could explain why Lopez et al., (2005) found that increasing applications of
IAA to PbEDTA solutions increased shoot concentrations of Pb in alfalfa
leaves by 2800%.
4.3 Objective 3
4.3.1. Symphytum officinale tissue culture
Pre-treatment did appear to reduce Pb accumulation, but in order to be more certain of
the causes (relating to SOD activity and polyphenols), statistically significant data needs
to be compiled. The main experiments would include:
(i) Replicating pre-treatments on individual lines showing the greatest difference.
Chapter 4 – Further discussion and conclusions 255
(ii) More than three to four replications.
(iii) If sufficient root tissue can be obtained, studying only the root tips (up to the
elongation zone) as histochemical superoxide anion staining showed that most of
the differences were located in this region.
(iv) For publication purposes, quantitative analysis of •O2 production will be required.
Re-treatment with lower Pb concentrations (e.g. 250 µM level) and earlier (e.g.
after 24 hours).
(v) Study plants developed from pre-treatment without re-treatment.
It was envisaged that (i) could be performed, but because the longer than envisaged time
involved in generating shoots from Pb pre-treated shoot petioles and their subculture,
this could not be achieved by the ‘one person’ research team. The efforts were also not
helped by a lack of shoot generation from Pb pre-treated whole plants and
contamination of established tissue culture stock plants (an unforeseen consequence of
changing the size of stock plant containers). For time and practicality reasons, it would
also be helpful to invest time in developing a liquid medium suitable to support
consistent whole plant growth from the crown tissue.
4.3.2. Trends based on levels
While studying changes in levels or activity of Pb, polyphenols and SOD (in response to
treatments) give some significant and important insights, there are inherit limitations;
the significance of changes to the composition, structure, and location of target
compounds under investigation may be missed. For example Konno et al., (2005)
demonstrated that copper affected polysaccharide synthesis in Lycopodium japonicum
prothallium, resulting in changes to not only the levels but also the composition of
pectins in the cell wall. In another example, Loponen et al., (2001) showed that there
was no trend between the distance of a polluted site (Ni-Cu smelter) and the level of
total polyphenols in white birch levels. However, when individual phenolic acids in the
leaves were measured, one type of phenolic acid (gallic acid) did show a significant
increase towards the smelter. Thus in this regard, future studies could include
identifying and measuring specific types of tannins and distinguishing between tannins
in the cell wall and vacuole. Other studies could include determining the degree of
polymerisation of polyphenols in the cell wall, and similar to other studies (Fornazier et
Chapter 4 – Further discussion and conclusions 256
al., 2002; Sandalio et al., 2001), the relative ratios of SOD isozymes and their cellular
location (e.g. apoplast vs. cytoplasm).
4.3.3. Engineered phytoremediators
Somaclonal variation is one approach towards improving the intrinsic heavy metal
remediation ability of plants. Other approaches include screening for chemical-induced
(e.g. EMS) mutants, cultivars of plants displaying remediation potential (Nehnevajova
et al., 2005; Kumar et al., 1995) and using genetic engineering. At the time of this
thesis, there was a moratorium (part of the Hazardous Substance and New Organism
Act, 1996 and Biosecurity Act, 1993) on releasing GMOs in New Zealand (Ministry for
the Environment – online, 2006). Hence, the genetic modification approach was not the
focus in this study. Nonetheless in future, genetic engineering studies could include:
(i) Overexpression of genes that produce enzymes (e.g. SOD in mitochondria or
chloroplasts) or Pb-binding compounds (e.g. tannins, particularly in vacuoles of
shoot tissue) related to the antioxidative defence system. This is because
overproduction of SOD has (in some cases) been linked with reduced oxidative
stress (Yu et al., 1999; Apel and Hirt, 2004) and variety of transgenic plants with
heightened phytochelatin levels have been shown to extract more Cd, Cu and Pb
etc than wild plants (Eapen and D’souza, 2005; Martinez et al., 2006). Minimising
oxidative stress could be another avenue to keep metal transporters (e.g. ATPases)
functional rather than adding new transporters (Xiong et al., 2006). However
while increased growth has been reported (Martinez et al., 2006), others reports
highlight that over-expressing genes may be very energy expensive. For example,
over expressing metallothionein genes in Nicotiana tabacum lead to a lower plant
yield compared to the untransformed plants (Tong et al., 2004).
(ii) If increased chelating agents or enzymes are required in the plant, increased
nitrogen assimilation would be required to provide the nitrogen backbone of these
substances or those that synthesise them. Thus this may require over-expression of
the nitrate reductase (NR) gene.
(iii) Genetic engineering could be a tool for understanding metal tolerance better. For
example, tracking SOD expression/response to heavy metals using fluorescence
Chapter 4 – Further discussion and conclusions 257
markers (e.g. GUS gene) in real time (and without wounding) in whole tissues
using confocal microscopy may be of interest.
(iv) If the root exodermis is an inhibiting factor for chelated Pb transport, perhaps
underexpressing peroxidases in the root (to reduce polymerisation and/or
exodermis formation) may be of interest for wetland plants.
(v) Perhaps the chloroplast should not only be viewed as a site of Pb damage or site to
insert genes but could also be targeted as an above ground sink/accumulation site
for heavy metals, in addition to the vacuole. Evidence for this possibility includes
Pb accumulation in the chloroplast of shoot cells of Chamaecytisus proliferus
treated with PbEDTA (Jarvis and Leung, 2001) and the high accumulation (more
than 60% of total) Cd in chloroplasts of Euglena gracilis, a unicellular
photosynthetic organism lacking a vacuole (Mendoza-Cozatl and Moreno-
Sanchez, 2005).
258
REFERENCES
Abou-Mandour A.A., Czygan F.C., Haass D., and Franz G. (1987). Fructan
synthesis in tissue-cultures of Symphytum-officinale L.: Initiation, differentiation, and
metabolic activity. Planta Medica 53: 482-487.
Aldrich M.V., Ellzey J.T., Peralta-Videa J.R., Gonzalez J.H., and Gardea-
Torresdey J.L. (2004). Lead uptake and the effects of EDTA on lead-tissue
concentrations in the desert species mesquite (Prosopis spp.). International Journal of
Phytoremediation 6: 195-207.
Ali M.B., Vajpayee P., Tripathi R.D., Rai U.N., Singh S.N., and Singh S.P. (2003).
Phytoremediation of lead, nickel, and copper by Salix acmophylla Boiss.: Role of
antioxidant enzymes and antioxidant substances. Bulletin of Environmental
Contamination and Toxicology 70: 462-469.
Alloway B.J., and Ayres D.C. (1997). Chemical Princples of Environmental Pollution.
2nd ed. London: Blackie Academic and Professional. 395 p.
Alscher R.G., Erturk N., and Heath L.S. (2002). Role of superoxide dismutases
(SODs) in controlling oxidative stress in plants. Journal of Experimental Botany 53:
1331-1341.
Antosiewicz D., and Wierzbicka M. (1999). Localization of lead in Allium cepa L.
cells by electron microscopy. Journal of Microscopy 195: 139-146.
Apel K., and Hirt H. (2004). Reactive oxygen species: Metabolism, oxidative stress,
and signal transduction. Annual Review of Plant Biology 55: 373-399.
Asada K., Takahash.M, and Nagate M. (1974). Assay and inhibitors of spinach
superoxide dismutase. Agricultural and Biological Chemistry 38: 471-473.
ATSDR. (2005). Agency for Toxic Substances and Disease. Online [Available]
www.atsdr.cdc.gov.
Baghour M., Moreno D.A., Villora G., Hernandez J., Castilla N., and Romero L.
(2001). Phytoextraction of cadmium and lead and physiological effects in potato plants
259
(Solanum tuberosum var. Spunta): Importance of root temperature. Journal of
Agricultural and Food Chemistry 49: 5356-5363.
Baker A.J.M., and Brooks R.R. (1989). Terrestrial higher plants which
hyperaccumulate metallic elements- a review of their distribution, ecology and
phytochemistry. Biorecovery 1: 81-126.
Banuelos G., Terry N., Leduc D.L., Pilon-Smits E.A.H., and Mackey B. (2005).
Field trial of transgenic Indian mustard plants shows enhanced phytoremediation of
selenium-contaminated sediment. Environmental Science and Technology 39: 1771-
1777.
Barnwell P., Blanchard A.N., Bryant J.A., Smirnoff N., and Weir A.F. (1998).
Isolation of DNA from the highly mucilagenous succulent plant Sedum telephium. Plant
Molecular Biology Reporter 16: 133-138.
Barocsi A., Csintalan Z., Kocsanyi L., Dushenkov S., Kuperberg J.M., Kucharski
R., and Richter P.I. (2003). Optimizing phytoremediation of heavy metal-
contaminated soil by exploiting plants stress adaptation. International Journal of
Phytoremediation 5: 13-23.
Bazzaz F.A., Rolfe G.L., and Windle P. (1974). Differing sensitivity of corn and
soybean photosynthesis and transpiration to lead contamination. Journal of
Environmental Quality 3: 156-158.
Beyer W.F., and Fridovich I. (1987). Assaying for superoxide dismutase activity:
some large consequences of minor changes in conditions. Analytical Biochemistry 161:
559-566.
Bharti N., and Singh R.P. (1993). Growth and nitrate reduction by Sesamum-indicum
Cv Pb-1 respond differentially to lead. Phytochemistry 33: 531-534.
Bhatia P., Bhatia N.P., and Ashwath N. (2002). In-vitro propagation of Stackhousia
tryonii Bailey (Stackhousiaceae): a rare and serpentine-endemic species of central
Queensland, Australia. Biodiversity and Conservation 11: 1469-1477.
260
Blamey F.P.C., Joyce D.C., Edwards D.G., and Asher C.J. (1986). Role of trichomes
in sunflower tolerance to manganese toxicity. Plant and Soil 91: 171-180.
Blaylock M.J., Salt D.E., Dushenkov S., Zakharova O., Gussman C., Kapulnik Y.,
Ensley B.D., and Raskin I. (1997). Enhanced accumulation of lead in Indian mustard
by soil-applied chelating agents. Environmental Science and Technology 31: 860-865.
Blokhina O., Virolainen E., and Fagerstedt K.V. (2003). Antioxidants, oxidative
damage and oxygen deprivation stress: a review. Annals of Botany 91: 179-194.
Blum U. (1997). Benefits of citrate over EDTA for extracting phenolic acids from soils
and plant debris. Journal of Chemical Ecology 23: 347-362.
Bollag D., Rozycki M.D., and Edelstein S.J. (1996). Protein Methods. New York:
Wiley-Liss, Inc. 405 p.
Bradford M.M. (1976). Rapid and sensitive method for quantitation of microgram
quantities of protein utilizing principle of protein-dye binding. Analytical Biochemistry
72: 248-254.
Bravo L. (1998). Polyphenols: Chemistry, dietary sources, metabolism, and nutritional
significance. Nutritional Reviews 56: 317-333.
Breckle S.W. (1991). Growth Under Stress. In: Waisel Y., Eshel A., Kafkafi U.,
editors. Plant Roots: The hidden half. USA: Marcel Dekker, Inc. p 351-414.
Bringezu K., Lichtenberger O., Leopold I., and Neumann D. (1999). Heavy metal
tolerance of Silene vulgaris. Journal of Plant Physiology 154: 536-546.
Brooks R.R. (1998). Plants that hyperaccumulate heavy metals : their role in
phytoremediation, microbiology, archaeology, mineral exploration and phytomining.
Brooks R.R., editor. New York: CAB International. 380 p.
Brown D. (2001). Cornell University: Poisionous plants information database. In:
Phenolic Toxicants - Tannins. Online. [Available].
www.ansci.cornell.edu/plants/toxicagents/tannin/tannin.html.
261
Burkey K.O., and Eason G. (2002). Ozone tolerance in snap bean is associated with
elevated ascorbic acid in the leaf apoplast. Physiologia Plantarum 114: 387-394.
Bussotti F., Gravano E., Grossoni P., and Tani C. (1998). Occurrence of tannins in
leaves of beech trees (Fagus sylvatica) along an ecological gradient, detected by
histochemical and ultrastructural analyses. New Phytologist 138: 469-479.
Cairns A.J. (2003). Fructan biosynthesis in transgenic plants. Journal of Experimental
Botany 54: 549-567.
Carlson R.W., Bazzaz F.A., and Rolfe G.L. (1975). Effect of heavy metals on plants
II. net photosynthesis and transpiration of whole corn and sunflower plants treated with
lead, cadmium, nickel, and thallium. Environmental Research 10: 113-120.
Chalker-Scott L., and Krahmer R.L. (1989). Microscopic studies of tannin formation
and distribution in plant tissues. In: Hemingway R.W., Karchesy J.J., editors. Chemistry
and Significance of Condensed Tannins. New York: Plenum Press. p 345-360.
Chen J., Huang J.W., Casper T., and Cunningham S.D. (1997). Arabidopsis
thaliana as a model system for studying lead accumulation and tolerance in plants. In:
Kruger E.L., Anderson T.A., Coats J.R., editors. Phytoremediation of Soil and Water
Contaminants. Washington, DC: American Chemical Society. p 264-273.
Chen T.C., and Hong A. (1995). Chelating extraction of lead and copper from an
authentic contaminated soil using N-(2-acetamido)iminodiacetic acid and s-
carboxymethyl-l-cysteine. Journal of Hazardous Materials 41: 147-160.
Cherian S., and Oliveira M.M. (2005). Transgenic plants in phytoremediation: Recent
advances and new possibilities. Environmental Science and Technology 39: 9377-9390.
Chevalier A. (1996). The Encyclopaedia of Medicinal Plants. London: Dorling
Kindersley. p 136.
Clemens S. (2001). Molecular mechanisms of plant metal tolerance and homeostasis.
Planta 212: 475-486.
262
Clemens S., Palmgren M.G., and Kramer U. (2002). A long way ahead:
understanding and engineering plant metal accumulation. Trends in Plant Science 7:
309-315.
Cobbett C. (2003). Heavy metals and plants - model systems and hyperaccumulators.
New Phytologist 159: 289-293.
Conner A.J., and Meredith C.P. (1985). Simulating the mineral environment of
aluminum toxic soils in plant-cell culture. Journal of Experimental Botany 36: 870-880.
Conner A.J., and Meredith C.P. (1985). Strategies for the selection and
characterization of aluminum-resistant variants from cell-cultures of Nicotiana
plumbaginifolia. Planta 166: 466-473.
Constabel C.P., and Ryan C.A. (1998). A survey of wound- and methyl jasmonate-
induced leaf polyphenol oxidase in crop plants. Phytochemistry 47: 507-511.
Cotter-Howells J.D., Champness P.E., and Charnock J.M. (1999). Mineralogy of
Pb-P grains in the roots of Agrostis capillaris L-by ATEM and EXAFS. Mineralogical
Magazine 63: 777-789.
Crist R.H., Martin J.R., and Crist D.L.R. (2004). Ion-exchange aspects of toxic metal
uptake by Indian mustard. International Journal of Phytoremediation 6: 85-94.
Csuros M. (1994). Introduction to metals. In: Environmental Sampling and Analysis
for Technicians. Boca Raton: Lewis Publishers. p 209-210.
Cunningham S.D., and Ow D.W. (1996). Promises and prospects of phytoremediation.
Plant Physiology 110: 715-719.
Dahmani-Muller H., van Oort F., Gelie B., and Balabane M. (2000). Strategies of
heavy metal uptake by three plant species growing near a metal smelter. Environmental
Pollution 109: 231-238.
Dalton B.R., Weed S.B., and Blum U. (1987). Plant phenolic-acids in soils - a
comparison of extraction procedures. Soil Science Society of America Journal 51:
1515-1521.
263
Dalzell S.A., and Kerven G.L. (1998). A rapid method for the measurement of
Leucaena spp proanthocyanidins by the proanthocyanidin (butanol/HCl) assay. Journal
of the Science of Food and Agriculture 78: 405-416.
Davison J. (2005). Risk mitigation of genetically modified bacteria and plants designed
for bioremediation. Journal of Industrial Microbiology and Biotechnology 32: 639-650.
De Paudia L.S., and Pantastico J.B. (1976). Histochemistry of comfrey, Symphytum
officinale L. Kalikasan, Philippines Journal of Biology 5: 351-356.
Degenhardt B., and Gimmler H. (2000). Cell wall adaptations to multiple
environmental stresses in maize roots. Journal of Experimental Botany 51: 595-603.
DeKock P.C., and Mitchell R.L. (1957). Uptake of chelated metals by plants. Soil
Science and Plant Nutrition 84: 55-62.
Del Rio L.A., Corpas F.J., Sandalio L.M., Palma J.M., Gomez M., and Barroso
J.B. (2002). Reactive oxygen species, antioxidant systems and nitric oxide in
peroxisomes. Journal of Experimental Botany 53: 1255-1272.
Delhaize E., Randall P.J., Wallace P.A., and Pinkerton A. (1993). Screening
Arabidopsis for Mutants in Mineral Nutrition. Plant and Soil 156: 131-134.
Dushenkov V., Kumar P., Motto H., and Raskin I. (1995). Rhizofiltration - the use of
plants to remove heavy metals from aqueous streams. Environmental Science and
Technology 29: 1239-1245.
Eapen S., and D'Souza S.F. (2005). Prospects of genetic engineering of plants for
phytoremediation of toxic metals. Biotechnology Advances 23: 97-114.
Ebbs S.D., and Kochian L.V. (1998). Phytoextraction of zinc by oat (Avena sativa),
barley (Hordeum vulgare), and Indian mustard (Brassica juncea). Environmental
Science and Technology 32: 802-806.
Elbaz B., Shoshani-Knaani N., David-Assael O., Mizrachy-Dagri T., Mizrahi K.,
Saul H., Brook E., Berezin I., and Shaul O. (2006). High expression in leaves of the
zinc hyperaccumulator Arabidopsis halleri of AhMHX, a homolog of an Arabidopsis
thaliana vacuolar metal/proton exchanger. Plant Cell and Environment 29: 1179-1190.
264
Eltrop L., Brown G., Joachim O., and Brinkmann K. (1991). Lead tolerance of
Betula and Salix in the mining area of Mechernich, Germany. Plant and Soil 131: 275-
285.
Evans G.E. (1996). Trease and Evan's Pharmacognosy. 4th ed. London: Bailerre
Tindall.
FAO/IAEA-manual. (2002). Quantification of Tannins in Tree Foliage.Vienna. Online
[Available] www.iaea.or.at/programmes/nafa/d3/crp/d3-1022.html.
Fatima R.A., and Ahmad M. (2005). Certain antioxidant enzymes of Allium cepa as
biomarkers for the detection of toxic heavy metals in wastewater. Science of the Total
Environment 346: 256-273.
Fickel J., Pitra C., Joest B.A., and Hofmann R.R. (1999). A novel method to evaluate
the relative tannin-binding capacities of salivary proteins. Comparative Biochemistry
and Physiology C-Pharmacology Toxicology and Endocrinology 122: 225-229.
Fisher A.E.O., Maxwell S.C., and Naughton D.P. (2004). Superoxide and hydrogen
peroxide suppression by metal ions and their EDTA complexes. Biochemical and
Biophysical Research Communications 316: 48-51.
Fornazier R.F., Ferreira R.R., Pereira G.J.G., Molina S.M.G., Smith R.J., Lea P.J.,
and Azevedo R.A. (2002). Cadmium stress in sugar cane callus cultures: Effect on
antioxidant enzymes. Plant Cell Tissue and Organ Culture 71: 125-131.
Foyer C.H., and Noctor G. (2005). Oxidant and antioxidant signalling in plants: a re-
evaluation of the concept of oxidative stress in a physiological context. Plant Cell and
Environment 28: 1056-1071.
Fry S.C. (1984). Incorporation of [C-14]-labeled cinnamate into hydrolase-resistant
components of the primary-cell wall of spinach. Phytochemistry 23: 59-64.
Gagne S., Saucier C., and Geny L. (2006). Composition and cellular localization of
tannins in Cabernet Sauvignon skins during growth. Journal of Agricultural and Food
Chemistry 54: 9465-9471.
265
Gahan P.B. (1984). Plant Histochemistry and Cytochemistry: An Introduction. London:
Academic Press. 242-243 p.
Gallego S., Benavides M., and Tomaro M. (2002). Involvement of an antioxidant
defence system in the adaptive response to heavy metal ions in Helianthus annuus L.
cells. Plant Growth Regulation 36: 267-273.
Gamborg O.L., and Phillips G.C. (1995). Plant Cell, Tissue and Organ Culture:
Fundamental Methods. Gamborg O.L., Phillips G.C., editors. New York: Springer-
Verlag. 21-41 p.
Garbisu C., and Alkorta I. (2001). Phytoextraction: a cost-effective plant-based
technology for the removal of metals from the environment. Bioresource Technology
77: 229-236.
Gardiner J. (1997). Propagation from Cuttings. A Wilsey Handbook. London: The
Royal Horticultural Society. p 40-51.
Geebelen W., Vangronsveld J., Adriano D.C., Van Poucke L.C., and Clijsters H.
(2002). Effects of Pb-EDTA and EDTA on oxidative stress reactions and mineral
uptake in Phaseolus vulgaris. Physiologia Plantarum 115: 377-384.
Getachew G., Makkar H.P.S., and Becker K. (1998). Localisation and quantification
of tannins in multipurpose tree leaves using a histochemical approach coupled with
image analysis. 2nd International Electronic Conference on Synthetic Organic
Chemistry (ECSOC-2). Online. [Available]. www.mdpi.org/escoc.
Ghosh M., and Singh S.P. (2005). A review on phytoremediation of heavy metals and
ultilization of its byproducts. Applied Ecology and Environmental Research 3: 1-18.
Gorinova N., Nedkovska M., Todorovska E., Simova-Stoilova L., Z. S., Georgieva
K., K. D.-K., A. A., and R. H. (2006). Improved phytoaccumulation of cadmium by
genetically modified tobacco plants (Nicotiana tabacum L.). Physiological and
biochemical response of the transformants to cadmium toxicity. Environmental
Pollution 145: 161-170.
266
Gratao P.L., Polle A., Lea P.J., and Azevedo R.A. (2005). Making the life of heavy
metal-stressed plants a little easier. Functional Plant Biology 32: 481-494.
Grĉman H., Vodnik D., Velikonja-Bolta S., and Lestan D. (2003).
Ethylenediaminedissuccinate as a new chelate for environmentally safe enhanced: Lead
phytoextraction. Journal of Environmental Quality 32: 500-506.
Greger M. (1999). Metal availability and bioconcentration in plants. In: Prasad
M.N.V., Hagemeyer J., editors. Heavy Metal Stress in Plants: From Molecules to
Ecosystems. New York: Springer. p 1-27.
Grene R. (2002). Oxidative stress and acclimation mechanisms in plants. In: The
Aradidposis Book: American Society of Plant Biologists. Online [Available]
www.fsl.orst.edu/~bond/fs561/references/OX-ACC.pdf. p 1-22.
Gurd F.R.N., and Wilcox P.E. (1956). Complex formation between metallic cations
and proteins, peptides, and amino acids. Advances in Protein Chemistry 11: 311-427.
Gzyl J., and Gwozdz A. (2005). Selection in-vitro and accumulation of phytochelatins
in cadmium tolerant cell line of cucumber (Cucumis sativus). Plant Cell Tissue and
Organ Culture 80: 59-67.
Haag-Kerwer A., Schafer H.J., Heiss S., Walter C., and Rausch T. (1999).
Cadmium exposure in Brassica juncea causes a decline in transpiration rate and leaf
expansion without effect on photosynthesis. Journal of Experimental Botany 50: 1827-
1835.
Haass D., Aboumandour A.A., Blaschek W., Franz G., and Czygan F.C. (1991).
The influence of phytohormones on growth, organ differentiation and fructan
production in callus of Symphytum officinale L. Plant Cell Reports 10: 421-424.
Hagerman A. (1998). Tannin Chemistry. Online. [Available]. www.muohio.edu/-
hagermae/def.html.
Hagerman A.E., and Butler L.G. (1978). Protein precipitation method for
quantitative-determination of tannins. Journal of Agricultural and Food Chemistry 26:
809-812.

267
Hall J.L. (2002). Cellular mechanisms for heavy metal detoxification and tolerance.
Journal of Experimental Botany 53: 1-11.
Hall R.D. (1999). An introduction to plant-cell culture. Plant Cell Culture Protocols.
New Jersey: Humana Press. p 1-18.
Hansel C.M., Fendorf S., Sutton S., and Newville M. (2001). Characterization of Fe
plaque and associated metals on the roots of mine-waste impacted aquatic plants.
Environmental Science and Technology 35: 3863-3868.
Harborne J.B., and Baxter H. (1993). Phytochemical Dictionary: A Handbook of
Bioactive Compounds from Plants. London: Taylor and Francis. p 519.
Hose E., Clarkson D.T., Steudle E., Schreiber L., and Hartung W. (2001). The
exodermis: a variable apoplastic barrier. Journal of Experimental Botany 52: 2245-
2264.
Howden R., Andersen C.R., Goldsbrough P.B., and Cobbett C.S. (1995). A
cadmium-sensitive, glutathione-deficient mutant of Arabidopsis-thaliana. Plant
Physiology 107: 1067-1073.
Huang C.Y., Bazzaz F.A., and Vanderho.Ln. (1974). Inhibition of soybean
metabolism by cadmium and lead. Plant Physiology 54: 122-124.
Huang J.W., and Cunningham S.D. (1996). Lead phytoextraction: Species variation
in lead uptake and translocation. New Phytologist 134: 75-84.
Huang J.W., Chen J., and Cunningham S.D. (1997a). Phytoextraction of lead from
contaminated soils. In: Phytoremediation of Soil and Water Contaminants (ACS
Symposium Series). p 283-298.
Huang J.W.W., Chen J.J., Berti W.R., and Cunningham S.D. (1997b).
Phytoremediation of lead-contaminated soils: Role of synthetic chelates in lead
phytoextraction. Environmental Science and Technology 31: 800-805.
Huebert D.B., and Shay J.M. (1992). The Effect of EDTA on cadmium and zinc
uptake and toxicity in Lemna-trisulca L. Archives of Environmental Contamination and
Toxicology 22: 313-318.
268
Huizing H.J., Pfauth E.C., Malingre T.M., and Sietsma J.H. (1983). Regeneration of
plants from tissue and cell-suspension cultures of Symphytum officinale L and effect of
in-vitro culture on pyrrolizidine alkaloid production. Plant Cell Tissue and Organ
Culture 2: 227-238.
Hutzler P., Fischbach R., Heller W., Jungblut T.P., Reuber S., Schmitz R., Veit M.,
Weissenbock G., and Schnitzler J.P. (1998). Tissue localization of phenolic
compounds in plants by confocal laser scanning microscopy. Journal of Experimental
Botany 49: 953-965.
Jackson F.S., Barry T.N., Lascano C., and Palmer B. (1996). The extractable and
bound condensed tannin content of leaves from tropical tree, shrub and forage legumes.
Journal of the Science of Food and Agriculture 71: 103-110.
Jaffre T., Brooks R.R., Lee J., and Reeves R.D. (1976). Sebertia acuminata - hyper-
accumulator of nickel from New-Caledonia. Science 193: 579-580.
Jansen M.A.K., van den Noort R.E., Tan M.Y.A., Prinsen E., Lagrimini L.M., and
Thorneley R.N.F. (2001). Phenol-oxidizing peroxidases contribute to the protection of
plants from ultraviolet radiation stress. Plant Physiology 126: 1012-1023.
Jarvis M.D. (2001). An investigation into some aspects related to the phytoremediation
potential of Pinus radiata (D. Don) and Chamaecytisus proliferus (L.f.) Link ssp.
proliferus var. palmensis (H. Christ.) (Ph.D. thesis). University of Canterbury. 262 p.
Jarvis M.D., and Leung D.W.M. (2001). Chelated lead transport in Chamaecytisus
proliferus (L.f.) link ssp proliferus var. palmensis (H. Christ): an ultrastructural study.
Plant Science 161: 433-441.
Jung C., Maeder V., Funk F., Frey B., Sticher H., and Frossard E. (2003). Release
of phenols from Lupinus albus L. roots exposed to copper and their possible role in
copper detoxification. Plant and Soil 252: 301-312.
Kabata-Pendias A. (2001). Elements of Group IV. In: Trace Elements in Soils and
Plants. Florida: CRC Press, Inc. p 208-218.
269
Kamachi H., Komori I., Tamura H., Sawa Y., Karahara I., Honma Y., Wada N.,
Kawabata T., Matsuda K., Ikeno S., Noguchi M., and Inoue H. (2005). Lead
tolerance and accumulation in the gametophytes of the fern Athyrium yokoscense.
Journal of Plant Research 118: 137-145.
Kaminsky R., and Muller W.H. (1977). Extraction of soil phytotoxins using a neutral
EDTA solution. Soil Science 124: 205-210.
Karenlampi S., Schat H., Vangronsveld J., Verkleij J.A.C., van der Lelie D.,
Mergeay M., and Tervahauta A.I. (2000). Genetic engineering in the improvement of
plants for phytoremediation of metal polluted soils. Environmental Pollution 107: 225-
231.
Kayser A., Wenger K., Keller A., Attinger W., Felix H.R., Gupta S.K., and Schulin
R. (2000). Enhancement of phytoextraction of zinc, cadmium, and copper from
calcareous soil: The use of NTA and sulfur amendments. Environmental Science and
Technology 34: 1778-1783.
Keller C., Hammer D., Kayser A., Richner W., Brodbeck M., and Sennhauser M.
(2003). Root development and heavy metal phytoextraction efficiency: comparison of
different plant species in the field. Plant and Soil 249: 67-81.
Kim C., and Ong S.K. (2000). Effects of amorphous iron an extraction of lead-
contaminated soil and EDTA. Practice periodical of harzardous, toxic and radioactive
waste management 4: 16-23.
Kim C., Lee Y., and Ong S.K. (2003). Factors affecting EDTA extraction of lead from
lead-contaminated soils. Chemosphere 51: 845-853.
Klein S., and Ginzburg B. (1960). An electron microscopic investigation into the
effect of EDTA on plant cell wall. Journal of Biophysical and Biochemical Cytology 7:
335-341.
Koeppe D.E. (1981). Lead: Understanding the minimal toxicity of lead in plants. In:
Lepp N.W., editor. Effect of Heavy Metal Pollution on Plants (Volume 1). London:
Applied Science Publishers. p 55-75.
270
Konno H., Nakato T., Nakashima S., and Katoh K. (2005). Lygodium japonicum fern
accumulates copper in the cell wall pectin. Journal of Experimental Botany 56: 1923-
1931.
Kos B., and Lestan D. (2003). Influence of a biodegradable ([S,S]-EDDS) and
nondegradable (EDTA) chelate and hydrogel modified soil water sorption capacity on
lead phytoextraction and leaching. Plant and Soil 253: 403-411.
Koster J. (1996). Basic Fructan Information. Online. [Available].
www.geocities.com/CapeCanaveral/4409/fructan.htm.
Krämer U. (2005). Phytoremediation: novel approaches to cleaning up polluted soils.
Current Opinion in Biotechnology 16: 133-141.
Krämer U., Smith R.D., Wenzel W.W., Raskin I., and Salt D.E. (1997). The role of
metal transport and tolerance in nickel hyperaccumulation by Thlaspi goesingense
Halacsy. Plant Physiology 115 (4): 1641-1650.
Kraus T.E.C., Dahlgren R.A., and Zasoki R.J. (2003). Tannins in nutrient dynamics
of forest ecosystems- a review. Plant and Soil 256: 41-46.
Ksiazek M., Wozny A., and Mlodzianowski F. (1984). Effect of Pb(NO3)2 on poplar
tissue-culture and the ultrastructural-localization of lead in culture cells. Forest Ecology
and Management 8: 95-105.
Kumar P., Dushenkov V., Motto H., and Raskin I. (1995). Phytoextraction - the use
of plants to remove heavy metals from soils. Environmental Science and Technology
29: 1232-1238.
Laks P.E., and Mckaig P.A. (1988). Flavonoid biocides: wood preservatives based on
condensed tannins. Holzforschung 42: 299-306.
Landberg T., and Greger M. (2002). Differences in oxidative stress in heavy metal
resistant and sensitive clones of Salix viminalis. Journal of Plant Physiology 159: 69-75.
Lane S.D., and Martin E.S. (1982). An ultrastructural examination of lead localization
in germinating-seeds of Raphanus-sativus. Zeitschrift Fur Pflanzenphysiologie 107: 33-
40.
271
Lane S.D., Martin E.S., and Garrod J.F. (1978). Lead toxicity effects on indole-3-
ylacetic acid-induced cell elongation. Planta 144: 79-84.
Larsen P.B., Tai C.Y., Kochian L.V., and Howell S.H. (1996). Arabidopsis mutants
with increased sensitivity to aluminum. Plant Physiology 110: 743-751.
Lasat M.M. (2002). Phytoextraction of toxic metals: A review of biological
mechanisms. Journal of Environmental Quality 31: 109-120.
Lavid N., Barkay Z., and Tel-Or E. (2001a). Accumulation of heavy metals in
epidermal glands of the waterlily (Nymphaeaceae). Planta 212: 313-322.
Lavid N., Schwartz A., Yarden O., and Tel-Or E. (2001b). The involvement of
polyphenols and peroxidase activities in heavy-metal accumulation by epidermal glands
of the waterlily (Nymphaeaceae). Planta 212: 323-331.
Lawerence D.H. (1976). Comfrey: Past, Present, and Future. London: Faber and Faber.
253 p.
LeDuc D.L., Tarun A.S., Montes-Bayon M., Meija J., Malit M.F., Wu C.P.,
AbdelSamie M., Chiang C.Y., Tagmount A., DeSouza M., Neuhierl B., Bock A.,
Caruso J., and Terry N. (2004). Overexpression of selenocysteine methyltransferase
in Arabidopsis and Indian mustard increases selenium tolerance and accumulation. Plant
Physiology 135: 377-383.
Lee J., Bae H., Jeong J., Lee J.Y., Yang Y.Y., Hwang I., Martinoia E., and Lee Y.
(2003). Functional expression of a bacteral heavy metal transporter in Arabidopsis
enhances resistance to and decrease uptake of heavy metals. Plant Physiology 133: 589-
596.
Lee K.C., Cunningham B.A., Chung K.H., Paulsen G.M., and Liang G.H. (1976).
Lead effects on several enzymes and nitrogenous compounds in soybean leaf. Journal of
Environmental Quality 5: 357-359.
Lehle seeds. (2002). Methods for Arabidposis thaliana (instructions with seed
purchase).
272
Leopold I., Gunther D., Schmidt J., and Neumann D. (1999). Phytochelatins and
heavy metal tolerance. Phytochemistry 50: 1323-1328.
Lesage E., Meers E., Vervaeke P., Lamsal S., Hopgood M., Tack F.M.G., and
Verloo M.G. (2005). Enhanced phytoextraction: II. Effect of EDTA and citric acid on
heavy metal uptake by Helianthus annuus from a calcareous soil. International Journal
of Phytoremediation 7: 143-152.
Levine A. (2000). Oxidative stress-response regulation in plants. In: Lerner H.R.,
editor. Plant Responses to Environmental Stress: From Phytohormones to Genome Re-
organisation. New York: Marcel Dekker. p 247-263.
Li Y.M., Chaney R., Brewer E., Roseberg R., Angle J.S., Baker A., Reeves R., and
Nelkin J. (2003). Development of a technology for commercial phytoextraction of
nickel: economic and technical considerations. Plant and Soil 249: 107-115.
Liao X.P., Ma H.W., Wang R., and Shi B. (2004). Adsorption of UO2 2+ on tannins
immobilized collagen fiber membrane. Journal of Membrane Science 243: 235-241.
Lichtenberger O., and Neumann D. (1997). Analytical electron microscopy as a
powerful tool in plant cell biology: Examples using electron energy loss spectroscopy
and X-ray microanalysis. European Journal of Cell Biology 73: 378-386.
Liu C., and Huang P.M. (2003). Kinetics of lead adsorption by iron oxides formed
under the influence of citrate. Geochimica Et Cosmochimica Acta 67: 1045-1054.
Lopez M.L., Peralta-Videa J.R., Benitez T., and Gardea-Torresdey J.L. (2005).
Enhancement of lead uptake by alfalfa (Medicago sativa) using EDTA and a plant
growth promotor. Chemosphere 61: 595-598.
Loponen J., Lempa K., Ossipov V., Kozlov M.V., Girs A., Hangasmaa K.,
Haukioja E., and Pihlaja K. (2001). Patterns in content of phenolic compounds in
leaves of mountain birches along a strong pollution gradient. Chemosphere 45: 291-301.
Lozovaya V.V., Gorshkova T.A., Yablokova E.V., Rumyantseva N.I., Valieva A.,
Ulanov A., and Widholm J.M. (1999). Cold alkali can extract phenolic acids that are
273
ether linked to cell wall components in dicotyledonous plants (buckwheat, soybean and
flax). Phytochemistry 50: 395-400.
Luwe M.W.F., Takahama U., and Heber U. (1993). Role of ascorbate in detoxifying
ozone in the apoplast of spinach (Spinacia-oleracea L) leaves. Plant Physiology 101:
969-976.
Lyons T., Plochl M., Turcsanyi E., and Barnes J. (2000). Extracellular antioxidants: a
protective screen against ozone. In: Agrawal S.B., Agrawal A., editors. Environmental
Pollution and Plant Responses. Bocta Raton: Lewis Publishers. p 189-191.
Mace M.E. (1963). Histochemical localisation of phenols in healthy and diseased
banana roots. Physiologia Plantarum 16: 915-925.
Mace M.E., and Howell C.R. (1974). Histochemistry and identification of condensed
tannin precursors in roots of cotton seedlings. Canadian Journal of Botany 52: 2423-
2426.
Malecka A., Jarmuszkiewicz W., and Tomaszewska B. (2001). Antioxidative
defence to lead stress in subcellular compartments of pea root cells. Acta Biochimica
Polonica 48 (3): 687-698.
Malone C., Koeppe D.E., and Miller R.J. (1974). Localization of lead accumulated by
corn plants. Plant Physiology 53: 388-394.
Maltais K., and Houde M. (2002). A new biochemical marker for aluminium tolerance
in plants. Physiologia Plantarum 115: 81-86.
Marmiroli M., Antonioli G., Maestri E., and Marmiroli N. (2005). Evidence of the
involvement of plant ligno-cellulosic structure in the sequestration of lead: an X-ray
spectroscopy-based analysis. Environmental Pollution 134: 217-227.
Marschner H. (1995). Mineral Nutrition of Higher Plants. London: Academic. 889 p.
Martin M.H., and Coughtrey P.J. (1981). Impact of metals on ecosystem function and
productivity. In: Lepp N.W., editor. Effect of Heavy Metal Pollution on Plants (Volume
2). London: Applied Science Publishers. p 147.
274
Martinez M., Bernal P., Almela C., Velez D., Garcia-Agustin P., Serrano R., and
Navarro-Avino J. (2006). An engineered plant that accumulates higher levels of heavy
metals than Thlaspi caerulescens, with yields of 100 times more biomass in mine soils.
Chemosphere 64: 478-485.
Massarado F., Corcuera L., and Miren A. (2000). Embyro physiological responses to
cold by two cultivars of oat during germination. Crop Science 40: 1694-1701.
McCallum J. 1989. Biochemistry of phenolic compounds in wheat grain (Ph.D. thesis).
University of Canterbury. 3-4 p.
McDonald M., Mila I., and Scalbert A. (1996). Precipitation of metal ions by plant
polyphenols: Optimal conditions and origin of precipitation. Journal of Agricultural and
Food Chemistry 44: 599-606.
McGrath S.P., and Zhao F.J. (2003). Phytoextraction of metals and metalloids from
contaminated soils. Current Opinion in Biotechnology 14: 277-282.
Meers E., Hopgood M., Lesage E., Vervaeke P., Tack F.M.G., and Verloo M.G.
(2004). Enhanced phytoextraction: In search of EDTA alternatives. International
Journal of Phytoremediation 6: 95-109.
Meers E., Lesage E., Lamsal S., Hopgood M., Vervaeke P., Tack F.M.G., and
Verloo M.G. (2005). Enhanced phytoextraction: I. Effect of EDTA and citric acid on
heavy metal mobility in a calcareous soil. International Journal of Phytoremediation 7:
129-142.
Megazyme. (2004). Fructan Assay Procedure. AOAC method 999.03 and AACC
32.32.: Megazyme International Ireland Limited. Online. [Available].
www.megazyme.com.
Mendoza-Cozatl D.G., and Moreno-Sanchez R. (2005). Cadmium(II) transport and
storage in the chloroplast of Euglena gracilis. Biochimica Et Biophysica Acta-
Bioenergetics 1706: 88-97.
Ministry for the Environment. (2006). Online. [Available]. www.mfe.govt.nz.
275
Moreno D.A., Villora G., Ruiz J.M., and Romero L. (2003). Growth conditions,
elemental accumulation and induced physiological changes in Chinese cabbage.
Chemosphere 52: 1031-1040.
Mueller W.C., and Beckman C.H. (1976). Ultrastructure and development of
phenolic-storing cells in cotton roots. Canadian Journal of Botany 54: 2074-2082.
Murashige T., and Skoog F. (1962). A revised medium for rapid growth and bio
assays with tobacco tissue cultures. Physiologia Plantarum 15: 473-497.
Nakajima A., and Sakaguchi T. (1990). Recovery of uranium by tannin immobilized
on matrices which have amino group. Journal of Chemical Technology and
Biotechnology 47: 31-38.
Nakajima A., and Sakaguchi T. (2000). Uptake and removal of iron by immobilised
persimmon tannin. Journal of Chemical Technology and Biotechnology 75: 977-982.
Navari-Izzo F., and Quartacci M.F. (2001). Phytoremediation of metals - tolerance
mechanisms against oxidative stress. Minerva Biotecnologica 13: 73-83.
Nehnevajova E., Herzig R., Federer G., Erismann K.H., and Schwitzguebel J.P.
(2005). Screening of sunflower cultivars for metal phytoextraction in a contaminated
field prior to mutagenesis. International Journal of Phytoremediation 7: 337-349.
Neill S.O., Gould K.S., Kilmartin P.A., Mitchell K.A., and Markham K.R. (2002).
Antioxidant activities of red versus green leaves in Elatostema rugosum. Plant Cell and
Environment 25: 539-547.
Neumann D., and zur Nieden U. (2001). Silicon and heavy metal tolerance of higher
plants. Phytochemistry 56: 685-692.
Neumann D., Zurnieden U., Lichtenberger O., and Leopold I. (1995). How does
Armeria maritima tolerate high heavy metal concentrations. Journal of Plant Physiology
146: 704-717.
Nowack B. (2002). Environmental chemistry of aminopolycarboxylate chelating agents.
Environmental Science and Technology 36: 4009-4016.

276
Nowack B., and Sigg L. (1996). Adsorption of EDTA and metal-EDTA complexes
onto goethite. Journal of Colloid and Interface Science 177: 106-121.
Ow D.W. (1996). Heavy metal tolerance genes: Prospective tools for bioremediation.
Resources Conservation and Recycling 18: 135-149.
Parham R.A., and Kaustinen H.M. (1976). Differential staining of tannin in sections
of epoxy-embedded plant-cells. Stain Technology 51: 237-240.
Parham R.A., and Kaustinen H.M. (1977). On the site of tannin synthesis in plant
cells. Botanical Gazette 138: 465-467.
PDR. (1998). PDR for Herbal Medicine. New Jersey: Medical Economics. p 1163-
1165.
Phillips D.A. (1981). Chemistry and biochemistry of trace metals in biological systems.
In: Lepp N.W., editor. Effect of Heavy Metal Pollution on Plants (Volume 1). London:
Applied Science Publishers. p 4.
Pilon-Smits E. (2005). Phytoremediation. Annual Review of Plant Biology 56: 15-39.
Polle A., Krings B., and Rennenberg H. (1989). Superoxide dismutase activity in
needles of norwegian spruce trees (Picea-abies L). Plant Physiology 90: 1310-1315.
Prasad M.N.V. (1999). Metallothionines and metal binding complexes. In: Prasad
M.N.V., Hagemeyer J., editors. Heavy metal stress in plants: from molecules to
ecosystems. New York: Springer. p 305-329.
Predieri S. (2001). Mutation induction and tissue culture in improving fruits. Plant Cell
Tissue and Organ Culture 64: 185-210.
Quershi A., Hardwick K., and Collin H.A. (1986). Intracellular localisation of lead in
a lead tolerant and sensitive clone of Anthoxanthum odoratum. Journal of Plant
Physiology 122: 357-364.
Raven P.H., Evert R.F., and Eichhorn S.E. (1992). Biology of Plants. New York:
Worth Publishers. 791 p.
277
Reddy A.M., Kumar S.G., Jyothsnakumari G., Thimmanaik S., and Sudhakar C.
(2005). Lead induced changes in antioxidant metabolism of horsegram (Macrotyloma
uniflorum (Lam.) Verdc.) and bengalgram (Cicer arietinum L.). Chemosphere 60: 97-
104.
Reeve R.M. (1951). Histochemical tests for polyphenols in plant tissues. Stain
Technology 26: 91-96.
Remotti P.C. (1998). Somaclonal variation and in-vitro selection for crop. In: Jain
S.M., Brar D.S., Ahloowalis B.S., editors. Somaclonal Variation and Induced Mutations
in Crop Improvement. Dordrecht: Kluwer Academic Publishers. p 169-201.
Ritsema T., and Smeekens S.C.M. (2003). Engineering fructan metabolism in plants.
Journal of Plant Physiology 160: 811-820.
Robinson B.H., Lombi E., Zhao F.J., and McGrath S.P. (2003). Uptake and
distribution of nickel and other metals in the hyperaccumulator Berkheya coddii. New
Phytologist 158: 279-285.
Ross A.R.S., Ikonomou M.G., and Orians K.J. (2000). Characterization of dissolved
tannins and their metal-ion complexes by electrospray ionization mass spectrometry.
Analytica Chimica Acta 411: 91-102.
Ruley A.T., Sharma N.C., and Sahi S.V. (2004). Antioxidant defense in a lead
accumulating plant, Sesbania drummondii. Plant Physiology and Biochemistry 42: 899-
906.
Rus A.M., Rios S., Olmos E., Santa-Cruz A., and Bolarin M.C. (2000). Long-term
culture modifies the salt responses of callus lines of salt-tolerant and salt-sensitive
tomato species. Journal of Plant Physiology 157: 413-420.
Ruso J., Zapata J., Hernandez M., Ojeda M.A., Benlloch M., Prats-Perez E., Tena
M., Lopez-Valbuena R., and Jorrin J.V. (2001). Toxic metals accumulation and total
soluble phenolics in sunflower and tobacco plants. Minerva Biotecnologica 13: 93-95.
Ruzin S.E. (1999). Plant Microtechnique and Microscopy. New York: Oxford
University Press. p 33-140.
278
Sahi S.V., Bryant N.L., Sharma N.C., and Singh S.R. (2002). Characterization of a
lead hyperaccumulator shrub, Sesbania drummondii. Environmental Science and
Technology 36: 4676-4680.
Salt D.E., Blaylock M., Kumar N., Dushenkov V., Ensley B.D., Chet I., and Raskin
I. (1995a). Phytoremediation - a novel strategy for the removal of toxic metals from the
environment using plants. Bio-Technology 13: 468-474.
Salt D.E., Prince R.C., Pickering I.J., and Raskin I. (1995b). Mechanisms of
cadmium mobility and accumulation in Indian mustard. Plant Physiology 109: 1427-
1433.
Salt D.E., Smith R.D., and Raskin I. (1998). Phytoremediation. Annual Review of
Plant Physiology and Plant Molecular Biology 49: 643-668.
Samantaray S., Rout G.R., and Das P. (2001). Induction, selection and
characterization of chromium and nickel-tolerant cell lines of Echinochloa colona (L.)
Link in-vitro. Journal of Plant Physiology 158: 1281-1290.
Sandalio L.M., Dalurzo H.C., Gomez M., Romero-Puertas M.C., and del Rio L.A.
(2001). Cadmium-induced changes in the growth and oxidative metabolism of pea
plants. Journal of Experimental Botany 52: 2115-2126.
Sas-Nowosielska A., Kucharski R., Malkowski E., Pogrzeba M., Kuperberg J.M.,
and Krynski K. (2004). Phytoextraction crop disposal - an unsolved problem.
Environmental Pollution 128: 373-379.
Sattelmacher B. (2001). The apoplast and its significance for plant mineral nutrition.
New Phytologist 149: 167-192.
Saxena P.K., KrishnaRaj S., Dan T., Perras M.R., and Vettakkorumakankav N.N.
(1999). Phytoremediation of heavy metal contaminated and polluted soils. In: Prasad
M.N.V., Hagemeyer J., editors. Heavy Metal Stress in Plants: From Molecules to
Ecosystems. New York: Springer. p 305-329.
Scalbert A. (1991). Antimicrobial properties of tannins. Phytochemistry 30: 3875-3883.
279
Scalbert A., Mila I., Expert D., Marmolle F., Albrecht A., Hurrell R., Huneau J.,
and Tome D. (1999). Polyphenols, metal ion complexation and biological
consequences. In: Gross G.G., Hemingway W.R., Yoshida T., editors. Plant
Polyphenols 2: Chemistry, Biology, Pharmacology, Ecology. London: Kluwer
Academic/Plenum. p 345-351.
Scalet M., Crivelato E., and Mallardi F. (1989). Demonstration of phenolic compunds
in plant tissues by an osmium-iodide postfixation procedure. Stain Technology 64: 273-
280.
Scandrett C. (1997). Controlling Phenol Extraction. Online. [Available].
www.hbd.org.brewery/library/Phen_CS0497.html.
Schickler H., and Caspi H. (1999). Response of antioxidative enzymes to nickel and
cadmium stress in hyperaccumulator plants of the genus Alyssum. Physiologia
Plantarum 105: 39-44.
Schinkel H. (2001). New isoforms of copper-zinc superoxide dismutase with high
isoelectric points and low abundance in pine and poplar. Umeå: Swedish University of
Agricultural Sciences. p 7-11.
Scholl R., Rivero-Lepinckas L., and Crist D.L.R. (1998). Growth of plants and
preservation of seeds. In: Martinez Zapater J.M., Salinas J., editors. Arabidposis
Protocols. New Jersey: Humana Press. p 1-17.
Schöpfer P. (1996). Hydrogen peroxide-mediated cell-wall stiffening in-vitro in maize
coleoptiles. Planta 199: 43-49.
Schor-Fumbarov T., Keilin Z., and Tel-Or E. (2003). Characterization of cadmium
uptake by the water lily Nymphaea aurora. International Journal of Phytoremediation 5:
169-179.
Schreiber L., Hartmann K., Skrabs M., and Zeier J. (1999). Apoplastic barriers in
roots: chemical composition of endodermal and hypodermal cell walls. Journal of
Experimental Botany 50: 1267-1280.
280
Schutzendubel A., and Polle A. (2002). Plant responses to abiotic stresses: heavy
metal-induced oxidative stress and protection by mycorrhization. Journal of
Experimental Botany 53: 1351-1365.
Schützendübel A., Schwanz P., Teichmann T., Gross K., Langenfeld-Heyser R.,
Godbold D.L., and Polle A. (2001). Cadmium-induced changes in antioxidative
systems, hydrogen peroxide content, and differentiation in scots pine roots. Plant
Physiology 127: 887-898.
Setiz P. (1996). The Complete Gardener. New York: Sterling Publishing, Inc. p 22-33.
Shalata A., and Neumann P.M. (2001). Exogenous ascorbic acid (vitamin C)
increases resistance to salt stress and reduces lipid peroxidation. Journal of
Experimental Botany 52: 2207-2211.
Sharma N.C., Sahi S.V., and Jain J.C. (2005). Sesbania drummondii cell cultures:
ICP-MS determination of the accumulation of lead and copper. Microchemical Journal
81: 163-169.
Shulman A., and Dwyer F.P. (1964). Metal chelates in biological systems. In:
Chelating Agents And Metal Chelates. New York: Academic Press, Inc. p 383-435.
Silanikove N., Shinder D., Gilboa N., Eyal M., and Nitsan Z. (1996). Binding of
poly(ethylene glycol) to samples of forage plants as an assay of tannins and their
negative effects on ruminall degradation. Journal of Agricultural and Food Chemistry
44: 3230-3234.
Sobotik M., Ivanov V.B., Obroucheva N.V., Seregin I.V., Martin M.L., Antipova
O.V., and Bergmann H. (1998). Barrier role of root system in lead-exposed plants.
Journal of Applied Botany 72: 144-147.
Song W.Y., Sohn E.J., Martinoia E., Lee Y.J., Yang Y.Y., Jasinski M., Forestier C.,
Hwang I., and Lee Y. (2003). Engineering tolerance and accumulation of lead and
cadmium in transgenic plants. Nature Biotechnology 21: 914-919.

281
Srivastava A., and Appenroth K.J. (1995). Interaction of EDTA and Iron on the
Accumulation of cadmium(II) in Duckweeds (Lemnaceae). Journal of Plant Physiology
146: 173-176.
Steele M.C., and Pitchel J. (1998). Ex-situ remediation of a metal contaminated
superfund soil using selective extractants. Journal of Environmental Engineering 124:
639-645.
Stoutjesdijk P.A., Sale P.W., and Larkin P.J. (2001). Possible involvement of
condensed tannins in aluminium tolerance of Lotus pedunculatus. Australian Journal of
Plant Physiology 28: 1063-1074.
Strycharz S., and Shetty K. (2002a). Peroxidase activity and phenolic content in elite
clonal lines of Mentha pulegium in response to polymeric dye R-478 and
Agrobacterium rhizogenes. Process Biochemistry 37: 805-812.
Strycharz S., and Shetty K. (2002b). Response of oregano (Origanum vulgare L.)
clonal lines to Pseudomonas sp Z strain and polydye R-478 and implications for
hyperhydricity prevention in tissue culture. Process Biochemistry 38: 343-350.
Suthersan S.S. (1997). Remediation Engineering. USA: CRC Press, Inc. 362 p.
Sutter E.G. (1996). General laboratory requirements, media and sterilisation methods.
In: Trigiano R.N., Gray D.J., editors. Plant Tissue Culture Concepts and Laboratory
Excersices. Boca Raton: CRC Press. p 11-25.
Tal M. (1990). Somaclonal variation for salt resistance. In: Bajaj Y.P.S., editor.
Biotechnology in Agriculture and Forestry. Berlin Heidelberg: Springer-Verlag. p 236-
257.
Tanaka H., Machida Y., Mukai N., and Misawa M. (1974). Accumulation of
glutamine by suspension cultures of Symphytum officinale. Agricultural and Biological
Chemistry 38: 987-992.
Terrill T.H., Rowan A.M., Douglas G.B., and Barry T.N. (1992). Determination of
extractable and bound condensed tannin concentrations in forage plants, protein-
282
concentrate meals and cereal-grains. Journal of the Science of Food and Agriculture 58:
321-329.
Thompson P. (1992). Creative propagation. A Grower's Guide. London: B. T. Batsford
Ltd. p 99-120.
Thurman D. (1981). Mechanism of metal tolerance in higher plants. In: Lepp N.W.,
editor. Effect of Heavy Metal Pollution on Plants (Volume 1). London: Applied Science
Publishers.
Tong Y.P., Kneer R., and Zhu Y.G. (2004). Vacuolar compartmentalization: a
second-generation approach to engineering plants for phytoremediation. Trends in Plant
Science 9: 7-9.
Tripathi A.K., and Tripathi S. (1999). Changes in same physiological and
biochemical characters in Albizia lebbek as bio-indicators of heavy metal toxicity.
Journal of Environmental Biology 20: 93-98.
Vandevivere P., Hammes F., Verstraete W., Feijtel T., and Schowanek D. (2001).
Metal decontamination of soil, sediment, and sewage sludge by means of transition
metal chelant [S,S]-EDDS. Journal of Environmental Engineering 127: 802-811.
Vassil A.D., Kapulnik Y., Raskin I., and Salt D.E. (1998). The role of EDTA in lead
transport and accumulation by Indian mustard. Plant Physiology 117: 447-453.
Velisek J.N., and Cejpek K. (2005). Biosynthesis of food constituents: Saccharides.2.
Polysaccharides - a review. Czech Journal of Food Sciences 23: 173-183.
Verma S., and Dubey R.S. (2003). Lead toxicity induces lipid peroxidation and alters
the activities of antioxidant enzymes in growing rice plants. Plant Science 164: 645-
655.
Wang R., Liao X.P., and Shi B. (2005). Adsorption behaviors of platnium(II) and
palladium(II) on collagen fiber immobilized bayberry tannin. Industrial and Engineering
Chemistry Research 44: 4221-4226.
Waterman P.G., and Mole S. (1994). Analysis of Phenolic Plant Metabolites. Oxford
and Northampton: Blackwell Scientific Publications. 235 p.

283
Watmough S.A., and Dickinson N.M. (1996). Variability of metal resistance in Acer
pseudoplatanus L (sycamore) callus tissue of different origins. Environmental and
Experimental Botany 36: 293-302.
Watmough S.A., and Hutchinson T.C. (1998). Relationship between soil metal
contamination and metal resistance of callus established from mature red maple.
Canadian Journal of Forest Research 28: 1073-1077.
Weigel D., and Glazebrook J. (2002). Arabidopsis: A Laboratory Manual. New York:
Cold Springer Harbor Laboratory Press. p 75-77.
Wenzel W.W., Unterbrunner R., Sommer P., and Sacco P. (2003). Chelate-assisted
phytoextraction using canola (Brassica napus L.) in outdoors pot and lysimeter
experiments. Plant and Soil 249: 83-96.
White P.J., Whiting S.N., Baker A.J.M., and Broadley M.R. (2002). Does zinc move
apoplastically to the xylem in roots of Thlaspi caerulescens? New Phytologist 153: 201-
207.
Wierzbicka M. (1987). Lead translocation and localization in Allium cepa Roots.
Canadian Journal of Botany 65: 1851-1860.
Wierzbicka M. (1995). How lead loses its toxicity to plants. Acta Societatis
Botanicorum Poloniae 64: 81-90.
Wierzbicka M. (1998). Lead in the apoplast of Allium cepa L. root tips - ultrastructural
studies. Plant Science 133: 105-119.
Wojtaszek P. (1997). Oxidative burst: an early expert plant response to pathogen
infection. Biochemical Journal 322: 681-692.
Wu J., Hsu F.C., and Cunningham S.D. (1999). Chelate-assisted lead
phytoextraction: Lead availability, uptake, and translocation constraints. Environmental
Science and Technology 33: 1898-1904.
Wulff E.G., Torres S., and Vigil E.G. (2002). Protocol for DNA extraction from
potato tubers. Plant Molecular Biology Reporter 20: 187a-187e.
284
Xie T., and Marshall W.D. (2001). Approaches to soil remediation by complexometric
extraction of metal contaminants with regeneration of reagents. Journal of
Environmental Monitoring 3: 411-416.
Ximenes F. (1998). Tannins. Online. [Available].
www.anu.edu.au/Forestry/wood/nwpfp/tannins/tannins.html.
Xiong Z.T., Zhao F., and Li M.J. (2006). Lead toxicity in Brassica pekinensis rupr.:
Effect on nitrate assimilation and growth. Environmental Toxicology 21: 147-153.
Yang X., Feng Y., He Z.L., and Stoffella P.J. (2005). Molecular mechanisms of heavy
metal hyperaccumulation and phytoremediation. Journal of Trace Elements in Medicine
and Biology 18: 339-353.
Yang X., Long X., Ye H., He Z., Calvert D., and Stofella P. (2004). Cadmium
tolerance and hyperaccumulation in a new zinc-hyperaccumulating plant species. Plant
and Soil 259: 181-189.
Yang Y.Y., Jung J.Y., Song W.Y., Suh H.S., and Lee Y. (2000). Identification of rice
varieties with high tolerance or sensitivity to lead and characterization of the mechanism
of tolerance. Plant Physiology 124: 1019-1026.
Yu Q., Osborne L.D., and Rengel Z. (1999). Increased tolerance to Mn deficiency in
transgenic tobacco overproducing superoxide dismutase. Annals of Botany 84: 543-547.
Zheljazkov V., and Fair P. (1996). Study of the effect of highly heavy metal polluted
soils on metal uptake and distribution in plants from genera Artemisa, Draccocephalum,
Inula, Ruta and Symphytum. Acta Horticulturae 426: 397-417.
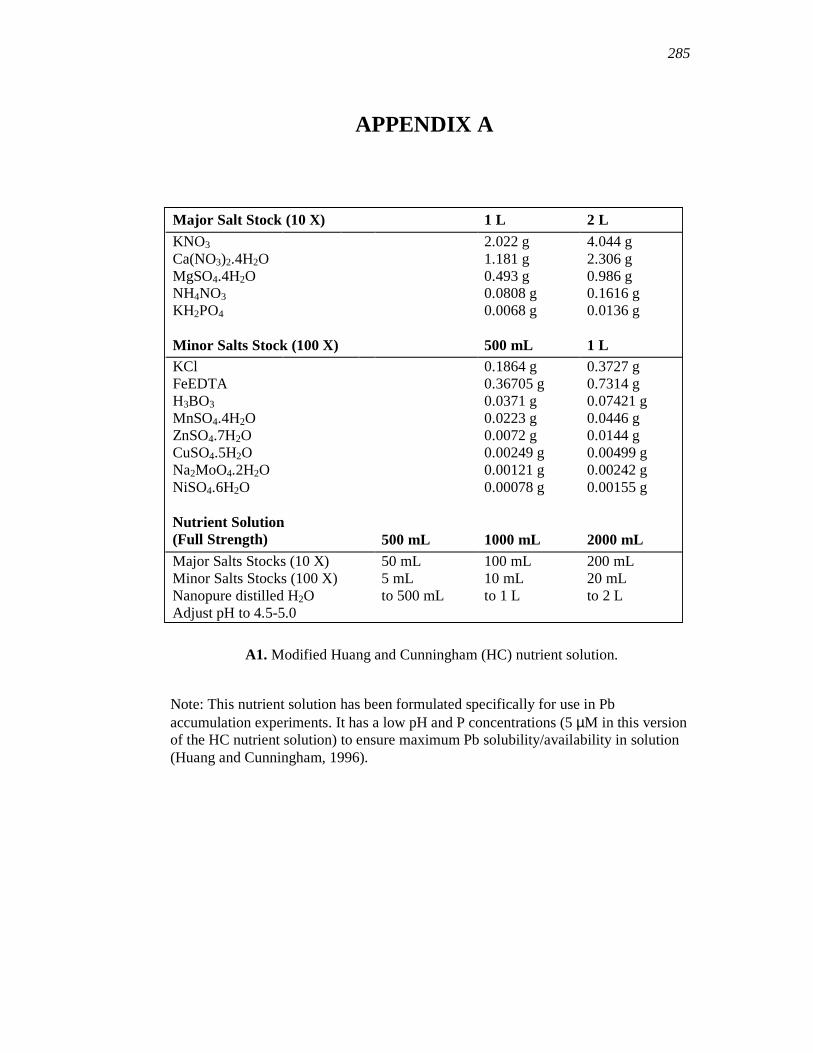
285
APPENDIX A
Major Salt Stock (10 X) 1 L 2 L
KNO3 2.022 g 4.044 g Ca(NO3)2.4H2O 1.181 g 2.306 g MgSO4.4H2O 0.493 g 0.986 g NH4NO3 0.0808 g 0.1616 g KH2PO4 0.0068 g 0.0136 g Minor Salts Stock (100 X) 500 mL 1 L
KCl 0.1864 g 0.3727 g FeEDTA 0.36705 g 0.7314 g H3BO3 0.0371 g 0.07421 g MnSO4.4H2O 0.0223 g 0.0446 g ZnSO4.7H2O 0.0072 g 0.0144 g CuSO4.5H2O 0.00249 g 0.00499 g Na2MoO4.2H2O 0.00121 g 0.00242 g NiSO4.6H2O 0.00078 g 0.00155 g
Nutrient Solution
(Full Strength) 500 mL 1000 mL 2000 mL
Major Salts Stocks (10 X) 50 mL 100 mL 200 mL Minor Salts Stocks (100 X) 5 mL 10 mL 20 mL Nanopure distilled H2O to 500 mL to 1 L to 2 L Adjust pH to 4.5-5.0
A1. Modified Huang and Cunningham (HC) nutrient solution.
Note: This nutrient solution has been formulated specifically for use in Pb
accumulation experiments. It has a low pH and P concentrations (5 µM in this version of the HC nutrient solution) to ensure maximum Pb solubility/availability in solution (Huang and Cunningham, 1996).
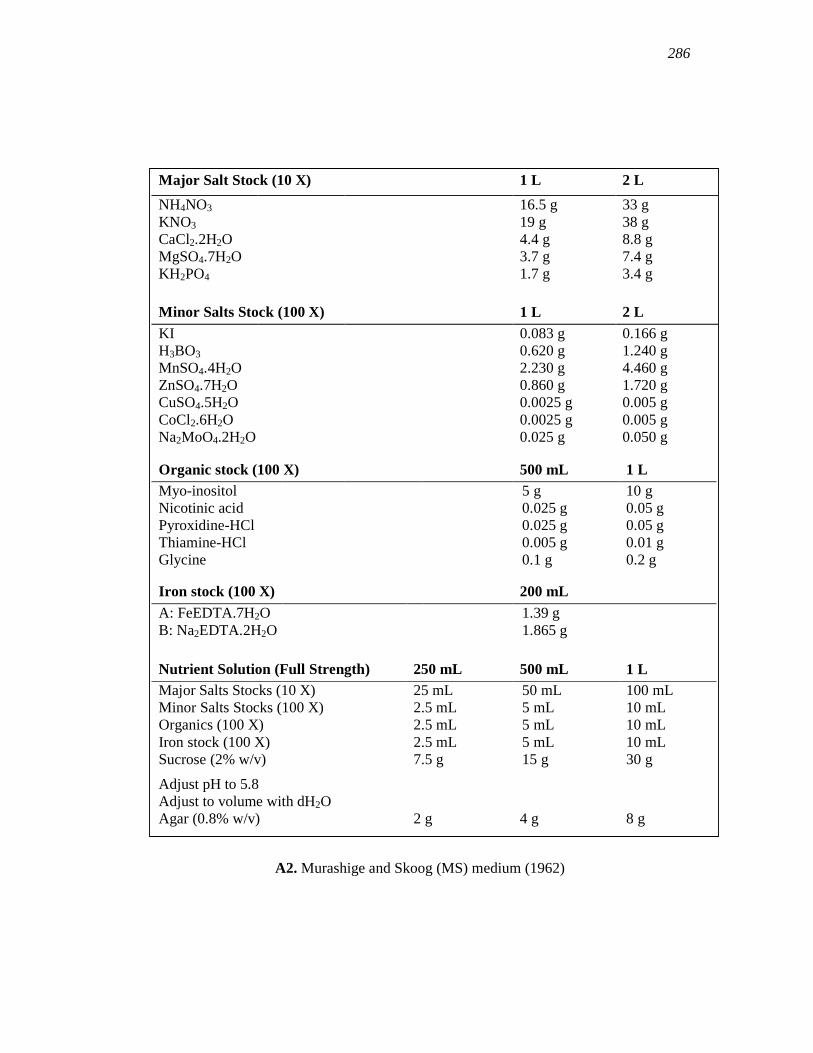
286
Major Salt Stock (10 X) 1 L 2 L
NH4NO3 16.5 g 33 g KNO3 19 g 38 g CaCl2.2H2O 4.4 g 8.8 g MgSO4.7H2O 3.7 g 7.4 g KH2PO4 1.7 g 3.4 g
Minor Salts Stock (100 X) 1 L 2 L
KI 0.083 g 0.166 g H3BO3 0.620 g 1.240 g MnSO4.4H2O 2.230 g 4.460 g ZnSO4.7H2O 0.860 g 1.720 g CuSO4.5H2O 0.0025 g 0.005 g CoCl2.6H2O 0.0025 g 0.005 g Na2MoO4.2H2O 0.025 g 0.050 g
Organic stock (100 X) 500 mL 1 L
Myo-inositol 5 g 10 g Nicotinic acid 0.025 g 0.05 g Pyroxidine-HCl 0.025 g 0.05 g Thiamine-HCl 0.005 g 0.01 g Glycine 0.1 g 0.2 g
Iron stock (100 X) 200 mL
A: FeEDTA.7H2O 1.39 g B: Na2EDTA.2H2O 1.865 g
Nutrient Solution (Full Strength) 250 mL 500 mL 1 L
Major Salts Stocks (10 X) 25 mL 50 mL 100 mL Minor Salts Stocks (100 X) 2.5 mL 5 mL 10 mL Organics (100 X) 2.5 mL 5 mL 10 mL Iron stock (100 X) 2.5 mL 5 mL 10 mL Sucrose (2% w/v) 7.5 g 15 g 30 g
Adjust pH to 5.8 Adjust to volume with dH2O Agar (0.8% w/v) 2 g 4 g 8 g
A2. Murashige and Skoog (MS) medium (1962)
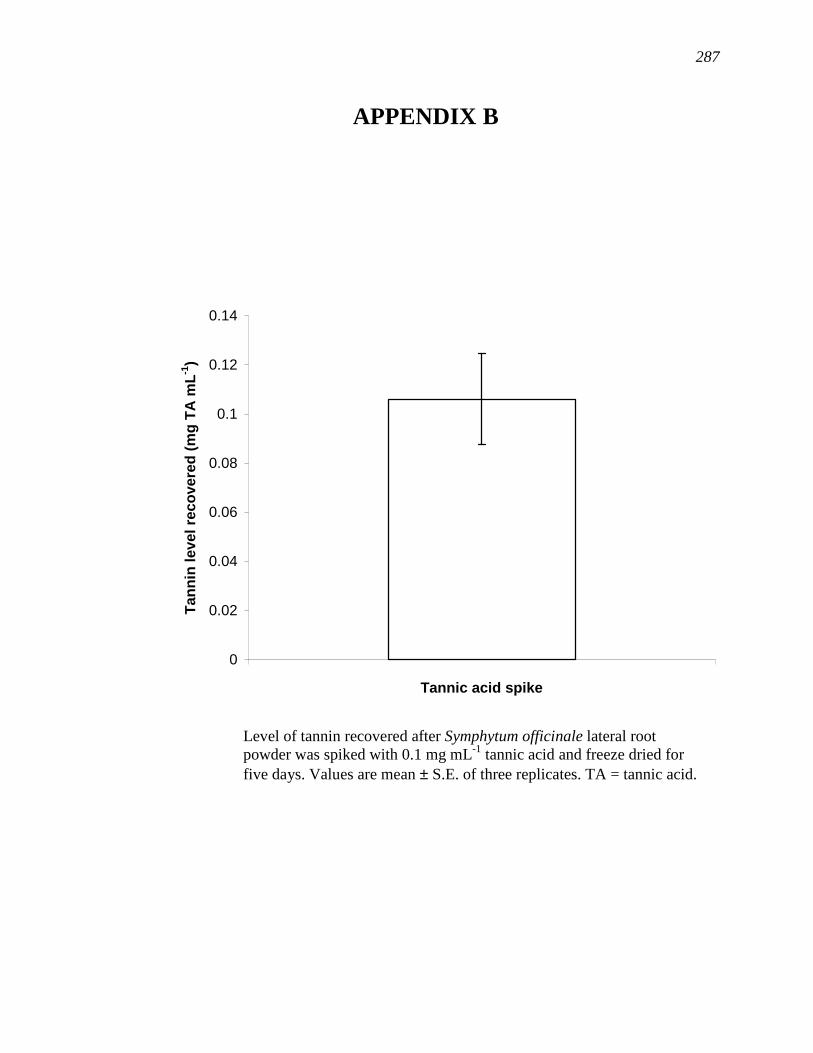
287
APPENDIX B
Level of tannin recovered after Symphytum officinale lateral root powder was spiked with 0.1 mg mL-1 tannic acid and freeze dried for
five days. Values are mean ± S.E. of three replicates. TA = tannic acid.
0
0.02
0.04
0.06
0.08
0.1
0.12
0.14
Tannic acid spike
Tan
nin
level
reco
vere
d (
mg
TA
mL
-1)
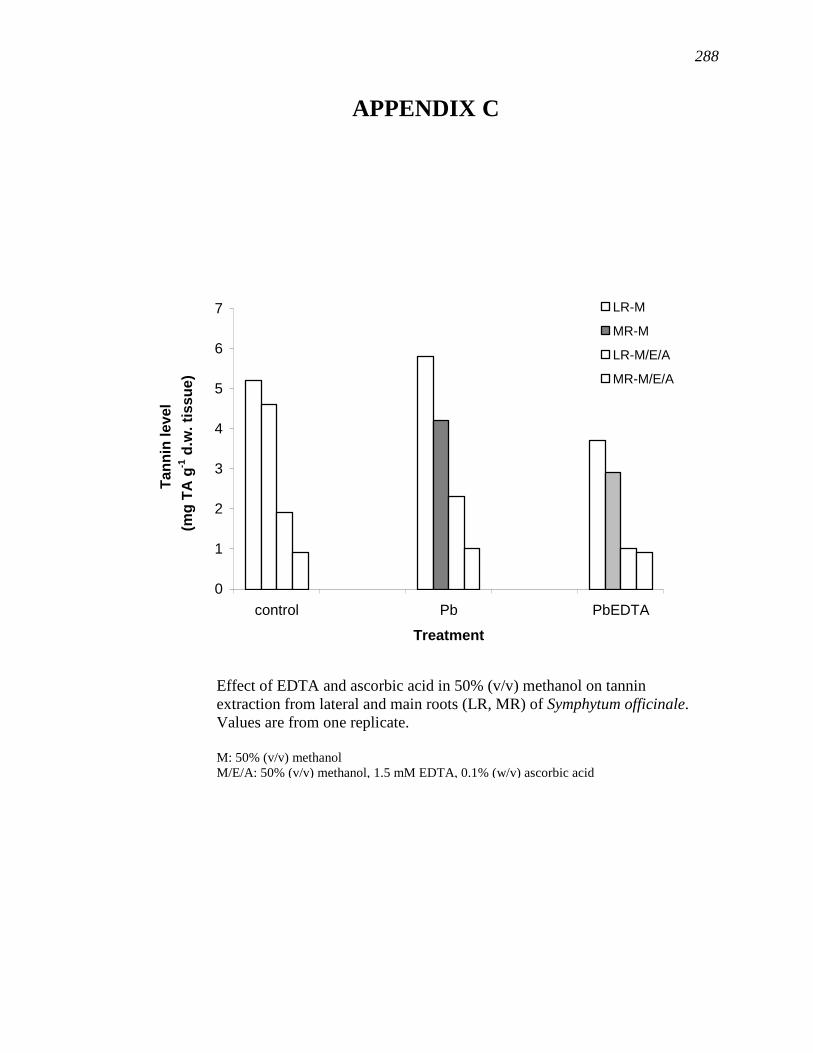
287
APPENDIX C
0
1
2
3
4
5
6
7
control Pb PbEDTA
Treatment
Tan
nin
level
(mg
TA
g-1
d.w
. ti
ssu
e)
..
LR-M
MR-M
LR-M/E/A
MR-M/E/A
Effect of EDTA and ascorbic acid in 50% (v/v) methanol on tannin extraction from lateral and main roots (LR, MR) of Symphytum officinale. Values are from one replicate. M: 50% (v/v) methanol M/E/A: 50% (v/v) methanol, 1.5 mM EDTA, 0.1% (w/v) ascorbic acid
288
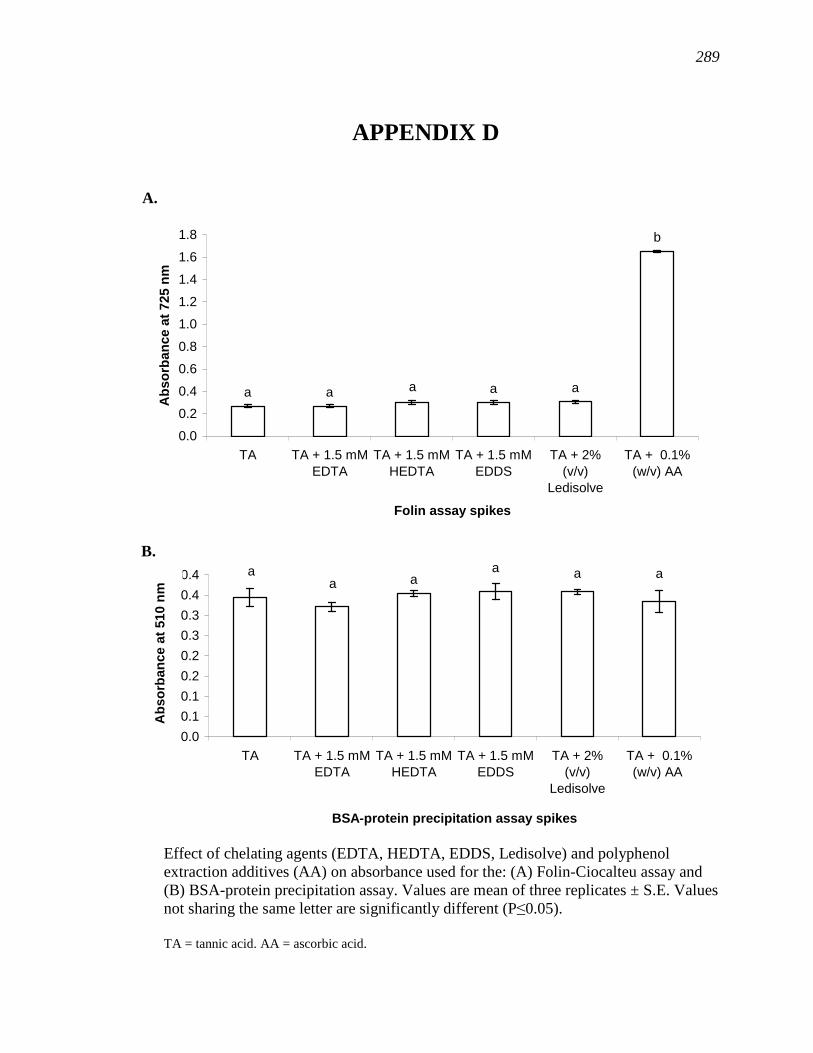
289
APPENDIX D
a aaaa
a
0.0
0.1
0.1
0.2
0.2
0.3
0.3
0.4
0.4
TA TA + 1.5 mM
EDTA
TA + 1.5 mM
HEDTA
TA + 1.5 mM
EDDS
TA + 2%
(v/v)
Ledisolve
TA + 0.1%
(w/v) AA
BSA-protein precipitation assay spikes
Ab
so
rban
ce a
t 510 n
m
b
aaaaa
0.0
0.2
0.4
0.6
0.8
1.0
1.2
1.4
1.6
1.8
TA TA + 1.5 mM
EDTA
TA + 1.5 mM
HEDTA
TA + 1.5 mM
EDDS
TA + 2%
(v/v)
Ledisolve
TA + 0.1%
(w/v) AA
Folin assay spikes
Ab
so
rban
ce a
t 725 n
m
Effect of chelating agents (EDTA, HEDTA, EDDS, Ledisolve) and polyphenol extraction additives (AA) on absorbance used for the: (A) Folin-Ciocalteu assay and (B) BSA-protein precipitation assay. Values are mean of three replicates ± S.E. Values not sharing the same letter are significantly different (P≤0.05). TA = tannic acid. AA = ascorbic acid.
A.
B.
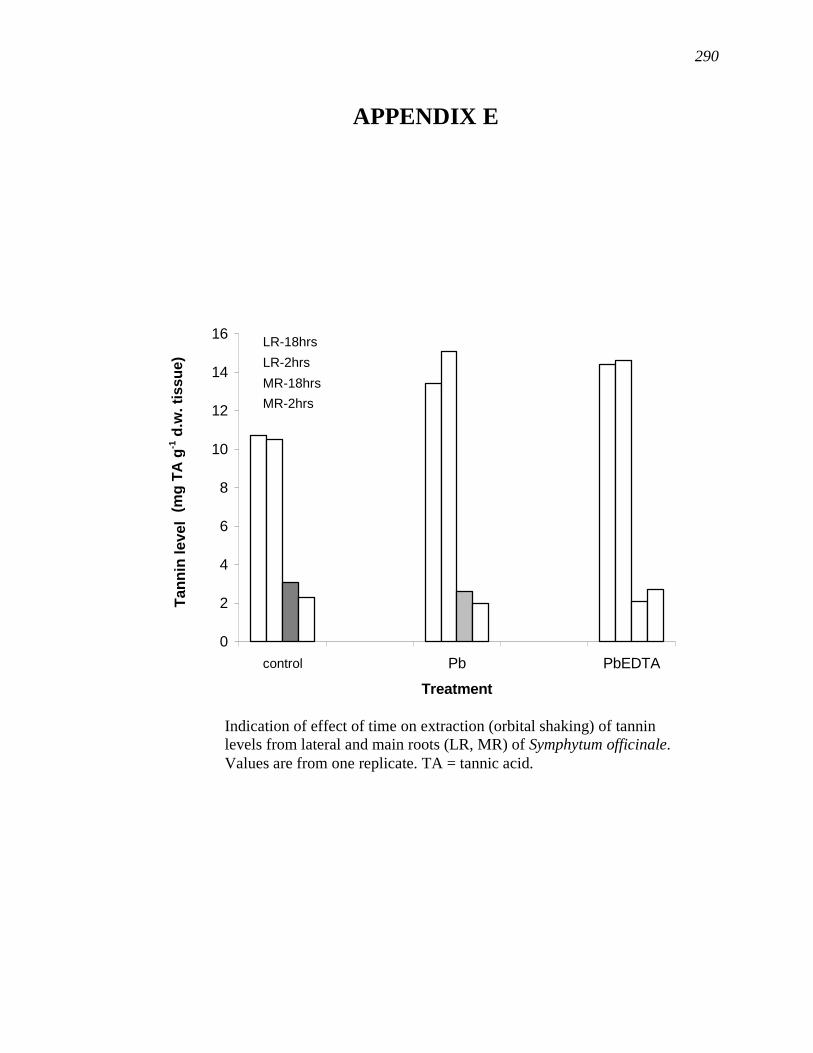
287
APPENDIX E
0
2
4
6
8
10
12
14
16
Control Pb PbEDTA
Treatment
Tan
nin
level (m
g T
A/g
d.w
. ti
ssu
e)
YLR-18 hrs
YLR-2 hrs
YMR 18 hrs
YMR-2 hrs
Indication of effect of time on extraction (orbital shaking) of tannin levels from lateral and main roots (LR, MR) of Symphytum officinale. Values are from one replicate. TA = tannic acid.
LR-18hrs
LR-2hrs
MR-18hrs
MR-2hrs
control
290
(mg
TA
g-1 d
.w. ti
ssu
e)
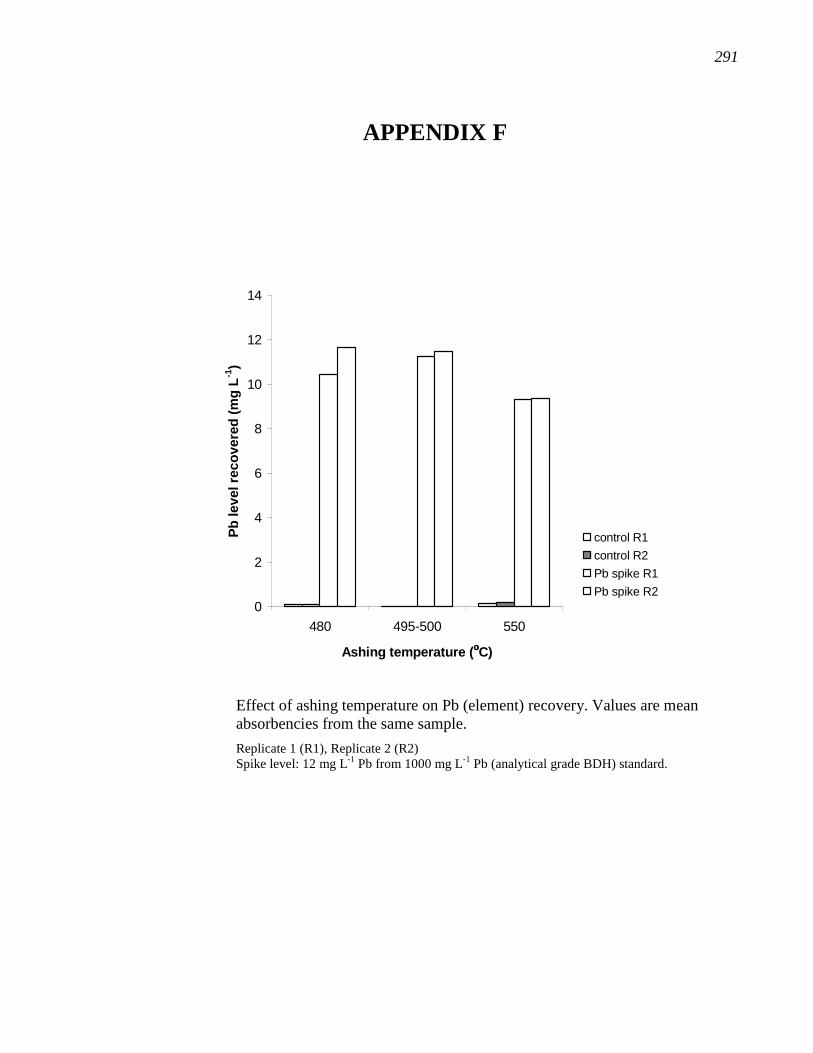
291
APPENDIX F
0
2
4
6
8
10
12
14
480 495-500 550
Ashing temperature (οοοο
C)
Pb
le
ve
l re
co
ve
red
(m
g L
-1)
control R1
control R2
Pb spike R1
Pb spike R2
Effect of ashing temperature on Pb (element) recovery. Values are mean absorbencies from the same sample.
Replicate 1 (R1), Replicate 2 (R2) Spike level: 12 mg L-1 Pb from 1000 mg L-1 Pb (analytical grade BDH) standard.
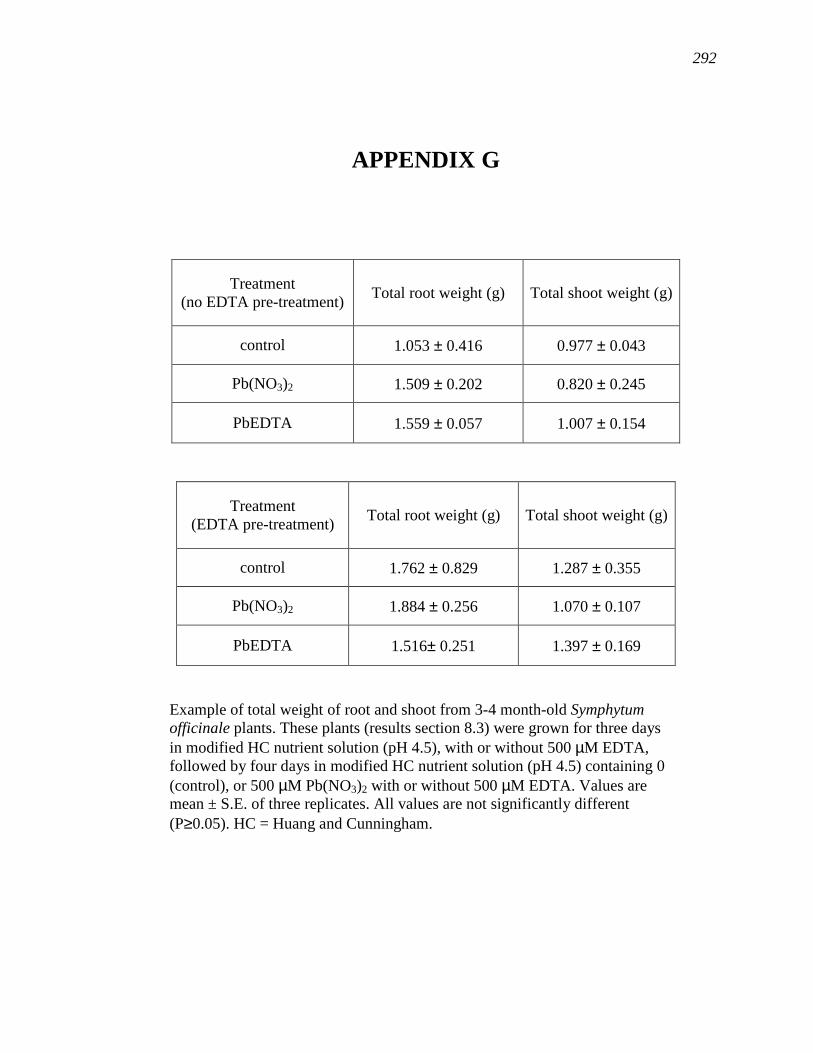
Chapter 3 - Results and discussion 307
APPENDIX G
Treatment (no EDTA pre-treatment)
Total root weight (g) Total shoot weight (g)
control 1.053 ± 0.416 0.977 ± 0.043
Pb(NO3)2 1.509 ± 0.202 0.820 ± 0.245
PbEDTA 1.559 ± 0.057 1.007 ± 0.154
Treatment (EDTA pre-treatment)
Total root weight (g) Total shoot weight (g)
control 1.762 ± 0.829 1.287 ± 0.355
Pb(NO3)2 1.884 ± 0.256 1.070 ± 0.107
PbEDTA 1.516± 0.251 1.397 ± 0.169
Example of total weight of root and shoot from 3-4 month-old Symphytum
officinale plants. These plants (results section 8.3) were grown for three days
in modified HC nutrient solution (pH 4.5), with or without 500 µM EDTA, followed by four days in modified HC nutrient solution (pH 4.5) containing 0
(control), or 500 µM Pb(NO3)2 with or without 500 µM EDTA. Values are mean ± S.E. of three replicates. All values are not significantly different
(P≥0.05). HC = Huang and Cunningham.
292

Chapter 3 - Results and discussion 221
APPENDIX H
APPENDIX I
b
bb
a
0
0.02
0.04
0.06
0.08
0.1
0.12
0.14
0 0.1 0.25 0.5
% Triton-X
SO
D a
cti
vit
y (
un
its/m
g f
.w.)
Effect of Triton X-100 concentrations in extraction Buffer A on SOD activity in blade tissue of in vitro grown Symphytum officinale. Values are means ± S.E. of three replicates. Values not sharing the same letter are significantly different (P≤0.05).
Composition of buffer: Buffer A: 100 mM potassium phosphate + 1%(w/v) PVPP, pH 7.8.
293
(un
its
mg
-1 f
.w.)
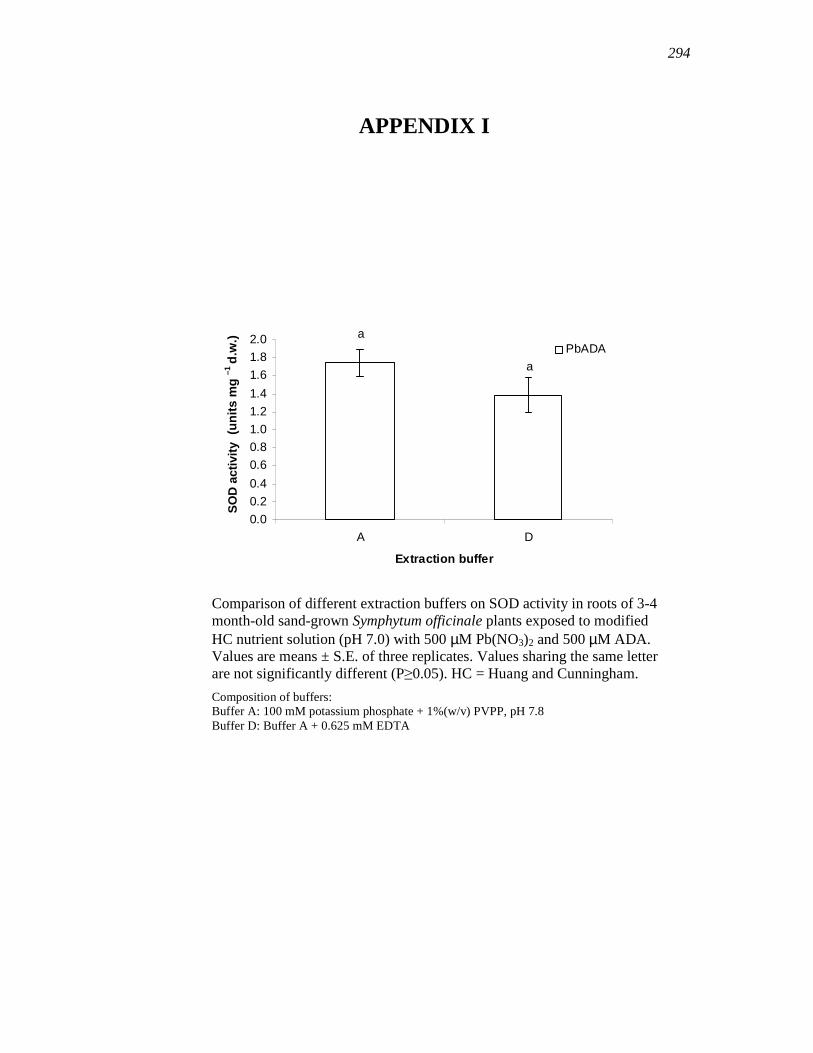
Chapter 3 - Results and discussion 221
APPENDIX I
a
a
0.0
0.2
0.4
0.6
0.8
1.0
1.2
1.4
1.6
1.8
2.0
A D
Extraction buffer
SO
D a
cti
vit
y (
un
its/m
g d
.w.)
PbADA
Comparison of different extraction buffers on SOD activity in roots of 3-4 month-old sand-grown Symphytum officinale plants exposed to modified
HC nutrient solution (pH 7.0) with 500 µM Pb(NO3)2 and 500 µM ADA. Values are means ± S.E. of three replicates. Values sharing the same letter are not significantly different (P≥0.05). HC = Huang and Cunningham.
Composition of buffers: Buffer A: 100 mM potassium phosphate + 1%(w/v) PVPP, pH 7.8 Buffer D: Buffer A + 0.625 mM EDTA
294
(un
its m
g –
1 d
.w.)
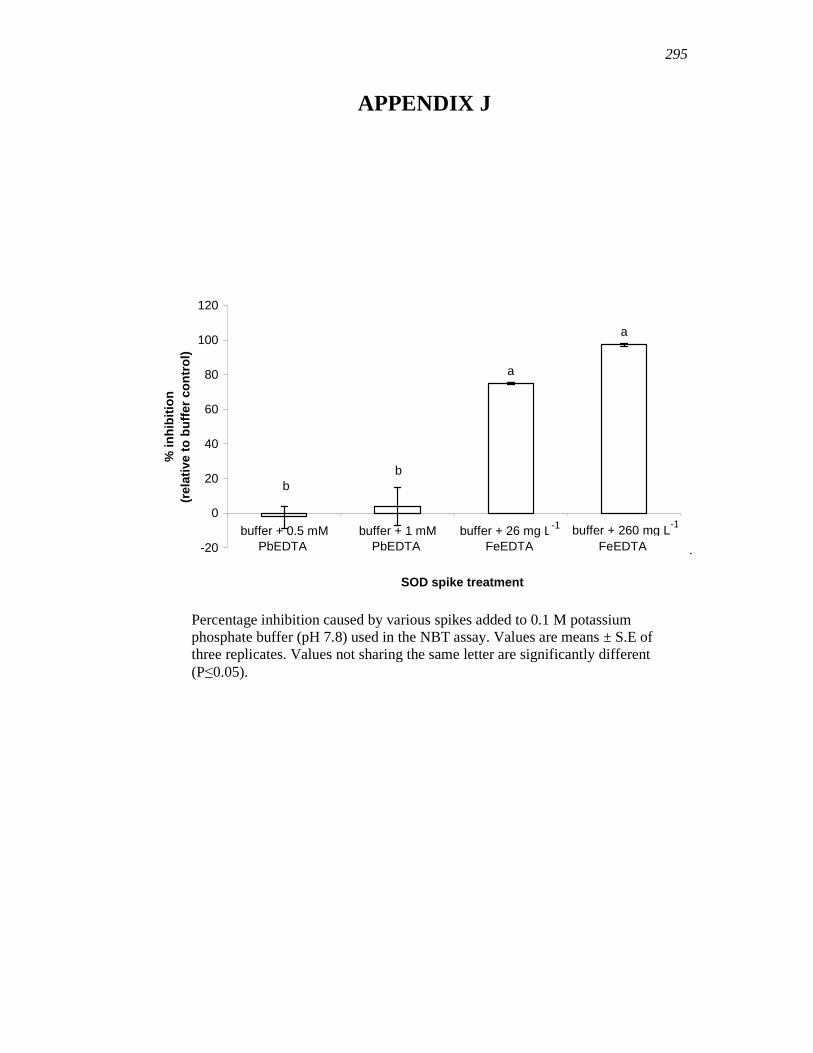
Chapter 3 - Results and discussion 221
APPENDIX J
Percentage inhibition caused by various spikes added to 0.1 M potassium phosphate buffer (pH 7.8) used in the NBT assay. Values are means ± S.E of three replicates. Values not sharing the same letter are significantly different (P≤0.05).
295
b
b
a
a
-20
0
20
40
60
80
100
120
buffer + 0.5 mM
PbEDTA
buffer + 1 mM
PbEDTA
buffer + 26 mg L-1
FeEDTA
buffer + 260 mg L-1
FeEDTA
SOD spike treatment
% i
nh
ibit
ion
(rela
tive t
o b
uff
er
co
ntr
ol)
-1 buffer + 260 mg L-1
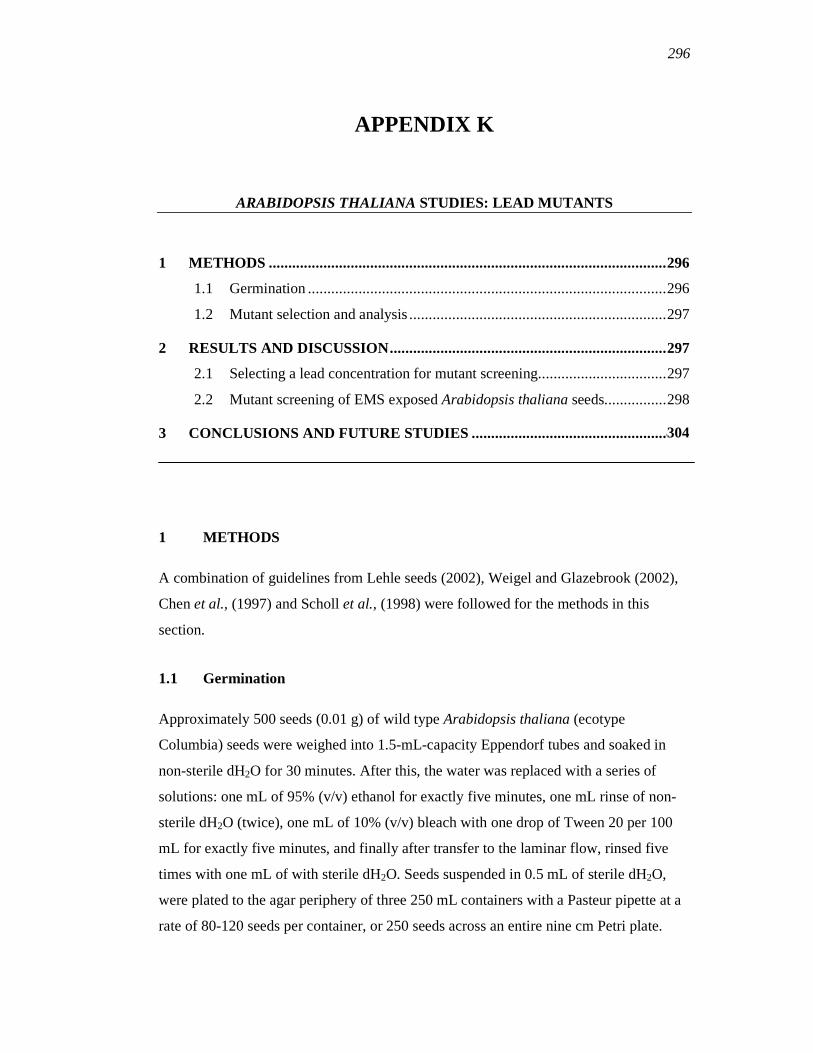
296
APPENDIX K
ARABIDOPSIS THALIANA STUDIES: LEAD MUTANTS
1 METHODS ......................................................................................................296
1.1 Germination ............................................................................................296
1.2 Mutant selection and analysis ..................................................................297
2 RESULTS AND DISCUSSION.......................................................................297
2.1 Selecting a lead concentration for mutant screening.................................297
2.2 Mutant screening of EMS exposed Arabidopsis thaliana seeds................298
3 CONCLUSIONS AND FUTURE STUDIES ..................................................307
1 METHODS
A combination of guidelines from Lehle seeds (2002), Weigel and Glazebrook (2002),
Chen et al., (1997) and Scholl et al., (1998) were followed for the methods in this
section.
1.1 Germination
Approximately 500 seeds (0.01 g) of wild type Arabidopsis thaliana (ecotype
Columbia) seeds were weighed into 1.5-mL-capacity Eppendorf tubes and soaked in
non-sterile dH2O for 30 minutes. After this, the water was replaced with a series of
solutions: one mL of 95% (v/v) ethanol for exactly five minutes, one mL rinse of non-
sterile dH2O (twice), one mL of 10% (v/v) bleach with one drop of Tween 20 per 100
mL for exactly five minutes, and finally after transfer to the laminar flow, rinsed five
times with one mL of with sterile dH2O. Seeds suspended in 0.5 mL of sterile dH2O,
were plated to the agar periphery of three 250 mL containers with a Pasteur pipette at a
rate of 80-120 seeds per container, or 250 seeds across an entire nine cm Petri plate.
3304
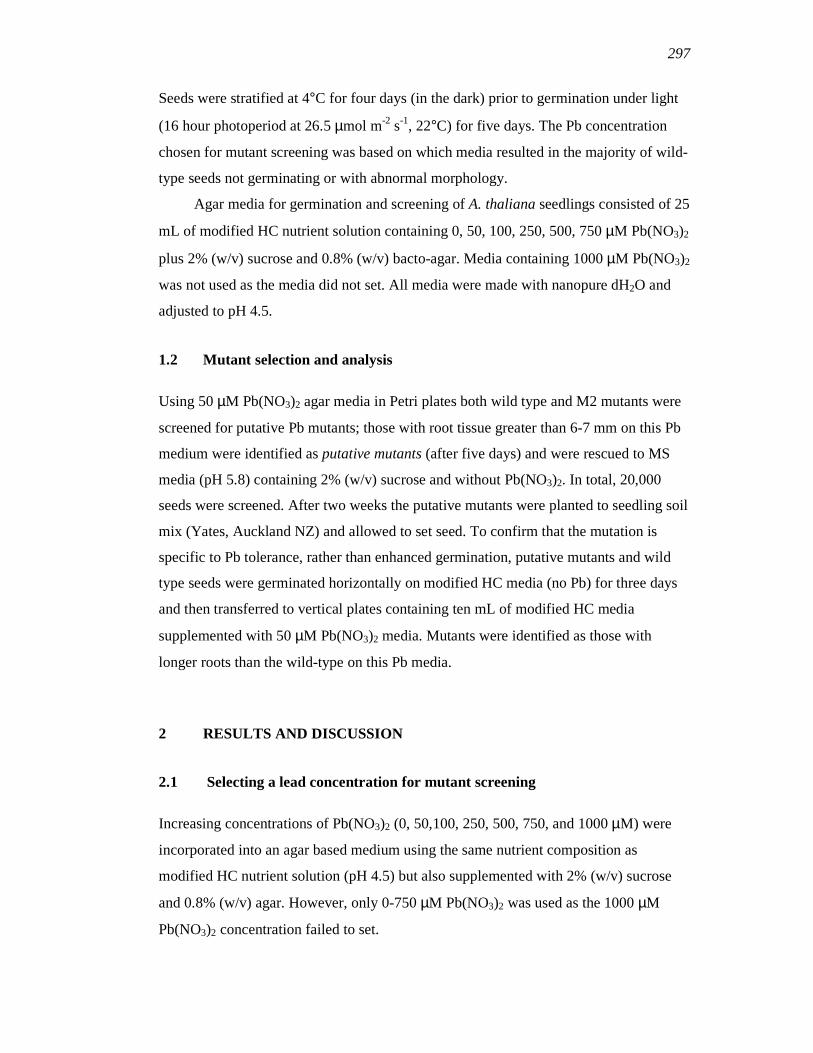
297
Seeds were stratified at 4°C for four days (in the dark) prior to germination under light
(16 hour photoperiod at 26.5 µmol m-2 s-1, 22°C) for five days. The Pb concentration
chosen for mutant screening was based on which media resulted in the majority of wild-
type seeds not germinating or with abnormal morphology.
Agar media for germination and screening of A. thaliana seedlings consisted of 25
mL of modified HC nutrient solution containing 0, 50, 100, 250, 500, 750 µM Pb(NO3)2
plus 2% (w/v) sucrose and 0.8% (w/v) bacto-agar. Media containing 1000 µM Pb(NO3)2
was not used as the media did not set. All media were made with nanopure dH2O and
adjusted to pH 4.5.
1.2 Mutant selection and analysis
Using 50 µM Pb(NO3)2 agar media in Petri plates both wild type and M2 mutants were
screened for putative Pb mutants; those with root tissue greater than 6-7 mm on this Pb
medium were identified as putative mutants (after five days) and were rescued to MS
media (pH 5.8) containing 2% (w/v) sucrose and without Pb(NO3)2. In total, 20,000
seeds were screened. After two weeks the putative mutants were planted to seedling soil
mix (Yates, Auckland NZ) and allowed to set seed. To confirm that the mutation is
specific to Pb tolerance, rather than enhanced germination, putative mutants and wild
type seeds were germinated horizontally on modified HC media (no Pb) for three days
and then transferred to vertical plates containing ten mL of modified HC media
supplemented with 50 µM Pb(NO3)2 media. Mutants were identified as those with
longer roots than the wild-type on this Pb media.
2 RESULTS AND DISCUSSION
2.1 Selecting a lead concentration for mutant screening
Increasing concentrations of Pb(NO3)2 (0, 50,100, 250, 500, 750, and 1000 µM) were
incorporated into an agar based medium using the same nutrient composition as
modified HC nutrient solution (pH 4.5) but also supplemented with 2% (w/v) sucrose
and 0.8% (w/v) agar. However, only 0-750 µM Pb(NO3)2 was used as the 1000 µM
Pb(NO3)2 concentration failed to set.

298
Root growth inhibition in wild type A. thaliana seeds increased with Pb
concentration in agar medium. After five days, root growth and germination was almost
or completely impeded with concentrations above 100 µM Pb(NO3)2. At 50 µM
Pb(NO3)2 root growth was reduced by 68%, but only by 5% for stem length (P≤0.05)
(Table K). Pb(NO3)2 at 50 µM was selected for mutant screening as it allowed visibly
perturbed germination and root growth to be visualized for mutant selection based on
root growth inhibition.
2.2 Mutant screening of EMS exposed Arabidopsis thaliana seeds
Mutants can be identified by selecting seedlings with root lengths greater than the wild
type seedlings on the same media. How much longer should the roots be? This is
defined by the tolerance index. According to Chen et al., (1997), the tolerance index
(TI) of A. thaliana to Pb(NO3)2 is defined by:
TI =
In this case the TI index was an average of 0.322. To achieve a mutant TI index of 0.5,
as suggested by Chen et al., (1997), putative mutants with a root length of between 6-7
mm (if wild type root lengths were 12.10 mm on control medium) or relative to the root
length of EMS seeds on control media (without Pb).
Over 20,000 seeds were screened for Pb mutants using root length as the
screening tool. Three putative mutants were identified and rescued for seed production.
Only one of the three putative mutants set seed. These putative mutant seeds only
germinated faster than wild type seeds (Plates K1 and 2); upon transplantation to
vertical root growth plates, root length of these putative mutants were the same as wild
type seedlings on the 50 µM Pb(NO3)2 media (Plate K3). Thus of the 20,000 seeds
screened, no true mutants could be identified.
It was interesting to note that roots of Pb-germinated seedlings followed a
different morphological growth pattern compared with that of the control (no Pb) (after
seven days, outside the screening period); Pb-germinated seedlings produced a stunted
tap root with lateral roots; the control plants (no Pb) only produced a tap root (Plate K4
and 5, Figure K1 and 2). This may have some bearing on the effectiveness of the mutant
selection regime (see more below).
root length of wild type A. thaliana grown on media with Pb
root length of wild type A. thaliana without Pb

299
Pb(NO3)2 level
(µµµµM)
Root length
(mm)
Stem length
(mm)
0 12.10 ± 1.17a 1.95 ± 0.44a
50 3.90 ± 0.33b 1.85 ± 0.53a
100 ≤1 ≤1
250 ≤1 ≤0.5
500 - -
750 - -
Table K. Effect of Pb concentration on root length of Arabidopsis thaliana
seedings after five days in modified HC nutrient agar medium (pH 4.5)
supplemented with 2% (w/v) sucrose, 0.8% (w/v) agar and various
concentrations of Pb(NO3)2. Values are means ± S.E. of ten replicates. Values
not sharing the same letter are statistically different from each other (P≤0.05).
Statistics can not be tabulated for 100-750 µM Pb(NO3)2 as differences in
values were close to zero. HC = Huang and Cunningham.

300
Plate K. Comparison of putative mutant with wild-type seed germination and
root growth.
1. Wild-type seedlings (control) after three days on modified HC
nutrient agar (pH 4.5) supplemented with 2% (w/v) sucrose and 0.8%
(w/v) agar.
2. Putative mutant seedlings after three days on modified HC nutrient
agar (pH 4.5) supplemented with 2% (w/v) sucrose and 0.8% (w/v)
agar.
3. Five days after transfer to vertically-placed plates containing
modified HC nutrient agar (pH 4.5) supplemented with 50 µM
Pb(NO3)2, 2% (w/v) sucrose and 0.8% (w/v) agar. Wild-type
seedlings (control) were placed on same plate; sections that are not
indicated are seedlings from the putative mutant.
HC = Huang and Cunningham.
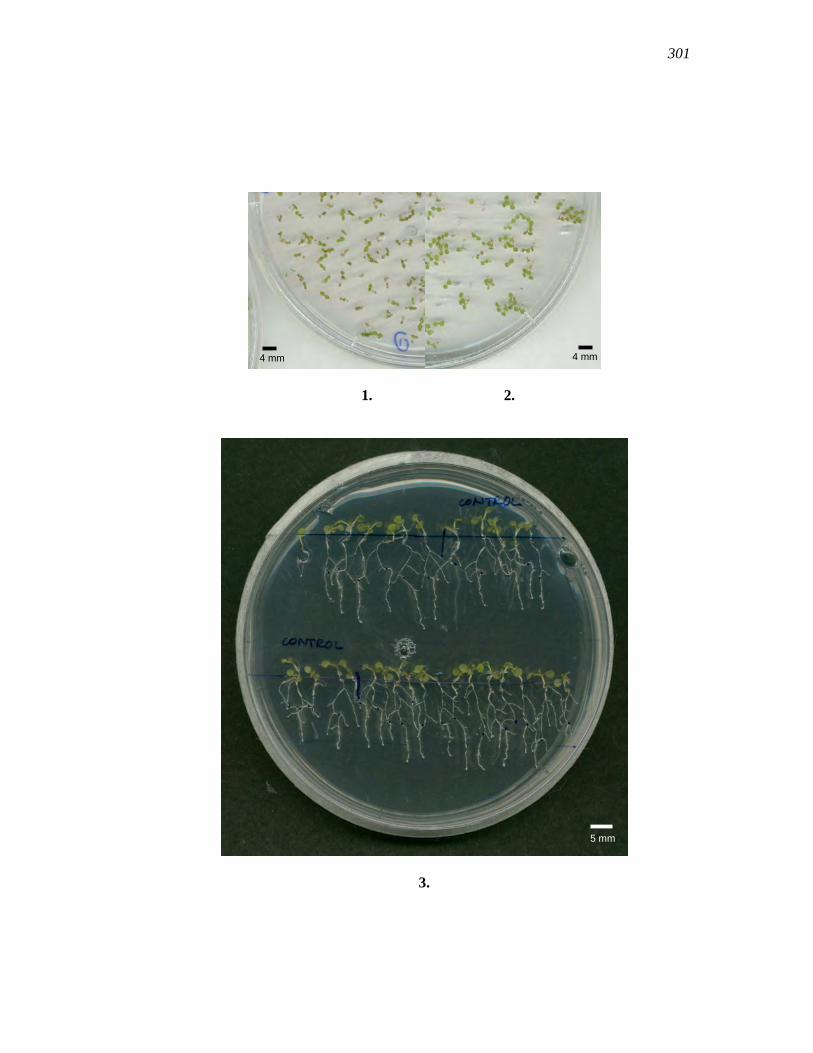
301
1. 2.
3.
4 mm 4 mm
5 mm
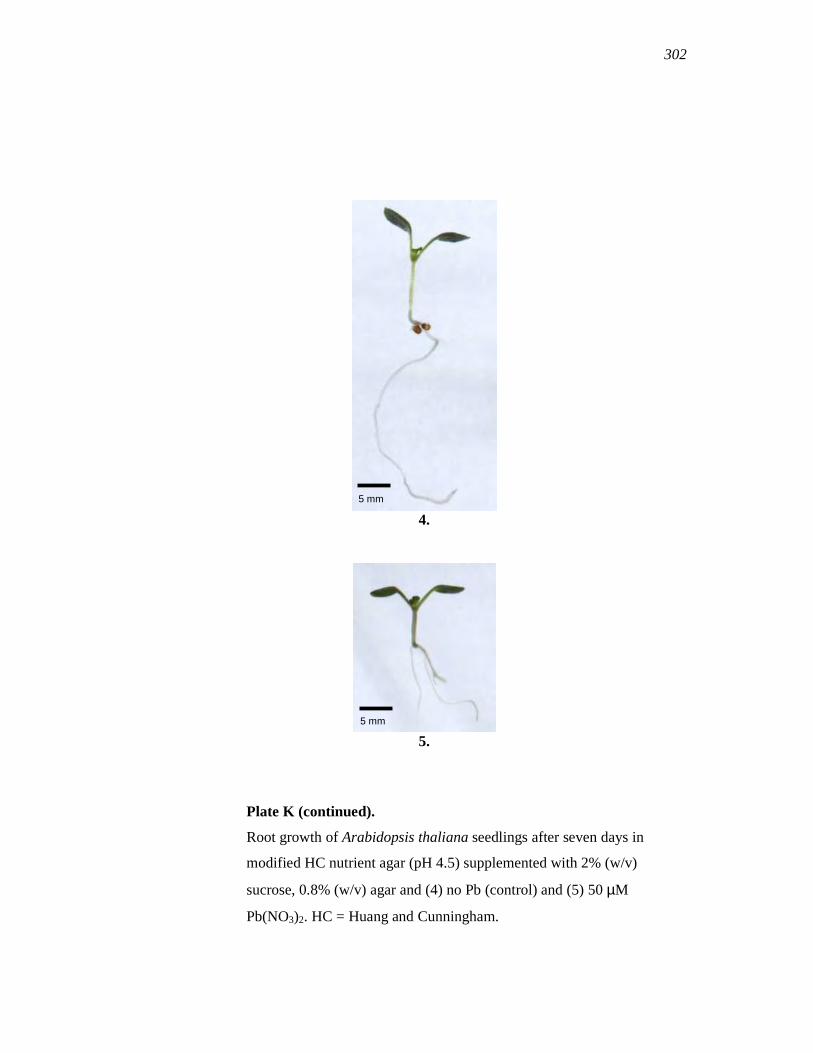
305
4.
5.
Plate K (continued).
Root growth of Arabidopsis thaliana seedlings after seven days in
modified HC nutrient agar (pH 4.5) supplemented with 2% (w/v)
sucrose, 0.8% (w/v) agar and (4) no Pb (control) and (5) 50 µM
Pb(NO3)2. HC = Huang and Cunningham.
5 mm
5 mm
302
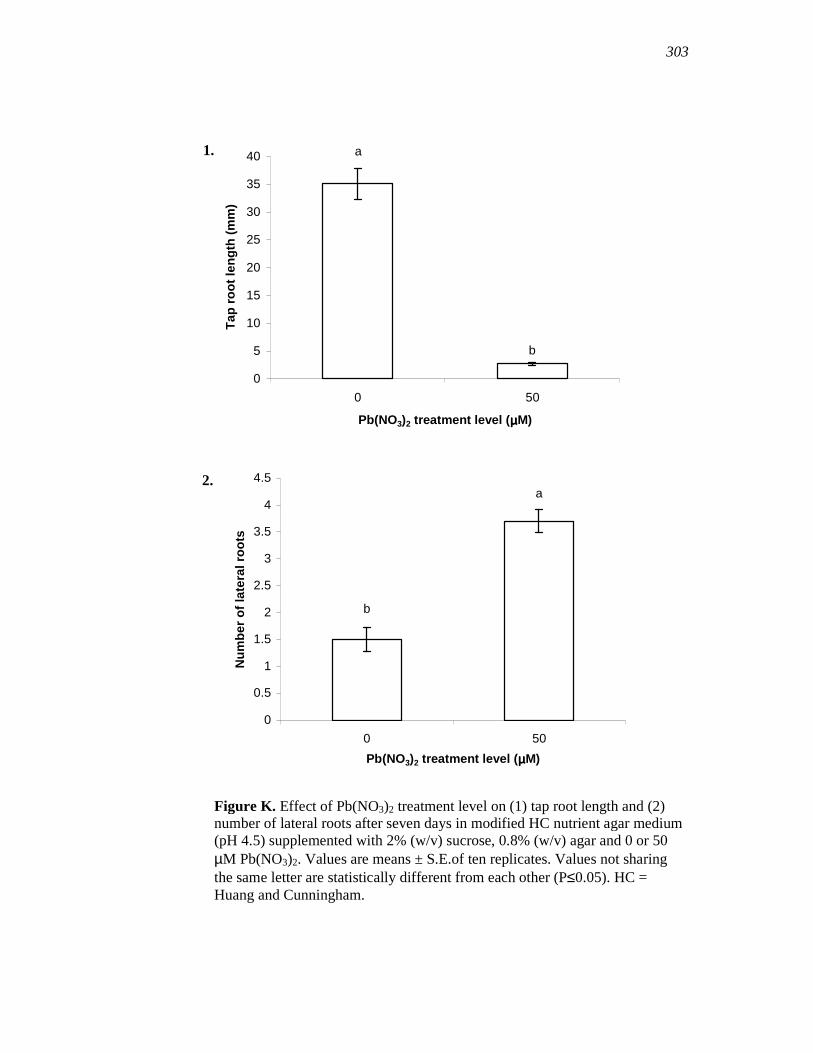
306
Figure K. Effect of Pb(NO3)2 treatment level on (1) tap root length and (2) number of lateral roots after seven days in modified HC nutrient agar medium (pH 4.5) supplemented with 2% (w/v) sucrose, 0.8% (w/v) agar and 0 or 50
µM Pb(NO3)2. Values are means ± S.E.of ten replicates. Values not sharing
the same letter are statistically different from each other (P≤0.05). HC = Huang and Cunningham.
2.
b
a
0
5
10
15
20
25
30
35
40
0 50
Pb(NO3)2 treatment level (µµµµM)
Ta
p r
oo
t le
ng
th (
mm
)
a
b
0
0.5
1
1.5
2
2.5
3
3.5
4
4.5
0 50
Pb(NO3)2 treatment level (µµµµM)
Nu
mb
er
of
late
ral
roo
ts
1.
303
307
3 CONCLUSIONS AND FUTURE STUDIES
It was anticipated that more than three putative mutants should have been isolated.
According to Chen et al., (1997), 25 putative Pb mutants were selected from 500,000
seeds; using this ratio, it was expected that up to ten putative mutants could be found
amongst the 20,000 seedlings screened.
The decision to follow the procedure from Weigel and Glazebrook (2002) and
Chen et al., 1997 for heavy metal or metalloid mutant selection, may have played a part
in the lack of Pb-tolerant mutants found. Weigel and Glazebrook (2002) recommended
a mutant screening period of five days, probably before the root density of the 250
seedlings plated prohibited mutant identification. But after five days, Pb treatment did
not simply cause root growth inhibition; it appeared to induce a different growth
response (compared to the control). Only the primary root could be seen at this time.
The lateral roots, which upon reflection of the results may have been necessary for
mutant selection, was not seen at this time. These developed after seven days, outside
the selection time. In A. thaliana seedlings, it appears that the inhibition of primary root
growth and observed increase in lateral root formation may be an adaptive response to
damaged root tips due to Pb stress. This more dense and compact root morphology has
been apparently observed in Fagus and Trifolium roots under after exposure to Pb, Al,
Cd and Cu (Breckle, 1991).
The key question arising from this technique was “how can one accurately
identify putative mutants based on degree of root inhibition (section 2.1.2 above) if it is
not merely inhibition, but an induction of a different root growth pattern (for both wild
type and EMS seedlings) on Pb media?” One possibility is that the overall lateral root
growth should be instead have been compared. However, this would require a radical
screening and practicality adjustment: (i) a longer germination time required for lateral
root growth, (ii) all plates would be vertically placed, and most importantly, and (iii)
significantly more plates as at least ten times less seeds per plate would be required to
clearly visualize root growth. These steps require far greater resources (in terms of
number of plates and time) than was allowed in the study.
In future studies, X-ray fluorescence spectrometry (XRFS) could be used for
screening A. thaliana mutants. This technique enables the detection of potential mutants
at shoot level and from large quantities of seedlings (100,000). This is because the
technique involves growing seedlings in soil, so there is no need for sterile practices
(aseptic germination) and no limitation associated with root density (Delhaize et al.,
1993).
304
Copyright © 2022 FDOKUMEN