
02Whole.pdf - Griffith Research Online
164
Phylogeography, Dispersal and Movement of Fleay's Barred Frog, Mixophyes fleayi Author Doak, Naomi C Published 2005 Thesis Type Thesis (PhD Doctorate) School School of Environmental and Applied Science DOI https://doi.org/10.25904/1912/3482 Copyright Statement The author owns the copyright in this thesis, unless stated otherwise. Downloaded from http://hdl.handle.net/10072/365483 Griffith Research Online https://research-repository.griffith.edu.au
-
Upload
khangminh22 -
Category
Documents
-
view
0 -
download
0
Transcript of 02Whole.pdf - Griffith Research Online

Phylogeography, Dispersal and Movement of Fleay's BarredFrog, Mixophyes fleayi
Author
Doak, Naomi C
Published
2005
Thesis Type
Thesis (PhD Doctorate)
School
School of Environmental and Applied Science
DOI
https://doi.org/10.25904/1912/3482
Copyright Statement
The author owns the copyright in this thesis, unless stated otherwise.
Downloaded from
http://hdl.handle.net/10072/365483
Griffith Research Online
https://research-repository.griffith.edu.au

Phylogeography, dispersal and movement of Fleay’s Barred Frog, Mixophyes fleayi.
Naomi C Doak
B.Sc. (Hons) – JCU, Townsville, QLD.
School of Environmental and Applied Sciences Griffith University
Thesis submitted in fulfilment of the requirements of the degree of
Doctor of Philosophy April 2005


This image has been removed.
Male Mixophyes fleayi, Cunningham’s Gap, south-east Queensland (Photo: Harry Hines).
i


Abstract
This thesis investigates historical and current dispersal in Mixophyes fleayi, an
endangered, wet forest-restricted frog species, found exclusively on the Great Dividing
Range of mid-eastern Australia. The phylogeographic structuring and genetic
divergence among isolated forest fragments and the presence of multiple populations
within continuous forest is used to investigate historical connectivity of populations and
current dispersal. Indirect genetic methods as well as field based direct methods are
also used to investigate dispersal and movement. These results are used to explore
the consequences of dispersal in terms of conservation and management of the
species.
Few studies have investigated genetic differentiation between upland mesic
rainforest areas in southern parts of Queensland, which potentially acted as historical
refugia for rainforest dependant species. The broad scale investigation of genetic
diversity and structure in M. fleayi, using sequence variation within the mitochondrial
ND2 gene, revealed two scales of genetic structure. Two deeply divergent and
geographically isolated lineages were found to group populations across the Brisbane
River Valley, with isolation of the Conondale Range in the north from all other
populations to the south. This can be attributed to regional isolation of rainforest
fragments during the Pliocene. Lower levels of genetic variation and sequence
divergence were found across forest fragments within the southern distribution of the
species (Springbrook, Mount Barney, McPherson, Main, Upper Richmond and
Nightcap Ranges), resulting from more recent fragmentation and restricted dispersal
related to expansion and contraction of rainforest habitat during the Pleistocene.
Genetic structure among populations indicates that comparatively high levels of
genetic differentiation exist on very small geographic scales relative to other amphibian
species. These data suggest isolation by distance within forest fragments and
significant genetic structuring between populations separated by more than two
kilometres. Despite the relatively low vagility of individuals, terrestrial dispersal occurs
among nearby streams, both within as well as across major catchments. The extent of
shared subcatchment boundary between nearby streams provided some indication of
the probability and magnitude of gene flow, with sites that share more subcatchment
boundaries showing lower levels of genetic differentiation.
iii

Abstract
The indirect genetic evidence of restricted dispersal within the species is
supported by mark-recapture, spooling and radio-tracking investigations of movements
made by individual M. fleayi in the field. The activity of both sexes is characterized by
intervals of small, localized movements. In adult females this behaviour is punctuated
by large movements that generally displace individuals away from breeding habitat
after relatively short amounts of time spent at the stream. While migration of females
between breeding sites was not detected, the movements made by adult females are
large enough to enable dispersal between breeding sites, although such dispersal
events are probably infrequent. Adult males are extremely philopatric and remain within
the breeding area, rarely moving away from the stream, making exchange of adult
males between populations extremely unlikely.
The management of M. fleayi is particularly important given the potential impact
recent declines in both population size and number may have had on genetic variation.
Intraspecific genetic divergence, across the Brisbane River Valley, highlights the need
to conserve populations in isolated forest fragments both north and south of this
putative barrier. Within fragments of continuous forest habitat, evidence of restricted,
infrequent terrestrial dispersal of individuals suggests colonization of vacant habitat is
unlikely, particularly among streams that do not share subcatchment boundaries. To
maintain important, albeit low levels of gene flow and movement between nearby
streams, it is critical that habitat connectivity between populations is maintained.
iv
Table of Contents
DECLARATION............................................................................................... II
ABSTRACT ................................................................................................... III
TABLE OF CONTENTS.....................................................................................V
LIST OF FIGURES........................................................................................ VIII
LIST OF TABLES ...........................................................................................IX
ACKNOWLEDGEMENTS...................................................................................X
CHAPTER 1. GENERAL INTRODUCTION 1
1.1 Dispersal and movement of amphibians ........................................................1
1.2 Methods of investigating dispersal in amphibians ........................................4 1.2.1 Direct methods ...................................................................................................... 4
1.2.1.1 Mark-recapture 4 1.2.1.2 Radio-tracking 5 1.2.1.3 Spooling 6
1.2.2 Indirect methods ................................................................................................... 8
1.3 Species introduction.........................................................................................9
1.4 Aims and structure of the thesis ...................................................................12
CHAPTER 2. BROAD SCALE GENETIC VARIATION OF MIXOPHYES FLEAYI 15
2.1 Introduction .....................................................................................................15
2.2 Methods............................................................................................................17 2.2.1 Specimen collection and sampling strategy .................................................... 17 2.2.2 Molecular techniques ......................................................................................... 20
2.2.2.1 Extraction of DNA and PCR Reactions 20 2.2.2.2 DNA sequencing and sequence alignment 21
2.2.3 Analysis................................................................................................................ 21 2.2.3.1 Mitochondrial DNA sequences 21 2.2.3.2 Broad scale genetic structure 22 2.2.3.3 Nested clade analysis 23
v
Table of Contents 2.3 Results............................................................................................................. 26
2.3.1 Haplotype distribution and composition ..........................................................26 2.3.2 Broad scale genetic structure............................................................................30 2.3.3 Nested clade analysis .........................................................................................31
2.4 Discussion ...................................................................................................... 38 2.4.1 Broad scale genetic variation - northern and southern forest fragments ...........................................................................................................38 2.4.2 The influence of population declines on genetic structure of M. fleayi .........................................................................................................................39 2.4.3 Implications for wet forest history.....................................................................41
CHAPTER 3. FINE SCALE GENETIC STRUCTURE OF MIXOPHYES FLEAYI 45
3.1 Introduction..................................................................................................... 45
3.2 Methods........................................................................................................... 47 3.2.1 Specimen collection and sampling strategy ....................................................47 3.2.2 Molecular techniques..........................................................................................48
3.2.2.1 Extraction of DNA and PCR reactions 48 3.2.2.2 Haplotype screening 48 3.2.2.3 DNA sequencing and sequence alignment 52
3.2.3 Analysis................................................................................................................52 3.2.3.1 Mitochondrial DNA sequences 52 3.2.3.2 Fine scale genetic structure 52
3.3 Results............................................................................................................. 54 3.3.1 Haplotype distribution and composition ..........................................................54 3.3.2 Fine scale genetic structure...............................................................................60
3.4 Discussion ...................................................................................................... 63 3.4.1 Fine scale genetic structure of M.fleayi ............................................................63 3.4.2 Subcatchment boundaries and genetic structure ...........................................64 3.4.3 Comparison of population genetic studies in other amphibians...................68
CHAPTER 4. MOVEMENTS MADE BY MIXOPHYES FLEAYI 73
4.1 Introduction..................................................................................................... 73
4.2 Methods........................................................................................................... 75 4.2.1 Study site .............................................................................................................75 4.2.2 Mark-recapture.....................................................................................................76 4.2.3 Spooling ...............................................................................................................77 4.2.4 Radio-tracking .....................................................................................................79 4.2.5 Individuals located on walking tracks and roads ............................................80 4.2.6 Analysis................................................................................................................80
4.2.6.1 Mark-recapture 80 4.2.6.2 Spool and radio-tracking 81
vi

Table of Contents
4.3 Results .............................................................................................................82
4.3.1 Individuals located on walking tracks and roads ............................................ 83 4.3.2 Mark-recapture movement ................................................................................. 85 4.3.3 Spooling movement ............................................................................................ 90 4.3.4 Radio-tracking movement .................................................................................. 92
4.4 Discussion .......................................................................................................96 4.4.1 Movements made by M. fleayi............................................................................ 96 4.4.2 Comparisons with other amphibian species.................................................... 99
CHAPTER 5. GENERAL DISCUSSION 103
5.1 Pliocene isolation and population differentiation ......................................103
5.2 Further population differentiation during the Pleistocene ........................105
5.3 Dispersal within continuous forest habitat.................................................107
5.4 Conservation and management implications.............................................110
References ......................................................................................... 113
Appendices ........................................................................................ 137
vii

List of Figures
Figure 1.1: Adult male and sub-adult M. fleayi. ........................................................... 10 Figure 1.2: Distribution of M. fleayi.............................................................................. 11 Figure 2.1: Sample sites for M. fleayi .......................................................................... 18 Figure 2.2: Hypothesised haplotype network for M. fleayi........................................... 32 Figure 2.3: Geographical distribution of M. fleayi haplotypes...................................... 33 Figure 2.4: Nested clade design for M. fleayi haplotypes............................................ 35 Figure 3.1: Geographical distribution of M. fleayi haplotypes...................................... 57
Figure 3.2: Hypothesised haplotype networks for M. fleayi across sites ..................... 58 Figure 3.3: Hypothesised haplotype network for M. fleayi across major catchments.. 59 Figure 3.4: Relationship between geographic and genetic distance ........................... 63 Figure 3.5: Subcatchment boundaries for sites within the McPherson Range............ 67 Figure 4.1: Study area in Lamington National Park, south-east Queensland ............. 75 Figure 4.2: Spooling attachment method. ................................................................... 78 Figure 4.3: Temporal sampling of spooled individuals. ............................................... 78 Figure 4.4: Diagram of results obtained from spool tracking for a single individual. ... 79 Figure 4.5: Diagram of distance calculations from mark-recapture............................. 81 Figure 4.6: Distance of initial capture point from the creek ......................................... 83 Figure 4.7: Location of individuals encountered on ridge-top roads............................ 84 Figure 4.8: Movements made by recaptured female M. fleayi
a) distance of recaptures away from the creek
b) displacement along the creek between recaptures. ............................ 86 Figure 4.9: Movements made by recaptured male M. fleayi
a) maximum distance away from the creek
b) maximum displacement along the creek ............................................. 88 Figure 4.10: Site fidelity of recaptured male M. fleayi at Bundoomba Creek. ............. 89 Figure 4.11: Distance of diurnal refuges from the creek
a) first diurnal refuge
b) second diurnal refuge.......................................................................... 91 Figure 4.12: Total distance moved versus displacement distance between diurnal refuge 1 and diurnal refuge 2 .................................................................. 92 Figure 4.13: Maximum distance away from the creek and road.................................. 93 Figure 4.14: Total distance moved by all radio-tracked frogs...................................... 94 Figure 4.15: Distance moved away from the creek for all methods ............................ 95
viii

List of Tables Table 2.1: Sample sites for broad scale genetic variation of M. fleayi..........................19 Table 2.2: Distribution of ND2 mtDNA haplotypes for populations of M. fleayi.. ..........28
Table 2.3: Forest fragment group pairwise differences and ΦST estimates .................29
Table 2.4: AMOVA results for M. fleayi mtDNA data using Φ-statistics......................30 Table 2.5: Results of the nested clade geographic distance analysis ..........................36 Table 3.1: Sample sites for fine scale genetic variation of M. fleayi .............................47 Table 3.2: Distribution of ND2 mtDNA haplotypes for fine scale genetic variation.......55 Table 3.3: AMOVA results for M. fleayi fine scale variation among major catchments and among McPherson Range sites, using Φ-statistics ..........61
Table 3.4: Pairwise ΦST estimates and percent average sequence divergence ..........61 Table 3.5: Geographic distance and estimed number of migrants ...............................62 Table 3.6: Measures of FST (or comparable statistic) from studies of amphibian population structure.....................................................................................68 Table 4.1: Frogs marked, spooled and radio-tracked at Cainbable Creek. ..................82 Table 4.2: Frogs encountered on creeks, walking paths and roads. ............................84 Table 4.3: Frogs marked, spooled and radio-tracked away from Cainbable Creek. ....85 Table 4.4: Distances travelled by amphibians ............................................................100
ix

Acknowledgements
There are so very many people without whose help, support and generosity this
thesis would not have been completed and to whom I will remain greatly indebted. First
and foremost I would like to thank my supervisors, Dr. Jean-Marc Hero, Prof. Jane
Hughes and Dr. Steve Phillips. All of them gave their time willingly to ensure this project
was a success. Marc for his guidance, support and faith in me, his tolerance and
understanding during the harder times and his enthusiasm during the easier ones. Jane,
who welcomed me into the genetics lab and always gave her time, encouragement and
enthusiasm, answering endless questions and reading numerous drafts in record time.
Both Marc and Jane gave me the freedom to develop this project, allowing me to make
my own mistakes and guiding me to find solutions. For that freedom and the many
lessons learnt along the way I will be forever grateful.
Steve who constantly taught me to look at the world and our environment with
questioning eyes and to Harry Hines, who always indulged such questions, and
endeavoured to answer so many of them with me along the way. Harry also provided
numerous samples for genetic analysis while guiding and accompanying me on many
collecting trips in many wonderful places.
A huge thankyou to all the people who ventured out into the field with me, many
of whom were repeat offenders; Shawn Smith, Andrew Melville, Luke Shoo, Brett
Manning, Luke Grainger, Laura Dakuna, Dave Hall, and the participants of O’Reilly’s
Frog Week 2001 and 2002. A special thankyou to Andy, Vanessa and the Queensland
Parks and Wildlife Service staff at Green Mountains who provided continual support
and accommodation and to Carina Uraiqat for help during countless nights and days in
the field, gourmet catering and showing me how to travel in style.
Thanks to all the numerous genetics geeks who have touched this project in
some way, either directly or through the accumulated knowledge of Jane’s lab. Thanks
go to Jing Ma, Rachel King, Steve Smith, Mia Hillyer, David Gopurenko, Andrew Baker,
Alicia Toon and Dan Schmidt for advice, encouragement and support throughout this
study. Special thanks go to Michael Cunningham who first encouraged me to venture
into the world of genetics, spent time helping me with the original project design and
then introduced me to the lab. To Mark Ponniah who patiently taught me the molecular
techniques and also helped me understand them.
x

Acknowledgements
Michael Mahony and the South Australian Museum Evolutionary Biology Unit
graciously provided samples from New South Wales. A number of organisations
provided funding for this study without which much of the fieldwork and detailed genetic
work would not have been possible; The Peter Rankin Trust Fund for Herpetologists,
The Australian Society for Herpetologists and The Queensland State Government,
Growing the Smart State.
Marc, Jane, Steve, Luke Shoo, Harry Hines, Rachel King, Carmel Wild and
Mark Ponniah all kindly gave their time to read, edit and comment on previous drafts of
this thesis providing greatly appreciated and valued comments, suggestions and
corrections. Luke Shoo often earned the dubious honour of receiving the first drafts.
Special thanks go to him for his patient and thorough consideration of them and the
resulting long coffee breaks and discussions. Rachel King edited the complete thesis
providing invaluable comments and help as well as many of the maps and figures
included.
I owe a great deal to a large number of friends who provided support and
encouragement in many different ways over the last 5 years and thanks go to all of
them. A number deserve special mention for reasons too varied and numerous to list,
Narinder Virdee, Therese O’Brien, Libby, Ben and Max Nankivell, Kylie Pitt and Luke
Shoo. An enormous thankyou to Cath Moran, Michael Arthur and Rachel King who
shared their office with me at Nathan, as well as sharing the last 4 years. It was a
privilege to share their space and their lives while they shared in mine and indulged my
often endless questions.
This thesis would be incomplete without special thanks to Harry Hines who has
provided constant help, support, ideas, side projects, fieldwork, accommodation and so
much more, but most importantly friendship and the NMI. Harry, thankyou for first
introducing me to Mixophyes fleayi as well as so many wonderfully funky beasts since
and for your company and friendship on so many creeks and adventures, without your
generous support and belief in me this project would be missing so much, including the
spectacular frontispiece.
Thanks also go to my family; Verna, Ian, Liz, Tim, Rod, Amy, Joan, Barrie and
Kaye, who may not have always understood my fascination with frogs or exactly what it
was I was doing but without question have always been there for me and provided me
with the encouragement needed to make it this far.
xi

xii

1
Chapter 1. General introduction
The need to understand how natural populations persist and interact has meant
that the study of dispersal – the movement of individuals away from their birthplace to
that of their offspring – has become fundamental to ecology and population biology
(Koenig et al. 1996). An understanding of species specific dispersal capability, or
potential, is critical to effectively manage and conserve species (Rubenstein & Hobson
2004) and can be vital in the maintenance of viable populations. This is particularly true
in an increasingly fragmented environment (Brown & Kodric-Brown 1977; Hanski 1998;
Sumner et al. 2001).
Conservation concerns and the recent global declines in amphibians (Barinaga
1990; Richards et al. 1993; Blaustein 1994; Blaustein et al. 1994; Laurance et al. 1996;
Pechmann & Wake 1997; Pounds et al. 1997; Stuart et al. 2004) have led to a renewed
interest in the specific dispersal and movement patterns of individual species. Dispersal
is a process that operates at various temporal and spatial scales (Nathan 2001) and
may have profound effects on the persistence and distribution of populations within a
species (Sumner et al. 2001).
1.1 Dispersal and movement of amphibians
Studies on dispersal of amphibians between neighbouring breeding localities
have demonstrated that many species exist as sets of sub-populations connected
through frequent migration of juveniles and adults (Gill 1978; Breden 1987; Reh & Seitz
1990; Sinsch 1991, 1992a, 1992b; Sjögren 1991). Dispersal has become a popular
basis for studying, managing and subsequently conserving species that occur in
fragmented environments. It provides an empirical basis to assess the importance of
habitat patches and fragmentation on both local and regional scales, while highlighting
the role of regional processes in local population size and abundance (Harrison et al.
1988; Sjögren 1991; Kindvall & Ahlén 1992; Hanski et al. 1995a, 1995b; Lindenmayer
& Possingham 1995; Sjögren-Gulve & Ray 1996).
Amphibians that breed in either permanent or temporary pond environments
have received a great deal of attention in regards to dispersal capabilities. Ponds are
often the most convenient sites for sampling of amphibians and provide ecologists with
discrete definable sub-populations. The tungara frog, Physalaemus pustulosus, and the
natterjack toad, Bufo calamita, are both pond breeding species that have been studied

General introduction
2
extensively (Sinsch 1992a, 1997; Sinsch & Seidel 1995; Marsh et al. 1999). Dispersal
between spatially clumped clusters of breeding sites have been found to prevent local
extinction and enable colonization of vacant habitat patches at a broad scale.
However, most adult amphibians spend little time at ponds. Many of the species
studied to date are characterised by explosive breeding with activity concentrated over
a period as short as a few days (reviewed by Wells 1977). Species that have a
prolonged breeding season commonly spend most of their time in terrestrial habitat,
which in many cases may not be directly adjacent to the breeding site (Wilbur 1984).
The temporary nature of occupancy at breeding sites highlights the importance of
movements between terrestrial and breeding habitats, as well as movements between
breeding sites. As individuals from numerous breeding aggregations may well inhabit
the same terrestrial habitat, the potential for exchange of individuals between breeding
sites may be high, particularly in species with low fidelity to particular breeding sites.
The northern leopard frog, Rana pipiens, provides an intermediate between
pond and stream breeding species. Seburn et al. (1997) investigated dispersal in this
species, sampling individuals in a system of stream connected ponds situated within
the same marsh. They found post metamorphic individuals generally moved greater
distances up and down stream (1 and 2.1 km respectively) than they did overland (0.4
km). These results suggest that terrestrial isolation of breeding sites has a greater
influence on dispersal than aquatic distance. In a number of other pond breeding
species the extent of isolation between utilised breeding and terrestrial habitat has also
been found to be more important to regional dynamics and persistence than the extent
of pond to pond isolation (e.g. Laan & Verboom 1990; Edenhamn 1996). However, the
importance of these processes remains untested in stream breeding anurans, possibly
due to an inherent difficulty in defining and characterising streams as patches of
discrete habitat. As a result, species that utilize the linear network of breeding habitat
provided by stream systems have largely been overlooked.
An exclusively breeding site based study may underestimate the mobility of
individuals and the spatial scale over which the population should be monitored and/or
protected (Semlitsch 2002) because it ignores the extent to which individuals utilize the
surrounding habitat and the importance of isolation/fragmentation in regards to
terrestrial habitat. Studies exclusively based at breeding sites, be it pond or stream, will
generally lead to breeding site explanations of many processes including dispersal
(Alford & Richards 1999; Marsh & Trenham 2001). The problem of underestimating the
importance of terrestrial habitat, both as dispersal routes and critical habitat is not
unique to pond breeding species; stream breeding amphibians are also likely to utilize
surrounding terrestrial environments as post breeding habitat. However, the distance of
General introduction
3
post-breeding movements and the extent to which species utilize terrestrial habitats is
mostly unknown. Ultimately this means that the role of terrestrial habitats in
determining the extent of dispersal and frequency of movements between breeding
sites or sub-populations has been overlooked.
A number of studies focusing on amphibian movements, and utilizing a range of
research methods, indicate that many species occupy small areas for at least a part of
their life cycle (e.g. Martof 1953; Pearson 1955; Kramer 1973; Ashton 1975; Semlitsch
1981; Kleeberger & Werner 1982; Donnelly 1989; Tessier et al. 1991; Driscoll 1997;
Lampert et al. 2003). Monsen and Blouin (2003) found that Rana cascadae showed
strong genetic structuring between populations, with low levels of dispersal (gene flow).
This pattern is supported by many mark-recapture studies as well as numerous genetic
studies, which have found significant genetic differentiation at fine geographic scales in
other amphibian species (e.g. Hitchings & Beebee 1997; Driscoll 1998a, 1998b;
Shaffer et al. 2000; Veith et al. 2002; Anderson et al. 2004; Palo et al. 2004).
In contrast to these results, investigations into dispersal in other amphibians
have identified frequent dispersal between breeding sites and an increasing regularity
of long distance movements, with individuals occupying much larger areas than
previously considered usual (e.g. Jameson 1956; Dole 1965; Dole & Durant 1974;
Beshkov & Jameson 1980; Schwarzkopf & Alford 1996). Intensive mark-recapture
studies on dispersal in amphibians have revealed that species previously thought to
have low dispersal capabilities often make relatively long distance movements in
excess of 10 km (e.g. Stumpel & Hanekamp 1986; Tunner 1992; Spieler & Linsenmair
1998; Miaud et al. 2000). While such long distance dispersers may be rare in
amphibians, they are also notoriously hard to detect using mark-recapture methods
and both the number of individuals and distance covered are often underestimated
(Porter & Dooley 1993; Marsh & Trenham 2001).
On the other hand, mark-recapture studies may also overestimate effective
dispersal ability of a species, as although the dispersal distance may be real, it may not
lead to gene flow. Lampert et al. (2003) investigated the genetic variation of the
túngara frog, Physalaemus pustulosus using microsatellites. Despite mark-recapture
studies indicating that the species may exhibit high dispersal rates (Marsh et al. 1999;
2000) the genetic study showed high levels of genetic population structure at the scale
of only a few kilometres. This contradiction of results highlights the need for a wide
variety of methods to investigate dispersal in amphibians, along with flexibility in these
methods to be adapted to appropriate spatial and temporal scales. Methods suitable for
focusing on short term movement patterns of individuals within a single population may

General introduction
4
not be suitable for much longer-term studies that aim to investigate dispersal between
populations.
1.2 Methods of investigating dispersal in amphibians
Dispersal can be investigated by either following individuals directly through
both time and space, or indirectly by inference. Direct measures of dispersal usually
involve the use of markers (e.g. individual tags, radio transmitters, cotton spool
tracking), which enable individual animals to be identified and subsequently followed,
while indirect methods utilize biological markers (e.g. morphological and genetic
variation) that subsequently allow the inference of an animal’s origin and links with
populations. The method used will ultimately depend on the scale of interest. Variation
in the methods used will also affect the utility of results in comparative studies and the
ability to formulate general conclusions concerning patterns of habitat use, movement
and dispersal.
1.2.1 Direct methods
In the past, movement studies on amphibians have largely relied on direct
methods of investigation. While there are a variety of methods available, all rely on
being able to identify individuals or groups of animals to directly trace or follow their
movements. These direct measurements of movement are often very laborious,
requiring large amounts of fieldwork to locate, capture and mark individuals (Ims &
Yoccos 1997).
1.2.1.1 Mark-recapture
Marking and/or recognition of individuals ensures identification while providing
detail on movement patterns. Given sufficient mark-recapture data from several local
populations it is possible to estimate dispersal and migration as well as obtain
estimates of individual survival (Hestbeck et al. 1991; Nichols et al. 1992; Hanski
1999). These methods are often used when information on population dynamics and
individual characteristics such as survival, age and growth are also desired.

General introduction
5
There are a wide range of methods available to mark animals (see reviews by
Ferner 1979; Donnelly et al. 1994) with marks being permanent or temporary and
date-, age-, site- or individual-specific. Individuals are marked and/or recognised
through the use of toe-clipping (e.g. Bellis 1965; Daugherty & Sheldon 1982; Dodd &
Cade 1998), tattooing (e.g. Kaplan 1959; Schlaepfer 1998), branding (e.g. Nace et al.
1974; Brown 1997), skin dying (e.g. Gittins et al. 1980), pattern mapping (e.g. Tilley
1980; Doody 1995), tagging (e.g. Kramer 1973; Ashton 1975; Ovaska 1992) and more
recently injectable subcutanius technology such as Visual Implant Elastomers (VIE)
(e.g. Nauwelaerts et al. 2000; Davis & Ovaska 2001) and Passive Integrated
Transponder Tags (PIT) (e.g. Christy 1996; Ott & Scott 1999). These methods are
useful for marking both adult and larval amphibians, although the type of system
utilised depends on both the size and natural history of the target organism, time and
resources available and specific question being investigated.
Methods that individually mark animals within populations require that animals
be caught repeatedly and as a consequence the data obtained are often biased owing
to constant handling and disturbance of individuals. They are also limited by the extent
to which movements and dispersal can be investigated spatially. The probability of
recapturing or resighting marked individuals is often extremely low and as such this
approach requires large amounts of fieldwork to obtain very small numbers of
recaptures (Webster et al. 2002). This consequently influences the amount of
information and insight gained, especially when investigating the connectivity between
populations where the frequency of movements may be low to begin with.
The marking of large numbers of animals with assignable cohort or batch
markings has been used in species at breeding sites where large numbers of sub-adult
or juvenile animals are encountered (e.g. Dodd & Cade 1998; Driscoll 1997). Cohorts,
or groups of individuals, are identified and batch marked so that while individuals
cannot be recognised, the age, site or population of origin can be determined. The
small size of sub-adults and the potential for them to regenerate digits or change
markings however can become problematic as one of the major assumptions of mark-
recapture methods is that once applied marks are neither lost nor overlooked.
1.2.1.2 Radio-tracking
To determine the home range and movements of amphibians there are few
methods currently available that compare with the advantages of non-satellite based
radio-tracking. Individuals can be repeatedly located relatively easily and with minimal
General introduction
6
disturbance and handling. Furthermore, the precise spatial location of each amphibian
can be identified, which becomes particularly useful when investigating diurnal
movements in usually nocturnal species and vice versa (Richards et al. 1994).
Radio-tracking has recently become a commonly used technology for
investigating amphibian movement, with many species lending themselves to these
techniques due to their large body size. It has been used to investigate microhabitat
use by individuals (e.g. Spieler & Linsenmair 1997; Hodgkison & Hero 2000), home
range sizes (e.g. Doak 1995; Streatfield 1999), movement patterns and habitat use
(e.g. Matthews & Pope 1999; Streatfield 1999; Lemckert & Brassil 2000) as well as
daily (e.g. Woolbright 1985; Hodgkison & Hero 2000), seasonal (e.g. Lamoureaux &
Madison 1999) and migratory activity patterns (e.g. van Gelder et al. 1986; Spieler &
Linsenmair 1998). Radio-transmitters can also be used to monitor many physiological
parametres of amphibians including temperature, heart rate and locomotor activity
(Richards et al. 1994).
Hodgkison and Hero (2000) utilised radio telemetry techniques to investigate
daily behaviour and microhabitat use in both wet and dry season conditions in Litoria
nannotis, revealing that unlike most stream-breeding frog species the stream was the
primary habitat for both males and females of this species. This detailed information
would have been unavailable without the use of radio transmitters, especially as almost
half of the nocturnal fixes located individuals hiding under rocks in the stream, where
they would otherwise have remained unsighted.
Radio-tracking technology provides information on animal movements in both
terrestrial and aquatic environments. When utilised on amphibians it requires following
the animals on foot with a portable receiver to locate the signal emitted. So, therefore
despite the detailed information provided by radio-tracking techniques, its expense,
time consuming nature and the influence on signal quality of the habitat being
investigated, often means this method is under utilised. Much of the very fine scale
detail, both temporally and spatially, of an individual’s movements are also overlooked
by radio-tracking.
1.2.1.3 Spooling
Often used in conjunction with radio-telemetry, cotton spooling is a technique
used to investigate short-term movements that allows the actual path moved by an
individual to be followed. This method involves attaching a cotton thread spool in a
similar way to a radio transmitter. However, spooling has the advantage of providing

General introduction
7
detail on the direction and magnitude of individual movements, reflecting the actual
path moved and total distance covered. Comparisons of spooling and radio-tracking
results indicate that the latter can significantly underestimate the nightly movements of
individuals (Lemckert & Brassil 2000) as it only provides a measure of the distance
between two location points, neglecting the potentially larger distances covered by an
animal as it moves between two locations.
Spool tracking provides detailed information on the short-term movements and
more specifically microhabitat use and preference of individuals. Frequently used in
studying movement patterns in mammals (e.g. Cape York rat, Leung 1999; northern
bettong, Vernes & Haydon 2001; musky rat kangaroo, Dennis 2002; Stephens’
kangaroo rat, Brock & Kelt 2004), it has also been used in lizards (Bull & Baghurst
1998) and even invertebrate studies (e.g. land snail, Murphy 2002). This method has
been used successfully to investigate movement patterns in amphibians including
Rana pipiens (Dole 1965, 1972) and Bufo boreas (Tracy & Dole 1969) in the United
States, Phyllomedusa bicolor (De Oliveira 1996) in Brazil as well as species of
Mixophyes (Streatfield 1999; Lemckert & Brassil 2000) in Australia. Dole (1965)
followed 136 frogs for up to 35 days each, providing detailed information on
movements of adult Rana pipiens in northern Michigan. In contrast, both Streatfield
(1999) and Lemckert and Brassil (2000) followed individual frogs for much shorter
periods of time but gained considerable information on distances covered by
individuals and microhabitat preferences as did De Oliveira (1996) for Phyllomedusa
bicolor.
The time period of tracking is limited by the length of string within the spool and
hence the weight of the spool relative to the individual or the number of times animals
are caught and the spool replaced. This often means that the duration of time an
animal can be followed with a cotton spool is much less than with radio–tracking,
unless animals are recaptured and spools replaced. Consequently this method is often
restricted to frogs of large size. Because movement activity is influenced by both
individual variation and environmental factors, such as climate, many individuals often
need to be spooled. Spooling may also be less favourable for species that burrow into
the soil, climb trees or find resting places in crevices, as the external pack of the spool
may hinder movement for some species.

General introduction
8
1.2.2 Indirect methods
The use of indirect measures of dispersal using genetic markers has become
an accepted alternative to dispersal estimates based on direct methods. Genetic
markers enable estimates of the level of genetic differentiation (FST estimators) and
provide the added benefit of estimating effective dispersal i.e. dispersal leading to
genetic exchange, rather than simply an estimate of distance travelled. For example,
Szymura and Barton (1991) found genetic estimates of dispersal rates in Bombina
bombina to be almost double those obtained using mark-recapture methods. The
reverse is also possible, with Physalaemus pustulosus found to show significant
genetic differentiation at small distances despite mark-recapture studies showing the
species capable of frequent dispersal between breeding sites (Marsh et al. 1999, 2000;
Lampert et al. 2003).
Genetic sampling of extant populations can also be used to infer movement and
effective dispersal, or lack of, at various time scales from generations to historically
long time periods. In this way the use of genetic markers enables investigation of both
contemporary and historical connectivity and dispersal, potentially providing information
on the previous distributions of species and the extent to which populations were
connected historically. The geographic distributions and genealogical relationships
within a species i.e. its phylogeography, can then be utilised to infer the biogeographic
as well as demographic history of the species, identifying any historical barriers to
dispersal and the contemporary evolutionary consequences of these (Avise 1994,
2000).
The entire range of genetic markers (microsatellites, mitochondrial and nuclear
DNA sequencing, allozymes, RAPD’s, RFLP’s, AFLP’s) have been used to investigate
movement patterns and dispersal in amphibians. In particular, the use of bi-parentally
inherited neutral genetic markers, such as microsatellites, have become increasingly
popular and practical, providing information on the genetic influence of dispersing
individuals at small geographical scales. The use of microsatellites in conjunction with
mitochondrial DNA (mtDNA) and the continued development of statistical approaches
have also made it possible to investigate sex-biased dispersal from target populations
(review in Prugnolle & de Meeûs 2002; Lampert et al. 2003). The use of neutral
markers ensures that the results obtained are not complicated by the influence of
selection and, as such, the presence of variation within the chosen marker is due
entirely to the process of random genetic drift acting independently within populations
with little or no dispersal between them.

General introduction
9
Studies targeting amphibians have ranged from those investigating historical
connectivity and population history between areas (e.g. McGuigan et al. 1998; Barber
1999a; James & Moritz 2000; Bos & Sites 2001; Estoup et al. 2001; Schäuble & Moritz
2001; Babik et al. 2004; Burns et al. 2004) to current dispersal between neighbouring
local populations (e.g. Driscoll 1998a, 1998b; Lampert et al. 2003). Traditionally,
amphibians have been considered to have relatively low dispersal ability (Driscoll
1998a). However, the recent focus on molecular studies has shown that there are often
high levels of genetic exchange between geographically isolated and distant
populations (Seppä & Laurila 1999; Newman & Squire 2001). The traditional view of
low dispersal in amphibians may simply be due to the limitations involved in mark-
recapture based studies of dispersal, their time consuming nature and inherent
difficulty in investigating dispersal between numerous populations or sites over
considerable time periods. The contradictions in results obtained with direct and
indirect methods highlights the importance of utilizing a variety of techniques to
investigate movement patterns within amphibians and even within a particular species.
1.3 Species introduction
The myobatrachid genus Mixophyes contains six species, with five found in
Australia and one in New Guinea. Distributed along the eastern coast of Australia
Mixophyes fleayi (Fleay's barred frog) (Figure 1.1) is found within disjunct montane wet
sclerophyll and rainforest communities of Mount Warning and the Conondale,
McPherson, Main, Tooloom and Nightcap ranges (Figure 1.2). Extending from the
Conondale Range in south-east Queensland (-26o42’S 152o35’E) to the Tooloom
Range in north-east New South Wales (-28o39’S 152o29’E) (Hines et al. 1999) the
evolutionary history of M. fleayi is likely to reflect the historical distribution of the wet
forests it inhabits.
The biology and ecology of the species is poorly known, with current ongoing
studies providing valuable information on its habitat requirements, population structure
and dynamics and breeding biology (Hines et al. 1999). The species relies on
permanent and semi permanent freshwater streams, between 100-1000 m above sea
level for critical breeding habitat. However, females and sub-adults have been
observed many hundreds of metres from known breeding sites (Meyer et al. 2001).
First described in 1987 by Corben & Ingram, M. fleayi was distinguished from
other barred frogs based on the colouration of its flanks and venter as well as
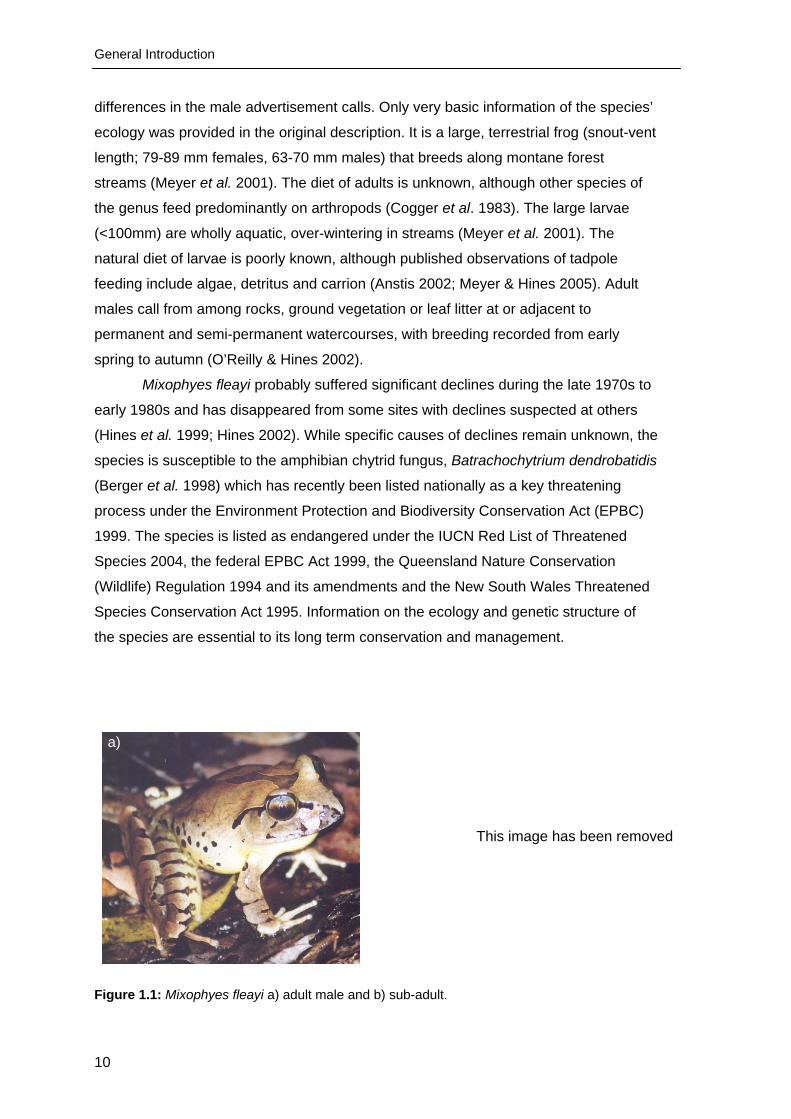
General Introduction differences in the male advertisement calls. Only very basic information of the species’
ecology was provided in the original description. It is a large, terrestrial frog (snout-vent
length; 79-89 mm females, 63-70 mm males) that breeds along montane forest
streams (Meyer et al. 2001). The diet of adults is unknown, although other species of
the genus feed predominantly on arthropods (Cogger et al. 1983). The large larvae
(<100mm) are wholly aquatic, over-wintering in streams (Meyer et al. 2001). The
natural diet of larvae is poorly known, although published observations of tadpole
feeding include algae, detritus and carrion (Anstis 2002; Meyer & Hines 2005). Adult
males call from among rocks, ground vegetation or leaf litter at or adjacent to
permanent and semi-permanent watercourses, with breeding recorded from early
spring to autumn (O’Reilly & Hines 2002).
Mixophyes fleayi probably suffered significant declines during the late 1970s to
early 1980s and has disappeared from some sites with declines suspected at others
(Hines et al. 1999; Hines 2002). While specific causes of declines remain unknown, the
species is susceptible to the amphibian chytrid fungus, Batrachochytrium dendrobatidis
(Berger et al. 1998) which has recently been listed nationally as a key threatening
process under the Environment Protection and Biodiversity Conservation Act (EPBC)
1999. The species is listed as endangered under the IUCN Red List of Threatened
Species 2004, the federal EPBC Act 1999, the Queensland Nature Conservation
(Wildlife) Regulation 1994 and its amendments and the New South Wales Threatened
Species Conservation Act 1995. Information on the ecology and genetic structure of
the species are essential to its long term conservation and management.
a)
This image has been removed
Figure 1.1: Mixophyes fleayi a) adult male and b) sub-adult.
10

General introduction
11
Figure 1.2: Distribution of M. fleayi across south-east Queensland and north-east New South Wales.
N
Sampled forest fragment
Site Waterway

General introduction
12
1.4 Aims and structure of the thesis
Empirical data on the movement and dispersal of animals are fundamental to
the conservation of species in fragmented environments. Many species that formerly
existed with continuous spatial distributions are being isolated by habitat fragmentation
and the direct loss of critical habitat. This raises important issues regarding the extent
of dispersal between areas of viable habitat and the genetic consequences of changing
connectivity.
The overall aim of this study is to investigate historical and contemporary
movement and dispersal in the endangered frog, M. fleayi, and explore the
consequences for its conservation and management. Genetic analysis techniques are
utilised to investigate historical and contemporary gene flow between isolated forest
fragments and populations. To compliment the findings of the genetic methods the
movement of individuals within and between monitored populations within a forest
fragment is examined directly through mark-recapture, radio-tracking and cotton
spooling.
Specifically the thesis aims to:
• Examine the broad-scale genetic variation and structure of M. fleayi between
disjunct forest fragments across the species’ distribution. In particular, to test
the hypothesis that the current fragmentation of suitable habitat patches
throughout the species’ distribution will have resulted in substantial genetic
differentiation and phylogeographic structuring among isolated forest fragments
(Chapter 2).
• Investigate the relationship between genetic and geographic distance within
continuous habitat and to determine how genetically distinct geographically
distant populations are to identify divergent populations for conservation and
management. Specifically, to test the hypothesis that terrestrial dispersal is
likely to lead to isolation by distance between geographically distant populations
within forest fragments, regardless of major catchment boundaries (Chapter 3).
General introduction
13
• Utilise direct methods to examine the movement patterns of individuals at
known breeding sites and to assess the potential for dispersal between local
populations of M. fleayi. In particular to test the hypothesis that females spend
only short periods of time at breeding sites, and are likely to contribute to gene
flow across catchments (Chapter 4).
• The results of these analyses are drawn together in Chapter 5. This chapter
places the main findings of the work into a broader comparative framework
while considering the conservation and management implications of these
findings.
To limit repetition, similar sampling, genetic and statistical analysis methods
described in Chapter 2 are not repeated in Chapter 3. Additional detail has been
provided where necessary both in the text and as appendices.

14 14
15
Chapter 2. Broad scale genetic variation of Mixophyes fleayi 2.1 Introduction
Phylogeography utilizes contemporary geographic distributions and
genealogical relationships to infer the historical biogeography and demography of
species, as well as the evolutionary and ecological processes that have influenced a
species’ current distribution (Avise et al. 1987; Avise 1994). Identifying and describing
population genetic structure, in relation to historical processes, further allows us to
understand how specific populations have responded to changes in the environment,
as well as the contemporary evolutionary consequences of historical barriers to
dispersal or the existence of historical refugia (Avise 2000; Hewitt 2000, 2001).
Sampling across the species’ distribution allows large-scale patterns of
phylogeographic variation to be explored (Schneider et al. 1998), while also allowing
inferences of historical connectedness between areas and identification of appropriate
units for conservation management. Studies on broad scale genetic variation of
amphibians along the east coast of Australia have found a range of genetic structuring,
identifying no single outstanding historical event responsible for defining genetic
structure. Schäuble and Moritz (2001) investigated the phylogeography of two closely
related frog species, Limnodynastes tasmaniensis and L. peronii, which are found in
open forest habitats along the east coast of Australia. They concluded that the
phylogeographic history of these open forest species may predate the Quaternary (1.8
mya) (Schäuble & Moritz 2001), while deep phylogeographical divergences dating to
the Tertiary period (65 – 1.8 mya) have been found in another open forest species,
Litoria fallax (James & Moritz 2000). A detailed study of four wet tropics hylid species;
Litoria serrata, L. nannotis, L. rheocola and Nyctimystes dayi, identified two scales of
genetic structuring within these rainforest restricted frog species: ancient vicariance
perhaps as early as the late Miocene (23.8 – 5.3 mya) and recent coalescence during
the late Pleistocene (1.8 mya – 10,000 ya) and Holocene (< 10,000 ya) (Cunningham
2001).
Despite recent increases in the number of studies investigating the
phylogeography of Australia’s amphibians, much of this work has focused on north-
eastern Australia’s Wet Tropics (e.g. Joseph et al. 1995; Williams & Pearson 1997;
Schneider et al. 1998; Schneider & Moritz 1999; Cunningham 2001). The detailed
knowledge of rainforest history (Nix 1991; Nix & Switzer 1991; Hopkins et al. 1993;

Broad scale genetic variation
16
Kershaw 1994) and fauna (Monteith 1996a, 1996b; Williams et al. 1996; Moritz et al.
2001), combined with its high level of endemism and conservation value, has facilitated
studies focused in the Wet Tropics area. Despite the high number of endemic species
of both reptiles and amphibians found in south-east Queensland and north-east New
South Wales (Covacevich & McDonald 1991; Czechura 1991), very few studies have
investigated the genetic differentiation between areas that potentially acted as historical
refugia.
The small number of studies investigating patterns of genetic variation in the
subtropical rainforests of south-east Queensland found similar genetic divergences to
those in northern rainforests. McGuigan et al. (1998), examined mtDNA diversity and
historical biogeography in Litoria pearsoniana and found a lack of contemporary gene
flow among subtropical wet forest isolates and genetic differences between areas
previously identified as historical refugia. The deep phylogeographic divergence found
in this species corresponds to the late Miocene or Pliocene separation and contraction
of wet forest habitat (5.3 – 1.8 mya).
Mixophyes fleayi shares similar patterns of distribution amongst wet forest
isolates to L. pearsoniana, also utilizing similar wet forest stream habitats, but the
broad scale genetic structure of M. fleayi has not previously been studied. However,
based on what is known of the biology, ecology and habitat of M. fleayi (Chapter 1), it is
predicted that the current fragmentation of suitable habitat patches throughout the
species’ distribution will have resulted in substantial genetic differentiation and
phylogeographic structuring among isolated habitat patches. The species is expected
to display genetic structure across isolated forest fragments corresponding to rainforest
fragmentation occurring during the Pliocene. Similar patterns in broad scale
phylogeography between these two species would provide a more detailed picture of
the history of wet forests in south-east Queensland and north-east New South Wales. If
both species display a similar pattern in regards to their phylogeography, the most
parsimonious explanation is that they have been subjected to the same environmental
history (Avise 2000).
If historical climate changes and corresponding contraction/fragmentation of
rainforest occurred across south-east Queensland and north-east New South Wales
during the Pliocene and Pleistocene, it is expected that patterns of mtDNA diversity
and variation within M. fleayi will show indications of population isolation and deep
divergence between forest fragments. This component of the study utilizes indirect,
genetic based methods to examine patterns of intraspecific genetic variation and
differentiation in M. fleayi. Specifically it aims to 1) determine the degree to which
populations representing isolated forest fragments are genetically distinct and 2) infer

Broad scale genetic variation
17
historical movement and dispersal between currently isolated forest fragments. This will
allow inferences of wet forest history in south-east Queensland and north-east New
South Wales.
2.2 Methods 2.2.1 Specimen collection and sampling strategy
Tissue samples were obtained from 122 individuals of M. fleayi from 24
localities across the species’ current distribution in eastern Australia (Figure 2.1, Table
2.1). Geographic sampling included most currently known extant populations of the
species with sites sampled from each major forest isolate currently known to contain
the species. This maximised the chance of sampling haplotype variation with sampling
priority given to geographic coverage without a-priori assumptions of critical areas.
Samples were obtained as either toe clips from post metamorphic individuals or
tail fin clips from tadpoles, captured and released at monitoring sites (collected under
Queensland National Parks and Wildlife Service, Scientific Purposes Permits, Numbers
E5/000102/99/SAA and W4/002653/01/SAA ). Where possible, post metamorphic frogs
were sampled as it has been shown that for some species of anurans, tadpoles prefer
to congregate with siblings (Waldman & Alder 1979; Rautio et al. 1991; Hokit &
Blaustein 1997; Saidapur & Girish 2000, 2001). While it remains unknown if closely
related tadpoles of the genus Mixophyes school, to avoid the increased possibility of
sampling individuals from the same clutch, tissue samples were obtained from
juveniles and adults. When sampling of tadpoles was required (due to small numbers
of adult frogs) samples were obtained from multiple pools within a location, to minimise
the chances of collecting individuals from the same clutch. Sites requiring the collection
of tissue from tadpoles and the number of samples taken are shown in Table 2.1.
Individual tissue samples were stored in 70% ethanol until extraction of mtDNA.

Broad scale genetic variation
18
Figure 2.1: Sample sites for M. fleayi across south-east Queensland and north-east New South Wales. Sample site numbers correspond to those in Table 2.1.
N
Protected area
Sample site
Waterway

Broad scale genetic variation
19
Table 2.1: Forest fragments and sites sampled across the species’ distribution. Site numbers correspond to those used in Figure 2.1. The number of individuals sampled from each site is shown. Tissue type and source of tissue are indicated. Tissue Type - TC = toe clip, TP = tadpole tail clip, LV = Liver sample Tissue Source - COL, Collected this study; SAM, South Australian Museum, Adelaide
Forest fragment and site number
Site sampled Number of individuals
Latitude (south)
Longitude (east) Tissue type Source
Conondale Range
1 North Booloumba 10 -26o 42’ 49” 152o 35’ 05” 10 TC COL
2 East Kilcoy Creek 9 -26o 45’ 00” 152o 35’ 00” 9 TC COL
McPherson Range
3 Cainbable Creek 8 -28o 11’ 34” 153o 06’ 47” 8 TC COL
4 Morans Creek 3 -28o 14’ 04” 153o 07’ 35” 3 TC COL
5 Stockyard Creek 8 -28o 12’ 33” 153o 06’ 18” 8 TC COL
6 Bundoomba Creek 7 -28o 13’ 09” 153o 08’ 22” 7 TC COL
7 Egg Rock 2 -28o 10’ 42” 153o 12’ 13” 2 TC COL
8 Pyramid Creek 5 -28o 11’ 28” 153o 09’ 36” 5 TC COL
9 Coomera River 4 -28o 13’ 05” 153o 10’ 58” 4 TC COL
10 Nixons Creek 2 -28o 12’ 32” 153o 12’ 16” 2 TC COL
Springbrook Plateau
11 Natural Bridge 2 -28o 13’ 58” 153o 14’ 36” 2 TC COL
12 Tallebudgera Creek 5 -28o 13’ 59” 153o 18’ 39” 5 TC COL
13 Currumbin Creek 5 -28o 14’ 22” 153o 20’ 41” 5 TC COL
Main Range
14 Dalrymple Creek 7 -27o 59’ 08” 152o 21’ 29” 7 TC COL
15 Gap Creek West 12 -28o 03’ 03” 152o 22’ 56” 12 TC COL
16 Condamine River 5 -28o 15’ 36” 152o 28’ 12” 5 TC COL
17 Steamers Creek 4 -28o 12’ 00” 152o 25’ 12” 3 TC, 1TP COL
18 Pinchgut Creek 3 -28o 11’ 00” 152o 25’ 00” 2 TC, 1TP COL
19 Blackfellows Creek 3 -27o 57’ 00” 152o 22’ 00” 3 TC COL
20 Cryptocaria Creek 7 -28o 14’ 22” 153o 20’ 41” 1 TC, 6 TP COL
Tooloom Range
21 Yabbra Creek 5 -28o 39’ 24” 152o 28’ 57” 5 LV SAM
22 Little Haystack 1 -28o 40’ 25” 152o 29’ 43” 1 LV SAM
Nightcap Range
23 Terania Creek 4 -28o 39’ 54” 153o 16’ 04” 4 LV SAM
Mount Barney
24 Cronan Creek 1 -28o 17’ 55” 152o 41’ 56” 1 TC COL

Broad scale genetic variation
20
2.2.2 Molecular techniques
2.2.2.1 Extraction of DNA and PCR reactions
Total genomic DNA was extracted following a modification of the CTAB/phenol-
chloroform DNA extraction protocol (Doyle & Doyle 1987). A 650 base pair fragment of
the mitochondrial DNA ND2 (NADH dehydrogenase subunit 2) protein-encoding region
was amplified using polymerase chain reaction (PCR). The ND2 gene was predicted to
be evolving at rates appropriate to provide the level of information required on all
lineages within the species (Graybeal 1994; Richards & Moore 1996; Pesole et al.
1999).
The variation contained within a genetic marker or region often determines the
spatial scale at which genetic structure is expected (Scribner et al. 1994; Parker et al.
1998; Smith & Green 2004). Mitochondrial DNA (mtDNA) is a haploid cytoplasmic
organelle that is almost strictly maternally inherited in animals and, as such, does not
undergo intergenerational recombination. This lack of recombination means that
mtDNA effectively acts as a clone and allows relationships of decent to be inferred
more easily than does nuclear DNA (nDNA). As such, it is the marker of choice for
phylogeographic studies (Avise et al. 1987).
The primers used in both amplification and sequencing were L4221 (5’ –
AAGGACCTCCTTGATAGGGA–3’) and H4980 (5’–ATTTTTCGTAGTTGGGTTTGRTT
–3’) for NADH subunit 2 (Macey et al. 1998b; Read et al. 2001). Reactions were run in
a 25 μl total volume containing: 1.0 μl of DNA, 2.5 μl of 10x reaction buffer, 1.0 μl of 50
mm MgCl2, 0.5 μl of dNTPs, 1.0 μl of each primer and 0.5 μl of Taq polymerase
(Bioline BioTAQ RedTM). PCR was performed on the Geneamp PCR system 9700 (PE
Applied Biosystems) utilizing an initial denaturation step of 94oC for five minutes,
followed by 30 cycles of denaturation at 94oC for 30 seconds, annealing at 48oC for 30
seconds and extension at 72oC for one minute. A final extension at 72oC for five
minutes completed the PCR reaction. Six μl of PCR product was electrophoresed at 80
V for 30 minutes on 1.6 % agarose gel, stained with ethidium bromide, to enable
assessment of product quality. All chemicals for PCR reactions were supplied by
Bioline (NSW, Australia) and primers were synthesized by Sigma-Genesis (NSW,
Australia).

Broad scale genetic variation
21
2.2.2.2 DNA sequencing and sequence alignment
The PCR product was purified using a modification of the Exo-SAP enzyme
cleaning protocol for removal of residual oligonucleotides (Werle et al. 1994). Ten units
(0.5 μl, 20 u/μl) of exonuclease I (Fermentas Inc. QLD, Australia) and 2 units (2 μl, 1
u/μl) of shrimp alkaline phosphatase (SAP) (Promega, WI, USA) were added to 20 μl of
PCR product and incubated at 37oC for 35 minutes before inactivation of the enzymes
at 80oC for 20 minutes prior to sequencing.
Sequencing reactions were prepared by adding 10-20 ng of purified DNA to 3.2
pmoles of one primer, 2 μl sequencing Big Dye Terminator (Perkin Elmer), 2 μl 5x PCR
Buffer (Applied Biosystems) and adjusting to 10 μl with ddH20. Reactions were cycle
sequenced in a thermocycler using the following profile: 25 cycles of 30 seconds at
95oC, 15 seconds at 50oC, four minutes at 60oC. Reaction products were then
precipitated with 76% ethanol and cleaned with 70% ethanol before the resulting DNA
pellets were vacuum dried for 20 minutes.
The Griffith University Sequencing Facility then directly sequenced product on
an Applied Biosystems 377 automated sequencer. All samples were sequenced from
both 5’ and 3’ directions. The resulting chromatograms were viewed and the
sequences aligned and edited with the aid of SEQUENCHER Version 4.1. Sequence
ambiguities were resolved through the comparison of complementary strands. All sites
that differed from the consensus sequence were checked to reduce the possibility of
either computer or human editing error.
After alignment of the sequences, exploratory data analysis was performed in
the program MEGA Version 2.1 (Kumar et al. 2001) and MACCLADE Version 4.0
(Maddison & Maddison 2000). All the sequences of the ND2 region were translated into
amino acids using MACCLADE Version 4.0. The alignment was unambiguous and
there were no nonsense or stop codons, suggesting that all of the sequences analysed
were functional.
2.2.3 Analysis
2.2.3.1 Mitochondrial DNA sequences
As NADH subunit 2 is a mitochondrial coding gene it is appropriate to perform
tests of neutrality prior to further genetic analysis. The Tajima’s tests of neutrality
(Tajima 1989) as well as Fu and Li’s (1993) D- and F- tests, as implemented in DnaSP

Broad scale genetic variation
22
(version 3.0; Rozas & Rozas 1999), were performed on the obtained sequences,
testing the assumption of neutrality for this fragment.
The most appropriate model of sequence evolution was selected based on the
results of hierarchical likelihood-ratio tests as implemented in MODELTEST 3.06
(Posada & Crandall 1998). The parametres of the models were computed using PAUP*
4.0b10 (Swofford 1998). The default option of a neighbour joining tree based on
distances estimated from a Jukes & Cantor (1969) model of substitution was used as
the input tree. This tree was then used to initiate the hierarchical test, successively
comparing a null model to an alternative one which included a single additional
parametre. The model selected as being the better fit by the likelihood ratio test was
then adopted as the null model in the next iteration. This process continued until all 56,
progressively parametre rich models, were tested against the null model (review in
Huelsenbeck & Crandall 1997).
Haplotype diversity (Hd) and nucleotide diversity (π) were calculated in DnaSP
for sampled populations as well as forest fragments. Haplotype diversity is an index of
the relative frequency of the haplotypes (Nei 1987) while nucleotide diversity is used to
describe the average number of nucleotide differences per site between a pair of
sequences.
2.2.3.2 Broad scale genetic structure
The spatial distribution of genetic variation within and among forest fragments
was estimated and tested using hierarchical analysis of molecular variance (AMOVA;
Excoffier et al. 1992). AMOVA calculates F-statistics and Φ- statistics, to describe the
population structure of diploid organisms. The Φ- statistics are a modified F-statistic
which incorporate the appropriate model of sequence evolution and which were used to
provide an estimate of population structure and subdivision. The hierarchical nature of
AMOVA requires the grouping of populations or sites into progressively higher levels.
The prespecified hierarchy produced three components of the genetic variation:
(FCT/ΦCT) among fragments, (FSC/ΦSC) among sites within fragments and (FST/ΦST)
among all sites sampled for the species.
AMOVA partitions the observed genetic variation within and among groups
(Excoffier et al. 1992) and uses a nonparametric permutation procedure to test the
level of significance of the resulting statistics. AMOVA and the associated tests of
significance (α = 0.05) were implemented in the program ARLEQUIN (Version 2.000;
Schneider et al. 2000) using 10000 permutations. By permuting haplotypes between

Broad scale genetic variation
23
sites, while keeping the sample sizes constant, Arlequin obtains the null distributions of
pairwise Φ values with the p-value corresponding to the proportion of permutations
leading to a value larger or equal to the one observed (Schneider et al. 2000). A ΦST
value that is found to be significantly different from zero indicates some restriction to
gene flow among at least two of the compared populations, while a non-significant ΦST
value indicates no restriction to gene flow i.e. panmixia between all of the populations
considered in the analysis. A ΦST of one suggests no gene flow among the groups
(Wright 1978). In the same way non-significant values for ΦSC and ΦCT indicate no
significant restriction to gene flow between populations within groups and among
groups respectively.
While AMOVA provides valuable information on the overall partitioning of
genetic variation, it does not provide detail on which components of each level are
significantly different from each other. For example, there may be significant
differentiation between a single pair of sites within a grouping, resulting in a significant
ΦST value, but all others may be homogeneous.
2.2.3.3 Nested clade analysis
A haplotype network was constructed using the program TCS version 1.13
(Clement et al. 2000). The relationships among haplotypes were estimated using the
networking algorithm developed by Templeton et al. (1992), which estimates the
probability that nucleotide differences between two randomly drawn haplotypes have
resulted from more than one mutational event. The coalescent based approach used to
build the network allows greater precision of gene flow estimation than haplotype
frequencies alone. This method was used in preference to traditional methods of
phylogenetic analysis such as tree building methods, as the latter generally perform
poorly under conditions in which DNA sequences differ by few substitutions
(Huelsenbeck & Hillis 1993) as found in this study. In addition to assuming large
genetic differences, tree building methods also assume that ancestral nodes are extinct
and impose strict bifurcations (Crandall & Templeton 1996).
TCS uses statistical parsimony to construct a 95% plausible set of all haplotype
linkages in an unrooted haplotype tree (Templeton et al. 1992, 2000). The result is a
network of equally parsimonious paths in which the oldest (ancestral) haplotypes are
placed as internal nodes and derived haplotypes as branch tips, interconnected via a
series of mutational events, derived from a matrix of the number of pairwise nucleotide

Broad scale genetic variation
24
differences. The resulting haplotype network allows clear representation of the
temporal relationships between haplotypes (Templeton et al. 1992).
Nested clade analysis (NCA; Templeton et al. 1995) was subsequently used to
test the null hypothesis that there was no association between clades of the haplotype
network and geographic location. NCA is an objective phylogeographic approach that
enables the inference of evolutionary processes on both a spatial and temporal scale
(Sgariglia & Burns 2003) and can determine whether the observed pattern is the result
of historical evolutionary processes or restricted contemporary gene flow. Thus, NCA
seeks to identify significant non-random patterns in the geographic dispersion of
haplotypes and lineages (Templeton et al. 1995). This particular analysis does not
assume a molecular clock, is independent of population models such as the Fisher-
Wright equilibrium model and allows for the recognition of different population histories
within different areas and at different times. It also allows for discrimination between
various biological explanations that may be responsible for the observed pattern of
genetic variation (Templeton et al. 1992, 1995, 2000).
The program GEODIS (Posada et al. 2000) was used to evaluate nested clades
for significant associations with geographical distribution, using a random, two-way,
contingency permutation analysis (Templeton & Sing 1993; Templeton 1998; Carbone
& Kohn 2001). Utilizing the number of mutational differences that exist between
haplotypes, combined with the geographical distances between populations, NCA is
able to test whether individuals from neighbouring populations are more closely linked
to each other in the haplotype network than would be expected due to chance (Hey &
Machado 2003). The haplotype network generated by TCS was ‘nested’ into
increasingly inclusive sets (clades) according to a series of published rules (Templeton
et al. 1987; Templeton & Sing 1993; Crandall 1996). Defined clades were subsequently
used in the analysis of spatial distribution of genetic variation (Templeton 1998).
NCA utilizes chi-squared exact tests for each clade at each level of nesting to
test geographic associations between locations. In this case, each geographic location
is treated as a categorical variable with distances between locations ignored (Posada
et al. 2000). Straight-line geographical distances between sampled populations were
calculated from the latitude and longitude co-ordinates obtained from GPS readings
and topographical maps.
The nested pattern (interior vs tip), geographical location and sample size for
each haplotype were used to calculate dispersion (Dc; average distance of all
individuals within a clade from the geographic centre of that clade) and displacement
(Dn; average distance of individuals within a clade from the geographic centre of the
next highest nesting level). Average distances between designated interior and tip

Broad scale genetic variation
25
haplotypes/clades within a nested group (I-Tc) and between a haplotype/clade and the
higher clade within which it is nested (I-Tn) were also calculated. Clades containing
less than two known haplotypes or with no geographic distance between haplotypes
were considered degenerate and uninformative and were excluded from the analysis.
The significance of the calculated statistics at the 5% level of significance was
determined using a Monte Carlo permutation procedure (Posada et al. 2000).
An updated version (July 2004, available from the GEODIS program website) of
the biological inference key developed by Templeton et al. (1992, 1995) was used to
interpret clades with significant haplotype-geographical association identified in the
nested contingency analysis. The inference key attempts to discriminate between
historical evolutionary processes that affect spatial genetic structure and recurrent
gene flow. It is based on the assumption that historical processes, such as range
expansion and allopatric fragmentation will result in different patterns of geographical
association between haplotypes to contemporary processes such as restricted gene
flow (Hey & Machado 2003).
Nested clade analysis is becoming an increasingly popular method of assessing
the geographic structure of genetic variation. However, several authors have drawn
attention to potential limitations of the analysis. For example Masta et al. (2003)
highlighted the influence of missing haplotypes on the interpretation of NCA inferences,
suggesting that a loss of haplotypes through genetic drift or localized influences may
lead to incorrect conclusions of long distance dispersal. Templeton (2002)
recommends ‘cross-validation’ or congruence among multiple unlinked loci, where
possible, to reduce or eliminate incorrectly inferring long-distance dispersal in some
cases. The use of appropriate caution when interpreting results from NCA and the
incorporation of extensive information on the biology, life-history and ecology of
species may also help to overcome the problems associated with the presence of
missing haplotypes (Masta et al. 2003).
Petit and Grivet (2002) argued that high levels of fixation, sampling of a small
number of populations (<20) and large sample sizes for each population become
problematic with NCA analysis and may lead to insufficiently conservative spatial
inferences. Templeton (2004) recognised the limitations placed on NCA under these
specific conditions and the potential for false inference or biological misidentification in
such cases. However, these conditions do not apply in this study and concordant
patterns of mtDNA variation across ecologically similar species from other studies may
be one approach available to validate the inferences made using NCA.
The timing of clade divergence was inferred using a molecular clock
approximation. The accuracy of divergence times based on molecular clocks remains

Broad scale genetic variation
26
debatable (Knowlton et al. 1993; Arbogast & Slowinski 1998). However, they provide
estimates of relative time frames for divergence events and phylogeographical
relationships (Arbogast et al. 2002). The ‘standard’ mtDNA molecular clock is
calibrated at 2% divergence per million years (Brown et al. 1979). This particular
standard calibration of mtDNA is not well supported in frogs with limited fossil evidence
available to test dates. It has been suggested that mtDNA evolution in poikilotherms,
and in particular amphibians, is much slower (Rand 1994; Caccone et al. 1997; Macey
1998a, 1998b; Gubitz et al. 2000; Mulcahy & Mendelson 2000; Kosuch et al. 2001).
Times of divergence between mtDNA haplotypes were subsequently based on a
molecular clock of 1.4 % sequence divergence per million years, which is based on the
ND1 gene (Macey et al. 1998a). Similar rates of divergence have been shown in other
poikilotherms, including anurans (Kosuch et al. 2001), salamanders (Spolsky et al.
1992), lizards (Macey et al. 1998b; Gubitz et al. 2000) and snakes (Zamudio & Greene
1997). The average percent sequence divergence between forest fragments was used
to calculate approximate divergence times based on the 1.4% molecular clock.
2.3 Results 2.3.1 Haplotype distribution and composition
Sequencing of the ND2 (NADH subunit 2) region of the mtDNA resulted in
sequence information for 122 samples of M. fleayi from 24 populations across seven
isolated rainforest fragments throughout the sampling area (Table 2.2). It revealed 27
unique haplotypes based on 619 base pairs. There were no insertions or deletions
detected in the sequences. Thirty eight (6.14%) nucleotide sites were variable
(Appendix 1) and 22 of these sites were parsimoniously informative.
The distribution of haplotypes sampled from the M. fleayi populations is shown
in Table 2.2. The most widespread haplotype (H-1) was found in populations sampled
from within McPherson Range, Main Range and Tooloom Range. This haplotype was
found in the highest frequency in all of the Main Range populations except Pinchgut
Creek (pop. 18).
Haplotype 1 (H-1) was also the only haplotype found in samples from Gap
Creek West, the population with the largest sample size. Only three other haplotypes
were shared among forest fragments (H-2, H-5, H-9), although some sharing of
haplotypes (H-3, H-4, H-6, H-8, H-12) was evident among populations within
fragments. Nineteen haplotypes were endemic to single locations and collectively these

Broad scale genetic variation
27
represented 23.2% of all individuals sampled. Only one sample was available for
sequencing from the Mount Barney area and it revealed a haplotype unique to the
Cronan Creek site.
Conondale Range populations showed a similar haplotype distribution pattern
to the other forest fragments, despite the fact that they shared no haplotypes with
them. The unique haplotypes found in the two known populations from the Conondales
were found to be very divergent from the southern haplotypes. However, both
populations shared a single most frequent haplotype (H-3) with the presence of a
number of low frequency and unique haplotypes.
The Tajima’s test of neutrality indicated that variation in this mtDNA fragment is
as expected under selective neutrality (overall D = - 0.23970; p>0.05 NS). Fu and Li’s
(1993) D- and F- test statistics (D = -0.20524, p>0.05 NS; F = -0.26328, p>0.05 NS)
also showed no evidence of deviations from neutrality. Due to an indication of some
subdivision within forest fragments, Tajima’s D was also calculated for each population
separately (Appendix 2). However, again no significant deviations from neutrality were
found.
The best-fit model of sequence evolution was the HKY model (Hasegawa et al.
1985), incorporating a gamma shape distribution for variable sites (HKY + G) of 0.0081
(Appendix 3). This model accommodates differing transition/transversion mutation
rates and uneven base frequencies. The observed transition/transversion ratio was
7.2628.
Overall haplotype diversity (Hd) across the species distribution was 0.867.
Haplotype diversity varied among forest fragments (due partly to differences in sample
size). Within forest fragments, haplotype diversity ranged from 0.333 to 0.872. Average
overall nucleotide diversity (πd) was 0.01078 and ranged from 0.00054 to 0.00427 for
forest fragments (Appendix 4).

Broad scale genetic variation
28
Table 2.2: The distribution of ND2 mtDNA haplotypes for populations of M. fleayi. The number of individuals of each haplotype within each population is shown. Site codes correspond to Figure 2.1. Sample sizes indicate the number of individuals sequenced. CR = Conondale Range, McR = McPherson range, SP = Springbrook Plateau, MR = Main Range, TR = Tooloom Range, NR = Nightcap Range, MB = Mount Barney.
Population
CR McR SP MR TR NR MB
Site Code 1 2 3 4 5 6 7 8 9 10 11 12 13 14 15 16 17 18 19 20 21 22 23 24
Sample
size 10 9 8 5 8 7 2 5 4 2 2 5 5 7 12 5 4 3 3 7 5 1 4 1
H-1 4 2 1 5 12 4 2 2 1 4 1
H-2 2 1 3 1 2 1 3 4 3
H-3 7 3
H-4 2 3 1 2
H-5 1 1 1 2 1
H-6 1 2 1
H-7 4
H-8 1 3
H-9 2 1
H-10 2
H-11 2
H-12 1 1
H-13 2
H-14 2
H-15 2
H-16 2
H-17 1
H-18 2
H-19 1
H-20 1
H-21 1
H-22 1
H-23 1
H-24 1
H-25 1
H-26 1
H-27 1

Broad scale genetic variation
29
Recent declines in the species have meant that many populations are currently
known to consist of only a very small number of individuals, potentially influencing not
only population size but genetic diversity within the population and forest fragment. An
increase in sample size may lead to an increase in both the number of haplotypes and,
subsequently, haplotype diversity. A linear regression of the relationship between
population sample size and number of haplotypes with each forest fragment was
significant, as expected (r2 = 0.834, p=0.011). However, the relationship between
sample size and haplotype diversity for forest fragments was not significant (r2 = 0.495,
p=0.119), suggesting that while an increase in sample size led to an increase in the
number of haplotypes it did not necessarily result in an increase in haplotype diversity
(Appendix 5).
Many of the identified haplotypes differed from the most common one (H-1) by
only a single nucleotide substitution, with haplotypes found in many of the forest
fragments showing only small sequence divergence (0.110-0.6055%). However, all
haplotypes from the Conondale Range (North Booloumba Creek and East Kilcoy
Creek) were highly divergent (2.7-3.16%) from haplotypes found in other forest
fragments. Sequence divergence ranged from 0.110% to 3.162% between forest
fragments. Percent average sequence differences within fragments ranged from 0.065
in the Tooloom Range to 0.476 within Springbrook Plateau (Table 2.3). Table 2.3: Forest fragment group pairwise differences based on mtDNA ND2 fragment. Above Diagonal: % average sequence differences between fragments. Diagonal Element: % average sequence differences within fragments. Below the Diagonal: Pairwise ΦST estimates based on Jukes-Cantor distances (*p<0.05).
Conondale Range
McPherson Range
Springbrook Plateau
Main Range
Tooloom Range
Nightcap Range
Mount Barney
Conondale Range 0.145 3.067 2.970 3.162 3.114 2.702 2.820
McPherson Range 0.996* 0.413 0.491 0.605 0.561 0.400 0.882
Springbrook Plateau 0.995* 0.131* 0.476 0.387 0.337 0.482 0.596
Main Range 0.998* 0.287* 0.579* 0.159 0.110 0.600 0.362
Tooloom Range 0.999* 0.112 0.326* -0.095 0.065 0.557 0.290
Nightcap Range 0.996* 0.357* 0.044 0.781* 0.782* 0.242 0.848
Mount Barney 0.997 0.478 0.421 0.578 0.805 0.802 0.000

Broad scale genetic variation
30
2.3.2 Broad scale genetic structure
AMOVA analysis was implemented in ARLEQUIN (Version 2.0, Schneider et al.
2000) utilizing the Jukes-Cantor model of sequence evolution with a specified gamma
correction of 0.0081 for pairwise distance calculations. MODELTEST identified the
HKY + G model of sequence evolution as the most appropriate. However this particular
model is unavailable in ARLEQUIN and the next most suitable available model was
chosen, i.e. Jukes-Cantor. AMOVA results identified 98.89% of the variation was
among forest fragments, 0.26% was among populations within forest fragments and
0.85% within populations (Table 2.4). All pairwise ΦST comparisons of the fragments
were significantly different, apart from both Main and McPherson Range with the
Tooloom Range and the comparison of Springbrook Plateau to Nightcap Range (Table
2.4). Table 2.4: Analysis of molecular variance (AMOVA) among isolated forest fragments containing populations of M. fleayi. Fixation indices as well as the percentage of the total variation that is explained by the grouping, along with its significance, are shown.
Source of Variation d.f. Percent variation
Fixation index
p
Among forest fragments 6 98.89 ΦCT 0.9889 0.00
Among populations within forest fragments
17 0.26 ΦSC 0.2311 0.00
Among all populations 99 0.85 ΦST 0.9915 0.00

Broad scale genetic variation
31
2.3.3 Nested clade analysis
The hypothesized haplotype network for the 27 haplotypes is shown in Figure
2.2. The distribution (Figure 2.3) and frequencies of haplotypes across the populations,
combined with the high level of genetic divergence (Table 2.3) observed between
forest fragments, suggests patterns of genetic structure resulting from long periods of
isolation between fragments. Coalescent based, nested clade analysis (NCA) was
used to infer the processes that may have influenced genetic structure.
Using the ND2 data set, two separate networks were resolved, one containing
populations within the northern geographical range of M. fleayi (i.e. the Conondale
Range) and the second or southern network containing all other forest fragments
(Figure 2.2). Up to10 mutational differences were statistically justified (p ≥ 0.95)
between haplotypes. When individual networks remain unconnected by TCS it is
because divergence between the networks exceeds the 95% confidence limits of
minimum parsimony according to the estimation procedure (Templeton et al. 1992). In
order to determine the relationships of haplotypes from the two networks the number of
mutational differences allowed before networks remain unconnected was adjusted,
allowing identification of the connection between the two networks. This relationship of
haplotypes is shown in Figure 2.2 with the two networks connected at H-2, but for
further analysis the two networks were treated separately.

Figure 2.2: Hypothesised network of all 27 unique M. fleayi haplotypes. Large coloured circles represent haplotypes with each colour signifying a different haplotype. Numbers inside each circle identify the haplotype (Table 2.2), the sample size (n) and populations within which it was found (Figure 2.1, Table 2.1). Each connection between haplotypes represents a single base change in the ND2 sequence. Each small black circle along the connections represents an unsampled putative ancestral haplotype.
32

Broad scale genetic variation
33
Figure 2.3: Geographical distribution of haplotypes. Each haplotype is represented by a different colour (see Figure 2.2). The proportion of individuals of each haplotype is presented for each sample site (Figure 2.1, Table 2.1), with the total number of individuals sampled at each site shown (n).
N
site 1 (n=10)
site 2 (n=9)
site 3 (n=8)
site 4 (n=5)
site 5 (n=8)
site 6 (n=7)
site 7 (n=2)
site 8 (n=5)
site 9 (n=4)
site 10 (n=2)
site 14 (n=7)
site 15 (n=12)
site 16 (n=5)
site 17 (n=4)
site 18 (n=3)
site 19 (n=3)
site 20 (n=7)
site 11 (n=2)
site 12 (n=6)
site 13 (n=5)
site 24 (n=1)
site 23 (n=4)
site 21 (n=5)
site 22 (n=1)

Broad scale genetic variation
34
The most likely ancestral haplotype within the main, southern network was
H-1 with an outgroup probability of 0.1865. The network showed evidence of
ambiguous relationships among three groups of haplotypes (H-1, H-7, H-19; H1, H-9,
H-16; H-2, H-6, missing haplotype) with these ambiguities resulting in closed loops
among haplotypes. These loops were resolved using criteria from Crandall &
Templeton (1993). For example, an ambiguous loop present between H-1, H-7 and H-
19 was resolved by removing a 1-step connection between H-7 and H-19 resulting in
H-19 becoming a tip haplotype and H-7 remaining internal to H-16 (Figure 2.2).
Removing the alternative connection between H-1 and H-7 would have resulted in H-19
becoming internal to both H-7 and H-16. Based on the geographical locations of H-1,
H-7 and H-19, their frequencies (38, 4 and 1 respectively) and their outgroup
probabilities (0.1865, 0.1263 and 0.0015 respectively) one of the ambiguous
connections was removed making H-19 a tip haplotype. Under the predictions of
coalescent theory the more frequent haplotype with the higher outgroup probability (H-
7) is more likely to be an internal haplotype.
The nesting design (Figure 2.4) revealed that haplotypes within the large
southern network were clustered in geographical regions. This southern network is
characterised by three common widespread haplotypes (H-1, H-2, H-5) which are
found in a number of populations (pop. 11, 9, and 5 respectively) across at least two
forest fragments and from which most other haplotypes are derived by single
mutational events. The 21 identified haplotypes were partitioned into 11 1-step clades,
four 2-step clades, two 3-step clades and one 4-step clade encompassing all
haplotypes and lower level clades. The presence of missing haplotypes (1-1, 1-2, 1-6,
1-8, 1-9, 1-10) and lack of geographic distance between haplotypes (1-5) in the
network meant that there were seven 1-step clades considered to be degenerate and
thus not included in the analysis. Four of the 11 analysed clades, including the total
cladogram, were identified as having significant geographical structuring of haplotypes
(p<0.05) by the chi-squared contingency table analysis (Table 2.5). The second much
smaller northern network consisted of the remaining six haplotypes in a single 1-step
clade which had no significant geographical structuring (p<0.05) of haplotypes.

Figure 2.4: Hypothesised nested clade design for NADH subunit 2 sequences of all 27 unique M. fleayi haplotypes. Haplotypes are represented by large coloured circles, each colour signifying a different forest fragment (see key). Numbers inside each circle identifies the detected haplotypes (see Table 2.2). Connections between haplotypes represent a single base change in the ND2 sequence. Each small black circle along the connections represents a putative ancestral haplotype that was not sampled. The first number of each clade nesting corresponds to the number of mutational steps enclosed in that clade.35

Broad scale genetic variation
36
Table 2.5: Results of the nested clade geographic distance analysis of ND2 haplotype networks for M. fleayi. a) Southern Network and b) Northern Network. The nested design is shown in Figure 2.5 with numbers shown in the haplotype/clade column corresponding to the clades shown in Figure 2.5. Clades that showed no geographical or genetic variation are not included. Significant χ2 (p<0.05) values are indicated by *. Significantly small (S) and significantly large (L) values are shaded (p < 0.05). For the total cladogram, clade 4-1 was identified as the interior clade as it included the haplotype (0 – step clade) with the largest outgroup probability (H-1). The inference key couplet sequence and the biological inference for each significant nested clade are listed. (RGF = restricted gene flow, IBD = isolation by distance, RE = range expansion, CRE = contiguous range expansion)
a) Southern Network
Nesting Clade
location χ2 statistic
Haplotype or
clade number Dc Dn
Inference key
= conclusion
One Step Clades
1 – 3 Interior 15.0 * 4 4.228 S 4.735 1, 2, 3, 4
Tip 17 0.0 4.769 = RGF / IBD
Tip 18 0.0 S 5.655
I – T 4.228 L -0.477
1 – 4 Interior 12.0 9 18.809 22.2 Non significant
Tip 11 0.0 14.65 S χ2 value
Tip 17 0.0 15.623
I – T 18.809 7.223 L
1 – 7 Interior 104.364* 1 65.152 65.385 1, 2, 11, 17
Tip 10 0.0 148.364 L = Inconclusive
Tip 20 0.0 45.788
Tip 21 0.0 82.649
Tip 23 0.0 55.314
I – T 65.152 -30.711
1 –11 Interior 6.0 6 1.843 2.919 Non significant
Tip 8 1.154 2.377 χ2 value
I - T 0.689 0.543
Two- step clades
2 – 1 Tip 20.238 1 – 1 0.0 12.544 L Non significant
Tip 1 – 2 8.417 8.043 χ2 value
Interior 1 – 3 4.823 4.839 S
I – T -2.543 -3.767
2 – 2 Tip 94.448* 1 – 4 17.827 38.329 1, 2, 3, 4
Tip 1 – 5 0.0 S 44.413 = RGF/IBD
Tip 1 – 6 0.0 152.523
Interior 1 – 7 68.526 66.882
I – T 60.299 L 16.960
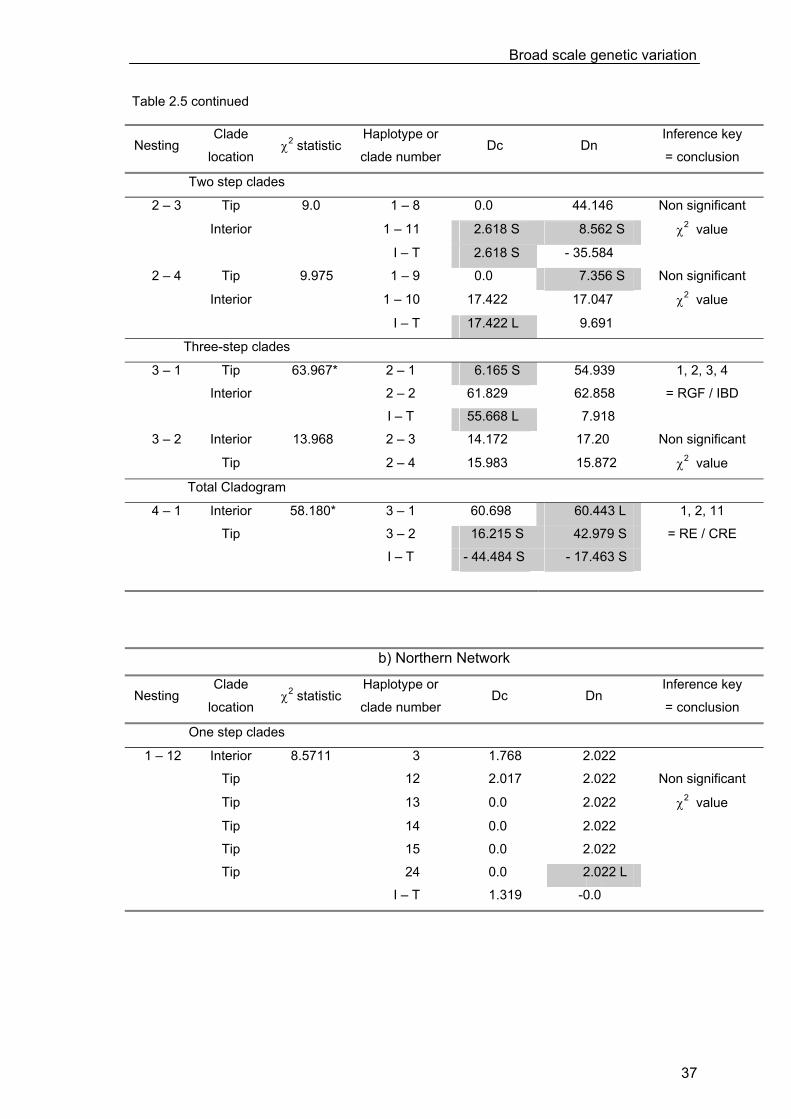
Broad scale genetic variation
37
Table 2.5 continued
Nesting Clade
location χ2 statistic
Haplotype or
clade number Dc Dn
Inference key
= conclusion
Two step clades
2 – 3 Tip 9.0 1 – 8 0.0 44.146 Non significant
Interior 1 – 11 2.618 S 8.562 S χ2 value
I – T 2.618 S - 35.584
2 – 4 Tip 9.975 1 – 9 0.0 7.356 S Non significant
Interior 1 – 10 17.422 17.047 χ2 value
I – T 17.422 L 9.691
Three-step clades
3 – 1 Tip 63.967* 2 – 1 6.165 S 54.939 1, 2, 3, 4
Interior 2 – 2 61.829 62.858 = RGF / IBD
I – T 55.668 L 7.918
3 – 2 Interior 13.968 2 – 3 14.172 17.20 Non significant
Tip 2 – 4 15.983 15.872 χ2 value
Total Cladogram
4 – 1 Interior 58.180* 3 – 1 60.698 60.443 L 1, 2, 11
Tip 3 – 2 16.215 S 42.979 S = RE / CRE
I – T - 44.484 S - 17.463 S
b) Northern Network
Nesting Clade
location χ2 statistic
Haplotype or
clade number Dc Dn
Inference key
= conclusion
One step clades
1 – 12 Interior 8.5711 3 1.768 2.022
Tip 12 2.017 2.022 Non significant
Tip 13 0.0 2.022 χ2 value
Tip 14 0.0 2.022
Tip 15 0.0 2.022
Tip 24 0.0 2.022 L
I – T 1.319 -0.0
Broad scale genetic variation
38
The analysis indicated phylogeographic structure at higher clade levels, and
absence of geographical structuring within most of the lower clade levels (Table 2.5).
Significantly small geographical associations across the highest clade nestings (clade
level 3 and 4) combined with comprehensive sampling of known populations and non-
overlapping geographical ranges of nested clades, resulted in the inference of
restricted gene flow/isolation by distance and contiguous range expansion. The total
cladogram suggested that the predominant historical evolutionary process has been
contiguous range expansion. The creation of two networks and the large number of
missing haplotypes between the southern and northern networks is indicative of
allopatric fragmentation at the level of species distribution.
Significantly small Dc and significantly large Dn values of haplotypes revealed
restricted gene flow with isolation by distance within the McPherson Range (Clade 1-3).
Similar low level analysis within other forest fragments were either inconclusive (Clade
1-7) or the chi-squared contingency table analysis showed no significant geographical
structuring of haplotypes (p>0.05).
Application of 1.4% sequence divergence per million years, based on the ND1
gene (Macey et al. 1998a) suggests that the divergence among some of the forest
fragments loosely correspond to the late Tertiary. The average genetic divergence
estimate between the northern and southern fragments (3%) suggests differentiation
occurred approximately 2.14 mya during the Pliocene (5.3 – 1.8 mya). Sequence
divergence between fragments within the southern distribution of the species’ ranges
from 0.1 to 0.6% (Table 2.3) and this corresponds to a relatively recent Pleistocene
(1.8 mya – 10,000 ya) differentiation of approximately 0.07 – 0.43 mya.
2.4 Discussion 2.4.1 Broad scale genetic variation - northern and southern forest
fragments
The 27 haplotypes observed in the mtDNA data were clustered into two distinct,
highly divergent and geographically separate clades. The northern clade haplotypes
were observed exclusively in the Conondale Range while the southern clade
haplotypes were distributed across the remaining six forest fragments; McPherson
Range, Springbrook Plateau, Main Range, Tooloom Range, Nightcap Range and Mt
Barney, with small but significant spatial structuring of haplotypes across these
fragments.

Broad scale genetic variation
39
The majority of sequence variation was present among forest fragments and
significant structuring was found among forest fragments, among populations within
forest fragments and among all populations. High average sequence divergence
between fragments also indicates restricted gene flow among isolated forest fragments.
All forest fragment pairwise comparisons were significant apart from Main Range and
McPherson Range with Tooloom Range and the comparison of Springbrook Plateau to
Nightcap Range. Surprisingly, forest fragments that were geographically close were not
necessarily those found to have non-significant comparisons. These data suggest that
gene flow between populations found in discrete forest fragments has not occurred for
a significant period of evolutionary time.
Relatively high haplotype diversity was found in a number of the forest
fragments sampled. The similarity in haplotype diversity between isolated forest
fragments implies historically similar effective population sizes for the species within
currently isolated forest fragments. Nested clade analysis revealed a complex history
with interacting processes of vicariance, colonization and range expansion
superimposed over locally restricted gene flow. This pattern emerged on two time
scales, with the species containing two deeply divergent lineages present between the
northern and southern forest fragments, representing allopatric fragmentation. The
genetic signal of allopatric fragmentation is evident when there is strong geographical
clustering of haplotypes, especially when the haplotypes are separated by long branch
lengths (Avise 1994; Templeton 1998; Templeton et al. 1995). There is also a much
shallower coalescence of haplotypes, indicating a relatively recent common ancestry
across a number of currently occupied habitat fragments within the southern forest
fragments.
2.4.2 The influence of population declines on genetic structure of
M. fleayi
Haplotype diversity within M. fleayi did not differ substantially across forest
fragments especially when the influence of sample size is considered. Fragments with
low levels of nucleotide and haplotype diversity were often those with the smallest
number of populations sampled and the smallest overall sample sizes. Increased
sample sizes may well have revealed the presence of low frequency endemic
haplotypes within these populations, increasing haplotype diversity. Small sample sizes
were acquired for a number of sites across the species distribution, despite repeated
efforts to increase sample size. This may reflect current small population sizes as only

Broad scale genetic variation
40
small numbers of adults or tadpoles could be found in these locations. However, well
sampled sites also showed low numbers of haplotypes and low levels of both haplotype
and nucleotide diversity, despite large sample sizes.
The small sample sizes for the Tooloom Range (6) and Nightcap Range (4) and
the frequency of shared haplotypes may be responsible for the non significant fragment
level comparisons between these and other southern forest fragments. McGuigan et al.
(1998) found much larger levels of sequence divergence between isolated forest
fragments of comparable geographic distance, despite smaller sample sizes for many
forest fragments. Litoria pearsoniana from both the Main and Border Ranges were
found to be 0.9% and 0.5 % divergent from the Gibraltar Range and no sampled
haplotypes were found to occur in more than one forest fragment. However, small
sample sizes for M. fleayi from some sites are likely to be representative of current
population sizes and reflect the current level of genetic diversity within forest isolates.
Recent unexplained declines in Australian amphibians (Tyler & Davies 1985;
Osborne 1989; Czechura & Ingram 1990; Ingram & McDoanld 1993; Laurance 1996;
Alfords & Richards 1999; Hero et al. 2002), including M. fleayi, potentially influenced
sample sizes and subsequently the low levels of genetic structuring among southern
forest fragments. Mixophyes fleayi has apparently disappeared from some sites where
it was previously recorded and declines at other sites are suspected (McDonald 1991;
Ingram & McDonald 1993; Mahony 1996; Mahony et al. 1997; Goldingay et al. 1999;
Hines et al. 2002). Dramatic declines, particularly in population size, across the
distribution of this species (Hines et al. 1999) will have potentially led to significant
decreases in effective population size and the extinction of low frequency endemic
haplotypes within small, isolated populations. In extreme cases such declines may
mean the ancestral haplotype is lost, however, declines would also explain the low
haplotype diversity observed in some of the geographically isolated populations (e.g.
Gap Creek West, Yabbra Creek) due to loss of low frequency endemic haplotypes.
The extinction of endemic haplotypes due to small remaining population size
and subsequent genetic drift is more likely to be responsible for the observed low levels
of genetic structuring between some forest fragments than sharing of haplotypes due to
recent terrestrial dispersal. Large expanses of agricultural land, limited dispersal ability
and the lack of extant populations between forest fragments support the hypothesis of
no recent connectivity between some forest fragments. Population pairwise ΦST values
suggest a pattern of isolation by distance within continuous forest fragments with some
level of contemporary terrestrial dispersal evident between geographically close
populations. Limited gene flow was found between populations much closer (e.g.
Cainbable – Bundoomba, separated by 3.68 km) than some of the forest fragments

Broad scale genetic variation
41
exhibiting non-significant comparisons (e.g. Yabbra – Main Range populations,
separated by 44 – 79 km). Barriers within continuous forest habitat may well inhibit
dispersal between geographically close populations. However, they are unlikely to
influence dispersal more than the presence of agricultural land and the absence of
suitable habitat between isolated forest fragments. Restricted gene flow within
continuous habitat is further investigated with increased sample sizes in chapter 3.
2.4.3 Implications for wet forest history
Mitochondrial DNA sequence variation within M. fleayi reveals substantial
geographic structuring, with the Conondale Ranges (northern forest fragment)
representing an evolutionary divergent lineage, separate from that found in forest
fragments across the southern distribution of the species. The average genetic
divergence estimate between the northern and southern forest fragments suggests
differentiation took place approximately 2.14 million years ago (mya) during the early
Pliocene (5 – 1.8 mya). The presence of divergent lineages within the species, from
north and south of the Brisbane River Valley (BRV), indicates continuous occupation of
forest fragments separated by an extensive area of low elevation, dominated by warm,
dry unsuitable habitat for this species. The intraspecific divergences observed between
the north (Conondale Range) and south (all other forest fragments) (2.7 – 3.2 %) can
be explained by allopatric separations of mesic rainforest due to climate fluctuations of
the Pliocene (Kershaw 1988; 1994; Kershaw et al. 1994).
Studies of a wide range of flora and fauna within Australia have shown
significant phylogeographic structure among conspecific populations due to bioclimatic
and landscape changes during both the Tertiary (65 – 1.8 mya) and Quaternary
periods (1.8 mya – present) (McGuigan et al. 1998; Schneider et al. 1998; Hughes et
al. 1999; Wong et al. 2004). There is evidence for changes to river drainage patterns
and range contraction and expansion of habitat (Kershaw 1994) during these periods.
Geological and palaeontological studies suggest eastern Australia experienced typical
glacial-interglacial climatic fluctuations and changes in sea level during the Tertiary,
with vegetation and available habitat undergoing environmental and geographic
changes associated with these events. The wet forest along the eastern coastline
experienced significant changes coinciding with these climatic changes. After the
Pliocene, progressively cooler and drier conditions forced formerly widespread
rainforest to contract to isolated pockets along the east coast (Galloway & Kemp 1981;
Kershaw 1981; White 1994).

Broad scale genetic variation
42
Climates in glacial periods were generally cooler and drier than in
corresponding interglacial periods (Longmore & Heijnis 1999) and there is general
continent-wide support for the presence of effectively wetter conditions during
interglacial periods (Kershaw et al. 2003). Rainforest range contractions and isolation
due to cooler, drier climates during glacial periods, means dispersal among rainforest
patches was potentially not possible due to increasingly unfavourable environmental
conditions. The break between the two main areas, across the BRV, is consistent with
the separation of Pliocene refugia predicted by paleoclimatic modeling for the historical
distribution of another rainforest restricted frog species, Litoria pearsoniana (McGuigan
et al. 1998), which is co-distributed with M. fleayi and also utilizes rainforest stream
habitats (McGuigan et al. 1998). The magnitude of the observed sequence divergence
in M. fleayi approaches that found across the BRV for L. pearsoniana (3.26%) and is
also of similar magnitude to the divergence observed between geographically
congruent phylogeographical divisions for species of reptiles and amphibians from the
Wet Tropics (see Joseph et al. 1995; Moritz et al. 1997; Schneider et al. 1998;
Schneider & Moritz 1999; Cunningham 2001).
Studies on the genetic variation within amphibians inhabiting the rainforests of
south-east Queensland are scant. Having a similar degree of vagility to amphibians,
patterns of genetic variation within endemic species of reptiles are likely to be
comparable to those found in amphibians. Eulamprus martini, a reptile distributed
across the Conondale and McPherson Range regions, exhibits levels of sequence
divergence (3.1%) (Moritz & Playford 1998) similar to those found in both M. fleayi and
L. pearsoniana from the same regions.
The Pleistocene is thought to have been a period of intense climatic fluctuations
(Nix 1991; Hope 1994). Pleistocene rainforests in southern areas of Queensland were
probably restricted to sheltered patches as opposed to extensive refugial areas, with
patches likely to be of smaller size than those found in north Queensland as the current
areas of rainforest are smaller in extent (Winter 1988). The stability of these patches,
along with the frequency of connections between them, was likely to be just as
important as the size of the patches (Williams & Pearson 1997). The smaller extent and
lower altitude of southern Queensland rainforest fragments means they are expected to
have been more severely affected by climate fluctuations than rainforest fragments in
northern Queensland, with the influence of fire also being significant (Hopkins et al.
1993). Small patch size, restricted distribution and fluctuating climatic conditions may
well have meant that populations of M. fleayi were more susceptible to stochastic
events and local extinction.

Broad scale genetic variation
43
The larger sequence divergence between forest fragments north and south of
the BRV support the idea that these two areas have been separated for much longer
than the forest fragments located south of the BRV have been from each other.
Sequence divergence between fragments south of the BRV ranged from 0.110 %
(Tooloom and Main Range) to 0.605 % (McPherson and Main Range). This
corresponds to gene flow between some of the southern forest fragments occurring
approximately 400,000 ybp, during the Pleistocene. The non significant pairwise ΦST
comparisons observed between some of the fragments, combined with low sequence
divergence levels indicate dispersal between the Tooloom and Main Ranges
approximately 78,500 ya, corresponding to the maximum expansion of complex
rainforest characterised by rainforest angiosperms particularly from 130 000 – 75 000
ya (Kershaw et al. 2003). The low level of genetic structuring between rainforest
fragments found across the southern distribution may well be the result of an increased
capacity for dispersal across once connected forest fragments in this region. The forest
fragments located south of the BRV are separated by smaller geographical distances
than that spanning the BRV, with areas of higher altitude found between southern
forest fragments.
Inferences about rainforest history are further strengthened when information is
available from multiple co-distributed species; comparative phylogeography (Avise
1994). Many of the investigations into genetic variation of amphibian species found
within south-east Queensland and north-east New South Wales have to date
concentrated on identifying species and clarifying taxonomic boundaries within species
groups (e.g. Donnellan et al. 1999; Donnellan & Mahony 2004; Knowles et al. 2004)
rather than identifying intraspecific genetic variation (but see McGuigan et al. 1998).
Subsequently identified sequence divergence between lineages is often much greater
than that found within this study. Knowles et al. (2004) investigated both allozyme and
mitochondrial nucleotide diversity within the amphibian genus Philoria with specimens
sampled from the same forest fragments as those in the southern distribution of M.
fleayi. Phylogenetic divergence between forest fragments was found to correspond to
evolutionary lineages of the order expected for sister species pairs of amphibians
(Johns & Avise 1998) with separation of the minimally divergent mtDNA clades
estimated to have been occurring at least since the early Pliocene (2.16 to 6.74 mya)
(Donnellan & Mahony 2004). Although used to investigate species boundaries, the
highly divergent clades found within Philoria correspond to the forest fragments
sampled for genetic variation within M. fleayi. Species in the genus Philoria are much
smaller (SVL < 37 mm), have a much more restricted geographical distribution and are
likely to be less mobile than the larger M. fleayi and as such are expected to show a

Broad scale genetic variation
44
higher level of genetic structure and sequence divergence. Limited dispersal ability is
expected to exacerbate the influence of climate induced rainforest contractions.
Euastacus sulcatus, a species of crayfish is also restricted to disjunct rainforest
fragments of south-east Queensland. This species has been shown to display a
‘classic’ pattern of mountain top differentiation with lowland areas separating forest
fragments acting as effective barriers to dispersal (Ponniah 2002). Mitochondrial CO1
data for this species places separation of the Main Range and McPherson Range
populations at 335,000 ya. This is similar to estimates of rainforest isolation between
these two areas based on the ND2 data for M. fleayi (432,000 ybp) during the late
Pleistocene. Separation dates for Main Range from Mount Barney were also similar
with estimates of 262,000 ybp based on E. sulcatus molecular data and 258,000 ya for
M. fleayi.
Deep divergence (5.73%) was found between sister species of E. sulcatus and
E. hystricosus (Ponniah 2002) corresponding to rainforest contraction of the late
Tertiary and subsequent separation of rainforest fragments (Kershaw 1988). The deep
divergence and major differentiation within mtDNA of M. fleayi supports Pliocene
contractions in rainforest habitat, suggesting that wet forest in southeast Queensland
and northeast New South Wales was restricted to two major geographically isolated
habitat refugia; north and south of the BRV. The shallower genetic divergences within
the species throughout its southern distribution indicate that ancestral populations and
the rainforest they occur in were further confined to even smaller isolates south of the
BRV during the climate fluctuations of the Pleistocene.

45
Chapter 3. Fine scale genetic structure of Mixophyes fleayi 3.1 Introduction
Patterns of dispersal have profound impacts on the dynamics of local
populations as well as greatly influencing the genetic resources of populations and the
ability of a species to respond to environmental and demographic changes (Tessier et
al. 1991; Whitlock 1992; McCauley 1993). Amphibians are traditionally thought to
possess limited dispersal ability and to be very philopatric (Daugherty & Sheldon 1982;
Reading et al. 1991; Sinsch 1991; Kusano et al. 1999). This limited movement between
breeding sites and populations has been used to explain significant genetic subdivision
among populations over relatively short geographic distances (e.g. Hitchings & Beebee
1997; Driscoll 1998a, 1998b; Shaffer et al. 2000; Veith et al. 2002; and see Table 3.6).
A number of amphibian species have been found to depart from this pattern of
strong site fidelity, displaying low levels of population differentiation (due to high levels
of gene flow) between populations considered to be geographically distant (Seppä &
Laurila 1999; Tallmon et al. 2000; Newman & Squire 2001). Studies on the exchange
of individuals between breeding localities in other species have demonstrated that a
number of amphibians show frequent dispersal of individuals between populations,
existing in systems of interacting local populations or metapopulations (Gill 1978;
Breden 1987; Reh & Seitz 1990; Sinsch 1991, 1992a, 1992b; Sjögren 1991; Alford &
Richards 1999; Marsh & Trenham 2001). Within these systems, dispersal of juveniles
and adults facilitates recolonization of vacant habitat and often counteracts local
extinction in populations where reproductive success is low (Sinsch & Seidel 1995).
These dispersing individuals not only influence the dynamics of local populations but
greatly affect their genetic structure.
Despite the contradictions between studies that proclaim amphibians to be
highly philopatric and those that show low levels of genetic subdivision, there are few
comprehensive, population level, genetic studies focused on quantifying dispersal
between neighbouring sites. Those that have been undertaken usually focus on pond
breeding species, largely ignoring both stream and terrestrial breeders and are
conducted across species distributions’ as opposed to investigating population
structure on fine geographic scales.
The genetic structuring of amphibian populations is likely to be reliant on the
terrestrial dispersal of adults and juveniles rather than aquatic larval dispersal
(reviewed in Waldman & McKinnon 1993). Previous studies have indicated that
juveniles move away from the natal pond, while adults tend to remain at the site where

Fine scale genetic structure
46
they first bred (Jameson 1956; Gill 1978, 1979; Breden 1988; Daugherty & Sheldon
1982; Berven & Grudzien 1990; Reading et al. 1991; Seburn et al. 1997).
Predominantly aquatic dispersal in stream breeding species would lead to genetic
structuring at a broad scale, among major catchments. Alternatively, terrestrial
dispersal is likely to lead to isolation by distance between geographically distant
populations regardless of catchment boundaries.
In spite of recent dramatic declines within many Australian amphibian species,
published population level genetic studies are especially scarce for Australian frogs,
with a few noteable exceptions (e.g. Driscoll et al. 1994; Driscoll 1998; Burns et al.
2004). Within this context, this component of the study provides information on
population level genetic variation over a range of geographical distances for the
endangered Australian myobatrachid frog, Mixophyes fleayi. It also provides one of the
few studies into fine scale genetic structuring for a stream breeding anuran. Terrestrial
dispersal between sites in this species is likely to be infrequent and due largely to
movements of adult females or juveniles (see Chapter 4). If terrestrial dispersal does
influence population structuring within M. fleayi, it is expected that patterns of
mitochondrial DNA (mtDNA) variation will show indications of isolation by distance
within continuous forest fragments.
This fine scale study includes intensive local level sampling from three forest
fragments known to contain M. fleayi. As previously mentioned (Chapter 1) M. fleayi
has reportedly undergone recent population declines. However, sampling still included
sites and forest fragments spanning the current known distribution of the species in
south-east Queensland. It builds on the investigation of broad scale genetic structuring
(Chapter 2), providing detail on the genetic variation within continuous habitat and
identifying genetically distinct populations. Specifically this chapter has four aims; 1) to
examine and document mtDNA patterns of genetic variation at a fine scale for M. fleayi;
2) to investigate patterns of dispersal; 3) to quantify the magnitude of contemporary
gene flow between sites within forest fragments; and 4) to identify possible barriers to
dispersal.

Fine scale genetic structure
47
3.2 Methods 3.2.1 Specimen collection and sampling strategy
Samples were collected from the Conondale, McPherson and Main Ranges
over three consecutive breeding seasons from late August to early May (2001 – 2004).
Tissue samples were collected from a total of 303 individuals from nine sites across
three forest fragments (Table 3.1). Site numbers correspond to those used in Chapter 2
(Figure 2.1, Table 2.1). A larger number of sites within each isolated forest fragment
were sampled for the broad scale investigation of genetic variation (Chapter 2) and
hence site numbers used in this chapter are not consecutive to allow for consistency.
Tissues were collected as per Chapter 2, Section 2.2.1. Sites requiring the
collection of tissue from tadpoles and the number of tadpoles sampled are show in
Table 3.1. The sampling strategy for this component of the study aimed to maximise
sample sizes at each site. Therefore, streams targeted for sampling were those thought
to support at least 30 individuals, allowing for at least two sites to be sampled within
each of three forest fragments. Other sites are currently thought to support small
numbers of individuals or access is too difficult to allow for more extensive sampling.
Individual tissue samples were stored in 70% ethanol until extraction of mtDNA.
Table 3.1: Sites sampled for population genetic analysis within each forest fragment. Site numbers correspond to Figure 2.1. The sample size from each site is shown as is the number and type of tissues collected from each site. (TC = toe clip from adult/juvenile; TP = tadpole tail clip).
Forest fragment and site number
Sample site Sample size
Latitude (south)
Longitude (east)
Tissue type
Conondale Range
1 North Booloumba 40 -26o 42’ 49” 152o 35’ 05” 35 TC, 5 TP
2 East Kilcoy Creek 35 -26o 45’ 00” 152o 35’ 00” 20 TC, 15 TP
McPherson Range (Lamington Plateau)
3 Cainbable Creek 50 -28o 11’ 34” 153o 06’ 47” 50 TC
4 Morans Creek 3 -28o 14’ 04” 153o 07’ 35” 3 TC
5 Stockyard Creek 30 -28o 12’ 33” 153o 06’ 18” 30 TC
6 Bundoomba Creek 45 -28o 13’ 09” 153o 08’ 22” 45 TC
8 Pyramid Creek 25 -28o 11’ 28” 153o 09’ 36” 25 TC
Main Range
14 Dalrymple Creek 35 -27o 59’ 08” 152o 21’ 29” 5 TC
15 Gap Creek West 40 -28o 03’ 03” 152o 22’ 56” 40 TC

Fine scale genetic structure
48
3.2.2 Molecular techniques
3.2.2.1 Extraction of DNA and PCR reactions
Total genomic DNA was isolated following a modification of a Hair Follicle
Extraction protocol. This protocol involved the use of small amounts of tissue to which
was added 100 μl of Hair Lysis Buffer and 0.5 μl of 20 mg/ml Proteinase K. A stock
solution of Hair Lysis Buffer was made of 5 ml of 10x PCR buffer (Fisher-Biotech, W.A.,
Australia), 5 ml of 25 mM MgCl2 (Fisher-Biotech, W.A., Australia) and 250 μl of TWEEN
20. Samples were incubated for 45 minutes at 60oC and then held at 95oC for a further
45 minutes before being stored at –20oC until being used for PCR amplification. PCR
procedures follow the protocol outlined in Chapter 2, Section 2.2.2.1.
The mtDNA ND2 fragment was amplified for this analysis. The strictly maternal
mode of transmission and lack of intergenerational recombination associated with
mtDNA results in an effective population size four times smaller than that of nuclear
DNA (nDNA). This, combined with a higher mutation rate, means that genetic
equilibrium is reached more rapidly in mtDNA markers. Rates of divergence among
populations due to the effects of genetic drift can be up to four times greater than for
nuclear loci (Birky et al. 1983). This makes mtDNA particularly sensitive for detecting
intraspecific genetic structure or differentiation among populations (Shaffer et al. 2000;
Smith & Green 2004).
3.2.2.2 Haplotype screening
Mitochondrial DNA can be screened to identify the different haplotypes among
a large number of samples. Only one individual of each assigned haplotype then needs
to be sequenced. Screening techniques provide the resolution of direct sequencing, but
with less time, effort and expense. Denaturing Gradient Gel Electrophoresis (DGGE)
and Single Strand Conformation Polymorphisms (SSCP) both provide efficient means
of screening large numbers of samples for the presence of haplotype variation among
homologous PCR fragments (Orita et al. 1989; Campbell et al. 1995). DGGE and
SSCP methods were utilised to screen all samples, providing independent confirmation
of the assignment of haplotypes for samples that were not directly sequenced.
Fine scale genetic structure
49
Denaturing Gradient Gel Electrophoresis - DGGE
The denaturing characteristics of DNA fragments are dependent on their base
pair composition (Poland 1974; Fixman & Friere 1977). This subsequently influences
the electrophoretic migration of the fragment through a denaturing gel, as the rate of
movement will slow at a range of denaturing concentrations during which the helical
structure of the DNA unwinds. Fragments with different base composition will travel
through a denaturing gel at different rates. If complementary strands completely
disassociate over the denaturing gradient differences will not be detected. This can be
overcome with the addition of a GC-clamp to one of the primers used in PCR (Sheffield
et al. 1989). In DGGE (Myers et al. 1985, 1985b) the denaturing environment is created
by a combination of uniform temperature and a linear chemical denaturing gradient
formed by a mixture of urea and formamide. In parallel DGGE, the denaturing gradient
is parallel to the electric field and the range of denaturant contained in the gel is
adjusted to allow better separation of fragments (Myers et al. 1987).
The denaturing gradient for the targeted DNA fragment was determined using
vertical, linear gradient gels with an original gradient of 0 – 100%, on a Bio-Rad
DCodeTM universal mutation detection system. To maximise resolution, 40%
acrylamide/bis (37.5:1) (Bio-Rad, CA, USA) was used to make stock solutions of 0%
and 100% denaturing 6% acrylamide gels. For the 0% gel, 15 ml of 40%
acrylamide/bis, 2 ml of 50x TAE buffer and 83 ml of ddH20 were used. The 100%
denaturing gel consisted of the same volumes of 40% acrylamide/bis and TAE buffer
but in addition required 40 ml of deionized formamide (Sigma-Aldrich, Steinham,
Germany) and 42 g of urea (Sigma-Aldrich, NSW, Australia), with a corresponding
decrease in the volume of ddH20 required to make a total volume of 100 ml. The gel
solution was degassed prior to the addition of 150 μl of 10% APS (ammonium
persulfate, Amresco, Ohio, USA) and 8 μl of TEMED (Sigma-Aldrich, MO, USA).
Gel plates (16 x 16 cm) were used to pour 1.0 ml parallel gradient gels using
the DCode TM gradient delivery system. Gels were top loaded with the 100% denaturing
solution poured first to ensure an increasing denaturing gradient as the samples
travelled through the gel. The DCode TM buffer tank was filled with 7 L of 1x TAE
running buffer and preheated to 60oC prior to loading of samples. Two μl of PCR
product was mixed with 10 μl of 2x gel loading dye (0.25 ml of 2% bromophenol blue,
0.25 ml of 2% xylene cyanol, 7.0 ml of 100% glycerol and 2.5 ml of ddH20).
The point at which the target DNA denatured was used to calculate the optimal
denaturing gradient for further DGGE and screening of samples. Using this information,
gels with a 15 – 45% denaturing gradient were run at 60oC and 75 V for 14 hours. Two

Fine scale genetic structure
50
gels were run simultaneously allowing the screening of 32 samples, including known
haplotype references. Samples were independently run more than once in combination
with different reference samples to confirm identification.
The addition of a 24 base pair GC clamp to one of the primers used in PCR
ensured that the region screened for variation was in the lower melting domain and that
the DNA fragment remained partially double stranded, ensuring samples did not
denature entirely. PCR reactions were performed as outlined in Chapter 2, section
2.2.2 with the addition of a GC clamp to the 5’ end of one of the primers utilised
(GCGCCCGGCCCGCCGCCCCCGCCC-primer) (Sigma-Genesis, NSW, Australia).
PCR products produced from reactions with clamps placed on either primer were
screened, with the H4980 GC clamp primer showing greater resolution of haplotypes.
All subsequent PCR reactions utilised this primer.
Heteroduplex Analysis (HA) can be used in conjunction with DGGE to enhance
visual detectibility of sequence variation and can greatly increase the sensitivity of the
screening technique. Heteroduplexing is used to combine a reference mtDNA sample
to the homologous section from a standard individual to enhance identification of
mutational differences among individuals (Campbell et al. 1995). The resulting
sensitivity of the screening technique is very high and can result in detection of single
base pair substitutions (Lessa & Applebaum 1993) allowing relatively easy and reliable
identification of haplotypes.
A heteroduplex has a mismatch in the double-strand DNA causing a distortion
in its usual conformation. This leads to a subsequent destabilizing effect, causing the
double strands to denature at a lower concentration of denaturant and the heteroduplex
bands to migrate more slowly than corresponding homoduplex bands. The results of
direct sequencing were used to select reference samples, of known haplotype, for HA.
Two samples from the Conondale Range (Hap C-A, samples 41C & 22H) were used in
HA of McPherson and Main Range samples, while a single individual from the
McPherson Range (Hap L-A sample 17C) was used for HA of all Conondale Range
samples.
Heteroduplex samples were created by mixing 2 μl of PCR product from both
the reference individual and an unknown individual in the same tube. This was then
denatured at 95oC for five minutes and then reannealed at 50oC for 15 minutes before
being allowed to cool to room temperature. Two products resulted from this
reannealing: the homoduplex - the native double strand DNA for both individuals; and
the heteroduplex - double strand DNA consisting of one strand from each individual.

Fine scale genetic structure
51
DNA was visualized using Cyber-Green staining. The gel was placed in a
solution of 25 μl of SYBR® Green I nucleic acid gel stain (Molecular Probes, Oregan,
USA) and 300 ml of 1x TAE running buffer for 10 minutes and then visualized by
transillumination and photographed on a Bio-Rad Gel Doc™ 1000 image acquisition
system and Quantity One software (Bio-Rad, Australia). Haplotypes were scored based
on visual interpretation and each individual was assigned a distinguishing haplotype
number. At least two representative individuals for each unique haplotype were
sequenced where possible. Random samples of each haplotype were sequenced to
confirm haplotype assignment.
Single Strand Conformation Polymorphism - SSCP
In conjunction with screening of samples with DGGE, the Bio-Rad DCode
system is also capable of performing single strand conformation polymorphism (SSCP)
screening. This technique for screening haplotypes is based on the principle that
single-stranded DNA has a sequence specific secondary structure. This secondary
structure is affected by sequence differences as small as one base pair and will result
in mobility differences between fragments. These single base pair differences can
subsequently be detected by electrophoresis in a nondenaturing polyacrylamide gel
(Orita et al. 1989). Despite requiring optimization of several gel electrophoresis
conditions (e.g. temperature, gel concentrations and additives and crosslinking ratio)
SSCP provides an easy and widely used mutation screening technique.
Eight percent acrylamide/bis (37.5:1) gels containing 5% glycerol were run for
three hours at 20 W and at 15oC in 1x TBE running buffer. The gels contained 8 ml of
40% acrylamide/bis, 4 ml of 10x TBE, 2 ml of 100 % glycerol and 26 ml of ddH20. Two
hundred μl of 10% APS and 20 μl TEMED were again added to the degassed gel
solution prior to pouring. Gels were allowed to set for a minimum of one hour before
being loaded into the DCode chiller bath.
Five μl of non GC clamp PCR product for each sample was added to 10 μl of 2x
gel loading dye (0.05 g of bromophenol blue, 0.05 g of xylene cyanol, 9.5 ml of
formamide, 0.4 ml of 0.5 M EDTA, pH 8) and denatured at 95oC for five minutes.
Samples were then immediately placed on ice to ensure that DNA remained single
stranded. Two reference samples were run on each gel for haplotype comparison in
addition to one non-denatured double strand control. The gels were stained with
SYBR® Green I nucleic acid gel stain and visualized and scored as outlined above for
DGGE gels.

Fine scale genetic structure
52
A number of screened samples were chosen randomly for direct sequencing to
confirm the assignment of haplotypes. Each sample was screened using both DGGE
and SSCP with the assignment of haplotypes in all cases confirmed by both methods
and direct sequencing of randomly chosen samples.
3.2.2.3 DNA sequencing and sequence alignment
PCR product purification, sequencing and sequence alignment procedures
followed the methods outlined in Chapter 2, Section 2.2.2.2. At least two samples of
each haplotype identified during screening were sequenced from both 5’ and 3’
directions by the Griffith University Sequencing Facility.
3.2.3 Analysis
3.2.3.1 Mitochondrial DNA sequences
Exploratory data analysis followed the methods used in Chapter 2, section
2.2.3.1 including tests of neutrality, selection of the appropriate model of sequence
evolution and construction of the haplotype network.
3.2.3.2 Fine scale genetic structure
The spatial distribution of genetic variation was investigated using hierarchical
analysis of molecular variance (AMOVA; Excoffier et al. 1992), implemented using
Arlequin (Schneider et al. 2000) as outlined in Chapter 2, Section 2.2.3.2. Two different
sets of hierarchies were used for AMOVA. To test for the presence of genetic structure
among sites between and within forest fragments, sites were grouped accordingly. The
influence of catchment boundaries between and within continuous forest fragments
was also investigated in this manner. The presence of terrestrial dispersal between
sites across major catchments would lead to a lack of genetic structuring between
major catchments. In order to investigate the presence of significant genetic
differentiation at the fine scale, pairwise ΦST statistics were calculated.
Fine scale genetic structure
53
Due to the low vagility of amphibian species and the habitat requirements of M.
fleayi, the level of gene flow between sampled streams within continuous forest
fragments was expected to be low and dependant on the geographic distance between
sample sites. The predicted presence of terrestrial dispersal within the species meant
catchment boundaries were expected to have less influence on genetic structure than
geographic distance. The relationship between genetic distance and geographic
distance was tested using Mantel’s test (Mantel 1967) from the comparison of all
pairwise FST/(1-FST) values with pairwise geographic distances using the program
Arlequin (Schneider et al. 2000). The genetic data were analysed on two different
geographical scales: firstly across all sampled sites and secondly for sets of sites found
within forest fragments. Straight-line geographic distances between sampled sites were
calculated from the latitude and longitude co-ordinates obtained from GPS readings
and topographical maps. Comparing FST/(1-FST) values with geographic distance has
been shown to more accurately indicate isolation by distance than comparisons of FST
with geographic distance (Rousset 1997).
To estimate the number of migrants (Nm) between sites, Wright’s (1943)
equation, Nm = (1-FST)/4 x FST, was used. The accuracy of this method remains
debatable and in general calculations of migration rates from FST measures that
assume an island model of migration are recognised as having serious limitations
(Avise 2000). They do, however, provide estimates of the number of migrants and were
calculated as an indication of the magnitude of migration between sites. These values
should be taken only as an indication of dispersal and interpreted with caution, given
that the species investigated within this study, and stream dependant species in
general, are unlikely to meet the assumptions of the island models of migration used to
estimate Nm (equal effective sizes, island model of gene flow, demographic
equilibrium; Whitlock & McCauley 1999).

Fine scale genetic structure
54
3.3 Results 3.3.1 Haplotype distribution and composition
A total of 303 samples were collected from nine sites distributed across three
forest fragments (Table 3.1). The majority of samples collected were from individuals
that had already undergone metamorphosis, except in the two Conondale Range sites,
where collection of tadpole tail clips was required. Sample sizes greater than 30 were
obtained from all except two sites (Table 3.1). Both of these sites were in the
McPherson range and were restricted to 25 and 3 samples for Pyramid and Morans
Creek, respectively. These two locations were included in the analysis to encompass
sites at a range of geographical distances, representing multiple catchments (Pyramid
Creek) and reasonable sampling of sites known from the McPherson Range (Morans
Creek). The small sample size available for Morans Creek, however, does mean that
statistical comparisons involving this site should be interpreted with caution.
Screening and sequencing of the ND2 (NADH subunit 2) region resulted in
haplotype information for all 303 samples with 179 of these being directly sequenced to
confirm sequence variation and assignment of haplotypes. Thirty three (5.23%) of the
631 base pairs were variable, with 22 (3.5%) being parsimoniously informative
(Appendix 6).
There were 22 mtDNA haplotypes observed across the nine sites and the three
forest fragments sampled (Table 3.2). The McPherson Range contained the most
haplotypes (15), while the Conondale and Main Ranges contained six and three,
respectively. The common shared haplotype from Main Range (HM-1) was also found
in the McPherson Range (HL-2), in both the Cainbable and Bundoomba sites, while
HM-2 was also found in the McPherson Range (HL-1) in all sampled sites except
Pyramid Creek (Table 3.2).
Tajima’s test of neutrality indicated that variation in this DNA fragment is as
expected under selective neutrality (overall D = 1.53877, p > 0.05 NS). The best fit
model of sequence evolution was the HKY model (Hasegawa et al. 1985),
incorporating a gamma shape distribution of 0.0158 and with a transition/transversion
ratio of 7.5413. Base frequencies were estimated as 0.2926, 0.3230, 0.1332 and
0.2512 for A, C, G and T respectively.
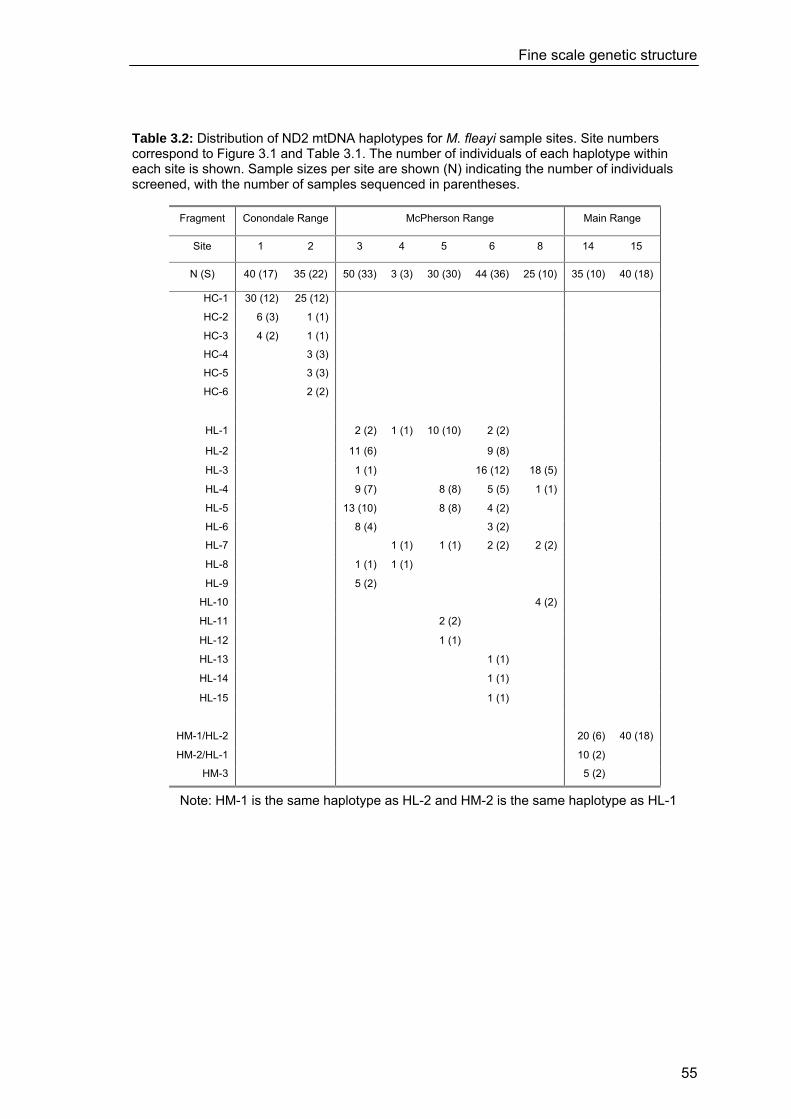
Fine scale genetic structure
55
Table 3.2: Distribution of ND2 mtDNA haplotypes for M. fleayi sample sites. Site numbers correspond to Figure 3.1 and Table 3.1. The number of individuals of each haplotype within each site is shown. Sample sizes per site are shown (N) indicating the number of individuals screened, with the number of samples sequenced in parentheses.
Note: HM-1 is the same haplotype as HL-2 and HM-2 is the same haplotype as HL-1
Fragment Conondale Range McPherson Range Main Range
Site 1 2 3 4 5 6 8 14 15
N (S) 40 (17) 35 (22) 50 (33) 3 (3) 30 (30) 44 (36) 25 (10) 35 (10) 40 (18)
HC-1 30 (12) 25 (12)
HC-2 6 (3) 1 (1)
HC-3 4 (2) 1 (1)
HC-4 3 (3)
HC-5 3 (3)
HC-6 2 (2)
HL-1 2 (2) 1 (1) 10 (10) 2 (2)
HL-2 11 (6) 9 (8)
HL-3 1 (1) 16 (12) 18 (5)
HL-4 9 (7) 8 (8) 5 (5) 1 (1)
HL-5 13 (10) 8 (8) 4 (2)
HL-6 8 (4) 3 (2)
HL-7 1 (1) 1 (1) 2 (2) 2 (2)
HL-8 1 (1) 1 (1)
HL-9 5 (2)
HL-10 4 (2)
HL-11 2 (2)
HL-12 1 (1)
HL-13 1 (1)
HL-14 1 (1)
HL-15 1 (1)
HM-1/HL-2 20 (6) 40 (18)
HM-2/HL-1 10 (2)
HM-3 5 (2)

Fine scale genetic structure
56
The haplotype networks for each forest fragment are shown in Appendix 7. The
distribution of haplotypes within forest fragments (Figure 3.1) shows no clear pattern of
haplotype distribution. Conondale sites showed a greater sharing of haplotypes
between sites than the other two forest fragments; three of the six haplotypes unique to
the Conondale Range were shared across both sites. The remaining three haplotypes
were endemic to East Kilcoy Creek, while North Booloumba contained no endemic
haplotypes (Figure 3.2 a)). Within the McPherson Range, eight of the 15 haplotypes
were shared across more than one site while the remaining seven were endemic to a
single location. None of the sampled haplotypes were found in all five sites, with three
(HL-1, HL-4, HL-7) being found in four of the five (Figure 3.2 b)). The two sites from
Main Range shared the most frequent haplotype (HM-1) with the two remaining
haplotypes (HM-2, HM-3) endemic to Dalrymple Creek; all 40 samples from Gap Creek
West were a single haplotype (Figure 3.2 c)).
The distribution and frequency of haplotypes across sites within forest
fragments support the hypothesis of restricted gene flow between streams within
continuous forest habitat (Figure 3.1; 3.2). Sharing of internal ancestral haplotypes
across numerous sites and low levels of sharing for derived haplotypes indicate low
levels of contemporary gene flow between geographically close sites irrespective of
catchment boundaries (Figure 3.3).

Fine scale genetic structure
57
Figure 3.1: Geographical distribution of haplotypes across a) the Conondale Range, b) the McPherson Range, and c) Main Range. Each haplotype is represented by a different colour (see networks). The proportion of individuals of each haplotype is presented for each sample site (Table 3.1), with the total number of individuals sampled at each site indicated by n.
N
Site 15 (n = 40)
Site 14 (n = 35)
Site 2 (n = 35)
Site 1 (n = 40)
Site 4 (n = 3)
Site 3 (n = 50)
Site 5 (n = 30)
Site 6 (n = 44)
Site 8 (n = 25)HM-1 HM-3
HM-2
c) Main Range
HL-9
HL-12
HL-7
HL-14HL-6
HL-13HL-8 HL-5
HL-2HL-1 HL-3
HL-4
HL-15
HL-11
b) McPherson Range
HC-1HC-2
HC-3
HC-5
HC-4
HC-6
a) Conondale Range
Main Range
McPherson Range

Fine scale genetic structure
58
Figure 3.2: Hypothesised haplotype networks for 24 M. fleayi haplotypes sampled across sites in a) Conondale Range, b) McPherson Range and c) Main Range (see key). Haplotypes are represented by coloured circles with circle size proportional to the frequency of individuals sampled with the haplotype (see key). Numbers inside each circle identify detected haplotypes (Table 3.1), sites and sample sizes. Connections between haplotypes represent a single base change. Each small black circle along the connections represents an unsampled putative ancestral haplotype.
HL-9(pop 3
n )5
HL-12(pop 5
n )1
HL-7(pop 4,5,6,8
n 1,1,2,2)
HL-14(pop 6
n )1
HL-6(pop 3,6
n )8,3
HL-13(pop 6
n )1 HL-8(pop 3,4
n )1,1
HL-5(pop 3,5,6n )13,8,4
HL-2(pop 3,6n )11,9
HL-10(pop 8
n )4
HL-1(pop 3,4,5,6n 2,1,10,2)
HL-3(pop 3,6,8n )1,16,18
HL-4(pop 3,5,6,8
n )9,8,5,1
HL-15(pop 6n )1
HL-11(pop 5
n )2
8. Pyramid
6. Bundoomba
5. Stockyard
4. Morans
3. Cainbable
McPherson Range Sitesb)
HM-1(pop 14,15
n )20,40
HM-3(pop 14
n )5
HM-2(pop 14
n )10
15. Gap Creek
14. Dalrymple Creek
Main Range Sitesc)
HC-1 (pop 1,2n 30,25)
HC-2 (pop 1,2
n 6,1 )
HC-3(pop 1,2
n 4,1 )
HC-5 (pop 2
n 3)
HC-4 (pop 2
n 3)
HC-6 (pop 2
n 2)
2. East Kilcoy
1. North Booloumba
Conondale Range Sitesa)

Fine scale genetic structure
59
Figure 3.3: Hypothesised haplotype networks for 24 M. fleayi haplotypes sampled across major catchments in a) the Conondale Range, b) the McPherson Range and c) Main Range (see key). Haplotypes are represented by coloured circles with circle size proportional to the frequency of individuals sampled with the haplotype (see key). Numbers inside each circle identify detected haplotypes (Table 3.1), sites and sample sizes. Connections between haplotypes represent a single base change. Each small black circle along the connections represents an unsampled putative ancestral haplotype.
HM-1(pop 14,15
n )20,40
HM-3(pop 14
n )5
HM-2(pop 14n )10
Condamine River
Main Range Catchmentsc)
HC-1 (pop 1,2n 30,25)
HC-2 (pop 1,2
n 6,1)
HC-3 (pop 1,2
n 4,1)
HC-5(pop 2
n 3)
HC-4(pop 2
n 3)
HC-6 (pop 2
n 2)
Brisbane River
Mary River
Conondale Range Catchmentsa)
HL-9 (pop 3
n ) 5
HL-12 (pop 5n 1)
HL-7(pop 4,5,6,8n 1,1,2,2)
HL-14(pop 6
n 1)
HL-6(pop 3,6n 8,3)
HL-13(pop 6n 1) HL-8
(pop 3,4n 1,1)
HL-5(pop 3,5,6n 13,8,4)
HL-2(pop 3,6n 11,9)
HL-10(pop 8
n 4)
HL-1 (pop 3,4,5,6n 2,1,10,2)
HL-3(pop 3,6,8n 1,16,18)
HL-4 (pop 3,5,6,8n 9,8,5,1)
HL-15(pop 6
n 1)
HL-11(pop 5
n 2)
Coomera River Albert River
McPherson Range Catchmentsb)

Fine scale genetic structure
60
3.3.2 Fine scale genetic structure
AMOVA results identified that a large percentage of the observed variation was
among major catchments when all samples, irrespective of forest fragment, were
analysed 99.49% ΦCT (Table 3.3). Within the McPherson Range, only a small
proportion of the observed variation was identified among major catchments (ΦCT
6.48%). There was also a small percentage of the overall variation observed among
sites within major catchments (ΦSC 5.06%) with the majority of variation observed
attributed to within sites (ΦST 88.46%). The small percentage of variation and non-
significant structure found among major catchments is not surprising given the results
of the pairwise ΦST values (Table 3.4) with non-significant (p>0.05) comparisons both
within and among major catchments.
Within both the Conondale and Main Ranges, the small number of adequately
sampled sites, combined with their location in respect to catchment boundaries,
prevented AMOVA on catchments. In Main Range both stream sites are within the
same major catchment while in the Conondale Range the two streams occur within
different catchments, preventing quantification of variation within catchments in the
latter.
Pairwise estimates of Nm, the number of migrants per generation, calculated
using Wright’s (1943) equation, ranged from 0 to 15 (Table 3.5). Only two of the
estimates between sites within continuous forest fragments showed no migration.
Fifteen (42%) pairwise estimates were above the level of gene flow necessary to
overcome the effect of genetic drift and prevent fixation (more than one migrant every
other generation; Slatkin 1985). Calculations indicated the occurrence of migration
between a number of sites, namely between Main Range and McPherson Range sites,
which are separated by geographical distances greater than 70 km (Table 3.5).

Fine scale genetic structure
61
Table 3.3: Analysis of molecular variance (AMOVA) among major catchments and McPherson Range sites of M. fleayi. Φ – Statistics calculated based on Jukes - Cantor distances. Fixation indices are shown, their significance and the percentage of the total variation that is explained by the grouping.
Level of partitioning Percent variation
Fixation index p
All major catchments
Among catchments 99.49 ΦCT 0.99486 0.055
Among sites within catchments 0.04 ΦSC 0.08658 0.000
Among all sites 0.47 ΦST 0.99531 0.000
McPherson Range
Among catchments 6.48 ΦCT 0.06481 0.110
Among sites within catchments 5.06 ΦSC 0.05408 0.019
Among all sites 88.46 ΦST 0.11539 0.000 Table 3.4: Pairwise ΦST estimates and % average sequence divergence. Above the diagonal: pairwise ΦST estimates based on Jukes-Cantor distances; * indicates significant differences (p<0.05). Below the diagonal: % average sequence divergence. Sites are shaded according to major catchments within forest fragments (boxed). Non-significant comparisons within continuous forest are in bold.
Conondale Range – North Booloumba Creek – Mary River Catchment, East Kilcoy Creek – Brisbane River Catchment McPherson Range – Cainbable, Morans, Stockyard Creeks – Albert River Catchment Bundoomba, Pyramid Creeks – Coomera River Catchment Main Range – Dalrymple, Gap Creeks – Condamine River Catchment
1 2 3 4 5 6 8 14 15
1 North Booloumba 0.055* 0.998* 0.999* 0.998* 0.997* 0.998* 0.999* 1.000* Conondale Range 2 East Kilcoy 0.08 0.997* 0.999* 0.998* 0.997* 0.998* 0.999* 1.000*
3 Cainbable 3.14 3.14 0.265* -0.008 0.064* 0.207* 0.172* 0.274*
4 Morans 3.26 3.26 0.41 0.252* 0.361* 0.481* 0.616* 0.835*
5 Stockyard 3.09 3.10 0.33 0.43 -0.011 0.102* 0.210* 0.359*
6 Bundoomba 3.05 3.06 0.33 0.44 0.32 0.033 0.261* 0.406*
McPherson Range
8 Pyramid 3.01 3.02 0.37 0.48 0.34 0.28 0.435* 0.627*
14 Dalrymple 3.19 3.19 0.27 0.38 0.29 0.28 0.31 0.200* Main Range 15 Gap Creek 3.21 3.21 0.24 0.37 0.29 0.27 0.32 0.07
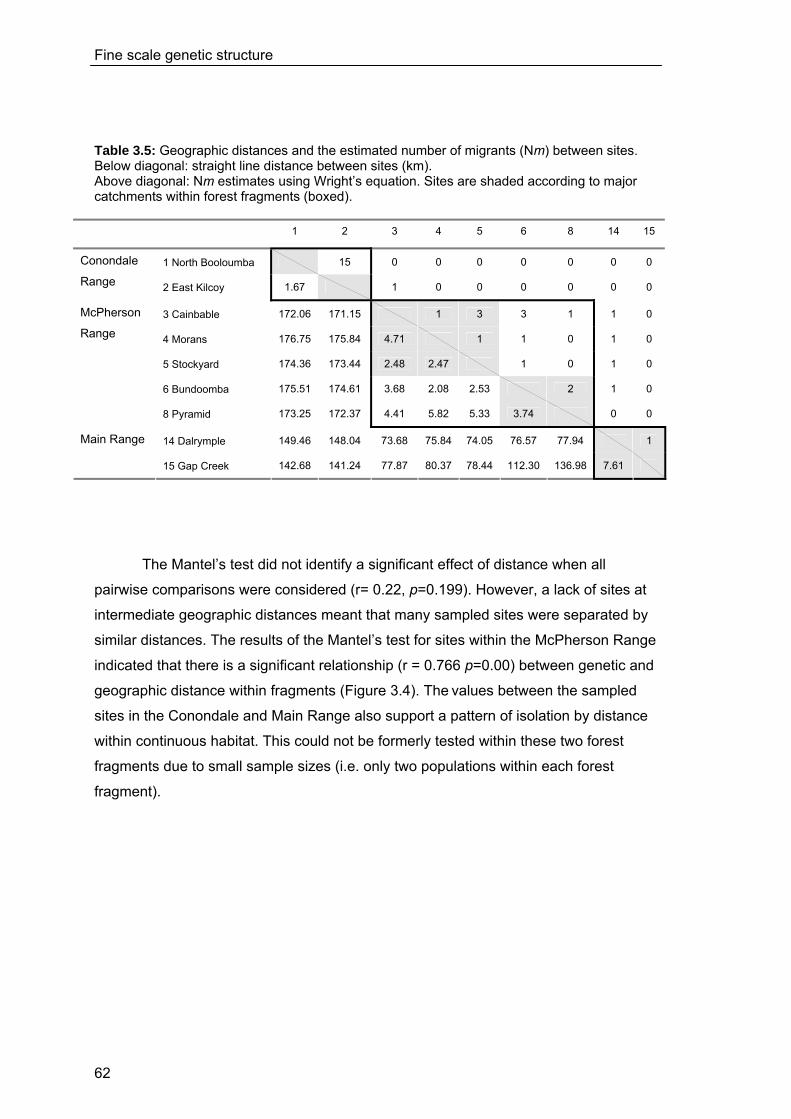
Fine scale genetic structure
62
Table 3.5: Geographic distances and the estimated number of migrants (Nm) between sites. Below diagonal: straight line distance between sites (km). Above diagonal: Nm estimates using Wright’s equation. Sites are shaded according to major catchments within forest fragments (boxed).
The Mantel’s test did not identify a significant effect of distance when all
pairwise comparisons were considered (r= 0.22, p=0.199). However, a lack of sites at
intermediate geographic distances meant that many sampled sites were separated by
similar distances. The results of the Mantel’s test for sites within the McPherson Range
indicated that there is a significant relationship (r = 0.766 p=0.00) between genetic and
geographic distance within fragments (Figure 3.4). The values between the sampled
sites in the Conondale and Main Range also support a pattern of isolation by distance
within continuous habitat. This could not be formerly tested within these two forest
fragments due to small sample sizes (i.e. only two populations within each forest
fragment).
1 2 3 4 5 6 8 14 15
1 North Booloumba 15 0 0 0 0 0 0 0 Conondale Range 2 East Kilcoy 1.67 1 0 0 0 0 0 0
3 Cainbable 172.06 171.15 1 3 3 1 1 0
4 Morans 176.75 175.84 4.71 1 1 0 1 0
5 Stockyard 174.36 173.44 2.48 2.47 1 0 1 0
6 Bundoomba 175.51 174.61 3.68 2.08 2.53 2 1 0
McPherson Range
8 Pyramid 173.25 172.37 4.41 5.82 5.33 3.74 0 0
14 Dalrymple 149.46 148.04 73.68 75.84 74.05 76.57 77.94 1 Main Range
15 Gap Creek 142.68 141.24 77.87 80.37 78.44 112.30 136.98 7.61

Fine scale genetic structure
63
Figure 3.4: Relationship between geographic and genetic distance (FST/1 - FST) for sites within continuous forest habitat.
3.4 Discussion 3.4.1 Fine scale genetic structure of M.fleayi
The results of this study show that M. fleayi is similar to a number of amphibian
species, with evidence of a high level of genetic population structure at a fine scale.
Major catchments within forest fragments were found to show no significant genetic
structuring and explained a very small proportion of the observed variation. However,
significant genetic structure was found among sites within major catchments. Although
this may suggest terrestrial dispersal and gene flow between major catchments, the
estimates of the number of migrants per generation between some sites was
surprisingly low, particularly in light of the large number of individuals sighted on the
ridge-tops between a number of the sites (see Chapter 4).
Gen
etic
dis
tanc
e (F
ST/
1-F S
T)
Geographic distance (m)

Fine scale genetic structure
64
Populations of M. fleayi showed significant pairwise comparisons between
some sites separated by geographical distances as small as 2 km, with an increase in
genetic differentiation with increasing geographic distance. This trend supports
restriction of gene flow with increased geographical distance. However, only one
population comparison involved a distance of less than 2 km, therefore it is possible
that genetic structure occurs at an even finer spatial scale within this species. Other
genetic studies have also found that amphibian populations tend to be isolated, with
high levels of genetic subdivision between sites (e.g. Driscoll 1998a, 1998b, 1999;
Shaffer et al. 2000; Veith et al. 2002; Palo et al. 2004), suggesting that amphibians
generally show strong site fidelity (Daugherty & Sheldon 1982; Reading et al. 1991;
Sinsch 1991; Kusano et al. 1999). Driscoll (1998b) investigated population structure in
two species of the genus Geocrinia, G. rosea and G. lutea. These species were found
to be amongst the most highly genetically subdivided anuran species, displaying
genetic structuring at the scale of tens of kilometres. Based on analysis of allozyme
variation, a number of significantly structured genetic groups have also been
recognised within G. alba and G. vitellina, implying extremely low levels of migration
between sites separated by a maximum of 18 km and 4 km respectively (Driscoll
1998a).
AMOVA results for M. fleayi in the McPherson Range indicated terrestrial
dispersal between some sites within continuous forest habitat and suggest that major
catchment boundaries are not current barriers to dispersal. The potential for terrestrial
dispersal in the species is further supported by the comparison of samples from two
streams within the Conondale Range. These streams represent different major
catchments but haplotypes were shared among them. The comparison of two Main
Range sites also showed significant genetic structure. However, these sites are
separated by geographic distances greater than 7 km and, while it is possible that there
are populations between these sites they are not facilitating gene flow between these
two populations.
3.4.2 Subcatchment boundaries and genetic structure
Available studies on the population genetics of amphibians (see Table 3.5)
have mostly been restricted to pond breeding species in which breeding sites or ponds
are identified as distinct populations, separated by distances often considered too large
to allow for regular migration. The biology and behaviour of pond breeding amphibians
are expected to consign individuals to relatively isolated populations tied to discrete

Fine scale genetic structure
65
habitats such as pond based breeding sites (Sinsch 1990; Blaustein et al. 1994; Rowe
et al. 2000; Smith & Green 2004). Gene flow between sites in pond breeding species
and the corresponding lack of genetic structuring requires terrestrial dispersal of post-
metamorphic individuals as the boundaries of breeding sites, i.e. ponds, negates the
possibility of larval dispersal. This facilitates the definition of populations and
investigation of isolation by distance between these distinct units. Investigation of the
effects of geographical distance is more complicated in stream breeding species,
where there is the potential for aquatic dispersal between connected sites. There is
also the possibility for populations to extend over much larger areas than the one
sampled, stretching along the linear habitat provided by streams.
Although the influence of both major and smaller subcatchment boundaries has
been relatively untested for stream breeding amphibians, the presence of terrestrial
dispersal and the effect of major catchment boundaries have been studied in other taxa
sympatric with M. fleayi and with distributions overlapping the sites sampled in this
study. The montane crayfish species, Euastacus hystricosus, was found to show
evidence of contemporary gene flow or recent historical connectivity between streams
of the Brisbane and Mary River catchments within the Conondale Range (Ponniah &
Hughes in review). Similar results were also found in the glass shrimp, Parataya
australiensis, with a sharing of mtDNA haplotypes across sites from distinct catchments
(Hurwood et al. 2003). As it is thought that the eastern uplands, where these species
occur, were formed at least 90 million years ago in the Mesozoic (Veevers 1984; Webb
et al. 1991; Twidale 2000; Ponniah & Hughes in review), it seems unlikely there were
recent aquatic connections between major catchments. While it remains difficult to
differentiate contemporary gene flow and recent historical connectivity, the geological
history of the area suggests gene flow through terrestrial dispersal is a likely
explanation for the observed pattern of genetic variation in these species.
Unrestricted gene flow between geographically close sites across catchment
boundaries, within the Conondale Range, has also been found in Litoria pearsoniana, a
wet forest-restricted, stream breeding frog that shares its broad habitat requirements
with M. fleayi. Limited genetic differentiation was found between sites separated by up
to 7 km and located within the Brisbane and Mary River catchments. As these two
catchments flow into the ocean hundreds of kilometres apart and the headwaters of the
sampled streams are separated by areas of upland rainforest, there is effectively no
stream connectivity, making aquatic dispersal impossible and providing compelling
evidence of terrestrial dispersal across catchment boundaries.
It is surprising that L. pearsoniana provided evidence of gene flow and
dispersal at geographic distances much larger than that shown by M. fleayi. However,
Fine scale genetic structure
66
L. pearsoniana are often observed at higher densities and are more widespread along
streams in the Conondale Range than M. fleayi (H. Hines pers. comm.) possibly
facilitating greater dispersal in L. pearsoniana. The headwaters of the sampled streams
also adjoin, so dispersal is potentially occurring over much smaller distances than
those reported, especially as populations are known to extend into the uppermost
headwaters of the two streams (H. Hines pers. comm.).
The degree to which streams share subcatchment boundaries may also
influence the extent of dispersal between streams as frogs are simply more likely to
move between adjacent subcatchment that shares considerable boundaries. Figure 3.5
shows the subcatchment boundaries for sites sampled for M. fleayi within the
McPherson Range. Adjacent sites that share large subcatchment boundaries also
show larger estimates of dispersal between sites (e.g. Cainbable and Stockyard
Creeks). While the extent of shared subcatchment boundary does not explain the
observed genetic structuring between all sites, it may provide an indication of the
likelihood of dispersal in some site pairwise comparisons.
Topographical features of the landscape between sites also act as potential
barriers to dispersal. Intervening ridge-tops do not appear to be significant barriers to
dispersal in M. fleayi as there is evidence of gene flow across ridge-tops between a
number of sites sampled (e.g. Cainbable and Stockyard Creeks). However, steep
escarpments and corresponding drops in altitude are likely to greatly influence
dispersal in this species. As individuals disperse away from their natal breeding site,
the terrain of adjacent subcatchments may prevent further dispersal simply in terms of
increased actual distance travelled on the ground. Further continued dispersal by
individuals, across several subcatchments, may be unlikely as they may remain at the
first suitable breeding site encountered.
The influence of anthropogenic induced habitat changes, roads and land use,
on dispersal ability and genetic subdivision of populations remains unknown in M.
fleayi, but warrants further investigation. Morans Creek is separated from other
sampled sites by areas of agricultural land and pairwise comparisons with this site
indicated significant genetic differentiation. However, small sample sizes mean these
comparisons should be interpreted with care. Current ridge-top roads between a
number of the sampled sites also have the potential to significantly influence gene flow
through mortality of individuals, as females are often observed in large numbers along
these roads (Chapter 4), and roadkills have been observed.
Habitat fragmentation, roads and agricultural land may well exacerbate the
effects of geographical distance on gene flow (Vos & Chardon 1998). Habitat
fragmentation has been found to cause a loss in genetic variation in other amphibian

Fine scale genetic structure
67
species (e.g. Hyla arborea, Anderson et al. 2004) while roads, railways and land use
have also been shown to act as significant barriers to dispersal (e.g. Rana temporaria,
Reh & Seitz 1990; Rana arvalis, Vos & Chardon 1998).
Figure 3.5: Map of subcatchment boundaries for sampled sites within the McPherson Range. Arrows represent estimates of dispersal (Nm) between sites and are scaled accordingly. Green arrows indicate non-significant genetic structuring between sites, while red arrows represent significant structuring.
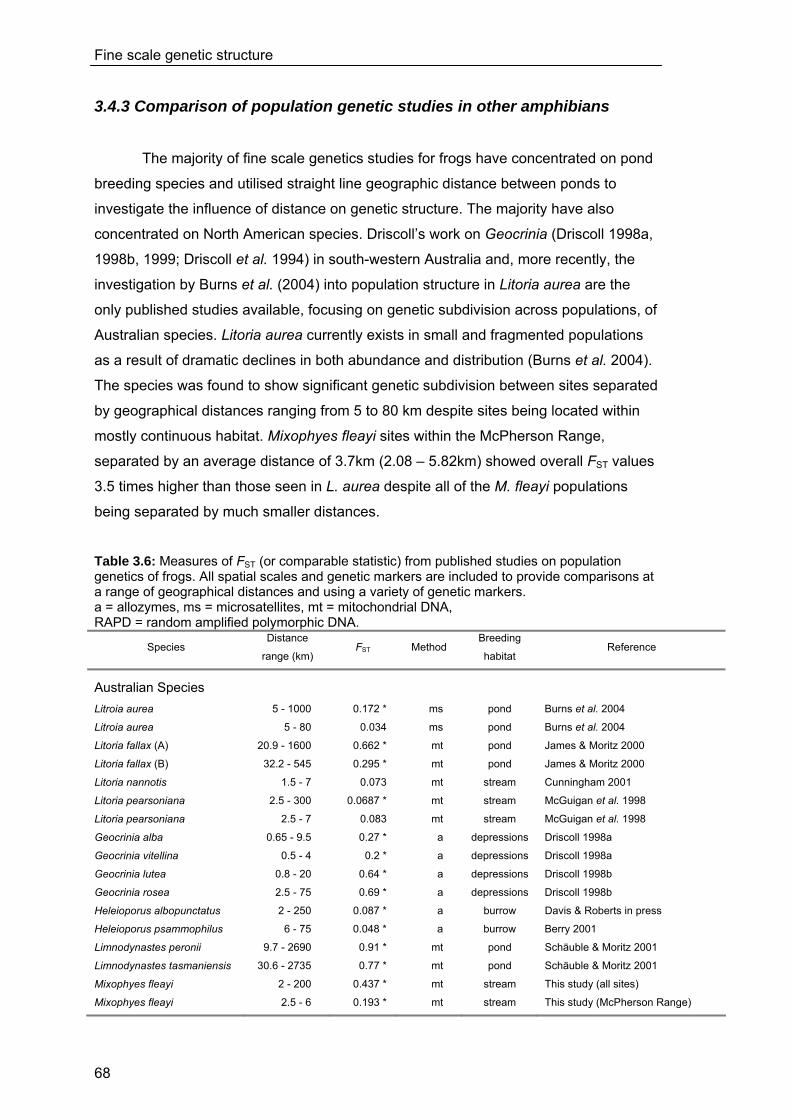
Fine scale genetic structure
68
3.4.3 Comparison of population genetic studies in other amphibians
The majority of fine scale genetics studies for frogs have concentrated on pond
breeding species and utilised straight line geographic distance between ponds to
investigate the influence of distance on genetic structure. The majority have also
concentrated on North American species. Driscoll’s work on Geocrinia (Driscoll 1998a,
1998b, 1999; Driscoll et al. 1994) in south-western Australia and, more recently, the
investigation by Burns et al. (2004) into population structure in Litoria aurea are the
only published studies available, focusing on genetic subdivision across populations, of
Australian species. Litoria aurea currently exists in small and fragmented populations
as a result of dramatic declines in both abundance and distribution (Burns et al. 2004).
The species was found to show significant genetic subdivision between sites separated
by geographical distances ranging from 5 to 80 km despite sites being located within
mostly continuous habitat. Mixophyes fleayi sites within the McPherson Range,
separated by an average distance of 3.7km (2.08 – 5.82km) showed overall FST values
3.5 times higher than those seen in L. aurea despite all of the M. fleayi populations
being separated by much smaller distances.
Table 3.6: Measures of FST (or comparable statistic) from published studies on population genetics of frogs. All spatial scales and genetic markers are included to provide comparisons at a range of geographical distances and using a variety of genetic markers. a = allozymes, ms = microsatellites, mt = mitochondrial DNA, RAPD = random amplified polymorphic DNA.
Species Distance
range (km) FST Method
Breeding
habitat Reference
Australian Species Litroia aurea 5 - 1000 0.172 * ms pond Burns et al. 2004
Litroia aurea 5 - 80 0.034 ms pond Burns et al. 2004
Litoria fallax (A) 20.9 - 1600 0.662 * mt pond James & Moritz 2000
Litoria fallax (B) 32.2 - 545 0.295 * mt pond James & Moritz 2000
Litoria nannotis 1.5 - 7 0.073 mt stream Cunningham 2001
Litoria pearsoniana 2.5 - 300 0.0687 * mt stream McGuigan et al. 1998
Litoria pearsoniana 2.5 - 7 0.083 mt stream McGuigan et al. 1998
Geocrinia alba 0.65 - 9.5 0.27 * a depressions Driscoll 1998a
Geocrinia vitellina 0.5 - 4 0.2 * a depressions Driscoll 1998a
Geocrinia lutea 0.8 - 20 0.64 * a depressions Driscoll 1998b
Geocrinia rosea 2.5 - 75 0.69 * a depressions Driscoll 1998b
Heleioporus albopunctatus 2 - 250 0.087 * a burrow Davis & Roberts in press
Heleioporus psammophilus 6 - 75 0.048 * a burrow Berry 2001
Limnodynastes peronii 9.7 - 2690 0.91 * mt pond Schäuble & Moritz 2001
Limnodynastes tasmaniensis 30.6 - 2735 0.77 * mt pond Schäuble & Moritz 2001
Mixophyes fleayi 2 - 200 0.437 * mt stream This study (all sites)
Mixophyes fleayi 2.5 - 6 0.193 * mt stream This study (McPherson Range)

Fine scale genetic structure
69
Table 3.6 continued
Species Distance
range (km) FST Method
Breeding
habitat Reference
Other Species
Bufo bufo 5.5 - 14.5 0.016 * ms pond Scribner et al. 1994
Bufo bufo (islands) 0.5 - 7.5 0.019 * a rock pool Seppä & Laurila 1999
Bufo bufo (urban) av 2.2 0.535 * a pond Hitchings & Beebee 1998
Bufo bufo (rural) av 37.4 0.292 * a pond Hitchings & Beebee 1998
Bufo calamita (A) 2 - 3.6 0.060 * ms pond Rowe et al. 2000
Bufo calamita (B) 2 - 16 0.224 * ms pond Rowe et al. 2000
Bufo calamita (C) 0.5 - 9 0.111 * ms pond Rowe et al. 2000
Bufo canorus 7.5 0.19 * mt pools/pond Shaffer et al. 2000
Bufo fowleri 3.2 - 251 0.262 * mt pond Smith & Green 2004
Bufo woodhousii fowleri 2 - 30 0.127 * a pond Hranitz & Diehl 2000
Bufo marinus 3 - 80 0.131 * a pond Easteal 1988
Rana arvalis 0.28 - 8 0.052 ms swamp/pond Vos et al. 2001
Rana cascadae 50 - 260 0.78 * mt pond Monsen & Blouin 2003
Rana luteiventris 16 0.04 * ms pond Call 1997 in Newman & Squire 2001
Rana luteiventris 49 - 165 0.056 ms pond Call 1997 in Monsen & Blouin 2004
Rana luteiventris 3 - 34 0.07 * ms pond Call et al. 1998
Rana ridibunda 20 - 100 0.16 * RAPD, ms pools/pond Zeisset & Beebee 2003
Rana sylvatica 0.05 - 21 0.014 * ms pond Newman & Squire 2001
Rana sylvatica 200 - 225 0.11 * ms pond Squire & Newman 2002
Rana sylvatica 5 -10 0.05 ms pond Squire & Newman 2002
Rana temporaria (islands) 0.2 - 7.5 0.068 * a rock pools Seppä & Laurila 1999
Rana temporaria 200 - 1600 0.235 * ms pond Palo et al. 2003
Rana temporaria 3.5 0.036 * ms pond Palo et al. 2003
Rana temporaria (urban) 0.8 - 4.4 0.388 * a pond Hitchings & Beebee 1997
Rana temporaria (rural) 41 - 93 0.144 * a pond Hitchings & Beebee 1997
Physalaemus pustulosus 0.26 - 11.8 0.015 * ms pond Lampert et al. 2003
Eupsophus vertebralis 49 0.386 a burrows Formas 1993
Eupsophus emiliopugini 270 0.653 a burrows Formas 1993
Hyla arenicolor (1) 8 - 927 0.861 * mt pools/pond Barber 1999b
Hyla arenicolor (2) 10 - 153 0.699 * mt pools/pond Barber 1999b
Hyla arborea 1.1 - 43.2 0.2245 * ms pond Anderson et al. 2004
Hyla regilla 3 - 34 0.07 ms pond Call 1997 in Monsen & Blouin 2004
Pseudacris crucifer 14.5 - 2570 0.897 * mt pond Austin et al. 2002
Estimates of geographical distance were taken from Burns et al. (2004) or estimated from maps and information given within publications. Significance of values is indicated (*), only when provided in the original publication and is according to p value of original study. Breeding habitat is as reported in each study.

Fine scale genetic structure
70
Extensive use of microsatellite techniques as well as continued use of
allozymes and mtDNA, have seen a substantial increase in anuran population genetic
studies since the late 1990s (Table 3.6; see also Hitchings & Beebee 1997; Shaffer et
al. 2000; Newman & Squire 2001; Burns et al. 2004). Despite this increase, many
studies are still conducted over considerable geographic distances with many
populations separated by more than 20km. Where populations do not occur in
continuous habitat, migration between such distant populations is extremely unlikely
and significant genetic differentiation would be expected.
Although the use of mtDNA means that FST estimates are expected to be higher
(four times) than nuclear markers, due to a smaller effective population size, results
from this study place M. fleayi amongst the most genetically structured anurans, at fine
geographical scales. The overall FST value for M. fleayi is over ten times higher (0.193
c.f. 0.019) than those seen in Rana sylvatica populations separated by almost the
same geographical distance, 3.78 km (Berven & Grudzien 1990). Overall FST values
are also much higher than those found by Sëppa & Laurila (1999) in Bufo bufo (FST =
0.019) at comparable scales, ranging from as little as 0.5 km to 7.5 km, despite these
populations occurring on islands and presumably experiencing significant identifiable
barriers to dispersal. The range of significant values (ΦST 0.055 - 0.481) for M. fleayi
sites within continuous habitat encompasses those reported for numerous other
species including B. canorus (FST = 0.2, Shaffer et al. 2000) and Rana temporaria (FST
= 0.068), also with populations on islands (Sëppa & Laurila 1999).
While mtDNA is accepted as having less resolution than microsatellites,
showing geographical structure on a much broader scale (Rowe et al. 2000), the levels
of differentiation found in M. fleayi within continuous habitat are comparable and often
higher than those found by a number of studies utilizing microsatellites (e.g. Scribner et
al. 1994; Rowe et al. 2000; Vos et al. 2001; Palo et al. 2003; Lampert et al. 2003). The
use of microsatellite markers, in conjunction with mtDNA, would allow further
investigation of genetic structuring in this species and the identification of genetic
structuring on even smaller geographic scales. It would also allow the comparison of
estimates of gene flow obtained from nuclear markers with those found from mtDNA
and would provide further detail on possible sex-biased and sub-adult moderated
dispersal.
For Australian species studied at similar scales, the overall FST value is
comparable to both Geocrinia alba and G. vitellina (Driscoll 1998a) and is more than
double that found for L. pearsoniana which occurs within the same habitat and was
sampled from many of the same sites (McGuigan et al. 1998). Of the studies

Fine scale genetic structure
71
conducted at fine scale geographical distances (< 20 km), considered similar to this
study, five out of 13 species showed FST values higher than the overall FST for M. fleayi
in the McPherson Range. However, two of these five species included population
comparisons at distances greater than those in the McPherson Range (i.e. > 6 km).
Three of these five species were also found to have lower FST values than M. fleayi in
other studies at similar distances.
Two of the studies showing FST values higher than M. fleayi were on species
existing in urban environments, where barriers to dispersal resulting from urbanization
were believed to lead to considerable increases in the genetic structuring among
populations. Hitchings and Beebee (1997) found that Rana temporaria, displayed
genetic differentiation between populations separated by as little as 2-3 km when
comparing isolated urban ponds. This same species was shown to display a lack of
genetic differentiation between populations up to 41 km apart when considering ponds
existing in rural areas considered barrier free (Hitchings & Beebee 1997). Population
structure within Rana arvalis, shows a significant positive association between genetic
and geographical distance with dispersal rates among populations declining with
distance (Vos et al. 2001). This species also displays declining rates of dispersal
associated with the presence of man made barriers to dispersal such as roads and
railways, which influence rates of dispersal to a greater degree than simply
geographical distance alone. The presence of roads and/or agricultural land may
influence the genetic structure of M. fleayi populations. However, this remains untested
and requires further sampling and analysis.
A high level of genetic structuring among populations within continuous forest
fragments, suggests limited contemporary dispersal in M. fleayi. However, a lack of
genetic differentiation across major catchment boundaries provides evidence of at least
some effective terrestrial dispersal between neighbouring populations that are not
connected aquatically.

72

73
Chapter 4. Movements made by Mixophyes fleayi 4.1 Introduction
Movement of amphibians can be classed into three general categories; daily
movements, seasonal movements to and from breeding sites and dispersal post-
metamorphosis. Primarily sedentary animals, the majority of the movements made by
amphibians are much smaller in magnitude than those of other small-bodied tetrapods
(Sinsch 1990; Zug 1993; Blaustein et al. 1994).
The daily movements of amphibians are influenced by their need to maintain
adequate physiological conditions (Dole 1965; Beshkov & Jameson 1980; Woolbright
1985; Zug 1993; Cohen & Alford 1996; De Oliveira 1996; Streatfield 1999; Hodgkison &
Hero 2000). Foraging for food is assumed to account for the majority of daily activities.
Other factors such as resource competition, for shelter and mates, and predator
avoidance are also associated with these short-term movements (Dole & Durant 1974;
Harris 1975; Woolbright 1985).
Studies on daily movement patterns of amphibians are limited with most
undertaken at breeding sites where frogs are readily encountered. Calling and shelter
sites are often scarce at breeding locations (pond or stream) (Duellman & Trueb 1986)
and this may well influence the magnitude of movements made by individuals when
they are at breeding sites. Males may limit movements away from breeding sites as
foraging away from the site may increase the energy males must expend on their
return as they are forced to compete for calling or shelter sites (Woolbright 1985).
Stream-breeding species have been shown to forage away from streams during
periods when the risks involved with being away from the stream environment are
substantially reduced (e.g. desiccation and predation) (Martof 1953; Daugherty &
Sheldon 1982). Typically, movements along streams tend to be more substantial than
movements away from the stream (Ashton 1975; Holomuzki 1982; Beshkov &
Jameson 1980; Duellman & Trueb 1986). Females can avoid harassment, competition
and increased risk of predation by visiting breeding sites for only short periods, to lay
eggs (e.g. Rana clamitans, Martof 1953; Rana pipiens, Dole 1965). Females, which
have higher nutritional requirements than males in order to produce eggs (Duellman &
Trueb 1986), are likely to spend a greater portion of their daily activities foraging and
may seek areas with greater prey abundance and or less competition (Woolbright
1985; Hodgkison 1998).
Most species, including M. fleayi spend some time of the year congregated at
breeding sites. Many amphibians undergo seasonal migration between aquatic

Movements made by M. fleayi
74
breeding sites and terrestrial habitats utilised during non-breeding activity. Most studies
on breeding migrations have been on pond-breeding species. Quantifying the
distances moved during migration can be very difficult as individuals may be dispersed
widely across the landscape and difficult to detect or re-sight.
Following metamorphosis frogs may move away from breeding sites in search
of food and shelter while escaping desiccation and predation (e.g. Denton & Beebee
1993; Bosman et al. 1996; Spieler & Linsenmair 1998; Lamoureaux & Madison 1999;
Hodgkison & Hero 2000; Lemckert & Brassil 2000). Natal dispersal within amphibian
species, as with many vertebrates, is most frequently a juvenile behaviour (Gill 1978;
Breden 1987; Berven & Grudzien 1990; Arntzen & Teunis 1993; Joly & Grolet 1996). A
lack of sexual dimorphism in juvenile amphibians and the associated difficulty in
determining sex (Duellman & Trueb 1986) means either destructive sampling or long
term mark-recapture studies are required to identify sex biased patterns of dispersal.
Consequently only a few recent studies (Austin et al. 2003; Bartelt et al. 2004; Palo et
al. 2004) have investigated this.
Numerous studies have examined migration and localized dispersal in
amphibians between and among adjacent ponds and waterways (e.g. Twitty et al.
1964; Sinsch & Seidel 1995; Driscoll 1997; Seburn et al. 1997; Dodd & Cade 1998;
Sjögren-Gulve 1998; Peter 2001; Pilliod et al. 2002; Austin et al. 2003). The majority of
these studies used a combination of mark-recapture techniques and pit-fall traps, to
determine the magnitude of movements (e.g. Martof 1953; Strijbosch 1979; Holomuzki
1982; Sjögren 1991; Sinsch 1992a; Driscoll 1997; Marsh et al. 1999; Skelly et al. 1999;
Pope et al. 2000). However, this information is of limited use as it only results in data
on the overall magnitude of movements with no detailed information on total distance
moved. An alternative method is the use of a trailing device such as cotton spools
which enable precise accounts of daily activities, providing data on the total distance
and orientation of movements between successive captures (e.g. Dole 1965; De
Oliveira 1996; Streatfield 1999; Lemckert & Brassil 2000).
The aims of this chapter are to investigate the spatial movement patterns of
adult M. fleayi using a combination of mark-recapture, spool- and radio-tracking
techniques. The use of the three techniques enables investigation of individual
movements on a number of spatial and temporal scales, including detailed daily
movements within a population and larger long-term movements across breeding
seasons. Specifically this chapter aims to quantify the distances moved along and
away from creeks. It is hypothesized that males will move less distance away from the
creek than females remaining at the breeding site in search of mates.

Movements made by M. fleayi
75
4.2 Methods 4.2.1 Study site
The study was carried out within the Green Mountains Section of Lamington
National Park, south-east Queensland (Figure 4.1). Mark-recapture and monitoring of
populations occurred at four sites within this section of the park. Spooling and radio-
tracking of individuals, along with detailed investigation of within population movements
using intensive mark-recapture methods took place at Cainbable Creek. The study site
was located in a sub-catchment with an altitudinal range of 600 to 850 m and known to
support a breeding population of M. fleayi. It is a moderate sized stream, 3-8 m wide,
with permanent pools and is surrounded by subtropical rainforest.
Figure 4.1: Map of the study area in the Green Mountains Section of Lamington National Park, south-east Queensland. Monitored populations are marked with site numbers corresponding to those used in Chapters 2 and 3. (3 = Cainbable Creek, 4 = Morans Creek, 5 = Stockyard Creek, 6 = Bundoomba Creek)

Movements made by M. fleayi
76
4.2.2 Mark-recapture
A 200 m transect was established along Cainbable Creek (altitude 600-620m).
It was visually and acoustically surveyed at regular intervals (Appendix 8), within two
hours of sunset over three breeding seasons, between October 2000 and April 2003.
Previous observations in Lamington National Park, as well as at other known breeding
sites, suggest breeding activity in this species occurs between August and April
(O’Reilly & Hines 2002). All frogs found were captured using single use plastic bags,
measured (snout-vent length, SVL; head length, HL; head width, HW; tibia length, TL),
weighed and their reproductive condition noted. Each individual was sexed: males by
their call or the presence of nuptial pads, and females by their larger size and the
absence of nuptial pads. The position at which the frog was located and subsequently
captured was recorded, including its distance from the streamside and distance along
transect.
Evaluation of movement and dispersal requires the individual identification of
animals, which can only be achieved by the use of mark-recapture methods. Adult
frogs (>30mm) were individually marked with passive integrated transponders (PIT
tags). These glass encased microchips emit an alphanumeric code after activation by a
hand-held scanning device and were inserted under the dorsal skin of the adults
(Christy 1996).
The small size of juvenile frogs prevented the use of PIT tags for marking and
individual identification was not possible. Year and site specific toe clips, requiring the
clipping of only a single toe, were used to enable cohort recognition.
The fidelity of reproductive adults and juveniles to the breeding stream where
they were originally tagged was used to assess the movement of individuals into and
out of the population. Detail on the magnitude of movements made by individuals was
also obtained from straight line distances between points of capture for marked
animals, both away from the stream and along the stream.
Surveys were also undertaken at Bundoomba, Stockyard and Morans Creeks
(Appendix 8). All individuals caught at Bundoomba Creek were PIT tagged as part of
existing Queensland Parks and Wildlife Service monitoring. Known breeding sites and
monitoring transects at Stockyard and Morans Creeks were surveyed for adult frogs
and marked individuals from the mark-recapture populations at Bundoomba and
Cainbable Creeks.

Movements made by M. fleayi
77
4.2.3 Spooling
The distance moved and resulting displacement of individuals over 24 hour
periods was obtained through the use of cotton trailing devices attached to individual
frogs. The movements of frogs were measured over two periods; October 2000 to April
2001 and September 2001 to April 2002 (Appendix 9).
Large (> 62 mm snout-vent length and 30 grams in weight) individuals were
fitted with temporary, soft belts made from microporous tape (Smith and Nephew, and
3M brands). A modified spool was attached via the belts which were tied through a loop
in the masking tape used to camouflage the cotton thread spool (Figure 4.2 a). The
weight of the spool and belt was approximately 3 grams. The belts were loosely but
securely tied around the frog’s waist, at the narrowest point just anterior to the join of
the legs, ensuring that the spool sat on the frog’s dorsum above the vent with the
thread trailing posteriorly. Frogs were held and observed for 1 minute to ensure secure
attachment of the spool.
After attachment, frogs were released at their original point of capture. The free
end of the thread was attached to a plastic marking stake inserted into the ground at
the release point. Frogs were then left to carry out their usual nocturnal activities. The
following day, frogs were located in their diurnal refuge by following the trail of thread.
The frog’s position along the transect, distance and direction of the first diurnal refuge
(dr1) from the stream, total distance moved between initial capture and dr1, and
distance and direction from dr1 to the initial capture point (displacement) were
measured using a Stone Blaze hip chain and a hand held compass (Figure 4.3; 4.4).
The condition of the frog was checked visually and the cotton thread broken and retied
to a new stake adjacent to the retreat site.
Twenty-four hours later frogs were located at their second diurnal retreat site
(dr2). Distance and direction of movements between each major change in direction
greater than 10o (runs) was measured as well as the straight line distance between
successive diurnal refuges (displacement) (Figure 4.4). The spool was then removed
from the animal and a PIT tag inserted to prevent any one animal being spooled twice.

Movements made by M. fleayi
78
Figure 4.2: Spooling attachment method. a) cotton spool tied to a temporary belt around the frog’s waist, b) female M. fleayi in diurnal refuge with cotton spool attached.
Figure 4.3: Diagram representing the temporal sampling of spooled individuals. Spools were attached and frogs released at the initial nocturnal capture point. Direction and distance moved between initial capture, creek and diurnal refuge 1 was measured the following morning. Direction and distance of each run between diurnal refuge 1 and 2 was measured on the morning of day 3.

Movements made by M. fleayi
79
Figure 4.4: Diagram representing results obtained from spool tracking for a single individual. Total distance travelled is measured as the sum of all run distances. Displacement distance is between the capture point and dr1 and then from dr1 to dr2. 4.2.4 Radio-tracking
To investigate movements further, individual frogs were fitted with radio
transmitters. Transmitters (Holohil BD-2G weighing approximately 1.65g, with a battery
life of 15 weeks) were attached in the same way as cotton spools (Figure 4.2). The
transmitter sat on the frog’s dorsum above the vent with the antennae trailing
posteriorly.
Frogs were held and observed for one minute after the transmitter was attached
to ensure secure attachment of the transmitter, prior to release at their original capture
point. They were further monitored for five minutes after release. The total mass of the
transmitter package was always well below the recommended level of 10% of the body
mass of the individual (Richards et al. 1994). The tightness of the belt allowed the
entire package to slip from the individual should it become tangled or caught.
Signals from the transmitters were received using a hand held H–frame
antenna attached to a Telonics TR–4 receiver. Frogs were located three times every 24
hours, twice during the day (0700–1500hrs) and once at night (1900–0700hrs), on a
minimum of three days a week during peak activity and weekly as activity decreased.
The location times were chosen to determine the movement patterns
throughout a 24-hour period. Location of radio-tracked animals on a minimum of three
days a week, with approximately 24 hours between each location day, ensured
independence between location times. Each time a frog was located, information,
including the distance from water, position along the transect, and direction and
distance from previous location was recorded.

Movements made by M. fleayi
80
Each frog was inspected weekly to monitor the condition of the belt and ensure
the transmitter attachment was not causing any damage to the skin. Every four weeks
each belt was changed and the frog weighed to determine if the transmitter was having
any detrimental effects on the overall condition of the frog. If losses in body weight
exceeded 20% or rubbing was evident the transmitter was removed. At the end of
tracking the frog was recaptured and the transmitter removed.
4.2.5 Individuals located on walking tracks and roads
Individuals were often encountered away from creeks during activities
associated with monitoring e.g. along the 4 km walk (Blue Pools walking track) to and
from the Bundoomba Creek monitoring site and on the ridge-tops, along the Lamington
National Park and Duck Creek roads. These opportunistic observations provide
valuable detail on the movement of individuals. Large frogs were PIT tagged for
individual identification and their location recorded.
4.2.6 Analysis
4.2.6.1 Mark-recapture
Low recapture rates of females meant that limited information on the scale of
movements was obtained from the mark-recapture data and no statistical comparisons
were made with males. Scatter plots and box plots were used to investigate the
movement of individuals both along the stream and away from the stream. The Tukey’s
box plots include the median (represented as a black bar) and the 25% quartiles for the
hinges (ends of the box). The difference between the values of the two hinges is the
interquartile range (IQR) or spread. The whiskers extend to the extreme values within
1.5 times the IQR, outside the closest hinge. Data values outside the whiskers are
identified as outliers (Quinn & Keogh, 2002).
Maximum distance away from the stream was calculated as the furthest
distance from the stream that animals were located over the entire study. Maximum
displacement along the stream was calculated as the maximum distance between any
two points of location along the transect (Figure 4.5).

Movements made by M. fleayi
81
Figure 4.5: Diagram of distance calculations from mark-recapture. Time since initial capture was determined as the number of days between the first capture and the last recapture. Maximum displacement along the stream and distance away from the stream were only calculated for frogs recaptured at least once.
4.2.6.2 Spool and radio-tracking
As the measurement of movement based on spool results were all over a 24
hour time period the duration of spooling will not influence the magnitude of
movements. However, differences in movement may be due to intraspecific differences
in body size. Consequently, the relationship between body size (using snout-vent
length) and movement distances obtained with spooling was investigated using
regression. This included total distance moved, average run length and distance from
both diurnal refuge 1 (dr1) to the stream and from dr1 to diurnal refuge 2 (dr2).
Maximum distance moved away from the stream was determined from the distance of
dr1 and dr2 from the stream.
Regression analysis was used to investigate the relationship between radio-
tracking duration and the total distance moved, the maximum distance moved away
from the stream, effect of body size and tracking duration on total distance moved,
maximum displacement along the stream and maximum distance from the stream, for
radio-tracked individuals.
Non-parametric Mann-Whitney U-tests with tied ranks were used to test for
differences in movement distances between males and females as equal variances
could not be assumed.

Movements made by M. fleayi
82
4.3 Results
A total of 185 surveys were undertaken at the four sites within Lamington
National Park over the three activity periods (2000-2003). Cainbable Creek was
surveyed the most intensively (145 surveys) as it was also the site used for spooling
and radio-tracking of individuals (Appendix 8). At Cainbable Creek, 148 individuals, 29
females and 119 males, were PIT tagged with 23 sub-adults clipped. Only fourteen
percent (four individuals) of females were recaptured, one of these once, two twice and
the fourth being recaught three times. Only two females were recaptured in subsequent
breeding seasons with no recaptures of females over three seasons. Fifty three percent
(63 individuals) of males were recaptured at least once with one individual being
recaptured 20 times. Only five sub-adults were recaught. However as sub-adults were
cohort marked, it is unknown if this was the same or multiple individuals with all
recaptures within the same breeding season as the mark (Table 4.1).
Table 4.1: Number of frogs marked, spooled and radio-tracked at Cainbable Creek.
Method Sex Season 2000-2001 2001-2002 2002-2003
new recap new recap new recap
Mark-recapture males 66 39 31 52 19 25 females 6 - 20 4 3 - sub-adults 3 - 16 5 4 -
Spool males 19 - 6 - - - females 3 - 5 - - -
Radio-tracked males 5 - 4 - - - females 3 - 9 - 3 -
All individuals caught at Cainbable Creek were found within 20m of the stream
(Figure 4.6). Animals that were spooled or radio-tracked are not included in the mark-
recapture group as they were only marked on the completion of tracking. All 29 mark-
recapture females from the transect were located within 10 metres of the creek (range
0 -10m), despite searching for individuals further away from the creek during spooling
and radio-tracking activities. The eight spooled and 15 radio-tracked females were also
initially located within 10m of the stream. Males were often located further from the
stream than females, however all were found within 20 m of the stream. Males,
regardless of whether they were new individuals or recaptures were located on
average 3.42 metres from the water (range 0-18 m). Sub-adult frogs were found, on

Movements made by M. fleayi
83
average, 2.5 metres from the water (range 0 -11 m). A Mann-Whitney U test indicated
no significant difference between males and females and the distance from capture to
the creek (p>0.05).
Figure 4.6: Distance of initial capture point from the creek for mark-recapture, spooling and radio-tracked individuals, not including those frogs located on the road. black bar = median, box = 25% quartiles, whiskers = 1.5 times the spread • represents outliers, * represents an extreme outlier (male=18m, sub-adult=11m). 4.3.1 Individuals located on walking tracks and roads
The majority of individuals located on both Cainbable and Bundoomba Creeks
were males, 69.5% and 93 % respectively (Table 4.2). More females were encountered
on the walking track out of Bundoomba than on the creek and almost the same number
of females were found on the ridge-top roads as on Cainbable Creek. A single male
was located on a ridge-top road. In comparison, males represent only 16% of
individuals seen on the Blue Pools walking track, although most of these were found
within 50m of Bundoomba and Darraboola Creeks. Surveys at other breeding sites in
south-east Queensland show similar trends with females rarely encountered on creeks
(5.5% of all individuals found). Of the 30 frogs located along the ridge-top roads within
Lamington National Park 28 were females. Only one male was found in this area, at the
junction of the two roads near Cainbable Creek (Figure 4.7, Table 4.3). One sub-adult
was located along the walking track out of Cainbable Creek, 630 m straightline

Movements made by M. fleayi
84
distance from the creek. Fifteen females from ridge-top roads were PIT tagged and an
additional nine were spooled and four radio-tracked. Table 4.2: Number of frogs encountered on intensively surveyed creeks, walking tracks and roads within Lamington National Park and for all other creek surveys for M. fleayi.
Figure 4.7: Map of Green Mountains section of Lamington National Park showing the location of individuals encountered on the ridge-top roads. Coloured dots represent the capture points of animals, each colour represents the technique used and sex of each frog (see key). mr = mark-recapture, rt = radio-tracking
Location Nights Females Males Sub-adults Total n % n % n %
Cainbable Creek 143 29 17.0 119 69.5 23 13.5 171
Bundoomba Creek 35 31 2.4 1183 93.1 57 4.5 1271
Ridge-top Roads 7 28 93.3 1 3.4 1 3.3 30
Blue Pools Walking Track 24 81 53.0 24 16.0 48 31.0 153
All other creeks 186 196 5.5 3220 90.5 139 4.0 3555

Movements made by M. fleayi
85
Table 4.3: Number of frogs marked, spooled and radio-tracked away from Cainbable Creek.
Method Sex Season 2000-2001 2001-2002 2002-2003
new recap new recap new recap
Mark-recapture males - - 1 - - -
females 4 - 6 - 5 -
sub-adults - - 1 - - -
Spool females - - 9 - - -
Radio-tracked females 1 - 3 - - -
4.3.2 Mark-recapture movement
The small number and the temporal spacing of female recaptures make it
difficult to make any inferences on the scale of movements made by females, based on
mark-recapture. Only two individuals were recaptured across two seasons (i.e. > 200
days between captures). All recaptured females were recaught within 10m of the creek
(Figure 4.8 a). One of the females (F1) recaught across seasons, was located in close
proximity to its original capture position while the other female (F4), recaught across
seasons, was found 140m from the original capture location (Figure 4.8 b).

Movements made by M. fleayi
86
Figure 4.8: Movements made by recaptured marked female M. fleayi. a) distance of recaptures away from the creek, b) displacement of individuals along the creek between consecutive capture times. When time since initial capture > 200 days, individuals were caught across seasons.
b)
a)
Movements made by M. fleayi
87
The large number of recaptured males at Cainbable Creek allows investigation
of the movement of male M. fleayi. Most (52.4%) were recaught across at least two
seasons, with 33.3% recaught only across two seasons and 19.1% recaught across all
three (>600 days between initial and final capture) (Figure 4.9). Although significant
(p<0.05) the r2 value for the maximum distance male frogs were recaptured away from
the creek and time since initial capture was low (0.222). This was also the case for the
maximum displacement along the creek and time since initial capture (p<0.05,
r2=0.125). For most individuals a large number of days between captures, even across
seasons, did not necessarily mean they moved further away from the creek (Figure 4.9
a) or were displaced further along the creek (Figure 4.9 b).
Within a single season displacement distances along the stream were mostly
below 30 m while over all three seasons 65% of animals made movements displacing
them less than 20 m (Figure 4.9 b). Most large movements along the stream were
made by individuals recaught over three seasons (>600 days). However, a single
individual, recaught within a season, was displaced 84 m along the creek. Only five
individuals were displaced more than 50 m along the stream, with three of these larger
movements made by frogs that were recaught over three seasons. The maximum
displacement along the stream for one individual was 93 m.
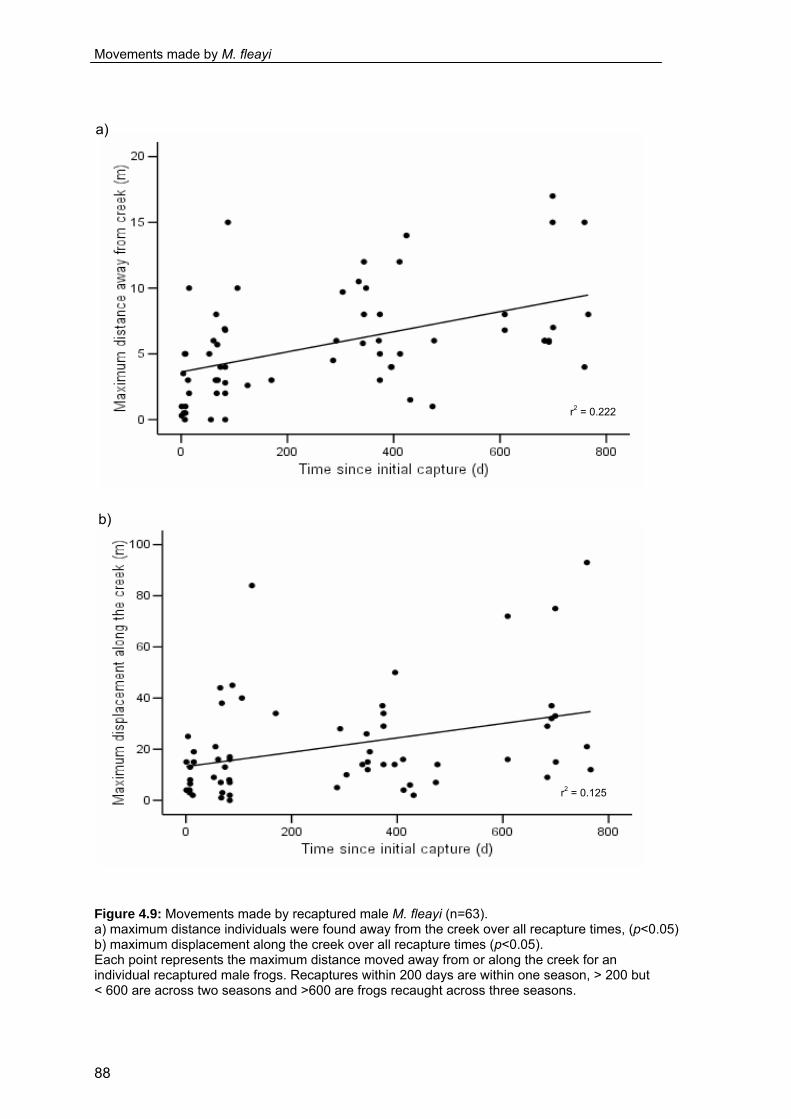
Movements made by M. fleayi
88
Figure 4.9: Movements made by recaptured male M. fleayi (n=63). a) maximum distance individuals were found away from the creek over all recapture times, (p<0.05) b) maximum displacement along the creek over all recapture times (p<0.05). Each point represents the maximum distance moved away from or along the creek for an individual recaptured male frogs. Recaptures within 200 days are within one season, > 200 but < 600 are across two seasons and >600 are frogs recaught across three seasons.
r2 = 0.222
a)
b)
r2 = 0.125

Movements made by M. fleayi
89
Mark-recapture data for site fidelity and movement of males at the 300 m
transect at Bundoomba Creek shows a pattern similar to that seen along the 200 m
transect at Cainbable Creek (H. Hines, R. Knowles & N. Doak, unpub. data).
Monitoring at Bundoomba Creek has been ongoing since 1996 and the oldest male
recaught at this site is over six years old with 2207 days between its initial and most
recent capture. Over this time period this male has been recaught 14 times, always
within the same 8 m section of stream. Males recaught at this site in both the first and
second year following initial marking also remain close to the initial capture point (1
year n = 66, median distance from capture = 12 m; 2 years n = 36, median distance
from capture = 10 m) (Figure 4.10). The largest displacement along Bundoomba Creek
was 143 m for a male that has been recaught 8 times.
Figure 4.10: Site fidelity of recaptured male M. fleayi, at Bundoomba Creek. Maximum displacement was calculated across all recaptures for individual male frogs and is the furthest distance between any two capture locations.
Movements made by M. fleayi
90
4.3.3 Spooling movement
The summary data for all spooled frogs, including weight, size, and details of
the distances moved are shown in Appendix 10. For spooled frogs linear regressions
showed no significant relationship between body size (SVL) and total distance moved
(p=0.219), average run length (p=0.392), or displacement distance from diurnal refuge
1 (dr1) to diurnal refuge 2 (dr2) (p=0.533). Linear regression analysis showed a
statistically significant relationship between the distance of both dr1 and dr2 to the
creek and SVL, p=0.00 for both. However, regression analysis on the distance of dr1
and dr2 to the water and SVL including just females was not significant (p=0.135 and
p=0.113 respectively) nor was there a significant relationship for males (p=0.591 and
p=0.671 respectively). Females moved further away from the creek than males to find
their diurnal refuges (dr1, p=0.00; dr2, p=0.00) (Figure 4.11a, b). There was no
significant difference in the displacement (straight line distance) between the first and
second diurnal refuge for males and females (p=0.42) despite a significant difference in
the total distance moved (p=0.036).
Males often travelled greater total distances than females, but displacement
was similar (Figure 4.12). One male covered a total of 81 metres to return to a diurnal
refuge approximately 1.4 m from the previous day’s refuge. Two males were displaced
20 m and 30 m between refuges, however, these animals moved downstream within
the creek and did not return upstream. Mark-recapture data for these two individuals
shows they remained close to their new locations, downstream from their original
capture and spooling points.
Females spooled on the road showed no significant difference in magnitude of
movements in regards to total distance moved (p=0.796), displacement between dr1
and dr2 (p=0.442) or average run distance (p=0.279) when compared to females
spooled at the creek, indicating that the behaviour of females is similar away from the
creek.

Movements made by M. fleayi
91
Figure 4.11: Distance of diurnal refuge from creek for male and female M. fleayi spooled at Cainbable Creek.
a) distance of first diurnal (dr1) from creek, (all p=0.00, males p=0.591, females p=0.135) b) distance of second diurnal refuge (dr2) from creek (all p=0.00, males p=0.671, females p=0.113)
a)
r2=0.461
b)
r2=0.493

Movements made by M. fleayi
92
Figure 4.12: Total distance moved (cotton thread distance), versus displacement (straight line distance) from diurnal refuge 1 (dr1) to diurnal refuge 2 (dr2) for all spooled frogs. Nine individuals that remained in dr1 for the entire spooling period are not included. 4.3.4 Radio-tracking movement
One male and one female slipped free of the radio-transmitter belt. The
transmitter signal was lost on four occasions, all females, three from the creek and one
from the road. This loss was presumably due to failure of the transmitter, as extensive
searches and continued monitoring for a signal both on the creek and away from it,
failed to find these individuals. Two of the four individuals were subsequently found
during nocturnal searches within 50m of the Cainbable Creek transect. The third creek
female was found 214 days after loss of the transmitter signal, on the Lamington
National Park Road.
The summary data for all radio-tracked frogs, including weight, size, and total
distance moved and duration of tracking is shown in Appendix 11. No significant
difference was found between the total distance moved by females at the creek
compared to females on the road (p=0.665, Figure 4.12) and data for females was
pooled for further analysis. Linear regression analysis identified no statistically
significant relationship between the body size of animals (snout-vent length, SVL) and
the total distance moved (p=0.094). Only 10.4% of the variation in the total distance
moved could be explained by the regression (r2=0.104).
The duration of tracking for individuals (Figure 4.11) was determined by the life
of the battery in the transmitter as well as any changes in condition observed, i.e. a
significant drop in weight or rubbing by the belt (Appendix 12). There was no significant

Movements made by M. fleayi
93
difference in the number of days males and females (including the four female road
frogs) were tracked (p=0.546) so any difference observed in movement is real and not
an artifact of one sex being tracked for longer time periods (Figure 4.13, 4.14). Linear
regression analysis identified no significant relationship between the duration of
tracking (days), and the maximum distance an animal moved from the stream
(p=0.362) (Figure 4.13) or the total distance moved by an animal (p=0.111) (Figure
4.14).
At Cainbable Creek females were initially captured at similar distances from the
stream as males but moved significantly further away from the creek in subsequent
movements (p=0.003) (Figure 4.14). There was a significant probability of a linear
relationship between body size and the maximum distance an animal was located
away from the creek (p=0.023, r2=0.213). However, the low r2 value indicates only a
small percentage, 21%, of the variation in the maximum distance individuals were
found from the creek is explained by body size (SVL). The linear relationship is not
surprising as females are larger than males and moved further from the stream. When
analysed separately no statistically significant relationship was found between SVL and
maximum distance females were found from the creek (p=0.832) or the road (p=0.262).
However, a significant statistical relationship was found for males (p=0.027, r2=0.527)
despite the relatively low r2 value. Females tended to remain at the creek for very short
periods of time while males spent most of their time relatively close to the stream,
rarely moving more than 10 m away from the water (Appendix 13).
Figure 4.13: Maximum distance away from the creek for frogs radio-tracked at Cainbable Creek and from the road for females radio-tracked along the ridge-top (p=0.362).

Movements made by M. fleayi
94
Figure 4.14: Total distance moved by all radio-tracked frogs both at the creek and at the road, over the duration of radio-tracking (p=0.111).
The maximum distance from the creek was not measured for females radio-
tracked on the road because it could not be assumed they had originated from
monitored creeks. Therefore, the road was used as the reference point for distances
moved by these individuals. Two of the four road frogs remained within 25 m of the
road while the other two females moved up to 80 m away.
No radio-tracked male moved beyond 20 m of the creek while females showed
a greater range in movements, with all spending some time close to the creek before
moving up to 70 m away. Despite obvious differences in the proximity of males and
females to the creek there was no significant difference between sexes in the total
distance moved by radio-tracked animals (p=0.066) (Figure 4.14). Differences in the
distance from the creek for males and females were not due to movements made by a
single individual (Appendix 13).
The male radio-tracked for the greatest number of days, remained within 20 m
of the creek and was not the individual found to move the greatest total distance. The
female that travelled the furthest total distance remained within 50 m of the creek and
was also not the female tracked for the longest time. While no mark-recapture females
were found to move either between sites or between the creek and the ridge-top road a

Movements made by M. fleayi
95
single radio-tracked female (F15) that was initially located on the stream was
subsequently found on the roadside (approximately 1 km from stream), after failure of
the transmitter.
Results for maximum distance moved away from the creek showed no
significant difference between the three methods, in particular for males (Figure 4.15).
Mark-recapture measures found individuals of both sexes remained within 20 m of the
creek, as did measures of 24-hour movement provided by spooling. Using both
methods females were found to move further from the creek than males. While mark-
recapture methods provide a measure of movement on the longest time frame, with
individuals identifiable across multiple seasons, they are limited by the reliance on
detecting and locating individuals. Compared to radio-tracking results, mark-recapture
and spooling underestimate the maximum distance moved away from the creek,
particularly for females.
Figure 4.15: Distance moved away from the creek based on mark-recapture, spooling and radio-tracking.

Movements made by M. fleayi
96
4.4 Discussion
4.4.1 Movements made by M. fleayi
Mixophyes fleayi appears to show sex-biased differences in movement. Mark-
recapture, spooling, radio-tracking and other observations of movement in M. fleayi
suggest adult males are typically found in close proximity to streams and are highly
philopatric. Males remain in close proximity to the breeding site, not only throughout the
breeding season but also between breeding seasons. In contrast to this, females tend
to spend short periods of time at breeding sites, moving away often after only two or
three nights and finding consecutive diurnal refuges progressively further from the
creek.
Females are found well away from streams and are capable of large
movements suggesting movements between breeding sites are possible, although
such events are probably infrequent and were not detected during this study. Female
movement patterns, when either close to or away from the breeding site, are typified by
relatively large movements over short time periods. These movements are interspersed
by intervals of inactivity or numerous small movements centered on a particular refuge
area often well away from breeding sites.
While displacement distances between capture or location points for male M.
fleayi were small this does not mean that the total distances travelled by male frogs
was small. Radio-tracking and mark-recapture results found males moved greater
distances along the creek than they did away from it. However, most males remained
within 25 m of their original capture point. This was in contrast to females which tended
to move similar distances to males over a single night but were displaced further away
from the creek. If displacement distance between refuge sites is a reliable indicator of
adult dispersal ability it appears that dispersal in M. fleayi is more likely due to the
movement of females rather than males.
In this study, larger frogs did not necessarily move greater total distances but
they did move further from the creek, implying that larger animals (and thus potentially
older females) are the individuals making the long-distance movements away from
breeding sites. Smaller females moved further away from the stream than males of
comparable size and consequently movement distances are likely to be related to sex
biased behavioural differences rather than physiological constraints influenced by
environmental conditions such as such as temperature, humidity and moisture
availability.

Movements made by M. fleayi
97
Sex-biased differences in movement patterns have been identified in other
amphibian species (e.g. Rana temporaria, Palo et al. 2004) with females often moving
much further than males (Table 4.4). In Rana luteiventris females move up to 1030 m
from breeding sites while males remain within 200 m of breeding areas (Pilliod et al.
2002) and in Bufo boreas females have been found to move up to 2.44 km from
breeding sites, 2.6 times further than males (Bartelt 2000; Muths 2003).
Movements made away from breeding sites by females may be due to
unfavourable conditions, including harassment by males and increased resource
competition (Dole & Durant 1974; Harris 1975; Woolbright 1985). The presence of male
frogs close to the stream may result in increased resource competition for food as well
as diurnal refuges that provide protection from predation and desiccation. Higher
nutritional requirements of females, required for egg development, may influence their
movements away from the breeding site and towards more productive feeding areas,
with competition for food expected to be lower in the forest than close to the stream.
In contrast to females, males may remain at the breeding site to establish and
protect territories and calling sites to attract females (Wells 1977). Established
territories may provide them with greater access to feeding, oviposition and shelter
sites, enhancing their attractiveness as mates and reproductive success, which in
males is related to the number of mates obtained (Duellman & Trueb 1986). In
polygynous species, where individuals mate with more than one other individual within
a breeding season, it is generally accepted that the sex considered responsible for
obtaining and defending territories is also responsible for rearing young and in most
cases is the more philopatric sex (Greenwood 1980; Austin et al. 2003). Like most
amphibians, M. fleayi does not exhibit parental care but they require specific sites and
conditions for breeding. Thus familiarity with a breeding area may well convey a
competitive advantage and encourage site fidelity. Consequently males may sacrifice
foraging activities further a field to defend territories close to breeding sites and
advertise for mates. In species such as M. fleayi, that exhibit prolonged breeding
seasons with females arriving at breeding sites asynchronously and remaining at these
sites for short periods of time, it would also be advantageous for males to remain
sedentary and close to the stream. Males would also be expected to remain at
locations where previous breeding attempts were successful.
Suitable diurnal retreat sites are an important resource for terrestrial, tropical
frogs (Stewart & Pough 1984) and this is also likely to be the case for subtropical
amphibians. In habitats where suitable refuge sites are limited, those sites that provide
protection from predation and desiccation may well be more frequently used and once
located may be returned to, in preference to searching for similar sites or occupying

Movements made by M. fleayi
98
refuges that offer reduced protection. Specific microhabitat preferences and the
maintenance of retreat sites may therefore promote site fidelity (even for extended
periods) in preference to the increased risk of predation involved with time spent finding
alternative retreat sites.
Differences in dispersal and the magnitude of movements between males and
females may also be related to avoidance of inbreeding (Wolf 1993, 1994; Austin et al.
2003). In species where females mate only once during a breeding season, increased
chances of mating with relatives has greater evolutionary consequences and a
subsequent emphasis on inbreeding avoidance would confer advantages to dispersal
(Sterck 1997; Perrin & Mazalov 2000). Conversely, males may mate with more than
one individual in a breeding season thus decreasing the consequences of mating with
a relative on a single occasion.
Despite mark-recapture methods providing measures of movements and
dispersal for large numbers of individuals and on long time frames they are influenced
by problems associated with detecting and locating individuals that move away from
the transect or out of the search area. Female M. fleayi were rarely encountered on
streams with most individuals located on walking tracks and roads well away from
creeks. This was confounded by low recapture rates for females. At Bundoomba
Creek, 33 censuses resulted in 56 females being marked, with only 10 individuals ever
recaptured (H. Hines, R. Knowles and N. Doak, unpub. data). Low overall recapture
rates at Cainbable and Bundoomba Creeks, 55 and 54%, respectively, may indicate
that a high proportion of individuals dispersed. However, this seems unlikely as the
majority of animals never recaught were males. During this study marked, spooled or
radio-tracked males were not observed more than 20 metres from a stream. There was
only a single observation of a male distant from a stream - on the Lamington National
Park Road. Low recapture rates in males are more likely to be the result of individuals
moving along streams (i.e. off monitored transects) or from natural mortality.
It remains unknown if marked females that are not recaught move to alternative
breeding sites. The small time periods spent close to breeding sites by females may
mean that marked females returned undetected to Cainbable Creek. Females
opportunistically located away from creeks, on ridge-top roads, were found to make
movements very similar to those made by females on the creek; small localized
movements interspersed with movements covering much larger distances. However
none of the females originally located on the road were subsequently found at other
monitored breeding sites. A single female was found to move from the breeding site to
the ridge-top (approximately 1 km) but the frequency of such large movements remains
unknown. This large movement was detected in the third monitoring season and so it is
Movements made by M. fleayi
99
unknown if this female returned to Cainbable Creek in subsequent breeding seasons or
moved to another breeding site.
In many studies small sample sizes for both sex and life stage preclude the
identification of sex or age dependant differences in the magnitude of movements. This
is particularly true for radio-tracking studies, which require expensive equipment and in
which the location of a large number of animals can become increasingly labor
intensive. This particular method of quantifying movements is usually restricted to adult
frogs due to weight limits so movements made by juveniles and sub-adults can usually
not be studied with this method and often go undetected. In some species of
amphibians, juveniles tend to remain at the adult breeding site (e.g. Bufo variegata,
Beshkov & Jameson 1980) while in others adults have shown site fidelity while
juveniles disperse (e.g. Hyla regilla, Jameson 1956; Rana sylvatica, Beshkov &
Jameson 1980; Ascaphus truei, Daugherty & Sheldon 1982). Twenty eight sub-adults
of M. fleayi were marked, and only five of these were recaught. One sub-adult was
observed away from the creek (630 m), while a large number were found on walking
tracks (48). This indicates that sub-adults of this species are capable of large
movements and have the potential to disperse into neighbouring breeding sites. This is
more similar to the movements of adult females than adult males. As the sex of sub-
adults and juveniles was not determined in this study (as it requires destructive
sampling) no clear conclusions can be made in regards to their movements.
4.4.2 Comparisons with other amphibian species
Mixophyes fleayi utilizes rainforest habitat for both breeding and non-breeding
activities and as such the separation of these two habitats is difficult. The species is
reliant on rainforest streams for breeding and the presence of permanent streams may
be the only feature that differentiates breeding from non-breeding habitats. Male M.
fleayi remain in close proximity to these streams throughout the breeding season and
during non-breeding activity. In contrast females move away from specific breeding
sites after short periods of time. Most studies investigating movement in amphibians
have focused on identifying and quantifying the movement of adults from specific
breeding areas into habitats utilised in post-breeding activity (see review by Lemckert
2004). Numerous species have been shown to cover distances between breeding and
non-breeding areas much larger than those observed in female M. fleayi (Table 4.4).

Movements made by M. fleayi
100
Table 4.4: Maximum recorded distances travelled by amphibians. Mean distances ( x ) are shown if maximums were not stated. The sex or life stages found to make the movements are indicated unless unreported in the original study. nr = not reported, b = breeding site, pb = post breeding site, mr = mark-recapture, sp = spool tracking or mechanical trailing device, rt = radio-tracking, trap = funnel trapping.
Species Distance Sex area Method Reference
Bufonidae
Bufo boreas 2440 females b – bp nr Bartelt 2000 in Muths 2003
Bufo boreas 2324 females b – pb rt Muths 2003
Bufo bufo 1600 adults b – pb sp Sinsch 1988a
Bufo bufo 3000 adults b – bp mr Sinsch 1990
Bufo bufo 1900 adults b – b mr Reading et al. 1991
Bufo calamita 985 females b – pb mr/sp/rt Sinsch 1988b
Bufo calamita 240 females b – bp mr/rt Sinsch 1992a
Bufo quercicus 574 x nr b – bp trap Dodd 1996
Bufo terrestris 515 x nr b – bp trap Dodd 1996
Ranidae
Rana aurora 2800 adults b – pb rt Bulger et al. 2003
Rana clamitans 300 adults b mr Martof 1953
Rana lessonae 15000 adults b – b mr Tunner 1992
Rana luteiventris 1030 females b – bp rt Pilliod et al. 2002
Rana muscosa 1000 females b – b mr Pope & Matthews 2001
Rana palustris 213 adults b – bp mr Resetarits 1986
Rana pipiens 10500 adults b – pb sp Dole 1968
Rana pipiens 2100 adults b – b mr Seburn et al. 1997
Rana p. pretiosa 1280 females b – b mr Turner 1960
Rana sylvatica 2500 juveniles b – b mr Berven & Grudzien 1990
Hylidae
Acris gryllus 383 x nr b – pb trap Dodd 1996
Hyla arborea 12600 adults b – b mr Stumpel & Hanekamp 1986
Hyla cineria 545 x nr b – pb trap Dodd 1996
Hyla femoralis 266 x nr b – pb trap Dodd 1996
Hyla regilla 238 juveniles b – b mr Jameson 1956
Hyla squirella 594 x nr b – pb trap Dodd 1996
Litoria nannotis 15 females/juv. b – b rt Hodgkison & Hero 2000;2002
Myobatrachidae
Mixophyes fasciolatus 143 females b rt/sp Streatfield 1999
Mixophyes iteratus 50 females b rt/sp Streatfield 1999
Mixophyes iteratus 100 adults b rt/sp Lemckert & Brassil 2000
Geocrinia alba 40 males b mr Driscoll 1997
Geocrinia vitellina 50 males b mr Driscoll 1997

Movements made by M. fleayi
101
Due to the geographic separation of distinct areas utilised in breeding and non-
breeding seasons by many amphibian species movements between these two areas
are often substantial. They are also difficult to detect, especially with traditional mark-
recapture methods which are usually focused around breeding sites. The majority of
studies investigating such movements in frogs have focused on North American pond
breeding species in which a clear distinction between breeding and non-breeding
habitats is readily made. A number of investigations have focused on movements
made between breeding sites (e.g. Martof 1953; Turner 1960; Berven & Grudzien
1990; Seburn et al. 1997). However, species that utilize similar habitats during both
seasons have generally been overlooked in movement studies and the magnitude of
movements made by individuals during daily activities within breeding areas is rarely
reported.
Male M. fleayi moved large distances within breeding areas, despite displaying
very small displacement distances. While results from spooling indicated that short
term total distances moved by males were significantly larger than those of females the
opposite was true for longer term movements (radio-tracking). The total distance
moved by both males and females were smaller than many of the maximum
movements recorded for other amphibian species (Table 4.4), including M. iteratus and
M. fasciolatus (Streatfield 1999; Lemckert & Brassil 2000).
One of the most extensively studied families (Ranidae) have been examined
utilizing a range of direct methods including both mark-recapture and radio telemetry.
Displacement distances within this family range from 15 km for the more mobile
species, to hundreds of metres or less (see Table 4.4). However, methods such as
mark-recapture and radio-tracking, used to study movement, only measure the
minimum distance (i.e. displacement) between two location points and may
underestimate the maximum distance moved and dispersal ability. Mark-recapture and
radio-tracking results for adult M. fleayi, representing the displacement of individuals, in
this study greatly underestimated the actual distance travelled by frogs as measured by
spooling. Empirical data for both M. iteratus and M. fasciolatus, show the same result
with radio-tracking methods significantly underestimating the actual distance moved by
individuals (Streatfield 1999; Lemckert & Brassil 2000).

Movements made by M. fleayi
102
Despite the limitation of accurately measuring total distance travelled by an
individual, the use of radio-tracking has facilitated investigations into the long term
movements made by amphibians and the quantification of movement distances, and
has often led to the discovery of rare long distance dispersal events. Bulger et al.
(2003) found radio tagged Rana aurora draytonii to be capable of movements of up to
2.8 km between breeding and post-breeding areas, with individuals capable of moving
up to 500 m in a single night. Mark-recapture methods have also revealed some
species to be capable of large movements. Bufo bufo have been found to make
movements of 3 km (Sinsch 1990) while other species are capable of significantly
larger movements (e.g. 15 km, Rana lessonae; Sinsch 1990; Tunner 1992; 12.6 km,
Hyla arborea; Stumpel & Hanekamp 1986; 6 km, Hoplobatrachus occipitalis; Spieler &
Linsenmair 1986). In many cases long distance movements are made between distinct
breeding areas and subsequently facilitate gene flow between populations. Genetic
data showed no evidence of such movements in M. fleayi, either between isolated
forest fragments (see Chapter 2) or populations occurring within continuous habitat
(see Chapter 3). Direct measurements of movement highlighted that gene flow
between populations within continuous habitat is likely to be the result of the movement
by adult females as opposed to adult males.

103
Chapter 5. General discussion
Results of this study provide evidence for restricted contemporary gene flow
within M. fleayi, on a broad scale, between disjunct forest fragments, and on a fine
scale, between populations within continuous habitat. Populations found in disjunct
rainforest fragments across the species’ current distribution have been genetically
isolated for considerable periods of time with lowland areas between forest fragments
effectively functioning as barriers to dispersal. The most significant of these is the
Brisbane River Valley (BRV) which has apparently been a barrier to dispersal in this
species since the Pliocene. Historical contraction of rainforest due to extreme climatic
fluctuations of the Pleistocene further isolated populations of M. fleayi in south-east
Queensland and north-east New South Wales.
Dispersal does occur within continuous habitat in this species although it is
restricted by geographical distance. Direct field based measurements of movement and
dispersal indicate that adult females, sub-adults or juveniles are most likely to be the
individuals facilitating gene flow between neighbouring sites. Dispersal of adult males is
unlikely due to the observed high fidelity to streams. Indirect measurements of
dispersal based on genetic methods suggest that while dispersal may occur between
proximal subcatchments connected by suitable habitat, it is infrequent and is reduced
by increasing distance.
5.1 Pliocene isolation and population differentiation
The distribution of M. fleayi was probably rather extensive prior to the Pliocene
with potential for connections between populations ranging from the Conondale Range
in the north to the Tooloom Range in the south. Reconstruction of paleoclimatic events
during the Miocene suggests conditions on the east coast of Australia were wet and
cold with vegetation coverage predominantly mesic rainforest (Kershaw 1988, 1994;
Kershaw et al. 1994). The floristic characteristics of these were similar to those known
to currently support populations of M. fleayi (Kershaw 1988; Kershaw et al. 1994, 2003)
suggesting there were suitable habitats and climate conditions for an extensive and
more contiguous ancestral range.
Mitochondrial DNA sequence divergence indicates separation of the Conondale
Range from all other forest fragments currently containing M. fleayi populations (Mount
Barney, McPherson, Main, Tooloom and Nightcap Ranges) across the BRV sometime
during the Pliocene (3%, 2.14 mya) (Chapter 2). The retreat of mesic rainforest to
isolated fragments approximately 2 mya during the Pliocene (Kershaw 1988; Adam

General discussion
104
1992) is expected to have disrupted dispersal in M. fleayi with any subsequent
expansion of habitat insufficient to allow reconnection of refugial populations across the
BRV.The event most likely to have led to contraction of rainforest and to have disrupted
otherwise contiguous ancestral distributions leading to the observed intraspecific
divergences across the distribution of M. fleayi was the change in climate and
associated contraction of mesic rainforest. Paleoclimatological and palynological
evidence, although limited for south-east Queensland, suggests expansion of mesic
rainforests during suitable climate conditions and dramatic contraction during
increasingly cooler and drier periods of the Pliocene and Pleistocene (Galloway &
Kemp 1981; Kershaw 1981, 1994; Nix 1991; Truswell 1993; White 1994; Kershaw et al.
1994, 2003).
Increasingly arid conditions during the Pliocene combined with dramatic climate
fluctuations ensured populations separated across extensive areas of low altitude, such
as the BRV, remained disconnected during cool, wet periods. The mtDNA data shows
some evidence of restricted dispersal due to geographical distance and also indicates
that current intervening dry, lowland areas potentially act as effective barriers to
dispersal for M. fleayi. The closest sampled sites from Springbrook and Lamington
National Parks, share common ancestral haplotypes but do not share recently derived
haplotypes. This suggests that dispersal between these nearby sites is absent or
restricted due to intervening lowland areas (the Numinbah Valley) and a lack of suitable
habitat (dry eucalypt forest), as the geographical distance between them is similar to
distances between populations with current gene flow found in continuous habitat at
higher altitudes.
The distribution and phylogeography of other rainforest dwelling species found
in south-east Queensland provide support for isolation of the Conondale Range from
other southern rainforest fragments during the Pliocene. The few studies that have
investigated genetic differentiation in the region’s endemic rainforest species have
found similar trends to those seen in M. fleayi; sequence divergence consistent with the
separation of rainforest refugia during the late Pliocene. The 3.26% sequence
divergence across the BRV in the rainforest restricted frog Litoria pearsoniana (2 mybp,
McGuigan et al. 1998) is similar to the divergence found for M. fleayi, providing
independent support for forest fragmentation across the BRV during the Pliocene.
A Pliocene separation of forest fragments, north and south of the BRV, is
further supported by interspecific 16s mtDNA divergence within the genus Euastacus.
Divergence between E. hystricosus from the Conondale Range and E. sulcatus from
both the Lamington Plateau and Main Range (1.3%) places forest fragment isolation at
4.4 mybp during the Pliocene (Ponniah 2002). Intraspecific divergence in the skinks

General discussion
105
Eulamprus martini (3.1%, 2.2 mybp, Moritz & Playford 1998) and Lampropholis delicata
(Conondale/D’Aguilar – Lamington 3.9-4.1 mybp; Conondale/D’Aguilar – Main Range
4.2-4.4 mybp) (Moritz & Playford 1998) further support a Pliocene separation of mesic
forest fragments north and south of the BRV.
Lampropholis delicata and Euastacus display deeper sequence divergence
across the BRV and date separation of forest fragments earlier in the Pliocene than the
divergence in M. fleayi. However, earlier isolation of populations and an increase in
divergence is expected with increasing rainforest specialization and/or decreasing
vagility (Joseph et al. 1995). The existence of similar trends in inter- and intraspecific
divergence in other endemic species, across the putative barrier of the Brisbane River
Valley warrants further investigation.
5.2 Further population differentiation during the Pleistocene
Forest fragments found within the southern distribution of M. fleayi show smaller
levels of genetic variation and sequence divergence corresponding to much more
recent expansion and contraction of rainforest habitat as recently as 78.5 thousand
years ago during the Pleistocene. The Pleistocene is believed to have been a period of
intense climatic fluctuations (Hope 1994; Nix 1991). During these periods of climatic
variability, if suitable habitat was extensive, there should be evidence of dispersal as
extensive suitable habitat facilitates widespread gene flow. Deterioration of climatic
conditions would obviously lead to a reduction of rainforest and a receding of
associated species distributions to refugial areas of suitable habitat. Such climatic
fluctuations appear to have influenced the intraspecific genetic variation of M. fleayi
through vicariant isolation and divergence of relatively small Pleistocene populations
across the species’ southern distribution.
The other three species of the genus Mixophyes found in south-east
Queensland and north-east New South Wales do not have distributions that completely
overlap with M. fleayi. However, the ecologically similar, sister taxon, M. balbus is
found in forest fragments adjacent to, and south of, a number of the southern forest
fragments containing M. fleayi. Mitochondrial ND2 data for M. balbus show sequence
divergence between forest fragments similar to that of M. fleayi, suggesting contraction
and isolation of forest fragments further south during the Pleistocene (N. Doak
unpublished data).
Similar timing of mesic forest contraction consistent with Pleistocene isolation of
populations is indicated from sequence divergence in Lampropholis delicata (150,000

General discussion
106
ybp – 1 mybp) across south-east Queensland and north-east New South Wales (Moritz
& Playford 1998) as well as two species of rainforest endemic lizard, with restricted
geographic distributions, from mid-east Queensland; Eulamprus amplus and Phyllurus
ossa (Stuart-Fox et al. 2001). Mitochondrial species histories of many wet tropics
endemic rainforest restricted species, considered to have similar dispersal ability to M.
fleayi, including frogs (Litoria rheocola, L. nannotis, L. genimaculata, Nyctymistes dayi),
skinks (Gnypetoscincus queenslandiae) and a gecko (Saltuarius cornutus) (see Joseph
et al. 1995; Moritz et al. 1997; Schneider et al. 1998; Schneider & Moritz 1999;
Cunningham 2001) also display regional isolation of populations and divergence of
lineages during the Pleistocene.
Control of climatic fluctuations during the Pleistocene has been attributed to
changes in the distribution of incoming radiation due to alterations in the earth’s orbit
around the sun (Williams et al. 1998; Kershaw et al. 2003). Interglacial periods of the
Pleistocene produced regionally wetter conditions and correspondingly warmer
climates with contraction of major ice sheets in the northern hemisphere and
subsequently high sea levels (similar to current conditions) as well as expansion of
complex angiosperm dominated rainforests (Kershaw et al. 2003). Cooler glacial
periods coincided with higher ice volumes, low sea levels and climate variation
expressed predominantly in reduced moisture availability. Subsequently, conifer
dominated drier rainforests and/or open woodlands were more widespread and mesic
plant communities existed with restricted distributions (Kershaw et al. 2003).
Pleistocene glacial periods would therefore have created effective barriers to dispersal
as lowland areas between forest fragments would not have been wet enough to
support rainforest habitat during these periods. Warmer climates during interglacial
periods would have allowed rainforest to expand into these lowland areas but may
have restricted dispersal due to increased temperature.
The lack of genetic structuring between some of the southern forest fragments
(Chapter 2) may be the result of recolonization by a small number of individuals from
refugial populations during wet interglacial periods (Kershaw & Nix 1988, Kershaw et
al. 2003). However, given the species’ apparent limited dispersal ability (Chapter 3 and
4), it is more likely that the lack of structuring reflects small sample sizes from some
sites which are an artifact of current small population sizes. Possible declines in
population size seen at many sites would confound this and may have resulted in the
loss of low frequency endemic haplotypes contributing to low levels of genetic
structuring between some forest fragments.

General discussion
107
5.3 Dispersal within continuous forest habitat
Fine scale genetic structure of M. fleayi populations within forest fragments
suggests that while current climate and habitats are favourable within a fragment,
dispersal does not currently occur between geographically distant catchments.
Widespread sharing of ancestral haplotypes and the restricted distribution of more
recently derived ones, within continuous habitat, suggests that contemporary gene flow
is restricted by geographical distance as it is in a number of other amphibian species.
Terrestrial ground dwelling amphibian species are considered to have relatively low
dispersal ability (Blaustein et al. 1994), particularly relative to other taxa such as birds
and mammals. They often display high levels of site fidelity and low potential for
migration (Daugherty & Sheldon 1982; Berven & Grudzien 1990; Driscoll 1997;
Semlitsch & Bodie 1998) with movements greatly restricted by environmental
conditions (Beshkov & Jameson 1980; Sinsch 1990) and the presence of suitable
habitat (Hitchings & Beebee 1997, 1998).
The mtDNA data indicate that streams supporting breeding populations that
have headwaters close to one another, and thus share considerable subcatchment
boundaries, are likely to be connected by a larger number of dispersing individuals. For
example, the headwaters of Cainbable and Stockyard Creeks are close to each other
geographically and a share considerable subcatchment boundary. These two sites also
shared the highest estimate of gene flow of all sampled sites within Lamington National
Park. Stockyard and Bundoomba Creeks are separated by a similar distance but
estimates of gene flow between them are smaller. However, the extent of shared
subcatchment boundary is also smaller.
It appears that a higher number of dispersing individuals between sites that
share a considerable common ridge-top boundary may also be the case in other forest
fragments. Two opposing catchments in the Conondale Range currently sustaining
populations of M. fleayi, Booloumba and Kilcoy Creeks are separated by a major
watershed but share a subcatchment boundary. Estimates of the number of migrants
per generation between these two sites indicate contemporary gene flow. As
Booloumba and Kilcoy Creeks flow into the Mary and Brisbane Rivers respectively
there is no aquatic connectivity and as such movement between them must be due to
recent terrestrial dispersal. Similar findings in other stream dependant species across
the same major watershed support this hypothesis; the frog Litoria pearsoniana
(McGuigan et al. 1998) and the crustaceans Euastacus hystricosus (Ponniah 2002)
and Parataya australiensis (Hurwood et al. 2003).

General discussion
108
The extent and capacity for dispersal and gene flow will depend greatly on the
geographical distance between populations and the presence of potential landscape
barriers. A growing number of publications focusing on the fine-scale genetic structure
of amphibians, in particular frogs, provide evidence for a strong influence of geographic
distance and intervening habitat on genetic structure (e.g. Reh & Seitz 1990; Reaser
1996; Lougheed et al. 1999; Shaffer et al. 2000; Rowe et al. 2000; Pilliod et al. 2002;
Lampert et al. 2003; Monsen & Blouin 2004; Funk et al. 2005). In particular, montane
upland areas appear to promote genetic subdivision between populations in a number
of species (Waldman & Tocher 1998; Lougheed et al. 1999; Garciá-Paris et al. 2000;
Shaffer et al. 2000; Tallmon et al. 2000; Monsen & Blouin 2003, 2004; Funk et al.
2005). Unlike other anuran species mountain ridges do not appear to act as effective
barriers to dispersal in M. fleayi. Results from this study have demonstrated that M.
fleayi, while consistent with the notion that montane species exhibit strong genetic
structuring between populations, does not support the idea that upland, elevated
habitats such as ridgelines are responsible for such subdivision.
Mountain ridges have been found to act as barriers to gene flow in Rana
luteiventris with dispersal rates over ridges low despite the species known potential for
long distance movements (Turner 1960; Reaser 1996; Pilliod et al. 2002; Funk et al.
2005). Similar observations have been made in regards to the effect of mountain ridges
on gene flow in Epipedobates femoralis (Lougheed et al. 1999) and population
differentiation in a number of other amphibian species (Garciá-Paris et al. 2000;
Shaffer et al. 2000; Tallmon et al. 2000; Monsen & Blouin 2003). Rana cascadae has
also been found to show extreme genetic subdivision between montane populations at
fine geographic scales (Monsen & Blouin 2004). However, most of the species studied
at this level of resolution breed in ponds or temporary waterways, the often discrete
nature of which may exacerbate the effects of intervening ridge-tops. Thus the
suggestion that montane habitats promote unusually high genetic subdivision among
frog populations requires further investigation and should be addressed in species that
utilise differing breeding habitats and strategies, before being widely accepted as a
generalization for amphibians. The results of this study suggest the underlying
mechanism for high levels of genetic structuring in amphibians inhabiting montane
habitats may require a refocusing onto ecological, field-based investigations of
dispersal to identify specific landscape features that restrict dispersal and gene flow
and promote genetic subdivision.
Genetic data refuting ridge-tops as substantial barriers to dispersal in M. fleayi
were supported by the results of field based studies. The use of cotton spooling and
radio-transmitters as well as other observations provided valuable data on movement

General discussion
109
patterns and distances travelled by individuals of M. fleayi. Importantly these direct
methods also provided information on the habitats utilised by potentially dispersing
individuals and empirical measurements of movement ability. The use of mitochondrial
DNA meant any lack of differentiation between populations was attributable to female
dispersal while differentiation of populations would be due to female philopatry. Low
levels of genetic subdivision observed between some subcatchments therefore
suggests that female M. fleayi may disperse between neighbouring sites.
Adult females were found to be capable of movements of the magnitude
required to cover the distances separating known breeding sites. Mark-recapture,
spooling and radio-tracking measurements of movements made by adults indicated
that female M. fleayi move away from breeding sites after short periods of time and are
often found in relatively high numbers along ridge-tops. In contrast, male M. fleayi were
found to be extremely philopatric and while they are capable of covering distances
similar to females, they do not move away from specific breeding sites, remaining close
to creeks and breeding areas both within and across seasons. Like many amphibian
species, M. fleayi requires specific sites and conditions for breeding, in which case
familiarity with the occupied area may well convey an advantage with competition for
specific microhabitats encouraging site fidelity and significantly influence the sedentary
nature of males.
The estimates of gene flow between geographically close populations do not
seem entirely unreasonable given the results of field based movement studies.
However, the number of females observed along the ridge-tops that otherwise separate
breeding sites, and the comparatively low estimates of the number of migrants per
generation for some adjacent sites, indicates that many females may display site
fidelity, moving to ridge-tops after breeding activity but returning to the same breeding
site in subsequent seasons. Such behaviour would also support the observation of
increasing genetic differentiation with increased geographical distance between sites.
Surprisingly for such a large and potentially mobile frog species, populations separated
by as little as 2 km were significantly different from each other. Significant genetic
differentiation at such a fine geographic scale, while surprising, is in accordance with
previous research indicating high levels of site fidelity and small migration distances in
adult frogs (e.g. Breden 1987, 1988; Berven & Grudzien 1990; Driscoll 1997; Monsen &
Blouin 2004). While dispersal by female M. fleayi may facilitate gene flow between
adjacent subcatchments, successful colonization or recolonization of vacant habitat is
extremely unlikely given the potential for site fidelity in females and the extremely high
philopatry shown by males.

General discussion
110
5.4 Conservation and management implications
Quantifying genetic differentiation between populations allows the estimation of
gene flow between sampled sites and can often result in the identification of
populations that are sufficiently genetically distinct from one another as to warrant
identification as evolutionary significant units (ESUs) (Moritz 1994a). Such genetically
distinct units may warrant conservation or management priority, despite the absence of
morphological or behavioural differences, to ensure the observed levels of genetic
diversity within the species are maintained (e.g. Brooke & Rowe 1996; Kimberling et al.
1996; Rowe et al. 1998). At the fine scale of population genetics, identification of local
population boundaries and dispersal patterns is critical in designing effective
conservation and management strategies. They may also lead to identification of
barriers to dispersal and migration within a species that may otherwise remain
undetected (Napolitano & Descimon 1994; Allen et al. 1995; Rowe et al. 1998).
A fundamental role of conservation biology is to identify and protect genetically
distinct populations/lineages. There has been considerable debate over the
requirements and definition of ESUs (Ryder 1986; Waples 1991; Moritz 1994a, 1994b,
1995; Vogler & DeSalle 1994; Taylor & Dizon 1999; Crandall et al. 2000) with genetic
differentiation often the only criterion used to identify distinct, discrete and biologically
or ecologically significant populations (Monsen & Blouin 2003). The measurement of
regional differentiation across the distribution of M. fleayi provided by this study has
identified at least two distinct areas of genetic endemism either side of the Brisbane
River Valley that can be considered as separate ESUs warranting independent
conservation and management actions. These two divergent mitochondrial lineages or
units comply with Waples’ (1991) definition of an ESU as a set of populations that are
reproductively isolated as well as Taylor and Dizon’s (1999) definition of management
units as geographical areas with restricted interchange of individuals and Mortiz’s
(1994a) ESU concept invoking reciprocal monophyly for mtDNA haplotypes.
A lack of recent historical connectivity between occupied forest fragments within
the southern ESU further supports the conservation and management of this species at
the level of forest fragment (e.g. Springbrook Plateau, McPherson, Main, Nightcap and
Tooloom Ranges). This scale of management is particularly important given the impact
that possible recent declines have had on the number and size of breeding populations
and the genetic variation within isolated forest fragments (see Chapter 2). Management
of the species at the scale of forest fragment is also important considering the level of
genetic structuring found between populations within continuous habitat that are
separated by relatively small geographical distances. Restricted movement between

General discussion
111
neighbouring subcatchments highlights the importance of continuous forest to the
maintenance of current, albeit restricted, gene flow within this species.
Dispersal of individuals between breeding sites and their impact on the genetic
structure of populations is extremely important to the conservation and management of
isolated populations. Such movements determine the potential for recolonization of
previously occupied habitats as well as for colonization of vacant habitat. Long distance
movements are especially important in both of these. Long-distance movements (>3
km) by M. Fleayi are probably rare. However, conservation of landscape characteristics
that may facilitate them, will be critical to the species persistence.
The presence of endemic haplotypes in a number of populations within
continuous habitat, including those separated by relatively small geographical
distances, highlights the importance of the conservation of these populations.
Restricted dispersal capability of this species, combined with male site fidelity, means
that populations have the potential to be easily isolated both spatially and genetically,
increasing the need to identify and maintain existing dispersal routes. The potential for
roads and clearings to further isolate populations, particularly those currently found
within continuous habitat, warrants further investigation in this species. If levels of
genetic diversity within the species are to be maintained, populations that show some
level of gene flow, albeit restricted, must remain connected by continuous habitat.
Species occurring over small geographical ranges, that are comprised of
multiple distinct lineages, with low levels of gene flow occurring between these units
and subsequent high levels of genetic structuring, are often considered to be at
relatively low levels of extinction risk (Moritz 1994a). However, while the species itself
may be at a lower risk of extinction the local populations may be more susceptible to
extinction. If populations continue to become fragmented and isolated, reintroductions
may be considered necessary for the continuation of some populations and the
species’ survival, especially if recent unexplained declines continue within isolated
populations. Such reintroductions should only be based on genetic and ecological
similarity between source and target populations (Banks & Taylor 2004). Genetic
results provided by this study should help to guide such drastic measures should they
become necessary. More importantly however, they provide guidance for continued
efforts to ensure the conservation of current levels of intraspecific genetic variation and
genetically distinct lineages both of which are important for the long-term evolutionary
success of populations and the species.

General discussion
112

113
References
Adam P (1992) Australian rainforests. Clarendon Press, Oxford. Alford RA, Richards SJ (1999) Global amphibian declines: A problem in applied
ecology. Annual Review of Ecology and Systematics 30: 133-165. Allen PJ, Amos W, Pomeroy PP, Twiss SD (1995) Microsatellite variation in gray seals
(Halichoerus grypus) shows evidence of genetic differentiation between two British breeding colonies. Molecular Ecology 4: 653-662.
Anderson LW, Fog K, Damgaard C (2004) Habitat fragmentation causes bottlenecks
and inbreeding in the European tree frog (Hyla arborea). Proceedings of the Royal Society of London Series B 271: 1293 - 1302.
Anstis M (2002) Tadpoles of south-eastern Australia: A guide with keys. Reed New
Holland, Sydney. Arbogast BS, Edwards SV, Wakeley J, Beerli P, Slowinski JB (2002) Estimating
divergence times from molecular data on phylogenetic and population genetic timescales. Annual Review of Ecology and Sytematics 33: 707-740.
Arbogast BS, Slowinski JB (1998) Pleistocene speciation and the mitochondrial DNA
clock. Science 282: 1955. Arntzen JW, Teunis SFM (1993) A six-year study on the population dynamics of the
crested newt (Triturus cristatus) following the colonization of a newly created pond. Herpetological Journal 3: 99-110.
Ashton REJ (1975) A study of movement, home range, and winter behaviour of
Desmognathus fuscus (Rafinesque). Journal of Herpetology 9 (1): 85-91. Austin JD, Dávila JA, Lougheed SC, Boag PT (2003) Genetic evidence for female-
biased dispersal in the bullfrog Rana catesbeiana (Ranidae). Molecular Ecology 12: 3165-3172.
Austin JD, Lougheed SC, Neidrauer L, Chek AA, Boag PT (2002) Cryptic lineages in a
small frog: The post-glacial history of the spring peeper, Pseudacris crucifer (Anura: Hylidae). Molecular Phylogenetics and Evolution 25: 316-329.
Avise JC (1994) Molecular markers, natural history and evolution. Chapman & Hall,
New York. Avise JC (2000) Phylogeography: The history and formation of species. Harvard
University Press, Cambridge, MA. Avise JC, Arnold J, Ball RM, Bermingham E, Lamb T, Neigel JE, Reeb CA, Saunders
NC (1987) Intraspecific phylogeography: The mitochondrial DNA bridge between population genetics and systematics. Annual Review of Ecology and Systematics 18: 489-522.
Babik W, Branicki W, Sandera M, Litvinchuk S, Borkin LJ, Irwin JT, Rafiñski J (2004)
Mitochondrial phylogeography of the moor frog, Rana arvalis. Molecular Ecology 13: 1469 - 1480.

References
114
Banks SC, Taylor AC (2004) Genetic analyses in fauna conservation: Issues and
applications to Australian forests. In: Conservation of Australia's forest fauna (second edition) (ed. Lunney D), pp. 576-590. Royal Zoological Society of New South Wales, Mosman, NSW, Australia.
Barber PH (1999a) Phylogeography of the canyon treefrog, Hyla arenicolor (Cope)
based on mitochondrial DNA sequence data. Molecular Ecology 8 (4): 547-562. Barber PH (1999b) Patterns of gene flow and population genetic structure in the
canyon treefrog, Hyla arenicolor (Cope). Molecular Ecology 8 (4): 563-574. Barinaga M (1990) Where have all the froggies gone? Science 247: 1033-1034. Bartelt PE (2000) A biophysical analysis of habitat selection in western toads (Bufo
boreas) in southeastern Idaho Unpublished PhD Thesis, Idaho State University. Bartelt PE, Peterson CR, Klaver RW (2004) Sexual differences in the post-breeding
movements and habitats selected by western toads (Bufo boreas) in southeastern Idaho. Herpetologica 60 (4): 455-467.
Bellis ED (1965) Home range and movements of the wood frog in a northern bog.
Ecology 46 (1): 90-98. Berger L, Speare R, Daszak P, Green DE, Cunningham AA, Goggin CL, Slocombe R,
Ragan MA, Hyatt AD, McDonald KR, Hines HB, Lips KR, Marantelli G, Parkes H (1998) Chytridiomycosis causes amphibian mortality associated with population declines in the rain forests of Australia and Central America. Proceedings of the National Academy of Science USA. 95: 9031-9036.
Berry O (2001) Genetic evidence for wide dispersal by the sand frog, Heleioporus
psammophilus (Anura: Myobatrachidae), in Western Australia. Journal of Herpetology 35 (1): 136-141.
Berven KA, Grudzien TA (1990) Dispersal in the wood frog (Rana sylvatica):
Implications for genetic population structure. Evolution 44 (8): 2047-2056. Beshkov VA, Jameson DL (1980) Movement and abundance of the yellow-bellied toad
Bombina variegata. Herpetologica 36 (4): 365-370. Birky CW, Maruyama T, Fuerst P (1983) An approach to population genetic and
evolutionary genetic theory for genes in mitochondria and chloroplasts, and some results. Genetics 103: 513-527.
Blaustein AR (1994) Chicken little or neros fiddle? A perspective on declining
amphibian populations. Herpetologica 50 (1): 85-97. Blaustein AR, Wake DB, Sousa WP (1994) Amphibian declines: Judging stability,
persistence, and susceptibility of populations to local and global extinctions. Conservation Biology 8 (1): 60-71.
Bos DH, Sites JWJ (2001) Phylogeography and conservation genetics of the Columbia
spotted frog (Rana luteiventris; Amphibia, Ranidae). Molecular Ecology 10: 1499-1513.

References
115
Bosman W, van Gelder JJ, Strijbosch H (1996) Hibernation sites of the toad Bufo bufo and Bufo calamita in a river floodplain. Herpetological Journal 6: 83-86.
Breden F (1987) The effect of post-metamorphic dispersal on the population genetic
structure of fowler's toad, Bufo woodhousei fowleri. Copeia 1987: 386-395. Breden F (1988) Natural history and ecology of fowler's toad Bufo woodhousei fowleri
(Amphibia: Bufonidae), in the Indiana dunes National Lakeshore. Fieldiana Zoologica 49: 1-16.
Brock RE, Kelt DA (2004) Influence of roads on the endangered Stephens' Kangaroo
Rat (Dipodomys stephensi): Are dirt and gravel roads different? Biological Conservation 118: 633-640.
Brooke MdL, Rowe G (1996) Behavioural and molecular evidence for specific status of
light and dark morphs of the Herald Petrel Pterodroma heraldica. Ibis 7: 420-432.
Brown JH, Kodric-Brown A (1977) Turnover rates in insular biogeography: Effect of
immigration on extinction. Ecology 58: 445-449. Brown LJ (1997) An evaluation of some marking and trapping techniques currently
used in the study of anuran population dynamics. Journal of Herpetology 31 (3): 410-419.
Brown W, George MJ, Wilson A (1979) Rapid evolution of animal mitochondrial DNA.
Proceedings of the National Academy of Science USA 76: 1967-1971. Bulger JB, Scott NJJ, Seymour RB (2003) Terrestrial activity and conservation of adult
Californian red-legged frogs Rana aurora draytonii in coastal forests and grasslands. Biological Conservation 110: 85-95.
Bull CM, Baghurst BC (1998) Home range overlap of mothers and their offspring in the
sleepy lizard, Tiliqua rugosa. Behavioural Ecology and Sociobiology 42: 357-362.
Burns EL, Eldridge MDB, Houlden BA (2004) Microsatellite variation and population
structure in a declining Australian hylid Litoria aurea. Molecular Ecology 13: 1745 - 1757.
Caccone A, Milinkovitch MC, Sbordoni V, Powell JR (1997) Mitochondrial DNA rates
and biogeography in European newts (genus Euproctus). Systematic Biology 46: 126-144.
Call DR (1997) Microsatellite characteristics and population structure for two anurans
Rana luteiventris and Hyla regilla. Unpublished PhD Thesis, Washington State University, Pullman, WA.
Call DR, Hallett JG, Mech SG, Evans M (1998) Considerations for measuring genetic
variation and population structure with multilocus fingerprinting. Molecular Ecology 7: 1337-1346.

References
116
Campbell NJH, Harriss FC, Elphinstone MS, Baverstock PR (1995) Outgroup heteroduplex analysis using temperature gradient gel electrophoresis: High resolution, large scale, screening of DNA variation in the mitochondrial control region. Molecular Ecology 4: 407-418.
Carbone I, Kohn LM (2001) A microbial population-species interface: Nested cladistic
and coalescent inference with multilocus data. Molecular Ecology 10: 947-964. Christy MT (1996) The efficacy of using passive integrated transponder (PIT) tags
without anaesthetic in free-living frogs. Australian Zoologist 30 (2): 139-141. Clement M, Posada D, Crandall KA (2000) TCS: A computer program to estimate gene
genealogies. Molecular Ecology 9: 1657-1660. Cogger HG, Cameron EE, Cogger HM (1983) Zoological catalogue of Australia.
Volume 1 Amphibia and Reptilia. Australian Government Publishing Service, Canberra, ACT.
Cohen MP, Alford RA (1996) Factors affecting diurnal shelter use by the cane toad
Bufo marinus. Herpetologica 52 (2): 172-181. Corben CJ, Ingram GJ (1987) A new barred river frog (Myobatrachidae: Mixophyes).
Memoirs of the Queensland Museum 25: 233-237. Covacevich J, McDonald KR (1991) Frogs and reptiles of tropical and subtropical
eastern Australian rainforests: Distribution patterns and conservation. In: The rainforest legacy: Flora and fauna of the rainforest (ed. Warren GPK), pp. 281-309. Australian Government Publishing Service, Canberra.
Crandall KA (1996) Multiple interspecies transmissions of human and simian t-cell
leukemia/lymphoma virus type I sequences. Molecular Biology and Evolution 13 (1): 115-131.
Crandall KA, Bininda-Emonds ORP, Mace GM, Wayne RK (2000) Considering
evolutionary processes in conservation biology. Trends in Ecology and Evolution 15 (7): 290-295.
Crandall KA, Templeton A (1993) Empirical tests of some predictions from coalescent
theory with applications to intraspecific phylogeny reconstruction. Genetics 134: 959-969.
Crandall KA, Templeton AR (1996) Applications of intraspecific phylogenetics. In: New
uses for new phylogenies (eds. Harvey PH, Leigh Brown AJ, Maynard Smith J, Nee S). Oxford University Press, Oxford.
Cunningham M (2001) Vicariance, speciation and diversity in Australopapuan rainforest
frogs. Unpublished PhD Thesis, The University of Queensland. Czechura GV (1991) The Blackall-Conondale Ranges: Frogs, reptiles and fauna
conservation. In: The rainforest legacy: Flora and fauna of the rainforest (ed. Warren GPK), pp. 311-324. Australian Government Publishing Service, Canberra.
Czechura GV, Ingram G (1990) Taudactylus diurnus and the case of the disappearing
frogs. Memoirs of the Queensland Museum 29 (2): 361-365.

References
117
Daugherty CH, Sheldon AL (1982) Age-specific movement patterns of the frog
Ascaphus truei. Herpetologica 38 (4): 468-474. Davis RA, Roberts JD (in press) The population genetic structure of the western
spotted frog, Heleioporus albopunctatus (Anura; Myobatrachidae) in a fragmented landscape in south-western Australia. Australian Journal of Zoology.
Davis TM, Ovaska K (2001) Individual recognition of amphibians: Effects of toe clipping
and fluorescent tagging on the salamander Plethodon vehiculum. Journal of Herpetology 35 (2): 217-225.
De Oliveira SN (1996) Daily movements of male Phyllomedusa bicolor in Brazil.
Herpetological Review 27 (4): 180-181. Dennis AJ (2002) The diet of the musky rat-kangaroo, Hypsiprymnodon moschatus, a
rainforest specialist. Wildlife Research 29: 209-219. Denton JS, Beebee TJC (1993) Reproductive strategies in a female-biased population
of natterjack toads, Bufo calamita. Animal Behaviour 46: 1169-1175. Doak DF (1995) Source-sink models and the problem of habitat degradation: General
models and applications to the Yellowstone grizzly. Conservation Biology 9: 1370-1379.
Dodd CKJ (1996) Use of terrestrial habitats by amphibians in the sandhill uplands of
north-central Florida. Alytes 14 (1): 42-52. Dodd CKJ, Cade BS (1998) Movement patterns and the conservation of amphibians
breeding in small, temporary wetlands. Conservation Biology 12 (2): 331-339. Dole JW (1965) Summer movements of adult leopard frogs, Rana pipiens Schreber, in
northern Michigan. Ecology 46 (3): 236-255. Dole JW (1968) Homing in leopard frogs, Rana pipiens. Ecology 49 (3): 386-399. Dole JW (1972) Evidence of celestial orientation in newly-metamorphosed Rana
pipiens. Herpetologica 28: 273-276. Dole JW, Durant P (1974) Movements and seasonal activity of Atelopus oxyrhynchus
(Anura: Atelopodidae) in a Venezuelan cloud forest. Copeia 1974: 230-235. Donnellan SC, Mahony M (2004) Allozyme, chromosomal and morphological variability
in the Litoria lesueuri species group (Anura: Hylidae), including a description of a new species. Australian Journal of Zoology 52: 1-28.
Donnellan SC, McGuigan K, Knowles R, Mahony M, Moritz C (1999) Genetic evidence
for species boundaries in frogs of the Litoria citropa species-group (Anura: Hylidae). Australian Journal of Zoology 47: 275-293.
Donnelly MA (1989) Effects of reproductive resource supplementation on space-use
patterns in Dendrobates pumilio. Oecologia 81: 212-218.

References
118
Donnelly MA, Guyer C, Juterbock E, Alford RA (1994) Techniques for marking amphibians. In: Measuring and monitoring biological diversity: Standard methods for amphibians (eds. Heyer WR, Donnelly MA, McDiarmid RW, Hayek L-AC, Foster MS), pp. 277-284. Smithsonian Institution Press, Washington, D.C.
Doody JS (1995) A photographic mark-recapture method for patterned amphibians.
Herpetological Review 26: 19-21. Doyle JJ, Doyle JL (1987) A rapid DNA isolation procedure for small amounts of fresh
leaf tissue. Phytochemical Bulletin 19: 11-15. Driscoll DA (1997) Mobility and metapopulation structure of Geocrinia alba and
Geocrinia vitellina, two endangered frog species from southwestern Australia. Australian Journal of Ecology 22: 185-195.
Driscoll DA (1998a) Genetic structure of the frogs Geocrinia lutea and Geocrinia rosea
reflects extreme population divergence and range changes, not dispersal barriers. Evolution 52 (4): 1147-1157.
Driscoll DA (1998b) Genetic structure, metapopulation processes and evolution
influence the conservation strategies for two endangered frog species. Biological Conservation 83 (1): 43-54.
Driscoll DA (1999) Genetic neighbourhood and effective population size for two
endangered frogs. Biological Conservation 88: 221-229. Driscoll DA, Wardell-Johnson G, Roberts JD (1994) Genetic structuring and distribution
patterns in rare southwestern Australian frogs: Implications for translocation programmes. In: Reintroduction biology of Australian and New Zealand fauna (ed. Serena M). Surrey Beatty and Sons, Chipping Norton, NSW.
Duellman WE, Trueb L (1986) The biology of amphibians. Johns Hopkins University
Press, Baltimore, Maryland. Easteal S (1988) Range expansion and its genetic consequences in populations of the
giant toad, Bufo marinus. Evolutionary Biology 23: 49-84. Edenham P (1996) Spatial dynamics of the European tree frog (Hyla arborea l.) in a
heterogeneous landscape. Unpublished PhD Thesis, Uppsala University. Estoup A, Wilson IJ, Sullivan C, Cornuet J-M, Moritz C (2001) Inferring population
history from microsatellite and enzyme data in serially introduced cane toads, Bufo marinus. Genetics 159: 1671-1687.
Excoffier L, Smouse PE, Quattro JM (1992) Analysis of molecular variance inferred
from metric distance among DNA haplotypes: Application to human mitochondrial DNA restriction data. Genetics 131: 479-491.
Ferner JW (1979) A review of marking techniques for amphibians and reptiles. Herp.
Circ. 9: 3-7. Fixman M, Friere JJ (1977) Theory of DNA melting curves. Biopolymers 16: 2693-
2704.
References
119
Formas JR (1993) Allozymic and morphological differentiation between two South American frogs, genus Eupsophus (E. vertebralis and E. emiliopugini). Comparative Biochemical Physiology 106B: 77-81.
Fu Y-X, Li W-H (1993) Statistical tests of neutrality of mutations. Genetics 133: 693-
709. Funk WC, Blouin MS, Corn PS, Maxell BA, Pilliod DS, Amish S, Allendorf FW (2005)
Population structure of Columbia spotted frogs (Rana luteiventris) is strongly affected by the landscape. Molecular Ecology 14: 483-496.
Galloway RM, Kemp EM (1981) Late Cainozoic environments in Australia. In:
Ecological biogeography of Australia (ed. Keast A), pp. 53-80. Junk, The Hague.
Garcia-Paris M, Good DA, Parra-Olea G, Wake DB (2000) Biodiversity of Costa Rican
salamanders: Implications of high levels of genetic differentiation and phylogeographic structure for species formation. Proceedings of the National Academy of Science USA 97 (4): 1640-1647.
Gill DE (1978) The metapopulation ecology of the red-spotted newt, Notophthalmus
viridescens (Rafinesque). Ecological Monographs 48: 145-166. Gill DE (1979) Density dependence and homing behaviour in adult red-spotted newts
Notophthalmus viridescens (Rafinesque). Ecology 60: 800-813. Gittins SP, Parker AG, Slater FM (1980) Population characteristics of the common toad
(Bufo bufo) visiting a breeding site in mid Wales. Journal of Animal Ecology 49: 161-173.
Goldingay RL, Newell D, Graham M (1999) The status of rainforest stream frogs in
north-eastern New South Wales; decline or recovery? In: Declines and disappearances of Australian frogs (ed. Campbell A), pp. 64-71. Environment Australia, Canberra.
Graybeal A (1994) Evaluating the phylogenetic utility of genes: A search for genes
informative about deep divergences among vertebrates. Systematic Biology 43 (2): 174-193.
Greenwood PJ (1980) Mating systems, philopatry and dispersal in birds and mammals.
Animal Behaviour 28: 1140-1162. Gubitz T, Thorpe RS, Malhorta A (2000) Phylogeography and natural selection in the
Tenerife gecko Tarentola delalandii: Testing historical and adaptive hypotheses. Molecular Ecology 9: 1213-1221.
Hanski IA (1998) Metapopulation dynamics. Nature 396 (5): 41-49. Hanski IA (1999) Metapopulation ecology. Oxford University Press, Oxford. Hanski IA, Pakkala T, Kuussaari M, Lei G (1995a) Metapopulation persistence of an
endangered butterfly in a fragmented landscape. Oikos 72: 21-28.

References
120
Hanski IA, Pöyry J, Kuussaari M, Pakkala T (1995b) Multiple equilibria in metapopulation dynamics. Nature 377: 618-621.
Harris RT (1975) Seasonal activity and microhabitat utilization in Hyla cadaverina
(Anura: Hylidae). Herpetologica 31 (2): 236-239. Harrison S, Murphy DD, Ehrlich PR (1988) Distribution of the bay checkerspot butterfly,
Euphydryas editha bayensis: Evidence for a metapopulation model. American Naturalist 132: 360-382.
Hasegawa M, Kishino H, Yano TA (1985) Human origins and analysis of mitochondrial
DNA sequences. Journal of Molecular Evolution 22: 160-174. Hero J-M, Hines HB, Meyer E, Morrison C, Streatfield C (2002) New records of
"declining" frogs in Queensland, Australia. In: Frogs in the community, proceedings of the Brisbane symposium, February 1999, Brisbane (ed. Nattrass AEO), pp. 49-52. Queensland Frog Society, Brisbane.
Hestbeck JB, Nichols JD, Malecki RA (1991) Estimates of movement and site fidelity
using mark-resight data of wintering Canada geese. Ecology 72: 523-533. Hewitt G (2000) The genetic legacy of the quaternary ice ages. Nature 405: 907-913. Hewitt G (2001) Speciation, hybrid zones and phylogeography - or seeing genes in
space and time. Molecular Ecology 10: 537-549. Hey J, Machado CA (2003) The study of structured populations - new hope for a
difficult and divided science. Nature Reviews Genetics 4: 535-543. Hines HB (2002) Additional specimens of Fleay's barred frog Mixophyes fleayi. In:
Frogs in the community, proceedings of the Brisbane symposium, February 1999, Brisbane (ed. Nattrass AEO), pp. 49-52. Queensland Frog Society, Brisbane.
Hines HB, Mahony M, McDonald KR (1999) An assessment of frog declines in wet
subtropical Australia. In: Declines and disappearances of Australian frogs (ed. Campbell A), pp. 44-64. Environment Australia, Canberra, ACT.
Hitchings SP, Beebee TJC (1997) Genetic substructuring as a result of barriers to gene
flow in urban Rana temporaria (common frog) populations: Implications for biodiversity conservation. Heredity 79: 117-127.
Hitchings SP, Beebee TJC (1998) Loss of genetic diversity and fitness in common toad
(Bufo bufo) populations isolated by inimical habitat. Journal of Evolutionary Biology 11: 269-283.
Hodgkison SC (1998) Behavioural and feeding ecology of the declining amphibians:
Litoria nannotis, L. rheocola, and Nyctimystes dayi. Unpublished M.Sc. Thesis, James Cook University.
Hodgkison SC, Hero J-M (2000) Daily behaviour and microhabitat use of the waterfall
frog, Litoria nannotis in Tully gorge, eastern Australia. Journal of Herpetology 35 (1): 116 - 120.

References
121
Hodgkison SC, Hero J-M (2002) Seasonal behaviour of Litoria nannotis, Litoria rheocola and Nyctimystes dayi in Tully gorge, north Queensland, Australia. In: Frogs in the community, proceedings of the Brisbane symposium, February 1999, Brisbane (ed. Nattrass AEO). Queensland Frog Society, Brisbane.
Hokit DG, Blaustein AR (1997) Effects of kinship on interactions between tadpoles of
Rana cascadae. Ecology 78: 1722-1735. Holomuzki JR (1982) Homing behaviour of Desognathus ochrophaeus along a stream.
Journal of Herpetology 16 (3): 307-309. Hope GS (1994) Quaternary vegetation. In: History of the Australian vegetation:
Cretaceous to recent (ed. Hill RS), pp. 368-389. Cambridge University Press, Cambridge.
Hopkins MS, Ash J, Graham AW, Head J, Hewett RK (1993) Charcoal evidence of the
spatial extent of the Eucalyptus woodland expansions and rainforest contractions in north Queensland during the late Pleistocene. Journal of Biogeography 20: 59-74.
Hranitz JM, Diehl WJ (2000) Allozyme variation and population genetic structure during
the life history of Bufo woodhousii fowleri (Amphibia: Anura). Biochemical Systematics and Ecology 28: 15-27.
Huelsenbeck JP, Crandall KA (1997) Phylogeny estimation and hypothesis testing
using maximum likelihood. Annual Review of Ecological Systems 28: 437-466. Huelsenbeck JP, Hillis DM (1993) Success of phylogenetic methods in the four-taxon
case. Systematic Biology 42: 247-264. Hughes JM, Ponniah M, Hurwood DA, Chenoweth SF, Arthington A (1999) Strong
genetic structuring in a habitat specialist, the oxleyan pygmy perch Nannoperca oxleyana. Heredity 83: 5-14.
Hurwood DA, Hughes JM, Bunn SE, Cleary C (2003) Population structure in the
freshwater shrimp (Paratya austaliensis) inferred from allozymes and mitochondrial DNA. Heredity 90: 64-70.
Ims RA, Yoccos NG (1997) Studying transfer processes in metapopulations:
Emigration, migration and colonization. In: Metapopulation biology (eds. Hanski IA, Gilpin ME), pp. 247-266. Academic Press, San Diego.
Ingram GJ, McDonald KR (1993) An update on the decline of Queensland's frogs. In:
Herpetology in Australia: A diverse discipline (eds. Lunney D, Ayers D). Transactions of the Royal Zoology Society of New South Wales, Mosman.
James CH (1998) Molecular systematics and phylogeography of the Litoria bicolor
species group (Anura: Hylidae) from eastern Australia. Unpublished PhD Thesis, The University of Queensland.
James CH, Moritz C (2000) Intraspecific phylogeography in the sedge frog Litoria fallax
(Hylidae) indicates pre-Pleistocene vicariance of an open forest species from eastern Australia. Molecular Ecology 9: 349-358.

References
122
Jameson DL (1956) Growth, dispersal and survival of the Pacific tree frog. Copeia 1956: 25-29.
Johns GC, Avise JC (1998) A comparative summary of genetic distances in the
vertebrates from the mitochondrial cytochrome b gene. Molecular Biology and Evolution 15 (11): 1481-1490.
Joly P, Grolet O (1996) Colonization dynamics of newly-created ponds in the alpine
newt, Triturus alpestris: Influence of landscape configuration and age structure of the colonizers. Acta Oecologia 17: 599-608.
Joseph L, Moritz C, Hugall A (1995) Molecular support for vicariance as a source of
diversity in rainforest. Proceedings of the Royal Society of London Series B 260: 177-182.
Jukes TH, Cantor CR (1969) Evolution of protein molecules. In: Mammalian protein
metabolism (ed. Munro HN), pp. 21-132. Academic Press, New York. Kaplan HM (1959) Electric tattooing for permanent identification of frogs. Herpetologica
15: 126. Kershaw AP (1981) Quaternary vegetation and environments. In: Ecological
biogeography of Australia (ed. Keast A), pp. 81-101. Junk, The Hague. Kershaw AP (1988) Late tertiary and Pleistocene vegetation history - 20 my to 20 ky -
Australia. In: Vegetation history (eds. Huntley B, Webb TI), pp. 237-306. Academic Publishing, Boston.
Kershaw AP (1994) Pleistocene vegetation of the humid tropics of north-eastern
Queensland, Australia. Palaeogeography, Palaeoclimatology, Palaeoecology 109: 399-412.
Kershaw AP, Martin HA, McEwen Mason JRC (1994) The Neogene: A period of
transition. In: History of Australian vegetation: Cretaceous to recent (ed. Hill RS), pp. 299-327. Cambridge University Press, Cambridge.
Kershaw AP, Moss P, Van Der Kaars S (2003) Causes and consequences of long-term
climatic variability on the Australian continent. Freshwater Biology 48: 1274-1283.
Kershaw AP, Nix HA (1988) Quantitative paleoclimatic estimates from pollen data
using bioclimatic profiles of extant taxa. Journal of Biogeography 7: 589-602. Kimberling DN, Ferreira AR, Shuster SM, Kiem P (1996) Rapid marker estimation of
genetic structure among isolated northern leopard frog populations in the south-western USA. Molecular Ecology 5: 521-529.
Kindvall O, Ahlén I (1992) Geometrical factors and metapopulation dynamics of the
bush cricket, Metrioptera bicolor philippi (Orthoptera: Tettigoniidae). Conservation Biology 6: 520-529.
Kleeberger SR, Werner JK (1982) Home range and homing behaviour of Plethodon
cinereus in northern Michigan. Copeia 1982: 409-415.

References
123
Knowles R, Mahony M, Armstrong J, Donnellan S (2004) Systematics of sphagnum frogs of the genus Philoria (Anura: Myobatrachidae) in eastern Australia with the description of two new species. Records of the Australian Museum 56: 57-74.
Knowlton N, Weight LA, Solorzano LA, Mills DK, Bermingham E (1993) Divergence in
proteins, mitochondrial DNA, and reproductive compatability across the Isthmus of Panama. Science 260: 1629-1632.
Koenig WD, Van Vuren D, Hooge PN (1996) Detectability, philopatry, and the
distribution of dispersal distances in vertebrates. Trends in Ecology and Evolution 11 (12): 514-517.
Kosuch J, Vences M, Dubois A, Ohler A, Bohme W (2001) Out of Asia: Mitochondrial
DNA evidence for an oriental origin of tiger frogs, genus Hoplobatrachus. Molecular Phylogenetics and Evolution 21: 398-407.
Kramer DC (1973) Movements of western chorus frogs Pseudacris triseriata tagged
with Co60. Journal of Herpetology 7 (3): 231-235. Kumar S, Tamura K, Jakobsen IBM, Nei M (2001) MEGA2: Molecular evolutionary
genetics analysis software. Bioinformatics 17: 1244-1245. Kusano T, Maruyama K, Kanenko S (1999) Breeding site fidelity in the Japanese toad,
Bufo japonicus formosus. Herpetological Journal 9: 9-13. Laan R, Verboom B (1990) Effects of pool size and isolation of amphibian
communities. Biological Conservation 54: 251-262. Lamoureux VS, Madison DM (1999) Overwintering habitats of radio-implanted green
frogs, Rana clamitans. Journal of Herpetology 33 (3): 430-435. Lampert KP, Rand AS, Mueller UG, Ryan MJ (2003) Fine-scale genetic pattern and
evidence for sex-biased dispersal in the túngara frog, Physalaemus pustulosus. Molecular Ecology 12: 3325-3334.
Laurance WF (1996) Catastrophic declines of Australian rainforest frogs: Is unusual
weather responsible? Biological Conservation 77: 203-212. Laurance WF, McDonald KR, Speare R (1996) Epidemic disease and the catastrophic
decline of Australian rain forest frogs. Conservation Biology 10: 406-413. Lemckert FL, Brassil T (2000) Movements and habitat use of the endangered giant
barred river frog (Mixophyes iteratus) and the implications for its conservation in timber production forests. Biological Conservation 96: 177-184.
Lemckert FL (2004) Variations in anuran movements and habitat use: Implications for
conservation. Applied Herpetology 1: 165-181. Lessa EP, Applebaum G (1993) Screening techniques for detecting allelic variation in
DNA sequences. Molecular Ecology 2: 119-129. Leung LK-P (1999) Ecology of Australian tropical rainforest mammals II. The Cape
York melomys, Melomys capensis (Muridae: Rodentia). Wildlife Research 26: 307-316.

References
124
Lindenmayer DB, Possingham HP (1995) Modelling the viability of metapopulations of the endangered Leadbeater's possum in southeastern Australia. Biodiversity and Conservation. 4: 984-1018.
Longmore ME, Heijnis H (1999) Aridity in Australia: Pleistocene records of
palaeohydrological and palaeoecological change from perched lake sediments of Fraser Island, Queensland, Australia. Quaternary International 57: 35-47.
Lougheed SC, Gascon C, Jones DA, Bogart JP, Boag PT (1999) Ridges and rivers: A
test of competing hypotheses of Amazonian diversification using a dart-poison frog (Epipedobates femoralis). Proceedings of the Royal Society of London Series B 266: 1829-1835.
Macey JR, Schulte II JA, Ananjeva NB, Larson A, Rastegar-Pouyani N, Shammakov
SM, Papenfuss TJ (1998a) Phylogenetic relationships among agamid lizards of the Laudakia caucasia species group: Testing hypotheses of biogeographic fragmentation and an area cladogram for the Iranian plateau. Molecular Phylogenetics and Evolution 10: 118-131.
Macey JR, Schulte II JA, Larson A, Fang Z, Wang Y, Tuniyev BS, Papenfuss TJ
(1998b) Phylogenetic relationships of toads in the Bufo bufo species group from the eastern escarpment of the Tibetan plateau: A case of vicariance and dispersal. Molecular Phylogenetics and Evolution 9 (1): 80-87.
Maddison DR, Maddison WP (2000) MACLADE 4: Analysis of phylogeny and character
evolution, version 4.0. Sinauer Associates, Sunderland, MA. Mahony M (1996) Survey of the distribution and abundance of declining frog species in
northern New South Wales. Australian Nature Conservation Agency, unpublished report.
Mahony M, Knowles R, Pattinson L (1997) Silverblue-eyed barred frog, Mixophyes
fleayi. In: Threatened frogs of New South Wales: Habitats, status and conservation (ed. Ehmann H). Frog and Tadpole Study Group of NSW Inc., Sydney South, Australia.
Mantel N (1967) The detection of disease clustering and a general regression
approach. Cancer Research 27: 209-220. Marsh DM, Fegraus EH, Harrison S (1999) Effects of breeding pond isolation on the
spatial and temporal dynamics of pond use by the túngara frog, Physalaemus pustulosus. Journal of Animal Ecology 68: 804-814.
Marsh DM, Rand AS, Ryan MJ (2000) Effects of inter-pond distance on the breeding
ecology of túngara frogs. Oecologia 122: 501-513. Marsh DM, Trenham PC (2001) Metapopulation dynamics and amphibian
conservation. Conservation Biology 15 (1): 40-49. Martof B (1953) Home range and movements of the green frog, Rana clamitans.
Ecology 34 (3): 529-543. Masta SE, Laurent NM, Routman EJ (2003) Population genetic structure of the toad
Bufo woodhousii: An empirical assessment of the effects of haplotype extinction on nested clade analysis. Molecular Ecology 12: 1541-1554.

References
125
Matthews KR, Pope KL (1999) A telemetric study of the movement patterns and habitat
use of Rana muscosa, the mountain yellow-legged frog, in a high-elevation basin in Kings Canyon National Park, California. Journal of Herpetology 33 (4): 615-624.
McCauley DE (1993) Evolution in metapopulations with frequent local extinction and
recolonization. Oxford Surveys in Evolutionary Biology 10: 109-134. McDonald KR (1991) Report of a workshop on declining frog populations in
Queensland. Queensland National Parks and Wildlife Service, unpublished report.
McGuigan K, McDonald KR, Parris K, Moritz C (1998) Mitochondrial DNA diversity and
historical biogeography of a wet forest-restricted frog (Litoria pearsoniana) from mid-east Australia. Molecular Ecology 7: 175-186.
Meyer E, Hines HB, Hero J-M (2001) Wet forest frogs of south-east Queensland.
Griffith University, Gold Coast. Meyer EA, Hines HB (2005) Observations of barred frog (Mixophyes spp.) tadpoles
feeding on carrion in the wild. Herpetofauna 34: 90-91. Miaud C, Sanuy D, Avrillier J-N (2000) Terrestrial movements of the natterjack toad
Bufo calamita (Amphibia, Anura) in a semi-arid, agricultural landscape. Amphibia-Reptilia 21: 357-369.
Monsen KJ, Blouin MS (2003) Genetic structure in a montane ranid frog: Restricted
gene flow and nuclear-mitochondrial discordance. Molecular Ecology 12: 3275-3286.
Monsen KJ, Blouin MS (2004) Extreme isolation by distance in a montane frog Rana
cascadae. Conservation Genetics 5: 827-835. Monteith GB (1996a) Interim report: Distribution, altitudinal zonation and conservation
criteria for low vagility and southern relict insects of the Queensland Wet Tropics, Part 1. Queensland Museum, Brisbane, Australia.
Monteith GB (1996b) Interim report: Distribution, altitudinal zonation and conservation
criteria for low vagility and southern relict insects of the Queensland Wet Tropics, Part 2. Queensland Museum, Brisbane, Australia.
Moritz C (1994a) Defining 'evolutionary significant units' for conservation. Trends in
Ecology and Evolution 9 (10): 373-375. Moritz C (1994b) Applications of mitochondrial DNA analysis for conservation: A critical
review. Molecular Ecology 3: 401-411. Moritz C (1995) Use of molecular phylogenies for conservation. Philosophical
Transactions of the Royal Society 349: 113-118.

References
126
Moritz C, Joseph L, Cunningham M, Schneider CJ (1997) Molecular perspectives on historical fragmentation of Australian tropical and subtropical rainforest: Implications for conservation. In: Tropical rainforest remnants: Ecology, management, and conservation of fragmented communities (eds. Laurance WF, Bierregaard RO), pp. 442-454. Chicago University Press, Chicago.
Moritz C, Playford J (1998) Genetic diversity and the design of a comprehensive,
adequate and representative reserve system for forests in south-east Queensland, Unpublished report to Queensland Department of Environment and Heritage.
Moritz C, Richardson KS, Ferrier S, Monteith GB, Stanisic J, Williams SE, Whiffin T (2001) Biogeographical concordance and efficiency of taxon indicators for establishing conservation priority in a tropical rainforest biota. Proceedings of the Royal Society of London Series B 268: 1875-1881.
Mulcahy DG, Mendelson III JR (2000) Phylogeography and speciation of the
morphologically variable, widespread species Bufo valliceps, based on molecular evidence from mtDNA. Molecular Phylogenetics and Evolution 17 (2): 173-189.
Murphy MJ (2002) Observations on the behaviour of the Australian land snail
Hedleyella falconeri (Grey, 1834) (Pulmonata: Caryodidae) using the spool-and-line tracking technique. Molluscan Research 22 (2): 149-164.
Muths E (2003) Home range and movements of boreal toads in undistrurbed habitat.
Copeia 2003: 160-165. Myers RM, Fischer N, Lerman LS, Maniatis T (1985a) Nearly all single base
substitutions in DNA fragments joined to a GC-clamp can be detected by denaturing gradient gel electrophoresis. Nucleic Acids Research 13: 3131-3145.
Myers RM, Lumelski N, Lerman LS, Maniatis T (1985b) Detection of single base
substitutions in total genomic DNA. Nature 313: 495-498. Myers RM, Maniatis T, Lerman LS (1987) Detection and localisation of single base
changes by denaturing gradient gel electrophoresis. Methods in Enzymology 155: 501-527.
Nace GW, Culley DD, Emmons MB, Gibbs EL, Hutchinson VH, McKinnel RG (1974)
Amphibians: Guidelines for the breeding, care and management of laboratory animals. Institute of Laboratory Animal Resources, National Research Council, Washington D.C.
Napolitano M, Descimon H (1994) Genetic structure of French populations of the
mountain butterfly Parnassius mnemosyne (Lepidoptera: Papilionidae). Biological Journal of the Linnean Society 7: 325-341.
Nathan R (2001) The challenges of studying dispersal. Trends in Ecology and
Evolution 16 (9): 481-483.

References
127
Nauwelaerts S, Coeck J, Aerts P (2000) Visible implant elastomers as a method for marking adult anurans. Herpetological Review 31 (3): 154-155.
Nei M (1987) Molecular evolutionary genetics. Columbia University Press, Washington. Newman RA, Squire T (2001) Microsatellite variation and fine-scale population
structure in the wood frog (Rana sylvatica). Molecular Ecology 10: 1087-1100. Nichols JD, Sauer JR, Pollock KH, Hestbeck JB (1992) Estimating transition
probabilities for stage-based population projection matrices using capture-recapture data. Ecology 73 (1): 306-312.
Nix HA (1991) Biogeography: Patterns and process. In: Rainforest animals. Atlas of
vertebrates endemic to Australia's Wet Tropics. (eds. Nix HA, Switzer M). Australian Nature Conservation Agency, Canberra.
Nix HA, Switzer M (1991) Rainforest animals. Atlas of vertebrates endemic to
Australia's Wet Tropics. Australian Nature Conservation Agency, Canberra. O'Reilly WK, Hines HB (2002) Temporal patterns of calling in Fleay's barred frog
Mixophyes fleayi at Cunningham's Gap, south-eastern Queensland. In: Frogs in the community, proceedings of the Brisbane symposium, February 1999, Brisbane (ed. Nattrass AEO), pp. 53-58. Queensland Frog Society, Brisbane.
Orita M, Iwahana H, Kanazawa H, Hayashi K, Sekiya T (1989) Detection of
polymorphisms of human DNA by gel electrophoresis as single-strand conformation polymorphisms. Proceedings of the National Academy of Sciences of the USA 86: 2766-2770.
Osborne WS (1989) Distribution, relative abundance and conservation status of
corroboree frogs, Pseudophryne corroboree Moore (Anura: Myobatrachidae). Australian Wildlife Research 16: 537-547.
Ott JA, Scott DE (1999) Effects of toe-clipping and pit-tagging on growth and survival in
metamorphic Ambystoma opacum. Journal of Herpetology 33 (2): 344-348. Ovaska K (1992) Short- and long- term movements of the frog Eleutherodactylus
johnstonei in Barbados, West Indies. Copeia 1992: 569-573. Palo JU, O'Hara RB, Laugen AT, Laurila A, Primmer CR, Merila J (2003) Latitudinal
divergence of common frog (Rana temporaria) life history traits by natural selection: Evidence from a comparison of molecular and quantitative genetic data. Molecular Ecology 12: 1963-1978.
Palo JU, Schmeller DS, Laurila A, Primmer CR, Kuzmin SL, Merilä J (2004) High
degree of population subdivision in a widespread amphibian. Molecular Ecology 13: 2631-2644.
Palo JU, Lesbarrères D, Schmeller DS, Primmer CR, Merilä J (2004) Microsatellite
marker data suggest sex-biased dispersal in the common frog Rana temporaria. Molecular Ecology 13: 2865-2869.
Parker PG, Snow AA, Schug MD, Bootoon GC, Fuerst PA (1998) What molecules can
tell us about populations: Choosing and using a molecular marker. Ecology 79: 361-382.

References
128
Pearson PG (1955) Population ecology of the spadefoot toad, Scaphiopus h. holbrooki
(Harlan). Ecological Monographs 25 (233-267). Pechmann JHK, Wake DB (1997) Declines and disapperances of amphibian
populations. In: Principles of conservation biology (eds. Meffe GK, Carroll CR). Sinauer, Sunderland, MA.
Perrin N, Mazalov V (2000) Local competition, inbreeding, and the evolution of sex-
biased dispersal. American Naturalist 155(1): 116-127. Pesole G, Gissi C, De Chirico A, Saccone C (1999) Nucleotide substitution rate of
mammalian mitochondrial genomes. Journal of Molecular Evolution 48: 427-434.
Peter AKH (2001) Dispersal rates and distances in adult water frogs, Rana lessonae,
R. ridibunda, and their hybridogenetic associate R. esculenta. Herpetologica 57: 449-460.
Petit RJ, Grivet D (2002) Optimal randomization strategies when testing the existence
of phylogeographic structure. Genetics 161: 469-471. Pilliod DS, Peterson CR, Ritson PI (2002) Seasonal migration of Columbia spotted
frogs (Rana luteiventris) among complementary resources in a high mountain basin. Canadian Journal of Zoology 80 (11): 1849-1862.
Poland D (1974) Recursion relation generation of probability profiles for specific-
sequence macromolecules with long range correlations. Biopolymers 13: 1859-1871.
Ponniah M (2002) A genetic investigation into the evolution of Queensland spiny
mountain crayfish of the genus Euastacus (Decapoda: Parastacidae) Unpublished PhD Thesis, Griffith University.
Ponniah M, Hughes JM (in review) The evolution of Queesland spiny mountain crayfish
of the genus Euastacus. II. Testing simultaneous vicariance with intraspecific genetic data.
Pope KL, Matthews KR (2001) Movement ecology and seasonal distribution of
mountain yellow-legged frogs, Rana muscosa, in a high-elevation Sieraa Nevada basin. Copeia 2001: 787-793.
Pope S, Fahrig L, Merriam HG (2000) Landscape complementation and
metapopulation effects on leopard frog populations. Ecology 81 (9): 2498-2508. Porter JH, Dooley JLJ (1993) Animal dispersal patterns: A reassessment of simple
mathematical models. Ecology 74: 2436-2443. Posada D, Crandall KA (1998) Modeltest: Testing the model of DNA substitution.
Bioinformatics 14: 817-818. Posada D, Crandall KA, Templeton AR (2000) GEODIS: A program for the cladistic
nested analysis of the geographical distribution of genetic haplotypes. Molecular Ecology 9: 487-488.

References
129
Pounds JA, Fogden MPL, Savage JM, Gorman GC (1997) Tests of null models for amphibian declines on a tropical mountain. Conservation Biology 11: 1307-1322.
Prugnolle F, de Meeûs T (2002) Inferring sex-biased dispersal from population genetic
tools: A review. Heredity 88: 161-165. Quinn GP, Keough MJ (2002) Experimental Design and data Analysis for Biologists.
University Press, Cambridge, U.K. Rautio SA, Bura EA, Berven KA, Gamboa GJ (1991) Kin recognition in wood frog
tadpoles (Rana sylvatica) - factors affecting spatial proximity to siblings. Canadian Journal of Zoology 69: 2569-2571.
Read K, Keogh JS, Scott IAW, Roberts JD, Doughty P (2001) Molecular phylogeny of
the Australian frog genera Crinia, Geocrinia and allied taxa (Anura:Myobatrachidae). Molecular Phylogenetics and Evolution 21 (2): 294-308.
Reading CJ, Loman J, Madsen T (1991) Breeding pond fidelity in the common toad,
Bufo bufo. Journal of Zoology, London 225: 201-211. Reaser JK (1996) The elucidation of amphibian declines: Are amphibian populations
disappearing? Amphibian and Reptile Conservation 1: 4-9. Reh W, Seitz A (1990) The influence of land use on the genetic structure of populations
of the common frog Rana temporaria. Biological Conservation 54: 239-249. Resetarits WJJ (1986) Ecology of cave use by the frog, Rana palustris. American
Midland Naturalist 116 (2): 256-266. Richards CM, Moore WS (1996) A phylogeny for the African treefrog family
Hyperoliidae based on mitochondrial rDNA. Molecular Phylogenetics and Evolution 5 (3): 522-532.
Richards SJ, McDonald KR, Alford RA (1993) Declines in populations of Australia's
endemic tropical rainforest frogs. Pacific Conservation Biology 1: 66-77. Richards SJ, Sinsch U, Alford RA (1994) Radio-tracking. In: Measuring and monitoring
biological diversity: Standard methods for amphibians (eds. Heyer WR, Donnelly MA, McDiarmid RW, Hayek L-AC, Foster MS), pp. 155-158. Smithsonian Institution Press, Washington, D.C.
Rousset F (1997) Genetic differentiation and estimation of gene flow from f-statistics
under isolation by distance. Genetics 145: 1219-1228. Rowe G, Beebee TJC, Burke T (1998) Phylogeography of the natterjack toad Bufo
calamita in britain: Genetic differentiation of native and translocated populations. Molecular Ecology 7: 751-760.
Rowe G, Beebee TJC, Burke T (2000) A microsatellite analysis of natterjack toad, Bufo
calamita, metapopulations. Oikos 88: 641-651. Rozas J, Rozas R (1999) DnaSP, version 3. An integrated program for molecular
population genetics and molecular evolution analysis. Bioinformatics 25: 267-273.

References
130
Rubenstein DR, Hobson KA (2004) From birds to butterflies: Animal movement patterns and stable isotopes. Trends in Ecology and Evolution 19 (5): 256 - 263.
Ryder OA (1986) Species conservation and systematics: The dilemma of subspecies.
Trends in Ecology and Evolution 1: 9-10. Saidapur SK, Girish S (2000) The ontogeny of kin recognition in tadpoles of the toad
Bufo melanostictus (Anura; Bufonidae). Journal of Biosciences 25: 267-273. Saidapur SK, Girish S (2001) Growth and metamorphosis of Bufo melanostictus
tadpoles: Effects of kinship and density. Journal of Herpetology 35 (2): 249-254. Schäuble CS, Moritz C (2001) Comparative phylogeography of two open forest frogs
from eastern Australia. Biological Journal of the Linnean Society 74: 157-170. Schlaepfer MA (1998) Use of a fluorescent marking technique on small terrestrial
anurans. Herpetological Review 29 (1): 25-26. Schneider CJ, Cunningham M, Moritz C (1998) Comparative phylogeography and the
history of endemic vertebrates in the Wet Tropics rainforest of Australia. Molecular Ecology 7: 487-498.
Schneider CJ, Moritz C (1999) Rainforest refugia and evolution in Australia's Wet
Tropics. Proceedings of the Royal Society of London Series B 266: 191-196. Schneider SD, Roessli D, Excoffier L (2000) ARLEQUIN, version 2.0: A software for
population genetic data analysis. Genetics and Biometry Laboratory, Geneva, Switzerland.
Schwarzkopf L, Alford RA (1996) Desiccation and shelter-size in a tropical amphibian:
Comparing toads with physical models. Functional Ecology 10: 193-200. Scribner KT, Arntzen JW, Burke T (1994) Comparative analysis of intra- and
interpopulation genetic diversity in Bufo bufo, using allozyme, single-locus microsatellite, minisatellite, and multilocus minisatellite data. Molecular Biology and Evolution 11 (5): 737-748.
Seburn CNL, Seburn DC, Paszkowski CA (1997) Northern leopard frog (Rana pipiens)
dispersal in relation to habitat. In: Amphibians in decline: Canadian studies of a global problem (ed. Green DM). Herpetological Conservation, Vol 1.
Semlitsch RD (1981) Terrestrial activity and summer home range of the mole
salamander (Ambystoma talpoideum). Canadian Journal of Zoology 59: 315-322.
Semlitsch RD (2002) Critical elements for biologically based recovery plans of aquatic-
breeding amphibians. Conservation Biology 16 (3): 619-629. Semlitsch RD, Bodie JR (1998) Are small, isolated wetlands expendable?
Conservation Biology 12: 1129-1133. Seppä P, Laurila A (1999) Genetic structure of island populations of the anurans Rana
temporaria and Bufo bufo. Heredity 82: 309-317.

References
131
Sgariglia EA, Burns KJ (2003) Phylogeography of the California thrasher (Toxostoma redivivum) based on nested-clade analysis of mitochondrial DNA variation. The Auk 120 (2): 346-361.
Shaffer HB, Fellers GM, Magee A, Voss SR (2000) The genetics of amphibian
declines: Population substructure and molecular differentiation in the Yosemite toad, Bufo canorus (Anura, Bufonidae) based on single strand conformation polymorphism analysis (SSCP) and mitochondrial DNA sequence data. Molecular Ecology 9: 245-257.
Sheffield VC, Cox DR, Lerman LS, Myers RM (1989) Attachment pf a 40-base pair G +
C rich sequence (GC clamp) to genomic DNA fragments by the polymerase chain reaction results in improved detection of single-base changes. Proceedings of the National Academy of Science USA 86: 232-236.
Sinsch U (1988a) Seasonal changes in the migratory behaviour of the toad Bufo bufo:
Direction and magnitude of movements. Oecologia 1988 (76): 390-398. Sinsch U (1988b) Temporal spacing of breeding activity in the natterjack toad, Bufo
calamita. Oecologia 1988 (76): 399-407. Sinsch U (1990) Migration and orientation in anuran amphibians. Ethology, Ecology
and Evolution 2: 65-79. Sinsch U (1991) Mini-review: The orientation behaviour of amphibians. Herpetological
Journal 1: 541-544. Sinsch U (1992a) Structure and dynamic of a natterjack toad metapopulation (Bufo
calamita). Oecologia 90: 489-499. Sinsch U (1992b) Amphibians. In: Animal homing (ed. Papi F), pp. 213-233. Chapman
and Hall, New York. Sinsch U (1997) Postmetamorphic dispersal and recruitment of first breeders in a Bufo
calamita metapopulation. Oecologia 112: 42-47. Sinsch U, Seidel D (1995) Dynamics of local and temporal breeding assemblages in a
Bufo calamita metapopulation. Australian Journal of Ecology 20: 351-361. Sjögren P (1991) Extinction and isolation gradients in metapopulations: The case of the
pool frog (Rana lessonae). Biological Journal of the Linnean Society 42: 135-147.
Sjögren-Gulve P (1998) Spatial movement patterns in frogs: Target-oriented dispersal
in the pool frog, Rana lessonae. Ecoscience 5: 31-38. Sjögren-Gulve P, Ray C (1996) Using logistic regression to model metapopulation
dynamics: Large-scale forestry extirpates the pool frog. In: Metapopulations and wildlife conservation (ed. McCullough DR), pp. 111-138. Island Press, Washington D.C.
Skelly DK, Werner EE, Cortwright SA (1999) Long-term distributional dynamics of a
Michigan amphibian assemblage. Ecology 80 (7): 2326-2337.

References
132
Slatkin M (1985) Gene flow in natural populations. Annual Review of Ecology and Systematics 16: 393-430.
Smith MA, Green DM (2004) Phylogeography of Bufo fowleri at its northern range limit.
Molecular Ecology 13: 3723-3733. Spieler M, Linsenmair KE (1997) Choice of optimal oviposition sites by Hoplobatrachus
occipitalis (Anura: Ranidae) in an unpredictable and patchy environment. Oecologia 1997 (109): 184-199.
Spieler M, Linsenmair KE (1998) Migration patterns and diurnal use of shelter in a
Ranid frog on a west African savannah: A telemetric study. Amphibia- Reptilia 19: 43-64.
Spolsky C, Phillips CA, Uzzell T (1992) Antiquity of clonal salamander lineages
revealed by mitochondrial DNA. Nature 356: 706-708. Squire T, Newman RA (2002) Fine-scale population structure in the wood frog (Rana
sylvatica) in a northern woodland. Herpetologica 58 (1): 119-130. Sterk EHM (1997) Determinants of female dispersal in Thomas Langurs. American
Journal of Primatology 42: 179-198. Stewart MM, Pough FH (1984) Population density of tropical forest frogs: Relation to
retreat sites. Science 221: 570-572. Streatfield C (1999) Spatial movements of Mixophyes iteratus and Mixophyes
fasciolatus in southeast Queensland Unpublished Honours Thesis, Griffith University.
Strijbosch H (1979) Habitat selection by amphibians during their terrestrial phase.
British Journal of Herpetology 6: 93-98. Stuart SN, Chanson JS, Cox NA, Young BE, Rodrigues ASL, Fischman DL, Waller RW
(2004) Status and trends of amphibian declines and extinctions worldwide. Science 306: 1783-1786.
Stuart-Fox DM, Schneider CJ, Moritz C, Couper PJ (2001) Comparative
phylogeography of three rainforest-restricted lizards from mid-east Queensland. Australian Journal of Zoology 49: 119-127.
Stumpel AHP, Hanekamp G (1986) Habitat and ecology of Hyla arborea in the
Netherlands. In: Studies in herpetology (ed. Rocek Z), pp. 409-411. Charles University, Prague.
Sumner J, Rousset F, Estoup A, Moritz C (2001) 'Neighbourhood' size, dispersal and
density estimates in the prickly forest skink (Gnypetoscincus queenslaniae) using individual genetic and demographic methods. Molecular Ecology 10: 1917-1927.
Swofford DL (1998) PAUP: Phylogeny analysis using parsimony, version 4. Sinauer
Associates, Massachusetts.

References
133
Szymura JM, Barton NH (1991) The genetic structure of the hybrid zone between the fire-bellied toads Bombina bombina and B. variegata: Comparisons between transects and between loci. Evolution 45: 237-261.
Tajima F (1989a) Statistical method for testing the neutral mutation hypothesis by DNA
polymophism. Genetics 123: 585-595. Tajima F (1989b) The effect of change in population size on DNA polymorphism.
Genetics 123: 597-601. Tallmon DA, Funk WC, Dunlap WW, Allendorf FW (2000) Genetic differentiation
among long-toed salamander (Ambystoma macrodactylum) populations. Copeia 2000: 27-35.
Taylor BL, Dizon AE (1999) First policy then science: Why a management unit based
solely on genetic criteria cannot work. Molecular Ecology 8: S11-S16. Templeton AR (1998) Nested clade analyses of phylogeographic data: Testing
hypotheses about gene flow and population history. Molecular Ecology 7 (4): 381-397.
Templeton AR (2002) Out of Africa again and again. Nature 416: 45-51. Templeton AR (2004) Statistical phylogeography: Methods of evaluating and
minimising inference errors. Molecular Ecology 13: 789 - 809. Templeton AR, Boerwinkle E, Sing CF (1987) A cladistic analysis of phenotypic
associations with haplotypes inferred from restriction endonuclease mapping. I. Basic theory and an analysis of alcohol dehydrogenase activity in Drosophila. Genetics 117: 343-351.
Templeton AR, Clark AG, Weiss KM, Nickerson DA, Boerwinkle E, Sing CF (2000)
Recombinational and mutational hotspots within the human lipoprotein lipase gene. The American Journal of Human Genetics 66: 69-83.
Templeton AR, Crandall KA, Sing CF (1992) A cladistic analysis of phenotypic
associations with haplotypes inferred from restriction endonuclease mapping and DNA sequence data. III. Cladogram estimation. Genetics 132: 619-633.
Templeton AR, Routman E, Phillips CA (1995) Separating population structure from
population history: A cladistic analysis of the geographical distribution of mitochondrial DNA haplotypes in the tiger salamander, Ambystoma tigrinum. Genetics 140: 767-782.
Templeton AR, Sing CF (1993) A cladistic analysis of phenotypic associations with
haplotypes inferred from restriction endonuclease mapping. IV. Nested analyses with cladogram uncertainty and recombination. Genetics 134: 659-669.
Tessier C, Slaven D, Green DM (1991) Population density and daily movement
patterns of Hochstetter's frogs, Leiopelma hochstetteri, in a New Zealand mountain stream. Journal of Herpetology 25 (2): 213-214.
Tilley SG (1980) Life histories and comparative demography of two salamander
populations. Copeia 1980: 806-821.

References
134
Tracy CR, Dole JW (1969) Evidence of celestial orientation by California toads (Bufo
boreas) during breeding migration. Bulletin of the South California Academy of Science 68 (1): 10-18.
Truswell E (1993) Vegetation changes in the Australian tertiary in response to climatic
and phytogeographic forcing factors. Australian Systematic Botany 7: 533-557. Tunner HG (1992) Locomotion behaviour in water frogs from Neusiedlersee. In:
Proceedings of the sixth ordinary general meeting of the Society for European Herpetologists, 1991 (eds. Korsós Z, Kiss I). Natural History Museum, Budapest.
Turner FB (1960) Population structure and dynamics of the western spotted frog, Rana
p. pretiosa Baird & Girard, in Yellowstone Park, Wyoming. Ecological Monographs 30 (3): 251-278.
Twidale CR (2000) Early Mesozoic (?Triassic) landscapes in Australia: Evidence,
argument, and implications. Journal of Geology 108 (5): 537. Twitty VC, Grant D, Anderson O (1964) Long distance homing in the newt Taricha
rivularis. Proceedings of the National Academy of Science USA 51: 51-58. Tyler MJ, Davies M (1985) The gastric brooding frog Rheobatrachus silus. In: Biology
of Australasian frogs and reptiles (eds. Grigg G, Shine R, Ehmann H), pp. 369-470. Royal Zoological Society of NSW and Surrey Beatty and Sons, Chipping Norton, NSW.
van Gelder JJ, Aarts HMJ, Staal HWM (1986) Routes and speed of migrating toads
(Bufo bufo l.): A telemetric study. Herpetological Journal 1: 111-114. Veevers JJ (1984) Phanerozoic earth history of Australia. Clarendon Press, Oxford. Veith M, Vences M, Vieites DR, Nieto-Roman S, Palanca A (2002) Genetic
differentiation and population structure within Spanish common frog (Rana temporaria complex, Ranidae, Amphibia). Folia Zoologica 51: 307-318.
Vernes K, Haydon DT (2001) Effect of fire on northern bettong (Bettongia tropica)
foraging behaviour. Animal Ecology 26: 649-659. Vogler AP, DeSalle R (1994) Diagnosing units for conservation management.
Conservation Biology 6: 170-178. Vos CC, Antonisse-De Jong AG, Goedhart PW, Smulders MJM (2001) Genetic
similarity as a measure for connectivity between fragmented populations of the moor frog (Rana arvalis). Heredity 86: 598-608.
Vos CC, Chardon JP (1998) Effects of habitat fragmentation and road density on the
distributional pattern of the moor frog Rana arvalis. Journal of Applied Ecology 35: 44-56.
Waldman B, Alder K (1979) Toad tadpoles associate preferentially with siblings. Nature
282: 611-613.

References
135
Waldman B, McKinnon J (1993) Inbreeding and outbreeding in fishes, amphibians, and reptiles. In: A natural history of inbreeding and outbreeding, theoretical and empirical perspectives (ed. Thornhill NW), pp. 250-282. University of Chicago Press, Chicago.
Waldman B, Tocher M (1998) Behavioural ecology, genetic diversity, and declining
amphibian populations. In: Behavioural ecology and conservation biology (ed. Caro T), pp. 394-443. Oxford University Press, New York.
Waples RS (1991) Pacific salmon, Oncorhynchus spp., and the definition of 'species'
under the endangered species act. Marine Fisheries Review 53: 11-12. Webb JA, Finlayson BL, Fabel D, Ellaway M (1991) The geomorphology of the Buchan
karst - implications for the landscape history of the southeastern highlands of Australia. In: The Cainozoic in Australia: A reappraisal of the evidence (eds. Williams MAJ, De Decker P, Kershaw A). Geological Society of Australia, Sydney, Australia.
Webster MS, Marra PP, Haig SM, Bensch S, Holmes RT (2002) Links between worlds :
Unravelling migratory connectivity. Trends in Ecology and Evolution 17 (2): 76 - 83.
Wells K, D. (1977) The social behaviour of anuran amphibians. Animal Behaviour 25:
666-693. Werle E, Schneider C, Renner M, Volker M, Fiehn W (1994) Convenient single-step,
one tube purification of PCR products for direct sequencing. Nucleic Acids Research 22: 4354-4355.
White ME (1994) After the greening. Kangaroo Press, Sydney, Australia. Whitlock MC (1992) Nonequilibrium population structure in forked fungus beetles:
Extinction, colonization, and genetic variation among populations. American Naturalist 139: 252-259.
Whitlock MC, McCauley DE (1999) Indirect measures of gene flow and migration: FST
does not equal 1/(4nm + 1). Heredity 82: 117-125. Wilbur HM (1984) Complex life cycles and community organization in amphibians. In: A
new ecology: Novel approaches to interactive systems (eds. Price PW, Slobodchikoff CN, Gaud WS), pp. 195-224. John Wiley.
Williams MAJ, Dunkerley DL, De Deckker P, Kershaw A, Chappell JA (1998)
Quaternary environments, 2nd edn. Edward Arnold, London. Williams SE, Pearson RG (1997) Historical rainforest contractions, localized extinctions
and patterns of vertebrate endemism in the rainforests of Australia's Wet Tropics. Proceedings of the Royal Society of London Series B. 264: 709-716.
Williams SE, Pearson RG, Walsh PJ (1996) Distributions and biodiversity of the
terrestrial vertebrates of Australia's Wet Tropics: A review of current knowledge. Pacific Conservation Biology 2 (4): 327-362.

References
136
Winter JW (1998) Ecological specialisation of mammals in Australian tropical and subtropical rainforest: Refugial or ecological determinism. Proceedings of the Ecological Society of Australia 15: 127-138.
Wolf JO (1993) What is the role of adults in mammalian juvenile dispersal? Oikos 68:
173-176. Wolf JO (1994) More on juvenile dispersal in mammals. Oikos 71: 349-352. Wong BBM, Keogh JS, McGlashan DJ (2004) Current and historical patterns of
drainage connectivity in eastern Australia inferred from population genetic structuring in a widespread freshwater fish Pseudomugil signifer (Pseudomugilidae). Molecular Ecology 13: 391-401.
Woolbright LL (1985) Patterns of nocturnal movement and calling by the tropical frog
Eleutherodactylus coqui. Herpetologica 41 (1): 1-9. Wright S (1943) Isolation by distance. Genetics 7: 114-138. Wright S (1978) Evolution and genetics of populations. Vol. IV. Variability within and
among populations. University of Chicago Press, Chicago. Zamudio KR, Greene HW (1997) Phylogeogrpahy of the bushmaster (Lachesis muta:
Viperidae): Implications for neotropical biogeography, systematics and conservation. Biological Journal of the Linnean Society 62: 421-442.
Zeisset I, Beebee TJC (2003) Population genetics of a successful invader: The marsh
frog Rana ridibunda in Britain. Molecular Ecology 12: 639-646. Zug GR (1993) Herpetology: An introductory biology of amphibians and reptiles.
Academic Press, San Diego.

137
Appendices

Appendix 1: List of haplotypes found across the distribution of M. fleayi and alignment of variable sites. Haplotypes are aligned against the most widespread, ancestral haplotype (H-1). Parsimony informative sites are highlighted. Position of base substitutions are included above each nucleotide, identical sites are blank. Sample sizes are shown in parentheses.
Nucleotide position
Haplotype 12 46 64 151 156 194 201 231 234 261 267 294 321 342 352 362 390 393 394 395 398 413 421 457 464 486 509 525 531 543 555 567 577 578 587 591 592
H-1 (38) A C C T T T T G A C C A C C T C G G G A T A A C T G C G A A A G T C C T C
H-2 (20) A A T
H-3 (10) C C A C A G G G A G A G G G A C T C T
H-4 (8) C
H-5 (7) T C G T
H-6 (4) T
H-7 (4) C
H-8 (4) A T
H-9 (3) A
H-10 (2) T
H-11 (2) A A
H-12 (2) C C A T C A G G G A G A G G G A C T C T
H-13 (2) C C C A C A G G G A G A G G G A C T C T
H-14 (2) C C A C A A G G G A G A G G G A C T C T
H-15 (2) C C A C C A G G G A G A G G G A C T C T
H-16 (2) C G
H-17 (2) C G
H-18 (2) C C
H-19 (1) G C
H-20 (1) C
H-21 (1) T
H-22 (1) C T A
H-23 (1)
H-24 (1) C C A T C A G G G A G A G G G A C T C T
H-25 (1) C T A T
H-26 (1) T T A A T
H-27 (1) A G

Appendices
139
Appendix 2: Tajima’s D and Fu and Li’s D- and F- test statistics calculated for each isolated forest fragment with populations pooled and also for each sampled population where possible. None of the values obtained were significant.
Forest Fragment Population N Tajima’s D Fu & Li’s D- Fu & Li’s F-
Conondales 19 - 1.15215 0.40275 - 0.03247
1 Nth Booloumba 10 -0.69098 -0.28020 -0.42293
2 East Kilcoy 9 -0.68914 -0.26418 -0.40584
McPherson 41 0.40312 0.72859 0.73392
3 Cainbable 8 0.48523 1.31251 1.23248
4 Morans Creek 5 1.12397 1.12397 1.15583
5 Stockyard 8 0.16843 0.12651 1.15583
6 Bundoomba 7 1.45904 1.29750 1.43788
7 Egg Rock 2 n/c n/c n/c
8 Pyramid 5 -1.12397 -1.12397 -1.15583
9 Coomera 4 0.17969 1.17969 0.17272
10 Nixons 2 n/c n/c n/c
Springbrook 12 -0.46837 0.10896 -0.04531
11 Natural Bridge 2 n/c n/c n/c
12 Tallebudgera 5 -0.07339 -0.07339 -0.07686
13 Currumbin 5 -1.12397 -1.12397 -1.15588
Main Range 41 -1.54576 -1.16204 -1.50819
14 Dalrymple 7 0.55902 0.95346 0.91788
15 Gap Creek 12 n/c n/c n/c
16 Condamine 5 -0.81650 -0.81650 -0.77152
17 Steamers 4 1.89306 1.89306 1.61138
18 Pinchgut 3 n/c n/c n/c
19 Blackfellows 3 n/c n/c n/c
20 Cryptocaria 7 0.05031 0.38925 0.33832
Tooloom 6 -0.93302 -0.95015 -0.96473
21 Yabbra 5 -0.81650 -0.81650 -0.77152
22 Little Haystack 1 n/c n/c n/c
Nightcap 4 -0.75445 -0.75445 -0.67466
23 Terania 4 -0.75445 -0.75445 -0.67466
Mt Barney 1 n/c n/c n/c
24 Cronan Creek 1 n/c n/c n/c
Appendix 3: Molecular evolution parametre values estimated by MODELTEST.
Parametre Estimate ti / tv 7.2628 Base frequencies A 0.2941 C 0.3174 T 0.2530 G 0.1356 Proportion invariable sites 0 Gamma shape parametre 0.0081 Model Selected HKY + G

Appendices
140
Appendix 4: ND2 mtDNA haplotype (Hd) and nucleotide diversity (π) for each population and for each forest fragment sampled across the distribution of M. fleayi. Sample size for each population is shown as well as the number of haplotypes found. n/c = not calculated.
Population N (haps) Hd πd Hd πd
1 Nth Booloumba 10 (3) 0.511 0.0009 Conondale Range
2 East Kilcoy 9 (5) 0.861 0.0019 0.713 0.00145
3 Cainbable 8 (3) 0.714 0.0028 McPherson Range
4 Morans 3 (3) 0.8 0.0045
5 Stockyard 8 (4) 0.821 0.0032
6 Bundoomba 7 (4) 0.810 0.0026
7 Egg Rock 2 (2) 1 0.0032
8 Pyramid 5 (3) 0.733 0.0030
9 Coomera 4 (3) 0.833 0.0054
10 Nixons 2 (1) 0 0
0.872
0.00387
11 Natural Bridge 2 (2) 1 0.0032 Springbrook Plateau
12 Tallebudgera 5 (3) 0.7 0.0061
13 Currumbin 5 (2) 0.4 0.0032
0.561
0.00427
14 Dalrymple 7 (2) 0.476 0.0008 Main Range
15 Gap Creek 12 (1) 0 0
16 Condamine 5 (2) 0.4 0.0007
17 Steamers 4 (2) 0.667 0.0021
18 Pinchgut 3 (2) 0.667 0.0021
19 Blackfellows 3 (2) 0.667 0.0021
20 Cryptocaria 7 (3) 0.667 0.0020
0.591
0.00159
21 Yabbra 5 (2) 0.4 0.006 Tooloom Range
22 Little Haystack 1 (1) n/c n/c
0.333
0.00054
23 Terania 4 (2) 0.5 0.0024 Nightcap Range
0.5
0.00242
24 Cronan Creek 1 (1) n/c n/c Mount Barney
n/c
n/c

Appendices
141
Appendix 5: Relationship of a) the number of haplotypes and b) haplotype diversity with sample size for each forest fragment. The relationship between sample size and number of haplotypes was not significant. The relationship between sample size and haplotype diversity was significant (p=0.011).
a)
b)
r2 = 0.834
r2 = 0.495

Appendix 6: List of haplotypes found across sites of M. fleayi and alignment of variable sites. Haplotypes are aligned against the most widespread, ancestral haplotype within each forest fragment (HC-1, HL-1, HM-1). Parsimony informative sites are highlighted. Position of base substitutions are included above each nucleotide, identical sites are left blank.
Haplotype
Base position
12 64 151 156 194 201 231 234 261 267 294 352 362 390 394 395 398 413 421 486 509 525 531 543 555 567 569 577 578 587 591 595 627
HC-1 A C C T T C A A C C C T C A G G T G G A G A G G G A T C C T C T C
HC-2 C
HC-3 T
HC-4 C
HC-5 A
HC-6 T
HL-1 A C T T T T G A C C A T C G G A T A A G C G A A A G T T C C T T A
HL-2 C
HL-3 T
HL-4 A T
HL-5 C C
HL-6 C
HL-7 T C G
HL-8 C G C
HL-9 C A
HL-10 T C
HL-11 C C C
HL-12 A A T
HL-13 A T C
HL-14 C A A
HL-15 C T
HM-1 A C T T T T G A C C A T C G G A T A A G C G A A A G T T C C T C A
HM-2 T
HM-3 T

Appendices
143
Appendix 7: Hypothesised haplotype networks for a) the Conondale Range, b) McPherson Range, and c) Main Range. Haplotypes (HC 1-6, HL1-15, HM1-3) are represented by large coloured circles, each colour signifying a different haplotype. Each connection between haplotypes is representative of a single base change. Each small black circle along a connection represents an unsampled, putative ancestral haplotype.
HM-1(pop 14,15n )20,40
HM-3(pop 14
n )5
HM-2(pop 14n )10
c)
HC-1(pop 1,2n )30,25
HC-2(pop 1,2
n )6,1
HC-3(pop 1,2
n )4,1
HC-5(pop 2n )3
HC-4(pop 2n 3)
HC-6(pop 2n )2
a)
HL-9(pop 3
n )5
HL-12(pop 5
n )1
HL-7(pop 4,5,6,8
n 1,1,2,2)
HL-14(pop 6
n )1
HL-6(pop 3,6n )8,3
HL-13(pop 6
n )1 HL-8(pop 3,4n )1,1
HL-5(pop 3,5,6n )13,8,4
HL-2(pop 3,6n )11,9
HL-10(pop 8
n )4
HL-1(pop 3,4,5,6n 2,1,10,2)
HL-3(pop 3,6,8n )1,16,18
HL-4(pop 3,5,6,8
n )9,8,5,1
HL-15(pop 6
n )1
HL-11(pop 5
n )2
b)

Appendices
144
Appendix 8: Details of survey dates and frequency at sites within the Green Mountains section of Lamington National Park, south-east Queensland. Location Season Month Number of
surveys Cainbable Creek 2000/2001 November 4 December 11 January 8 February 2 March 10 April 7 May 5 2001/2002 September 4 October 5 November 9 December 8 January 9 February 10 March 10 April 7 May 5 2002/2003 October 4 November 4 December 5 January 6 February 6 March 4 April 2 Bundoomba Creek and 2000/2001 4 Blue Pools Walking Track 2001/2002 7 2002/2003 5 2003/2004 5 Stockyard Creek 2000/2001 3 2001/2002 5 2002/2003 4 Morans Creek 2000/2001 3 2001/2002 2 2002/2003 2

Appendices
145
Appendix 9: Details of spooling and radio-tracking dates at Cainbable Creek and on the Lamington National Park Road. # indicates the female originally located and radio-tracked on the creek that was subsequently found on the road 214 days after loss of the transmitter signal. Method Season Gender (number) Date Duration (days) Spooling at creek 2000/2001 Female (3) March 1 Male (6) December 1 Male (4) January 1 Male (6) February 1 2001/2002 Female (2) November 1 Female (1) December 1 Male (3) December 1 Male (3) March 1 2002/2003 Female (2) December 1 Male (1) November 1 Male (2) December 1 Spooling at road 2002/2003 Female (9) December 1 Radio-tracking 2000/2001 Female 19/12/2000 25 at creek Female 5/3/2001 71 Female 16/3/2001 95 Male 19/12/2000 164 Male 18/12/2000 26 Male 6/3/2001 52 Male 5/3/2001 104 Male 5/3/2001 8 Male 20/3/2001 37 Male 20/3/2001 37 Male 20/3/2001 20 Male 27/3/2001 8 2001/2002 Female 20/11/2001 28 Female 28/11/2001 65 Female 6/12/2001 36 Female 6/12/2001 36 Female 6/12/2001 15 Female 23/1/2002 29 Female 23/1/2002 35 Female 31/1/2002 27 Female 20/3/2002 7 Female 27/3/2002 13 Female 20/3/2002 55 Female # 27/3/2002 45 Radio-tracking 2000/2001 Female 21/3/2001 35 at road 2001/2002 Female 27/3/2002 30 Female 27/3/2002 54 Female 27/3/2002 49
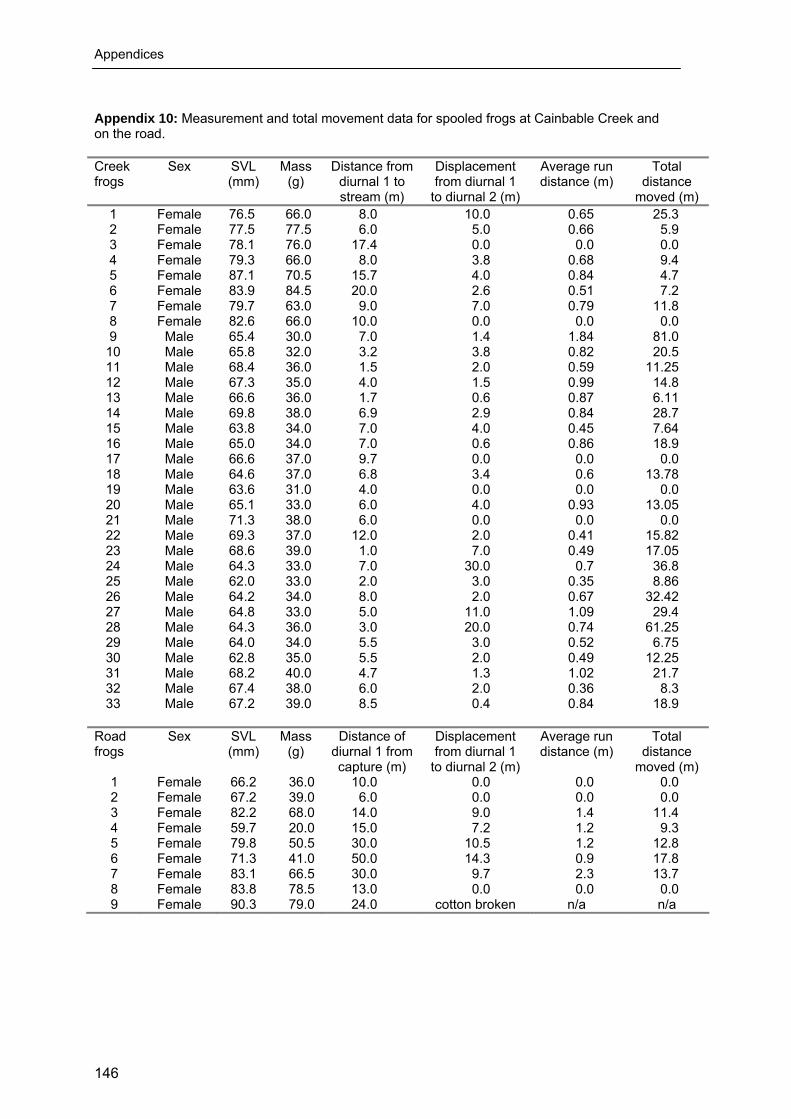
Appendices
146
Appendix 10: Measurement and total movement data for spooled frogs at Cainbable Creek and on the road. Creek frogs
Sex SVL (mm)
Mass (g)
Distance from diurnal 1 to stream (m)
Displacement from diurnal 1
to diurnal 2 (m)
Average run distance (m)
Total distance
moved (m) 1 Female 76.5 66.0 8.0 10.0 0.65 25.3 2 Female 77.5 77.5 6.0 5.0 0.66 5.9 3 Female 78.1 76.0 17.4 0.0 0.0 0.0 4 Female 79.3 66.0 8.0 3.8 0.68 9.4 5 Female 87.1 70.5 15.7 4.0 0.84 4.7 6 Female 83.9 84.5 20.0 2.6 0.51 7.2 7 Female 79.7 63.0 9.0 7.0 0.79 11.8 8 Female 82.6 66.0 10.0 0.0 0.0 0.0 9 Male 65.4 30.0 7.0 1.4 1.84 81.0
10 Male 65.8 32.0 3.2 3.8 0.82 20.5 11 Male 68.4 36.0 1.5 2.0 0.59 11.25 12 Male 67.3 35.0 4.0 1.5 0.99 14.8 13 Male 66.6 36.0 1.7 0.6 0.87 6.11 14 Male 69.8 38.0 6.9 2.9 0.84 28.7 15 Male 63.8 34.0 7.0 4.0 0.45 7.64 16 Male 65.0 34.0 7.0 0.6 0.86 18.9 17 Male 66.6 37.0 9.7 0.0 0.0 0.0 18 Male 64.6 37.0 6.8 3.4 0.6 13.78 19 Male 63.6 31.0 4.0 0.0 0.0 0.0 20 Male 65.1 33.0 6.0 4.0 0.93 13.05 21 Male 71.3 38.0 6.0 0.0 0.0 0.0 22 Male 69.3 37.0 12.0 2.0 0.41 15.82 23 Male 68.6 39.0 1.0 7.0 0.49 17.05 24 Male 64.3 33.0 7.0 30.0 0.7 36.8 25 Male 62.0 33.0 2.0 3.0 0.35 8.86 26 Male 64.2 34.0 8.0 2.0 0.67 32.42 27 Male 64.8 33.0 5.0 11.0 1.09 29.4 28 Male 64.3 36.0 3.0 20.0 0.74 61.25 29 Male 64.0 34.0 5.5 3.0 0.52 6.75 30 Male 62.8 35.0 5.5 2.0 0.49 12.25 31 Male 68.2 40.0 4.7 1.3 1.02 21.7 32 Male 67.4 38.0 6.0 2.0 0.36 8.3 33 Male 67.2 39.0 8.5 0.4 0.84 18.9
Road frogs
Sex SVL (mm)
Mass (g)
Distance of diurnal 1 from capture (m)
Displacement from diurnal 1
to diurnal 2 (m)
Average run distance (m)
Total distance
moved (m) 1 Female 66.2 36.0 10.0 0.0 0.0 0.0 2 Female 67.2 39.0 6.0 0.0 0.0 0.0 3 Female 82.2 68.0 14.0 9.0 1.4 11.4 4 Female 59.7 20.0 15.0 7.2 1.2 9.3 5 Female 79.8 50.5 30.0 10.5 1.2 12.8 6 Female 71.3 41.0 50.0 14.3 0.9 17.8 7 Female 83.1 66.5 30.0 9.7 2.3 13.7 8 Female 83.8 78.5 13.0 0.0 0.0 0.0 9 Female 90.3 79.0 24.0 cotton broken n/a n/a

Appendices
147
Appendix 11: Total movement distance and measurement data for all frogs monitored through radio-tracking including the four females found and radio-tracked on the Lamington National Park Road. # indicates the female originally located and radio-tracked on the creek that was subsequently found on the road 214 days after loss of the transmitter signal.
Creek frog
Sex SVL (mm)
Mass (mm)
Median distance
from stream (m)
Maximum distance
from stream (m)
Total distance moved
(m)
Tracking period
(d)
1 Female 79.4 73.0 11.0 50.0 196.7 25.0 2 Female 77.5 77.0 20.0 30.0 157.5 71.0 3 Female 78.1 76.0 40.0 72.0 136.0 95.0 4 Female 79.3 65.0 10.0 30.0 102.4 28.0 5 Female 87.1 66.0 4.5 12.0 69.9 65.0 6 Female 83.9 84.0 14.0 25.0 103.7 36.0 7 Female 79.7 63.0 12.0 19.0 91.5 36.0 8 Female 82.6 66.0 9.0 17.0 41.0 15.0 9 Female 82.6 69.0 20.0 23.0 95.5 29.0
10 Female 84.5 59.5 20.0 42.0 151.5 35.0 11 Female 84.0 79.0 7.0 10.0 47.0 27.0 12 Female 69.7 46.0 3.7 5.0 44.0 7.0 13 Female 82.7 65.0 6.0 16.0 28.0 13.0 14 Female 80.7 63.0 41.0 56.0 144.0 55.0 15 Female# 82.3 64.0 30.0 30.0 59.3 45.0 16 Male 67.7 36.0 5.5 12.7 98.82 164.0 17 Male 69.6 39.0 5.0 12.0 99.75 26.0 18 Male 64.3 37.0 5.0 9.0 102.5 52.0 19 Male 68.8 42.0 7.0 12.0 93.0 104.0 20 Male 62.0 33.5 2.0 5.0 28.0 8.0 21 Male 70.6 33.0 6.0 6.0 39.0 37.0 22 Male 65.5 34.0 3.7 6.0 112.6 37.0 23 Male 72.5 37.2 7.0 17.0 30.2 20.0 24 Male 72.0 41.0 10 15.0 6.0 8.0
Road frogs from road 1 Female 85.6 94.0 17.2 25.0 133.0 35.0 2 Female 85.5 61.0 61.0 80.0 139.0 30.0 3 Female 68.9 36.0 2.0 4.0 29.3 54.0 4 Female 84.7 80.0 41.3 64.0 145.0 49.0

Appendices
148
Appendix 12: Weight change for all radio-tracked frogs over the tracking period. In the case of the one frog that slipped its belt and the two lost signals the last known weight taken during the radio-tracking period was used. The stream female that lost 20 grams over the tracking period was observed to lay a clutch of eggs during tracking and the weight loss was attributed to this.

Appendices
149
Appendix 13: Distance moved away from the stream by a) radio-tracked females and b) radio-tracked males. Boxes are scaled to the number of times an individual was located. • represent outliers, * represent extreme outliers.
b)
a)