Untitled - Online ASDMA
29
-
Upload
khangminh22 -
Category
Documents
-
view
0 -
download
0
Transcript of Untitled - Online ASDMA


The support received from Department of Science and Technology is deeply acknowledged.
The valuable inputs and continuous support from the following organizations is gratefully acknowledged.
Acknowledgement
Dr. Jayanta PathakPrincipal Investigator
Asstt. Professor,Department of Civil Engineering,
Assam Engineering CollegeGuwahati, Assam, India 781013jayanta [email protected]
The project team takes this opportunity to thank the following persons for their suggestions, reviewsand support during the project.
Geological Survey of India (GSI)· Kolkata, Guwahati & Shillong,Indian Meteorological Department (lMD)· Delhi,AMTRON, RRL Jorhat,liT Guwahati, liT Roorkee, liT Kharagpur,Guwahati Metropolitan Development Authority (GMDA),Assam Engineering College & Jorhat Engineering College.
Dr. D.K Paul, Prof. & Head, DEQ, IITR Chairman, Working GroupMr. B.K. Bansal, Director & Program Officer (Seismology), Ministry of Earth SciencesDr. D. R. Nandy Ex-Director GSIDr. S.K. Nath, Professor, liT KharagpurDr. S.K. Dev, Professor, liT GuwahatiDr. Bibha Das Saikia, Principal, Assam Engineering CollegeDr. Palash Jyoti Hazarika, Professor, Assam Engineering CollegeDr. Biswajit Sarma, Senior Lecturer, Jorhat Engineering CollegeMr. Dalim Gogoi, Town Planner, GMDA
The untiring effort of the members of the project team Mr. Achinta Bezbaruah,Mr. Anurag Bhuyan, Mr. Ritu Boro is also deeply acknowledged.

EXEcutivE Summartj
Urban seismic risk in Guwahati is increasing with populationgrowth and the encroachment of vulnerable built environmentinto areas susceptible to seismic hazard. The city lies in zone Vand is the gateway to seven north·eastern states.Under the initiative of the Department of Science &Technology an effort has been made to enhance theunderstanding of the vulnerability of the built environment ofthe Guwahati city and generate seismic risk map on theGeographical Information System (GISI, based on hazardsevaluated through an already accomplished seismicmicrozonation mapping. An inventory of building data has beencreated to facilitate risk mapping by appropriate indexing ofthe risk involved due to potential hazard to the existingbuildings/structures. The current building map of Guwahati hasbeen completed on GIS with 85,000 building !ootprintscovering the entire Guwahati Metropolitan Area. The buildingmap has been prepared using both field survey and satelliteimagery. The vulnerability of existing building stock in theGuwahati Metropolitan area have been studied bothqualitatively and quantitatively. The Rapid Visual Screening(RVSI procedure has been adopted for qualitative vulnerabilityassessment of the structures and first level vulnerabilityanalysis has been completed based on building typology andsurveyed data. The first level seismic risk map has beenprepared by identifying the existing buildings on areassusceptible to various seismic hazards, considering theweighted contribution of all existing hazards as evaluated fromthe microzonation study. An attempt has been made to identifybuildings susceptible to landslide hazard and hazard due toliquefaction.
Dr. Jayanta PathakPrincipal Investigator

ContentIntroduction 1
Review of Status of Research and Development 1
Importance of the Study in the Context of Current Status 3
The Approach & Methodology 3
Site Visit & Building Survey· Administrative Units of Guwahati Urban area 5
Existing Building Scenario in Guwahati Urban area 8 •
Quantitative Seismic Vulnerability for Masonry Buildings 15
Quantitative Seismic Vulnerability for RC Buildings 16
Prognostic Damage Scenario of Guwahati Urban area & First Risk Map 17

co•...LJ
U:)
--0oL-
...LJC
C__ )
IntroductionUrban seismic risk in Guwahati is increasing with population growth and the encroachment ofvulnerable built-environment into areas susceptible to seismic hazard. The city lies in zone V and is thegateway to seven north-eastern states. Department of Science and Technology lOST) initiated theseismic microzonation of the Guwahati city. The main objective of the project has been to presenthazard map Is) for seismic hazard assessment of the city. The work on geological, seismological andgeotechnical zonation are completed, which are overlaid on each other on GIS platform - towardsformation of a hazard map. As a part of this project an inventory of building data has been developed,wherein, a large sample of more than 8000 buildings have been surveyed physically along with mappingof 85000 buildings from satellite data, which represents building types scattered over 60 municipalwards. To bring this whole exercise to a meaningful logical conclusion for engineering use it is ofutmost important to overlay of the building vulnerability data on various hazard maps prepared undermicrozonation project to evaluate risk maps to manage seismic disaster reduction measures, includingpreparedness, seismic retrofit, emergency response activities and city planning.The Department of Science & Technology initiated this project with an objective to enhance theunderstanding of the vulnerability of the built environment of the Guwahati city and draw risk mapbased on hazards evaluated through the seismic microzonation initiative. One major challenge facedwas the issue of non-availability of building data for seismic risk mapping. In this project an inventory ofbuilding data has been created to facilitate risk mapping by appropriate indexing o{the risk involved dueto potential hazard in various areas and vulnerability of the existing buildings/structures. An exhaustiveexercise of creating an inventory of building data of Guwahati Urban Centre has been completed forpreparation of various risk map of Guwahati city. The current building map of Guwahati has beencompleted with 85,000 building footprints covering the entire Guwahati Metropolitan Area. This workhas provided simple technology, and with data generated through this project, more sophisticated andaccurate results are being developed, using engineering and GIS.The various areas of the city having potential hazards W.r.t geological, geotechnical & seismotectonicsettings are already mapped for Guwahati Microzonation Project under DST by different project groups.The process of microzonation has provided micro level hazard evaluation along with study of groundresponse to earthquake motions. An attempt has been made in this project to prepare GIS based riskmap for Guwahati metropolitan area by integrating the building inventory data to various datasets andhazard maps prepared in the Guwahati Microzonation project. The project work will finally delivervarious risk maps representing risk associated with various attribution of the surveyed building viz.type, age, form, materials along with risk maps for respective hazards established throughmicrozonation study. The first risk map has been provided by overlaying the building inventory data onthe final hazard map considering the weighted contribution of all existing hazards as evaluated from themicrozonation study. The risk map due to landslide hazard and hazard from potential liquefiable areasare also presented.
Review of status of Research andDevelopment in the su~ectThe International Decade for Natural Disaster Reduction liON DR) secretariat launched the RADIUSIRisk Assessment Tools for Diagnosis of Urban Areas against Seismic Disaster) initiative in 1996, with

( 2 J
financial and technical assistance from the Govt. of Japan to conduct a comparative study tounderstand urban risk around the world !Ind to promote information exchange for seismic riskmitigation at city level. The Kolkata and Mumbai are the only two cities in India, which participatedin this program.The Federal Emergency Management Agency (FEMAl, USA has provided a natural hazard lossestimation methodology developed in partnership with the National Institute of Building Sciences.Using Geographic Information Systems (GIS) technology, it allows users to compute estimates ofdamage and losses that could result from an earthquake. The system is capable of using twoseparate geographic information systems to map and display ground shaking, the pattern of buildingdamage, and demographic information about a community. Once the ·Iocation and size of ahypothetical earthquake is identified.The Earthquake Area Vulnerability Assessment of Tokyo has been published by Tokyo MetropolitanGovernment (TMG) recently, which shows relative seismic risks in Tokyo. "The area danger levels"were determined with respect to building collapse, fire outbreak and spread, human casualties andaccess for evacuation, considering soil conditions, building inventory and social conditions.A comprehensive exercise for microzonation of Guwahati city has been completed by a workinggroup set up by DST. The potential vulnerable areas of the city W.r.t geological, geotechnical &seismotectonic settings are already mapped for the project by different working groups. AnInventory of building data of Guwahati Urban Centre has been created by the author and his groupunder the same project covering 4500 buildings through extensive field su[vey in the first phase ofthe project and the same has been expanded to more than 8000 buildings at present. This is thelargest ever inventory created for any city in the country.A comprehensive proposal on "seismic microzonation and GISbased studies for earthquake disastermanagement of Delhi region' has been evolved and submitted to Govt. of NCT of Delhi as a turnkeyproject. The project involves a multi-disciplinary and multi-institutional participation. DST has alsocompleted a project on microzonation of Jabbalpur. An Earthquake Risk Evaluation Center has beenestablished at Indian Meteorological Department, New Delhi. The main mandate of the center is tocollate and integrate all the existing seismological and collateral geophysical data and prepare theearthquake risk maps for the country.The first attempt to create Vulnerability Atlas of India (ASSAM) 1997 (Arya, 1997) details outvulnerability tables wherein damage risk levels for earthquakes are defined based on the intensityscale such as Very High, High, Moderate, Low, and Very Low, and categorization of houses has beencarried out based on distribution of houses by predominant materials of roof and wall, according to1991 Census. The state-wise Vulnerability Atlas, describing district-wise damage risk due toearthquake, wind and flood has been prepared. Accordingly, the earthquake damage risk associatedfor Guwahati urban area varies from very low, low, & medium for Type-C, Type-B, & Type-A housesrespectively. There has not been any other reported literature on seismic vulnerability of existingbuilding stocks of Guwahati urban area, which is one of the important modules for any SeismicHazard Risk Management (SHRM) study. A combination of local hazard intensity and vulnerabilityof existing house types has been used for carrying out risk analysis given in the district-wise tables.The Vulnerability Atlas, thus, provides ready macro-level information for use by the authorities fornatural disaster mitigation and preventive actions. The types of housing as existing in each districthas been taken from the Censusof India, 1991 and categorized from vulnerability consideration. Thevulnerability of these types to various intensities of the hazards was estimated by and the damagerisk in each district has been presented in a separate table. The area of the district prone to varioushazard intensities has also been shown.

Importance of the stud8 in the context ofcurrent statusAn estimate of losses for future earthquakes is essential for city like Guwahati which has seenhaphazard growth over last decade. A seismic risk map of the city prepared from survey of existingbuilding will be important for:
A. Land-use planning from a map-based analysis that identifies those parts of the city wherebuildings are at various level risk of damage.
B. Prioritization of retrofit or abatement programs from estimate of building damage, thusproviding the basis for establishing programs to mitigate or strengthen buildings that maycollapse in earthquakes.
C. Local emergency response and contingency planning from estimates of casualties and ofdamage to buildings and utilities.
D. Medical and relief agency preparedness and response to casualties and homelessness.
THE APPROACH 6 METHODOLOGYThe approach for assessment of seismic vulnerability of buildings involves estimation of seismicvulnerability of existing building stock both quantitatively and qualitatively. The quantitativeapproach covers demand-capacity computation, while the qualitative procedure has been based onstructural/non-structural damage grade indexing as per national & international state-of-the-artprocedures viz. Rapid Visual Screening (RVS) Procedure. The methodology adopted in carrying out thesurvey and indexing damage potential to various buildings are in line with the proposed methodologyby Ministry of Home Affairs (MHA), India and is based on the classification of buildings as per MSKIntensity scale as well as the new European Intensity scale, modified by Or. Anand S. Arya, NationalSeismic Advisor, GOI, New Delhi. The quantitative approach covers demand-capacity computationbroadly as outlined in ATC-40, 1996.Evaluation is a complex process, which has to consider not only the design of building but also thedeterioration of the material and damage caused to the building, if any. The difficulties faced in theseismic evaluation of a building are manifold. In many instances, there is no reliableinformation/database available for existing building stock, construction practices, in-situ strength ofmaterial and components of the building. The seismic evaluation mainly relies on set of generalevaluation statements. The unavailability of a reliable estimate of earthquake parameters, to whichthe building is expected to be subjected during its residual life poses another challenge.
( 3 )

(__4_)
The foremost problem is of uncovering the structure. In many buildings thestructure is concealed by architectural finishes, and the surveyor faces greatdifficulty in reporting the structural status of the buildings. The non-availability ofplans, and design documents is another problem particularly with respect toreinforced concrete work. Assessing material quality and associated allowablestresses is also difficult preposition, and one has to rely on locally availablereports/information or otherwise one has to go for destructive testing, which isseldom possible. Destructive and non-destructive testing of reinforced concreteand masonry elements are necessary to determine strength and quality ofconstruction. The rebound hammer is usually used to assess the compressivestrength of concrete structural members, wherever access is provided inreinforced concrete structure. If reinforcement details are available, a limitedamount of exposure of critical reinforcement is needed to verify conformity to theplans/structural details. If the plans are not available, the quality of reinforcementis assessed by exposing reinforcement to a limited extent. In view of aboveconstraints, the present study is limited to seismic evaluation of representativebuildings of different typology viz. Type-A (Mud/RR Masonry, Adobe), Type-B(Brick Masonry Buildings), and Type-C (RCC Buildings), and projects a generalizedpattern of building response to future seismic ground motion in differentwards/zones of Guwahati urban area. The results are mapped for different typesof buildings viz. Adobe/Mud houses (Type-A), Masonry buildings with RCC cornercolumns and Lintel band (Type-B) and reinforced concrete (Type-C) buildings. Anattempt has been made to prepare seismic risk map with engineering,seismological inputs on vulnerability of engineered and non-engineered structuresincluding parameters of population living in dwelling susceptible to damage andother exposure factors. Figure 1 shows the demographic distribution in variouswards of Guwahati city.

Figure 1: Ward wise Demographic Distribution Map of Guwahati
SITE VISIT 6 BUILDING SURVEY -Administrative Units of Guwahati Urban AreaThe region delineated under Guwahati Metropolitan Area includes GuwahatiMunicipal Corporation (GMCI area measuring 262 sq. km, North GuwahatiTown Committee, Amingaon CensusTown and 21 revenue villages which areunder : Abhaypur, Rudreswar, Namati, Jalah, Gouripur, Silamohekaiti,Tilingaon, Shila, Ghorajan, Mikirpara, Kahikuchi, Kahikuchi, Mirjapur,Jugipara, Borjhar, Garal Gaon, Dharapur, Janisimalu & Jansimalu (NCl,Kalitakuchi(NCl, Kharghuli, Bonda, Bondagaon and Bonda Grant, (1&111 andBirkuchi. In addition to the above area are the Narengi Cantonment areas,Guwahati Refinery (IOCll area, NFrailway Colony which show planned clusterof buildings.
(__5_)

WARD AND ROAD OVERLAY MAPOF GUWAHATI URBAN AREA
N
A
Figure 2: WARD Map with Road layout of Guwahati
'1

Table 1 Rapid Visual Screening of Indian Buildings for Potential Seismic HazardsSeismic Zone V
Building Name _
Use _
Address:
Elevation to Scale
Plan to Scale
Pin
Other Identifiers _
No. Stories Year Built
Total Floor Area (sq.m)
PHOTOGRAPH
OCCUPANCYResi: OrdlImp. School Max. Number of PersonsHealth Assembly Office 0-10 11-5051-100 >100Commercial Historic ResidentsEmer. Service Industrial Floating _
Probable Maximum Grade of Damage
SITE
High w.I. (within 8 m)Liquefiable (if sandy soil)Land Slide Prone
FALL! NG HAZARDS
ilding rv'asalry Building RC cr Steel Frarre Building LRv1 infill WXx:1
Type AA+ B,B+ C,C+ 0 C,C+ 0 E,E+ F
D!:JTage gade in
Zrrev G5 G5 G4 G3 G4 G3 G2 G1 G4 G4
Note: + sign indicates higher strength hence somewhat lower damage expected than that stated. Also averagedamage in one building type in the area may be lower by one grade point than the probable maximum indicated.Surveyor will identify the Building Type, encircle it. also the corresponding damage grade and tick mark therecommendation.Recommended Action:
I) A, A+ or B, B+ : evaluate in detail for need ofreconstruction or possible retrofitting to achieve type C or D
2) C, C+: evaluate in detail for need of retrofitting to achieve type D3) URM infill: evaluate for need ofreconslruction or possible
retrofitting to level D4) Wood: evaluate in detail for retrofitting
Surveyor's Signature
Name: ----------
(__7_)
(__8_)
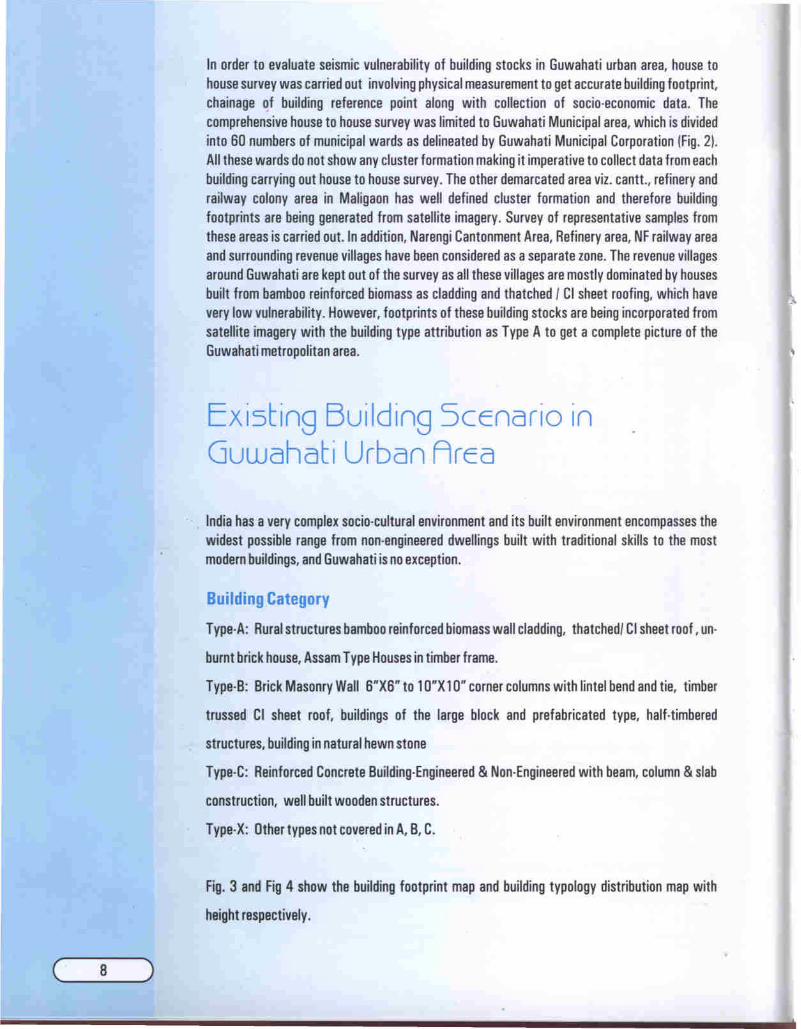
In order to evaluate seismic vulnerability of building stocks in Guwahati urban area, house tohouse survey was carried out involving physical measurement to get accurate building footprint,chainage ~f building reference point along with collection of socio-economic data. Thecomprehensive house to house survey was limited to Guwahati Municipal area, which is dividedinto 60 numbers of municipal wards as delineated by Guwahati Municipal Corporation (Fig. 2).All these wards do not show any cluster formation making it imperative to collect data from eachbuilding carrying out house to house survey. The other demarcated area viz. cantt., refinery andrailway colony area in Maligaon has well defined cluster formation and therefore buildingfootprints are being generated from satellite imagery. Survey of representative samples fromthese areas is carried out. In addition, Narengi Cantonment Area, Refinery area, NF railway areaand surrounding revenue villages have been considered as a separate zone. The revenue villagesaround Guwahati are kept out of the survey as all these villages are mostly dominated by housesbuilt from bamboo reinforced biomass as cladding and thatched I CI sheet roofing, which havevery low vulnerability. However, footprints of these building stocks are being incorporated fromsatellite imagery with the building type attribution as Type A to get a complete picture of theGuwahati metropolitan area.
Existing Building Scenario inGuwahati Urban Area
. India has a very complex socio-cultural environment and its built environment encompasses thewidest possible range from non-engineered dwellings built with traditional skills to the mostmodern buildings, and Guwahati is no exception.
Building Category
Type·A: Rural structures bamboo reinforced biomass wall cladding, thatchedl CIsheet roof, un·
burnt brick house, Assam Type Housesin timber frame.
Type·B: Brick Masonry Wall 6"X6" to 1O"X10" corner columns with lintel bend and tie, timber
trussed CI sheet roof, buildings of the large block and prefabricated type, half-timbered
structures, building in natural hewn stone
Type·C: Reinforced Concrete Building-Engineered & Non-Engineeredwith beam, column & slab
construction, well built wooden structures.
Type·X: Other types not covered in A, B, C.
Fig. 3 and Fig 4 show the building footprint map and building typology distribution map with
height respectively.

co
\
OF S
Figure 3: Existing Building Footprints in Guwahati Metropolitan Area

....•o
-BUI..DH:i TYPES
low Rile (A and B)I • Mdm Rise(C):... (C)
fads~RMI
Figure 4: Existing Building Typologies in Guwahati Metropolitan Area

The majority of houses in the villages around Guwahati urban area are of Assam Type categorized in TYPE-A& B - (a) brick masonry wall, 6"X6" to lO"x 10" R.C. Column, lintel band, tie and with Timber truss. (b)Bamboo reinforced Biomass Wall cladding with roofs made of thatch of bamboo supported on bamboopurlins. These building have very low vulnerability.
Figure 5: Existing Building Typologies in Guwahati Urban Area
(__ 11_)

C l L )

Figure 7: Existing Building Typologies in Guwahati Urban Area
( 13 )
( 14 )
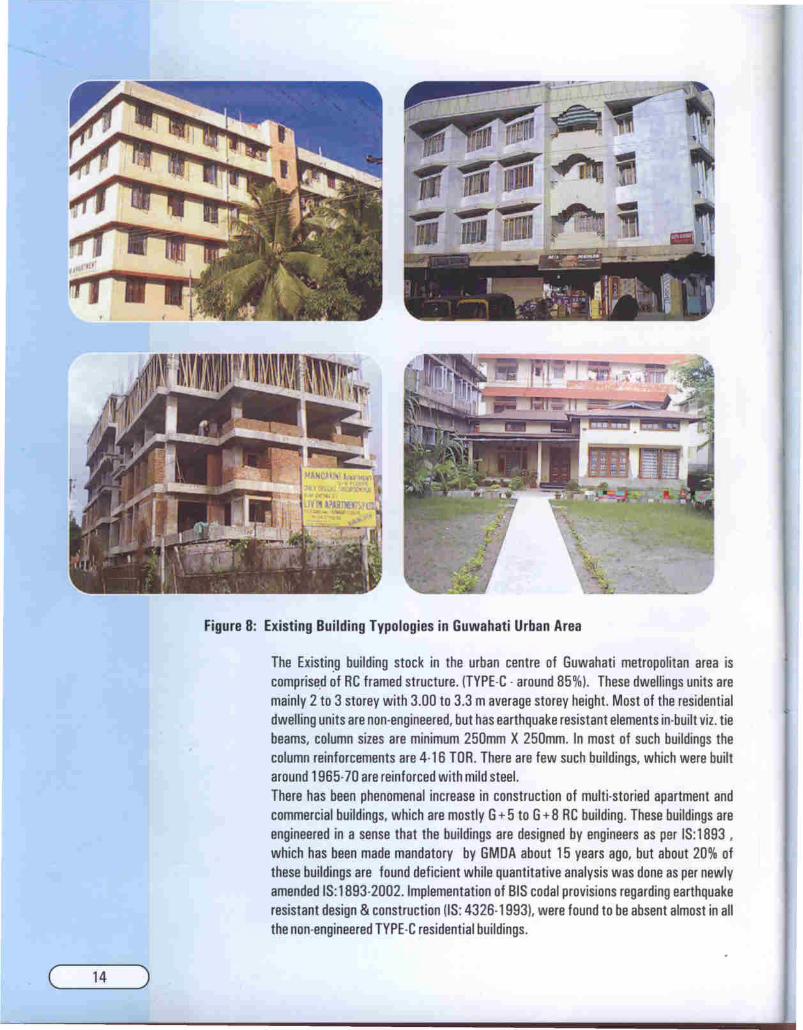
Figure 8: Existing Building Typologies in Guwahati Urban Area
The Existin.g building stock in the urban centre of Guwahati metropolitan area iscomprise.d of RC framed structure. (TYPE-C· around 85%). These dwellings units aremainly 2 to 3 storey with 3.00 to 3.3 m average storey height. Most of the residentialdwelling units are non-engineered, but has earthquake resistant elements in-built viz. tiebeams, column sizes are minimum 250mm X 250mm. In most of such buildings thecolumn reinforcements are 4·16 TOR. There are few such buildings, which were builtaround 1965· 70 are reinforced with mild steel.There has been phenomenal increase in construction of multi-storied apartment andcommercial buildings, which are mostly G+ 5 to G+ 8 RC building. These buildings areengineered in a sense that the buildings are designed by engineers as per IS: 1893 ,which has been made mandatory by GMDA about 15 years ago, but about 20% ofthese buildings are found deficient while quantitative analysis was done as per newlyamended IS: 1893-2002. Implementation of SIS codal provisions regarding earthquakeresistant design & construction (IS: 4326-1993), were found to be absent almost in allthe non-engineered TYPE-C residential buildings.

The study found that most of the residential buildings in Guwahati areconstructed based on socio-economic consideration rather than engineeringapproach. The majority of building stock (about 85%) composed of Type-Cbuildings. The TYPE-Band TYPE-A buildings in residential area (about 15%)are though non-engineered, they have earthquake resistant constructionfeatures inbuilt in them.Generalconstruction of RCframed buildings are of nominal concrete of M 15grade (1:2:4) ranging from 3 to 4 story with story height of 3.00 to 3.30 m(Type-CStructures) having RCCslab of 120-140 mm thickness and 200-250mm thick brick masonry in CM (1:6) as infill. The apartment buildingsauthorized by GMDA and GMC are well engineered as the procedure ofobtaining permission for such buildings are rigorous with a structuralengineer as RTP (Registered Technical Personnel) in addition to thearchitect. The geotechnical investigations for such buildings are mandatoryrendering the substructure design more reliable. These RC buildings aredesigned for earthquake load as per IS: 1893 1984/ 2002. The detailingpart of these buildings is of-course not as good as their design effort andaround 20% of these buildings are deficient in ductility provisions asenumerated in BIS: 13920-1993. Figure 5 to Figure 8 shows some typicalbuilding types existing in Guwahati.
Quantitative Seismic Vulnerabilittjfor Masonrtj BuildingsSince earthquake is a random process, all the load bearing walls in astructure are to be evaluated for their shear resistance. The demand placedby an earthquake Le. lateral forces at various levels, as per IS:1893-2002,arong with gravity load calculations were carried out for sample buildings,and later check in terms of Demand Capacity Ratio (OCR) for shearresistance, combined stress, overturning, and stability of non-structuralfailures for long and short walls. The OCRgreater than unity, indicates thatthe building is seismically vulnerable in respective criterion, whereas OCRless than one implies the building to be safe under earthquake loads. Asindicated earlier, earthquake demandsfor better shear resistance and hencethe OCRin shear should be less than one, otherwise the building will havediagonal (X) cracking. The OCR greater than one for combined stressesmeansthat the building is not even designedfor gravity loads and would leadto collapse on seismic shaking. The failures in overturning corroboratefalling of walls. The check for non-structural element implies the fallinghazard of parapet wall. The above analogy has been used to estimateseismic vulnerability in terms of various failure modesLe. collapse, excessivecracking, falling of walls including parapet walls. The city of Guwahatifortunately does not have many loads bearing structures, and the only areawhere such structures are located are the NF Railway colony, where all theofficial residences are on load bearing wall structure ranging from one toeventhree stories.
( 15 )

(__ 16_)
Quantitative Seismic Vulnerabilit8for RC BuildingsIn order to critically evaluate the RC framed buildings, selectedbuilding sample were modeled using structural analysis softwareunder combination of earthquakes & other loads for computing themember end forces in each structural member (Fig. 91. The samplestructures have been analyzed for design basis earthquake (OBEIloads, the earthquake loads which can reasonably be expected tooccur at least once during the lifetime of the structure. The analysisdirectly computes member end forces and then each member isdesigned for worst load combination. In order to calculate theOCRs, the calculated reinforcement of structural members has beencompared with provided reinforcement. The OCRs for longitudinaland transverse reinforcement reflects OCRs for flexure and shear ofmember. The OCRs calculated for flexure and shear gives the ideaabout inherent ductility and strength of member to ensure safety &serviceability during severe shocks.The OCR greater than one for flexure indicates that the longitudinalreinforcement in columns & beams are inadequate leading to failure.The possibility of failure of such buildings is excessive crackingleading to collapse. Whereas OCR greater than one in shearindicates that t~e lateral ties provided are not sufficient leading tobrittle failures i.e. catastrophic failure. In this case, there ispossibility of diagonal cracking in structural elements. Based uponabove analogy, OCRs for flexure, shear and stability of non·structural members viz. parapet wall etc., the seismic vulnerabilityof the structures are evaluated in terms of failure modes Le.excessive cracking, diagonal cracking and falling hazardrespectively, for sample RC buildings have been computed.

Load 1 : DisplacementLoad 8 : Bending Z
Figure 9: OCRANALYSIS - TYPE-CSample Buildings
Prognostic Damage Scenario ofGuwahati Urban Area 6 First RisK MapThe prognostic damage scenario based on the building survey on sample of 8000 buildings, spreadover 60 wards reflects the structural and non-structural damages induced in the existing buildingstocks. The damage scenario is being worked out in a ward is based on representative buildingsurveyed for different building typologies and not final and complete. It is found that Type-A, Type-B& Type-C buildings stocks are 10%, 40%, & 30% vulnerable respectively. In order to present theprognostic damage scenario for Guwahati urban area using quantitative approach, the failures modesof different type of buildings are being collated. Unlike in other parts of India rural housing in generalin North-eastern are very light and devoid of use of load bearing walls and stones. The roofing is verylight rendering tltem very safe against earthquake. For Type-B buildings, the postulated failure modeshave been categorized as excessive cracking IECI; falling of walls IFWI; falling hazard of non-structural members IFHI; and combination thereof - Excessive cracking + falling of walilEC + FWI;excessive cracking + falling hazard IEC + FHI; falling of wall + falling hazard IFW + FHI; excessivecracking + falling of wall + falling hazard IEC + FW + FHI; and safe buildings Iwhich do not have anyfailurel. Similarly, the various failures modes for assessing seismic vulnerability of Type-C buildingsare identified as excessive cracking IECI, diagonal cracking lOCI; falling hazard of non-structuralmembers IFHI; and combination thereof and safe buildings.
The buildings in, rural structures-bamboo reinforced biomass wall cladding and thatchedroof/CI sheet Iclassified as Type-AI, comprises of 4-5% of total building stock in GuwahatiMetropolitan area. The construction practices, materials used and quality of construction for Type-A buildings are more or less uniform in nature from one region to another region in the area. All thebuildings are light weight with sturdy ductile bamboo framing showing seismic resistant measuresand are of very low vulnerability.
About 15 % building stock in Guwahati urban centre is composed of Type-B buildings whichinclude ordinary brick masonry buildings with 6"X6" to 1O"x 10" corner column and lintel bend & tiebeams. As regards to their susceptibility to seismic damage, about 60% buildings are safe, while40% buildings are likely to suffer damages in form of excessive cracking, falling of walls, fallinghazard of non-structural component and combination thereof.
(__ 17_)

00
RISK MAP OF THE BUILDINGS OF GUWAHATI CITY AREA BASED ON HAZARD INDEX
.. ..-.
N
~.
Risk (Basis Hazard Index)_ Low (less than 0.20)o Low to medium (0.20 - 0.30)
Medium (0.30 - 0.40)_ High (0.40 - 0.50)_ Very high (more than 0.50)N Major roadsN Other roads
oi
2 Kilometers
91':;lSO'
Figure 10: First Risk Map based on Cumulative Hazard Index from Microzonation

co
26610'
26"5'
LANDSLIDE RISK_ High Risk
Medium RiskLow RiskNo Risk
~Brahmaputra RiverNMajor RoadsN Other Roads
• \!r4'
Figure 11: Risk Map of Building based on Landslide Hazard in Guwahati Metropolitan Area• l.
N
\!' ':'U'

No
Figure 12: Risk Map of Building based on Liquefaction Potential in Guwahati Metropolitan Area
N
2 Km.- OJ

NATURAL FREQUENCY DISTRIBUTION OF BUILT ENVIRONMENT OF HIGH DENSITY URBAN CENTRE WITHIN GUWAHATI N
A
Figure 13: Map showing Natural Frequency of Buildings in High Density area (developed for site response and amplification damage)

NN
Natural time period_ 0.18·0.276_ 0.276·0.371
II0.371 . 0.4670.467· 0.562
_ 0.562·0.6580.658 . 0.7530.753 . 0.849
00.849.0.944D 0.944 - 1.04
N......--...A
:...•• .J
NATURAL TIME PERIOD DISTRIBUTION OF BUILT ENVIRONMENT OF GUWAHATI REGION
Figure 14: Map showing Natural Time Period of Buildings ldeveloped for site response and amplification damage)

The engineered RC construction in the region typically consists of RCMoment Resisting Frames (Type-CI with in filled brick masonry walls,which constitutes about 85% of total building stock. The buildings arefound to be designed for earthquake loads with deficient provisionsfor ductility. In case of an earthquake about 30% of Type-C buildingsare found to be vulnerable and are likely to suffer damages in the formof soft·storey failure, excessive cracking, diagonal cracking, fallinghazard and its combination. This study will finally present the seismicdamage scenario of Guwahati urban area taking into account allprevalent construction practices, material of construction,quality/workmanship of construction, types of buildings. Thegeological/ geotechnical parameters based on ground realities are tobe collated and overall vulnerability of the building stock based ontopographical variation, site response, sub-structure vulnerability toliquefaction leading to building collapse are being incorporated.
The first risk map based on available cumulative hazard indexfrom microzonation study has been presented in figure 10. Thebuilding footprint map developed from field survey and satelliteimagery is overlaid on cumulative hazard map from microzonationstudy. The first level risk map shows the risk of the built environmentW.r. t existing seismic hazard. The risk index has been kept inconformity with the cumulative hazard index from microzonationstudy. The next level risk maps will present the damage scenario basedon differential vulnerability of various building types and theirsurveyed data. The risk map of building based on landslide hazard hasbeen worked out overlaying the building map on landslide hazard map(Fig. 111. An attempt has been made to derive risk map fromliquefaction potential hazard map by identifying the building falling inliquefiable area of the city (Fig. 121. The work on deriving buildingparameters and mapping them in the base map with building footprintsare carried out. The Fig. 13 & Fig. 14 show the mapping of naturalfrequency and time period of the buildings calculated from theavailable heights based on IS: 1893-2002 and are useful for study ofbuilding response to site amplification at predominant frequency.
( 23 )

(__ 24_)
Bi bl iographtj1) A. S. Arya, Current Science 62, 251 (1992).
2) ATC-21, (1988), "Rapid Visual Screening of Buildings for
Potential Seismic Hazards: A Handbook", Applied Technology
Council, Redwood city, CA, USA.
3) ATC-21-1(1988), "Rapid Visual Screening of Buildings for
Potential Seismic Hazards: Supporting Documentation",
Applied Technology Council, Redwood city, CA, USA.
4) ATC-40, (1996), "Seismic Evaluation and Retrofit of Concrete
Buildings", Vol. 1, Applied Technology Council, Redwood city,
CA, USA.
5) IS: 13920·1993, (1993), "Ductile Detailing of Reinforced
Concrete Structures Subjected to Seismic Forces·Code of
Practice", Bureau of Indian Standards, New Delhi.
6) IS: 1893·2002, (2002), "Criteria for Earthquake Resistant
Designof Structure", Bureauof Indian Standards, New Delhi.
7) IS: 4326-1993, (1993), "Code of Practice for Earthquake
Resistant and Construction of Buildings", Bureau of Indian
Standards, New Delhi.
8) Vulnerability Atlas of India (1999), Building Materials &
Technology Promotion Council,New Delhi.