timing of facial growth - Adelaide Research & Scholarship
250
WARNING The University of Adelaide Library recognises the moral rights of Aboriginal and Torres Strait Islander peoples as the owners of their knowledge. Please be aware that this thesis may contain sensitive information, including names and images of people who have passed away and which may sadden and distress some Indigenous people.
-
Upload
khangminh22 -
Category
Documents
-
view
2 -
download
0
Transcript of timing of facial growth - Adelaide Research & Scholarship

WARNING
The University of Adelaide Library recognises the moral rights of Aboriginal and Torres Strait Islander peoples as the owners of their knowledge.
Please be aware that this thesis may contain sensitive information, including names and images of people who have passed away and which may sadden and distress some Indigenous people.

TL)I
TIMING OF FACIAL GROWTHIN
AUSTRALIAN ABORIGINES
A study of relations with stature andossification in the hand around puberty
KEITH CYRIL GRAVE, B.DS.,F. A.C.D.S.
^, - i,
Department of Dental Science
University of Adelaide, Adelaide, South Australia
-February 1971-

PREFACE
The adolescent growth spurt is a constant phenomenon occurr:-ng
inallchildren,butvaryingintimeofonset,inintensityanddura-
tionfrononechildtothenext"Thechronologicalageofachi]d,
therefore, is a poor indicator of physiological status '
Anunderstandingoftherelationbetweenthetíningofmaximum
growthinthefacialskeletonandothermaturationeventsisuseful
intheplanningoforthodontictreatment"Moreover,reliabtemethods
of estinating the tining of naxinun skeletal growth would be of clini-
caI value in fields apart from orthodontics '
The purpose of this investigation is to ascertain:
The tining of skeletal maturation events as observed on
standardized hand and wrist roentgenograns;
The tining of maximum growth in body height;
The timing of maximum growth of selected craniofacial components;
Therelationbetweenthetirningofmaturationevents,maximum
growth in body height and maximum facial growth' during the
circunpuberal Period;
The most reliable and clinically useful predictors of maximum
craniofacial growth "
1
2
3
4
5
1L

SUMMARY
The main objective of the investigation was to ascertain the
relations between the tíming of maturation events, maximum growth
in body height and maxinun facial growtho during the circumpuberal
period in Aboriginal children"
Longitudinal records of subjects enrolled in a university of
Adelaide Growth study are filed in the Department of Dental science"
Records of 52 males and 36 females were selected from those available
to provide suitable observations for the study. Most of the subjects
belonged to the wailbri tribe of Australian Aborigines living under
settlement conditions at Yuendumu in the Northern Territory of
Australia "
variables studied included the magnitude and timing of peak
growth velocity in body height obtained from serial observations of
stature made at Yuendunu; the time of ossifieation of the pisiform'
hook of the hanate-stages 1 and 2 and sesanoid bones obtaíned from
serial hand and wrist roentgenograms; and, final-ly, the magnitude
and tining of peak growth velocity in facial dimensions obtained from
serial lateral head roentgenograms "
A preliminary study was made to determine the most suitable
method for skeletal age assessment and to select earpal ossífication
events for analysis. Facial dimensions weTe selected to cover most
aspectsofthenasomaxiltarycomplex"Aseriesofdoubledeter_
minations were made in order to determine the nagnitude of experi-
mental errors and the extent to which they affected results "
1rL

The tines of appearance of carpal ossification events and the
tines of peak growth velocity in stature and facial dimensions were
recorded as the mid-point of the year during which the events occurred'
The relations between carpal ossification and peak growth velocity
in stature and the facial skeleton were studied" coefficients of
linear correlation between paired variables were determined as well as
time intervals between paired events "
Results showed that Abotigines and caucasoids were similar in
their patterns of carpal maturation and general body and facial growth'
Sex differences were shown to occur in the time of appearance of car-
pal ossification events, and in the magnitude and tining of peak growth
vetocity in stature and the facial skeleton" In addition, it was
noted that there was a sex difference in the relation between the timing
and sequence of peak growth velocity in facial divnensions,and statuTe"
For example, in females, peak growth velocity of most facial dimensions
occurred after peak growth in stature, while in males peak growth
velocity of most facial dimensions occurred either before or coincident
with peak growth velocity in stature"
All carpal ossification events ossified before peak growth velocity
in stature and facial dimensions" In general, carpal ossification was
found to be a fairly reliable indicator of the growth rate" In par-
ticular, the pisiform (in females) and hamate-stage 1 (in males) were
found to be closely related to the onset of peak growth velocity because
each event ossified on the average, approximately L"5 years before peak
growth velocity in stature" Hamate-stage 2 and sesamoid ossification
indicated that peak growth velocity had occurred or was immínent
1V

because each event ossified on the average, 0"4 years before peak
grohrth velocity in stature"
The investigation clarified the understanding of general reLations
between body growth, skeletal maturation and facial growth¡ In parti-
cular, the results can be applied in orthodontic practice as a means
of assessing the growth status of children"
V

ACKNOWLEDGEMENTS
My sincere appreciation is extended to both Professor A"A" Abbie,
Emeritus Professor of Anatomy and Histology and Dr" T" Brown, Reader
in Oral Anatomy for their supervision of this thesis"
Special thanks are due to Mr" M"J. Barrett, Reader in Prosthetic
Dentistry for permission to use records which he and Dr" Brown collected
at Yuendumu, Northern Territory, during a longitudinal growth study and
for photographs taken on field expeditions, Mr" M"J" Barrett also gave
pernission to use unpublished results of an oral health survey carried
out in 1970 by Mr" J.J" Williamson and Mr. G"C. Townsend" These re-
sults are discussed in APPendix A.
Professor A.A" Abbie made avaí1ab1e a series of hand and wrist
roentgenograms obtained on field trips to Yuendumu. Computer programmes
used in the research were coded by Dr. T" Brown"
I am extremely grateful to Professor A"M" Horsnell, Head of the
Department of Dental Science and Professor J"C. Thonard, Dean of the
Faculty of Dental Science for making available the facilities of the
Department "
I acknowledge my gratitude to Mr. J. ScoIlin, Dental Superintendent,
Royal Adelaide Hospital for his assistance while employed in the Depart-
ment of Orthodontics during the period of the M"D"S" programme"
Mrs. S.K" Nicholls assisted with data processing and the tabulation
of material and Mrs" R" Scantlebury typed the final manuscript" I am
deeply grateful for their assistance"
V1

Data processing was carried out under a Departmental Computing
Grant nade available by the University of Ade1aide. The research
was supported by U S P H S research grant DE 02034 from the National
Institute of Dental Research, National Institutes of Hea}th, Bethesda,
Maryland, U"S.A"
vlr

SIGNED STATEN4ENT
This thesis is submitted in finaL fulfilnent for the require-
rnents of the Degree of Master of Dental Surgery in The University
of Adelaide. Entry to candidature for the Degree was gained by
passing a Qualifying Exarnination in Novenber, 1969 of a standard
equivalent to the Honours Degree of Bachelor of Dental Surgery.
Study for this examination lvas in the field of Dento-facial Growth
and Developnent.
The thesis contains no material which has been accepted for
the award of any other degree or diploma in any University. To
the best of my knowledge and belief, it contains no material pre-
viously published or written by another person, except when due
reference is nade in the text of the thesis.
KEITH CYRIL GRAVE
vl-11

CONTENTS
Preface
Summary
Acknow ledgements
Sígned Statement
Líst of Tables
List of Figures
Results, 60;
74.
page 11
iiivi
viiixi
xiii
24
53
7S
85
11 INTRODUCTION: SKELETAL MATURATION AND FACIAL GROWTH
Skeletal maturation, 1; Craniofacial growth
studies, !4i The relation between skeletalmaturation and facial growth , 21.
MATERIALS AND N{ETHODS
Material, 24; Previous studies of the Waitbri, 26i
Selection of subjects, 281' General methodology, 321
Roentgenographic methods, 33; Stature, 4l; Hand and
wrist ossification events, 4L; Reference points and
reference lines, 44i Variables studied, 46;
Statistical methods, 50.
2
3
4
5
ERRORS OF THE METHODS
Methods of investigation, 53;
Discussion, 7L; Conclusions,
RATING OF SKELETAL MATURITY
Introduction, 751' Method, 75; Results, 78i
Discussion, 78; SummarY , 84,
GROWTH VELOCITIES AROI.JND ADOLESCENCE
Introduction, 85; Methods, 87t Results, 91;
Discussion, 91; SummarY, 100.
1X

6 ASSOCIATIONS BETWEEN FACIAL GROWTH Ë SKELETAL MATURATION page 101
Introduction, 101; Results, 103; Discussion, 138;
Sunmary, 151.
7. RELATIONS IN TIME BETWEEN GROI{ITH EVENTS
Introduction, L52; Methods, L52i Results' 153;
Discussion and SummaÌY, 169.
8. GENERAL DISCUSSION AND CONCLUSIONS
L52
188
199
207
208
2t3
2I5REFERENCES
Dental State of subjects
Skeletal Maturation Study, Form 7
Variables studied
Conputer outPut for growth velocities
x

1.
2.
3.
4.
5.
6"
7.
8.
9.
10.
11.
t2.
13.
t4.
15.
16.
L7,
18.
19.
20.
2r"
22,
23,
LIST OF TABLES
Tirne of appearance of the sesanoid in Caucasoids
Distribution of subjects with hand and wrist roentgenogra¡ns
Distribution of subjects with lateral head roentgenograms
Statistical Parameters
SkeletaI age, bone scores and sesamoid diameters in Caucasoids
skeletal age, bone scores and sesamoid dianeter in Aborigines
Double deterninations on hand and wrist roentgenograms in Caucasoids
Double determinations on hand and wrist roentgenoglans in Aborigines
Atlas and Tanner-whitehouse methods of age deter¡ninations
Misclassifications of ossification even-ls
Double deterninations on lateral cephalonetric roentgenograms
Tine of appearance of ossification events in Aborigines
Tine of appearance of ossification events in Caucasoids 6 Aborigines
Tirning and magnitude of peak velocity in stature
Tining and magnitude of peak velocíty in n-s and pn-sp
Tiningandmagnitudeofpeakvelocityinthenandible
Tining and rnagnitude of peak velocity in face height
correlations between ossification events and stature
correlations between facial dimensions and stature
correlations between facial dimensions and hook of hanate
Correlations between facial dimensions and pisiform and sesanoid
Correlations between facial dimensions and sesamoid stages
correlations between chronological age-at-appearance of ossi-fication events
correlations between skeletal age-at-aPpearance of ossificationevents
24.
x1

25.
26.
27.
28,
29,
30.
31.
32.
5J.
34.
Correlations between facial dinensions (magnitude)ç
Correlations between facial dimensions (chronological age)
Correlations between facial dinensions (skeletal age)
Time intervar between stature and carpal ossification events
Time interval between pisiform and facial dinensions
Time interval between hamate-stage 1 and facial dimensions
Time interval between hamate-stage 2, sesanoid, and facialdinensions
Time interval between carpal ossification events
Listing of paired conparisons with no significant time difference
subjects with ossification events óccurring before or afterstature
35. subjects with ossification events occurring before or afterupper facial dimensions
36. subjects with ossification events occurring before or afterlower facial dimensions
37, Subjects with significant time intervals between ossificationevents.
x1t

1
LIST OF FIGURES
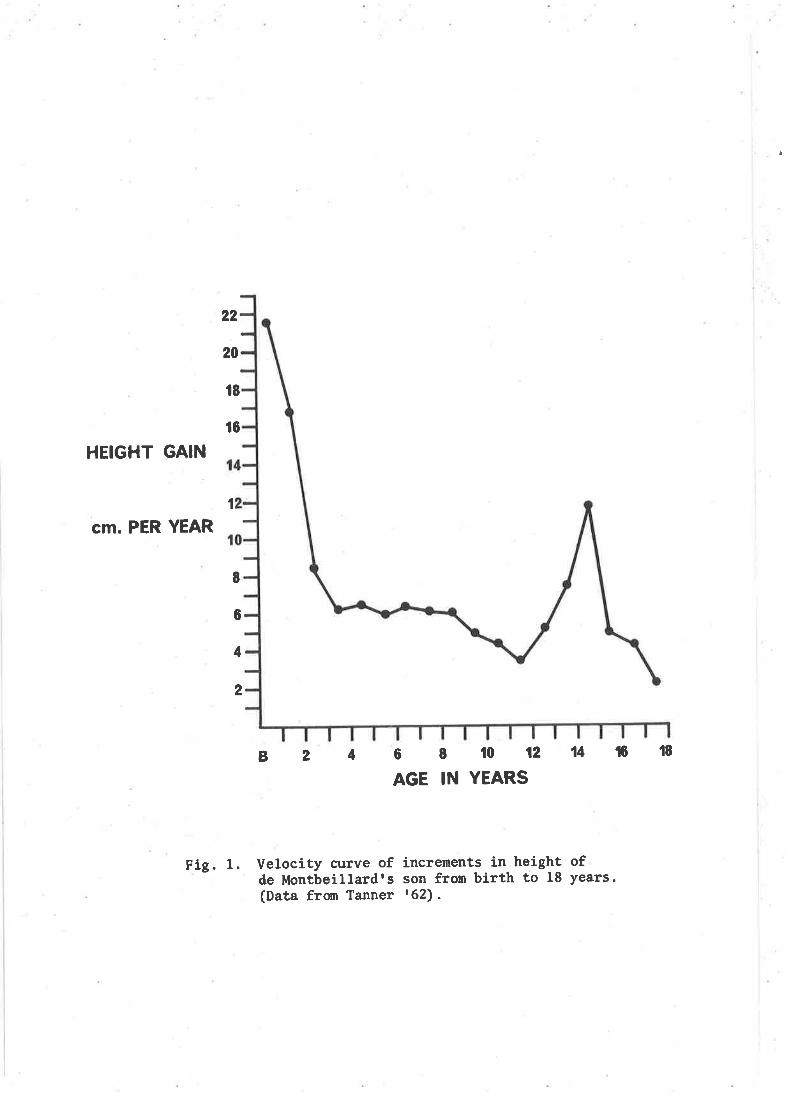
Velocity curve of increnents in height of d9-Montbeillardts son
from birth to 18 years (Data fro¡n TANNER '62)
Location of Yuendumu Settlement
Head holder used during field studies at Yuendunu
Subject positioned for hand and wrist roentgenogran
Measurement of standing height using the anthropometer constructedfor field studies
ossification events inspected in prelininary analysis
Roentgenographic reference points and reference lines
Ossification events inspected in final analysis
Craniofacial dimensions measured
Mean age-at-appearance of ossification events
DiaI gauge vernier caliPer
Magnítude of peak velocities in stature and facial dimensions
Relations between peak vetocity in stature and facial dimensions
Relations betweon ossification events and peak velocity instature
15" Relations between ossification events and peak velocity instature and facial dinensions
2
3
4
5
6.
7"
8"
9.
10.
t1.
L2,
13"
14.
x]-11

CHAPTER I
INTRODUCTION: SKELETAL MATURATION AND FACIAL GROWTH
SKELETAL MATURATION
SCAMMON (,27) stated that Count Philibert Gueneau de Montbeillard
was ïesponsible for the first recorded longitudinal growth study" A
velocity growth curve of his son (Fig. 1) illustrates a typical pattern
of growth in height, velocity decreasing from birth on¿ards except for
one or possibly two periods when an increase is observed. The earlier
period has been called the juvenile growth spurt, occurring between
6 - 8 years, while the second period, the adolescent growth spurt, occuls
between 13 - 15 Years "
BOAS ('32) found that the adolescent growth spurt occurred approxi-
mately two yeaTs earlier in girls than in boys" Furthernore, TANNER
(,62) stated that the maximum rate of growth is found just before or
during pubertY '
Four systens are comnonly used to deternine physiological matutity "
They include: skeletal age, dental age, morphological age and secondary
sex character age" Skeletat age is discussed separately later in this
Chapter "
¡
22
20
t8
16
HEIGHT GAIN
CM. PER YEAR
1
I
6
4
2
821
Fig. 1. Velocity curve of incre¡nents in height ofde Montbeillardrs son fron birth to 18 years.(Data frm Tanner '62).
681012AGE IN YEARS
14t18

3
DENTAL AGE
Tooth eruption and tooth development patterns have been employed
to assess the physiological status of children"
CLEMENTS, DAVIES-THOMAS and PICKETT ('53) noted that early erup-
tion of the second nolar was related to early puberty. SUTOW, TERASAKT
and OHWADA (t54) cornpared skeletal developnent with dental status in
1r360 Japanese children aged 6 - 14 years" Assessment of dental status
was made by counting the number of erupted teeth" They found that chil-
dren advanced in skeletal development had a gTeater number of erupted
teeth than children below average skeletal development" However, STEEL
(,64) found that at !2 yeats of age, there was no simple direct relation
between dental and skeletal maturity'
BJöRK and HELM ('67) studied the relation between the timing of
two definite stages of tooth eruption and naximum growth in body height "
Theyconcludedthatdentaldevelopnentwasoflittlevalueasacri-
terion of PubertY "
LAMONS and GRAY ('5S) determined dental age from a tooth develop-
rnental chart (scHOUR and MASSLER, '41) and made comparisons with skele-
tal and chronological age" They found chronological age was a slight-
1y better index of tooth development than skeletal age which varied
independentlY of dental age"
LAUTERSTEiN ('61) found high positive correlations between the
root of the lower right first permanent molar and skeletal age and be-
tween root development and the nunber of erupted permanent teeth'
LEWISandGARN('60)studiedtherelationbetweentoothfornation

4
and a number of maturation events., They reported that during infancy
and childhood, eorrelatíons between tooth formation and general growth
and developnent were 1ow and rarely significant. Howevero as adoles-
cence approaches, correlations between the same variables inereased'
MOORREES, FANNING and HUNT ('63) presented sex-specific standards
for dental age assessment" In addition, means and standard deviations
were listed for developmental stages of cTohrns and roots of the per-
manent mandibular caníne, premolars and molars (FANNING and BROWN" t71) "
MORPHOLOGICAL AGE (SIZE AND SHAPE AGE)
size and shape of individuals have been used as a measule of devel-
opment"SHELDON('40)popularizedtheclassificationofbodybuild
into three main somatotypes: endomorphy, mesonorphy and ectomorphy'
Subjects were photographed standing nude in front of a calibrated gril1
and certain anthropometric measurements were made. From a numerical
scale, a classification was made " somatotype ratings have been related
to physiologic status by a number of workers includíng DUPERTUIS and
MICHAEL ('53), ACHESON and DUPERTUIS ('57) and HUNT' C00KE and GALLAGHER
('s8)"
WETZEL['41,,43)introducedthelWetzelGridlasameansofass-
essing growth in children in relation to iLlness and malnutrition' The
grid was constlucted so that it was possible to determine quantitative
Tatings on such attributes as physique, developnental 1eve1, basal meta-
bolisn and calorie needs from stature, weight, sex and age data"
MEDAWAR(,44)designedagridtoillustratethechangeinvertical

-5-
ploportíons of the body from five nonths to adulthood' An equation ex-
pressed the change in reLat-ion of defj.ned anatomical levels with in-
ereasing age, and from thís a shape age hras developed"
SECONDARY SEX CHARACTER AGE
Theonsetofpubertyisusuallyassessedfrontheappearanceof
outward stgns attTibutable to the action of sex hormones" Puberty is
considered to begin when pubie , axiIJ.ary or faciaj' hair appear, when
thetestes,penisorprostatebegintoincreaseínsizeorwhenbreast
development, is noticeable. BURSTONE It63) considered that in most
chitdren marked seeondary sex charaeteristics appeared later than the
peak velocitY of growth ín height"
Menarchenearlyalwaysoecursaftertheapexoftheheightspurt
haspassed(DEMÏNG,o57)"GREULICH(r38)comrnentedt'bhemarkediv'-
reguLanita of the ealLy menstt,ua"L cycLes of girls shouLd make one r,e.
Lurctant to att.ttbute to bhe menayehe iteeLf the impottance as a ev'í-
tarion af matur,.Lty uhieh ùs commonLy aset''ùbed tcs tt by wv"ítets on
adoleeeenee.t, The first sj.gns of pubic hair growth and breast de-
velopinent preeede menarehe by about two years ITANNER' '62) "
ThetimeofonsetandthedurationofpubertyVaTygreatlybetween
children (SCHONFELD, r45). This variation may be due to genetic
(PETRI,'35;IIO,'42)oeJ'imatie(ELLIS"50)sseasonalREYMERTand
JOST, ,47)o nutritÍonal (BRUCH, '41; GARN and HASKELL, '60) or socio.
economic and secular (MICHELSON, ',44i WILSON and sUTHERLANID" r53)
faetors "

6
TANNERIs('62)ratingofsecondarysexcharactersifunaccompanied
by other evidence is not a clear cut nor a practical guide to the clin-
ician in the deternination of the degree of skeletal maturation"
SKELETAL AGE
skeletal age is by far the most conmonly used indicatol of physio-
logical maturity during the growing period" COHN ('24) cites POLAND
(in his paper) as the pioneer of hand and wrist roentgenographic tech-
niques. However, it has been stated that RANKE (1896) hlas one of the
first workers to enploy roentgenograms to detect the onset of ossifi-
cation events in the carpals " He studíed physical development in re-
Iation to the appearance of ossification sites from birth through to
adolescenc'e "
shortly after the advent of roentgenographic technique in 1895,
pRyoR commenced collecting material for the study of hand and wrist
ossification, publishing a report of his studies in 1905 '
In collaboration with PRYOR, ROTCH ('08) used hand and wrist ro-
entgenograms for skeletal assessments " They found that chronological
age was a pool,- indication of a childrs general developmental status'
They carried out an exhaustive study of the ossifícation patterns in
the extremities stating in 1908, ttqTom l;he analyses of 11000 eases
r haue come to the conclusùon that in the proeess of deueLopment fTom
biy,th to ad"oLeseenee the nov'maL changes uhieh t'ake pLace in the uröst
corrlpa,lesoeLoseLytoothet,joí'ntsthatinthegreatmajonityof
índíuiduaLs, the uy,t)et may be aecepted as a fairLy aceuz'ate ùndeæ of

7
genela\, d,eve7-opmentt'. ROTCH (t08) hras concerned mainly with the first
appearance of ealeification in bony centres of the caÏpalso radius and
ulna" A total of thirteen stages of maturity covering the period fron
birth to the fourteenth year of life were studied. Approximate ages
were assígned for the various stages of the rating scale used"
It appears that earlier investigators gave littl-e attention to the
morphologieal ehanges in individual carpal centres between the earlíest
ealcificauron and maturity" BARDEEN ('21), however, indicated develop-
mental stages by one of four codes, allocating four codes to each de-
velopíng earpal centre" These stages were combíned into overall ratings
of carpal developnent. He defined eleven such stages, excluding the
radius and ulna.
PRYOR ('25, '28) noted that females matured earlier than males'
the difference becoming apparent as early as the embryonic stage of de-
velopment.
BALDWIN ('2L) endeavoured to overcome the problems introduced by
variation in the order of carpal bone appealance and the differing
ossifying stages by using a planimeter to measure the total ossified
area dírectly from the roentgenogram. He reported hígh correlations
between the degree of ossification, height and body weight, Howevet'
there was no attenpt to correct for variations in the sj ze of the hands
of chitdren of equal maturitY "
PRESCOTT ('23) and GARTER (r24) suggested a refinenent of BALDWINTS
method. They eaeh recorded a measurement of a defined area and the
tstal ossified area in the wrist region" The ratio of these two
measurements were taken as an index of anatomic maturity. The measure-

8
ment method was considered to be more reliable than inspection"
TODD ('30a, l30b) developed an inspectional system for rating
skeletal development in which an assessment was rnade on the radíal and
ulna epiphyses, netacarpal and phalangeal epiphyses' and earpal bones"
ToDD cited SAWTELL as the first to include t'he radial and ulna epi-
physes " This method differed from previous ones in that TODD studied
centres of ossification in the shoulder, knee and foot as well as een-
tres in the hand "
TODD ('37) published an Atlas of standards, which were derived for
the left hand and wrist of healthy cleveland children' GREULICH and
PYLE(,50,'59)revisedthesestandardsandassignedanexactskeletal
age to every bone in the hand and wrist. SPEIJER (r50) and suTow and
OHWADA('53)atsopublishedstandardsforDutchandJapanesechildren
respectivelY "
In assessing skeletal age it is customary to examine roentgenograms
of the left hand and wrist on the assunption that pronounced lateral
differences are raTe" In the eax|y studies of PRYOR ('05), RQTCH It08)
and BALDWIIiI (,2L), right hand and wrist roentgenogÏans were used' This
practicereceívedmuchcriticismpromptingPRYOR('56)tostatethatttz,egardless of the uav'íatt)ons (nonmaL), the ossifÌcation ðs bíLateraLl'y
syntmetrí,eaL.tt This conclusion was reached after the study of hand
and wrist roentgenograms of 554 children from 3 rnonths to 14 years of
age "
However,LONGandCALDWELL('11)studied200roentgenograrnsfron
subjectsranginginagefromearlychildhoodtoyoungadulthood" The
rnental status of the subjects extended from that- of idiots and cretrns

9
to the exeeptionally bright high sehool boy. In more than one third of
the subjects, developmentat diserepaneies were found between the right
and left wrists. Furthermore, ALLEN (,126) reported marked lateral dif-
ference in ossifíeation of the skeleton"
IORGERSEN (t51) found that when lateral asymmetry existed, the left
hand and wrist skeleton was usually more advaneed than the right' He
suggested that asymmetïy could be due to a dífference rn innervation"
MENEESandHOLLY(.'32),FLECKER('32)andDREIZEN,SNODGRASSE,WEBB-'
pEpLOE, PARKER and SPLES ('57) reported that rn a majority of indivi-
duals the right side was more advanced skeletally than the left. MENEES
and HOLLy (.1 52) reported data whieh indieated that the side in whieh
ossification was more advanced beeame the side of dominant function'
Lateral asymmetïy appears to be moÏe eommon in the earpal bones than in
the long bones of the hand and wrist (BAER and DURKATZ, ',57i DREIZEN
et al " '57) "
5AWTELL ('29), MENEES and HOLLY (,132), FI-ECKER (',32), TORGERSEN
('51) DREIZEN et at" ('57) and ROCHE ['63) a]1 report-ed that for praeti-
ca1 purposes, diserepancies j-n ossification sequence and timing between
left and right sides were mostly non-signifieant and, therefore, did
not constitute a souree of error in the deterrnrnation of skeletal status.
ACHESON (t54, ,57) introdueed a new system termed the Oxford method
for determiníng skeletal age as an alternative to the use of TQDDrs
standards which were derived from observatíons made on Ameriean chíldren"
Furthermore, the Oxford method provided ratings of skeletal maturation
aecording to a defined scale of measurement " The Oxford rnethod was
based on a longitudinal study of the physical development of 650 healthy

-10-
preschool children in oxford, England" oxford Maturíty units were alIo-
cated to a bone as each distinct shape change made itself manifest so
that the sum total of units scored by a bone at any stage in its develop-
ment would be an exact measure of its maturity'
TANNER and WHITEHOUSE ['59) and TANNER' WHITEHOUSE and HEALY ('62)
introduced a weighted scoring method (referred to hereafter as the T-W
technique)forratingskeletalage"Thenumericalscoreassignedto
each bone was standaxdized from hand and wrist roentgenograms of 2"564
healthy British children of average soeio-eeonomíc status ' The assess-
ment procedure requires a close inspeetion of eaeh of 20 bones in order
to ensure that they meet the criteria of a defined stage ' The indivi-
dual scores are summed and the total seoÏe rs read off against a sex-
specific scale to provide a skeletal age ratlng"
several evaluations of the various methods of skeletal rating have
been made" MAINLAND ('55, '54) cornpared the methods of TODD' and PYLE
and her associates, finding that in the hands of an inexperienced ob-
server, TODD's method was more accurate than PYLErs" WEINER' and
THAMBIPILLAI('52)alsoobtainedmoreconsistentresultsusingTODDls
technique "
ACHESON, FOWLER, FRY, JANES, KOSKT, iJRBANO and VAN DER WERFF TEN
BOSCH ('63) studied the reliability of assessing skeletal maturity from
hand and wrist roentgenoglams using the Atlas of GREULICH and PYLE (t59)'
The experiment involved six experienced and two less experieneed ob-
servers rating skeletal age on 50 hand and wrist roentgenogTams of chil-
drenagedbetween2and18years"Theyfoundthatasingleassess-
nentofskeletalagewassatisfaetory,althoughsomevaríationin

-11-
skeletal rating occurred between experienced observers. The results
of this study suggest that the caÏpus should be ignored in difficult
assessnents as it is subject to pronounced maturatronal variability"
PRYOR ('07) questioned whether the variability ín carpal ossifi-
cation had a genetic basis" However, he stated that illness or in-
adequate diet had frequently been proposed to explain for the delay in
""tp"t ossification. This has been substantiated by more recent in-
vestigators who include ACHESON ('60), and ACHESON, FoWLER and JANES
('62) "
GARN, ROHMANN AND BLE¡4ENTHAL ('66) stated that the ossification
sequence polymorphism and sexual dimorphism are prevalent in the post-
natal skeleton" They favour a genetical explanation for common se-
quence polymorphisms" From studies in Guatemala, GARN ('65, '66)
found that while ossification timing could be delayed by malnutrition'
ossification sequence was litt1e affected"
DREIZEN, SNODGRASSE, PARKER, CURRIE and SPIES ('54J found that
chronic nalnutrition retarded aIl of the 28 centres which they observed
in the hand, but not all to the same extent" The most generally re-
tarded centres were the niddle and distal phalangeal epiphyses. The
capitate and hanate were the least retarded"
HEWITT, WESTROPP and ACHESON ('55) and DREIZEN, SNODGRASSE' WEBB-
PEPLOEaTdSPIES('58)Statedthatthecarpuswasrnostsusceptibleto
interference in rnaturation because of environmental vicíssitude"
Retardation of skeletal maturation in chinese and west African
children (CHAN, CHANG and HSIU, '61; MASSE and HUNT, 163) was found to
be intimately related to the nutritional status and environmental con-

-r2-
ditions. However, the sequence of ossification appeared normal"
BALDWIN, BUSBY and GARSIDE ('23), WALLIS ('31), BAYER and NEWELL
('40), GARN ANd ROHMANN ('59, f6O) ANd JOHNSTON ANd JAHINA (165) WETE
all concerned about the bias in skeletal age assessment introduced by
the carpal bones. However, TANNER et a1. ('62) justified the heavy
weighting of carPals,
FRY (t68) compared the Atlas and T-W techniques" He concluded
1¿',rat t,one cannot say if one techníque is cotrect ar the other ineonrect'
aLthough ín theony the T-l,l techvtique by íts painstaking eonsidenation of
tuenty bones in the Lnnd. and uv'ist should offet' far gz'eater pnecis'Lon
than the hoListíe appnoach of the Gr,euLich and eyLe AtLas teehnique't.
The comparison showed that skeletal age judged by the G-P Atlas was,
on the average, advanced by about one year compared with age assessment
by the T-W nethod.
ROCHE and JOHNSoN ('69) conpared seven different methods of ratíng
area skeletal ages from individual bone skeletal ages " One method
which involved a systen of selection and weightíng based on the method
of TANNER et aI, ('62) showed a significant difference to the other
nethods until ossification had occurred in every carpal bone" Their
findings suggested that any method excluding the carpal bones wilI not
alter appreciably the mean area skeletal ages "
OSSIFICATION EVENTS
The objective of the present investigation ís to relate the timing
of ossification events readily observed on the hand and wrist roentgeno-

- r5-
grams in Australian Aborigines with the timing of rnaximum growth in cer-
tain craniofacial dimensions. ABBIE and ADEY (r53b) have published the
times of hand and wrist ossificatíons in an Australian Aboriginal tribe'
Fromtheircross-sectionalstudytheyfoundthatthetinesofossifi-
cation fel1 within the European range. The results indicated that in
conmon with other populations, females showed earlier ossification than
males. They noted that in Aborigines' ossification of the hook of the
hamate, tubercle of the scaphoid, pisiform' rídge of trapezium and
sesamoidsoccurduringthecircumpuberalperiod"Inthemalethe
pisiform centre appeared at about the same time as the sesamoids oppo-
site the head of the first metacarpal, while in the female it ossified
3 - 4 years before the sesamoids '
The adductor and flexor sesamoid bones of the thumb have received
ag]eatdealofattention,althoughearlystudiesreportingtheossifi_
cation timing were based on snall samples" BALDWIN (t28), TODD ('37) '
BUEHLandPYLE('42),JOSEPH('51)'GARNandROHI"IANN('62)andBJöRKand
HELM('67)reportedthetirnesofappearanceoftheadductorandflexor
sesanoids. These studies are summaxized in Table i- below"
TABLE 1-
Average tinebones of the
of appearance of adductor and flexor sesamoid
thurnb in Caucasoids reported by various authors
Investi gator
Age ín Years
Girls Boys
Baldwin ('28)Todd ('37)Buehl and PYle ('42)Joseph ('5f)Garn and Rohmann ('62)Björk and HeIm ('67)
10-147I "710"1_IO_T210"511.5
T2-L6t2 "7L2"L2-L2.13"
7
156)

-r4
FLORY('36)statedthatpuberalonsetcouldbepredictedfairlywell
bytheonsetofcalcificationintheulnaandflexorsesamoids.The
sesamoids ossify in girls about two years before the first menstruation"
BJöRK and HELM ('67) found that on the average the sesamoids appeared
two and a half years before the first menstruation"
BJöRK and HELM ('67) in a study of the tining and prediction of
naxirnumpuberalgrowthinbodyheight,foundacloseassociationbetween
theagewhenmaximumvelocityingrowthofbodyheightoccurredandthe
agewhentheulnanetacarpophalangealsesanoidofthethumbossified"
They found that the sesamoid did not ossify after rnaximun puberal skele-
tal growth, but usually it ossified one year before" As a consequence'
they concluded that presence of ossification in the sesamoid would in-
dicatethatmaximumpuberalskeletalgrowthwasimminentorhadbeen
reached.
It would seem then that ossification of the sesamoid is a fairly
clearindicationthatthepuberalgrowthperiodiscommencing'parti-
cularly as JOSEPH (t51) showed that the pollex sesamoids were found in
100% of adults.
CRANIOFACIAL GROWTH STUDIES
The first cross-sectional cephalonetric analysis of faciat growth
inAustralianAborigineswasreportedbyCRAVEN('58),Heanalysedthe
lateral cephalometric roentgenograms of 56 Central Australian Aboriginal
children and young adults from the Hernannsburg and Haast Bluff settle-
nents.ThesefilmswerepreviouslyobtainedbyHEATH(,47)"The

-15-
subjects were of mixed tribal origin. Mean values, Sex differences
and age changes were determined for many craniofacial variables and t'he
resultswerecomparedwithagroupofSwedes'Bantus'andNorthAmeri-
canWhites"AlveolarprognathisnwasmostmarkedintheAustralian
Aboriginal,andincontrasttotheotherethnicgroups,itincreased
with age"
BARRETT,BROWNandMACDONALD(163a)obtainedlinearandangular
measuïements fron tracings of lateral head roentgenograms of 58 young
adult Australian Aborigines - 31 males and 27 fenales, in order to
measurethedegreeofprognathism.Prognathismwasdescribedintwo
ways:bytheconventionalcraniometricgnathícindexandbyangular
measurements. comparisons were made with the findings of previous
studies of Aborigines (CRAVEN, ,5g) and other ethnic groups (s-Tönx , '47 i
BJöRK and PALLING, '54i KAYUKAWA, '57)" The most striking character-
istic was the marked degree of alveolar prognathisn of both jaws ín the
Aus tralian Aboriginal "
BROWN and BARRETT ('64) reported further on the facial morphology
and the sex difference in certain facial dirnensions of the sane young
adultgroupofAustralianAborigines"Averagevaluesoffaciallinear
measurenents, particularly in the lower face, were greater ín rnales than
females" However, there were no significant sex differences in facial
shape, as expressed by nean angular variables '
Inamoredetailedreport,BROWN('65)employedcorÏelationand
regression analyses and related prognathism to cranial base morphology
and to the si ze and shape of other dentofacial structules ' Early studies
in the series of reports on the dental and craniofacial characters of

- 16-
the Wailbri (BARRETT, BROWN and FANNING' *65) i^iere concerned main)y
with adults" However, GRESHAM, BROWN and BARRETT ( t65j compared the
skeletal and denture patterns of Ausrralran Aborrgl-nal chi'Idren with
those from Merbourne, New zealanð and North Amerrca. Forty-four
Aboriginalchildrenwereselectedforthestudyt()matchtheor-her
populationsinageandsexdistributron;theiTãge.rangedfromz-9
yeaTs.Themostmarkeddifferencebetweenthegroupsofchildrenwas
the proc.lination and forward posj-tion of the rncrsor teeth in the
Australian Aboríginal'
ComputertechniquesadoptedbytheAdelardeUnrversrtyGrowth
Study (BARRETT, BROWN and SIMMONS, n66j made it possible to apply
multivariatetechniquestocheanalysisofeephalometrrcdataIBROWN,
BARRETT and DARROCH, '65a) and to use factor analysrs for colnparrsons
between two ethnic groups (BROWN, BARRETT and DAR'ROCH"'65b) "
BROWN ('67) used factor analysis to disctose sources of eo^
ordinationwithinthecraniofacialeomponents.Heobtainedstandard_
ized Iateral and postero-anterlor roent.genograms of' 100 Australian
Aboriginal Male skulls housed in the south Australran Museum' Adelarde'
Measurements were taken directly from the skutLs or drrectly from the
cephalometric roentgenograms'
BARRETT, BROWN and McNULTY ('68) described eomputer techniques
forco-ordinateanalysisoflinearandangularmeasurementsof
cephalometric roentgenoglams. McNULTY, BROWN and BARRETT It68) em-
ployedthisco-ordinatesystemofcephalometr.l-canalysisbasedont.he
mesh díagram method of MOORREES and LEBRET i'62J to study the cranio:
facialmorphologyof6syoungadultCentral{¡5tralranAborrgines.

-77 -
McNULTY ('63) in a rnore detailed study examined the overall growth
changes in facial morphology, and showed that specific differences ex-
isted in the pattern of growth between males and females.
A nunber of reports on cephalometric analyses of other ethnic
groups appear in the literature " An attempt is made to highlight in-
vestigations relevant to the present study"
BROADBENT (',37), BRODIE ('41,'53), BJöRK (',47,'53, '540'55) and
LANDE (t52) analysed craniofacial growth from serial lateral roent-
genograms of the head" They all used reference lines for the orien-
tation of records which were registered on various cranionetric points "
However, these methods have their limitations as all landmarks in the
head are subject to growth changes in shape and position" ABBIE (163a,
t65b) has suggested that the anthropometric point hormion, located near
the base of the pituitary fossa, has considerable clains for attention
as an inportant fixed morphological point on the grounds that it ap-
proximates the location of the notochord tip '
BROADBENT('37)publishedresu]tsofhisinvestigationonthe
growth of the human face" This cross-sectional study included 50 girls
aged between 3 years and 18 years, and 50 boys between the ages of 3
years and 12 years" All subjects were enrolled in the Bolton Study"
Results indicated that the face grows in a downward and forward di-
rection away from the cranial base'
BRODIE ('41) reported the results of a longitudinal study of head
growth fron serial cephalometric roentgenograrns. The material, con-
sisting largely of BROADBENTTs collection of cephalonetric roentgeno-
grams, conprised 14 sets of serial head plates taken on 2I males between

-18-
the ages of 3 months and 8 years. The brain case, as well as nasal,
upper alveolar and mandibular areas were studied separately" He in-
dicated that the shape and form of the skull is determined at about
the third month of life. Growth of the various areas appeared to be
so integrated that the various reference points were displaced along a
series of straight lines.
LANDE (r52) found fron his cephalonetric roentgenographic analysis
of 34 boys from the Bolton study, aged between 3 and 18 years, that the
rates of growth in the mandible and maxilla differed" The convexity
of the face almost always decreased with age after seven years, due to
an increase in mandibular prognathism'
BRODIE ('55) studied growth of the head in a group of 19 boys aged
between g and !7 yeats from whom serial cephalonetric roentgenograms
were available" It was evident that the individual pattern of growth
was consistent. The nasal floor showed a strong tendency to renain
stable throughout the growth period and the junction of the pterygoid
process and the maxillary tuberosity was the most stable region in the
face.
s.tönx (,47) investigated facial prognathism in 322 twelve year
o1d boys and 281 males aged twenty-one years. Increase in mandibular
prognathism was slightly more accentuated than the increase in naxillary
prognathisn" As a consequence, a straightening of the facial profile
occurred with an increase in age. This was attributed to the greater
rate of increase of the ra¡nus height"
In a follow up study (¡"1önf, '53, '55; BJöRK and PALLING, '54) of
243 twelve-year oId Swedish boys, who were re-examined at the age of

-19-
20 yeats, correlations were determined between measurements of cranial
base flexion and prognathism" DAVENPORT and RENFROE (r40) used seríal
roentgenogïans to study the development of se1la turcica in 46 boys and
50 girls ranging in age from 10 to 18 years. They found that the sex
difference in mean area of the sagittal section of sella turcica was
established early, as the same annual increase in both sexes occurred
between 12 yeats and 18 Years "
FRANICIS ('48) studied growth changes in the pituitary fossa in a
group of 418 foetal skulls, 400 living white subjects, 39I living Negro
children and 1,131 adult skulls. Age lange extended from the fifth
foetal month to old age" The pituitary fossa was found to grow rapidly
during both the foetal period and the first year of postnatal 1ife. A
brief pre-adolescent spurt interrupted a less rapid but uniform child-
hood growth. Adult dimensions were attained at about the eighteenth
year.
g"Iönr (t55, ',63, ',64, '68) studied facial growth by means of
metallic implants inserted into well defined areas of both the mandible
and maxilla" He noted the cranium was almost fully developed in size
before puberty; in contrast, growth of the face continued to a con-
siderable extent during adolescence" Metallic inplants and serial
cephalonetric roentgenograms made it possible to illustrate the varia-
tions in the pattern of growth in the mandible and maxilla"
MEREDITH ('5S) reported a longitudinal study of nose height in 80
children, 38 boys and. 42 girls , aged between 5 and 12 yeats" He found
that genetally an adolescent spurt occurTed, but stressed that a con-
siderable degree of individual variability existed. SUBTELNY (r59)

-20-
confirmed these results in his serial cephalometric roentgenographic
analysis of 15 males and 15 fenales aged 3 months to 18 years "
Ir4AJ and LUZI ('64) studied mandibular growth of L2 boys and 16
girls from serial lateral roentgenograns of the head taken annually from
age 9 to 13 years. They showed that fenales exhibited a greater in-
crease in size of the mandible than boys" This difference was due to
the fact that, in fenales the relative increase in the height of the
rani is about one third greater than males " There was no significant
relationship between the growth increments of the mandibular body and
rani " An attempt was made to predict mandibular growth on the basis of
the gonial angle value"
TRACY, SAVARA and BRANT ('65) utilized co-ordinate analysis in a
longitudinal study on the interrelations of five dimensions of the man-
dible in 27 girls. The dimensions hlere related to height, width and
depth of the mandible" Analyses demonstrated that the mandible was
not interrelated in height, width and depth"
In a mixed longitudinal cephalometric study SINGH and SAVARA ('66)
analysed the maxillary growth of a group of 50 girls aged between 3
yeaïs and 16 years. They stressed the importance of utilizing di-
mensions that strictly define the maxillae and selected seven dimensions
for analysis" Growth changes in the naxillae were most marked in
measures of height, less in length and least in width"
MAJ and LUCCHESE (t69) reported a serial cephalometric roentgeno-
graphic analysis of facial growth in 13 boys and 14 girls from age 9
years to 17 years " They studied seven linear and two angular dinen-
sions in the face, and an analysis of the relations between these vari-

-2I-
ables revealed that the inclination of the nandible was a prine fac-
tor in affecting the antero-posterior position of the jaws"
THE RELATION BETWEEN SKELETAL MATURATION AND FACIAL GROWTH
The relation between skeletal maturation and facial growth in
Australian Aborigines has not previously been reported"
In order to study the rates of growth in the face NANDA ( I 55)
measured seven linear dimensions directly on serial lateral roentgeno-
grarns of the head in ten male and five female subjects from 4 - 20
years of age" The growth curves of all facial dimensions hlere typical
of general skeletal growth curves. However, the time of circunpuberal
naximum growth was slightly later in facíal dimensions than in body
height" In this smal1 sample, girls showed relatively less facial
growth than boys during adolescence "
ROSE ('60) used cross-sectional material to study the relation
of area measurements of the face to several body dimensions ' The
analysis was restricted to individuals aged 9 to 18 years " The facial
areas were neasured directly with a planimeter, The results showed
that stature and body weight were more effectíve guides to facial de-
velopment in the circumpuberat period than chronological or skeletal
age.
BAMBHA ('61) made a quantitative analysis of five skul1 neasure-
ments on serial lateral cephalometric roentgenoglams of 25 boys and
25 girls enrolled in the growth study at the Child Research Council in
Denver. The study revealed that the face followed the characteristic
skeletal growth pattern, including distinct adolescent changes" The

') ')
time of the maximum growth spurt in the faee usua-lIy occurred a little
after the spurt rn body height-" The faee eontrnued to show a small
increment of growth after the growth in body height had been cornpleted"
Compared with boys, girls had smal-ler absolute neasurements, â Slower
rate of growth and tended to mature about 2 - 3 years earlier"
BAMBHA and VAN NATTA ('63') in a longìl-rrdinal study of skeletal
maturation and facial growth du:r:rng adolescence employed only one di-
mension, sella-gnathion [s-gn) e as a measure of the time of maximum
growth in the faee. They found an assoe.íation between skeletal matu-
ratíon and faeial growth during the adolescent period at the two ex-
tremes of skeletal development. Indivicluals who showed advanced skele-
tal maturatron revealed an early adolescent facial spurt, whíIe those
with retarded skeletal maturation tended to mature later. There was a
wide variation between these tù/o groups "
In three separate studies JOHNSTON, HUFHAM, MORESCHI and TERRY
('65) compared skeletal maturation, cephalofacial development and
chronologic age" They found that eertaín cephalofacial parameters
were elosely related to the plocesses of skeletal mat'uration" lt was
clearly demonstrated that spurts and lags in maturat-íon actrvíty in the
nandible wer.e aecompanie.d by similar spurts and lags in some aspect of
growth. A delay in skeletal maturation was often found to be assocí-
ated with a particular kind of maloeclusion'
A serial investigation of facíal and statural growth in 25' seven
to twelve year o1d children by PIKE ('68) showed that in all indíviduals
a elose approximation to a eonstant rate of growth occurred in stature
and in the faeial dimensions studied.

-23-
HUNTERTs ('66) longitudinal study on 25 males and 34 females from
seven yeaïs up to adolescence comprises the most comprehensive group
from the files of the child Research council in Denver" seven linear
measurernents were used to evaluate the growth of the face " The tine
of peak velocity in height was determined for each subject fron the in-
cremental growth curve derived from his anthropometric measurements "
Skeletat age was used to calegotize subjects into retarded, average, and
accelerated groups. Results showed that naximum facial growth was co-
incident with maximum growth in height in the majority of subjects' This
differed slightly to the results of NANDA ('55) and BAMBHA ('61)'
SINGH, SAVARA and MILLER (r67) examined the size relationships of
selected face and body dimensions at two year intervals in a nixed long-
itudinal study of 33 girls from 6 to 14 years of age" The facial and
the body dinensions revealed no consistent relationship. stature, calf
bone width, weight and body surface area appeared to be the best indi-
cators of facial develoPment.

CHAPTER ÏÏ
MATERIALS AND METHODS
I. MATERIAL
The relations between ossification of selected bones of the carpus,
and the timing of maximum growth in stature and facial dimensions were
studied in 88 Central Australian Aborigines - 52 males and 36 females,
aged between 8 and 18 years. Observations of ossification events and
measurements of facial dimensions were obtained frorn standardized roent-
genograms of the hand and wrist area and head"
The subjects studied belong mainly to the Wailbri tribe of Aus-
tralian Aborigines living under settlement conditions at Yuendumu, 185
mites north-west of Alice Springs (Fig.2) " A few Pintubi children were
included in the gïoup. All subjects were of pure aboriginal ancestry'.
so far as can be ascertained. The settlement was established by the
Commonwealth Government in 1946 to provide food, clothing, medical care
and schooling for Aborigines living in the region"
Within the settlement conpound at Yuendunu there are houses for ad-
ministrative staff, a sma1l hospital, school buildings, a large dining
hall and kitchen, stores and workshops" The hospital and infant wel-
fare clinic are staffed by trained nurses who attend to the immediate
medical needs of the community and supervise the care of pregnant wonen,
babies and small children"
Most fanilies live in homes provided by the Governement" However,

Yuendumu Reserve
Darwin
NORTHERN
TERRITORY
oAlice Springs
t:
ArnhemLand
âz-¡(nzf¡¡r¡¡
-)q
SOUTH AUSTRALIA
-Jút-U)Þ
zúl&¡F(t')f¡¡
Location of Yuendunu Settlement.(Courtesy Dr. T. Brown, 'Dept. of Dental Science,University of Adelaide, Adelaide, South Australia)
Fig. 2

-26-
those who prefer primitive living conditions build crude shelters away
from the Settlenent compound. Although the majority of adults are em-
ployed by the Government on the settlement, some are engaged on nearby
cattle stations or on a mining enterprise in the vicinity. Further in-
come is derived from maternity allowances, child endowrnent, and age and
invalid pensions.
The Settlement staff provides low cost meals daily at the comnunity
dining hall. However, those Aborigines able to pay for food supplies
at the settlement store often prefer to cook for thenselves '
Prior to 1946, most Wailbri were following a simple hunting and
food gathering wdy of life" However, under settlement conditions,
European influence has imposed different environrnental conditions which
provide a unique opportunity of studying a geographicalty isolated
tribe of Aborigines.
TINDALE ('53) reported that in 166 narriages of members of the
wailbri tribe only 8eo were with members of other tribes " He regarded
this tribe as a fairly homogeneous group" It is highly likely that
the communitY is inbred.
PREVIOUS STUDIES OF THE WAILBRI
various aspects of the general anthropology of the wailbri have
been published by GAPELL ('52), ABBIE and ADEY (t53a,r53b, '55).
SIMMONS, GRAYDON and sEMPLE (r54), CLELAND and TINDALE ('54)' POIDEVIN
('57), SCHULTZ ('58), ABBIE ('57, r61a, r6lb, '63c, ',66,'67), and
MEGGTTT (',62) .

-27 -
professor T.D. Canpbell first visited the Yuendunu Settlement in
1951. He regarded the Settlenent as especially suited to dental
studies (BARRETT, t65) and as a result annual expeditions have been
nade by members of the Departnent of Dental Science, The University of
Adelaide. .Earlier studies reported were mainly concerned with the
effects of changing environment (CAMPBELL and BARRETT, '53; CAMPBELL,
SIMPSON, CORNELL and BARRETT, '54; CRAll, '55; BARRETT, '64, '69),
and oral physiology (BARRETT,'56a) .
ora1 conditions in the Wailbri have also been investigated. Parti-
cular attention has been directed to dental fluorosis (BARRETT, ' 56b) ,
gingival conditions (BARRETT, t53a; CRAN, '55, ',57), diet and dental
caries (BARRETT, t53a; CRAN, '59, r60a), histology of the teeth (CRAN,
'60b), oral nicrobiology (CRAI'{, t64) and oral pignentation and oral
disease (READE, '62, '64).
Tooth morphology and dental occlusion in the Wailbri have been
studied extensively by BARRETT and his colleagues. The enphasis has
been on the metric characters of the permanent and deciduous dentitions
(BARRETT, BROWN and LUKE, '63; BARRETT, BROWN and MACDQNALD, r63b;
BARRETT, BROWN,ARATO AND OZOLS, '64), the size and shape of the dental
arches (BARRETT, BROWN and lvlACDoNALD, '65; BARRETT and BRQWN, '68;
CHENG, '70), the patterns of tooth attrition (BARPüTT, t55a, '60, t69),
functional tooth occlusion (BARRETT, r53b, t57a, '58) and the sequence
of rooth eruption (BARRETT, t57b; BARRETT, BROWN and CELLIER, ',64i
BARRETT and BROWN, '66).
Two further aspects recently investigated are variations in crown
morphology of prirnary teeth (KUUSK, t70), and patterns of growth in

-28-
height (BROWN and BARRETT, '70).
in 1961, the nethodology of the study was extended to include a
selection of anthroponetric body measurernents, standardized hand and
wrist and cephalo¡netric roentgenograms. Consideration was given to
variations in the relation between skeletal maturation, the dental
arches and craniofacial structures. As sufficient records had not
been accumulated, previous investigations have been closs-sectional
and nixed longitudinal, and concerned mainty with craniofacial mor-
phology in adults only. These reports deal with facial and alveolar
prognathism (BARRETT, BROWN and IvÍACDQNALD, t63a; BROWN and BARRETT,
,64; BROWN, '65), the use of factor analysis in cranionetric research
(BROÌ,{N, BARRETT and DARROCH, r65a, t65b), and the application of auto-
matic methods of measurement with the use of co-ordinate system of analy-
sis (BARRETT, BR0WN and McNULTY, '68; McNULTY, BROWN and BARRETT, '68;
McNULTY, '68).
A preliminary conparison of facial characteristics in Australian
Aboriginal children and children from Melbourne, New Zealand and North
Anerica has been made by GRESHAM, BROWN and BARRETT (165).
SELECTION OF SUBJECTS
The following criteria were strictly adhered to in the selection of
subjects.
1. Pure aboriginal ancestrY.
2" A recorded and confirned birth-date.
3. An age range of 8 - 18 Years.

_29_
4. An absence of physical deformity"
5 " A minimum of three serial hand and wrist roentgenograms.
6, A ninimum of four serial lateral cephalometric roentgenograms
obtained with the teeth in occlusion.
over I,615 single casts, 1,070 cephalonetric roentgenograms and
hand and wrist roentgenograms have been collected since the longitudinal
growth study began.
The naterial used in the present study is listed in Tables 2 and 3,
indicating the number of records available and the distribution of hand
and wrist and lateral cephalonetric roentgenograms according to chrono-
logicat age of the subject. The appearance of ossification events and
facial growth velocity calculatíons were recorded prior to the field
expedition during May, 1970. Hand and wrist roentgenograns obtained
in 1970 were included only for those subjects in which ossification
events had not appeared or hrere uncertain. Lateral head roentgenograms
obtained in 1970 were included only if they increased the sample size
when the criteria for selection of peak growth velocity were applied
(Chapter 5).
Although this study is concerned mainly with the relation between
skeletal maturation and craniofacial growth, it seems relevant to dis-
cuss briefly the dental state of the subjects. Important features are
discussed in Appendix A.

- 30-
TABLE Z(a). Distribution of subjects according to the numberof serial hand and wrist roentgenogra¡ns.
Nunber ofSerialRecords MaIe Female
TotalSubjects Filns
3
4
5
6
7
2
19
16
15
8
7
11
9
1
10
26
27
24
1
30
104
135
r44
7
Total 52 36 88 420
TABLE 2(b). Distribution of subjects with hand and wristroentgenograns accolding to age.
Age Males Females TotaL
8
9
10
11
t2
t3
L4
15
16
t7
18
T7
22
31
40
4t
44
50
13
10
4
1ó
2L
29
26
28
18
t4I6
2
33
43
60
66
69
62
44
2L
16
6
Total 252 168 420

TABLE 3(a).
-51-
Distribution of subjects according to the nunberof serial lateral cephalonetric roentgenograns.
Nunber ofSerialRecords Matre Female
TotalSubjects Films
3
4
5
6
7
8
2
9
7
15
15
4
4
5
5
11
8
3
6
t4
t2
26
23
7
18
56
60
1s6
L61
56
Total s2 36 88 507
TABLE 3(b). Distribution of subjects with lateralcephalonetric roentgenograns according to age
Age Ma1es Fenales Total
8
9
10
11
L2
13
t4
15
16
L7
18
25
27
37
40
40
4s
36
27
18
10
I
t7
22
30
28
30
24
19
t4
11
7
1
42
49
67
68
70
67
55
4L
29
t72
Tota1 304 203 507

-32-
II. METHODS
For descriptive purposes, the methods are divided into
(1) General nethodology, (2) Roentgenographic methods, (3) stature,
(4) Hand and wrist ossification events, (5) Reference points and
reference 1ines, (6) The variables studied, and (7) Statistical methods"
The exact nethod of measuring stature, assessing skeletal age and
the presence of ossification events and the measurement of individual
craniofacial components are described in later chapters.
(1) General MethodologY.
Statural observations were obtained from the somotornetry record
forms which are kept with the roentgenoglams, photographs and casts in
the Dental Anthropology Laboratory of The University of Adelaide"
Recording of observations
A data sheet was designed for recording all observations of the
study. This form is ídentified as Dentgro Project, Skeletal Maturation
Study, Form 7, and is illustrated in Appendix B. The data recorded on
each sheet represented the observations for a field trip of a particular
subj ect .
The ossification events appearing on hand and wrist roentgenograms
were recorded on data card 1, and stature as well as all ¡neasurenents
derived from lateral cephalometric roentgenograns hrere recorded on data
card 2. Colunn 80 on data card 2 was used to identify the year of the
trip in order to facilitate the calculation of the time interval between
observations with respect to the selection of maximun velocity.
To reduce errors, observations lrrere recorded directly on the data

-33-
sheets after the subjectrs identification nunber, sex, chronological
age and trip record number had been checked. All observations were
entered carefully on the data sheets in red ink and subsequently trans-
ferred onto standard 8O-column punched cards by operators in the Com-
puting Centre of The University of Adelaide. In the Dental Anthro-
pology Laboratory the data deck vüas appropriately arranged and a
computer listing was nade to facilitate the detection of any renaining
punching errors.
(2) Roentgenogra Methods
The roentgenograms were taken under field conditions at Yuendunu,
using conventional equipment modified to suit the requirements of the
study. These nodifications have previously been described by BROWN
(t65). However, the radiographic techniques used followed closely
accepted nethods previously publíshed (KRQGMAN and SASSOLJNI, '571
SALZMANN, '61).
A Watson Victor Model Konrad 5T X-ray machine, modified for use
in the field was used for both hand and wrist roentgenograms as well
as for lateral cephalonetric roentgenograms. The power supply avail-
able at the Settle¡nent was a reasonably stable 240 volts A"C. This
was generated by a 20 KvA alternating current generator powered by a
diesel motor.
CePhalostat
M.J. Barrett designed the head-holder (Fig. 3) . It was sinilar
in design to that suggested by e.lönX ('50). The main frame was cast
in aluninium. The ear rods were fitted with wooden supports fastened

--r.tllooo
Fig. 3. Head holder used during field studies at Yuendumu

-35 -
to a lever system which moved both left and right ear rods simul-
taneously. This nethod ensured that the nedian sagittal plane re-
nained constant for all subjects regardless of age or head-breadth"
The head position was made more secure by using a median nasion
rest which was adjustable in both vertical and horizontal directions.
An orbitale indicator was also fitted to the cephalostat. This was
used for checking head orientation after rotation of the subject for
postero-anterior fil¡ns .
The cephalostat and the X-ray head were assenbled on steel frames
which were prefabricated and securely bolted to the floor following
test exposures for correct alignment.
Soft Tissue Contrast
An alu¡ninium wedge 250 mm x 65 nm x 20 mn tapering to 1 mm was
placed between the facial profile and the filn at the tine of exposure
of the lateral filns. As a result, the soft tissue profile was clearly
evident without any impairment to the definition of the underlying bony
structures.
Positioning of Subjects
For the hand and wrist roentgenograns the subjects stood in line
with the screen behind the cassette holder and the right arn extended"
The film was held against the screen by the right hand and wrist" The
fingers were slightly separated (Fig. 4). If the wrist appeared dis-
torted the subject was asked to stand a little behind the screen. This
position corrected the wrist distortion without causing a great deal
of confusion to the subject.

--, ar-D -D
I.
IJ
alaaa {aaaÒaa* aa
Fig. 4. Subject positioned for hand and wrist roentgenograrn

-37 -
For head roentgenograms, the subject was seated on an adjustable
stool, so that.the leveI of the external accoustic meati could be ad-
justed to the height of the ear rods of the cephalostat" The seated
subject was positioned in the cephalostat and the head was fixed by
means of the ear rods and nasion support after a natural head position
was obtained. This was best accomplished by asking the subject to
focus his eyes on a spot on the far wall at eye level"
Although this report is linited to the results obtained from
hand and wrist filns as well as lateral head fil¡ns taken in the tooth
position, other exposures were nade during each expedition for future
study.
The tooth position radiographs were obtained by asking the sub-
ject to hold thin strips of paper between the back teeth on both sides
simultaneously. Wherever possible the tooth position was visually
checked before the radiograph was exposed. In practice it was found
that it was best to avoid using verbal directions to bite or close as
this very often caused confusion for the subject, particularly those
with poor cornmand of Engtish. In a significant nunber of subjects
the teeth did not interdigitate maxinally on right and left sides to-
gether. This occlusal condition, which is due to a dispatity in the
widths of upper and lower dental arches is being studied further by
the Adelaide Dental Anthropology Group. BARRETT ( ' 58) hras the first
to describe this occlusal condition in the Wailbri' However, it was
subsequently found in a different group of central Australian Aborigines
by HEITHERSAY (t61). Further¡noÎe, these occlusal relations have been
described by BEYRON ('64) and subsequently noticed in other ethnic

-38 -
groups.
Specification of X-raY Beam
For each hand and wrist roentgenogram the cone of the x-ray
machine was centered over the head of the third metacarpal bone at a
distance of 100 cm for the expeditions from 1961-1966 and 195 cn
frorn 1967-1970.
The anode to median sagittal plane distance was kept constant
for all subjects at 180 crn. BJöRK ('50) suggested a median sagittal
plane-filn distance of 10 cms. However, this distance proved to be
impracticable with nany subjects because the cervical portion of the
vertebral column of the Australian Aborigine is considerably shorter
than that of the European (WOOD-JONES,. '58). As a consequence' shoul-
der interference with the lower margin of the cassette holder forced
the subject into an unnaturat sitting posture. Therefore, the median
sagittal plane to film distance was set for all subjects at 15 cm to
ensure they could be seated comfortably'
The above distances produced a calculated enlargenent of 8"Seo for
linear structures situated in the median sagittal plane.
Filn TYPe
Fron 1961 to 1969, all hand and wrist, and head exposures were
made on Kodak Blue Brand safety Filn, 20 cm x 25 cm (8'r x 10") and
25 cm x 30 cn ([Qrr x 12tr) respectively. Alignment tests were made on
standard periapical dental filns. In 1970, fihn processing was
changed fron manual to automatic and Kodak RP/s x-omat Medical x-ray
fifun with a tinted estar saftety base was used" Watson Victor Kontak

-59 -
cassettes fitted with two Dupont stainless steel fast speed inten-
sifying screens were used.
Before the subject pïesented for the roentgenographic survey, six
cassettes were loaded. This permitted repeat exposures to be ¡nade
without unduly disturbing the subject.
Lead numbers, clipped to the corner of each cassette, identified
exposed films with the subject's expedition number'
Filn ExPosure Data
Hand and wrist and lateral head roentgenograms of a satisfactory
quality were obtained on all subjects on each expedition from 1961-1966
and 1961-1969 respectively when the following average settings were
used.
Hand and Wrist Roentgenograns 50 Kv 20 MA 0'5 sec'
Lateral Head Roentgenograns 78 Kv 15 MA 0.5 sec.
However, with the change in hand and wrist roentgenographic methods
in 1967 and with the introduction in 1970 of the new type film which is
best suited to automatic processing, the following settings were en-
ployed.
Hand and Wrist Roentgenograms 70 Kv 30 MA 2 sec'
Lateral Head Roentgenograns 80 Kv 20 MA 0.6 sec'
During the period of the field survey test filns were developed
fron time-to=ti¡ne and if necessary adjustnents made to the exposure
data, Furthermore, films were air freighted to Adelaide for processing
and report (qualitY control).
On each trip the X-ray unit, the operator, and the work area were
monitored for radiation and found to be well within accepted safe

-40-
levels. Nevertheless, as a precautionary neasure all subjects were
covered by a lead apron during exposure to radiation"
Filn Process:-ng
The roentgenogra¡ns were developed in Kodak liquid X-ray developer
Type 2, and fixed in Kodak liquid X-ray fixer according to the recom-
mended tine-temperature specifications of the manufacturers. A final
wash of about one hour was given in clear running water, after which
the filns were allowed to dry at roon tenperature. The hand and wrist
roentgenogran and the set of head roentgenograms were placed in a sepa-
rate manilla folder. However, each folder supplied the same information,
namely, the subjectrs delta number, l1e and expedition number. AI1
roentgenograms were filed in delta number order and each subjectrs re-
cords were filed in order of trip. These records were always avail-
able for immediate perusal in the Dental Anthropology Laboratory"
Automatic filn processing was used for the 1970 film exposure"
This unit*, which is housed in the Radiology Department of the Adelaide
Dental Hospital, greatly simplified filn processing as all roentgeno-
grams were uniformly developed in several hours.
The unit was program¡ned so that all films were in Ilford Phenisol
X-ray developer for two minutes, washed for one minute and in Ilford
Hypan X-ray rapid fixer for four ninutes. They were washed again for
four minutes and noved into a drying cabinet for five minutes before
each film was released from its hanger and returned through a shute in
* Refrema Processing Unit, manufactured in Sweden.

-41-
the viewing area. The hanger was autonatically fed back to the loading
position.
Hypan hardener was added to the fixer in order to prevent scratching
of the filns.
(3) Stature
Height was measured using an anthropometer (Fig. 5) with the sub-
ject standing in a relaxed position,. eyes directed horizontally.
One observer recorded height measurements on six of nine visits.
On the other three occasions different observers nade the measurenents
following the standard technique.
(4) 0ssification Events
The ossification events initially considered in a pilot study and
illustrated in Fig. 6 included:
* radial capping
* appearance of Pisiform
* hooking of ha¡nate
* approximation of trapezium with base of second rnetacarpal
i appearance of ulna metacarpophalangeal sesamoid of the thumb
* epiphyseal capping of proximal phalanx of the thumb
* fusion of the distal phalanges I - V
According to average times stated in the Greulich-Py1e At1as (r59)
some of these events often occur after the period of maximun puberal
growth and were, therefore, exctuded from further study. Others were
excluded because of difficulties in consistently visualizing the precise
stages in question on the radiographs.

Fig. 5. Measurement of standing height using theanthropometer constructed for field studies

hook of hamate
pisiform
fusion of all+ distal phalanges
sesamoid
epiphyseal caPPing
of proximal Phalanx of thumb
approximation of traPezium withthe base oû second metacarPal
capping of radius
Fig. 6. ossification events inspected in pretininary analysis

-44-
Finally, the following three ossification events were selected
for detailed studY:
(1) appearance of Pisiform;
(2) hooking of hanate;
(5) appearance of ulna metacarpophalangeal sesamoid of thunb.
(5) Reference Points and Reference Lines (Fig ' 7) '
The reference points we1.e located on each loentgenogram and all
measurements were nade directly on the film. All reference points
are situated in the median sagittal plane or ar.e projected onto that
plane. When doubte projection occurred nid-points of the two images
were used. All reference points and reference lines were located
according to the definitions of BJöRK ('60).
Reference Points
Articulare (ar): intersection between the contour of the external
cranial base and the dorsal contour of the condylar head.
Gnathion (gn) : lowest point on the mandibular symphysis "
Gonion (go): a point on the bony contour of the gonial angle
located by the bisection of the angle formed by the nandibular
line and the ramus line.
Infradentale (id): highest and nost prominent point on the lower
alveolar arch.
Nasion (n): ¡nost anterior point of the fronto-nasal suture"
Pogonion (pg): most prominent point on the chin"
Prosthion (pr): lowest and most prominent point on the upper
alveolar arch.
1
2
3
4
5
6
7

tst3
flt rlBt
Dr
ia
rlTt
Fig. 7. Roentgenographic reference points and reference lines

-46-
8. Pterygomaxillare (pn): point representing the dorsal surface of
the naxilLa at the level of the nasal floor. The point is located
on the dorsal contour of the naxilla, which, above, forns the
anterior limit of the pterygopalatine fossa, where this contour
intersects that of the hard and soft palates '
9. Sella (s): centre of the bony crypt known as sella turcica' The
upper limit of the sella turcica is defined as the line joining the
tuberculun sella and the dorsun sellae'
10. Spinal point (sp): (acanthion): apex of the anterior nasal spine.
Reference Lines
1. Nasion-sella line (NSL): line joining the nasion to the sella'
2, Nasat line (NL) : the straight line passing through the spinal
point and Pterygomaxillare.
3. Mandibular line (ML) : tangent to the lower border of the body of
the nandible through gnathion.
4. Ramus line (RL): tangent to the posterior border of the mandibular
ramus and through the articulare.
(6) Variables Studied
Standing height: the distance from the highest point of the top of
the head in the mid-sagittal plane to the floor (ASHLEY-
MoNTAGU, '60).
Ossification Events (Fig. 8)
Appearance of Pisiform: pisiform bone was considered present when it
was visible on the hand and wrist roentgenogran'

hook of hamate
pisiform
Stage I
Stage 2
Fig. 8. Ossification events inspected in final analysis

-48-
Hook of Hanate: hook of hamate was considered present when a radio-
opaque outline was visible within the upper section of the
hamate bone on the hand and wrist roentgenogram. Two distinct
stages of this event were recorded.
stage 1: a fine, incomplete radioopaque outline. This stage
corresponds to Tanner, Whitehouse and Healy Stage 7.
Stage 2: a distinct radioopaque outline. This stage corresponds
to Tanner¡ Whitehouse and Healy Stage 8.
Appearance of ulna netacarpophalangeal sesamoid of thumb: sesamoid
bone was considered present when it was clearly visible on the
hand and wrist roentgenogran.
Size of ulna metacarpophalangeal sesamoid of the thumb: naximun dia-
meter of the ulna metacarpophalangeal sesanoid of the thunb.
Craniofacial Dinensions (Fig. 9)
The variables listed below include measures of the cranial base,
upper and lower jaws, and various segments of the naso-rnaxillary con-
p lex.
Cranial Base
Anterior cranial base tength (n-s): the distance between nasion and
seI la.
Maxil la
Maxillary jaw base length (pm-s): the distance between pterygonaxillare
and spinal point.

ns
pm
id go
Fig. 9. Craniofacial dinensions neasured.
pr
pgogn

Mandible
Total length (Pg-ar):
Corpus length (pg-go)
Ramus height (ar-go):
-50-
the distance between pogonion and articulare.
the distance between gonion and pogonion.
the distance between gonion and articulare.
Facial Heieht
Morphological face height (n-gn): the distance between nasion and
gnathion.
upper face height (n-sp): the distance between nasion and spinal
Point.
Mandibular face height (id-gn): the distance between infradentale
and gnathion.
Middle face height (pr-id): the distance between prosthion and
infradentale.
posterior upper face height (pn-s): the distance between
pterygonaxillare and sella.
(7) Statistical Methods.
The statistical parameters - nean, standard deviation, standard
error of the nean and range (minirnum and maxirnun) htere computed for
each variable studied. In addition, associations between pairs of
variables were expressed by the coefficient of linear correlation.
Formulae of these parameters are listed in Table 4'

-51 -
TABLE 4. Statistical Parameters.
Symbol Parameter Determination
T
S
xy
e(x)
XXArithmetic mean N
Standard deviationr(x-x)
N-1
Standard error of the mean
'T
Correlation coefficient x(x-x) (Y-Y)
x(x-x) x(Y-Y)
S
r
X and Y are observed scores and N is the number of observations
To assess the significance of differences between the variances
and neans of two groups, the F-ratio test of Snedecor and the t-test
of Student were used.
For each variable studied the coefficient of variation(s )(¡ x100)
and the pearsonian neasures of skewness(/Tf and kurtosis( br)
(PEARSON and HARTLEY, '54), were calculated to provide additional in-
fornation, particularly on the shape of the distributions. These

-52-
parameters¡ howeveTr' axe not included in the Tables. Judging fron the
measures of skewness and kurtosis, nost variabl.es were"distributed nor=
nally.
AIl calculations'hrere carríed out,ott the CDC 6400 conputer situated
in The UníverqitY of Adelaide.

CHAPTER III
ERRORS OF THE METHODS
In bionetric research, it is essential to establish the degree of
accuracy of the methods empolyed. Limitations in techniques and in-
struments wilI give rise to errors of observations; If it can be es-
tablished that these errors are small in comparison with the variability
of the measurenents used, then they can be regarded as being within
acceptable linits.
The methods used to test the accuracy of the results are discussed
under three headings:
(1) Skeletal age and sesanoid dia¡neter;
(2) Ossification events in hand and wrist roentgenograms;
(3) Lateral cephalonetric roentgenograms.
In each of the three phases of the study double determinations
were made and analysed by Dahlbergrs nethod (t40) in order to determine
the rnagnitude of experinental errors and the extent to which they af-
fected results.
(1) Skeletal Age and Sesamoid Diameter
CARTER (,26) stated that considerable alterations in the size and
shape of the projections of the carpal bones occurred when the hand
was flexed during radiography. He also stated that FICK ('01) se-
lected the nstraight positionrr as a standard position with which other

-s4-
positions could be conpared. The hand is in the straight position
when the long axis of the third metacarpal bone almost corresponds to
that of the forearm.
To select a method of evaluating skeletal age and to establish the
effect of hand position on this rating and on the dianeter of the ulna
netacalpophalangeal sesanoid of the thumb, a series of double deter-
minations was made.
The accuracy and consistency of recordings hras determined by
ma.king two separate assessments of each observation at least 24 hours
apart . Data vlere recorded on IBM coding sheets for transfer to punch
cards "
Series 1
A prelininary study was undertaken in order to assess the consis-
tency of two comnonly used nethods for assessing skeletal age. Hand
and wrist roentgenograns of 25 Aborigines and 25 Caucasoids were se-
lected at random and skeletal age assessnents were made on each film
with both an inspectional and a scoring method.
The Greulich and Pyle Attas ('59) was used with the inspectional
nethod to obtain a skeletal age in years. The scoring method of
TANNER, WHITEHOUSE A¡{D HEALEY provided a total bone score which on con-
version gave a sketetal age in years. The repeat assessnents were
conpared with thosÀ obtained fron the initial series for each subject,

-55-
Series 2
To deternine the effect of hand position on the rating of skele-
tal rnaturation, two left hand and wrist roentgenograms were obtained
for the same gïoup of 25 Caucasoids as above. on the first film the
hand was in the position of rest; on the other the thurnb was rotated.
A standardízed technique was used for each roentgenogram.
The hand was said to be in the rest position when it was held
straight with the fingers separated and the thunb in a natural degree
of rotation with the axis making an angle of 30o with the first finger.
The paln was pressed slightly downwards on the film'
The hand was said to be in the rotated thunb position when it was
held straight and held flat against the filn with the thumb rotated as
¡nuch as possible.
Series 3
To determine the effect of wríst position on skeletal assessment,
three 1eft hand and wrist roentgenograms were obtained for each of six
patients registered in the Dental Department, The University of Adelaide"
The films were obtained with the forearn in three separate positions:
1. forearn fLat on the table;
2, forearm at 45o to the wrist;
5" forearm almost at right angles to the wrist'

-56-
Series 4
To deter¡nine the effect of rotation of the thunrb on the measurenent
of the ul,na netacarpophalangeal sesanoid of the thr¡mb, the diEneter
was,recorded on two seperate occasions for both the rthumb-restr and
rthumb-rotatedr positions. Measurenents were nade to the nearest
0.5 nm with l{ild caliPers*.
(2) Ossificatio-n Events in Hand and wrist Roentgenoglams
Errors alose fron two nain soutces: the field ¡rethods and the
recording methods. Field method errors included those caused by
difficulties in positioning the subjectrs hand end forearn on the
fil¡n and nove¡nent of the subjectrs hand during exPosure of the fiL¡n.
Recording nethod ertors included those caused by dlfficultíes in
vísualizing radíographic changes and the ¡nenner of, neasuting the dia.
metet of the ulna netacarpophalangeal sesanoid of the thumb.
Ossification Events
Qssification events were recqrded for all subjects by the sane
observe¡ on two scpalate occasions. The tinc interval between deter-
ninations wss ePPloximately onc nonth. Statistical analysis was
mede of the differcncos bctwcen deternin¿tions by means of the con-
puter. l{hcn a diScrepancy bctween the two obscrvations of an
ossifícation evcnt w¿s disclosed, a thi¡d dete¡mÍnation was nade'
* Manufacturcd by Hcerbrugg' Switzcrland¿

-s7 -
(3) Lateral Cephalonetric Roentgenograms
The Various sources of errors that occur in roentgenographic
cephalonetry have been reported by many researchers including ADAMS
('40), BJöRK (,47), FRAI.IKLIN ('52), THoRNE ('53), WERNER ('55),
NEVAKARI ('56), TALLGREN ('57), SARNiIS ('57), LYSELL and FILIPSSSN
('58), HATTON and GRAINGER (r58), BROADWAY, HEALY and POYTON ('62).
sJönf and SOLOW ('62) and BARRETT et al. ('63a). All these studies
indicate that the errors involved are small and unlikely to affect
results to any great extent" As roentgenographic cephalometry pro-
vides the only nethod of studying craniofaciat structures thoroughly
in living subjects, it is an extrenely valuable tool in research pro-
viding results are interpreted carefully.
Errors arose from two sources: field nethods and neasuring
methods. Field nethod errors included those caused by difficulties
in positioning subjects in the cephalostat , difficulties in regis-
tering the intercuspal posítion, movement of subjects during exposure
and errors in projection. Measurement errors included those caused
by difficulties in locating reference points and reference lines and
those caused by inaccuïacies in the measuring instrunent and in the
reading of the recorded dimension.
Field nethod errors have previously been investigated by BRQWN
(t6S) and found to be small. In order to determine the magnitude of
neasurement errors 50 lateral head roentgenograms were selected at ran-
don and all variables were neasured on each film by the sane observer,
approxinately one month after the cornpletion of the first determination.
The differences between two deterninations were analysed and expressed

-58-
as the mean of the difference (U.aiff¡, the standard deviation of
the differences (S.D.diff), and the error of the nean differences
( eM diff) . The following fornulae were used to determine the error
statistics:
xdM diff n
s.D. diffx(¿ - M dirf)2
n
e M diff s.D. diff
where d
n
Fdifference between two determinations,
number of double determinations.
In addition the method of Dahlberg ('40) was used to conpute the
standard deviation of a single determination (S.D.s) according to:
S.D.s
where 2n number of single determinations.
Studentrs rt-testrt was used to deternine the probability that a
mean difference differed significantly fron zero, thereby indicating a
systematic discrepancy between the two deterninations. For the test,
tlne S% and Leo probability levels were used and the mean differences

-59-
were designated significant at the 5eo level and significant at the Leo
level respectively. The value of t was calculated according to the
equation:
M difft t M diff
The extent to which the variability due to experimental error
affected the observed variance was indicated by using the generality
that component parts of a variance can be suruned to equal the total
variance.
Thus:
where observed variance fron samPle asdeter¡nined fron the original values.This vatue includes variance due to
" 'measurenent error.
estinate of the true sample variance
2
tr'
tr'
tr'
,,, 2b+
e
S variance due to measurenent error,termed error variance in this study"This value is deternined as SD-2
s
e
dwhere S.D.
s
The error variance was then expressed as a percentage of the ob-
served variance.
x
2n

-60-
Results
Skeletal Age and Sesamoid*
Table 5 shows the basic descriptive statistics (mean, error of
the mean, standard deviation, mininum and naxinum) for the Caucasoid
group and Table 6 for the Aboriginal group. conparisons of the
variables listed below were recorded for both groups separately.
Analyses are listed in Tables 7 and 8.
Skeletal age
Skeletal age
Round bone score
Long bone score
Total bone score
Skeletal age
Atlas method (hand in rest position)
Atlas nethod (hand in rotated position)
- T /W (Tanner - Whitehouse method)
(hand in rest Position)
- T/W nethod (hand in rest position)
- T/W method (hand in rest position)
T/W nethod (hand in rest Position)
Round bone score - T/W ¡nethod (hand in rotated position)
Long bone score - T/W nethod (hand in rotated position)
Total bone score - T/W method (hand in rotated position)
Skeletal age - T/W method (hand in rotated position)
Diameter of the metacarPophalangeal sesamoid of the thumb.
Significant differences were found between the inspectional and
scoring method for both gloups (p ' 0.01). The Aborigines showed a
significant difference between chronological age and skeletal age
using the Atlas method (P ' 0.01).
* In this and followÍng secskeletal rating is indica
tions the Tanner-ted by the abbrev
Whitehouse methiation T/W
od for

-61 -
Comparison of all other variables showed no significant dif-
ference. These results are surunartzed in TabIe 9'
ossification Events in Hand and wrist Roentgenograms
A total of 1,257 double determinations were ¡nade on 419 hand and
wrist roentgenograms. The differences between determinations were
expressed as nisclassifications. Table l'0 shows the percentage of
subjects with misclassification of either the pisiform, hamate or
sesa¡noid bones.
Lateral Cephalornetric Roentgenogra¡ns
A total of 500 double determinations were made on 50 lateral head
roentgenograms. The results showing the ¡nean differences, the stan-
dard error of the mean differences and the standard deviation of
single deternination as well as variance (error) and per cent variance
(error) for each variable are shown in Table 11'

TABLE 5.
-62-
Determinations of skeletal age, round bone scores, long bone
scores and sesamoid diameter nade fron hand and wristroentgenograms of 25 Caucasoids. Ages recorded in decimalyears, sesanoid diameter in nm.
Mean e (M) s Min MaxVariab 1e
Chronoloeica I Ase
Ske letaIAtlas Method-Rest.Deter¡nination 1
2
Skeletal Aee
Atlas Method-RotateDeter¡nination 1
2
Round Bone Score
RestDetermination 1
2
Lon Bone Score
RestDetermination 1
2
Total Bone Score
RestDeternination 1
2
Skeletal Ase
T/W Method - RestDetermination 1
2
13.s 0.48 2.4 9.7 19.6
t3.2t3,2
L3,2t3,2
0 .580 .56
19 .019.0
t211
s00 .0500 .0
134.01s4.0
500 .0500 .0
00
5658
8.07.s
7,58.0
2.82,9
2.92.8
19 .019 .0
351 .8352.t
30,7030.10
153. 5150 .3
5.09.0
8.08.5
2
932
366.6370.7
26.6024.60
133.1L23.0
280 .8367.4
7L8,4762.8
56.2073.50
259.0 r277 .0
000998
00
t3.713. 8
0.630 .58
19 .019 .0

-63-
TABLE 5 (continued).
Variab le Mean e(M) s Min Max
Round Bone Score
RestDeternination 1
Rotate
Lonq Bone Score
RestDetermination 1
Rotate
Total Bone Score
RestDetermination 1
Rotate
Skeletal Ase
T/W MethodRotate
Sesamoid Diameter
Determination 1
2
13.8 0 .58 2.9 8,7 19.0
5535
366.637s.0
30.7030.10
153. 51s0 .5
tzs.0119.0
500 .0500.0
1.82.t
7L8.4727 .L
26.6024.t0
s6.2053. 10
133.1720.4
280 .8265.6
t34.0158 .0
259,0277 .0
500.0s00 .0
L000 .01000 .0
44
I8
0.280.28
6.56.5
2.02,0
1.1l".L

-64-
Determinations of skeletal age, round bone scores, long bonescores and sesamoid dia¡neter made fron hand and wristroentgenograns of 25 Aborigines. Ages recorded in decimalyears, sesamoid dianeter in mn.
Mean e(M) s Min Max
TABLE 6.
Variab le
Chronol I Ase
Skeletal Ase
Atlas MethodDeter¡nination 1
2
Round Bone Score
Deternination 1
2
Long Bone Score
Determination 1
2
Total Bone Score
Determination 1
2
Ske letal Ase
T/W MethodDetermination 1
2
Sesamoid Diameter
Deternination 1
2
t2.9 0 .24 L.2 10.9 ts .2
L2,2t2.t
0.320.31
346.5328.t
326.1307.6
24.L02t.90
4t.6038.10
19 .00t7 .70
910.
218.0196 .0
4t2.040s .0
10 .110.4
15 .0ls .0
947 .0967 .0
1.61.6
40
L20.4109 .4
180.0L77 .0
500 .0s00 .0
94.888.7
496 .0496 .0
672.6635.7
0.270.28
3.13,L
208 .0190 .5
13. 313.0
0.290.27
1.51.3
1s .81s.4
4.54.s
2,02.0
0.91.0

TABLE 7.
-6s-
Analysis of differences between double determinations ofhand' and wrist roentgenograms of 25 Caucasoids. Ages
recorded in decinal years, sesamoid diameter in mm.
Variab 1e Mean e (M) Min Max T-values
At las -RestDeternination 1-2
At las -Rotate
Determínation 1-2
AtIasRest l-Rotate 1
Chronological AP-Skeletal Age
Atlas Rest 1
Chronological Age-ffiIæãT Asè
Atlas Rotate 1
Round Bone Score
0.0 0.04 0.2 -0.5 -0.s 0.49
-0.1 0.04 0.2 -0.5 0.5 -1.31
0.0 0.04 0.2 -0.5 0.s 0.23
0.4 0.24 t.2 -1 .6
0.4 0.26 1.3 -1.6
3.2 L.48
3.7 t.42
Deternination 1-2
Lonq Bone Score
-0.3 6.60 53.0 -80.0 111.0 -0.0s
Deter¡nination t-2
Total Bone Score
Dererminarion 1-2 -44.4 40.50 202.5 -18.0 111.0 -L.10
Skeletal Aee-T/W
Determination 1-2 -0 '1 0.09 0.5 -t'2 1 .1 -0.79
-4.L 2.70 13.s -33.0 16.0 -1.s1
+ Mean difference significant at the p < 0.01 level

-66-
TABLE 7 (continued)
Variable Mean e(M) s Min Max T-value
Round Bone Score
Rest 1-Rotate
Long Bone Score
Rest 1-Rotate
Total Bone Score
Rest 1-Rotate
Chronological Age-Ske1etal Ase
-0 .3 0 .28 t.4 -3.1 3.4 -1.10
-2.3 1.0
-0.5 6.60 33.0 -80.0 111.0 -0.05
-8.3 3.10 1s.6 -47.0 16.0 -2.67
Rest 1-Rotate -8 .7 7 .20 36.0 - 100 .0 98 .0 -t .20
Skeletal Ag e-T /W
-0.1 0.10 0.s -L.2 1.1 -1.38
-0.2 0.31 1.6 -3.1 4.L -O.ss
Atlas Rest 1-T/W Rest 1
Skeletal Age
Atlas Rest 1T/W Rotate
I
-4.54'
Sesamoid Diameter
Deternination 1-2 0.0 0.00 0.0 0 '0 0 '0 0.0
-0.s 0.1s 0.8 -2.3 0.8 -3.4s+
-0.7 0.15 0.7
+ Mean difference significant at the p < 0.01 level

TABLE 8
-67 -
Analysis of differences between double deterninations ofhand and wrist roentgenograns of 25 Aborigines. Ages
recorded in decinal years, sesamoid diameter in mn,
Variab 1e Mean e(M) Min Max T-values
Skeletal AgeÃiffiõa-Deternination 1-2 0.1 0.06 0.3 -0.6 0'5 1'35
Chronolo 1Ae eta e
Atlas Method 1
Round Bone Score
Deterninatíon L-2 18.4 L2.50 62.6 -70 '0 144 '0 L '47
L Bone Score
Determination 1-2
Total Bone Score
18 .6 7 ,20 35 .8 -87.0 91 .0 2.s9
Determination 1-2 37,0 14.30 7L.7 -59.0 194.0 2.58
Ske1etal Age
ffi¡lr-t.ÏõFnõã-Deternination 1-2 0.3 O.t2 0.6 -0'5 1'6 2'42
Chronolo ical e-a Age
0.7 0.20 1.0 -1.0 2.3 3 .47+
r/wDeternination 1
Skeletal Ase
Atlas l-TlW 1
Sesamoid Diameter
-0,4 0.22 1.1 -2.7 t.2 -1. s6
+-1.0 0.1ó 0.8 -2.4 1 .0 6.46
Deternination 1-2 0.0 0.07 0.5 -0'5 0'5 0'56
+ Mean difference significant at the p < 0.01 level'

TABLE 9
-68-
Comparison of chronological age and skeletal agedetèrmined by the Atlas and Tanner-Whitehouse Methods.Differences in mean ages recorded in decimal years.
Caucasian AboriginalMF
M(diff) e(M diff)Variab Ie M
M(dif f)F
e(M diff)
DifferencesbetweenAtlas Rest 1
T/W Rest 1
DifferencesbetweenAt1as Rest 1
T/W-Rotate
DifferencesbetweenChronol. AgeAtlas Rest L
Chronol. AgeT/W Rest
Chronol. Aget/tll Rotate
-0 .5+ 0 .15
À-o .7' 0 .15
0.4 o.24
-0.2 0 .31
-1 .0+ 0.16
0.7+
0 ,20
-0.4 0.22
-0 .3 0.28
+ Mean difference significant at the p < 0.01 level

-69-
TABLE 10. Misclassification of ossification events on hand and
wrist roentgenograns.
0ssifícationEvent
Nurnber ofDeterminations
Number ofMisc lassifications
PercentageMisc lassifications
Pisiforn
Hamate
Sesamoid
M
F
M+F
M
F
M+F
M
F
M+F
253
166
419
2Ss
166
41.9
253
166
419
5
4
9
0
0
0
15
9
24
1 .98
2.4t2 .ls
s.93
s.42
s.73
0.00
0.00
0.00

-70-
TABLE 11.
Variable Mean e(M) tr' 22
ee
2S S x 100/5
1
n-s
pn-sP
pg-ar
pg-go
ar-go
n-gn
n-sP
id-gn
pr-id
pn-s
-0.07
0 .03
0.02
-0 .15
0,2L"
0.14
0.1s
0.06
,0.12*
-0 .14
0.03
0.11
0 .05
0 .08
0.09
0 .08
0 .14
0.0s
0 .06
0 .09
6 .59
8.86
36.43
30.2t
14. 10
47 .t7
13.30
10. ó3
2.72
11.48
0.03
0 .51
0 .07
0. 18
0.20
0. 13
0 .49
0 .06
0 .08
0,20
0 .47
5. 51
0.20
0 .59
L .42
0,28
3.67
0.s4
2.86
1 .69
* M diff. differs from zero at the 5 per cent probability level'

-7L-
DISCUSSION
(1) Skeletal Age and Sesanoid Diameter
For Caucasoids and Aborigines there h'as a significant difference
(p < 0.01) between skeletal ages assessed by the Attas and T/w ¡nethods,
using filrns obtained with the hand and wrist in the rest position' In
Aborigines, the T/l/\l age deternination was greater than the Atlas age
determination by 1.0 years and in caucasians by 0.5 years. with the
thumb rotated, a greater difference (0.7 years) was revealed between
the two methods for Caucasians. The differences shown in skeletal
age assessments deternined by both nethods support the findings of FRY
('ó8) and ROCHE and J0HNSON ('ó9)'
Rotation of the thumb did not affect the skeletal age assessment
deternined by the Atlas method (mean difference between determinations
0.0 years). using the T/w method, rotation of the thunb revealed a
slightly greater difference (nean difference between determinations
0.1 years). However, the difference between the two assessment nethods
with the hand in the rotated position was 0,7 years conpared to 0'5
years with the thumb in the rest position. Therefore, strict attention
nust be paid to the thunb position when obtaining hand and wrist loent-
genograms employing the T/w method for skeletal age assessment.
skeletal age deternination using the Atlas nethod, with the hand
and wrist in the rest position was on the average 0.7 years earlier
than chronological age in Aborigines and 0'4 years earlier in Caucasoids'
The difference was significant in Aborigines only. The slightly re-
tarded skeletal developnent revealed in Aborigines supports the studies

-72-
of ABBIE and ADEY ('53).
It lrras more difficult to visualize the radiographic changes con-
sistently in Aborigines than in caucasians. In Aborigines, the dif-
ference between first and second determinations using the Atlas nethod
was 0.I years compared to a 0.3 years difference between deter¡ninations
using the T/w ¡nethod. Double determinations of long bone scores
showed a significant diffelence (p < 0.05) in Aborigines. This was
possibly the result of varying hand positions '
The Atlas rnethod would seem to be more reliable where a non-
standard hand and wrist roentgenographic technique is used, as in the
field studies at Yuendumu in central Australia. The Atlas method is
quicker and involves a general assessrnent. Although it leads to dif-
ferent assessments than those films determined by inspecting and scoring
many bones with the T/w nethod, the Atlas method appeals to be the tech-
nique of choice with the avaitable material'
Until standards of hand and wrist ossification are available for
Aborigines it is necessary to use those standards developed for
caucasoid children. Moreover, at the present tine there is no infor-
mation on the differences between hand and wrist ossification in
Aborigines and caucasoids over the age range represented by the sub-
jects of this study. However,ratings ¡nade for Aborigines according
to the Atlas Method, should lead to consistent results particularly if
the tine scale is based on rrcaucasoid equivalentrr yeals.

-73-
(2) Ossification Events
The per cent nisclassification of ossification events (pisiform -
2.IS%, hamate - 5.73%, and sesa¡noid - 0.00%) indicate the consistency
in visual lzíng these changes on hand and wrist roentgenograms ' The
ninor difficutty in visualizing the two stages in the ossification of
the hook of the hamate seems to relate to the interpretatj-on of
stage 1.
(3) Lateral Cephalolnetric Roentgenograms
The range of the nean differences between the double deterninations
of ten linear dimensions on 50 lateral cephalonetric roentgenograns
was -0.14 to +0.21 mm. Enployment of therrt testrrrevealed that the
mean difference of the variables lanus height (0.2L t 0.09) and middle
face height (0,12 I 0.06) differed from zero at the P = 0.05 level.
None of the means displayed deviations fron zero significant at the
1% level.
Conparison of the nean difference of ramus height (0,2L) with its
mean value (42.81) and of niddle face height (0.12) with its mean
value (25.67), illustrates that the experimental er3or will not
seriously affect sample mean values.
The standard deviation of a single deter¡nination was used to
assess the degree to which the neasurement erlors affected estinates
of a population variance or standard deviation. For example, using
sumrnation of variances and the anlysis of variance for the dimension
upper face height it can be seen that the unbiased sample variance

-7 4-
closely approximates the observed variance fron the sample as the naxi-
mum error variance of 0.49 represents only 3.67% of the observedvari-
ance. The ninimun error variance pel. cent of 0.20% occurred in the
dinension total nandibular length. This shows that the experinental
errors did not greatly affect variance estimates '
CONCLUSIONS
varying hand positions can affect a skeletal age assessment'
In the investigation of technique for rating skeletal age, the Atlas
Method was shown to provide more consistent assessments than the
Tanner/Whitehouse scoring system. The Greulich PyIe Atlas was, there-
fore, used for alt skeletal age assessments in the present study.
The appearance of the selected ossification events can be accu-
rately visualized and there seems to be little doubt than an observer
after some experience, could consistently assess such clear cut events "
It has also been shown that the experimental errors in the
measurement of serial cephalonetri.c roentgenograns did not seriously
affect the results. As a consequence, the methods employed can be
justified.

CHAPTER IV
RATING OF SKELETAL MATURITY
Serial hand and wrist roentgenograms of each subject included in
the study were used to derive esti¡nates of skeletal age and to obtain
the age-at-appearance of selected ossification events in the carpus.
All ossification events studied appeared, on the average' around puber-
ty; furthermore, they could be recognized readily on the roentgeno-
grams. These two criteria were applied in the study.
METHOD
'rCaucasoid equivalent" skeletal age ratings were made on each hand
and wrist roentgenogran employing the inspectional nethod of GREULICH
and PYLE (t59). The filn to be.assessed was conpared with the stan-
dard of the sane sex and nearest chronologic age in the Atlas. It was
then conpared with adjacent standards untiL a standard which super-
ficially resembled it was found.
A more detailed conparison was then made of the individual bones
and epiphyses in the following order: the distal ends of the radius
and ulna, the carpals (order was capitate, hamate, triquetral, pisiform,
lunate, navicular, trapezium and trapezoid), the netacarpals, and
finally the phalanges. If an individual bone in the filn was at the
same stage of developnent as the corresponding bone in the standard

-76-
selected for detailed conparison, it was given the skeletal rating of
that standard. However, when the bone was retarded or advanced' com-
parison was made with adjacent standards respectively. If the com-
parison indicated the bones showed the sane degree of development'
then the skeletal rating of that standard was recorded. If a bone
was internediate between the standard selected for detailed comparison
and the adjacent standard it was given an intermediate skeletal rating
between the two standards.
The ossification events studied, defined in Chapter II, i1lus-
trated in Fig. 8 and listed in the Appendix C, were:
ossification of Pisiform
ossification of hook of ha¡nate - stages I and 2
ossification and size of the sesanoid of the thumb
The time of onset of these ossification events was recorded when the
first radiographic changes in ossification could be clearly visualized,
The size of the sesamoid of the thunb was determined by measuring its
greatest diameter to the nearest 0.5 mm with calipers. AIl assessments
were entered directly onto skeletal maturation form 7, from which the
age-at-appearance for the various ossification events was selected.

-77 -
SESAMOID SIZE CLASSIFICATION
Stage 1 - maximum diameter not exceeding 1.5 nm
Stage 2 - naximum diameter not exceedíng 2.5 mm
Stage 3 - maximum dianeter exceeding 2.5 mm
AGE-AT-APPEARANCE OF OSSIFICATION EVENTS
Criteria for selection
1. Age was taken as the mid-point of the year in which each event
appeared, that is, between adjacent observations, one year aparl,
However, because the visits to Yuendunu in 1961 and 1962 were nade
in the months of January and August respectively, the time inter-
val of 1.6 years was accepted in this instance'
2. The ossification event appeared between adjacent records, that
is, the film taken previously to the one which showed the appear-
ance of the event revealed no evidence of ossification.
3. The ossification event was clearly visible.
For example, if an event was not present on a record taken at age
tl,4 years but present on the next record taken at t2.4 yeats, the
onset of the event was recorded as 11.9 years.
All assessments made on the hand and wrist ToentgenogÏams were
transferred to punched cards. These cards were identified as data
card 1. Statistical analyses of the data were carried out by con-
puter.
The mean age-at-appearance of the ossification events hrere con-
pared with the only available data for Australian Aborigines (ABBIE

-78-
and ADEY r53b). Comparisons were also made with standards reported by
various authors for Caucasoid children.
RESULTS
The results are summarized in Table 12 which lists the mean, the
error of the mean, the standard deviation and the range of observations
for chronological and skeletal ages-at-appearance for the various
ossification events and sesanoid stages. Male and fenale differences
in the age-at-appearance of the ossification events studied are illus-
trated in Fig. 10 which was drawn fro¡n mean values for both sexes.
DISCUSSION
Analysis of mean values revealed that the earliest events to be
seen on serial hand and wrist roentgenograms were the initial ossifi-
cation of the pisiform and the hook of the hanate. Hamate-stage L
appeared at 10.6 years in females and L2.2 years in males; and the
age-at-appearance of the pisiforn was 10.5 years in fenales and t2.6
years in males. Ossification in the adductor sesanoid of the thumb,
which was the last event to be seen occurred at L7,2 yeats in females
and 13.5 years in males.
All ossification events occurred earlier in fenales than in nales
The greatest sex difference in the timing of ossification events was
2,3 years for both hanate-stage 2 and the sesamoid. A similar sex
difference for the sesamoid is given by GREULICH and PYLE ('59), GARN
and ROHIT4ANN ('62) and g.iöRK and HELM ('67). The snallest sex dif-

-79-
TABLE 12. Tine of appeatance of ossification events on serial hand
and wrist- ioentgenograms are recorded in years for 52 males
and 36 females.
Variab 1e Mean e(M) Min Max ns
PISIFORM
Chron. Age
Skelet. Age
Chron. Age
Skelet.Age
12.210 .6
0.2t0.34
11. s9.9
0. 160.20
4325
t3.311.8
432S
L4.214.9
2918
t3,3t2.3
2918
M
F
M
F
t2.610 .5
11.99.8
t3.411.1
0 .190,2t0.130.t7
15.1L2.9
9.68.9
9.57.8
10 .68.9
9.58.9
t.21.1
0.80.9
1.1L.4
0.80.9
0.81.0
HAMATE-STAGE 1
HAMATE-STAGE 2
M
F
M
F
0,60.6
M
F
M
F
Chron. Age 0. 140.2t
11.69.8
3723
L3.6t2.0
3723
16 .1L3.4
Ske let . Age
Age was recorded as the mid-point of the year in which each
"iurrt appeared, i.e. between adjacent observations, 1 year apart
t2.810 .7
0 .100. 11
11.39.7

-80-
TABLE 12 (continued)
Variab 1e Mean e(M) s Min Max n
SESAMOID
Chron.Age
Skelet.Age
M
F
M
F
13. stL.2
0 .140.23
0.91.8
0.50.6
1.21.0
0.40.5
0.8t.20.50.5
1.0L,7
1120
00
10 .99.2
16 .113.9
13.6t2.o
4326
t2,710 .6
0 .080.t2
11.39.2
4326
Chron. Age
Ske let . Age
SESAMOID-STAGE 1
SESAMOID-STAGE 2
SESAMOID-STAGE 3
M
F
M
F
t2.9tt.2t2.210 .6
t3.4tr.7
0 .550 .31
0 .180.14
0.180.31
10 .99.8
13.9L3,4
5
10
5
1011.69.7
11 .69.8
t2.511.0
Chron.Age
Skelet . Age t2.810 .9
13.8L2'.t
0.200 .41
M
F
M
F
0.61.0
M
F
M
F
t2.010 .0
11 .99.2
L4.913.9
13.6t2.0
16 .114.9
13.913.0
19L4
19t4
Chron . Age
Skelet.Age 0.L20,24
11.39.2
13.011 .5
25t7
25T7
Age was recorded as the mid-point of the year in which each
eient appeared, i.e. between adjacent observations, 1 year apart.

I 10 l1 12 t3
A. PISIFORM
B. HAMATE - stagel
C. HAMATE - stase 2
D. SESAMOID
10 11 12 13AGE - YEARS
Male -r sD +I SD
Female -r sD +l SD
l4
14 15
Fig. 10. Mean age-at-appearance of ossification events

-82-
ference in timing of an event was recorded as 1.6 years for hamate-
stage 1. This value approxinates that of ABBIE and ADEY ('55b) and
GREULICH and PYLE ( '59) .
The pisiforn ossified 2.1 years earlier in the females of the
group. ABBIE and ADEY (r53b) stated that the age-at-appearance of the
pisiform in females was on the average 3 - 4 years ahead of males.
They also stated that in males it appeared at about the sane time as
the metacarpophalangeal sesanoid of the thumb. In the present study,
ossification of the pisiform was recorded 0.9 years before the sesamoid
ossified. The age-at-appearance for the pisiform given by GREULICH
and PYLE (t59) and GRAY ('58) indicates an earlier ossification in
Caucasoids.
Initial ossification of the hook of the hanate occurred at 10.6
years in fenales and !2,2 years in males. These values closely
approximate those given by ABBIE and ADEY (11.0 years in females and
!2.0 years in males) and GREULICH and PYLE (10.5 years in fenales and
t2,O yeats in males) .
JOSEPH ('51) found the metacarpophalangeal sesamoids of the
thunb ossify in all persons. His investigation on a group of Indians
and Africans suggested that there was no racial difference in the in-
cidence of the sesamoids of the thunb. In Aboriginal nales the sesa-
moid appeared at 13.5 years, which is approximately 1 year later than
North Anerican males (GREULICH and PYLE '59, GARN and RQHMAI¡N '62)'
However, the sesamoid appeared slightly later (5 nonths) than the age
estirnated in Danish males by B.lönf and HELM ('67). In Aboriginal
females, the sesamoid appeared at 11.2 years, which is approximately

-83-
midway between time of appearance of the sesanoid in North Anerican and
Danish girls.
Table 13 conpares the age-at-appearance of the various ossification
events given by a number of authors for Caucasoids with the findings
for Aborigines.
TABLE 13. Time of appearance of ossification events reportedby various authors (age in Years) .
0ssificationEvent
Group Investigator Fenales Males
Pisiform
Hook of Hamate
Sesamoid
Nth.AmericanWhites
Not stated
AustralianAborigines
AustralianAborigines
Nth.ñnericanWhites
Aus tra I ianAborigines
AustralianAborigines
Greulich & Pyle('59)Gray('58)
Abbie & Adey( r53b) 10.0-11.0 <14.0
Present Study 10 .5 12 .6
10 .5 12 .0
Abbie & Adey( '53b) 11 .0 12 .0
Present Study 10 .6 12 .2
Greulich & Pyle('sg) 10.5 t2,5
8.3
9 .0- 10 .0
10 .0
t2.0
L2:6
t2,6
Nth.AmericanWhites
Nth.AmericanWhites
Danish
AustralianAborigines
Garn & Rohmann(r62)
Björk & Heln('67)10 .5
11.s
Present Study Lr.2 15. s

-84-
SUMMARY
1. The age-at-appearance for various ossification events have been
recorded fron serial hand and wrist roentgenograms of 52 male
and 36 female Aborigines.
2. Females displayed earlier ossification times than males. This
pattern was similar to that reported for other ethnic groups.
3. In general, the ossification events studied occurred sl'ightly
later in Aborigines than in Caucasoids.

CHAPTER V
GROWTH VELOCITIES AROUND ADOLESCENCE
Individual variation in growth and development results from the
interplay between genetic and environnental influences. It can be
difficult to investigate the relative inportance of hereditary and
environment in growth varíations in hunan populations. However, the
role of environnental factoïs as determinants of ethnic group dif-
ferences in growth has been discussed by wEINER and THAMBIPILLAI ('52),
GREULICH ('57) and tutASSE and HUNT ('63) .
A short tern environnental disturbance will often produce a tem-
porary variation in growth (HIERNAUX, t68). In most instances, the
depression caused by acute starvation or disease is soon conpensated
by an acceleration in growth (TANNER, t63). However, long-term growth
retardation results when starvation occurs soon after birth (HIERNAUX,
'65) .
Most Aborigines breast feed their children for at least 12 months
and in many instances for two years (ELLIOTT, MAXWELL, KNEEBONE and
KIRKE, t69). The mean birth weight for Aborigines was lower than
that for White Australians by 1 lb 12 oz in nales and 1 lb 9 oz in
females (KETTLE, '66). KETTLE also observed that during the first
six months of post natal life, Aborigines appeared to grow more rapi-dly
than white Australians, but after this time the increments were nuch
smaller and so their mean weight was always less '

-86-
ELLIOTT and others ('69) showed that the lactose content of breast
milk in Aborigines decreased markedly after the sixth nonth of lactation,
and breast milk production did not increase with the age of the suckling.
Furthermore, the same authors suggested that the quality and quantity of
breast nilk were possibly responsible for the diminished nutrition that
occurred in the second six months of life. In Japanese subjects
TAKAITASKI ('66) showed a high association between adult stature and the
consumption of milk and eggs during childhood'
Supplementary feeding of infants and snal1 children has been
carried out for many years by trained nurses at the Government Settle-
nents (CAMPBELL and BARRETT, '53; KETTLE, '66). ABBIE ('70) has
found little evidence of gross malnutrition in Aboriginal children
Iiving at various Settlements in Australia. Furthelmore' BRQWN and
BARRETT ('70), using serial height measurements obtained at Yuendumu,
found few differences in average height attained between Aboriginal
children and British children after age five or thereabouts. However,
MAXWELL and ELLIOTT ('69) , using stature, weight and other selected
body measurenents, interpreted their results to indicate a high inci-
dence of malnutrition in the Aboriginat subjects exanined, conpared
with Caucasoid standards.
KIR.KE ('69) found that Aboriginal children, fed and cared for in
much the same way as white Australian children reveal almost identical
growth patterns to Caucasoids. The physical proportions of children
are similar for Aborigines and Europeans up to approximately six years
when a sudden extension of the inferior extremities occurs (ABBIE, '57).
The proportions in Aborigines at this age are close to those of a

-87 -
European child aged L2 years (ABBIE, '58) " However, after this age
growth seems to proceed at about the same rate in both ethnic groups "
Investigations on the rate of growth in the facial skeleton have
been reviewed in Chapter I " It seems appropriate to emphasize that
in nost studies the variables are measured across two or nore bones "
HOWELLS ('69) stated that ttmeasu,rements, espec'iaLly of the eraníwn,
uhåeh aLLous the Loaation of Langen nwnbers of anatomíeaL points, haue
tended. to beeome bamd by tnadì,t.Lon.tt He suggested that attention be
given to ensure better and more descriptive methods in any investi-
gation" As a consequence, variables were selected in the present
study to describe the rate of growth in each unit of the nasomaxillary
conplex as accurately and simply as possible.
METHODS
STATURE
Standing height was measured using a specially designed anthro-
porneter with the subject standing without shoes, his back against the
vertical rod (Fig"5) " A relaxed body position was attained by having
the subject focus on some distant object" The horizontal arm of the
anthropometer was lowered until it made firm contact with the crown of
the head without pressure" No attenpt was nade to elevate the head
by applying upward pressure at the mastoid region as is done in some
techniques of stature measurements.

-88-
FACIAL VARIABLES
The variables studied (Fig. 9), defined in chapter 2 and listed
in the ApPendix C, were:
Anterior cranial base length n - s
MaxiltarY jaw base length Pm - sP
Total nandibular length Pg - ar
Mandibular corpus length Pg - go
Mandibutar ramus height ar - go
MorPhological face height n - gn
Upper face height n - sP
Mandibular face height id - gn
Middle face height Pr - id
Posterior upper face height Pm - s
For more consistent location of reference points, each of the
series of films for a subject was studied before locating the reference
points " All films were measured on a fixed viewing table in the ortho-
dontic department of The University of Adelaide" The viewing table is
constructed so that the light intensity can be varied' Sliding screens
elirninate extraneous light from areas on the film under inspection"
These two facilities a110wed more consistent l0cation of the various
referencepoints.Attimesasmallhandmagnifyingglasswasalso
used to assist in the location of certain points which were difficult
to visualize" whenever a bilateral randmark appeared as a double image
on the lateral head roentgenogram, the reference point was located as
the mid-point of the left and right images '

-89 -
All films h/ere covered with an overlay for protection and all
variables were measured directly on the fílms with a dial gauge vernier
scale (Fig. 11) . These measurements were directed onto skeletal matu-
ration form 7. A1l observations were later transferred to punched
cards for conPuter analYsis.
The velocity for height attained was computed from the differences
in height at two consecutive times " This was Iepeated for all obser-
vations for a subject with the velocity recorded as occurring at the
nid-point of the time interval between two consecutive observations.
For example, if the height of a subject was 145.5 cn at age L3"8 years
and 154"8 cm at age 1"4"8 years then the velocity for the interval was
computed as 9. 3 cnfyear occurring at L4" 3 years. The peak velocity
was taken to be the maximum of the individual velocities calculated
for each interval between adjacent observations, providing it met cer-
tain criteria" Peak velocities for facial dimensions were recorded
in the same way. The actual form of the computer output for the
growth analyses is shown in Appendix D.
Calculations of the magnítude and time of maximum growth velo-
city were accepted only if the following criteria were net:
l-. Maximun velocity occurred between adjacent observations,
preferably at one Year interval;
2. Maximum velocity occurred between adjacent velocity calculations,
that is, there should be a velocity before and after the maximum;
3. A minimum of three velocities, that is, four observations were
avai 1ab 1e;

Fig. 11. DiaI gauge vernier caliper

-91-
4, Maximun velocity occurred within the expected puberal age range
or it was clear cut;
5. Maximum velocity exceeded other recorded veloci-ties by a value
equal to the appToximate measurement error. For stature it was
taken to be 0.5 cm; for facial dimensions 0.5 nm.
peak velocities which satisfied the above criteria were recorded
independently by two observers for all subjects. Comparisons of
selected peak velocities were made and any differences were noted and
discussed by both observers before final acceptance "
RESULTS
The results are summarized in Tab1es 14 - 17 which list the mean,
the error of the mean, the standard deviation and the range of obser-
vations for peak velocity in stature and the facial dimensions studied.
Male and female differences in the magnitude and time of peak velocity
in growth are illustrated in Figs " L2 and 13 which were drawn from
mean values for both sexes '
DISCUSSION
peak velocity of stature at adolescence was 10 "3 cmfyeat in males
and 8 ,5 cm/year in females. The nean value in Aboriginal males was
the same as that recorded for British males by TANNER, WHITEHOUSE and
TAKAISHI ('66) . However, the mean value for Aboriginal females was
less than that for British females (9.1- cm/year, TANNER et aI., '66).

-92-
TABLE 14. Tirning (in years) and nagnitude (cm/year) of peakvelocity in stature in 50 males and 32 females
"
Variab le Mean E(M) s Min Max n
Magnitude
Skelet.Age
1.1 8.5
1.0 6.8
0.6
0.6
t2.2LL.4
30
18
M
F
M
F
M
F
10 .3
8.5
L5.I11.8
13.0
Lt,2
0. 19
0,24
o.L7
0.28
0.12
0 .15
Chron. Age
0.9
L.2
t2.89.9
50
18
16.1
t4"4
11.3
L0.2
13.8
12.0
27
t7
Age was recorded as the nid-point of the year during which peak
vélocity occurred, i.e. between adjacent observations, 1 year apart.

-93-
TABLE 15. Timing (in years) and magnitude (mm/year) of peak velocityin the anterior cranial base and maxilla in 50 males and32 fenales.
Variab le Mean e(M) s Min Max n
n-sAnterior cranial
ase
Magnitude
Chron.Age
Ske let . Age
Maxi I I awe
Magnitude
Chron. Age
M
F
M
F
M
F
7.23.0
2.4t.7
0.2L0.t2
13.8t2.2
11.69.8
13.1tt.4
0.2t0,24
11.39.0
1s.113.1
1.10.9
1.0L.2
1.10.6
r.2t.21.01.1
L,20.8
1.31.5
t.2L,3
2728
00
16 .8L4,4
2823
2823
2322
0.230.25
s
2.92.4
M
F
M
F
M
F
0,260 .L7
6.44.0
15.8L5,2
202L
13.5It.7
10.79.6
202t
t2,7rt.2
L0 .38.9
192t
0.290 .33
Skelet.Age
Age was recorded as the mid-point of the year during which peakvelocity occurred, i.e. between adjacent observations, 1 year apart"
15.1t4 .4

-94-
TABLE 16. Timing (in years) and nagnitude (mm/year) of peakvelocity in the nandible in 50 nales and 32 fenales.
Variab 1e Mean e(M) s Min Max n
Total length (pe-ar)
Magnitude
Chron. Age
Chron. Age
0.280.24
282t
0.200.25
11 .69.9
282L
58
M
F
M
F
M
F
M
F
M
F
M
F
13.8L2.0
54
13.011.6
0.200.23
0.270 .35
1.11.1
0.91.1
0.90.8
1.0t.20.8t.4
L.21.1
L.41.6
1.11.3
0.240.24
3.83.1
4,L3.6
2,92.7
t.41.1
10 .310 .0
8.47.0
5.64.7
16 .874.2
16.814. 8
t6.414.0
Skelet . Age
Corpus length (Pg-go)
Magnitude
Chron. Age
Skelet . Age
Ranus heieh
Magnitude
0.160.17
2922
13 .911 .9
0.180.25
292L
13. 1
11. s0 .160 .31
11 .37.6
15.115 .0
2527
262I
16 .8t7.l
262L
15.114. 0
232t
2.31.9
L2,69.6
t (ar-eo)
M
F
M
F
M
F
2.6L.6
lL.29.6
6.95.6
13.9L2,5
Skelet . Age
Age was recorded as the mid-point of the year during which peak
velocity ocÇurred, i.e. between adjacent observations, 1 year apart.
L3.211 .8
0.250.28
11.510 .0
1920

TABLE 17.
-95-
Timing (in years) and magnitude (mm/year) of peakvelocity in face height in 50 males and 32 fenales.
Variab le Mean e (M) s Min Max n
n-t1 cal Face
Magnitude
Chron.Age
Skelet.Age
M
F
M
F
M
F
13L2.
0 .360.23
5.44.4
r.4t.3
82
3543
t.01.0
12,9t2.0
0.240.2L
10 .5L0 .5
t6.413.1
2716
2716
2316
0.260.32
11.310 .0
16.8t5.2
t2 .36.0
6.95.2
3,23.2
3.02.5
1.51.3
9.59.8
9.38.9
t.21.0
1.91.0
1.10.8
L.31.1
1.81.8
L.7l. .6
0.50.6
1.21.1
r facen-s
Magnitude
Chronol.Age
Skelet . Age 12.11.
Magnitude 2
I
2413
0 .110 .14
2616
0 .230 .27
10 .610.5
2616
3.3,
L3.t2,
M
F
M
F
M
F
M
F
M
F
M
F
12.9tL.7
15.812.7
0,250.28
0 .360.47
00
1
2
01
61
2615
16.115 .0
2615
t6.415 .0
Mandibular face
08
Chron.Age
Skelet.Age 0.2L0.27
10 .310 .3
14. 5
14 .0221s
Age was recorded as the nid-point of the year in which each eventappeared, i.e. between adjacent observations, I year apart'
16 .1t4.4

-96-
TABLE 17 (continued).
Variab le Mean e(M) s Min Max n
Middle Facen-ã.íeñ4r-i¿lMagnitude M
F
Chron.Age M
F
Skel.et.Age M
F
2213
10 .510 .9
22L3
t7t2
t.71.5
12.6t2.4
4.03.6
2823
3,73.7
2,52.L
0 .160.22
0 .380 .35
0 .410.42
0.80.8
7
700
10 .510.s
9.59.ó
9.57.6
1.81.3
13.312.6
t.7t.4
16.81s.1
L7 .315.5
16 .8L4.4
14. s13.1
2823
Posterior upper faceñéisñr (Þrn-a)
Magnitude
Chron. Age
0.130.15
L3.4L2.t12.611 .5
0.250.26
M
F
M
F
M
F
0.70.7
52
t.2t.2
0.81.0
0.290.25
1
1
Ske let . Age
Age was recorded as the mid-point of the year during which peakvelocity occurred, i.e. between adjacent observations, 1 year apart,
242t

11
'10
unity'vear
VELOCITY
Fig. L2.
I
I
7
6
5
4
3
2
1
Male IFemale I
Stature n-s pg-ar n- n-sp pr-id
VARIABLES
Magnitude of ¡nean values for peak velocity in statureand facial dinensions in nales and females.

6J,8'9,1111
I
t0.3
8.4
103 4
I
13 14
AGE- YEARS
4
15
PEAKVELOCITIES
MALES1
STATURE
vEtocrTY
I
I
7
6
5
4
cmf vear
813
12
FEMAIES
I n-sp2 pr-id3 pm-s4 pm-sp5 stature6 n-s7 pg-arI n-gn9 id-gn10 pg-go11 ar-go
5
I
I
7
6
5
4
3
1,3
6 ISTATURE
VELOCITY 1l2
11.8
11 12AGE - YEARS
13
Fig. 13. Mean ages at peak velocity for facial dimensionsnarked on a stature curve for males and fenales.
10

-99-
The average ages at which peak velocity in stature was reached in
Aboriginal children were 1.3.8 years for males and 11.8 years for fe-
males. These values are nídway between those given by TANNER et al'
('66) and DEMING ('57) for British and North Anerican children res-
pectively. The sex difference in mean age at peak velocity was 2.0
years. This value corresponds to the sex difference of. 2.0 years
given by TANNER et 41. ('66) and DEMING ('57) for the tining of peak
stature velocitY.
The maximun growth velocity of facial dinensions was greater in
males than fenales, except for one variable, upper face height. Fe-
nales reached their peak velocity in the face earlier than males.
The naximun sex difference in the age at peak velocity was 2'0 years
for the dimension mandibular body length and the nininum was 0.7
years for the dimension middle face height. The nean age for peak
velocity in the maxilla was It,7 years in females. This corresponds
closely to the mean value of 11.5 years reported by SINGH and SAVARA
(t66) for the tine of maximum growth in the maxilla in females.
Maxinun growth in the length of the maxilla occurred before peak
velocity in stature in both males and females. The last event to
occur in females was peak velocity in mandibular face height. This
occurred on the average 0.9 years after peak velocity in stature.
peak velocities of facial height measurements in males occurred before
peak velocity in stature, with one exception, norphological face
height. peak velocities of mandibular dinensions all occurred either
at the same time or slightly after peak velocity in stature.

- 100-
The reference point, gnathion, is influenced by the later mandi-
bular growth. This is the nost likely explanation for growth in
morphological face height following the general pattern of mandibular
growth. Maxinurn growth in the length of the nandible was almost co-
incident with maximun grovrth in stature for males and fenales. This
finding is similar to that of HUNTER ('66) who studied Caucasoid
chi ldren .
SUI,¡UnRY
Methods used in this stature and facial growth study as well as
those enptoyed in calculating and selecting the time and magnitude of
peak velocity have been described; Analysis of results revealed the
fo1 1 owing:
j.. Males showed a greater peak velocity in stature than females but
on the average, gro$Jth velocities in the facial skeleton were of
si¡ni1ar value in nales and females. Peak velocity occurred earlier
in females both in stature and facial di¡nensions.
2. In females, peak velocity of most facial dimensions occurred after
peak velocity in stature, whereas in nales peak velocity of nost
facial height measurements occurred before and mandibular neasure-
ments occurred after peak statural velocity. Peak velocity of
naxillary length occurred before peak velocity in stature in both
males and fenales.

CHAPTER VI
ASSOCIATIONS BETWEEN FACIAL GROWTH AND SKELETAL }'IATURATION
To assess the strength of relations between the age-at-appearance
of ossification events and the tining and nagnitude of peak velocity
in stature and certain facial dimensions, coefficients of linear cor-
relation were computed for all paired cornbinations of variables.
SOLOW (t66 p.75) states t'aLthough a, eorneLation anaLgsís giues
no infonmation about causal v'eLationships" it has generaLLy been
asswned ín the íntenpretatíon of anthu'opoLogieaL assocíations that
the pnesenee of a si,gnificant eoz,teLation indicates a bíoLogícaL co-
oydination.'t However, correlations between some variables may be
biased if the variables share common reference points, reference lines
or angles. This effect comes about because the variability of the
common points used to determine the variables will be included in the
variability of each variable, thus the co-variance increases between
then. This forn of correlation was referred to by S0L0W (r66 p.82)
as 'ttopographicalrr, while correlations between variables not sharing
common points or lines were termed trnon-topographicalrr.
PEARSON and DAVIN ('24) introduced the term, I'spuriousrr cor-
relations, in relation to variables that shared common components and
those linear variables that rrcovered" each other. Variables neasured
on cephalometric roentgenograms are also subject to I'spurious?r co-
ordination.

-toz-
BROWN (,67) introduced the concept of "speciousrr associations be-
tween variables sharing conmon components, variables spanning adjacent
anatomical regions, and variables sharing common reference points or
lines. Thus, his use of the term rrspecious" included both previous
terms nentioned - rrspuriousil and "topographical'r. He stressed that
ttthe presenee of a ttspeeioust' co-ovdination bek¡een tuo uariabLes does
not precLud.e the possibiLítA of addítionaL bioLogícaL eo-ordination;
,Lt means, hotieüen, tTtat untiL more is knoun of the natwe of antht'o-
pometnie assoeíatíons obserued correLation uaLues shouLd be interpv'eted
eattiousLy't.
CROXTON ('55 p,L27) states that ttthe presence of eonreLation be-
h¡een tuo sets of data does not necessavíLy mean that eausation is
present euen though the eoz,relation maA be hightt. Correlation may be
present as a result of any one of the following conditions:
1. Correlation naY be fortuitous;
2" Qne variable is the cause, although not necessarily the sole
cause, of the other;
3. The two variables may be interdependent;
4. The two variables may be affected by the same cause.
GARN and SHAMIR ('58 p.84) warned against attaching too great bio-
logical relationship between age-associated events, because nany develop-
nental events are essentially irreversible and occur in a fairly definite
sequence. The same authors give as an exanple a study that reported
moderate to high correlations between third nolar fornation stages and
either chronological or physiological age (r = 0 ,73). Before agreeing

- 103-
with the previous statement they state that "one need only note that the
eoyqeLation beü¡een age at the beginning of thírd moLa.r formatíon an'd.
menavche is essentiaLLY zerott.
BJöRK and SoLOW (,62) found that correlation coefficients between
variables having conmon reference points which are marked on radio-
graphs, will be biased. The increase in the çorrelation co-efficient
is due to the fact that the errors involved when marking the points
are also correlated. They found that measuring procedures will also
affect the value of a correlation coefficient.
The matrix of correlation coefficients between the 58 variables
included correlations arnong the chronological and skeletal age-at-
appearance of ossification events, and the nagnitude, chronological
and skeletaL age-at-peak velocity in stature and certaín facial dimen-
sions. Thèse variables are listed in Appendix C.
To clarify interpretation of the 1,653 coefficients computed, the
natrix has been partitioned into segments which are presented in the
following tables. Coefficients were arbitrarily classified as follows:
"highrt relation, r > 0.80;'rmoderaterr relation, 0.80 > r > 0.40;
r?lowrr relation, r ( 0.40, disregarding sign and according to GARN ('58).
RESULTS
Tables L8 - 27 list the coefficients of correlation determíned for
nales and females separately. Average coefficients for males and fe-
rnales combin6d were determined by Z - transformation of the coefficients
for each group using the method of FISHER ('58 p,204). These trans-

- 104-
formed coefficients are also shown in the Tables.
coefficients significantly differing from zero at the 5% and
the l% levels are marked * and ** respectively. Coefficients that
differed significantly between sexes are marked ++.

TABLE 18.
-105-
Correlations between time of appearance of ossificationevents observed on serial hand and wrist roentgenograrns andtirning and magnitude of peak velocity in stature in 50 malesand 32 females. Û g
OSSIFICATION EVENT STATURE VELOCITY
Magnitude Chron.Age Skelet . Age
P IS I FORM
Chron. Age
Skelet. Age
HAMATE-STAGE 1
Chron. Age
Skelet. Age
HAMATE-St 2
Chron. Age
M
F
M+FM
F
M+F
M
F
M+FM
F
M+F
M
F
M+ F
M
F
M+F
.06_.27-.07
,20.t4.18
.18-.22
.00
.51_*
.75**
.62* *
.28
.20
.25
.19,7L**.46**
.06
.48
.19
.75**
.85**
.78* *
.46*
.40,44* *
-.11.06
-.04
042909
-.04-.23-.L2
- .25- .09-.20
.15
.30
.21
_)1.18
-.07
.10
.35
.L9
.4r"28.36*
,49,L2.33
Skelet.Age
* Coefficients significant at p < ,05
** Coefficients significant at p < .01
++ Difference between males and females significant at p < .01
rf In this and the following tables coefficients differing fron zeroat the S% and the L% level were arbitrarily classified as follows:"hightt relation, r > 0.80; rrmoderatetr relation, 0.80 > r > 0'40;rrlo"rr relation, r < 0.40, disregarding sign and according toGARN ('s8) .
S Although records were obtained from 50 males and 32 females, therewere nány missing observations in the series. Consequently, thecorrelation coefficients reported in this and subsequent tableswere derived from the availabLe observations, which in nostinstances numbered less than the total.

- 106-
TABLE 18 (continued)
OSSIFICATION EVENT STATURE VELOCITY
Magnitude Chron.Age Skelet.Age
SESAMOID
Chron.Age
Skelet . Age
SESAMOID-Stape 1
Chron.Age
Skelet.Age
SESAMOID-Staqe 2
Chron.Age
Skelet.Age
SESAI\,IOI D-Stase 3
Chron . Age
SkeIet.Age
-.t4- .09-.t2
,20.16.19
M
F
M+FM
F
M+F
-.10.12
-.02
.84**
.85**
.84**
.s2**,47.51**
.65**
.15
.50**
M
F
M+FM
F
M+F
Insufficient paired observations- .38 .89* .35Insuff icient paired observations
Insufficient paired observations-.07 .63 .23Insufficient paired observations
M
F
M+FM
F
M+F
-.43,64 **
- .03
- .27.40
- .03
,92**,82**.89**
.81** , ,T1
-.11.57**
.4t
.08
.30
.87**,46.78**
-.17- )q,
-.2t
.90**
.84**
.82**
.13
.2t
.t7
.47*
.20
.36*
M
F
M+FM
F
M+F
- .06-.26-.15
.4L
.55*,47**
**
++
Coefficients significant at p < .05
Coefficients significant at p < .01
Difference between males and fenales significant at p < .01

-L07 -
TABLE 19(a) Correlations between tining and rnagnitude of peak velocityin facíat dinensions and stature in 50 males and 32 females.
FACIAL DIMENSION STATURE
Magnitude Chron.Age Skelet.Age
ANTE RIOR CRANIAL BASE LENGTH
(n-s)
Magnitude
Chron. Age
Skelet.Age
MAXILLARY JAW BASE LENGTH
(pn-sp)
Magnitude
Chron. Age
Skelet.Age
.31,L7.25
.32
.04,20
-.38.12
-.18
.45
.26
.37,k
M
F
M+FM
F
M+FM
F
M+F
- .07.28.08
.27
.13
.2L
.38
.02,22
.87**
.76**
.95**
.03
.43
.19
,46.20,34
M
F
M+FM
F
M+FM
F
M+F
.03
.04
.04
,34-.02
.18
.53*aa
A.r*
- ,4L.54++.00
- .05- .03-,04
- .09-.26-.t7
.11
.L3
.12
,32.78**.56**
* Coefficients significant at p < .05
** Coefficients significant at p < .0L
++ Difference between males and fenales significant at p < .01

- 108-
TABLE 19(b)
FACIAL DIMENSION STATURE
Magnitude Chron. Age Skelet. Age
TOTAL LENGTH OF MA}IDIBLE
(pg-ar)
Magnitude
Chron. Age
Skelet.Age
CORPUS LENGTH OF MANDIBLE
(pg-go)
Magnitude
Chron. Age
Skelet. Age
.05- .51- .19
.28
.50,37*
.7 2t'*
.38
.62**
292728
M
F
M+FM
FM+F
M
F
M+F
- .35-.40-.36*
- .49*-.51*- .50**
.78**
.7gn*
.78**
.56**.22.46**
.56**
.43
.51**
-.31-.31-.3L
- .39-,r4- .30
.12-.39- .06
M
F
M+FM
FM+F
M
FM+F
.25
.59
.30
-.25- .06-.18
.88 **,67 **.g3**
-.15-.34-.22
. B7*x ++
.31
.73**
.49*- .09
.28
* Coefficients significant at p < .05
** Coefficients significant at p < .01
++ Difference between males and females significant at p < .01

-109-
TABLE 19(c)
FACIAL DIMENSION STATUPT
Magnitude Chron. Age Ske1et.Age
RAI4US HEIGHT 0F I'IANDIBLE
(ar-go)
Magnitude
Chron. Age
Skelet. Age
MORPHOLOGICAL FACE HEIGtrIT
(n-gn)
Magnitude
Chron. Age
Skelet. Age
M
F
M+FM
FM+F
M
F
M+F
M
FM+F
M
FM+F
M
F
M+F
.27
.20
.24
-.11-.02- .08
.15-.4L-.15
-,25-,28-.26
.13
.64"
.35*
-.02.20.07
- .01.08.02
,28.05.18
- .16.15
- .06
-.10- .31-.20
.23,L4.11
L2382t
-,37.34
- .15
.04
.06
.00
.85**
.84**
.84**
.39
.39
.59*
.43,t2.34
.50*
.25
.42*
* Coefficients significant at p < .05
** Coefficients significant at p < .01
++ Difference between nales and fe¡nales significant, at p < .01

-110-
rABLE 19 (d)
FACIAL DIMENSION STATURE
Magnitude Chron.Age Skelet.Age
UPPER FACE HEIGHT
(n-sp)
Magnitude
Chron. Age
Skelet.Age
MANDIBULAR FACE HEIGHT
(id-gn)Magnitude
Chron. Age
Skelet. Age
- .05-.16- .08
-.22-.2L-.2t
- .06.09
- .01
.15
.2t
.t7
M
FM+F
M
F
M+FM
FM+F
M
F
M+FM
F
M+FM
F
M+F
313031
-.22.44
-.02
.35
.11,28
.3t,34.32
.45-.14
.27
.37
.4s
.40*
.09-.62*- .15
- qO* J.
.15- .42"
- .04.08
- .01
.28
.32
.29
.69**-.22
.50**
.90**
.72*
.96**
++
-.2L.09
-.11
.80**-.01
.64**
++
*
**
++
CoeffÍcients significant at p < .05
Coefficients significant at P < .01
Difference between males and females significant at p < .01

- 111-
TABLE 19(e)
FACIAL DIMENSION STATURE
Magnitude Chron.Age Skelet.Age
MIDDLE FACE HEIGHT
(pr-id)Magnitude
Chron. Age
Skelet. Age
POS TERIOR UPPER FACE HEIGHT
(pn-s)
Magnitude
Chron. Age
Skelet. Age
-.L2-.L2-.12
.02
.7gx
.28
M
F
M+FM
F
M+FM
F
M+F
,22,27,23
.39
.56
.44*
400829
.37- .51
.L9
.35-.27
.t7
- .09.22
- .01
-.11.14.00
-.40.25
-.t4- .06
.26
.09
.04_.26- .05
M
F
M+FM
F
M+FM
F
M+F
.80**
.7 6**,79x*
.30
.05,20
.11
.06
.09
.44
.15.31
.35-,L7
.L2
.53*
.10
.34
* Coefficients significant at p < .05
** Coefficients significant at p < .01
++ Difference between males and fenales significant at p < .01

TABLE 20(a)
-tr2-
Correlations between tining and magnitude of peak velocityin facial dimensions and time of appearance of the hook ofhanate observed on serial hand and wrist roentgenograms in50 males and 32 females.
FACIAL DIMENSION HAMATE-STAGE 1 HAMATE-STAGE 2
Chron.Age Skelet.Age Chron.Age Skelet.Age
(n-s)Magnitude
Chron.Age
(pm-sp)Magnitude
Chron.Age
Skelet.Age
(pg-ar)Magnitude
Chron.Age
2t3606
M
F
M+FM
F
M+F
M
F
M+FM
F
M+FM
F
Ir,! + F
M
F
M+F010904
M
F
M+F
.00
.28
.13
.29
.06
.11
-.L2-.44-.31
.38
.15
.26
.60
.05
.32
-.13- .39-.23
.24
.55
.28
-.06.04
-.02.39.51*.44* *
-.L7.04
- .09
.19
.43
.32
.09- .08
.02
Skelet.Age M
F
M+F
.01
.49,25
-.02.25.11
- .03.06.01
.13-.11
.01
.20
.01
.11
.29- .01
.15
- .50- .24- .3ó
-.22.29.05
.7 L*
.68*
.69* *
.20
.L7
.19
.61x
.41
.51*
.15
.28
.22
.37- .03
.16
.44
.71**
.60**
.39
. 51*,44**
-.41- .r7-.32
-.25-.18-.22
Skelet.Age M
FM+F
.30
.7 4**
.50* *
.40
.34
.37
.66*
.02
.4r
.15- .03
.07
.45++-.25
.15
* Coefficients significant at p < .05
** Coefficients significant at p < .01
++ Difference between males and fenales significant at p < .01

- 113-
TABLE 20(b)
FACIAL DIMENSION HAMATE-STAGE 1 HAMATE-STAGE 2
Chron.Age Skelet.Age Chron.Age Skelet.Age
(pg -go)Magnitude
(ar-go)Magnitude
Chron.Age
Skelet.Age
(n-gn)Magnitude
Chron. Age
-.10.10
-.02
.01
.t4
.06
.57**
.55*
.57**
.07
.11
.08
,52*.20.24
M
F
M+F064826
Chron.Age M
F
M+FSkelet.Age M
F
M+F
M
F
M+FM
F
M+FM
F
M+F
M
F
M+FM
F
M+FSkelet.Age M
FM+F
.20-,25
.00
-.02- .48-.23
.30
.75* *
.54* *
- .10.02
-.04
.49
.50
.40*
.56- .30
.08
- .50-.23-.26
.16
.59
.32
++
.24- ,37- .03
.20-.25
.01
- .05- .45-.22
.22 ++-.51- .08
-.13.51.13
-.37.13
- .18
-.03-,28-.19
.16
.64*
.40
.30
.7 6*
.50*
- .08.40,L4
.30-.29- .08
-.09-.21-.t4
.09- .54-.ls
-.13-.45-.25
.00-.16- .05
- .08.15
-.02
.05
.50
.22
.58* *
.78**
.65**
,07.08.07
.05
.21
.11
.20-.11
.08
.2t
.02
.13
* Coefficients significant at p < .05
** Coefficients significant at p < .01
++ Difference between males and fenales significant at p < .01

-114-
TABLE 20(c)
FACIAL DIMENSION HAI'IATE-STAGE 1 HAIvIATE-STAGE 2
Chron.Age Skelet.Age Chron.Age Skelet.Age
(n-sp)Magnitude
Chron.Age
(id-gn)Magnitude
Chron. Age
Skelet . Age
(pr-id)Magnitude
Chron. Age
Skelet . Age
.08
.08
.08
.19
.L4,L7
.01
.30.12
M
F
M+FM
F
M+F
400429
- .01M
F
l.'l + F
M
F
M+FM
F
M+F
423926
M
F
M+FM
F
M+FM
FM+F
-.2t- .38-.27
.23
.32
.26
- .04.18.03
-,02-.36-.14
.t7
.56
.32
.28-.23- .08
-.19-.44-.28-.t6
.35
.02
-.10,57.13
.38
.31
.56*
.30
.10
.24
.09
.20
.66**
.75*
.69**
.16
.42
.24
.32
.33
.32
Skelet.Age M
F
M+F
.28- .50- .01
.38
.19
.32
.52-to
,22
- .05-.10- .04
.08
.58
.20
.2s
.20
.23
.43
.16
.36
.L3- .06
.07
- .09.04
- .05
.08
.07
.03
.27
.92'"
.50*
.38
.25
.34
.10-.07
.05
.13
.25
.L7
.10- .40- .11
.16-.40- .08
* Coefficients significant at p < .05
** Coefficients significant at p < .01
++ Difference between malçs and fenales significant at p < .01

-115-
rABLE 20(d)
FACIAL DIMENSION HAI'IATE-STAGE 1 HAN{ATE-STAGE 2
Chron.Age Skelet,Age Chron.Age Skelet.Age
(pn-s)Magnitude
Chron. Age
M
FM+F
M
FM+F
.04-.L4-.04-.L2
.581,27
- .18-.67*- .43*
.10- .40-,L2-.28
,17- .09
.05- .66*-.32
.03
.19
.10E.o* *
.79**
.68**
.27
.04,L7
.06
.07
.07
.16
.36
.24
450930
Skelet.Age M
F
M+F
* Coefficíents significant et p < .05
** Coefficients signífÍcant at p < .01
++ Differençe between nales and fenales significant:at p < .01

TABLE 2L(a),
-116-
Correlations between tining and nagnitude of peak velocityin facial dimensions and tine of appearance of pisiformand sesanoid observed on serial hand and wrist roentgeno-grams in 50 males and 32 females.
FACIAL DIMENSION PISIFORM SESAMOID
Chron.Age Skelet.Age Chron.Age Ske1et.Age
(n-s)Magnitude
Chron,.Age
Skelet.Age
(pn-sp)Magnitude
Chron.Age
Skelet . Age
M
FM+F
M
F
M+FM
F
M+F
M
F
M+FM
FM+F
M
F
M+F
.03
.16
.05
-.11-.34-.2I
000803
- .04.04
- .01
.11
.4r
.25
.01
.00
.00
,56**,71**.63**.19.L2.16
.19
.48*
.32*
.18-.16
.02
.44
.02
.23
.22
.24
.23
.34
.34
.34*
.08
.23
.16
- .58*- .59- .49**
-.26.18
- .03
.61**
.42,52), *
.45- .L7
.15
.40
.77**
.63**
.18
.38,29
.57r,
.02
.31
.08
.42
.27
.30
.28,29
-.25-.52*- .40*
*Coefficients significant at p < .05
**Coefficients significant at p < .01
++Difference between nales and fenales significant at p < .01

-tt7 -
TABLE 21(b)
FACIAL DIMENSION PISIFORM SESAMOID
Chron.Age Skelet.Age Chron.Age Skelet.Age
(pg -ar)Magnitude
Chron.Age
(pg-eo)Magnitude
Chron.Age
(ar-go)Magnitude
Chron.Age
Skelet.Age
- .06-.27-.13
_)7-.20-.25
M
F
M+FM
F
M+FSkelet.Age M
F
M+F
M
F
M+FM
F
M+FSkelet.Age M
F
M+F
M
F
M+FM
F
M+FM
F
M+F
.19
.06
.t4
,s2**.60*.55**
.34
.34
.34*
.18
.11
.15
.58**
.03
.58*
- .01- .55*-.28
-.22.07
-.11
-,34.23
- .13
- .t7- .31-.22
.32
.57 *
.42**
.24
.4L
.31
.23- .59- .08
- .15.62**.20
.41
.29
.36*
- .09- .49*-.28
.48*
.10
.31
-.t4-.11-.13
-.48.3g *+
- .08
.65**
.62x*
.64* *
- .09-.14-.11
.39*
.3s
.37"
.78**-.07 ++
,52**
.42
.10,28
.34
.05
.1ó
.34-.2L
.72
- .05- .54*-.27
- .09-.43-.23
.01- .30-.11
-.42- .03
.27
- .01, 56*.23
-,28.t4
-.12++
- .4s.10
-,20
-.32-.33-.32
=.10- .45-.28
* Coefficients significant at p < .05
**'Coefficients significant at p < .01
++ Difference between nales and females significant at p < .01

-118-
TABLE 21 (c)
FACIAL DIMENSION PISIFORM SESAT4OID
Chron.Age Skelet.Age Chron.Age Skelet.Age
(n-gn)Magnitude
Chron.Age
[n-sp)Magnitude
Chron.Age
Skelet.Age
(id-gn)Magnitude
Chron. Age
M
F
M+FM
F
M+FSkelet.Age M
F
M+F
M
F
M+FM
F
M+FM
F
M+F
M
F
M+FM
F
M+FSkelet.Age M
F
M+F
.L8-.22
.07
.44*
.76**
.55**
.07
.34
.15
.10
.04
.08
-.24 ++
.7 r*
.06
- .05- .63*-.25
.19
.59
.26
.33
.33
. 53*
.13
.37
.20
-.22-.62*- .36*
.L2
.08
.11
68* *83**7 sxt
.33
.4t
.36r.
.50
.28
.29
-.13-.02- .09
-.19.15
- .08
-.02.13.03
-.12.36.04
- .05.43.11
.18
.51
.29
-.23 ++
.60*
.05
-.04.25.04
.L7-.15
.08
- .03-.15-.07
.18
.06
.11
- .05-.L4- .08
.26
.18,T4
.05
.09
.05
.56**
.57
.57**,7 5**.46.68**
.48*
.50
.49**
.29
.15
.15
. ó6**
.86**
.73**
.37-.18
.20
.35
.13,29
.44-.24
.24
* Coefficients significant at p < .05
x* Coefficients significant at p < .01
++ Difference between nales and females significant at p < .0L

-119-
TABLE zr(d)
FACIAL DIMENSION PISIFORM SESAMOID
Chron.Age Skelet.Age Chron.Age Skelet.Age
(pr-id)Magnitude
Chron.Age
Skelet . Age
(pm-s)Magnitude
Chron.Age
Skelet.Age
M
F
M+FM
F
M+FM
F
M+F
M
F
M+FM
F
M+FM
F
M+F
- .05-.49-.18
-.24- .35-.27
,L4-.10
.07
-.L7- .05-.r4
.33-.35
.08
-.16,26.01
.25
.51
.28
.22-.51- .01
.58**
.88**
.69**
.59*
.48
.56**
.27
.68*
.40*
.61*
.7 8*,67*t
.45*
.24?o*
290520
- .03- .44-.22
.05
.09
.01
-.13- .56*- .36*
-.10- .49*-.29-.36-.32-.34*-.29-.07-.1.9
.15-.39- .06
.L2-.24-.04
.53**,7 4**.63**
0L2309
*
**
++
Coefficients significant at p < .05
Coefficients significant at p < .01
Difference between nales and females significant at p < .01

TABLE 22(a).
FACIAL DII{ENSION
n-s
- Magnitude
Correlations between timing and nagnitude of peak velocity in facial dimensions and
tine of attaining different stages of naturation in the sesa¡noid observed on serialhand and wrist roentgenograms in 50 males and 32 fernales.
SESA},IOID-STAGE 1 SESAMOID-STAGE 2 SESAMOID-STAGE 3
Chron.Age Skelet.Age Chron.Age Ske1et.Age Chron.Age Skelet.Age
M+F
Chron.Age M
Skelet.Age M
Insufficient pairedobservations
-.59 -.60Insufficient paired
observations
Insufficient pairedobservations.7 4* .44
Insufficient pairedobservations
Insufficient pairedobservations.25 .20
Insufficient pairedobservations
.85*
.56.28
- .01
M
F
F
M+F
F
M+F
.44
.52.28.05
.20
.10.38
- .05
.49*
.7 4r'*
.L7
.14
.85**
.L2
.54*
.L6
.56*
.66**
.61**
.2L
.32
.38
IPt\)oI
.65-.11
.26
.04-.10
-.03
.35
.23
.08
.15
*
**
++
Coefficients significant at p < .05
Coefficients significant at p < .01
Difference between males and females significant at p < .01

rABLE 22(b)
FACIAL DIMENSION
SESAMOID-STAGE 1 SESAMOID-STAGE 2 SESAMOID-STAGE 5
Chron.Age Skelet.Age Chron.Age Skelet.Age Chron.Age Skelet.Age
pn-spMagnitude M
Chron.Age M
Skelet.Age M
Insufficient pairedobservations.2t .57
Insufficient pairedobservations
Insufficient pairedobservations.81* .28
Insufficient pairedobservations
Insufficient pairedobservations.55 .23
Insufficient pairedobservations
.36-.02
.50
.90**.30.64*
.08
.44
29
.69
.58
.63**
2909
554s
.16
.09F
M+F
F
M+F
F
M+F
-.02
.L6
.24-.t4
.01
-.11
.75**
04
48*
.53*
I
HN)ÉI
.19
.22.20.60
4858
.2L .4L
* Coefficients significant at P < .05
** Coefficients significant at p < .01
++ Difference between males and females significant at P < .01

TABLE 22(c)
FACIAL DIMENSION
Chron.Age M
pg-atMagnitude M Insufficient paired
observations- .42 - .2L
Insufficient pairedobservations
Insufficient pairedobservations.20 .19
Insufficient pairedobsenrations
SESAMOID-STAGE 1 SESAT,IOID-STAGE 2 SESAMOID-STAGE 5
Chron.Age Skelet.Age Chron.Age Skelet.Age Chron.Age Skelet.Age
0934
.05- .30
-.L4_.23
.23
.02.32.00
.29
.56
5528
33
.7 3't't'
.58
F
M+F
IHt\)NI
0813
.10
F
M+F
.66*
.56,7 3**.85**
-.17
.7 1*t
.64*
.68**
.68**
- .10 -.11
.15
.62*t
Skelet.Age M Insufficient pairedobservations
-.t2 -.04Insufficient paired
observations .t2
Coefficients significant at p < .05
Coefficients significant at p < .01
Difference between nales and females significant at p < .01
F
M+F
.78**
.4r*
*
**
++

rABLE 22(d)
FACIAL DIMENSION
SESA},IOID-STAGE 1 SESAMOID-STAGE 2 SESAMOID-STAGE 3
Chron.Age Skelet.Age Chron.Age Skelet.Age Chron.Age Skelet.Age
pg-goMagnitude M
Chron.Age M
Skelet.Age M
Insufficient pairedobservations
-.72 -.92*Insufficient paired
observations
Insufficient pairedobservations.33 -.L3
Insufficient pairedobservations
Insufficient pairedobservations
- .64 -.7sInsufficient paired
observations
F
M+F
F
M+F
F
M+F
3304
3623
3006
-.25.47
08
- .45*.20
-.11
.82**
.55
72**
- .18
.7 6**
.75**
.75**
.14
.48**
.66**
-.19
.56**
.68**
.20
.49**
.34
.18 I
HN)(^¡I.27
.51
.19.67 *.13
.18 44
*
**
++
Coefficients significant at p < .05
Coefficients significant at p < .01
Difference between males and fenales significant at p < '01

TABLE 22(e)
FACIAL DIMENSION
ar-goMagnitude M
Chron.Age M
Skelet.Age M
Insufficient pairedobservations
-.40 -.27Insufficient paired
observations
Insufficient pairedobservations.53 .15
Insufficient pairedobservations
Insufficient pairedobservations
-.09 -.18Insufficient paired
observations
SESAMOID-STAGE 1 SESAMOID-STAGE 2 SESAMOID-STAGE 3
Chron.Age Skelet.Age Chron.Age Skelet.Age Chron.Age Skelet.Age
.t2- .61
.07
.01-.16-.33
- .01-.07F
M+F
F
M+F
F
M+F
.69*
.59.02
- .01-.03
.s7-.15.t4
_)L
.65**
.13-.24
-.07
-.04
.01
-.23
.24
- .43-.57
-.51*
- .03
- .05
I
tsN)ÞI
.15-.t4
-.07- .51
-.01 32
*
**
++
Coefficients significant at p < .05
Coefficients significant at p < .01
Difference between nales and fe¡nales significant at p < .01

rABLE 22(f)
FACIAL DIMENSION
n-gn
-Magnitude
Chron.Age M
Skelet.Age M
Insufficient pairedobservations.75 .75
Insufficient pairedobservations
Insufficient pairedobservations
-.s1 -.s1Insufficient paired
observations
Irsufficient pairedobservations
-.53 -.53Insufficient paired
observations
SESAMOID-STAGE 1 SESAMOID-STAGE 2 SESAMOID-STAGE 3
Chron.Age Skelet.Age Chron.Age Skelet.Age Chron.Age Skelet.Age
M
.28-.2I
.r4
.43.06
-.62.06
- .61F
M+F
F
M+F
F
M+F
.L3
.73**
.68
.7t
.23
.23 18
.7 4**
.92x*
,82**
33
-.t7
.14
.30.39.7 4*
I
HN)(/r
I
.4t- .07
.59
.19.2L.54
00
,L7
.52**
.43*
3459
*
**
++
Coefficients significant at p < .05
Coefficients significant at p < .01
Difference between nales and females significant at p < .01

rABLE 22(e)
FACIAL DIMENSIONSESAI\4OID-STAGE 1 SESAMOID-STAGE 2 SESAMOID-STAGE 3
Chron"Age Skelet.Age Chron.Age Skelet.Age Chron.Age Skelet"Age
n-sp
-Magnitude M
Chron.Age M
Skelet.Age M
Insufficient pairedobservations.19 .1s
Insufficient pairedobservations
Insufficient pairedobservations
-.1s -.10Insufficient paired
observations
Insufficient pairedobservations
- .42 -.20Insufficient paired
observations
30
.55-.02
-.04-,26
,4L
"10
.34 - .13 .32
.07 _)? .06
.23
.38.03)L
_?)-.t3
-.07-.r3F
M+F
F
M+F
F
M+F
.12 -.20 09
.08
.04
.07
0L
ItsN)o\I
.34
.40"11
-.4t.26
-.47.19.44
*
**
++
Coefficients significant at p < .05
Coefficients significant at p < .01
Difference between males and females significant at p < "01

TABLE 22(h)
FACIAL DIMENSION
id-gnMa gnitude M
Chron.Age M
Skelet.Age M
Insufficient pairedobservations.35 .25
Insufficient pairedobservations
Insufficient pairedobservations.79 .52
Insufficient pairedobservations
Insufficient pairedobservations.03 -.08
Insufficient pairedobservations
SESAI\4OID-STAGE 1 SESAMOID-STAGE 2 SESAMOID-STAGE 3
Chron.Age Skelet.Age Chron"Age Skelet.Age Chron.Age Skelet.Age
.04
.49
.17
.90**
.75
86* *
5928
.37
.22
.14
.55*
-.t4.09
-.07
.69**
.79*
.72t'*
.25
22
.59*
.40
.54**
.55**
.23
.192126F
M+F
F
M+F
F
M+F
4238
I
FN){I
.65*
.25.34.08
.68*21
*
**
++
Coefficients significant at p < .05
Coefficients significant at p < .01
Difference between males and fenales significant at p < .01

rABLE 22(1)
FACIAL DIMENSION
pr-idMagnitude M
Chron.Age M
Skelet.Age M
Insufficient pairedobservations.63 .63
Insufficient pairedobservations
Insufficient pairedobservations
-.s1 -.s1Insufficient paired
observations
Insufficient pairedobservations
-.55 -. s3Insufficient paired
observations
-.01.80
.25- .01
.02
.20
SESAIvIOID-STAGE 1 SESAMOID-STAGE 2 SESAMOID-STAGE 3
Chron.Age Skelet.Age Chron.Age Skelet.Age Chron.Age Skelet.Age
F
M+F
F
M+F
F
M+F
.37
.33
.36
.43-.28
.26
.52
.27
.46
.88
02
-.4L
.18
.63**
.22
.07
.37
.2L
++*.64*.60
.27
.60I
tst\)OoI
-.11- .86
.46**- .95*
.43-.26
.25
.t4
*
**
++
Coefficients significant at p < .05
Coefficients significant at p < .01
Difference between males and fenales significant at p < .01

rABLE 22(j)
FACIAL DIMENSION
pn-sMagnitude
Chron.Age M
Skelet.Age M
Insufficient pairedobservations
-.11 -.63Insufficient paired
observations
Insufficient pairedobservations.7 4 .22
Insufficient pairedobservations
Insufficient pairedobservations
- .01 - .51Insufficient paired
observations
.51
.72*.02.18
SESAT,IOID-STAGE 1 SESAMOID-STAGE 2 SESAMOID-STAGE 3
Chron.Age Skelet.Age Chron.Age Skelet.Age Chron.Age Skelet.Age
M
- .18.t4
-'61**48
-.L7
09
-.15- .05
-.10
.30
.20
.25
.85**
.66**
.78**
0s
.4t
.23
.33
.63**
.25
.48**
'74****.46
19
FM+F
IHNJroI
F
M+F
FM+F
04
.61 **
.07-.19
.37- .43
++
-.05
* Coefficients significant at p < .05** Coefficients significant at p < .01
++ Difference between males and females significant at p < .01

TABLE 23.
VARIABLE
PISIFORM
FIAIvÍATE
Stage 1
Stage 2
SESAT4OID
.7 4**
.87r'*
.80**
.66**
.45*
.59**
.67**
.83**
.74**
SESAI\40ID
.67**
.54**
.62**
.90*
.56
.69**
.85
.49.61
.99
.95**
.00
.61*
.41
.53**
.81**
.86**
.85**
1.00.89**.00
correlations between tine of appearance (chronological age) ofossification eVents observed on serial hand and wrist roentgenograms
in 50 males and 32 females.
HAI\4ATE
Stage 1 Stage 2
SESAMOID SIZE
Stage 1 Stage 2 Stage 3
M
F
M+F
M
F
M+FM
FM+F
M
F
M+F
.65* *
.67**
.64**
.56**
.7t**,62"*
.57 *
.48**
.67**
.78**
.68* *,75**
430545
.88**
.87**
.87**
I
F(^oI
1
1
000000
.89**
.88**
.89**
*
**
++
Coefficients significant at p < '05
Coefficients significant at p < '01
Difference between nales and fenales significant at p < .01

TABLE 24. Correlations between time of appearance (skeletal age) of ossificationevents observed on serial hand and wrist roentgenograms in 50 nalesand 32 fenales.
HAMATE SESAI\4OID SESAI"IOID SIZEVARIABLE
Stage L Stage 2 Stage 3Stage I Stage 2
PISIFORM
HAT,IATE
Stage 1
Stage 2
SESAIVIOID
M
F
M+F
M
F
M+FM
F
M+F
M
F
M+F
.s2**
.46
.50**
.29
.01
.19
.42*- .16
.2L
.38- .03
.23
++
.59**
.47*
.55**
.t7
.26
.23
.55-.24
.10
1.00.59*.00
.34- .05
.18
.77**
.35
.64**
.25_.29-.L6
.50*-.42
.47*
-.25.7 4*.00
.3r
.53
.40*
274007 I
F(¡¡FI
.46*-.2L
.22
000000
1
1
.59**
.43
.55* *
*
**
++
Coefficients significant at p < .05
Coefficients significant at p < .01
Difference between nales and females significant at p < .01

TABLE 25. Correlations between the nagnitude of peak velocity in facial dimensionsin 50 nales and 32 fernales.
VARIABLE pm-sp pg-ar pg-go ar-go n-gn n-sp id-gn pr-id Pn-s
n-s
pn-sp
pg-ar
pg-go
ar-go
n-gn
M
F
M+FM
F+FM
393759
M
F+FM
M
F+FM
M
F+FM
M
F
M+F
.10
.18
.15
-.11-.10-.11
.35
.22
.10
-.24-.07-.t7
.02-.42-.15
.68* *
.29
.56**
-.02.15.0s
.30- .53
.00
.22-.59- .13
103318
.55*
.16
.58*
.27
.s1
.41*
-.2t.4s.t2
.L7
.15
.16
.85**
.58*
.76**
.36
.08
.25
- .01.33.L4
.30**
.03
.L7
.19
.03
.L2
.20
.23
.2t
.13-.03
.07
.00
.49
.22
- .09.4t.19
.07
.25
.06
-.19.36.07
*
.30
.03
.2L
.10
.2L
.t4
,32.L2.16
.19++
.58*
.09
-.L6.t2
-.07
.10
.06
.05
.16
.56
.32
¡
F(¡¡NI
.22
.04
.13
.49
.13
.37
.s7*-.13
.40*
.33
.28
.3r
052313
*
383838
*
**
++
Coefficients significant at p < .05
Coefficients significant at P < .01
Difference between nales and females significant at p < .01

TABLE 25 (continued)
VARIABLE pn-sp pg-ar pg-go ar-go n-gn n-sp id-gn pr-id pn-s
n-sP
id-gn
pr-id
11010ó
M
F
M+F
M
F+FM
IH(^(¡¡I
M
F+FM
.38
.15
.32
.2t,14.20
.22
.28
.24
.31
.L4
.25
,33.26.31
*
**
++
Coefficients significant at P < .05
Coefficients significant at P < .01
Difference between nales and fenales significant at p < 01

TABLE 26. Correlations between tine (chronological age) of peak velocity in facialdimensions in 50 males and 32 fenales.
VARIABLE pn-sp pg-ar pg-go ar-go n-gn n-sp id-gn pr-id pm-s
n-s
pn-sp
pg-ar
pg-go
ar-go
n-gn
.51
.68
.61* *
'87****.52*.78**
.90**. .??
.55*
.90**
.56**
.69*
.55**
- .08++.84**.54* *
.84**
.39**
.79**
.48++
.90* *
.7 4t'*
,7 4**.90**.82**
.7 7 t'*
.64*
.7 3t'*
.56**
.60
.50**
.76**
.63*
.70**
.46
.57
.50**
.48*
.32
.43*
.88**
.49*
.81* *
.4s
.7 3*
.58**
.44
.76
.45*1 1**
.75*
.73* t
.59
.53
.45*
.50*
.28,44*
.66**
.7 2*
.68**
.85**
.76**
.81**
.3L
.68**
.53**
.82r'*
.47', a,* *
.80* *
.62**
.7 3t'*
.54*
.60* *
.57**
.90**
.7 3**
.78* *
M
FM+F
M
F+FM
M
F+FM
M
F+FM
M
F+FM
M
F
M+ F
.39
.80**
.66**
.59*
.58* *
.59**
.89* *-ra*.*
.94**
.55**
.7r*t,
.62**
.39
.61*
.49* *
.89**'26**.76**
.88**
.13+*
.73**
IP(^èI
.72**
.51
.65**
.55*
.66
.58**
Coefficients significant at p < .05
Coefficients significant at p < .01
Difference between nales and females significant at p < .0L
.4L
.61*
.49**
.11
.7L*
.38
.79**
.65 *
.75* *
2S3428
*
**
++

TABLE 26 (continued)
VARIABLE pn-sp pg-ar pg-go ar-go n-gn n-sP id-gn pr-id Pm-s
n-sP
id-gn
pr=id
*
**
++
340824
M
FM+F
M
F+FM
M
F+FM
.67**
.s1
.64**
.53
.48
.51*
.56*
.40.51* *
.79**
.66**?tr**
4S4847
IP(^(tlI
*
Coefficients significant at p < .05
Coefficients significant at P < .01
Difference between males and fenales significant at P < 01

TABLE 27. Correlations between time (skeletal age) of peak velocity in facialdimensions in 50 males and 32 fenales.
VARIABLE pn-sp pg-ar pg-go ar-go n-gn n-sp id-gn pr-id pn-s
n-s
pn-sp
lg-ar
pg-go
ar-go
n-gn
M
F
M+FM
F+FM
IP(^OrI
M
F
M+FM
F+FM
F+F
M
M
M
FM+F
.61*
.62t'*
.62**
.70**
.39
.55**
,7 4**.52.66**
.58
.52*
.54* *
.7 3**
.7 4**
.7 4**
.57*.59*.58**
.95* *
.61***
.86**
.05
.55*
.36
.55*
.78**
.68* *
.56*
.48
.52**
.61* *
.45
.55**
.19
.59*
.40*
.48*
.82**
.66**
.55*
.43
.51**
.82**
.54
.73t'*
.65**
.62*
.64* *
.54.7 4*.64**
.52"
.36
.47*
.77*x
.91**
.84**
.7 7 t'*
.82**
.79**
,70*.36.58**
.87**
.22+*
.69* *
.88* *
.06++', 1,rc *
.43
.30
.37
.60*
.42.53**
.38
.47
.42
.62*
.49
.56* *
.46
.11
.33
.53*
.75**
.66**
.44
.45
.44r,
.7 4* r,
.06++
.51**
.76**
.7r**
.7 4t'*
.4L
.78*
.58**
.39
.35
.37
.05
.4t
.t7
.64*
.42
.53**
.56*
.26
.45*
.44
.L7
.34
*
**
++
.59*
.68
.62**
Coefficients significant at p < .05
Coefficients significant at p < .01
Difference between males and females significant at p < .01

TABLE 27 (continued)
VARIABLE pn-sp pg-ar pg-go ar-go n-gn n-sp id-gn pr-id Pn-s
n-sp
id-gn
pr-id
*
**
++
M
FM+F
430824
M
F+FM
M
F+FM
.39
.t7
.34
.33
.76
.43
.79**
.52
.7L*t
.61
.18
.44
.23
.10
.18
IfJ(r¡\¡I
Coefficients significant at P < .05
Coefficients significant at p < .01
Difference between males and fenales significant at P < .01

-138-
DISCUSSION
To sirnplify the discussion, the correlation analysis will be dis-
cussed under the following headings:
* osslfícation events and statu¡e
* stature and facial growth
* ossification events and facial growth
* ossification events
* facial growth
Diagrams identify the matrlx segment being described.


-140-
OSSIFICATION EVENTS AND STATURE
Refer TABLE 18
In both nales and females associations between the chronological ages-
at-appearance of the sesamoid and peak velocity in stature were high
(r = 0.84 in males and r = 0.85 in females). These values were slight-
ly in excess to those values given by n.lönK and HELM (t67), where
r = 0.75 in ¡na1es and r = 0.57 in females. Moreover, a high correlation
(r = 0.92) existed between the chronological age at peak velocity in
stature and sesamoid-stage 2 in ¡nales. Chronologic age at peak stature
was moderately correlated with chronological age-at-appearance of the
pisiform (r = 0.62) and ossification of the hook of the hamate-stage 2
(r = 0.78).


-L42-
STATURE AND FACIAL GROWTH
Refer TABLE 19(a), (b), (c), (d) and (e)
High correlations were found between the chronological ages at peak
velocity in stature and peak velocity in n-s (r = 0.83), pg-go
(r = 0.83), n-gn (r = 0.84) and id-gn (r = 0.86). In males,
chronological age at peak velocity in mandibular face height showed
an extre¡nely high correlatíon (r = 0.90) iTable 19(d)) with chrono-
logical age at peak velocity in statule. The correlations between
chronological ages at peak velocity in stature and various facial
dimensions differed significantly from zero for aIl variables except
n-sp {Table 19(d) }.

\

-144-
OSSIFICA'|ION EVENTS AND FACIAL GROI,IITH
(Refer Tables 20, 27 and 22)
HAMATE.. Stage IHAMATE.. Stage 2
Refer Tables 20(a), (b), (c) and (d)
Chronological age at peak velocity for pm-sp, Pg-ar and pr-idshowed a somewhat stronger association with chronological age-
at-appearance of hanate-stage 1 than with hamate-stage 2.
'fhesc correlati.ons were noderate in all j.nstances except pr-id,wlrich revealed a high correlation (r = 0.92) in females
(Tab1e 20c). Chronological age-at-appearance of harnate-stage
2 was.moderately correlated with chronological age at peak
velocity for the variables, r-s (r = 0.44), pm-sp (r = 0.60),
pg-ar (r = 0.44), pg-go (r = 0.57), n-gn (r = 0.65), id-gn
(r = 0.ri9) and pm-s (r = 0.68). It was not significantlycorrelated with variabJes ar-go (r = 0.15) (Table 20b), and
pr-id (r = 0.34) (Table 2Oc) .

-14s-
Refer Tables zl(a), (b), (c) and (d)
PISIFORM
The chronological age-at-appearance of the pisiforn was
only noderately correlated with chronological age at
peak r¡elocity in several facial dimensions. The re¡nainder
of the correlations were non significant. However, a
significant sex difference was shown for the association
between chronological ages-at-appearance of the pisiforn¿nd at peak velocity in ar-go (in males, r = 0.15 and
in females r = 0.62 (Table zlb).

-t46-
Refer Tables 2I(a - d) and 22(a - j)
SESAMOID
SESAMOID STAGES
The chronological age-at-appeArance of the sesamoid was only
moderately correlated with chronological age at peak velocityin nost facial dinensions. 'l'he correlations between the age-
at-appearance of sesamoid and peak velocities of the variables
ar-go (r = 0.23), n-sp (r = 0.33) and pr-id (r = 0.39) were
the exce;;tions. Ilowever, the time of peak velocity of the
variable ar-go was noderately correlated (r = 0.65) with age-
at-appea-rance of sesarnoid-stage 2 (Table 22c) . The associ-
ations between chronological ages at peak velocity in facial-
dimensiolrs and the sesamoid were somewhat stronger as the
sesarnoid increased in size. In fact, chronological ages-at-
appearances of sesamoid-stage 2 and sesanoid-stage 3 were
highly correlated with tine of peak velocity of variablesi.d-gn (r = 0.86) (Table 22h) and n-gn (r = 0,82) (TabLe 22f)
respectively.


-148-
OSSIFICATION EVENTS
Refer TABLES 23 and 24
Chronological ages-at-appearance of the pisiform and hamate-stage 1
were highly correlated (r = 0.80) (Table 23). A similar association
was evident between ha¡nate-stage 2 and sesanoid-stage 2 (r = 0.83)
(Table 23). Most other varíables considered in this section were
only moderately correlated.


- 150-
FACIAL GROWTH
Refer TABLES 25, 26 and 27
Coefficients of correlation indicated a general low relationship be-
tween the nagnitude of peak velocity in nost facial dimensions.
Table 25 shows four coefficients were noderate and 38 did not differ
significantly fron zero at the p = 0'05 level' The significant
correlations might be expected topographically, as reference points
were shared. Magnitude of peak velocity of variable pm-sp was
noderately correlated (r = 0.41) with the variable pg-ar but revealed
no marked associations with other facial variables. The apparent
indeperdence of facial components is not surprising because the facial
skeleton is nade up of a number of bones all of which may be subject
to a variety of influences during growth.
Correlations between the chronological age at peak velocity in the
facial dimensions were generally strong, TabLe 26 shows five co-
efficients were high, 57 were moderate and three did not differ sig-
nificantly from zero at the 0.1 level.

- 151-
SUMMARY
1. In both males and females associations between the chronological
ages-at-appearance of the sesanoid and peak velocity in stature
were high
2, Generally, moderate to high coefficients of correlation were
found between the chronological ages at peak velocity in stature
and peak velocity in nost facial dimensions. However, in males,
chronological age at peak velocity in mandibular face height
showed an extrenety high correlation with chronological age at
peak velocity in stature"
3" Of the selected ossification events only the sesamoid was mode-
tately correlated with chronological age at peak velocity in
most facial dimensions. The associations between chronological
ages at peak velocity in facial dimensions and the sesamoid were
somewhat stronger as the sesamoid increased in size.
4. The chronological ages-at-appearance of the pisiforrn and hamate-
stage 1 were highly correlated. A sinilar association was evident
between hamate-stage 2 and sesamoid-stage 2"
5" Coefficients of correlation revealed a general low relationship
between the rnagnitude of peak velocity in most facial dimensions.
However, a generally stronger relationship existed between the
chronological age at peak velocity in the facial dinensions.

CHAPTER VIl
RELATIONS IN TIME BETWEEN GROWTH EVENTS
The intervals between the time of initial appearance of ossification
events observed on hand and wrist roentgenograms and the time of maximum
growth velocity in stature and various facial dimensions were determined.
In each paired comparison the interval was recorded in decimal years as
the difference between the mid-points of the years in which the two events
occurred "
METHODS
For each subject the time of initíal appearance of the selected car-
pa1 ossification centres and the calculated tine of peak growth velocity
in stature and facial dimensions were entered on punched cards " Time
was recorded as chronological age as previously discussed" A computer
was used to deterrnine the time intervals between all paired events"
One hundred and fifty three such conparisons were made; they are listed
in Appendix C "
The time intervals were calculated for males and females separately"
Descriptive statistics, in the form of the mean, error of the mean'
standard deviation and range, u/ere computed in each instance" For con-
venience, time intervals between events were classified on a scale
ranging from -5 to +3 as follows:

-153-
Classification of timing differences
Category
(-3)(-2)
( -1)(0)
(1)
(2)
(3)
Years
iq<
-1.5 <
-0.5 <
0 "5 <
1.5 <
2"5 <
Years
-2.5-1.5-0 .5
0.5
1.5
2.5
T
T
T
T
T
T
T
where T = tíme difference in decimal years between events
For example, if the interval between the timing of two events
fe11 between -0"5 and 0.5 years, the events were regarded as occurring
simultaneously and the interval was categorized as 0 "
A statistical sign test (DIXON and MOOD, '46) was used to determine
the significance of the difference between the number of subjects with
positive and negative time intervals between the occurrence of two events,
that is the significance of differences between the number of subjects
where one event followed or preceded the other"
RESULTS
Tables 28 - 32 list 48 time differences between variables for males
and females separately" Significant differences between the timing of
two events, as determined by the sign test referred to above, are desig-
nated in the tables according to the probability levels of 5% (*) and
L% (**) .

- 1s4-
Table 53 lists all paired comparisons in which there were no sig-
nificant differences between the number of subjects having one event
either preceding or following the other. That is, in these compari-
sons the event can be taken to occur within the same year.
Tables 34 - 37 list the percentage of subjects in which one event
occurs before or after the other, as well as the mean and standard
deviation of timing intervals between the two events " Male and female
differences in the tine interval between the ossification events studied
and peak velocity in stature as well as the percentage of subjects with
ossification events appearing before peak velocity in stature are i1lus-
trated in Fig" 14 which was drawn from mean values for both sexes"

TABLE 28 "
Paired
Events
STATUREPISIFORM
STATUREHAMATE_STAGE 1
STATUREHAIvIATE-STAGE 2
STATURESESAMOID
**
Time intervals recorded in decinal years, based on chronological age, between peak
velocity in stature and carpal ossification in 50 nales and 32 fenales.
Classification of Tine Interval
22(7 3 .3)1( s"s) 7(41"2)
.3) 1 ( 3.3)
.s)
Earliest0ccurringEvent
PISIFORM
**FLAMATE-
STAGE 1***
HAMATE-STAGE 2
**
SESAMOID**
Subj ect
Nunber-3
N (%)
')
N (%)-1
N (%)0
N (%)1
N (%)2
N (%)3
N (%)
t3(s4.2)11 (68
" 7)M
F
2416
s (20 .8)1( 6"3)
3(r2.s)2(t2.s)
3(L2.s)2(r2.s)
M
F
M
F
16T3
2(t2 "s) 6(37 .s)t( 7 "7) 2(Ls "4) 7 (s3
" B)
1( 5.e) 17(6s(6
5.40.0
1(1(
3.8)6.7)
) 7 (26 "s)s(53"3)
s(3t.2)r( 7 "7)
3(18"8)2(Ls,4)
IFLN(¡lI
M
F
2615
30t7
7 (23s (s2
* Tine difference between paired events significant at p < "05
Time difference between paired events significant at p < .01

TABLE 29. Time intervals recorded in decinal years, based on chronological age, between initialossification of the pisiform and peak velocity in facial dimensions in 50 nales and
32 fenales "
Classification of Time Interval Earliest0ccurringEvents
Paired
Events
Subj ect
Number-3
N (%) N (%) N (%) N (%) N (%) N (%) N (%)
PISIF0RM/n-s ¿519
PISIFORM/pn-sp t718
PISIFORM/pg-ar 2415
s(2I .7) 2( 8 .7) 10 (43 . s)2 (10
" s) 7 (36 .8) s(26 .3)
e(s2.e)s(27 .8)
4(t6.7)2(t3.3)
4(I7.4)4(2r.0) 1( s"5)
M
F
M
F
M
F
M
F
M
F
M
F
1( s.s)2(11.1)
s(22.7)2(10.s)
IÊt,o\
1( s.e)2(tI.t)
4(234(22
s (20 .8)5(20.0)
11 (4s.8)4(26.7)
4(r1(
1( s.e)s(27 .8)
3(138(42
2( e.s)7 (46 "6)
.s)
.2)
2( 8.7)
1( s.s)
P SIFORM*lk
ù
PISIFORM
PISIFORMt< tr
**PISIFORM
**
PISIFORMJr*
**PISIFORM
****
3(t2 "s)6(40.o)
1( 4.2)
PIS IFORM/pg-go 2219
.6) 1o(4s.s) 4(L8.2)
.1) s(26 .3) 3(1s "8)
P IS IFORM/ ar- go 2L15
6(28.6)1( 6 "7)
8(58"1)s(35.3)
e .0)6.7) 1( 6.7)
2( 8.7)PISIF0RM/n-gn 2311
4(r7 "4)6(s4.s)
1o (45. s)2(L8.2)
1( s "5)
1( 4.8)
4(17.4)1( s.1)
3(13.0)2(t8.2)
* Tine difference between paired events significant at p < .05
Tine difference between paired events significant at p < .01**

TABLE 29 (continued)
Classification of Tine Interval Earliest0ccurringEvents
PISIFORM*tç
PISIFORM****
PISIFORM**
PISIFORM**
Paired
Events
Subj ect
Nunber-3 -2 -1
N (%) N (%) N (%)0
N (%)1
N (%)2
N (%)J
N (%)
PISIF0RM/n-sp 23L2
PISIFORM/id-gn 2011
PISIF0RM/pr-id 199
PISIFORM/prn-s 2l18
M
F
M
F
M
F
M
F
No3(
s(2s.0)4(36.4)
significant difference in the timing of the two events2s.o) 1( 8.3) s(4L.7) 3(2s.0)
1( s.0) 10(s0.0) 3(1s.0) 1( s.0)3(27 .3) 3(27 .3) 1( e.o)
No significant difference in the timing of the two events3(33.3) s (ss .6) 1 (11 .1)
No significant difference in the timing of the two events3Q6.h sQ7 .8) 6(33.3) 3(16.7) 1( s .s)
I
tst/l--¡I
* Time difference between paired events significant at p < .05
Tine difference between paired events significant at p < .01**
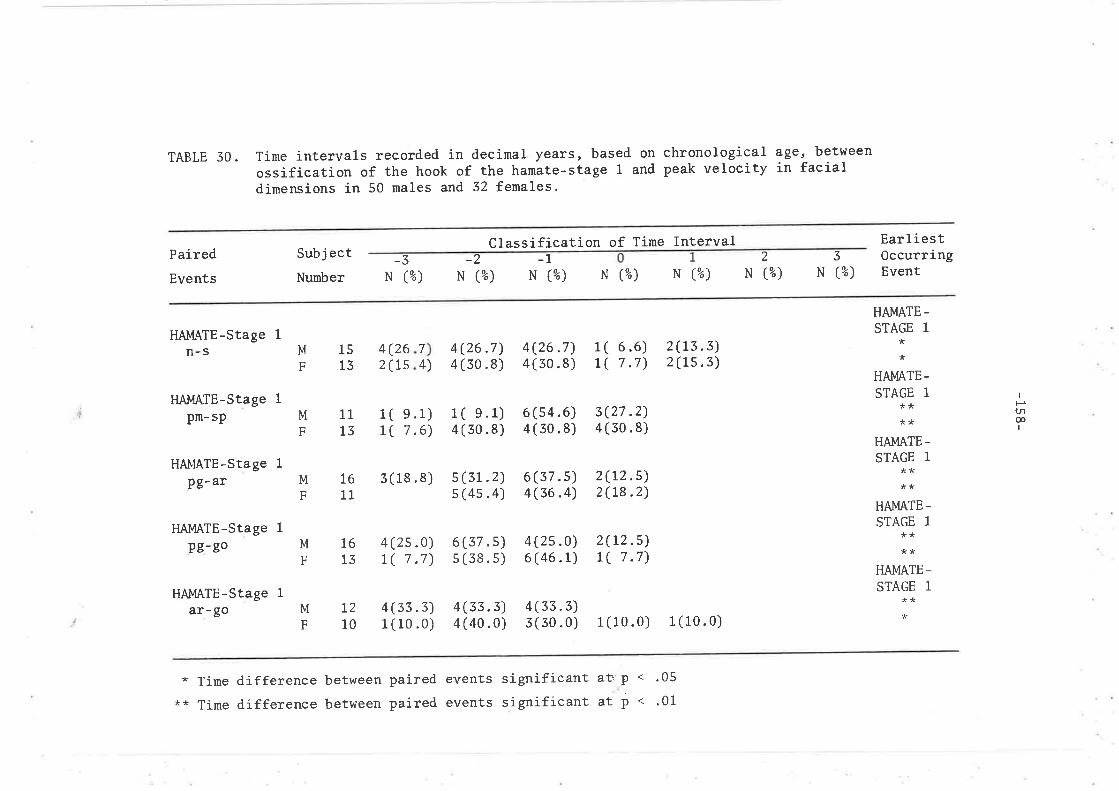
TABLE S0. Time intervals recorded in decimal years, based on chronological age, between
ossification of the hook of the ha¡nate-stage 1 and peak velocity in facialdinensions in 50 ¡nales and 32 fenales.
Classification of Tine IntervalPaired
Events
HAMATE-Stage 1
n-s
HAI,IATE-Stage L
pn-sp
HANIATE-Stage 1
Pg-ar
HAMATE-Stage 1
pg-go
HAI"IATE-Stage 1
ar-go
Subj ect
Number-3
N (%)
2
N (%)3
N (%)
Ear lies t0ccurringEvent
1513 4)
4(2s.0) 6(37 .s)L( 7 .7) s (38. s)
-1N (%) N (%) N (%) N (%)
4(264(50
1 ( s.1) 6(s4.6) 3(27 .2)4(30.8) 4(30.8) 4(30.8)
-2
3)3)
) 2(13.) 2(ts.
4(26.7)4 (30 .8)
6.67.7
7M
F
2(t2.s)t( 7 .7)
4(262(ts
1(1(
1(1(
.7)
.8)
HAMATE-STAGE 1.
**
HAMATE-STAGE 1
****
HAMATE-STAGE 1
****
HAIvIATE-STAGE 1
****
HAMATE-STAGE 1
*
i e .1)7 .6)
M
F
M
F
M
F
33.3).5).o)
M
F
1113
1611
¡
tstnæI
3(13.s) s(3L.2) 6(57.s)s (4s .4) 4(36 .4)
2(t2.s)2(t8.2)
1613
4(2s.0)6 (46 .1)
3340
43 30.0) 1(10.0) 1(10.0)
* Tine difference between paired events significant atrP < .05
** Time difference between paired events significant at p < .01
l210
4(33.3) 4(1(10.0) 4(
((

TABLE 30 (continued)
Paired
Events
Ear Iiest0ccuningEvent
Subj ect
Nunber
t49
((
3544
M
F
Classification of Time Interval0
N (%) N (%) N (%) N (%) N (%) N (%) N (e")
4(28.6) 2(r4.3)3 (33. 5)
3(r7.6) 3(17.6) s(2s.4) 4(23.s) 1(s.e) 1(s.s)No significant difference in the tirning of the two events
s (41 .6) 5 (2s . 0) 2(!6 .7) 2(16 .7)No significant difference in the timing of the two events
No significant difference in the tining of the th,o eventsL(16 .7) s (83.3)
.7)
.4)
HAI\4ATE-Stage 1
n-gn
tlAl"lATE-Stage 1
n-sp
HAI'IATE-Stage 1
id-gn
HAMATE-Stage L
pr-id
HAMATE-Stage L
pm-s 15l2
13.3)2s.0)
M
F
M
F
M
F
M
F
t710
5
42(L4.3)1(11.1)
2C
3(
t( 7 .L)1(11.1)
1(1(
7)5)
68
1(1(
t( 6.7)
HAMATE-STAGE 1
***
HAMATE-STAGE 1
*
HAMATE-STAGE 1
**
HAMATE-STAGE 1
*HAMATE-STAGE 1
**
I
P(/rrc)
I
t28
1s6
6(40.o)4(33.3)
4(26.6)5 (2s .0)
6.7)8.3)
* Time difference between paired events significant at p < .05
Tine difference between paired events significant at p < '01**

TABLE 31(a).
Paired
Event
HAMATE-Stage 2
n-s
HAI,IATE-Stage 2
Pg-go
HAMATE-Stage 2
n-gn
HAMA'TE-Stage 2
id-gn
HAMATE-Stage 2
pr-id
Sub j ect
Nunber
2317
2210
1810
Time intervals recorded in decimal years, based on chronological age, between
ossification of the hook of the hanate-stage 2 and sesamoid, and peak velocityin facial dimensions in 50 males and 32 females.
-3N (%)
-2Classification of time Interval
-1 1
N (%) N (%) N (%) N (%)
2
N (%)3
N (%)
Earliest0ccurringEvent
3023
8(4(
M
F
M
F
4.3)s .s)
1(1(
8)2)
I
o\oI
3.8)s.e)
1(1(
1s(8(
.8)
.s)
*No1(
M
F
8(6(
1( 4.3)2(11.7)
1(4(
4.3)s .s)
1(1(
34.8) tt(47.5s.3) 7 (4L.
1( 4.3)
HAMATE-STAGE 2
**
HAMATE -STAGE 2
**
HAMATE-STAGE 2
*
HAMATE-STAGE 2
**
HAMATE-STAGE 2
t(
M
F
M
F
26L7
3.8)23.s)
s7 .7)47 .I)
1( 5.8)
2311
No significant difference in the tirning of the two events3(27 .3) 3(27 .3) s (4s .4)
36.4) 10(4s.4) 2( s.L)40.o) 5(30.0)
2( s.L) 8
3(30.0) 4
significant difference in the timing of the two events1o.o) 2(20.0) 4(40.0) 3(30.0)
* Time diffeIence between paired events significant at p < .05
Tine diffelrence between paired events significant at p < .01

TABLE 31 (b)
Paired
Events
HAMATE-Stage 2
pm-s
Subj ect
Number-2 -L
lassification of Tine Intervalc3
N (%)
Earliest0ccurringEvent
-3N (%)
2
N (%) N (%) N (%) N (%) N (e")
SESAIÍOID/n-s 2619
SESAI,Í0ID/pg-ar 2616
SESAI\OID/pg-go 2818
1( 3.6) 1(4(2
SESAIT,ÍOID/n- gn 25T2
No significant difference2(L2 .s) e (s6 .3)
No significant difference1( s .3) 1( s .3) e(47 .3)
1( 3.8) 2( 7 .7) 7 (26 .s)No significant difference
in the timing of the two eventss(31.2)
in the tining of the two events7(36.8) 1( s.3)
14 (s3 . e) 2( 7 .7)in the timing of the two events
M
F
M
F
M
F
M
F
M
F
2216
HAMATE-STAGE 2
**SESAMOID
**SESAMOID
*
SESAMOID***
SESAMOID
IPo\FI
3,6)2.2)
s(2s.s) 18(64.3)6(33.3) 7(38.s) 1(s.6)
No significant difference in the timing of the two events2(t6 .7) 4(3s .3) 6 (so. o) *
* Time difference between paired events significant at p < .05
Time difference between paired events significant at p < .01**

TABLE 31 (c)
Paired
Events
Subj ect
Nunber-3
N (%)
Classification of Tirne Interval
N (%) N (%) N (%) N (%) N (%) N (%)
SESAI,IOI D/id - gn
SESAI\,IOI D/pr - id 2010
SESAI'l0ID/pm-s 2518
2411
t( 4.2) 1)6)
M
F
1(1(
2963.
4.2)s .1)
7(7(
14(s8.3) L( 4.2)3(27 .3)
EarliestOccurringEvent
SESAMOID***
SESAMOID
SESAI\OID
**
*No1(
M
F
M
F
significant difference in the tining of the two events10.0) 2(20.0) 3(30.0) 4(40.0)
No significant difference in the tining of the two events3(t6 .7) e (s0 .0) s(27 .8) 1( s .s)
I
Fo\N)I
* Tine Difference between paired events significant at P < .05
** Time Difference between paired events significant at p < .01

TABLE 52. Tine intervals recorded in decinal years, based on chronological age, between carpalossification events in 50 males and 32 females'
Paired
Events
PISIFORMHAtvIATE-Stage 2
PISIFORMSESAI"OID
PISIFORMSESAIvIOID-Stage 1
PISIFORMSESAT,ÍOID-Stage 2
PISIFORMSESAMOIDStage 3
Subj ect
Number
c lassification of Time Interval-3
N (%) N (%) N (%) N (%) N (%) N (%) N (%)
Earliest0ccurringEvent
PISIFORM****
PISIFORM****
PISIFORM
*
PISIFORM**
PISIFORM****
M
F
M
F
M
F
M
F
M
F
322l
6 .3)4.8)
1613
2) s))
s(1s.6) 13(403(14.3) L0(47 1 ( 4.8)
s(13.s) t6(43.2) t4(37.8)3(t2.s) 12(s0.0) 6(2s.0) 2(8.3)
2(r22(ts
s(1(
31.3)7 .7) L( 7 .7)
2(1(
1( 62(ts
s.4)4.2)
2(1(
2( s.s)2(11.8)
L2(37.s)6(28.s)
.6)
.6)
3724
5 No significant difference in the timing of the two eventss 2(22.2) 4(44.4) 3(35.3)
Itso\(¡¡
I
8 (s0 .o)7 (s3.8)44
**)
2tt7
s (23.8)7 (4r.2)
8 (38.1)4(2s.s)
6(28.6)3(17.6) 1( s.s)
* Time difference between paired events significant at p < .05
** Time difference between paired events significant at p < .01

TABLE 52 (continued)
Paired
Events
Classification of Tine Interval2
N (%)3
N (%)
EarliestOccurringEvent
Subj ect
Number-3
N (%)-2
N (%)-1
N (%)0
N (%)1
N (%)
HAMATE-Stage 1
HAI\,IATE-Stage 2
HAI.,IATE-STAGE 1
SESA}MID
HAI,IATE-Stage 1
SESAIvIOID- M
Stage 2 F
HAI\,fATE-StagE 1
SESAIvIOID- M
Stage 3 F
SESAI,!0IDSESAI"IOID- M
Stage 3 F
SESAI"OIDStage 2
SESA},IOID M
Stage 3 F
L7t2
11.8)16.7)
25t7
2(r1.8) 11(64.2(16.7) 4(ss.
s(3(
e)8)
3) 7(26.e) s(27 .
11(7(
6(2s.t)4(22.2)
4238
M
F
2L15
2( s.s)
2( 7 .7)
2s.8) t4(66.7)20 . o) LL(77 .3) L( 6 .7)
STAGE 1****
HAIvÍATE-
STAGE 1***
HAT,IATE-
STAGE 1*
HAMATE-STAGE 1
****
SESAMOID
**
SESAMOID-STAGE 2
**
M
F
2618 1(11.1)
s 1(11 . 1) 4(44.4) 2(22.2) 2(22.2)9 No signifícant difference in the tining of the two events
IHo\ÞI
7)3)
2(2(
2(11.8)4(3s.s)
49
No significant difference in the timing of the th'o events3(t7 .6) 7 (4t.2) 7 (41,2)
No significant difference in the timing of the th'o eventse(1oo.o)
* Tine difference between paired events significant atTine difference between paired events significant at
p<p<**
"05"01

-16s-
TABLE 33(a). Paired comparisons in which there was no significantdifferences between the number of subjects having one
event either preceding or following the other.
Peak velocitY in stature and:
sesa¡noid-stage 1, sesamoid-stage 2, sesamoid-stage 3'
peak velocity in n-s, peak velocity in pm-sp,
peak velocity in PE-at, peak velocity in P8-8o'
peak velocity in at-go, peak velocity in D-Bl¡
peak velocity in n-spr peak velocity in id-gn,
peak velocity in pr-id, peak velocity in pm-s.
Pisiform ossification and:
hamate-stage !, sesanoid-stage 1 (nales only),
peak velocitY in n-sP (males onlY)
peak velocity in pr-id (males only)
peak velocitY in Pn-s (males onlY)
Hamate-stage t ossification and:
sesamoid-stage 1, sesamoid-stage 2 (fenales only),
peak velocity in n-sp (females only),
peak velocity in id-gn (fenales only),
peak velocity ín pr-id (males only).
Hamate-stage 2 ossification and:
sesa¡noid-stage 3, peak velocity in pm-sp'
peak velocity in pg-al, peak velocity in ar-go,
peak velocitY in n-gn (males onlY),
peak velocitY in n-sP,
peak velocity in pr-id (nales only),
peak velocitY in Pn-s (males onlY)

- 166-
TABLE 33(b)
Sesanoid ossification and:
sesamoid-stage 1, sesamoid-stage 2, sesamoid-stage 3 (males only),
peak velocity in n-s (males only), peak velocity in pm-sp,
peak velocity in pg-ar (females only), peak velocity in ar-go,
peak velocity in n-gn (mates only), peak velocity in n-sp,
peak velocity in pr-id (males only),
peak velocity in pm-s (males only).
Sesamoid-stage 1 and:
sesamoid-stage 2, sesamoid-stage 3, peak velocity in n-s,
peak velocity in Pm-sP, peak velocity in PE-at,peak velocity in P8-9o, peak velocity in ar-go,
peak velocity in D-Bn, peak velocity in n-sp,
peak velocity in id-gn, peak velocity in pr-id,peak velocitY in Pm-s.
Sesamoid-stage 2 and:
sesanoid-stage 3
peak velocitY inpeak velocitY inpeak velocitY inpeak velocitY inpeak velocitY in
(males only) , peak veloci-ty in n-s,
pn-sp, peak velocity in pg-ar,
pg-go, peak velocity in ar-go,
D-gn, peak velocity in n-sp,
id-gn, peak velocity in pr-id,pm-s.
Sesanoid-stage 3 and:
peak velocitYpeak velocitYpeak velocitYpeak velocitYpeak velocitY
n-s¡ peak velocity in Pm-sP,
pg-ar, peak velocity in P8-go,
ar-go, peak velocity in D-go,
r-sp, peak velocity in id-gn,pr-id, peak velocity in pm-s
1n
inininin

-t67 -
TABLE 33(c)
Peak velocity in n-s and:
peak velocity in Pm-sP, peak velocity in Pg-ar,peak velocity in Pg-go, peak velocity in ar-go,
peak velocity in o-glt, peak velocity in û-sp,
peak velocity in id-gn, peak velocity in pr-id,peak velocity in pm-s.
Peak velocity in Pm-sp and:
peak velocity in PB-ar, peak velocity in P8-8o,
peak velocity in ar-go' peak velocity in D-gn,
peak velocity in n-sp, peak velocity in id-gn,
peak velocity in pr-id, peak velocity in pm-s.
Peak velocity in pg-ar and:
peak velocity in Pg-go, peak velocity in ar-go,
peak velocity in n-gn, peak velocity in n-spr
peak velocity in id-gn, peak velocity in pr-id,peak velocity in Pm-s.
Peak velocity in pg-go and:
peak velocity in ar-go, peak velocity in D-gn,
peak velocity in tr-sp, peak velocity in id-gn,
peak velocity in pr-id, peak velocity in pm-s.
Peak velocity in ar-go and:
peak velocity in n-gn, peak velocity in D-spr
peak velocity in id-gn, peak velocity in pr-id,peak velocity in pm-s,
Peak velocity in n-gn and:
peak velocity in r-spr peak velocity in id-gn,
peak velocity in pr-id, peak velocity in pm-s.

-168-
rABLE 33(d)
Peak velocity in n-sP and:
peak velocity in id-gn, peak vel'ocity in pr-id,peak velocitY in Pm-s.
Peak velocity in id-gn and:
peak velocity ín pr-id, peak velocity in pm-s.
Peak velocity in Pr-id and:
peak velocitY in Pm-s.

-169-
DISCUSSION
To sinplify discussion, timing intervals betvreen paired events are
discussed under three main headings:
Stature - carpal ossification;
Carpa1 ossification - uPPer and lower face;
Carpal ossification.
Díagrams are used to identify the timing interval under discussion.


- 171-
STATURE - CARPAL OSSIFICATION
Table 34 (p.t72 ) shows and Fig.14 (p.t73 ) illustrates that in
general the selected ossification events ossified either before or during
the same year as peak velocity in stature. In fact, in the najority of
subjects, the pisíform and hamate-stage 1 ossified before the year during
which peak velocity in stature occurred.
Table 28 shows that the pisiform ossified during the year before
peak velocity in stature in 54 ,2% of males and 68 .7eo of females. More-
over, in approxirnatety 53% of females ossification of the hook of the
hanate-stage L and ossification of the sesamoid occurred during the year
before peak velocity in stature.
Ossification of the hook of the hamate-stage 2 occurred during the
sane year as peak velocity in stature in 65 ,4% of males and 60,Ùeo of
fenaLes. However, in 75.3eo of males the sesamoid ossified during the
same year as peak velocity in stature.
Table 54 records that nean values for the timing intervals between
events in males ranged frorn 0.5 years for the stature/hamate-stage 2
and stature - sesamoid comparisons to 1.7 yeats for the stature/hamate-
stage 1 comparison. In females the ninimum timing interval was 0.5
years for the stature/hamate-stage 2 and stature-sesa¡noid conparisons,
and the maximu¡n was 1.4 years for the stature/pisiform comparison.

TABLE 34.
Paired
Events
STATURE/PISIFORM
STATURE/HAMATE-Stage 1
STATURE/HAMATEStage 2
STATURE/SESAT,ÍOID
% of subjectsin which theossificationevent occurredBEFORE peakvelocity instature
79.293.7
87.s76.9
eo of subjectsin which theossificationevent occurredAFTER peakvelocity instatute
3.9
percentage of subjects with ossification events occurring before or after peak
velocity in statuie. The ¡nean and standard deviation of the tining intervalbetween events are listed in decinal years.
MeanTime
IntervalStandardDeviation
L.3t.4
1.00.8
1.1r.2
0.60.7
0.50.7
Its.-JNI
M
F
M
F
M
F
M
F
7.7
5.926.652.9
70
3040
0.30.5
t.7L.2
0.30.5

STATURE
VELOCITY
GM / year
STATURE
VELOCITY
t0.3
B (87.5)
8.4
A(s3.7)
MATES
A(7e.2)
FEMALES
B(76.e)
13 14AGE - YEARS
11
10
I
I
III
(30.?)!cD(26.6)
6
5
4
t3.8
12 15
10
I
c (40'0)
D(52.e)
11 12AGE- YEARS
ossrFrcATroNEVENTS
A. PISIFORM
B. HAMATE, StagelC. HAMATE, Stage 2
D. SESAMOID
13
cm I
7
6
5
4
3
t1.8
10
Mean tine interval between ossification events andpeak velocity in stature.Percentage of subjects in which ossification eventsoccurred before peak velocity in stature shown inbrackets.
Fig.L4.

-L74-
SUMMARY
The time differences between selected ossification events and
peak velocity in stature have been discussed. In both males and
fenales, the most reliable indicator of the tine at which peak velo-
city in stature occurred was the apPearance of the pisiform. In
males, however, ossification of the hook of the hamate-stege I also
seems to be a fairly reliable indicator. Ossification of the hook
of the hønate-sf,a,ge 2, in malee ød ferruLes and the appearance of
the eeeamoid, ín maLee onLg, indicate that peak velocity in stature
is either occurring or is i¡nminent.


-t76-
CARPAL OSSIFICATION UPPER FACE
Table 35 (p. I77 ) shows that in general the ossification events
studied appeared either before or during the same year as peak velocity
ín upper facial dimensions. Ossification of the hook of the hamate-
stage 1 occurred after peak velocity in variables pm-s and n-s in L3.4%
of males and 15 ,3% of females respectively. However, in females only
the pisiforn showed significant tining intervals with all upper facial
dimensions, and in males hamate-stage L occurred before peak growth in
all upper facial dimensions.
On the average, ossification in hamate-stage 2 and in the sesanoid
occurred before peak growth velocity in upper facial dimensions ¡nore
frequently in femalesthan in males. The mean values of the timing
intervals between these two ossification events and all the upper facial
peak velocities were greater in fenales than in nales, that is in fe-
males carpal ossification preceded upper facial growth peaks by a greater
time than it did in males.
In the treatment of Class II division I Malocclusion some clinicians
apply a form of extraoral traction to the maxilla in order to retard its
forward growth. Knowing when peak velocity is likely to occur in the
maxilla is of great clinical value. Tab1e 35 shows that ossification
of the hanate-stage t did not occur after peak velocity in the dinension
pm-sp, in either males or females and the mean value for the tining in-
terval was 1.6 years in males and 1.3 years in fenales. It is inter-
esting to note that ossification of the hamate-stage 2 was almost co-
incident with peak velocity in the dimension pn-sp (interval is 0.1 years
in males and 0.5 Years in females) .

TABLE 35.
Paired
Events
n-s/PISIFORMn-s/HAIIÍATE-Stage 1
n-s/HAIvfATE-Stage 2
n-s/SESAMOID
pm-sp/PISIFORMpn-sp/HAMRtE-Stage 1
pn-sp/HAN{ATE-Stage 2
pm-sp/SESAMOID
n-gn/PISIFORMn-gn/HAtvtAtE-Stage 1
n- gn/FIAI'IATE - Sta ge 2
n-gn/SESAMOID
% of subjectsin which theossificationevent occurredBEFORE peakvelocity inupper facialdimension
M F
7 3.980.143.4
% of subjectsin which theossificationevent occurredAFTER peakvelocity inupper facialdinension
M F
11 .8 11 .1
11.1
percentage of subjects with ossification events occurring before or after peak
velocity in upper facial dimensions. The mean and standard deviation of thetining interval between events are listed in decimal years.
MeanTime
Interval
M F
StandardDeviation
M F
1.31.5t.21.0
1.61.61.00.9
1.31.60.50.4
5.31s .35.95.3
73.677 .Os2.957 .9
I.21.61.3t.3
0.7L.60.10.2
t.4L.51.11.0
8.7L3.38.6
8.77.t
t.41.50.70.8
1.1t.30.30.5
1.91.60.8o.7
t.31.60.50.4
IP\¡\¡I
64 "772.8
73.978.6
56.769.2
90 .988 .854.650.0
L.31.11.00.9
1.0L.20.90.8

TABLE 35 (continued)
Paired
Event
n-sp/PISIFORMn-sp/HAtttltE-Stage 1
n-sp/HAIT4ATE-Stage 2
n-sp/SESAMOID
pm-s/PISIFORMprn-s/HAl"fATE-Stage 1
pm-s/HAl"fATE-Stage 2
pm-s/SESAl,l0ID
% of subjectsin which theossificationevent occurredBEFORE peakvelocity inupper facialdinension
M F
75 .064.6
% of subjectsin which theossificationevent occurredAFTER peakvelocity inupper facialdinension
M F
11.8
MeanTine
Interval
M F
StandardDeviation
M F
IH{@I
0000
L.71.92.01.9
693
3
t.6r.30.70.9
t.41.80.90.9
0.81.30.30.1
2.01.9L,71.8
2.L2.01.1L.3
1.81.30.70.8
79.977 .883. 368 .866.7
13.45.58.3
5.5

-L79-
CARPAL OSSIFICATION LOWER FACE
Table SO (p. 180 ) shows that in the najority of subjects the
ossification events under study appeared either before or during the
sane year as peak velocity in lower facial di¡nensions. In fact,
ossification events occurred after peak velocities in only 12' out of
a total of 40 paired conparisons. In at least 75% of subjects ossi-
fication of the pisiform and hanate-stage 1 occurred before peak
velocity in ¡nost lower facial dimensions. The average time interval
between these two ossification events and the lower facial dimensions
ranged from 0.6 - 2.5 years ín nales and 1,4 - 2.4 yeats in females'
Peak velocities of the variables id-gn and pr-id occurred after
the appeaïance of hanate-stage 2 and the sesamoid in a greater per-
centage of fenales than males. The sex difference in the time inter-
val between events id-gn and hamate-stage 2 was 0.5 yeârs and for the
events id-gn and sesamoid, 0.4 years; for the events pr-id and hanate-
stage 2 and pr-id and sesamoid the sex difference in the mean time
intervals was 1.0 years in each instance. In males, the range of the
mean time interval between hamate-stage 2 and sesamoid, ard lower
facial dimensions was 0,2 - 0.5 years, and in fenales 0.6 - 1'5 years'

TABLE 3ó.
Paired
Events
percentage of subjects with ossification events occurring before or after peak
velocity in lower facial di¡nensions. The nean and standard deviation of thetiming interval between events are listed in decimal years.
% of subjectsin which theossificationevent occurredBEFORE peakvelocity invarious lowerfacialdinensions
M F
% of subjectsin which theossificationevent occurredAFTER peakvelocity invarious lowerfacialdinensions
M F
4.2
MeanTine
Interval
M F
StandardDeviation
M FI
F@aI
pg-arlPISIF0RMpg-ar/HAMATE-Stage 1
pg-arltlAt'IATE -Stage 2
pg-arlSESAMOID
pg-go/PISIFORM 81.8pg-go/HAl,fATE-Stage 1 87. 5pg-golHAl'fATE-Stage 2 38.4pg-go/SESAIvIoID 35.7
ar-go,/PISIF0RM 76.2ar-golHAtvlATE-Stage 1 100.0ar-golHAMATE-Stage 2 -ar-golSESAMOID
75 .087 .s
38 .4
80 .081 .8
o)47.55.
L.3t.21.01.0
t.6L.40.60.6
1.31.80.50.s7.7
53
5956
1.00.81.11.0
7.40.81.01.0
1.0L.31.1r.2
78 9305
r.21.10.80.7
L.41.60.70.8
1.51.50.70.7
1.51.90.50.5
38
4.886 .680 .0
6.710 .0
1.91.5t.7L.6
1.62.50.40.4

TABLE 36 (continued)
Paired
Event
id-gn/PISTFoRMid-gn/HAIÍATE-Stageid-gn/HAItlAtE -Stageid-gn/SESAI\0ID
pr-id/PISIFORMpr- idlHAt'fATE-Stage 1
pr-id/HAlvtATE-Stage 2
pr- idlSESAI'I0ID
% of subjectsin which theossificationevent occurredBEFORE peakvelocity invarious lowerfacialdinensions
M F
91 .0
eo of subjectsin which theossificationevent occurredAFTER peakvelocity invarious lowerfacialdimensions
M F
MeanTine
Interval
M F
StandardDeviation
M FIHæHI
80.0I 83.32 45,5
37.570.072.7
1.22.11.00.9
5.0
9.14.2
L.4r.61.1r.7
0.61.00.30.2
t.21.50.90.7
6484
001
1
1.31.30.80.8
2.42.3L.3L.2
t.42.t0.50.s
100 .0100 ,070.060 .0

-182-
SIJMMARY
The timing of various ossification events have been discussed
in relation to the time of peak velocity in upper and lower facial
dimensions. In males the tine of appearance of the hook of the
hamate-stage 1 and in fe¡nales, the tirne of aPpearance of the pisiform
seem to be the best indicators of the onset of peak velocity in facial
dimensions. The pisifor¡n appears on the average in males and fenales
1.5 years before peak velocity in the upper face and 1.8 years before
peak velocity in the lower face. However, hamate-stage L appears on
the average in nales and females 1.4 years and 1 .8 years before peak
velocity in the upper and lourer face respectively.


-184-
CARPALOSSIFICATION
PISIFORM/HAI4ATE-STAGE 2 .
The pisiform ossified before the hook of the hanate-stage 2
ín 62,5eo of males and 66,7o'o of females (Table 37). rn one
female the pisíform ossified during the year following
ossification of the hook of the hanate-stage 2 (Table 52).
PISIFoRM/SESAI'4OID .
The pisifor¡n ossified before the ulna metacarpophalangeal
sesa¡noid of the thumb in 62,2eo of males and 66 ,7% of fenales
(Table 57). In 50% of females the pisiform ossified during
the year before the sesamoid appeared. However, in two fe-
males (8,3%) the pisifor¡n ossified during the year following
the sesamoid appearance (Tabfe 32).
PI SIFORM/SESAMOID STAGES
In 50eo of males and 53.8% of fernales the pisiform ossified
during tho year before stage 2 level of the ulna metacarpo-
phalangeal sesamoid of the thurnb was reached (Table 32) .
HAI\4ATE-STAGE I/HAI4ATE-STAGE 2
stage 1 in the ossification of the hook of the hamate
occurred during the year before stage 2 in 66,7eo of nales
and 77,Seo of females. In two males (9.5e") the interval
between stages was greater than 2.5 years (Table 32) '

TABLE 37. Percentage of subjects with significant differences in the intervals betweenvarious ossification events. The mean and standard deviation of the timinginterval between events are listed in decimal years.
Paired
Event
PISIFORM/HAMATE-Stage 2
P ISI FORM/SESAMOIDP rsrFORM/SESAMOTD-Stage 1
P ISIFORM/SESAMO ID-Stage 2
PISIFORM/SESAMOID-Stage 3
HAMATE-Stage t/FIAMa-TE-Stage 2
FIAMn-TE-Stage l/SESAMOIDHAMATE-Stage l/SESAMOID-Stage 2
HAMATE-Stage t/SESAI,IOID-SIage 3
% of subjectsin which thefirst listedossificationevent appearedBEFORE thesecond
M F
66.6
84 "6
76.5
93.3
61.1
% of subjectsin which thefirst listedossificationevent appearedAFTER thesecond
M F
7.7
5.9
11.1
MeanTine
IntervalStandardDeviation
MF M F
66.766.7
62.s62.2
4.88.3
-1.0-0 .9
IPæ(rlI
1.01.1
0.90.9
-0.9-0.8
04
10
L2
15
L2
15
t3
-0 .9
-L.3
-r .4
-L.3
-0.8
-0.8
-1.3
0.6 0.9
68.7
7t.4
100 .0
73.L
77.7
88.2
0.9 L.2
1.0 L.4
1.0 L.3
0.7 0.6
0.9 1.0
77 "7 0.9 L .2

TABLE 37 (Continued)
Paired
Events
SESAIv0ID/SESAIvIOID-StAgE 3
SESAIvIOID-Stage 2/SESAI\,0ID-Stage 3
% of subjectsin which thefirst listedossificationevent appearedBEFORE thesecond
M F
s8.8
100.0
% of srùjeetsin which thefirst listedossificationevent appearedAFTER thesecond
M F
MeanTine
IntervalStandardDeviation
M FMFI
F@o\I
-0 .3 -0.8 0.5 0.8
-1.0 0.1

-t87 -
HAIvIATE-STAGE I/SESAI'IOI D
Ossification of the hook of the hamate-stage 1 occurred be-
fore the appearance of the ulna metacarpophalangeal sesanoid
of the thumb in 73"1% of males and 61 ,teo of females (Table
37) .
HAtr,IATE-STAGE I/SESAMOID STAGES
Ossification of the hook of the hanate-stage 1 ocçurred
during the year before the appearance of sesanoid-stage 3
in 64.7eo of males (Table 32) .
SESAMOi D/SESAMOI D STAGES
In all females, sesamoid-stage 2 was reached during the
year before sesanoid-stage 3 (TabIe 32) .
SUMMARY
The tirning intervats between various ossification events have
been discqssed" In males the pisiforn appeared before or during the
same year as all other ossification events except ossification of
the hook of the hamate-stage 1. However, in a snall percentage of
fenales, the pisiforn ossified after ha¡nate-stage 2, the initial
appearance of the sesamoid and sesanoid-stage 2 and stage 3. Also,
in a small group of females, ossification of the hook of the ha¡nate-
stage 1 was seen to occur after the initial appearance of the sesanoid"

CHAPTER VIII
GENERAL DISCUSSION AND CONCLUSIONS
Since 1951 regular expeditions have been made to the Yuendumu
Settlenent, in the Northern Territory of Australia, by members of the
Department of Dental Science, University of Adelaide. The early ex-
peditions were mainly concerned with the collection of serial dental
casts and the study of dental and oral conditions in Aborigines.
However, in 1961 the scope of the study was broadened so that cranio-
facial growth could be related to certain aspects of skeletal matura-
tion and general body growth in the subjects. As a result, hand and
wrist roentgenograms, dental casts, cephalometric roentgenograms, and
selected body measurements were obtained annuaLIy.
The subjects enrolled in the longitudinal growth study belong
mainly to the Wailbri tribe of Australian Aborigines" It could be
said that culturally they are still tribally orientated, although
European influence has imposed different environmental conditions "
However, one advantage of this study is that the group forms a re-
latively isolated and distinctly inbred community. Many of the dif-
ficulties encountered when studying growth in a heterogenous group
are then avoided.
The present report is restricted to a study of serial hand and
wrist, and lateral head roentgenograms as well as seríal stature

-189-
measurenents of 50 nales and 36 females, aged 8 - 18 yeals' Most
belong to the Wailbri tribe, although a few Pintubi children are in-
cluded in the group" All subjects were of pure Aboriginal ancestry
so far as can be ascertained"
In the first part of the study the tine of appearance of carpal
ossification events was determined. The time of appearance was re-
corded as the mid-point of the year in whích each event occurred'
In the second part of the study the times of peak growth velocity
in height and facial dinensions were determined" Age was recorded
as the mid-point of the year during which peak growth velocity in height
and in each facial measurenent occurred" In the facial skeleton,
variables were selected for measurement so that several dimensions of
the nasomaxillary complex were represented"
A computer was used to determine correlation coefficients between
the variables included in the study and to study the relations in time
between paired events. In the text, the importance of earefuL ùnten-
pt,etation of eoeffieients of Lineæ correLation has been emphasized.
This was stressed in relation to paired combinations of cephalometric
variables 'rtopographically" related and to paired combinations between
age-associated events "
For convenience, the results are summarized under the followíng
headings:
Ossification events;
Peak growth velocity in stature and the facial skeleton;
Relations between ossification events, stature and facial
growth.

-190-
0ssifícation Events
Of the ossification events studied in Aborigines, the earliest
events recorded on serial hand and wrist roentgenograms were the
initial ossification of the pisiform and the hook of the hamate.
Harnate-stage L appeared at 1.0,6 years in femaLes and 12.2 years in
maLes; and the age-at-appearance of the pisiform was J0.5 years in
femaLes and 1.2.6 gears in maLes" Ossification of the adductor
seeamoid of the thumb, which was the last event to appear, occurred
al L7.2 yeats in femaLes and 1'3.5 yeans in maLes'
AIl ossification events occurred earlier in females than in males'
Ossification in the hamate-stage 2 and in the sesamoid showed the
greatest time difference between sexes (2 "3 years) , This value is
similar to that reported by GREULICH and PYLE ('59), GARN and ROHI\4ANN
(,62) and S.IöRK and HELM (t67), The smallest time difference between
sexes (1"6 years) was recolded for hamate-stage 1; this value approxi-
mates that given by ABBIE and ADEY ('53b) for Aborigines and GREULICH
and PYLE ('59) for Caucasoids"
The ages-at-appearance of the carpal ossification events studied
showed that although Aborigines were placed wíthín the general
Caucasoid range of development timing, Aboriginal times were a litt1e
later, on the average, than those for Caucasoids ^
Peak Velocity in Stature and Facial Skeleton
The magnitude of peak growth velocity in stature (AborågönaL
maLee) was found to be the same (10"3 cm/year) as that recorded for
British males by TANNER, WHITEHOUSE and TAKAISHI ('66) " However, in
AbonigånaL femaLes, the value (8,5 emlyeav') was slíghtly less than

- 191-
that for British fenales (9,L cn/year, TANNER et al, '66) " Peak
g?outh ueloeity occurred at mean age 73,8 years ørt'd LL"B yeans'ùn
Aborì.gìnaL maLes and femaLes Yespeetiuely" These times fell rnid-
way between the average ages given for British (TANNER et a1, '66)
and North American (DEMING, '57) children" However, the sex dif-
ference in the age at peak height velocity (2"0 years) corresponded
to the value mentioned in the above reports.
In general, maximum growth velocity in the facial skeleton was
greater in Aboriginal males than in Aboriginal females" Similar
findings were reported in Caucasoids by NANDA ('55) and BAMBHA (t61)"
Aboriginal females reached their peak velocity in the facial skeleton
earlier than Aboriginal males" The maximum sex difference in the
age at peak velocity was 2.0 yeats for the measurement, mandibular
body length (pg-go) and the ninimum sex difference was 0"7 years for
the neasurement middle face height (pr-id). BAMBHA ('61) stated
that in females the face tended to mature 2 - 3 years earlier than in
males. However, BAMBHA used different facial measurements to those
used in the present study, so that close comparison of the two studies
is not warranted"
Maximum growth in the length of the maxilla (pm-sp) (1s.s aeal'!
in maLes qnd LL,7 years in femaLes) occurred before peak velocity in
stature (Figure 15) in both sexes " The mean age in Aboriginal fe-
males (11.7 years) corresponds closely to the value of 11"5 years
given by SINGH and SAVARA ('66) for Caucasoid females " The Last euent
to occw in Aboz,íginal females was peak ueLocity in mandibuLar face
heíght, This occurred on the average 0"9 years after peak velocity

11
t0
I
13
cm
Gln
r0.3
B(87.5)
MALES
A(7e.2)
5,6,7,8,9
t1
14
4
osstFtcATtoNEVENTS
A. PISIFORM
B. HAMATE,Stagel
C. HAMATE, Stage 2
D. SESAMOID
15
PEAKVELOCITIES
t n-sp2 pr- id
3 pm-s4 pm- sp
5 STATURE
6 n-s7 pg-arI n-gnI id -gnt0 ps-soll ar-90
I
3
2
t3.8
AGE-YEARS
STATURE
VELOCITY
6)lD(26.
I
I
7
6
5
4
f r.^,
f r'^'
12
5FEMALES
8.4
I
c(40.0)
D(52.e)
11
B(76.e)
A(93.7)
11 12AGE - YEARS
13
Mean time interval between ossification events andpeak velocity in stature and facial dinensions.Percentage of subjects in which ossification eventsoccurred before peak velocity in.stature shown inbrackets (Detail analysis of these ossificationevents are shown in Tables 28, 34).
4
I
I
7
6
5
4
3
107
I
STATURE
VELOCITY2
I
11.8
t0
Fig. 15.

-193-
in stature. In general, peak velocities of facial height measure-
ments in Aboriginal males occur.red before peak velocity in stature;
furthermore, peak velocities of mandibular measurements in Aboriginal
males all occurred either at the sane time or slightly after peak
velocity in stature"
Figure 15 clearly illustrates the time spread of peak growth
velocity in measurements of the facial skeleton in relation to peak
growth velocity in stature. NAIIDA ('55) and BAMBHA ('61) found that
peak growth velocity in the face occurred a little after peak growth
velocity in stature, whereas HUNTER ('66) showed that maximum facial
growth was coincident with maximun growth in stature. The present
study, therefore, does not reveaL any great differences in the char-
acter of facial growth at adolescence between Australian Aborigines
and the Caucasoid groups studied.
Relation between ossifi cation events. s tature and facial srowth "
In both Aboriginal males and females associations between the
chronological ages-at-appearance of the sesamoid and peak growth
velocity in stature were high (the average value calculated by
z-transformation, r = 0.34); however, the sesamoid tining was only
noderately correlated with chronological age at peak growth velocity
in most facial dimensions. Nevertheless, moderate to high coefficients
of correlation were found between chronological ages at peak velocity
in stature and peak velocity in nost facial measurenents"
Coefficients of correlation revealed a general low relationship
between the nagnitude of peak velocity in most facial dinensions "

- 194-
However, a stronger relationship existed between the chronological
ages at peak velocity in facial measurements.
In general, the selected ossification events appeared either
before or during the same year as peak growth velocity in stature,
The písífolqr ossifíed before peak velocity in stature in 93.7% of
females and hamate-stage I ossified before peak velocity in stature
in 87,5% of maLes, Moreover, hanate-stage 2 (in males and fenales)
and the sesamoid (in males only) ossified during the same year as
peak velocity in stature in approximately 60 - 75," of subjects"
In femaLes the pisíform ossifíed on the average 1',4 years be-
fore peak g!,olnth ueLoeíty ¿n statuve and in maLes, hamate-stage L
ossífied L,7 yeare befone peak gnouth ueloeíty in statwe. However,
in both males and females, hanate-stage 2 and the sesamoíd ossified
approximately 0.4 years before peak velocity in stature.
In the facial skeleton the same general tining relation outlined
above existed between carpal ossification events and peak velocity
of upper and lower facial measulements. Ossification of hatnate-
stage 1 oecuty,ed befone peak ueLoeity in the facial measwement
pm-sp, ín both males and femaLes. The average tì.mí,rry interuaL was
L,6 yeate inmaLes and L.3 yeare in females. It is interesting to
note that ossification qf hanate-stage 2 and the sesamoid was almost
coincident with peak velocity in the facial measurement, pm-sp, in
both males and females.
* * *

-195-
Skeletal age ratings have useful clinical applications in the pre-
diction of adult stature, in legal situations, in popul.ation studies,
in paediatrics, and in studies of child growth and development"
In Orthodontic practice skeletal age ratings determined at the
ínitial consultation could be of great assistance in locating the
position of the child in relation to his progress towards maturity"
Knowing the childrs present growth status would assist in the planning
of treatnent and in the general organization of an orthodontic prac-
tice. For instance, if the pisiforn (mean age-at-appea?anee
J.0,5 years in femaLes) was not present in an eleven-year-old girl
at the initial consultation, by applying the finding that the pisiform
ossified on the average approximately 1"5 years before peak growth
velocities, then it would be advisable to recall the child in one
year for a further examination of pisiform development" If the
pisiform htas plesent at this second exanination, then it would be
reasonable to assume that its ossification occurred rnidway between
11 years and L2 years, that is 11.5 years. The clinician would then
be in a much better position to determine the time of tleatment, that
is, he would connence treatment to take advantage of peak growth
velocity which on the average would occur during the coning yeat"
Skeletat assessment could be of great benefit in determining the
form of orthodontic treatment " For instance , in the treatment of
Class II division I Malocclusion some clinicians apply extraoral
traction to the naxilla in order to retard its forward growth" Knowing
when peak velocity is likety to occur in the maxilla is of great clini-
ca1 value" Results of the present study showed that in both Abori-

- 196-
ginal males and females hanate-stage 1 did not occur after peak
growth velocity in the measurenent, maxillary jaw base length (pm-sp)"
As mentioned previously in this chapter, the average tine interval
between these tl^ro events in males was J."6 years and in females 1"3
years. Such knowledge would benefit individual treatment as well
as overall practice organization.
In order to illustrate further the use of hand and wrist roent-
genograms in orthodontic practice, the example can be cited of a girl
presenting for exanination with the pisiform, hanate-stage 2 and the
sesamoid already ossified but with some of the epiphyses of the dis-
tal phalanges of the fingers beginning to fuse. SINCLAIR(P,82, '69)
stated tlthe menarche nouadaAs occltns uíthí'n a chronoLogì.eal age
Tange of 10 - L6 yeans, but uithin a much narrou)er lange of t'adiolo-
gieaL age - fnom 72 to L48 Aeors' z'ound about the time of fusion of
the epiphgses of the tenminaL phaløt'ges of the fì'ngers,tt Menarche
occurs almost invariably after tlæ apex of the height spurt has been
passed (DEMING, '59) and the present study has shown that in Aboriginal
females peak growth velocity of several facial measurements occur
well after peak growth velocity in stature. If the epiphyses of all
terminal phalanges have fused then the indication is that peak growth
velocity in stature and the facial skeleton has almost certainly
passed and little further facial growth would be expected to assist
treatment "
Some clinicians after active treatment use fixed retention in
the lower arch in the form of a lingual bar from canine to canine.
Thís appliance is cemented in position and retained until the child has

-197 -
accomplished facial maturity. SINCLAIR (p,76, '69) states that
ttskeLetaL maturatíon usualLy proeeeds noughLy pataLLeL uíth skeLetal
gyouth, and of co1,t?se, maturatían and gnouth both eome to an end uhen
the epiphyses cLoset', A hand and wrist roentgenogram would indicate
if epiphyseal fusion of the long bones of the hand and wrist has oc-
curred thereby assisting in the determination of the degree of facial
naturity.
This study is an extension of the research topic reported by B.lönf
and HELM (r67). At the present time, there have been no similar studies
reported in detail. The findings of the present investigation have in-
cluded information on the time intervals between peak growth velocity
in a nunber of dimensions of the nasomaxillary complex, peak growth
velocity in stature and the times at hrhich certain carpal ossificatíon
events took place.
The findings have also clarified the understanding of general re-
lations between body growth, skeletal maturation and facial growth" In
particular, the results can be applied in orthodontic practice to ac-
quire a deeper apprecíation of the growth status of patients and to
more objective.ly plan and carty out treatment goals,

A
B
C
D
APPENDICES
Dental state of the subjects
Skeletal maturation studY - form 7
Variables studied
Conputer output for growth velocities
page 199
207
208
2t3

-199-
APPENDIX A
Dental State of the Sub ects
In 1970, an oral health survey was carried out on the children
and young adults at the Yuendumu Settlenent (BARRETT, WILLIAMSQN,
BROWN and TOWNSEND, '70). Seventy-seven subjects out of the total
of 82 included in the present study were examined on this expedition
and the following characteristics were noted: teeth missing, teeth,
unerupted, teeth with caries, teeth with restorations, enamel hypo-
plasia, dental fluorosis, tooth attrition, oral hygiene and perio-
dontal condition. Observations on sone of these characteristics for
the renaining five subjects of this investigation were made from dental
casts by the writer.
This information has been included to indicate the general dental
state of Aborigines living under settlenent conditions. It is impor-
tant to note that no detailed information on the oral health of sub-
jects enrolled in the present study was available prior to the 1970
survey.
Included in the number of teeth present were all erupted and
partly erupted teeth. Table 38 su¡nmarizes the presence and absence
of teeth in the group under investigation. Disregarding the eruption
pattern of third nolars, nissing teeth were noted in 11 subjects (IS,+u"7.
This number included two subjects each with a missing first nolar due
to caries, and nine male subjects (L7.3e") with a missing incisor tooth
through ceremonial evulsion. CAI,IPBELL (t25) found evidence of cere-
monial evulsion in 11.4% and BROWN (t65) noted the occurlence in 25eo
of males investigated.

-200-
The papers referred to in Chapter II discussed the 1ow caries
incidence at the Yuendumu Settlement. Tables 39(a) and 39(b) list
the number of subjects with caries as well as the tooth surface on
which the caries originated.
Caries was considered to be present when any lesion had a detec-
tably softened floor or wall or Undermined enamel. In order to es-
tablish the presence of interproximal lesions, the probe ¡nust enter
the lesion with certainty. In any doubt existed, caries was not diag-
nosed. White spots, discoloured or rough spots, and hard stained pits
or fissures which catch an explorer but do not have a detectably soft-
tened floor or undermined enamel were not counted as caries.
It is interesting to note that caries was recorded in onLy 37.8%
of subjects in the present study and that of the total number of 78
carious lesions, 53 (62,5u"7 originated on a buccal surface. The small
number of amalgan restorations (Table 40) enphasized the low caries
incidence.
The bore water used by the Aborigines at Yuendumu contains approxi-
mately 1.5 parts per million fluoride (BARRETT,r55a, r56b). Since
that report the ftuoride content has increased slightly. Analyses
showed the bore water contained L73 patts per million fluoride in
1969 and 1.93 parts per million fluoride in 1970. However, since 1965
a different bore has been used for drinking purposes and analyses showed
it contains approximately 0.4 parts per million fluoride (WILLIAMSON.
BARRETT, BROtrN and TOWNSEND, '70). DEAN's method ('34) was used in
assessing the prevalence of dental fluorosis. Table 41 shows that
rnoderate and severe dental f ]uorosis was present in 59 subjects (47 "69").

-20L-
Fluorosis was more prevalent in males.
Enanel hypoplasiâ lttas recorded in a total of four subjects, all
were females.
An assessment of the degree of occlusal attrition was made for
each subject from an exarninaton of the maxiltary and mandibular first
permanent molars. If any of these teeth was missing, no alternative
tooth was exanined. Evaluation of the degree of attrition was made
according to the method of DAVIES and PEDERSON ('55) and each subject
was categorised into the foLlowing groups: 0 - no attrition;
1 - enamel worn without exposure of dentine; 2 - dentine exposed;
3 - secondary dentine exposed. An attrition index was derived for
each subject by dividing the total scores by the number of teeth exa-
mined. Table 42 shows that the attrition index was higher in males
than ín females.
Oral hygiene status was deternined by obtaining oral debris and
calculus scores separately. Examination was limited to six pexmanent
teeth surfaces - the labial surface of the upper right central incisor,
the labial surface of the lower left central incisor, and the buccal
surfaces of the upper first pernanent nolars. The periodontal index
developed by RUSSELL ('65) was utilized to assess the prevalence and
severity of periodontal disease. WILLIAI\'!S0N ('70) stated that almost
all subjects were found to have gross debris in the mouth and large
amounts of subgingival calculus. It appeared that the subgingival
calculus formed soon after eruption and as a result a generalized
gingival hyperplasia was most evident. However, the gingival hyper-
plasia tended to be non-progressive.

TABLE 38.(a)
-202-
Dental state of the subjects studied accordingto the nunber of teeth Present.
Number ofteethpresent
Ma1es Females Total
32
31
50
29
28
27
24
I
4
1
6
3
3
6
L7
1
t4
7
4
6
4S
5
1
28
4
1
Total 50 32 82

TABLE 58.(b)
-203-
Dental state of the subjects studied according tothe number and type of teeth nissing.
Nunber andtype ofnissingteeth
Males Females Total
Four third molars uneruPted
Three third molars uneruPted
Two third molars uneruPted
One third ¡no1ar uneruPted
Upper right central incisorUpper left central incisorUpper right lateral incisorUpper right first ¡nolar
Lower right fírst nolar
Four second Premolarsunerupted
32
4
4
1
s (4)
3(1)
1(1)
19
2
3
51
4
6
4
1
2
1(1)
1(1)
1(1)
Nunber in brackets denotes the number of subjects alsorepresented in a third molar category.

-204-
TABLE 39(a). Nunber of subjects studied with one or norecarious lesions (N = 50 nales, 32 females).
Males Females Total
23 31
46.0 25.0 37.8
TABLE 39(b). Number of caríous lesions present in the subjectsstudied, according to surface of origin.
Males Fenales Total
Occ lusal
BuccaI
Lingual
16 22
58 15
3
TotaI s7 2L 78
N
%
6
55
3

-205-
TABLE 40, Number of amalgan restorations present in 50 nalesand 32 femalgs, according to surface of location.
Surface Male Female Total
0cclusal
Buccal
2
3
3
7
5
10
Total. 10 5 15
TABLE 4I. Nu¡nber of subjects with evidence of noderate andsevere dental fluorosis.
Type of Fluorosis MaIe Fenale Total
Moderate L4 18
Severe t8 27
TotaI 32 7 39
4
3

-2A6-
TABLE 42. Mean values for the d.egree of attrition of Maxillary andMandibular first molar teeth of 44 male and 28 femaleAustralian Aborigines after the nethod of Davies andPedersen (t55) .
','Sub jects Attrition Index(Mean)
Males
Fe¡nales
44
28
L.44
t.28

FORü 7
,Ð
sl
Se¡amldDfen.
C¡rd
APPENDIX B
DENÎGRO PROJECT
SEI.EIAL MATI'RA1I6T Sfl'DT
DAÎA CARD 1
Iec
6
I1
28flPiefformPresence
DATA CARD 2
Ilamate SeeercldPregenceStace I
St¿Ee 2
< rl
5flSex
7
6
Ject
11 l8Age
Steture fl- 8 pm-sP Pg-ar pg -, go er-go
1p
2
I
I
pr-td pú- 8fd-gn3Pnn-gn
78

-208-
APPENDIX C
OSSIFICATION EVENTS STUDIED
Appearance of pisiform
Hook of hamate-stages I and 2
Appearance of ulna metacarpophalangeal sesamoid of the thunb
Reference Points and Lines used
Reference points
ar - articulare
gn - gnathion
go - gonion
id - infradentale
n - nasion
Reference lines
pg
pr
pn
s
sp
pogonion
prosthion
pterygonaxi I lare
sella
spinal point
nandibular line
ramus line
NSP
NL
nasion-sella line
nasal line
ML
RL

-209-
VARIABLES USED IN CORRELATION AI{ALYSIS
Magnitude of Peak VelocitY
Chronological Age at Peak Velocity
Skeletal Age at Peak VelocitY
were deternined for the following neasurements:
Stature
Chronological Age
Skeletal Age
were determined for the following ossification events:
n-s
pm-sp
pg-ar
pg-go
ar-8o
Peak
Peak
Peak
Peak
Peak
Peak
ve locityvelocityve locityvelocityve loci tyvelocity
staturen-s
pn-sp
pg-arpg-go
ar-go
ve locityve Iocityvelocityvelocityvelocity
in n-gn
in n-sp
in id-gn
in pr-idin pm-s
n-gn
n-sp
id-gnpr-idpn-s
Sesanoid-stage 1
Sesamoid-stage 2
Sesamoid-stage 3
Pis iformHamate-stage L
Ha¡nate - Stage 2
Sesanoid
Sesanoid Stage
was deter¡nined for the following events:
1n
in1n
inin1n
Peak
Peak
Peak
Peak
Peak

-2t0-
DIFFERENCES BETWEEN CHRONOLOGIC AGES OF PAIRED EVENTS
Peak velocity in stature and:
pisiform, hamate-stage 1, hanate-stage 2, sesamoid,
sesamoid-stage 1, sesamoid-slage 2, sesamoid-stage 3,
peak velocity n-s, peak velocity pn-sp, peak velocity PB-ar,
peak velocity pg-go, peak velocity ar-go, peak velocity D-gfl,
peak velocity n-sp, peak velocity id-gn, peak velocity pr-id,peak velocitY Pm-s.
Pisiforn ossification and:
hamate-stage 1 ossification, hamate-stage 2 ossification,sesamoid ossification, sesamoid-stage 1 ossification,sesamoid-stage 2 ossification, peak velocity n-s,
peak velocity pm-sp, peak velocity pg-ar, peak velocity Pg-go,
peak velocity ar-go, peak velocity n-gn, peak velocity n-sp,
peak velocity id-gn, peak velocity pr-id, peak velocity pm-s'
Hamate-stage 1 ossification and:
hamate-stage 2 ossification, sesamoid ossification,sesamoid-stage 1 ossification, sesarnoid-stage 2 ossification,
sesamoid-stage 3 ossification, peak velocity n-s,
peak velocity pm-sp, peak velocity PE-ar, peak velocity pg-go,
peak velocity ar-go, peak velocity l-Bn, peak velocity n-sp,
peak velocity id-gn, peak velocity pr-id, peak velocity pm-s '
Ha¡nate-stage 2 ossification and:
sesamoid ossification, sesamoid-stage 1 ossification,sesamoid-stage 2 ossification, sesamoid-stage 3 ossification,
peak velocity n-s, peak velocity pm-sp, peak velocity PB-ar'
peak velocity pg-gP, Peak velocity at-go, peak velocity n-gn,
peak velocity n-sp, peak velocity id-gn, peak velocity pr-id,peak velocitY Pn-s.

-2IL-
Sesamoid ossificatíon and:
sesamoid-stage I ossification, sesanoid-stage 2 ossification,
sesamoid-stage 3 ossification, peak velocity n-s,
peak velocity pn-sp, peak velocity P9-ar, peak velocity Pg-go,
peak velocíty at-go, peak velocity D-gn, peak velocity n-sp,
peak veJ"ocity id-gn, peak velocity pr-id, peak velocity pn-s.
Sesamoid-stage 1 ossification and:
sesanoid-stage 2 ossification, sesamoid-stage 3 ossification,peak velocity n-s, peak velocity pm-sp, peak velocity P9-41,
peak velocity pg-go, peak velocity ar-go, peak velocity n-gn,
peak velocity n-spr peak velocity id-gn, peak velocity pr-id,
peak velocitY Pm-s.
Sesamoid-stage 2 ossification and:
sesamoid-stage 3 ossification, peak velocity n-s'
peak velocity pn-sP, peak velocity P9-ar, peak velocity pg-go,
peak velocity ar-go, peak velocity n-gil, peak velocity n-sp,
peak velocity id-gn, peak velocity pr-id, peak velocity pm-s.
Sesamoid-stage 3 ossification and:
peak velocity n-s, peak velocity pm-sp, peak velocity PE-ar'
peak velocity pg-go, peak velocity aI¡-go, peak velocity n-gn,
peak velocity n-sp, peak velocity id-gn, peak velocity pr-id,
peak velocitY Pm-s "
Peak velocitY n-s and:
peak velocity prn-sp, peak velocity PE-ar, peak velocity pg-go'
peak velocity ar-go, peak velocity î-9n, peak velocity n-sp,
peak velocity id-gn, peak velocity pr-id, peak velocity pm-s.
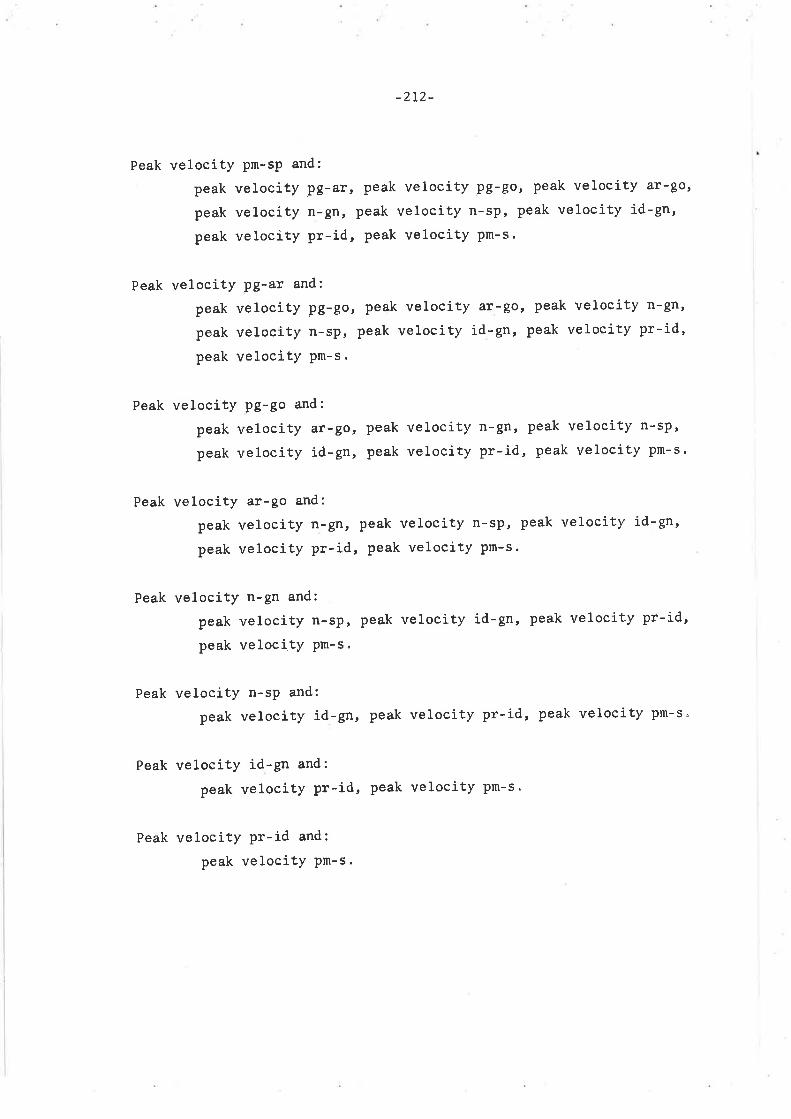
-2r2-
Peak velocity Prn-sP and:
peak velocity pg-ar, peak velocity Pg-go, peak velocity ar-go,
peak velocity tr-gD, peak velocity n-sp, peak velocity id-gn,
peak velocity pr-id, peak velocity pn-s.
Peak velocitY Pg-ar and:
peak velocity Pg-go, peak velocity ar-go, peak velocity n-9n,
peak velocity n-sp, peak velocity id-gn, peak velocity pr-id,peak velocitY Pm-s "
Peak velocity Pg-go and:
peak velocity ar-go, peak velocity n-gD, peak velocity n-sp,
peak velocity Íd-gn, peak velocity pr-id, peak velocity pm-s"
Peak velocity ar-go and:
peak velocity n-gn, peak velocity D-sp, peak velocity id-gn'
peak velocity pr-id, peak velocity pm-s.
Peak velocity n-gn and:
peak velocity n-sp, peak velocity id-gn, peak velocity pr-id,
peak velocitY Pm-s"
Peak velocity n-sP and:
peak velocity id-gn, peak velocity pr-id, peak velocity pm-s"
Peak vel.ocity id-gn and:
peak velocity pr-id, peak velocity pn-s'
Peak velocity Pr-id and:
peak velocitY Pn-s.

-213-
APPENDIX D.
Computer output for growth velocities (on next page)

oa
ooo
ooo
O
o
a
o
O
o
o
o
o
atorri ¡rrtrllt . trl.,3cl ltt rttl¡tc, rro0a.r oa¡y¡r
lllt È-l.. l-¡ac rl¡t. r-a ¡r-jl re-lt ta-eo^t-eo
{-0{ x-lp l0-0iC.00 0.00 0.00 c.00
ac.3t ¡09..0 aa.to !0.a8¡1.40 ¡ I l.ó0 l0¡00 t¡.¡0ót¡Or lll¡.0 ro.l0 t¡.lcat¡22 I lt¡00 rt.¡o !¿.a....0a ¡¿0.t0 .9.0a lt.åÉc.00 0.00 û.00 0.00
aa.óö ¡t¿.90 tt.t¡ t..ó3¡0¡00 .0.00 5¡.a0 -0.00
oa
o
O
a
o
ta
a
o
co
oo
a
a
O
o
o
o
o
Ioo
o
a
O
a
a
O
o
o
a
O
a
o
a
a
a
a
o
o
o
a
4., l¡ll¡L l¡ll¡t llrOll¡ tl¡ll¡a lloLIt, ll¡it¡t o¡ttrl ¡t.L¡v ¡a.tt
a'la o.aa ô.10atrttaa.¡.ll¡ ll?..l.?c.t.t.l!
t¡.la.ùll
0¡ 00 0.00 0.0CIt.t0 to.a¡¡cr.¡0 ta.lt¡aô.0c lr.¡¡¡0r.lo to.tt¡lo.oo .t¡ lt0.00 0.00¡¡t.10 ar.a0-0.C0 -0.00
0¡00¿ t.06¿¡.5?¡¿.0.tt.!tll¡tôt.0 0
22t42
ù.U0a¡.5ra¿.t0l5rZu
a.al¡a.f0l¡.ca¡¡.00¡¡.loa. cc
.l¡C0I t.00
¡¡0.¡c¡ó¡.talll¡ll¡rr.aa¡a¡.aa
c.at¡... ¡a.a ¡aa
¡¡.atl¡.tall.t.tt.talO¡tl
at.¡¡aa¡0!
0 rll¡a.tt.l¡al
0.00¡9¡0J¡ù.00
a¡¡Lrlt toi r¡rt¡rLt ttrr. .|,|{ct ltl^r{rLvsE!
tnlPS
ÍoN ¡0-0i SUIJEC! ¡¿?
rrltl ¡aa tlrtft lclocllvrlli.¡tc ¡0.9c0 t.ta¡
lrallrY¡l l.lO-tol¡t aoE Llrtft YcLocltY/vn
9.1t0 t0.9ãu .aót0.950 l¡.950 ¡0t0¡.930 ¡¿.e40 .0ô0a.910 ¡l.ero l¡!20!.910 t3.9r0 .315
tNl¿.YrL
1.t80¡.0001.0{¡uI ¡00ù2¡000
r l ù-Pu l,l1.t Itat ¡a¡c ¡t¡a au
¡t.ñaI l.llttl.íallrllC
¡ ¡ .tll a.¡C0¡t.r¡c r.aoat¡.ttc a.aac
I ¡laol.occ
¡0¡¡Itl¡l.
UÓOat0.10.t0910
rL lp
^, ¡e
rc t5rs luIU II
0.0ô0¡.rto
I rCCOI ¡0e0
¿.at0¡..J 0¡u tt ¡¡..l0 t. ¡r0
a. ¡tal¡CC0 ¡ a.950
rx ll¡tll ¡a.t¡r ¡fo l¡.|úcilD+elll 0l llll ll¡¡le¡fa!tt^! rat rt.rtt ¡o.rao l{o ¡¡.oocr¡0.t01¡t 0t ]ltl¡Îll ¡¡a ¡C.tlC
¡lrl¡ur YELocltt ¡.!¿0¡0f !lrlts ¡a.950
^{0 ¡3.950
x¡D-PotNt 0? vEtt tJ.a50tfflElAL roE Llrt13 l¡.000 lr¡0 ¡¡.t00H¡D-POlNl 0¡ lxflllrL
^OE l¡.?ã0
Afl¡LYSE3 70H YrRllsLl 9¡-lO 3UËJ¿Cf !¿2a a t a a aa a aa aa a a a a a a oaa
TPlps ¡oE L¡rlt5 v¿Locttt/Yr t(fßHvlL
¡¡aLrlta to.laaaaaaa
¡-l ¡uÒJlcl ¡t,
Vrltl aaf Llrllt lllOCltv/v¡ lttl¡YlL llD-rolNl ¡10-Put{t¡Ltt
tt l.¡ta.e lt¡itl.l ¡¡.llaaU tl¡all¡r lt¡ttl
¡c.rla¡¡.rtc¡t.t¡cI totlo¡t.60
..a¡rll0
I ¡C.0
t00000000000000
¡0tl¡al¡¡.
.oa0¡al0
¡L AP¡P ¡E
^c ^s¡t lU¡u
^t
9.1t0 0.9501.9å02.990¡.9505.910
-1.t0¿.5¡0
I ¡2to'.3Cu'¡020
tú000ù00ù00000ú
lo.oôo¡¡.a50ll¡a5il¡e¡t
¡U.ó10. alc
..t0
..t0
.9t0
t0.930¡ ¡.9J0¡¿.910¡t.9t0
¡l.aådta.9¡0
r¡rlrl|| fStoctrr 1.o.0¡l llr¡lt ll¡rro rro rr¡ttt¡¡0-01¡1 0t vl^l ra.a0!trQltl¡r ¡aa ltrttr l¡.ala ¡lþ ¡¡.raorlo-rolrt 0t ¡rflgtrt ^l¡¿ ¡t.00t
rlrlrux ltloclfY l.¿r0¡oE L¡X¡t¡ t¡.9t0
^N0 ¡¿.9J0
¡!o-Pol{I 07 vÉ¡n ¡¿.atoti¡LllrL ro¿ ltrtf3 ll¡000 l¡{0 tJ¡000rlo-Pol{l 07 lrELEt^L ¡r¡t ¡¿.000
o
o
aoa
a
a
a
a
o
o
o
o
O
o
a
a
a
a
o
o
o
o
o
o
Pl-lt ¡UaJ:Cl ¡12 I{¡LYSES 70N V¡¡trELê rp-00 suüJtcf !¿¿. aaa aao ¡a r a a a aa a
tatt¡ ref ttxt It rlLoc¡lr/rrr!
^r 9.tra ¡0.950 rt9t
¡? re l!¡l!0 I l.lb0 ¡0ó0.e l¡ ll.9r0 t¿.eto ¿.0¡0¡¡ ¡r, ¡t.aJC ll.ato ¡.4¡0¡u
^r lt.eto ¡9.9t0 .9to
¡^tlrut vCLoCltr 1.0¡orót L¡rlll ¡ ¡.cto ¡{u ¡¿.910
I {llxvrL
l.tl0I ¡00cl.0oo1.000l¡000
I ¡ ù-r0t ilt
10.000
Ì¡tPS ^OÊ
LtåttS VELoC¡tv/yR lNtfiv^L sto-put!tlL rt g.¡to ¡0.910 -¡t0. ¡.tlu
1.000l.0t¡0
.0ô 0
.150
..s 0
.rå0
.950
¡ ¡..10¡¿..t0¡1.t30
¡P ¡0 ¡o¡0
^3 t¡
rS ¡U ¡¿l{, tt ¡¡
950 I ¡.9t0950 t2.910990 t¡.9J0rl0 t5.990
¿.2ó0l. lô0
¡ 020. t¿o
1.0002¡0001..910
r¡rt{ux Yfloc¡tr ¿.aó0rot Ltrttt ¡0.9¡0 ¡¡0 t¡.9!0
1.e00 ¡io ¡¡.000rl0-rOlt¡l Ot V¡¡ltIILCtAL ¡3! Ltr¡ttrlD-rOlñt 0r tlfllr
¡ ¡..t0¡rfu?rl ¡at Llrll! ¡.l0.r0l{l Ot ¡¡alft¡L ¡ùt ¡¿.0e0 rL ¡0¡ 10.150
¡i¡Lrt¿t 70¡ vrr¡rú\f eß-¡t trJlJ¡cl l¿2ao a a a ¡ a a a. a a a a a aa a a a a
ì-0x SudJtcl J22
r¡¡tarl ¡,
roe Ll¡ttta.lt0 ¡0.9t0
vt-Olltt/lP l{l¿rl¡L rlD-lOtr? rnlPs
¡t rttP l0¡o ¡3¡s ruau lr
reE Llr¡13 V¿toc¡1Y/VF trrf{v^! r¡U-Pol rl0.rtôot.a50r, ¡e
¡C llr¡ tulu ¡r
¡c.lto ¡ ¡..t0¡ ¡.910 ¡l.t5o¡ r. r¡o ¡ t. etoI ¡.9t0 ¡ 5. eC0
l..at¡.t00
t0000000u009000
¡c¡¡¡¿¡t¡r
.0ô0
.a90
.lt0
..t0
.930
e.ttc¡ 0.9J0I I ¡930¡e.9!0¡!.950
I 0.eto¡¡.eJo¡2.9t0¡J. e90lÉ.950
¡.¿3ô¿.a00¡.ó00¿.t00¡ .100
td000000r,0O r,000
tr t00I.a00¡ .100
¿.150t..10
I r. lg0
F¡¡lrul Yfl0Clll l¡tOorea Llrttt l0.làu tr0 ¡¡.950
xr¡lrur vllocltY J.ó00¡o€ Llratls ¡¡.950 tilo l¿.950¡lO-POlNt 07 lE¡r ¡¿.ôS0SXELCIIL
^o[ Ltå¡l! ¡1.0ôo
^ilD ¡¡.000{lO-PolÍt O¡ txELCt¡L roÉ. ¡2.000
¡10{0¡rr oÍ Y(re ¡1..)ytf¡L¡lal ¡Of Ll¡¡ÎJ ¡0.t00 ¡¡O ¡¡.000r¡D-totN? 07 traLE?¡L lol ¡0.ttu
li¡!l¡l¡ aOP Y¡Pl¡ôLÉ PO-00 t22
I ¡lfr Y tL
l.t¡ol¡00Ù¡.0001.0002.00 0
rt¡LYSEs fOF Vrn¡^rLE ¡-Sp SUaJECÍ r?aa ata a a aa aa a rra a o
rrlrla! 1Þ
rot Ltrlrs9.1r0 ¡0.0t0
¡0.a!0 ¡l.9lo¡ ¡ .9lo ¡ ¿. ¡JoI t.9t0 I J.9å0tt.a5o t5.950
vfLocllt/tr ¡lO-Pül{l lPlPs ¡08 Llfltts vÊLoCtyy/tR txtf{l¡L Htu-tùt4t0¡ôtaoaa0òÒ0¡lu
¡ 0.9ô0¡ 1..10
¡L ¡P 9.¡t0 ¡0.950 2.jzt .lé o
¡ 000.0 00
rP re¡c rl¡¡ lu
¡ ¿..J oI 1..t0
tP ^cle ls
¡5 lU¡u tllt lY
¡0.9t0 ¡1.950¡t.e30 t¿.eso¡e.9t0 tr.9ro¡t.9t0 t3.9É0¡5.950 ¡ö.9s0
.s00-l .000
J. ó.0-¿.5¿ ù
000000
r¡r¡rur YlLocltraot l¡rtl3 ¡¡.c10 ¡¡¡o-tolil 02 la¡Ptf¡,!ar¡L ¡0t tt¡lrtrlo-POltll Ot 3¡tltf
r¡¡l{ut YELocttr t.ô.r,roc Llxlt3 ¡J.950
^{0 ¡ã.950
r¡O-POlìl OF Yfr¡ ¡i.950Sl(lLEtll r0¿ LtrllS ¡!.500 t{D -0.000xlo-Po¡{l 0a StfLgtrl Ad¿ ó.t5ù
I¡aa0no ¡¿.950¡¿..50
¡ ¡.000 ltru ¡¡.000¡L
^O¿ ¡a.000
¡a.95000ü
lu.ùô0I ¡..50l2¡¡50I ¡.aÉ0¡..930Iô.a50

-2L5-
REFERENCES
ABBIE, A.A. 1957 Metrical characters of a Central Australian tribe"
Oceania, 27 2220-243,
1958 Timing in Human Evolution.
Proc.Linn.Soc., N.S.Ill., 832t97 -2I3,1961a Physical changes in Australian aborigines consequent
upon EuroPean contact.
Oceania, 3t:L40-t44 ,
lg6lbApreliminarysurveyofthegrowthpatternofCentral Australian aboriginal males.
Oceania, 3lz2L4-22t.196lc Recent field work on the physical anthropology
of Australian aborigines.
Austral .J .Science, 23'-210-21L,
1963a Criteria for the conparison of skulls.
Nature, 199:101,
1963b The cranial centre
Z.Morph.AnthroP., 53:ó-11.
1963c Physical characters of Australian aborigines.
In: Australian Aboriginal Studies.
Ed. sheils, Helen. Oxford university Press, Melbourne. 89-107
1966 Physical characteristics. In: Aboriginal Man
in south and central Australia. Part 1. Ed. Cotton, B.c.
S.A. Branch of the British Science Guild Handbooks Comnittee,
AdeIaide, 9-45.
196TskinfoldthicknessinAustralianAborigines.Archaeol . Phys .Anthrop .Oceania, 22206-219'
1970 Personal communication
ABBIE, A.A. and W.R. ADEY 1953a Pigmentation in a central
Australian tribe, with special reference to fair-headedness '
funer.J .Phys .Anthrop .' 11 : 339-360.
Australian tribe.Hum. Biol . , 252265-278 .
1953b Ossification in a Central

-2t6-
ABBIE, A.A. and W.R. ADEY 1955 The non-metrical characters of a
Central Australian tríbe.Oceania, 25:198-207,
ADAMS, J.W. 1940 Correction of error in cephalometric roentgenograms.
Angte Orthodont. , l0: 3- 13 .
ACHESON, R.M. 1954 A method of assessing skeletal maturity from
radiograPhs.
J. Anat" 88:498-508.
1957 The Oxford method of assessing skeletal maturity.
Clin.Orthop., 10: 19-39.
1960 Effect of nutrition and disease on human growth,
In: Human Growth, Symp. Soc. Study. Ed. Tanner, J.M.
Human Biol. , 3;73-92,
ACHESON, R.M. and C.W. DUPERTUIS f957 The relationship between
physique and rate of skeletal maturation in boys.
Human Biol. , 29=t67-t93,
ACHESON, R.M., G.B. FOWLER, E.I. FRY, M.D. JAllES, K. KoSKI, P. URBANO
and J.J. VAI'¡ DER WERFF TEN BOSCH 1963 Studies in the
reliability of assessing skeletal naturity fron X-rays.
Part 1: The Greulich-Pyle Atlas" Hunan Biol. 3S:3t7-349,
ACHESON, R.M., G.B. FOWLER and M.D. JANES L962 Effect of improved
care in the predicted adult height of undernourished children"
Nature (London) , 194:735-736 ^
ASHLEY MONTAGUE, M.F. 1960 An introduction to Physical Anthropology"
3rd ed. Charles C. Thomas, Springfield.ALLEN, B. 1926 An X-ray study of development of ossification
centres of skeletal system.
Radiol ", 7:398-409.
BAER, M.J. and J. DURKATZ 1957 Bilateral asynmetly of hand and
wrist: roentgenographic analysis.
Amer.J.Phys.Anthrop., N.S., 15: 181-196"
BALDWIN, B.T. Lg2L The physical growth of children from birth to
maturity.Univ. of Iowa Studies in Child We1fare, t:167,

-2r7 -
BALDWIN, B.T, L928 Anato¡nic growth of children.
Univ. of Iowa Studies in Child Welfare, No. 1" 4:88.
BALDWIN, 8.T., L.M. BUSBY and H.V. GARSIDE 1928 Anatomic growth of
children. A study of some bones of the hand, wrist and lower
forearm by means of roentgenograms.
Univ. of Iowa Studies in Child We1fare, 4:No.1.
BAMBHA, J.K. 1961 Longitudinal cephalometric radiographic study of
face and craniun in relatíon to body height "
J.Amer.Dent.Ass., 63:776-799,
BAMBHA, J.K. and PEARL VAl.l NATTA 1963 Longitudinal study of facialgrowth in relation to skeletal maturation during adolescence"
Amer.J .Orthodont., 49 : 481-493.
BARDEEN, C.R. IgzL The relation of ossification to physiological
developnent.
J .Radio1. , 2:I-8,BARRETT, M.J. 1953a DentaI observations on Australian Aborigines:
Yuendumu, CentraL Australia, 1951-1952.
Austral.D.J., 57 :I27 -t38,1953b rrXrt-occlusion.
Dent.Mag. (Lond.), 70:279.
1956a Mastication - A Dynamic Process "
University of Adelaide documentary film.f956b Dental observations on Australian Aborigines:
water supplies and endenic dental fluorosis.Austral . D.J " , t:87 -92 .
1957a Serial dental casts of Australian Aboriginal
chi ldren.Austral.D.J., 2274.
1957b Dental observations on Australian Aborigines:
tooth eruption sequence.
Austrat "D.J. , 2=2L7-227 .
1958 Dental observations on Australian Aborigines
continuously changing functional occlusion.
Austral.D.J ., 3239-52.

-218-
BARRETT, M.J. 1960 Parafunctions and tooth attrition.In: Parafunctions of the masticatoxy system (Bruxism)
"
of a panel discussion. Ed. Lipke, D. and U. Posselt.
J .West. Soc " Periodont. , 8:135-148.
Report
1964 Walbiri customs and beliefs concerning teeth"
Mankind, 6:95-100.
1965 DentaI Observations on Australian Aborigines.
Mankind, 62249-254,
1969 Functioning occlusion.
Ann. A.C.D.S. 2:68-80.
BARRETT, M.J. and T. BROWN 1966 Eruption of deciduous teeth in
Australian Aborigines "
Austral. D.J ", 11:43-50 "
1968 Relations between the breadth and
depth of dental arches in a tribe of Central Australian Aborigines "
Austral.D.J., L3:381-386
BARRETT, M.J., T. BROWN, H. ARATo and I.V. OZoLS 1964 Dental
observations on Australian Aborigines: bucco-lingual crown
diameters of deciduous and permanent teeth.
Austral.D.J ., 92280-285,
BARRETT, M.J., T. BROWN and K.M. CELLIER L964 Tooth eruption
sequence in a tribe of Central Australian Aborigines.
Amer.J. Phys.AnthroP . 22:79-90.
BARRETT, M"J", T. BROWN and ELIZABETH A. FANNING 1965 A long-
term study of the dental and craniofacial characteristics of a
tribe of Central Australian Aborigines.
Austral "D,J ., 10:ó3-68.
BARRETT, M.J., T" BROWN and J.I. LUKE 1963 Dental observations
on AustraLian Aborigines: Mesiodistal diameters of decíduous teeth"
Austral.D.J., 82299-302.
BARRETT. M"J", T. BRQWN and M.R. MACDONALD 1963a Dental obser-
vations on Australian Aborigines: A roentgenographic study of
prognathism.
Austral.D.J., 8:418-427,

-2I9-
BARRETT, M.J,, T. BROWN and M.R. I4ACDONALD 1963b
vations on Australian Aborigines: mesiodistal
of permanent teeth.Austral "D .J . , 8: 150-155 .
19ó5 Size of the dental arches in
a tribe of Central Australian Aborigines.
J.Dent.Res., 44:912-920,
BARRETT, M.J., T. BROWN and E.C. McNULTY 1968 A computer-based
system of dental and cranio-facial measurement and analysis.
Austral.D.J ., 13: 207 -2I2,BARRETT, M.J., T. BR0WN and D.W. SIMMONS 1966 Computers in
dental research.
Austral.D.J., 1I: 329-335.
BARRETT, M"J., J.J. WILLIAMSON, T. BRoWN and G.C. TOWNSEND I97O
Dental caries prevalence in a group of Australian Aborigines.
I.A.D.R. Aust. and N.Z. Divis., 10th Annual Meeting, Abstracts,
Paper 28.
BAYER, L.M. and R.R. NEWELL 1940 The assessment of skeletal
developnent of the hand and knee between the ages of 8 and
14 years.
Endocrinology, 26:779-782,
BEYRON, H. tg64 Occlusal relations and nastication in Australian
Aborigines.Acta Odont.Scandinav., 22:597-678,
BJöRK, A. Lg47 The Face in Profile.Svensk Tandläkare Tsk ", Suppl . , 40: 5 B'
1950 Some biological aspects of prognathisn and
occlusion of the teeth.
Acta Odont " Scandinav. , 9: 1-40 .
I9SS Variability and age changes in overjet and overbite"
Amer.J.Orthodont., 39:779-80t,
1954 Cephalometric x-ray investigations in dentistry "
Int.Dent.J ., 417L8-7 44.
DentaI obser-
crown diameters

-220-
BJöRK, A. IgS5 Facial growth in nan, studied with the aid of
rnetallic imPlants.
Acta Odont .Scandinav. , 13:9-34.
1960 The relationship of the jaws to the cranium'
In: Introduction to Orthodontics. Ed. Lundstrom, A'
McGraw-HiII, New York. 104-I40.
1963 Variations in the growth pattern of the human
¡nandible: longitudinal radiographic study by the imptant method"
J "Dent. Res . , 42:400-411 .
1964Suturalgrowthoftheupperfacestudiedbytheimptant nethod"
Trans.Europ.Orthodont.Soc., 49-65 .
BJöRK, A. and M. PALLING 1954 Adolescent changes in sagittal jaw
relation, alveolar prognathy, and incisal inclination.Acta Odont.Scandinav., L2z20I-232.
BJöRK, A. and B. SOLOW L962 Measurement on radiographs.
J.Dent "Res. , 4L2672-683,
Wönf , A. and S. HELM 1967 Prediction of the age of maximum
puberal growth in bodY heíght.
Angle Orthodont . , 37:I34-I43 "
BOAS, F. 1932 Studies in growth.
Human Bio1., 4:307-350.
BROADBENT, H. 1931 A new X-ray technique and its applications
to orthodontia"Angle Orthodont., 1:45-66.
lg37 The face of a normal child, Bolton standards
and technique.
'Angle 0rthodont., 7 :183-208,
Ig37 The face of the nornal child"'Angle Orthodont., 7 :209-233,
BROAÐWAY, E.S., M.J.R. HEALY and H.G. POYTON 1962 The accuracy of
tracings from cophalometric lateral skul1 radiographs.
Dent, Prac . and Dent. Rec . , t2:455-460 '

-22t-
BRODIE, A.G. 1941 On the growth pattern of the human head from
the third month to the eighth year of life.Amer "J .Anat. , 68:209-262.
1953 Late growth changes in the human face.
Angte Orthodont., 232L46-t57 .
BROWN, T. 1965 Craniofacial Variations in a Central Australian
Tribe. A radiographic investigation of young adult nales and
females,
Libraries Boatd of South Australia, Adelaide.
1967 Sku1l of the Australian Aboriginal. A multi-
variate analysis of craniofacial associations.
Departnent of Dental Science, University of Adelaide, Adelaide.
BROWN, T. and M"J. BARRETT 1964 A roentgenographic study of
facial morphology in a tribe of Central Australian Aborigines "
Amer.J .PhYs.Anthrop. , 22233-42,
1970 Growth in Central Australian
Aborigines: Height attained (In preparation).
BROWN, T., M.J. BARRETT and J.N" DARROCH 1965a Factor analysis
in cephalometric research.
Growth, 29:97-I07,1965b Craniofacial factors in two
ethnic groups.
Growth, 292I09-L23.
BRUCH, H. 1941 Obesity ín relation to puberty.
J.Pediat., 19: 365-375'
BUEHL, C.C. and S. IDELL PYLE 1942 The use of age at firstappearance of three ossification centTes in determining the
skeletal status of children.
J . Fediat . , 2t: 335-342 "
BURSTONE, C.J. 1963 Process of maturation and growth prediction"
Amer . J . Orthodont . , 49: 907 -9 19 .
ÇAMPBELL, T.D. lg25 Dentition and Palate of the Australian
Aboriginal.University of Adelaide, Adelaide.

-222-
ÇAMPBELL, T.D. and M.J. BARRETT 1953 Dental observations on
Australian Aborigines: a changing environnent and food pattern.
Austral .D .J . , 57:L-6 ,
CAMPBELL, T.D., J"M. SIMPSON, J.G. CORNELL and M.J. BARRETT 1954
so They Did Eat. university of Adelaide documentary film"CAPELL, A. 1952 The Wailbri through their own eyes.
0ceania, 23:tL\-132,
CARTER, T.M. 1926 Technique and devices in radiographic study
ef the wrist bones of children.J .Educ. Psychol., L7 2237 -247 ,
CHAN, S.T., K.S.F. CHAIIG and F.K. HSIU 1961 Growth and skeletal
maturation of Chinese children in Hong Kong.
Aner .J . Phys . Anthrop . , 19 : 289- 300 .
CHENG, P. 1970 A tongitudinal study of the changes in size and
shape of the dental arches between adolescence and adulthood
in a group of Australian Aborigines.
University of Adelaide M.D.S. Thesis (In Preparation).
CLELAND, J.B. and N.B. TINDALE 1954 The ecological surroundings of
the Ngalia natives in Central Australia and native names and
uses of plants.Proc.Roy "Soc.S.Aust., 77 : 8I-86
"
CLEMENTS, E"M.B., E. DAVIES-THoMAS and K"G" PICKETT 1953 Time of
eruption of permanent teeth in British children in 1947-48.
Brit.Med.J ., LzL42I-1424.
COHN, I. Lg24 Normal bones and joints roentgenologically considered"
Ann.Roentgenol. , 4:2,
CRANI, J.A" 1955 Notes on the teeth and gingivae of central
Australian Aborigines .
AustralD.J., 59:356-361.
1957 Notes on the teeth and gingivae of Central
Australian Aborigines.
Austral.D "J., 2:277-282,
1959 Relationship of diet to dental caries.
Austral.D "J., 4: I82-190.
-223-
CRAII, J.A. 1960a An investigation on the effect of dietary changes
on the oral tissues of Central Australian Aborigines,
Doctoral thesis (part II). University of Adelaide.
1960b The histological structure of the teeth of Central
Australian Aborigines and the relationship to dental caries
incidence.Austral.D "J ., 5: 100-104.
1964 The incídence of Lancefield groups in oral
streptococci.Austral.D.J., 9:27-28,
CRAVEN, A.H" 1958 A radiographic cephalometric study of the
C entral Australian Aboriginal "
Angle Orthodont., 28:L2-35.
CROXTON, F.E. 1953 Elementary Statistics with Applications in
Medicine and the Biological Sciences.
Dover Publications, Inc., New York.
DAIILBERG, G. 1940 Statisticat Methods for Medical and
BiologicaL Students.
George Atlen and Unwin, Ltd., London.
DAVENPORT, C.B. and OLIVE RENFROE 1940 Adolescent developnent
of the sella tursica and the frontal sinus based on consecutive
roentgenograns.
Amer,J .Roentgenol. , 44:665-679 ,
DAVIES, T.G.H" and P"O. PEDERSEN 1955 The degree of attrition of
the deciduous teeth and first permanent molars of primitive and
urbanized Greenland natives.
Brit. Dent.J . , 99: 35-45.
DEAN, H.T" 1934 Classification of mottled enamel diagnosis.
J.Amer.Dent "Assoc., 2I:I42L-I426.
DEMING, JEAl.l 1957 Application of the Gompertz curve to the observed
pattern of growth in length of 48 individuat boys and girls during
the adolescent cYcIe of growth.
Human Biol. , 29:83-122,

-224-
DIXON, W.J. and A.M. MOOD 1946 The statistical sign test"
J .Amer,Statist.Assoc ", 41: 557-56ó.
DREIZEN, S", R"H. SNODGRASSE, G"S. PARKER, C. CURRIE and T"D. SPIERS
1954 Maturation of bone centres in the hand and wrist of
children with chronic nutritive failure.Atner . J .Dis .Chi ld. , 87 :429-439 .
DREIZEN, S., R. SNODGRASSE, H"WEBB-PEPLQE, G. PARKER and T.D" SPIES
1957 Bilateral symmetry of skeletal maturation in the human
hand and wrist.Aner"J .Dis .Child., 93:I22-L27,
DREIZEN, S., R.M. SNODGRASSE, H. WEBB-PEPLoE and T.D. SPIES 1958
The retarding effect of protracted under-nutrition on the
appearance of the postnatal ossification centres in the hand
and wrist.Human Bio1., 30: 253-264.
DUPERTUIS, C.W. and N.B. MICHAEL 1955 Comparison of growth in
height and weight between ectomorphic and mesomorphic boys "
Child Develpm., 242203-214,
ELLIOTT, R"B" , G.M" MAXWELL, G.M. KNEEBoNE and D.K. KIRKE 1969
A nutritional survey in Australian Aboriginal infants.
Aust.Paediat.J ., 5: I09-113"
ELLIS, R"W.B. 1950 Age at puberty in the tropics'Brit.Med.J., 1:85-89.
FANNING, ELIZABETH A. and T. BROWN I97I Primary and permanent
tooth develoPment.
Austral. D.J . (in Press) .
FICK.R. I$OI Ergebnisse einer Untersuchung der Handbewegungen
mit X-Strahlen. Verhandlungen der Anatomisohen
Gesellschaft, 175-184.
FISHER, R.A. 1958 Statistical Methods for Research Workers.
Thirteenth Ed. Oliver and Boyd, Edinburgh.
FLECKER, H. lg32 Roentgenographic observations of the times of
appearance of epiphyses and their fusion with the diaphyses "
J .Anat . 67:118-164.

-225-
FLQRY, C.D" 1936 Qsseous developnent in the hand as an index
of skeletal develop¡nent.
Monogr.Soc.Res.Child Develop., 1 No, 3. 1:141"
FRANCIS, C.C. 1948 Growth of the human pituitary fossa.
Human Biol. , 20:I-20,
FRANKLIN, J.B. 1952 Certain factors of aberration to be
considered in cLinícaI roentgenographic cephalometry.
Amer.J .Orthodont ., 38:351-368.
FRy, E"I. I9ó8 Assessing Skeletal maturity: comparison of
the Atlas and individual bone techniques.
Nature (London) , 220:496-497.
GARN, S,M" 1958 Statistics: A review.
Angle Orthodont. , 28: 149-165.
1965 Malnutrition and skeletal development in the
pre-school child" In: Malnutrition in the Pre-school child.Nat " Acad. Sci . , Washington, D .C .
1966 The evolutionary and genetic control of
variabilitY in nan.
Ann"N "Y.Acad.Sci . , I34: Ãrt,2, 602-615 .
GARN, S"M. and J.A. HASKELL 1960 Fat thickness and develop-
nental status in childhood and adolescence.
Amer.J .Dis "Child " , 99:746-75t "
GARN, S"M. and CHRISTABEL G" ROHMANN 1959 Conmunalities of the
ossification centres of the hand and wrist.Amer.J .Phys .Anthxop ", 17 :3I9-323.
1960 Variability in the order
of ossification of the bony centres of the hand and wrist.Amer.J.Phys .Anthrop., L8;219-230
"
L962 The adductor sesamoid of
the thumb.
Amer "J .Phy "AnthloP. , 2A:297 -302,
GARN, S.M., CHRISTABEL G. RoHMAI'IN and T" BLEMENTHAL 1966
Ossification sequence polymorphism and sexual dimorphisn in
skeletal develoPment"
Amer.J.Phys.Anthrop., 242 I01-115.

-226-
GARN, S"M. and Z. SHA¡4IR 1958 Methods for Research in Human Growth"
Charles C. Thomas, SPringfÍeld"
GRAY's Anatony, 32 Ed. Edited by T.B. Johnston, D.V. Davies, F. Davies,
Longnans, Green Ê Co"Ltd., 1958. London, New York, Toronto.
GRESHAM, H., T. BROÌ{N and M.J. BARRETT 1965 Skeletal and denture
patterns in chíldren fron Yuendumu, Central Australia, and
Melbourne.
AustlaI. D.J. , 10: 462-468,
GREULICH, W.W. 1938 A handbook of methods for the study of adolescent
chi ldren.Monogr . Soc
" Res .Child Developm. , 3:No " 2.
f957 A comparison of the physical growth and develop-
ment of American-born and native Japanese children.
Amer.J.Phys.Anthrop., N.S. 15:489-51'5.
GREULICH, W.W" and s. IDELL PYLE 1959 Radiographic atlas of
skeletal development of the hand and wrist.2nd edition" Oxford Uníversity Press, Oxford.
HATTON, M.E. and R.M" GRAINGER 1958 Reliability of measurements
from cephalograms at the Burlington Orthodontic Research Centre"
J .Dent.Res., 37 :853-859"
HEATH, J " Ig47 Normal and abnormal occlusion of the teeth of
Australian aboriginal children.
Austral.J.D. 51: 85-95.
HEITHERSAY, G.S. 1961 Further observations on the dentition of
the Australian Aborigines at Haatrs Bluff'Austral " D .J . 6: 18-28 .
HEWITT, D., CELIA K. WESTROPP and P.M. ACHESON 1955 Oxford child
health survey: Effect of childish ail¡nents on skeletal developrnent,
Brit.J .Prev.Soc "Med", 9: 179-186 "
HIERNAUX, J. 1g6s La Croissance des ícotiers Rwandais.
Roy.Acad"Sci., Outre-Mer, Brussels.
1968 Ethnic differences in growth and development"
Eugenics QuarterlY I5zI2-21 "

-227 -
HOWELLS, W.W. 1969 Críteria for selection of osteometric
dimensions .
Amer.J .Phys "Anthrop. 30 : 451-458.
HUNT, E"E., G. COOKE and J.R. GALLAGHER 1958 Sonatotype and
sexual naturatíon in boys: a method of developmental analysiS,
Human Biol., 30:73-9L,
HLNTER, C.J. 1966 The correlation of facial growth with body
height and skeletal maturatíon at adolescence.
Angle Orthodont., 36244-54.
ITO, p.K. Ig42 Comparative biometrical study of physique of
Japanese women born and reared under different environments,
Human Biol., L4:279-35I.
JOHNSTON, F.E., H.P. HUFHN, A.F" MORESCHI and G.P" TERRY 1965
Skeletal maturation and cephalofacial development.
Angle Orthodont., 35: 1-11.
JOHNSTON, F.R. and S.B. JAHINA 1965 The contribution of carpal
bones to the assessment of skeletal age.
Amer"J .Phys.Anthrop., 232 349-354.
JONES, F. WOOD 1938 The cervical vertebrae of the Australian
native.J.Anat. (London) , 72241I-415.
JOSEPH, J. 1951 The sesamoíd bones of the hand and the time of
fusion of the epiphyses of the thumb.
J .Anat . (London) , 85:230-24L.
KAYUKAWA, H. Lg57 Studies on morphology of mandibular overjet"
Part III. Radiographíc cephalo¡netric analysis.
J .Japan .Orthodont . Soc . , 16:- I-25 ,
KETTLE, ELLEN S. 1966 Weight and height curves for Australian
Aboriginal infants and children"
Med. J.Aust. , L:972-977 "
KIRKE, D"K. 1969 Growth rates of Aboriginal children in Central
Australía '
Med.J .Aust., 2: tr005-1009.

-228-
KROGI,IAN, W.M. and V. SASSOIJNI 1957 Syllabus in Roentgenographic
CephaLonetry.
Philadelphia Center for Research in Child Growth, Philadelphia.
KUUSK, S. The Australian Àboriginal Dentition" A study of
deciduous crown rnorphoLogy" M"D.S. Thesis, University of Adelaide
(in preparation) "
LAMONS, F.F. and S.W. GRAY 1958 A study of the relationship between
tooth eruption, age, skeletal developnent age and chronological
age in sixty-one Atlanta children.Amer "J .Orthodont,. , 44:687 -69I .
LAIIDE, M.J. 1952 Growth behaviour of the hunan bony facial profileas revealed by seriaL cephalometric roentgenology.
Angle Orthodont., 22:78-90,
LAUTERSTEIN, A.M. 1961 A cross-sectional study in dental development
and skeletal age.
J.Arner. Dent.Ass., 62: L6I-167 .
LEWIS, L.A. and S.M" GARN 1960 The relationship between tooth
for¡nation and other maturational factors.Angle Orthodont,. , 30:70-77 ,
LONG, E. and E.W. CALDWELL 1911 Some investigations concerning the
relation between carpal ossification and physical and mental
deve loPment .
Aner,J.Dis.Child., I: I13-138 "
LYSELL, L¡ and R. FILIPSSON 1958 A profile roentgenographic study
of a series of mediaeval skulls fron North Sweden"
Sartryck. ur Odont"T", 66:t6l-L74.
MACKAY, D.H. 1952 SketetaL maturation of the hand: a study of
development in East African children"Trans.Roy.Soc.Trop.Med. and Hygiene, 46: 135-150"
MAINLAND, D. 1953 EvaLuation of the skeletal age nethod of
estinatíng childrenrs developnent. Part I: Systemic errors
in the assessnent of roentgenograms.
Paediatrics, 12:lL4-L29 .

-229-
MAINLAì,ID, D. 1954 Evaluation of the skeletal age method of
estinating childrents development. Part 2: variable error
in assessment of roentgenograms.
Paediatrics, 13: 165-173.
I4ASSE, GENEVIEVE and E.E. HUNT, Jr . 1963 Skeletal maturation
of the hand and wrist in West African children"
Human Biol", 35:3-25.
MAJ, G. and C. LIJZI 1964 Longitudinal study of mandibular growth
between nine and thirteen years as a basis for an attenpt of
its prediction"Angle Orthodont. , 34:220-230.
MAJ.G. and F.p" LUCCHESE 1969 Individual variation of facial growth
in normal subjects aged between 9 and 17 years.
Europ "Orthodont . Soc . I37 -146 .
MAXWELL, G.M" and R.B. ELLIOTT 1969 Nutritional state of Australian
Aboriginal children"Amer. J .Clin.Nutrition, 2227L6-724,
McNULTY, E.C" 1968 Growth Changes in the Face. A semi-longitudinal
cephalometric study of the Australian Aboriginal by neans of a
co-ordinate anaIYsis.
Departnent of DentaI Science, University of Adelaide, M.D"S. Thesis.
McNULTY, 8"C", T. BROWN and M.J" BARRETT. 1968 Mesh diagram
analysis of facial rnorphology in young adult Australian Aboriginals "
Austral "D .J .,13: 440-446 "
MEDAWAR, P.B. Lg44 The shape of the human being as a function of
time.Proc "RoY.Soc, (Biol), L32: 133-141.
MEGGITT, M"J. Lg62 Desert People. A study of the Wailbiri
Aborigines of Central Australia.Angas and Robertson' Ltd", SYdneY.
MENEES, T"O" and L.E. HOLLY L932 Ossification in extremities of the
new-born.
Amer.J .Roent; and Rad.Th", 28:289-390.

-230-
MEREDITH, H.V. 1958 A time series analysis of growth in nose
height during childhood "
Child DeveloP., 29:L9-34,
MICHELSON, N" L944 StudÍes in the physical development ofNegroes. IV " Onset of PubertY.Amer.J .Phys .Anthrop., N.S . 2:L5I-I66.
MOORREES, C"F.A. and LAURE LEBRET 1962 The nesh diagram and
cephalometrics.
Ang1.e Orthodont. , 32:2I4-23L
MOORREES, C"F.A., ELIZABETH A. FANNING and E.E" HUNT, Jr. 1963
Age variation of formatÍon stages for ten permanent teeth"
J.Dent.Res., 42:1490-1502 "
NAÀIDA, R" S " 1955 The rates of growth of several facial components
measured from serial cephalometric roentgenograms.
Aner.J.Orthodont., 4I:658-673,
NEVAKARI, K. 1956 An analysis of the mandibular movement from
rest to occlusal Position.Acta Odont. Scandinav. , 14: Suppl . 19 .
PEARSON, K. and A" DAVIN L924 0n the biometric constants of the
human skul1.
Biometrika, 16:328-363,
PEARSON, E.S. and H.0" HARTLEY 1954 Biometrika Tables forStatisticians. VoI. 1. University Press, Cambridge"
PETRI . E. 1955 Untersuchungen zur Erbbedingtheit der Menarche "
Z .Morph"AnthroP., 33:43-48"
PIKE, J.B. 19ó8 A serial investigation of facial and staturalgrowth in seven to twelve year old children"
AngIe Orthodont", 38:63-73,
POIDEVIN, L"O.S. 1957 Some childbirth customs among the
Ngalia tribe: Central Australia.Med " J .Aust . , 1 : 543- 546 .
PRESCOTT, D"A. 1923 The determination of anatomical age inschool children and its relation to mental development.
Harvard Monog. in Educ., 5:1(JuIY) .

-23t-
PRYOR, J.W" 1905 Developrnent of the bones of the hand as shown
by the X-raY nethod.
Bull.State Colt"Kentucky, Series 2, No. 5.
1907 The hereditary nature of variation in the
ossification of bones.
Anat " Rec . , I: 84-88 "
Ig2S Time of ossification of the bones of the hand
of the male and fenale and union of epiphyses with the diaphyses "
Amer "J .Phys .AnthroP. , 8 : 401-410 .
1928 Difference in the ossification of the male and
female skeleton"
J .Anat ", 52:499-506 "
1936 Bilateral symnetry as seen in ossification"Amer.J "Anat., 58:87-I01
"
RANKE, J. I896 Die verwendbarkeit der photographie mittels der
rontgenshen strahlen zur illustration der ossification vorgange
in der menschlichen handwurzel "
Munchener Medicinsche Wochenschrift 43: 688-689.
READE, P.C " L962 Orat pigmentation in a tribe of Australian
Aborigines .
J,Dent"Res. , 4I:4L0 (Abstr.) '1964 Infantile acute oral noniliasis.
Austral.D.J. 9:I4-L6.REYMERT, M"L. and H. JoST 1947 Further data concerning the normal
variabílity of the menstrual cycle during adolescence and
factors associated with age of menarche "
Child Develpm., 18:169-179 "
ROCHE, A.F " 1963 Lateral comparisons of the skeletal maturity
of the human hand and wríst.Amer .J .Roentgen . Rad . Ther " Nuc. Med. 89 : t272-L280 ,
ROCHE, A.F. and JILL M. JOHNSON 1969 A comparison between methods
of calculating skeletal age (Greulich-Pyle) .
tuner.J .Phys .Anthrop . r 30:22I-230 ,

-232-
ROSE, G.J. 1960 A cross-sectional study of the relationship of
facial areas with several body dimensions "
AngLe Orthodont", 30:6-13"
ROTCH, T"M. t90B Chronologic and anatomic age in early life"J. Amer "Med "Ass " , 51:1197-1205.
RUSSELL, A.L" 1965 A system of classification and scoring forprevalence surveys of periodontal disease.
J.Dent "Res. , 35:350-359 "
SALZMAN, J.A. 1961 Roentgenographic Cephalometrics. Proceedings
of the second research htorkshop conducted by the Special
Committee of the funerican Association of Orthodontics "
J.B. Lippincott, PhiladeIPhia.
SARNAS, K" 1957 Growth changes in skulls of ancient man North
America.
Acta Odont "Scandinav., tSz2t3-27 3.
SAWTELL, R"O" 1929 Studies in ossification and growth of
children from one to eight years"
Amer"J.Dis.Chíld., 37 z6L-87 .
SCAMMON, R"E, 1927 The first seratim study of human growth"
Aner.J " Phys "Anthrop., I0:329-336
"
SCHONFELD, W.A. 1943 Primary and secondary sexual characteristics:
study of their development in males from birth through maturity,
with biometric study of penis and testes.
Amer.J"Dis "Child., 65: 535-549 "
scHouR, I" and M" MASSLER 1941 Studies in tooth development:
the growth Pattern of human teeth"
Part I1 27:1918-1931 "
SCHULTZ, D, L958 Observations on visual characteristics of
Central Australian Aborigines "
Dioptric News, 132430-432.
SHELDON, W.H. 1940 The Varieties of Human Physique.
New York: HarPer ' 347PP.
SIMMONS, R.T", J"J. GRAYDoN and N"M" SEMPLE 1954 A blood group
genetical survey in Australian Aborigines.
Amer "J " Phys "Anthrop. , 12:599-ó06.

-233-
S INCLAIR, D" 1969 Human Growth After Birth"Oxford Universíty Press.
SINGH, I.J" and B"s" SAVARA 1966 Norns of size and annual
increments of seven anatomical measures of maxillae ingirls from three to sixteen years of age.
Angle Orthodont", 36:3L2-324.
SINÇH, I.J", B.S" SAVARA and pAtnICIA MILLER 1967 Interrelations
of selected measurenents of the face and body in pre-
adobscent and adolescent girIs.Growth, 31:119-131.
solol{I, B" 1966 The Pattern of craniofacial Associations. A
morphological and methodological correlation and factor
analysis study on young adult males "
Acta Odont "Scandinav", 24: SuppI "46.
SPEIJER, B. 1950 Betekenis en Bepaling van de SkeletlecftijdWith a sunnary and atlas in Eng1ish"
Leiden: Sij thoff "
STEEL, G"H" 1964 A correlation study between dental and skeletal
maturitY "
Europ "Orthodont " Soc. , 83-91 "
SUBTELNY, J.D. 1959 A longitudinal study of soft tissue facialstructures and their profile characteristics, defined in
relation to underlying skeletal structures"
Amer.J"Orthodont., 45 : 481-507 "
suTOW, W"W" 1953 Skeletal maturation in healthy Japanese
children, ó-19 years of age" Comparison with skeletal
maturation in American children"
Hiroshitna J.Med " Sciences, 2: 181-191.
suTow, l,\I"w. and K. oHWADA 1953 Skeletal rnaturation in healthy
Japanese children 6-19 years of age" SkeletaL age standards"
Shonika Rinsko, 6:738^
SUTOW, W"W", T. TERASAKI and K. OHWADA 1954 Comparison of
skeletal naturation with dental status in Japanese children"
Paediatrics, 14;327 -333 "

-234-
TAKAIIASHI, E. 1966 Growth and environmentaL factors in Japan"
Human Bio1", 38:112-130'
TALLGREN, AIITJE 1957 Changes in adult face height due to ageing,
ws¿r. and loss of teeth and prosthetic treatment"
Acta Odont.Scandinav., 15:Supp1 " 24.
TAÌ.INER, J.M. 1962 Growth at Adolescence. 2nd Ed.
Blackwell Scientific Publications, Oxford"
TAÌ.INER, J"M. 19ó3 The regulatíon of human growth.
Child Dev., 34:817-847.
TA}{NER, J.M. and R"H. WHITEHOUSE 1959 Standards for skeletal
maturity. Part I "
Paris: International Childrenrs Centre"
TANNER, J.M", R.H" WHITEHOUSE and M.J"R. HEALY 1962 A new
system for estimating skeletal maturity from the hand and
wrist, with standards derived from a study of 2,000 healthy
British children. Part II: The scoring system
Paris: International Childrents Centre"
TAì'trNER, J.M", R.H. WHITEHOUSE and M. TAKAISHI 1966 Standards
frorn birth to maturity for height, weight, height velocityand weight velocity: British Children, 1965. Part I"
Arch"Dis.Child.' 4I:454-471,
TAÌ.INER, J.M", R.H. WHITEHOUSE and M" TAKAISHI 1966 Standards
from birth to maturity for height, weight, height velocity,and weight velocity: British Children, 1965. Part II.Arch"Dis "ChiId", 41-613-635
"
THORNE, H" 1955 The rest position of the nandible and the path
of cLosure from rest to occlusal position: rnethods of
cephal.ometric determination "
Acta Odont " Scandinav. , 11:141-165.
TINDALE, N"B. 1953 Tribal and intertribal narriage anong the
Australian Aborigines,
Hunan Bio1" , 252 169-190"
TODD, T"W. 1930a The anatomícaI features of epithyseal union"
Child"DeveloP", I: 186-194"

-235-
TODD, T.W. 1930b The roentgenographic appraisement of skeletal
differentiation .
Child DeveloP. , I:298-310.
tg37 Atlas of Skeletal Maturation. St. Louis:
C.V. Mosby Co.
TORGERSEN, J. 1951 Asymmetry and skeletal maturation.
Acta Radiol. , 36:521-523,
TRACY, W.E., B.S. SAVARA and J.W.A. BRAÀIT 1965. Relatíon of
height, width and depth of the mandible.
Angle Orthodont. 35:269-277 .
WALLIS, R.S. 1931 How children grow. An anthropometric study
of private school children fron two to eight yeals of age
Univ.Iowa Stud.Child Welfare, 5:No.1.
WEINER, J.S. and V. THAMBIPILLAI t952 Skeletat maturation of
West African Negroes.
Amer.J.Phys.Anthrop., N.S. 10: 407-4L8,
WERNER, H. 1955 Determination of the cephalometric orientation
of the jaws.
Acta Odont.Scandinav., L3:203-2L6 "
WETZEL, N.C. 1941 Physical fitness in terms of physique
developnent and basal metabolisn.
J .Aner.Med.Ass . , 116: 1187-1195.
Ig43 Assessing the physical condition of children.
J .Pediat. , 22:82-lt0; 208-225; 329-36t '
WILLIAMSON, J.J. Personal commuhication.
WILLIAMSON, J.J., M.J. BARRETT, T. BRoWN and G.C. TOWNSEND l97O
0ra1 health in a group of Australian Aborigines. I. Dental
caries prevalence (in preparation) '
WILSON, D"C. and I. SUTHERLAND 1953 The age of the nenarche in
the troPics.Brit.Med.J. 2:607 -608,

TIIE UNI\/ERSITY OTT ADELAIDEAIln'!.A.IDE, SOIITII AUSTß¡\LIt\
PI-TASß ÀDDRESS BÍPLY 'fO
TI1E ACAD}]ÀilC REGISI'IìÀR
oFFtcE Oi;
TllE ACADllttlIC R[CIS']'IìAn
f*"** ik øi":4a,"î
Å-vfr
,'á"\¿17N"t
ptf