Predictive factors of response and survival in myelodysplastic syndrome treated with erythropoietin...
33
doi:10.1182/blood-2007-06-096370 Prepublished online October 16, 2007; Pierre Fenaux and Francois Dreyfus Aljassem, Aspasia Stamatoullas, Lionel Mannone, Herve Dombret, Keith Bourgeois, Peter Greenberg, Mahe, Augustin Ferrant, Christophe Ravoet, Martine Escoffre-Barbe, Lionel Ades, Norbert Vey, Lina Valerie Coiteux, Genevieve Leroux, Pascale Lepelley, Marie-Therese Daniel, Stephane Cheze, Beatrice Sophie Park, Sophie Grabar, Charikleia Kelaidi, Odile Beyne-Rauzy, Francoise Picard, Valerie Bardet, treated with erythropoietin and G-CSF: the GFM experience Predictive factors of response and survival in myelodysplastic syndrome (4217 articles) Neoplasia (1725 articles) Free Research Articles (3716 articles) Clinical Trials and Observations (564 articles) Chemokines, Cytokines, and Interleukins Articles on similar topics can be found in the following Blood collections http://bloodjournal.hematologylibrary.org/site/misc/rights.xhtml#repub_requests Information about reproducing this article in parts or in its entirety may be found online at: http://bloodjournal.hematologylibrary.org/site/misc/rights.xhtml#reprints Information about ordering reprints may be found online at: http://bloodjournal.hematologylibrary.org/site/subscriptions/index.xhtml Information about subscriptions and ASH membership may be found online at: digital object identifier (DOIs) and date of initial publication. the indexed by PubMed from initial publication. Citations to Advance online articles must include final publication). Advance online articles are citable and establish publication priority; they are appeared in the paper journal (edited, typeset versions may be posted when available prior to Advance online articles have been peer reviewed and accepted for publication but have not yet Copyright 2011 by The American Society of Hematology; all rights reserved. 20036. the American Society of Hematology, 2021 L St, NW, Suite 900, Washington DC Blood (print ISSN 0006-4971, online ISSN 1528-0020), is published weekly by For personal use only. by guest on May 31, 2013. bloodjournal.hematologylibrary.org From
Transcript of Predictive factors of response and survival in myelodysplastic syndrome treated with erythropoietin...

doi:10.1182/blood-2007-06-096370Prepublished online October 16, 2007;
Pierre Fenaux and Francois DreyfusAljassem, Aspasia Stamatoullas, Lionel Mannone, Herve Dombret, Keith Bourgeois, Peter Greenberg, Mahe, Augustin Ferrant, Christophe Ravoet, Martine Escoffre-Barbe, Lionel Ades, Norbert Vey, LinaValerie Coiteux, Genevieve Leroux, Pascale Lepelley, Marie-Therese Daniel, Stephane Cheze, Beatrice Sophie Park, Sophie Grabar, Charikleia Kelaidi, Odile Beyne-Rauzy, Francoise Picard, Valerie Bardet, treated with erythropoietin and G-CSF: the GFM experiencePredictive factors of response and survival in myelodysplastic syndrome
(4217 articles)Neoplasia � (1725 articles)Free Research Articles �
(3716 articles)Clinical Trials and Observations � (564 articles)Chemokines, Cytokines, and Interleukins �
Articles on similar topics can be found in the following Blood collections
http://bloodjournal.hematologylibrary.org/site/misc/rights.xhtml#repub_requestsInformation about reproducing this article in parts or in its entirety may be found online at:
http://bloodjournal.hematologylibrary.org/site/misc/rights.xhtml#reprintsInformation about ordering reprints may be found online at:
http://bloodjournal.hematologylibrary.org/site/subscriptions/index.xhtmlInformation about subscriptions and ASH membership may be found online at:
digital object identifier (DOIs) and date of initial publication. theindexed by PubMed from initial publication. Citations to Advance online articles must include
final publication). Advance online articles are citable and establish publication priority; they areappeared in the paper journal (edited, typeset versions may be posted when available prior to Advance online articles have been peer reviewed and accepted for publication but have not yet
Copyright 2011 by The American Society of Hematology; all rights reserved.20036.the American Society of Hematology, 2021 L St, NW, Suite 900, Washington DC Blood (print ISSN 0006-4971, online ISSN 1528-0020), is published weekly by
For personal use only. by guest on May 31, 2013. bloodjournal.hematologylibrary.orgFrom

Predictive factors of response and survival in myelodysplastic syndrome
treated with erythropoietin and G-CSF: the GFM experience.
Sophie Park*1, Sophie Grabar*2, Charikleia Kelaidi*3, Odile Beyne-Rauzy4, Françoise Picard5,
Valérie Bardet5, Valérie Coiteux6, Geneviève Leroux7, Pascale Lepelley8, Marie-Thérèse Daniel9,
Stéphane Cheze10, Béatrice Mahé11, Augustin Ferrant12, Christophe Ravoet13, Martine Escoffre-
Barbe14, Lionel Adès3, Norbert Vey15, Lina Aljassem16, Aspasia Stamatoullas17, Lionel
Mannone18, Hervé Dombret19, Keith Bourgeois20, Peter Greenberg21, Pierre Fenaux3¤, François
Dreyfus1¤.
for the GFM group (Groupe Francophone des Myélodysplasies).
*SP, SG and CK equally contributed as first authors to this work. ¤FD and PF share senior
authorship.
1. Service d’hématologie, Hôpital Cochin, APHP, Paris, France 2. Département de Statistiques, Hôpital Cochin, APHP, Paris, France 3. Service d’hématologie, Hôpital Avicenne, APHP, Bobigny, France 4. Service de médecine interne, Hôpital Purpan, Toulouse, France 5. Laboratoire d’hématologie, Hôpital Cochin, Paris, France 6. Service des maladies du Sang, Hôpital Claude Huriez, CHRU Lille, France 7. Laboratoire d’hématologie, Hôpital Avicenne, Bobigny, France 8. Service d’hématologie, CHRU Lille, France 9. Laboratoire d’hématologie, Hôpital Saint-Louis, Paris, France 10. Service d’hématologie, CHU Caen, Caen France 11. Service d’hématologie, CHU Nantes, Nantes, France 12. Département de Médecine Interne, Cliniques Universitaires Saint-Luc, Bruxelles , Belgique 13. Institut Jules Bordet, Bruxelles, Belgique 14. Service d’hématologie, CHU Pontchaillou, Rennes, France 15.Département d’Onco-Hématologie, Centre Paoli-Calmettes, Marseille, France 16. Service d’hématologie, CH Chartres, Chartres, France 17. Service d’hématologie, CHU Rouen, Rouen, France 18. Service d’hématologie, CHU Nice, Nice, France 19. Service d’hématologie, CHU Saint-Louis, Paris, France 20. Department of Biostatistics and Computational Biology, University of Rochester, New York, USA 21. Department of Medicine, Division Hematology, Stanford University Medical Center, Stanford, USA
Running head: MDS and EPO+/- G-CSF treatment
Blood First Edition Paper, prepublished online October 16, 2007; DOI 10.1182/blood-2007-06-096370
Copyright © 2007 American Society of Hematology
For personal use only. by guest on May 31, 2013. bloodjournal.hematologylibrary.orgFrom

Correspondence: Dr Sophie Park, Service d’hématologie, Hôpital Cochin, APHP, Université Paris
V, 27 rue du Fb St- Jacques, 75014 PARIS, France, tel : 33 1 40 51 65 43, email :
For personal use only. by guest on May 31, 2013. bloodjournal.hematologylibrary.orgFrom

ABSTRACT
We analyzed prognostic factors of response, response duration and possible impact on
survival of epoetin alfa, beta or Darbepoetin alfa (DAR) +/- G-CSF in 403 MDS patients. 62%
(43% major and 20% minor) and 50% erythroid responses were seen, and median response
duration was 20 and 24 months according to IWG 2000 and 2006 criteria, respectively.
Significantly higher response rates were observed with <10% blasts, Low and Int-1 IPSS, RBC
transfusion independence, serum EPO level<200UI/l and, with IWG 2006 criteria only, shorter
interval between diagnosis and treatment. Significantly longer response duration was associated
with major response (IWG 2000 criteria), IPSS low-INT-1, blasts<5% and absence of multilineage
dysplasia. Minor responses according to IWG 2000 were reclassified as “non responders” or
“responders” according to IWG 2006 criteria. However, among those IWG 2000 minor
responders, response duration did not differ between IWG 2006 “responders” and “non
responders”. Multivariate adjusted comparisons of survival between our cohort and the untreated
MDS cohort used to design IPSS, showed similar rate of progression to AML in both cohorts, but
significantly better overall survival in our cohort, suggesting that epoetin or DAR treatment may
have a favourable survival impact in MDS.
For personal use only. by guest on May 31, 2013. bloodjournal.hematologylibrary.orgFrom

INTRODUCTION
Myelodysplastic syndromes (MDS) are clonal disorders characterized by ineffective
hematopoiesis leading to blood cytopenias, especially anemia and by frequent evolution to acute
myeloid leukaemia (AML). Several classifications have been used to categorize MDS. The
French-American British (FAB) group proposed morphological classification based on
percentages of blasts in blood and bone marrow, and of ringed sideroblasts 1,2. The WHO
classification refined FAB proposals by introducing in particular the notion of multilineage
dysplasia (MD) in MDS with no excess of marrow blasts 3,4. The International prognostic scoring
system (IPSS) ,which combines cytogenetic results, the number of cytopenias and the percentage
of marrow blasts, is the most widely used prognostic score that helps clinicians in therapeutic
decisions5,6.
Treatment of MDS varies between risk groups. In the higher risk group (including IPSS
high and Int-2 risk groups, with high risk of progression to AML and short survival), treatment
aiming at modifying the disease course, ie allogeneic bone marrow transplantation whenever
possible or otherwise high or low-dose chemotherapy, hypomethylating agents , is generally
proposed 7. In lower risk group (including IPSS Low and Int-1 risk groups, with lower risk of
progression to AML and more prolonged survival), which represents the majority of the patients,
treatment generally aims at improving cytopenias, and includes growth factors (epoetin alone or
associated with G-CSF)8,9, thalidomide10,11, lenalidomide, and less often hypomethylating agents
(5 azacytidine, decitabine) 12,13 or arsenic derivatives14.
Anemia remains the most frequent cytopenia in lower risk MDS. Epoetin α, epoetin β and
darbepoetin (DAR), have been used for several years, alone or in combination with G-CSF, to
treat anemia of MDS. (For the purpose of this manuscript, epoetin alfa and beta and DAR will be
grouped under the denomination of rEPO). Previous studies have shown that low pretreatment
serum EPO levels, low transfusion requirement and no or limited excess of marrow blasts were
For personal use only. by guest on May 31, 2013. bloodjournal.hematologylibrary.orgFrom

associated with better response rates to rEPO+/- G-CSF. Some other studies also found that MDS
with multilineage dysplasia and sideroblastic anemia had lower response rates9. In addition, the
largest rEPO study reported to date (129 patients) with sufficient follow-up showed that Low and
Int-1 risk group patients had longer response to rEPO+/-G-CSF and that treatment with rEPO+/-
GCSF had probably no effect on progression to AML and survival in MDS. 15
The objectives of the present study were (i) to confirm prognostic factors of response and duration
of response to rEPO+/- G-CSF in 403 MDS patients from French and Belgian centers of the GFM,
(ii) to compare the response rates using recently modified response criteria (IWG 2006) with those
obtained using IWG 2000 criteria16, (iii) to compare outcome of our cohort (in terms of
progression to AML and survival) to that of untreated patients included in the International MDS
risk Analysis Workshop ( IMRAW) database that was used to establish IPSS.
PATIENTS, TREATMENT AND METHODS
This study was approved by the institutional review boards of all participating centers. Informed
consent was provided according to the Declaration of Helsinki.
Patients
433 patients with MDS according to FAB criteria from 25 French and Belgian
hematological centers of the Groupe Francophone des Myélodysplasies (GFM) who had received
rEPO (ie epoetin alfa or beta, or DAR) +/-G-CSF treatment at weekly doses of 60000 U for
epoetin and 300µg for DAR during at least 12 weeks between 1998 and May 2006 were included
in the study. Thirty patients were excluded (10 unclassified MDS, 16 chronic myelomonocytic
leukaemia (CMML), 4 refractory anemia with excess of blasts in transformation (RAEB-t))
because they did not meet WHO criteria for MDS or could not be adequately classified, leaving
403 patients in the final cohort. One hundred and fifty eight (39%) of them had been included in 3
GFM clinical trials that used rEPO 17,18,19 and the remaining patients had been treated according to
GFM recommendations for the use of rEPO (described in http://www.gfmgroup.org, password
For personal use only. by guest on May 31, 2013. bloodjournal.hematologylibrary.orgFrom

5q17p). Main inclusion criteria of the 3 clinical trials were (i)IPSS Low and Int-1 MDS (ii)
Hb<10g/dl or need for more than 2 red blood cell units of transfusions during the two months
preceding the date of inclusion, (iii) serum EPO level<500mUI/ml (iv) de novo MDS, excluding
therapy related cases. GFM recommendations for treating patients with rEPO were similar. None
of the patient included in the study received, during the disease course, azacytidine, decitabine or
lenalidomide.
Morphological analysis
Bone marrow aspirate smears stained with May-Grunwald Giemsa were re-examined by a
panel of morphologists ( at least two morphologists) who assessed the degree of dysplasia in each
lineage (dyserythropoiesis, dysgranulopoiesis and dysmegakaryopoiesis) and reclassified patients
initially classified with FAB criteria only (mainly before 2001) in WHO classification. Dysplasia,
quantified with Flandrin’s cytological scoring 20, was considered positive for one lineage if there
were more than 10% of dysplastic cells, and multilineage dysplasia was defined by at least two
dysplastic lineages.
Treatment
rEPO treatment consisted of epoetin alfa (Eprex, OrthoBiotech) 60000 UI/week or beta
(Neorecormon, Roche) 60000 UI /week, or darbepoetin alfa (DAR, Aranesp, Amgen)
300µg/week. In some patients, G-CSF treatment, (filgastrim, Amgen or lenograstim, Chugai) was
associated with rEPO treatment, as recommended 14, 21, the dosage being adjusted to maintain the
WBC count below 10000/mm3.
Response to treatment was evaluated at week 12 according to IWG 2000 response
criteria22. Major response was defined by an increase in hemoglobin (Hb) >2g/dl or no more need
for transfusion, and minor response by an increase of Hb by 1- 2g/dl or transfusion requirement
reduced by 50% or more. All responses were reclassified according to IWG 2006 criteria16 where
erythroid response is defined by an increase of Hb by >1.5g/dl ( in patients with baseline
For personal use only. by guest on May 31, 2013. bloodjournal.hematologylibrary.orgFrom

Hb<11g/dl) or a reduction of RBC units transfused by an absolute number of at least 4 every 8
weeks.
Statistical methods
Prognostic factors of response
Comparisons between erythroid responders and non-responders at week 12 (based on IWG
2000 and IWG 2006 criteria) were tested using Pearson Chi-square test or Fisher’s exact test for
qualitative data, and Wilcoxon test for quantitative variables. Baseline characteristics at
introduction of rEPO treatment were compared : sex, age, presence of multilineage versus
unilineage dysplasia, marrow blasts percentage, serum EPO level, karyotype, transfusion
requirement over the 2 last months, IPSS score, number of cytopenias, type of rEPO (DAR vs
epoetin alfa and beta alone or with G-CSF), and MDS duration prior to rEPO treatment. A
multivariate logistic regression analysis was used to identify independent predictors of response at
week 12 using IWG 2000 and IWG 2006 response criteria. Crude and adjusted odds ratio were
provided together with their 95% confidence interval. Multivariate analysis was adjusted for all
variables with a p-value below 0.2 in univariate analysis and either FAB or WHO diagnosis. As
karyotype, blasts and cytopenias belong to the IPSS score definition, these variables were not
included in the multivariate analysis along with IPSS even if their p-value were <0.2 in univariate
analysis. The final multivariate model for response to rEPO was adjusted for age at EPO
introduction, IPSS score, EPO level, transfusion requirement and diagnosis (WHO classification)
both for IWG 2000 and IWG 2006 response criteria.
In responding patients at week 12, prognostic factors of duration of erythroid response
were also analyzed using Kaplan-Meier estimates (log rank test) for univariate analysis and
multivariate Cox regression analysis.
Outcomes
For personal use only. by guest on May 31, 2013. bloodjournal.hematologylibrary.orgFrom

We analyzed time to AML evolution, defined as the time in months between EPO
introduction and documented leukemic transformation (ie at least 30% of marrow blasts). Data
were censored when patients died or were lost to follow up (5 patients).
Overall survival was defined as the time between introduction of EPO treatment and death.
Data were censored at the end of follow-up (May 2006).
Comparison with the IPSS/ IMRAW cohort
Finally, and in order to assess a possible influence of rEPO on disease progression and survival,
we compared results obtained in our cohort with those of the IPSS/IMRAW cohort 5. This
historical cohort, where MDS patients had received only supportive care and no active treatment
(including rEPO), contains 816 patients. We restricted the comparison to patients with Hb<10g/dl,
Low and Int-1 IPSS and excluded CMML, RAEB-t according to FAB classification, unclassifiable
MDS, poor risk karyotype, and 3q26 deletion, as these patients are no more considered as MDS in
the WHO classification or are not the best candidates for rEPO treatment (high risk of AML
evolution) (Figure 1). Thus, 225 patients in the IMRAW and 284 patients in the French cohort
were included for outcome comparison. Overall survival (OS) and time to AML evolution from
diagnosis for the IMRAW patients and since rEPO introduction for the French-EPO were analysed
using univariate and multivariate Cox proportional hazards regression. Reasons why we chose the
date of diagnosis in the IMRAW cohort, and the date of introduction of rEPO in the French-EPO
cohort, were that in the IMRAW cohort, patients were followed from diagnosis, and all measures
used to calculate the IPSS score were collected at time of diagnosis. In the French-EPO cohort
however, baseline patient characteristics including IPSS scoring were measured at the introduction
of rEPO treatment. The proportional hazards assumption was checked graphically. Multivariate
analysis was adjusted on main known prognostic factors: sex, age, FAB diagnosis (as WHO
diagnosis was not available for IMRAW patients), hemoglobin level, % marrow blasts, karyotype,
and IPSS score. Baseline hemoglobin level was chosen instead of baseline RBC transfusion
For personal use only. by guest on May 31, 2013. bloodjournal.hematologylibrary.orgFrom

requirement, a recently identified prognostic factor in MDS23, because (i) it also constitutes an
important prognostic factor in most rEPO reported series 5, 24, 25 and (ii) RBC transfusion
requirement was not known in the IMRAW cohort.
Because the baseline characteristics of patients from the 2 cohorts were slightly different
and because residual confounding factors can never be totally excluded even with a multivariate
adjustment, we also performed a matched-pair analysis where patients from the French-EPO
cohort and IPSS/IMRAW cohort were matched for age at diagnosis (<70, or ≥70 years), FAB
diagnosis (RA or RARS, RAEB with ≤10% of blasts) and karyotype (good, intermediate) in a
ratio of 1:1. This matched-pair analysis led to a study sample of 200 patients in the French-EPO
and 200 patients in the IPSS/IMRAW cohort.
All statistical analyses were two-sided and p-values <0.05 were considered to have
statistical significance. Calculations were performed using the SAS package version 9.01 (SAS
Institute Inc, Cary, NC, USA).
For personal use only. by guest on May 31, 2013. bloodjournal.hematologylibrary.orgFrom

RESULTS
Patient characteristics and treatment
Our study population included 403 patients with a median age of 74 years (interquartile
range: IQR 25%-75%: 66- 79 ). Patients could be classified, according to FAB classification in
143 refractory anemia (RA), 142 refractory anemia with ringed sideroblasts (RARS), 118
refractory anemia with excess of blasts (RAEB) (Table 1) and according to WHO classification in
60 RA, 68 refractory cytopenia with multilineage dysplasia (RCMD), 83 RARS, 57 refractory
cytopenia with multilineage dysplasia and ringed sideroblasts (RCMD-RS), 91 RAEB-1, 26
RAEB-2 and eighteen 5q- syndrome. Karyotype was favourable in 261 patients, intermediate in
66 patients, unfavourable in 19 patients, and a cytogenetic failure or not done in 57 patients. IPSS
score was low in 139 patients (35%), Int-1 in 164 (40%), Int-2 in 37 (8%), High in 6 patients (2%)
and not determined in 57 patients (14%). Median pre-treatment EPO level was 76 UI/l (Range 6-
5,665 UI/L) and only 7% pts had EPO level >500 UI/l. All pts had Hb<10g/dl and 55% required
RBC transfusions, including 36% who received >2 RBC units/month. Treatment consisted in
epoetin alone (alfa or beta) in 164 patients, DAR alone in 107 patients, epoetin+G in 104 patients
and DAR+G in 28 patients.
Median interval between diagnosis and treatment by rEPO+/- G-CSF was 6 months (IQR
1-26 months).
Overall Response to treatment
After 12 weeks of rEPO treatment, 251 (62%) patients met IWG 2000 criteria for erythroid
response (40% major response, 22% minor response). Using IWG 2006 criteria, response was
achieved in 50% of the patients. Of the 88 minor responders according to IWG 2000 criteria, 56
patients (63%) were reclassified as non responders and 32 (37%) as responders, respectively,
according to IWG 2006 criteria.
For personal use only. by guest on May 31, 2013. bloodjournal.hematologylibrary.orgFrom

Prognostic factors of response and response duration to rEPO according to IWG
2000 and IWG 2006 criteria
IWG 2000 response criteria (Table 1)
In univariate analysis, significantly higher response rates were observed in patients with
age≥ 70 years (p=0.03), marrow blasts <5% (p=0.02), EPO level ≤200UI/l (p<0.0001), Low and
Int-1 IPSS score (p=0.001), absence of transfusion requirement (p<0.0001) and favourable or
intermediate karyotype (p=0.05). Regarding WHO classification, only RAEB-2 had significantly
lower response rates. We found no impact of unilineage versus multilineage dysplasia (63% of
response in multilineage dysplasia versus 61% of non-responders, p=0.52) on response rate. Of
note was the relatively high response rate of 56% in RAEB-1. Patients with the 5q- syndrome had
a response rate of 50%. Interval between diagnosis and rEPO introduction did not influence
response rate (p=0.13). The response rate was similar in patients treated with rEPO alone (66%) ,
and those treated with rEPO + G-CSF (58%, p=0.17). This was particularly the case for RARS
and RCMD-RS (62% response with rEPO alone and 64% with rEPO+G-CSF, p=0.8).
In multivariate analysis, EPO level ≤200 UI/l, absence of transfusion requirement and Low
and Int-1 IPSS score remained the only factors associated with better response to rEPO.
Median duration of response from the onset of rEPO was 20 months (range 3-74). Fifty
four of the 251 responders (21.4%) relapsed. Relapse was associated with evidence of progression
to higher grade MDS in 13%, and to AML in 15%, whereas no evident disease progression was
seen in the remaining 72% relapses. In univariate analysis, shorter response duration was
significantly associated with the quality of response (median 14 months for minor response vs 24
months for major response , p=0.003), with blasts>10% (median 12 months vs 22 months for
blasts <10%, p=0.007), with presence of multilineage dysplasia (median 16 months vs 24 months
without multilineage dysplasia, p=0.02) and with IPSS Int-2/High (median 8 months vs 21 months
for low/Int-1, p=0.004) (table 3). No difference in response duration was found according to age,
For personal use only. by guest on May 31, 2013. bloodjournal.hematologylibrary.orgFrom

sex, transfusion requirement, EPO level (Table 3). In multivariate analysis, factors predictive of
shorter response were minor response, presence of del 5q and RAEB-2.
IWG 2006 response criteria (Table 2)
Predictive factors of response and response duration using IWG 2006 criteria were
generally similar to those found with IWG 2000 criteria, with slight differences in p value. One
exception, however was that patients who received rEPO within 6 months of diagnosis, had a 56%
response rate as compared to 44% in patients treated after 6 months (p=0.01 using univariate
analysis; p= 0.04 using multivariate analysis).
Clinical Outcome of minor responders according to IWG 2000 criteria
88 patients had minor response according to IWG 2000. Fifty six and 32 of them were
reclassified as “non responders” and “responders”, respectively, according to IWG 2006 criteria.
Duration of response was of 11 months in the 56 “non responders” and of 12.6 months in the 32
“responders” according to IWG 2006 criteria (p=0.65). The transfusion requirement, IPSS score,
and baseline EPO level did not significantly differ between these two subgroups. In addition,
duration of response of the 32 “responders” in IWG 2006 was significantly shorter than that of
major responders according to IWG 2000 (median 12.5 vs 24 months, p=0.001).
Outcome comparison between the French-EPO cohort and the IMRAW cohort
Five-year OS in the French cohort was 64%. Duration of MDS (≥ or < 6 months) prior to
starting rEPO therapy and addition of G-CSF to rEPO did not influence OS (supplemental data
figures S1 and S2).
In order to determine if treatment with rEPO, with or without G-CSF, had an impact on
disease progression and survival, we compared outcome of our cohort to that of the untreated
cohort of MDS used to design the IPSS (IMRAW cohort). Because of the heterogeneity of MDS,
the comparison was restricted to Low and Int-1 IPSS patients with less than 10g/dl of hemoglobin,
For personal use only. by guest on May 31, 2013. bloodjournal.hematologylibrary.orgFrom

and we also excluded poor-risk karyotype and 3q26 deletion patients (Figure 1). Two-hundred and
eighty four patients and 225 pts in the French-EPO and in the IMRAW database, respectively, met
those criteria and were compared. Median follow-up from rEPO introduction in the French-EPO
cohort and from MDS diagnosis in the IMRAW cohort was 26 months (IQR 13-53) and 33
months (IQR 15-61) respectively. Both cohorts were significantly different for: age, IPSS, % of
blasts FAB diagnosis and, with borderline significance (p=0.05), hemoglobin level and karyotype
(Table 4). Therefore, adjustment on those factors was made for subsequent comparisons using
multivariate Cox proportional hazards regression. In the French-EPO cohort, 12 patients
progressed to AML and 35 patients died. In the IMRAW cohort, 24 patients progressed to AML
and 123 died. The 5-year incidence of progression to AML was similar in the French cohort
(12.2%) and in the IMRAW cohort (13.3%), (p=0.21).
Five year- overall survival (OS) was better in the French-EPO cohort (64%) than in the
IMRAW cohort (39%) (p<0.0001) (Figure 2a). This survival benefit, in the French cohort, was
restricted to patients who responded to rEPO, as non responders to rEPO had the same OS as the
IMRAW cohort patients (Figure 2b). In multivariate analysis, rEPO treatment (Hazard
Ratio=0.43, [CI 95% 0.25-0.72)]) was independently associated with better survival.
These results were confirmed by a matched-pair analysis where we matched patients of the
French-EPO and the IMRAW cohorts based on age, FAB, % of blasts and karyotype with a ratio
1:1, leading to a sample of 200 patients from the French -EPO and 200 patients from the IMRAW
cohort (Figure 2c). In a Cox model (with sex, age, % of blasts, FAB, karyotype and rEPO
treatment as covariates), rEPO treatment (HR=0.43, [CI 95% 0.25-0.72]) was associated with
significantly better overall survival.
For personal use only. by guest on May 31, 2013. bloodjournal.hematologylibrary.orgFrom

DISCUSSION
In our population of 403 MDS patients, the largest cohort of MDS patients treated with
rEPO reported so far to our knowledge, the response rate was 63% according to IWG 2000
criteria, similar to that observed in previous series of patients with the same features (large
predominance of lower risk MDS with low baseline serum EPO level). 26,27,30 Prognostic factors
of response were largely similar to those previously published, including: serum EPO<200UI/l,
absence of transfusion requirement and IPSS Low and Int-1.15,28
Some findings were however somewhat different from previously published literature.,
First of all, in RARS and RCMD-RS, response rates to rEPO alone were similar to those of rEPO
+G-CSF, using both IWG 2000 and IWG 2006 criteria. This does not confirm other series where
rEPO alone was less efficient than rEPO+ G-CSF in those MDS subsets 31. In addition, we found
a good response rate in RAEB-1 (56% vs 34% in patients with >10 % blasts). Also of note was
that, at least using IWG 2006 criteria, shorter interval between MDS diagnosis and introduction of
rEPO was associated with higher response rates, as previously shown by Spiriti et al29. Finally,
presence of multilineage dysplasia was not associated with significantly lower response rates in
our series, contrary to the Nordic series, where RA/RARS had significantly higher response rates
than RCMD and RCMD-RS30. Dysplasia is sometimes difficult to quantify and is often hardly
reproducible between observers, in part due to technical variability in preparing smears. We used
here Flandrin’s morphological scoring system, that allows a somewhat better reproducibility of
quantification of dysplasia20. On the other hand, multilineage dysplasia, in addition to IPSS int-2
high and minor response, was predictive of a shorter response.
Our study was also one of the first opportunities to assess, in a large patient cohort,
potential advantages of IWG 200616 response criteria in MDS, as compared to IWG 2000 criteria
22. We evaluated the outcome of minor responders according to IWG 2000 criteria with the new
IGW 2006 criteria, where this category is no more taken into account. Of 88 “minor responders”
(IWG 2000), 56 became “non responders” and 32 became “responders” (IWG 2006). These two
For personal use only. by guest on May 31, 2013. bloodjournal.hematologylibrary.orgFrom
groups were not different in terms of age, FAB, WHO classification IPSS, endogenous EPO level,
and transfusion rates, and we found no differences in response duration between these two groups.
Exclusion of “minor erythroid response” from IWG 2006 criteria revision was made in particular
after finding that some patients who received supportive care only could be classified as minor
responders16. Our findings suggest that this revision, on the other hand, may lead to underestimate
some relatively significant and durable responses, previously considered as minor responses using
IWG 2000 criteria. Using IWG 2006 criteria, however, we also found that a shorter interval from
MDS diagnosis to rEPO treatment was a favourable prognostic factor of response to rEPO, not
seen with IWG 2000 criteria. Therefore, new prognostic factors of response to treatments in MDS
may emerge using IWG2006 criteria.
A major issue, with rEPO treatment, is whether it has an impact on disease progression and
survival. The Nordic group, by comparing outcome of their patients treated with rEPO+G-CSF to
the IMRAW database, found no significant difference for incidence of progression to AML and
survival after adjustment on blasts, karyotype and number of cytopenias. By contrast, we found
that our treated population had better OS than the IMRAW cohort. The comparison between both
populations was made by restricting them to Low and Int-1 risk patients, also excluding patients
with CMML and with poor risk karyotype. The significant advantage of the French-EPO cohort
over the IMRAW cohort persisted after adjustment on main prognostic factors (age, gender,
hemoglobin level, FAB classification, karyotype). Those results are concordant with preliminary
results of a very recent study, so far presented only in abstract form, which showed a survival
advantage of a Nordic MDS cohort treated with rEPO over a matched Italian cohort that received
RBC transfusions only31. One explanation to the discrepancies between our findings and the first
findings of the Nordic group could have been a difference in sampling and in statistical methods.
To avoid possible biases due to sampling, we used two different statistical analyses, with
homogeneous groups: the first one with adjustment on main prognostic factors of survival (age,
sex, FAB classification, % of blasts, hemoglobin level and karyotype) in a Cox model and the
For personal use only. by guest on May 31, 2013. bloodjournal.hematologylibrary.orgFrom

second one by matching 1 to 1 patients of the French-EPO and the IMRAW cohorts based on age,
FAB, % of blasts and karyotype. Adjustment could not be made on baseline transfusion
requirement, a recently described prognostic factor in MDS 23 as this parameter was not available
in the IMRAW cohort. However, severity of anemia at baseline, a parameter obviously correlated
to transfusion requirement, and which has also demonstrated prognostic value in MDS 5, 24, 25,
tended to be more important in the French EPO cohort. Indeed, 53% of patients in the French
cohort selected for the comparison had baseline Hb level below 8g/dl, as compared to 44% in the
IMRAW database Still, we cannot completely exclude other confounding factors, such as
differences in performance status and comorbidities between the French –EPO and the IMRAW
cohorts, as those parameters were not available for the present study.
Reasons for the possibly improved survival with rEPO treatment are not clear, especially
because causes of non leukemic deaths in the IMRAW series were unknown and could not be
compared with those seen in our cohort. As RBC transfusion requirement may be a poor
prognostic factor per se, avoiding transfusions could improve survival for example by reducing the
risk of iron overload 34,35. In addition, patients requiring transfusions have a lower median
hemoglobin level than patients responding to rEPO, and this could have an impact, not only on
quality of life, but also on the risk of potentially fatal cardiovascular events. The fact that the
survival benefit was restricted to patients responding to rEPO treatment in our cohort possibly
goes along those lines. It could be argued that the survival improvement seen in our cohort of
patients, generally diagnosed after 1996, was due to progress in the overall management of MDS
patients during the last 10 years, as the IMRAW cohort was diagnosed prior to 1994. However,
there was no improvement of outcome in patients diagnosed between 1999 and 2003 compared to
those diagnosed between 1989 and 1993 in the Dusseldorf registry (U. Germing, personal
communication). Very recently, the use of drugs like 5- azacytidine, decitabine and lenalidomide
may have had an impact on survival in MDS 7,32,33. However, those drugs are still not approved
and not widely available in Europe and none of our patients had received them. Finally, survival
For personal use only. by guest on May 31, 2013. bloodjournal.hematologylibrary.orgFrom

in our cohort was measured from the introduction of rEPO, which occurred more than 26 months
from diagnosis in 25% of the patients. Not surprisingly, therefore, our cohort was characterized by
worse prognostic characteristics including higher age, higher % of blasts, lower % of RA, than in
the IMRAW cohort which logically should have translated into lower OS in our cohort.
Further prospective studies, with precise analysis of non leukemic causes of death in
patients receiving rEPO or not, are however obviously required to confirm if treatment with rEPO
confers a survival benefit in low risk MDS patients.
For personal use only. by guest on May 31, 2013. bloodjournal.hematologylibrary.orgFrom

Authorship:
SP and CK performed research and collected the data and wrote the manuscript. SG performed the
statistical analyses, contributed to data interpretation and participated to the draft of the article. FD
and PF designed the study. Other authors contributed to patients information.
Please see the Supplemental Appendix for centers and investigators of the Groupe Francophone
des Myélodysplasies that contributed to this study.
The authors declare no competing financial interests.
For personal use only. by guest on May 31, 2013. bloodjournal.hematologylibrary.orgFrom

REFERENCES
1. Bennett JM, Catovsky D, Daniel MT, et al. Proposals for the classification of the myelodysplastic syndromes. Br J Haematol. 1982;51:189-199. 2. Bennett JM, Catovsky D, Daniel MT, et al. Myelodysplastic syndromes: is another classification necessary? Br J Haematol. 1984;56:515-517. 3. Harris NL, Jaffe ES, Diebold J, et al. The World Health Organization classification of hematological malignancies report of the Clinical Advisory Committee Meeting, Airlie House, Virginia, November 1997. Mod Pathol. 2000;13:193-207. 4. Nosslinger T, Reisner R, Koller E, et al. Myelodysplastic syndromes, from French-American-British to World Health Organization: comparison of classifications on 431 unselected patients from a single institution. Blood. 2001;98:2935-2941. 5. Greenberg P, Cox C, LeBeau MM, et al. International scoring system for evaluating prognosis in myelodysplastic syndromes. Blood. 1997;89:2079-2088. 6. Pfeilstocker M, Reisner R, Nosslinger T, et al. Cross-validation of prognostic scores in myelodysplastic syndromes on 386 patients from a single institution confirms importance of cytogenetics. Br J Haematol. 1999;106:455-463. 7. Silverman LR, McKenzie DR, Peterson BL, et al. Further analysis of trials with azacitidine in patients with myelodysplastic syndrome: studies 8421, 8921, and 9221 by the Cancer and Leukemia Group B. J Clin Oncol. 2006;24:3895-3903. 8. Hellstrom-Lindberg E, Birgegard G, Carlsson M, et al. A combination of granulocyte colony-stimulating factor and erythropoietin may synergistically improve the anaemia in patients with myelodysplastic syndromes. Leuk Lymphoma. 1993;11:221-228. 9. Hellstrom-Lindberg E, Ahlgren T, Beguin Y, et al. Treatment of anemia in myelodysplastic syndromes with granulocyte colony-stimulating factor plus erythropoietin: results from a randomized phase II study and long-term follow-up of 71 patients. Blood. 1998;92:68-75. 10. Musto P, Falcone A, Sanpaolo G, Bisceglia M, Matera R, Carella AM. Thalidomide abolishes transfusion-dependence in selected patients with myelodysplastic syndromes. Haematologica. 2002;87:884-886. 11. Raza A, Buonamici S, Lisak L, et al. Arsenic trioxide and thalidomide combination produces multi-lineage hematological responses in myelodysplastic syndromes patients, particularly in those with high pre-therapy EVI1 expression. Leuk Res. 2004;28:791-803. 12. Silverman LR, Holland JF, Weinberg RS, et al. Effects of treatment with 5-azacytidine on the in vivo and in vitro hematopoiesis in patients with myelodysplastic syndromes. Leukemia. 1993;7 Suppl 1:21-29. 13. Leone G, Teofili L, Voso MT, Lubbert M. DNA methylation and demethylating drugs in myelodysplastic syndromes and secondary leukemias. Haematologica. 2002;87:1324-1341. 14. Vey N. Arsenic trioxide for the treatment of myelodysplastic syndromes. Expert Opin Pharmacother. 2004;5:613-621. 15. Hellstrom-Lindberg E, Gulbrandsen N, Lindberg G, et al. A validated decision model for treating the anaemia of myelodysplastic syndromes with erythropoietin + granulocyte colony-stimulating factor: significant effects on quality of life. Br J Haematol. 2003;120:1037-1046. 16. Cheson BD, Greenberg PL, Bennett JM, et al. Clinical application and proposal for modification of the International Working Group (IWG) response criteria in myelodysplasia. Blood. 2006;108:419-425. 17. Casadevall N, Durieux P, Dubois S, et al. Health, economic, and quality-of-life effects of erythropoietin and granulocyte colony-stimulating factor for the treatment of myelodysplastic syndromes: a randomized, controlled trial. Blood. 2004;104:321-327. 18. Mannone L GC, Quarre M.C, Bernard J.B, Giraudier S, Rosenthal E, Vassilief D, Hamza F, Park S, Kiladjian JJ, Vaultier S, Mo Beyne-Rouzy, Cheze S, Voilliat L, Agape P, Dreyfus F, Fenaux P. High Response Rate to Darbopoetin Alfa in "Low Risk" MDS: Results of a Phase II Study. ASH: Blood; 2004.
For personal use only. by guest on May 31, 2013. bloodjournal.hematologylibrary.orgFrom

19. L. Ades HM, D. Vassilief, E. Berger, B. Slama, N. Vey, R. Delarue, O. Beyne-Rauzy, A. Guerci, S. Cheze, X. Thomas, A. Stamatoullas, M. Gardembas, F. Bauduer, A. Kolb, M.C. Chaury, L. Legros, G. Damaj, F. Hamza, S. Vaultier, F. Dreyfus, P. Fenaux. Is There a Role for ATRA in Combination to EPO in Lower Risk Myelodysplastic Syndrome? Preliminary Results of a Phase II Study. American Society of Hematology. Atlanta: Blood; 2005. 20. Flandrin G. MDS score system. 6th International Symposium on Myelodysplastic syndromes. Stockolm; 2001. 21. Mantovani L, Lentini G, Hentschel B, et al. Treatment of anaemia in myelodysplastic syndromes with prolonged administration of recombinant human granulocyte colony-stimulating factor and erythropoietin. Br J Haematol. 2000;109:367-375. 22. Cheson BD, Bennett JM, Kantarjian H, et al. Report of an international working group to standardize response criteria for myelodysplastic syndromes. Blood. 2000;96:3671-3674. 23. Malcovati L, Porta MG, Pascutto C, et al. Prognostic factors and life expectancy in myelodysplastic syndromes classified according to WHO criteria: a basis for clinical decision making. J Clin Oncol. 2005;23:7594-7603. 24. Morel P, Hebbar M, Lai JL, et al. Cytogenetic analysis has strong independent prognostic value in de novo myelodysplastic syndromes and can be incorporated in a new scoring system: a report on 408 cases. Leukemia. 1993;7:1315-1323. 25. Mufti GJ, Stevens JR, Oscier DG, Hamblin TJ, Machin D. Myelodysplastic syndromes: a scoring system with prognostic significance. Br J Haematol. 1985;59:425-433. 26. Hellstrom-Lindberg E, Negrin R, Stein R, et al. Erythroid response to treatment with G-CSF plus erythropoietin for the anaemia of patients with myelodysplastic syndromes: proposal for a predictive model. Br J Haematol. 1997;99:344-351. 27. Musto P, Lanza F, Balleari E, et al. Darbepoetin alpha for the treatment of anaemia in low-intermediate risk myelodysplastic syndromes. Br J Haematol. 2005;128:204-209. 28. Rose EH, Abels RI, Nelson RA, McCullough DM, Lessin L. The use of r-HuEpo in the treatment of anaemia related to myelodysplasia (MDS). Br J Haematol. 1995;89:831-837. 29. Spiriti MA, Latagliata R, Niscola P, et al. Impact of a new dosing regimen of epoetin alfa on quality of life and anemia in patients with low-risk myelodysplastic syndrome. Ann Hematol. 2005;84:167-176. 30. Howe RB, Porwit-MacDonald A, Wanat R, Tehranchi R, Hellstrom-Lindberg E. The WHO classification of MDS does make a difference. Blood. 2004;103:3265-3270. 31. Martin Jädersten LM, Ingunn Dybedal, Matteo Giovanni Della Porta, Rosangela Invernizzi, Scott M. Montgomery, Cristiana Pascutto, Anna Porwit-MacDonald, Mario Cazzola, Eva Hellström-Lindberg. Treatment with Erythropoietin and G-CSF Improves Survival in MDS Patients with Low Transfusion Need. In: Blood ed. ASH. Orlando; 2006. 32. Kantarjian HM, O'Brien S, Huang X, et al. Survival advantage with decitabine versus intensive chemotherapy in patients with higher risk myelodysplastic syndrome: comparison with historical experience. Cancer. 2007;109:1133-1137. 33. List A, Kurtin S, Roe DJ, et al. Efficacy of lenalidomide in myelodysplastic syndromes. N Engl J Med. 2005;352:549-557.
For personal use only. by guest on May 31, 2013. bloodjournal.hematologylibrary.orgFrom
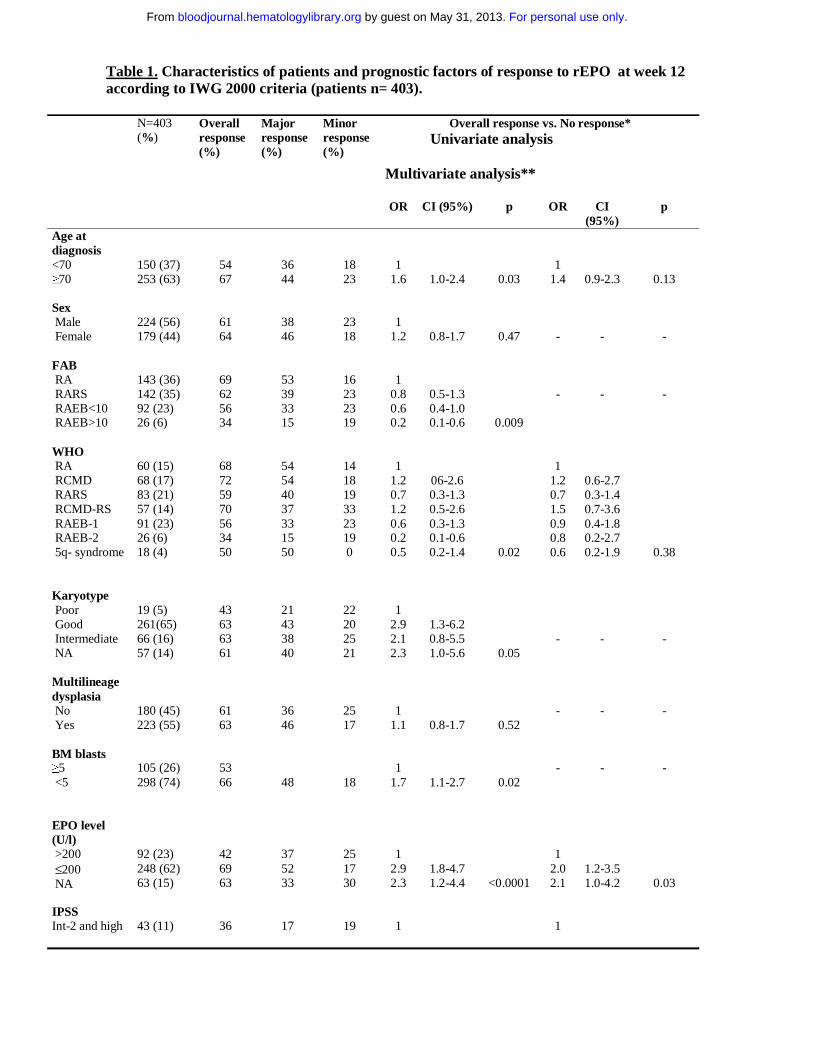
Table 1. Characteristics of patients and prognostic factors of response to rEPO at week 12 according to IWG 2000 criteria (patients n= 403).
N=403 (%)
Overall response (%)
Major response (%)
Minor response (%)
Overall response vs. No response* Univariate analysis
Multivariate analysis**
OR CI (95%) p OR CI (95%)
p
Age at diagnosis <70 ≥70
150 (37) 253 (63)
54 67
36 44
18 23
1
1.6
1.0-2.4
0.03
1 1.4
0.9-2.3
0.13
Sex Male Female
224 (56) 179 (44)
61 64
38 46
23 18
1
1.2
0.8-1.7
0.47
-
-
-
FAB RA RARS RAEB<10 RAEB>10
143 (36) 142 (35) 92 (23) 26 (6)
69 62 56 34
53 39 33 15
16 23 23 19
1
0.8 0.6 0.2
0.5-1.3 0.4-1.0 0.1-0.6
0.009
-
-
-
WHO RA RCMD RARS RCMD-RS RAEB-1 RAEB-2 5q- syndrome
60 (15) 68 (17) 83 (21) 57 (14) 91 (23) 26 (6) 18 (4)
68 72 59 70 56 34 50
54 54 40 37 33 15 50
14 18 19 33 23 19 0
1
1.2 0.7 1.2 0.6 0.2 0.5
06-2.6 0.3-1.3 0.5-2.6 0.3-1.3 0.1-0.6 0.2-1.4
0.02
1
1.2 0.7 1.5 0.9 0.8 0.6
0.6-2.7 0.3-1.4 0.7-3.6 0.4-1.8 0.2-2.7 0.2-1.9
0.38
Karyotype Poor Good Intermediate NA
19 (5) 261(65) 66 (16) 57 (14)
43 63 63 61
21 43 38 40
22 20 25 21
1
2.9 2.1 2.3
1.3-6.2 0.8-5.5 1.0-5.6
0.05
-
-
-
Multilineage dysplasia No Yes
180 (45) 223 (55)
61 63
36 46
25 17
1
1.1
0.8-1.7
0.52
-
-
-
BM blasts ≥5 <5
105 (26) 298 (74)
53 66
48
18
1
1.7
1.1-2.7
0.02
-
-
-
EPO level (U/l) >200 ≤200 NA
92 (23) 248 (62) 63 (15)
42 69 63
37 52 33
25 17 30
1
2.9 2.3
1.8-4.7 1.2-4.4
<0.0001
1 2.0 2.1
1.2-3.5 1.0-4.2
0.03
IPSS Int-2 and high
43 (11)
36
17
19
1
1
For personal use only. by guest on May 31, 2013. bloodjournal.hematologylibrary.orgFrom

Low and int-1 NA
303 (75) 57 (14)
65
47
18
3.6
3.5
1.8-7.0
1.5-7.9
0.001
2.5
2.2
1.0-6.4
0.8-6.1
0.05
0.14
RBC transfusion before rEPO treatment No Yes
182 (45) 221(55)
76 51
60 27
16 24
1
0.3
0.2-0.5
<0.0001
1 0.4
0.2-0.6
<0.0001
Addition of G-CSF no yes
271 (67) 132 (33)
66 58
46 34
20 24
1
0.7
0.5-1.1
0.17
1 0.8
0.5-1.3
0.46 Interval from diagnosis ≥6 months <6 months
198 (49) 205 (50)
59 66
35 47
24 19
1
1.4
0.9-2.04
0.13
1 1.4
0.9-2.0
0.13 *Results from logistic regression. ** Multivariate analysis was adjusted for IPSS, age, EPO level , transfusions administration of G-CSF and WHO diagnosis - OR (odds ratio)
For personal use only. by guest on May 31, 2013. bloodjournal.hematologylibrary.orgFrom

Table 2. Characteristics of patients and prognostic factors of response to rEPO at week 12 according to IWG 2006 criteria (patients n= 403).
Overall response
Overall response vs. Non response* Univariate analysis Multivariate
analysis**
% OR CI (95%) p OR CI (95%) p Age <70 ≥70
44 54
1
1.5
1.0-2.2
0.06
1
1.3
0.8-2.2
0.22
Sex Male
Female
46 55
1
1.4
1.0-2.1
0.08
1
1.5
0.9-2.3
0.08
FAB RA
RARS RAEB<10 RAEB>10
61 48 43 23
1
0.6 0.5 0.2
0.4-0.9 0.3-0.8 0.1-0.5
0.001
-
-
-
WHO RA
RCMD RARS
RCMD-RS RAEB-1 RAEB-2
5q- syndrome
63 61 46 50 43 23 50
1
0.9 0.5 0.6 0.5 0.1 0.6
0.5-1.9 0.3-1.0 0.3-1.3 0.2-0.9 0.0-0.4 0.2-1.7
0.008
1
0.9 0.5 0.7 0.7 0.7 0.7
0.4-2.0 0.2-1.0 0.3-1.6 0.3-1.4 0.2-3.1 0.2-2.2
0.49
Karyotype Poor Good
Intermediate NA
18 53 49 46
1 4
2.7 2.9
1.7-9.7 0.9-7.7 1.1-7.7
0.01
-
-
-
Multilineage dysplasia
No Yes
52 48
1 0.9
0.6-1.3
0.50
-
-
-
BM blasts ≥5% <5%
38 54
1
1.9
1.2-3.1
0.004
-
-
-
EPO level (U/l) >200 ≤200 NA
29 60 41
1 3.7 1.7
2.2-6.2 0.9-3.3
<0.0001
1 2.7 1.6
1.5-4.8 0.8-3.4
0.002
IPSS (subgroup)
Int-2 and high Low and int-1
NA
16 55 47
1 6.4 5.0
2.8-14.8 1.9-13.0
<0.0001
1 4.6 3.4
1.5-14.0 1.0-11.2
0.02
For personal use only. by guest on May 31, 2013. bloodjournal.hematologylibrary.orgFrom

RBC transfusion
before rEPO treatment
No Yes
66 37
1 0.3
0.2-0.4
<0.0001
1
0.4
0.2-0.6
<0.0001
Addition of G-CSF
no yes
55 41
1 0.6
0.4-1.0
0.08
1
0.7
0.4-1.1
0.12
Interval from diagnosis ≥6 months <6 months
44 56
1 1.7
1.1-2.5
0.01
1
1.6
1.0-2.5
0.04
*Results from logistic regression. ** Multivariate analysis was adjusted for IPSS, age, EPO level, transfusions and WHO diagnosis - OR (odds ratio)
For personal use only. by guest on May 31, 2013. bloodjournal.hematologylibrary.orgFrom

Table 3. Duration of response to rEPO according to IWG 2000 response criteria. *Results from Cox multivariate analysis. HR=hazard ratio
Univariate analysis Multivariate analysis* Number of patients
Median response duration (months)
HR CI (95%) p HR CI (95%) p
Type of response major 168 24.4 1 1.00 minor 83 13.8 1.8 1.3-2.6 0.003 1.63 1.1-2.5 0.02 Age <70 83 16.8 1 ≥70 168 20 0.9 0.7-1.4 0.73 Sex Female 115 20 1 Male 136 20 0.9 0.7-1.3 0.76 FAB RA 99 24.4 1 RAEB<10 53 16 1.6 1.0-2.6 RAEB>10 9 8 4.6 1.9-10.9 RARS 90 18.1 1.2 0.8-1.8 0.0003 WHO RA 41 30 1 1.00 RCMD 49 22.3 1.9 1.0-3.6 1.63 0.8-3.2 0.15 RARS 49 17.6 1.7 0.9-3.2 1.78 0.8-4.2 0.19 RCMD-RS 41 24.3 2 1.0-3.8 1.71 0.7-4.0 0.22 RAEB-1 53 16 2.3 1.2-4.5 2.00 0.9-4.4 0.08 RAEB-2 9 8 7.4 2.8-19.7 4.01 1.1-14.5 0.04 5q- 9 11.2 3.7 1.5-9.0 0.0006 4.04 1.6-10.4 0.004 Karyotype good 165 22.3 1
F
or personal use only. by guest on M
ay 31, 2013. bloodjournal.hem
atologylibrary.orgF
rom

intermediate 39 16.7 1.0 0.6-1.7 poor 7 na 1.3 0.4-4.0 failure or not done 40 21 0.9 0.5-1.5 0.94 Multilineage Dysplasia
no 109 24 1 1.00 yes 142 16 1.5 1.0-2.2 0.02 1.13 0.6-2.2 0.72 BM blasts >10% 9 12 1 ≤10% 242 22.3 0.3 0.1-0.8 0.007 IPSS Int-2 and high 15 8 1 1.00 Low and int-1 199 21 0.4 0.2-0.7 0.53 0.2-1.2 0.31 not available 37 28.4 0.3 0.1-0.7 0.004 0.49 0.2-1.3 0.14 EPO level (U/l) ≥200 40 25 1 <200 171 20 1.0 0.6-1.7 0.97 not available 40 11 1.9 1.0-3.5 0.05 Transfusion requirement
no 138 24 1 1.00 yes 113 18 1.4 0.9-1.9 0.07 1.11 0.7-1.7 0.61
F
or personal use only. by guest on M
ay 31, 2013. bloodjournal.hem
atologylibrary.orgF
rom

Table 4. Univariate and multivariate cox regression analyses of survival of the selected French-EPO (n=284) and IMRAW (n=225) cohorts. French -
EPO IMRAW P value
For France vs IMRAW
characteristics
AML (French
EPO cohort)
AML (IMRAW
cohort)
Died (French-
EPO cohort)
Died (IMRAW cohort)
5-year OS % (+/- sd*)
Multivariate analysis of OS
N=284 (%) N=225 (%) N=12 N=24 N=35 N=123 Adjusted HR** CI (95%) p Age <70 ≥70
127 (45) 157(55)
130 (58) 95 (42)
0.003
5 7
13 11
20 15
75 48
38(5.1) 55 (5.1)
1.1 1
0.8-1.5
0.53
Sex Male Female
157 (55) 127 (45)
124 (55) 101 (45)
0.97
6 6
17 7
25 10
74 49
37 (5.0) 57 (5.3)
1
0.6
0.5-0.9
0.004
FAB RA RARS RAEB
111 (39) 110 (39) 63 (22)
121 (54) 70 (31) 34 (15)
0.003
3 6 3
9 8 7
16 9
10
65 33 25
43 (5.1) 61 (6.1)
na
1
0.6 1.9
0.4-0.8 1.0-3.8
0.002
Karyotype Intermediate Favorable
28 (10) 256 (90)
35 (16) 190 (84)
0.05
0 12
5 19
3 32
18 105
51 (10.9) 45 (3.9)
1 0.9
0.6-1.5
0.84
BM blasts* Median (iqr)
3 (2-5)
2 (1-4)
<0.0001
1.0
0.9-1.1
0.89
IPSS Low Int-1
136 (48) 148 (52)
78 (35) 147 (65)
0.003
4 8
4 20
17 18
34 89
56 (5.7) 40 (4.7)
Hb level (g/dl) <8 8-10
150 (53) 134 (47)
99 (44) 126 (56)
0.05
9 3
14 10
20 15
57 66
rEPO treatment yes no
284 (100) 0 (0)
0 (0) 225 (100)
64 (8.1) 39 (3.9)
0.43 1
0.25-0.72
0.005
F
or personal use only. by guest on M
ay 31, 2013. bloodjournal.hem
atologylibrary.orgF
rom

* standard deviation ** Hazard ratio
F
or personal use only. by guest on M
ay 31, 2013. bloodjournal.hem
atologylibrary.orgF
rom

29
Figure 1. Flow chart for the comparison between the French EPO and the IMRAW database.
For personal use only. by guest on May 31, 2013. bloodjournal.hematologylibrary.orgFrom

30
Figure 2.a) Overall survival comparison between the IMRAW and French-EPO cohorts restricted to IPSS LOW INT1 without unfavorable karyotype, since diagnosis for IMRAW and since introduction of rEPO for French-EPO cohort. (IMRAW n=225 patients (dotted curve), French-EPO= 284 (plain curve)).
P<0.0001
For personal use only. by guest on May 31, 2013. bloodjournal.hematologylibrary.orgFrom

31
2b) Overall survival comparison between the IMRAW and French- EPO cohorts restricted to IPSS LOW INT1 without unfavorable karyotype, according to response to rEPO: IMRAW n=225 (dotted curve), French-EPO (rEPO responders n=195 (violet plain curve), rEPO non responders n= 99 (blue plain curve)). The p-value was <0.0001 between IMRAW and rEPO responders, and p=0.17 between IMRAW and rEPO non responders.
For personal use only. by guest on May 31, 2013. bloodjournal.hematologylibrary.orgFrom

32
2c) Matched-pair analysis with 200 patients in the IMRAW database and 200 patients in the French-EPO cohort.
P=0.0007
For personal use only. by guest on May 31, 2013. bloodjournal.hematologylibrary.orgFrom