Livestock manure treatment for nutrients removal - AIR Unimi

60
Predicting Transport of Nutrients from Three Tributary Rivers ofTaal Lake, Philippines
Jacqueline E. Hilario1,2,* and Teresita R. Perez3
1Institute of Environmental Science and Meteorology, College of Science, University of the Philippines, Diliman,Quezon City 1101, Philippines2School of Arts and Sciences, Philippine Women’s University, Taft Avenue, Manila3Department of Environmental Science, Ateneo de Manila University, Loyola School, Quezon City (e-mail:[email protected])*Author for correspondence; e-mail: [email protected], [email protected], [email protected]; Tel.: +63 02496 7005
Inflows from the Balete, Wawa and Laurel Rivers and from fish cages within Taal Lake, Batangas,Philippines were studied to assess the input of nitrogen (N) and phosphorus (P) into the lake. Physicalparameters such as temperature, total dissolved solids (TDS), pH, conductivity and dissolved oxygen(DO) were recorded in situ. Nutrient concentrations and wind data collected were used as inputs in amodified nutrient transport model simulating advection and dispersion of nutrient concentrations inTaal Lake. Results showed significant concentrations of P (P<0.01) and N (P<0.05) in Laurel River, withaverage mean discharges of 5 and 4 kg d-1, respectively, while Balete and Wawa Rivers contributedhigh mean discharges of 85 kg d-1 nitrate-nitrogen (NO3-N). Measurements of TDS and conductivitywere similarly significant (P<0.01) in the fishcages.
Simulated distribution patterns of nutrients revealed that during the Northeast (NE) monsoon, nutrientdischarges from Laurel and Balete Rivers were transported southward while nutrients coming from theWawa River moved in the northwest and southwest directions. During the Southwest (SW) monsoon,nutrients from Laurel were transported northwest while nutrients from Wawa and Balete moved in thesouthwest direction. High N and P concentrations in Laurel could be attributed to the neutral pHmeasured throughout the study period since P is soluble and N-fixers grow best at circum-neutral pH.NH4-N and NO3-N are soluble ions and are easily leached, so that losses of these ions from soils tofreshwaters reflect the amount of fixation in the soils.
A nutrient transport model of Taal Lake was formulated to quantitatively analyze the transport and fateof P and N nutrients that enter the lake via tributaries. Nutrient discharges into the lake weretransported by water movements which had three main influences: height differences of surface levelwith gravitational flow, density with buoyancy or sinking and surface wind stress with transfer ofmomentum as well as energy. Wind stress was responsible for the slow nutrient transport in the lake.
Key Words: advection and dispersion model, nitrogen, nutrient transport, phosphorus, Taal Lake, water qualitysampling
Abbreviations: DO – dissolved oxygen, NAMRIA – National Mapping and Resource Information Authority,PHIVOLCS – Philippine Institute of Volcanology and Seismology, SP – soluble phosphorus, TDS – total dissolvedsolids, TP – total phosphorus
INTRODUCTION
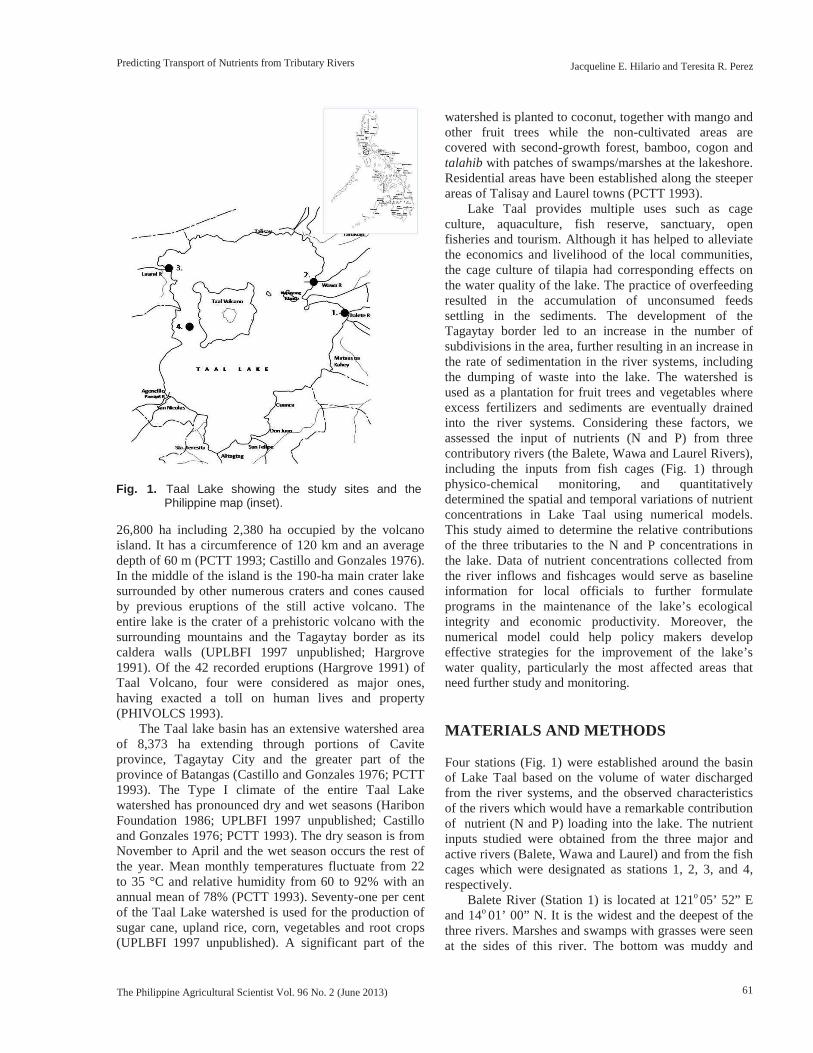
Taal Lake is the Philippines’ third largest lake (UPLBFI1997 unpublished) located between 120o 55’ to 121o 05’East and 13o 55’ to 14o 05’ North and lies about 60 kmsouth of Manila (Fig. 1). It has 37 tributary rivers
(inflows) and one outflow, the Pansipit River (Castilloand Gonzales 1976), which serves as the sole outlet intoBalayan Bay and the South China Sea. The PansipitRiver has a mean outflow of approximately 15 m3 s-1 anda maximum daily flow of 41.84 m3 s-1 (UPBFI 1997unpublished). Taal Lake covers an aggregate area over
ISSN 0031-7454PHILIPP AGRIC SCIENTISTVol. 96 No. 2, 000–000June 2013
The Philippine Agricultural Scientist Vol. 96 No. 2 (June 2013)
61
26,800 ha including 2,380 ha occupied by the volcanoisland. It has a circumference of 120 km and an averagedepth of 60 m (PCTT 1993; Castillo and Gonzales 1976).In the middle of the island is the 190-ha main crater lakesurrounded by other numerous craters and cones causedby previous eruptions of the still active volcano. Theentire lake is the crater of a prehistoric volcano with thesurrounding mountains and the Tagaytay border as itscaldera walls (UPLBFI 1997 unpublished; Hargrove1991). Of the 42 recorded eruptions (Hargrove 1991) ofTaal Volcano, four were considered as major ones,having exacted a toll on human lives and property(PHIVOLCS 1993).
The Taal lake basin has an extensive watershed areaof 8,373 ha extending through portions of Caviteprovince, Tagaytay City and the greater part of theprovince of Batangas (Castillo and Gonzales 1976; PCTT1993). The Type I climate of the entire Taal Lakewatershed has pronounced dry and wet seasons (HaribonFoundation 1986; UPLBFI 1997 unpublished; Castilloand Gonzales 1976; PCTT 1993). The dry season is fromNovember to April and the wet season occurs the rest ofthe year. Mean monthly temperatures fluctuate from 22to 35 °C and relative humidity from 60 to 92% with anannual mean of 78% (PCTT 1993). Seventy-one per centof the Taal Lake watershed is used for the production ofsugar cane, upland rice, corn, vegetables and root crops(UPLBFI 1997 unpublished). A significant part of the
watershed is planted to coconut, together with mango andother fruit trees while the non-cultivated areas arecovered with second-growth forest, bamboo, cogon andtalahib with patches of swamps/marshes at the lakeshore.Residential areas have been established along the steeperareas of Talisay and Laurel towns (PCTT 1993).
Lake Taal provides multiple uses such as cageculture, aquaculture, fish reserve, sanctuary, openfisheries and tourism. Although it has helped to alleviatethe economics and livelihood of the local communities,the cage culture of tilapia had corresponding effects onthe water quality of the lake. The practice of overfeedingresulted in the accumulation of unconsumed feedssettling in the sediments. The development of theTagaytay border led to an increase in the number ofsubdivisions in the area, further resulting in an increase inthe rate of sedimentation in the river systems, includingthe dumping of waste into the lake. The watershed isused as a plantation for fruit trees and vegetables whereexcess fertilizers and sediments are eventually drainedinto the river systems. Considering these factors, weassessed the input of nutrients (N and P) from threecontributory rivers (the Balete, Wawa and Laurel Rivers),including the inputs from fish cages (Fig. 1) throughphysico-chemical monitoring, and quantitativelydetermined the spatial and temporal variations of nutrientconcentrations in Lake Taal using numerical models.This study aimed to determine the relative contributionsof the three tributaries to the N and P concentrations inthe lake. Data of nutrient concentrations collected fromthe river inflows and fishcages would serve as baselineinformation for local officials to further formulateprograms in the maintenance of the lake’s ecologicalintegrity and economic productivity. Moreover, thenumerical model could help policy makers developeffective strategies for the improvement of the lake’swater quality, particularly the most affected areas thatneed further study and monitoring.
MATERIALS AND METHODS
Four stations (Fig. 1) were established around the basinof Lake Taal based on the volume of water dischargedfrom the river systems, and the observed characteristicsof the rivers which would have a remarkable contributionof nutrient (N and P) loading into the lake. The nutrientinputs studied were obtained from the three major andactive rivers (Balete, Wawa and Laurel) and from the fishcages which were designated as stations 1, 2, 3, and 4,respectively.
Balete River (Station 1) is located at 121o 05’ 52” Eand 14o 01’ 00” N. It is the widest and the deepest of thethree rivers. Marshes and swamps with grasses were seenat the sides of this river. The bottom was muddy and
Predicting Transport of Nutrients from Tributary Rivers Jacqueline E. Hilario and Teresita R. Perez
Fig. 1. Taal Lake showing the study sites and thePhilippine map (inset).
The Philippine Agricultural Scientist Vol. 96 No. 2 (June 2013)

62
floating materials were seen running off at the surface ofthe water. Wawa River (Station 2) is located at 121o 04’15” E and 14o 03’ 52”. It is the narrowest of the threerivers and surrounded by trees and grasses. Laurel River(Station 3) is located at 120o 56’15” E and 04o 04’30” N,and is the shallowest. Stones and rocks are embedded,and the river is sandy and slightly muddy at the bottom.A bridge could be seen almost 2 km away from the lake.Station 4, within the fishcages, had a combined odor offish and sulfur (H2S), which was remarkable in the area.The station had an average depth of 30 m; the water wasclear, often with slight waves.
Data of the depth, width, velocity, area and dischargeof the rivers were recorded. Depth and width weremeasured and estimated by a using meter stick whileflow velocity was measured indirectly by tracking thetime for an object in the water to travel at a givendistance. Area was computed as the product of the depthand the width while discharge rate (volumetric flow) wascomputed by multiplying the area by the velocity of theriver.
Water samples of the rivers and the fish cages weretaken once a month for 10 consecutive months from May1999 to February 2000 to cover the dry (October–February) and wet (May–September) seasons.
Water Quality SamplingNalgene bottles (acid-washed, 500-mL capacity) wereused to collect water samples at the mouth andsubsurface of every station. Water samples werecollected at the surface of the mouth of the rivers andfishcages. Measurements of water temperature, pH,conductivity and TDS were done in situ using theCheckmate M90 Field De Lux System. Physicalparameters were considered in this study to establish arecord on the present water quality condition of the lake.Various chemical parameters such as NH4-N, NO3-N,total phosphorus (TP) and soluble phosphorus (SP) weresimilarly analyzed at the Inland Fisheries ResearchStation (IFRS) Laboratory of the Bureau of Fisheries andAquatic Research (BFAR) in Ambulong, Tanauan,Batangas.
Two replicate samples per station were maintainedthroughout the study. Water samples for N and Panalyses were stored in 500-mL high-density nalgenebottles, previously rinsed with lake water two to threetimes. Samples were placed in an ice chest to maintain atemperature of 4 °C until further analyses in thelaboratory. Holding time of the water samples collectedfor nutrient analyses were observed at a minimum toavoid contamination and deterioration. Dissolved oxygen(DO) levels were determined by the Probe method(APHA 1989). All water samples were analyzed for TP,SP, NH4-N, and NO3-N based on the methods of Wetzeland Likens (1991). TP was analyzed with potassium-peroxi-disulfate using the ammonium molybdate method.
P was determined using the same method as mentionedabove with ascorbic acid as the reducing agent. Thephenol hypochlorite method was used to analyze NH4-Nusing sodium nitroprusside as a catalyst. On the otherhand, NO3-N was determined by cadmium-reductionafter oven drying of the filtered samples with sodium-salicylate solution.
All the gathered numerical data were subjected tostatistical analysis (SPSS) with one-way ANOVA tocompare the significance of the mean values obtainedbetween the stations. Differences having P-values < 0.05were considered significant. Statistical design andanalyses were conducted at the School of Statistics,University of the Philippines, Diliman, Quezon City.
Numerical ModelThe model modified for this application to Taal Lake hadtwo components: 1) a hydrodynamic lake circulationmodel and 2) a nutrient transport model (Schwab 2009).The flow velocities or circulation of a lake is mostly winddriven (Beletsky 2001). The classical model used byKoutitas (1988) for wind-driven circulation in coastalseas and lakes was adapted, which is given by theequations:
(1)
(2)
= -fu - (3)
In equations 1, 2 and 3, tsx and tsy represent the surfacestress due to the wind, tbx and tby the bottom stress, r thewater density, f the coriolis parameter (which depends onthe angular rotation rate of the earth and thetrigonometric sine of the latitude), and z the water surfaceelevation set up by the wind. ax and ay are stress-relatedvariables derived from a = 16.6 (Koutitas 1988). Thesurface stress is generally parameterized in terms of thewind W taken at anemometer level as in:
and (4)
with a constant drag coefficient cd. The bottom stress isestimated by the quadratic equation:
(5)
In equation 5, k is the bottom friction coefficient.Equations 1–3 describe the wind-driven circulation,which is generally responsible for the long-term and long-distance transport of nutrients in lakes and coastal seas.
For Lake Taal, a grid spacing of 250 m was used,giving a system of 40 squares by 60 squares. At the
0
y
vh
x
uh
phx
gfv
y
uaxu
x
uu
t
u bxsx
402.0
y
vav
x
vuv y
402.0
hy
g bxsy
s
WWc xdasx WWc ydasy
2222 , vukvvuku bxbx
The Philippine Agricultural Scientist Vol. 96 No. 2 (June 2013)
Predicting Transport of Nutrients from Tributary Rivers Jacqueline E. Hilario and Teresita R. Perez

63
center of each grid cell, the water depth was read fromthe only available bathymetric map published by theNational Mapping and Resource Information Authority(NAMRIA) in 1997 (Fig. 2). The bathymetric data weresubjected to smoothing by taking simple averages of foursurrounding points.
Stability, a property of the numerical scheme used(Thomann and Mueller 1987), is said to be stable if thedifference between the exact and the numerical solutionsof the finite difference equations does not increaseexponentially with time (Rivera 1997). It further impliesthat the difference between the exact and the numericalsolutions is negligibly small; however, as the physicalprocesses that act on the water system become morecomplex, the use of differential equations to model anddefine these processes create potential sources fornumerical errors.
For the circulation model defined above, a potentialsource of error is the truncation of terms in the TaylorSeries expansion of the numerical solution which resultsfrom approximating or solving the correspondingdifferential equations without the higher order terms(Rivera 1997). The error is usually small but could maskthe numerical solution during integration if stability is notensured.
An important stability requirement to consider is thechoice of the interval of numerical integration, , whichshould follow the Courant–Freidrich-Lewy (CFL)criterion. The CFL criterion defines a limit for suchthat
(6)
where g is gravitational acceleration and is themaximum depth. This inequality means that the usedmust be less than the time needed for a perturbation tocover the extent of a grid cell (Koutitas 1988).
Model Input for Taal LakeData entries for the numerical model were the nutrientconcentration data observed from the inflows of the riverstations and the wind data. Fishcage data were notincluded in the entry because the data collected weretaken from the lake and not from tributary inflows.Climatological data during the study period (Table 1)were taken from the Philippine Atmospheric,Geophysical and Astronomical Services Administration(PAGASA 1996) at the Ambulong, Station in Tanauan,Batangas. To use the model defined earlier, certainadjustments and additional information were needed.Included were the bathymetry (or depth contours) of thelake (Fig. 2), the resolution of the model in terms ofspace, and the setting of the value of the Coriolis term forTaal Lake.
Bathymetry of Lake Taal was taken from a depthblueprint of the lake provided by the NAMRIA (1997)and the Philippine Institute of Volcanology andSeismology (PHIVOLCS 1993).
Following the CFL stability criterion definedearlier, (the time interval for numerical integration)was set at 5 s. This interval was less than the timerequired for any numerical perturbation or wavedisturbance to cover the extent of the grid cell givena of 500 m and a maximum depth of 100 m.
The adjusted models were then integrated for 30 dusing the program PowerBasic® and the results of theflow pattern were plotted using Surfer® 6.01. Theassumed physical parameters for Lake Taal areas follows: (1) the dispersion coefficients are1 m-2 s-1; (2) m; (3) the coriolisforces and are computed with latitude 13o
from sinθ, where is the angular rotation rate of the earth (= 7.292 x 10⁻⁵ radian s-1), and θ is altitude (14° N); and (4) the diffusion coefficient of effectivediffusion homogenization (EDH) in the momentumequations is 1 m-2 s-1.
The wind-driven circulation of the lake wascalculated using the May 1999–February 2000 values ofwind speeds for two prominent seasons, the SW monsoonand NE monsoon (Table 1). The wind directions for theSouth (S), West Northwest (WNW), Southwest (SW) andNortheast (NE) monsoons were 190°, 300°, 230° and50°, respectively; and wind velocities were 1 and 2 m s-1,respectively. These wind data were taken at theAmbulong Meteorological Station in Tanauan, Batangas.
t
t
max2gh
st
maxht
Fig. 2. Bathymetry map of Taal Lake showing the depthcontours of the different areas of the Lake [imagetaken from the National Mapping and ResourceInformation Authority (NAMRIA)].
t
s
,, yx KK 500 sDYDX
vf uf 2f
The Philippine Agricultural Scientist Vol. 96 No. 2 (June 2013)
Predicting Transport of Nutrients from Tributary Rivers Jacqueline E. Hilario and Teresita R. Perez

64
Transport of Nutrients in the LakeModeling the transport or dispersion of nutrients in thelake was based on the Mass Conservation Law solvedusing the finite difference method. The advection-dispersion equation for aquatic nutrients is given by thepartial differential equation (Rivera 1997):
(7)
where c is the concentration of nutrients; u,v are the flowvelocities given by the circulation model; kx, ky arediffusion coefficients; t is time; and x, y, are horizontalcoordinates. For this model, the Upstream (Finite)Difference Scheme was used for easy programimplementation. The time interval of 5 s gave stablesolution.
The three major rivers in this study that dischargenutrients into Taal Lake were chosen based on thevolume of water and observed characteristics of therivers. The nutrient data taken from the inflows of thethree tributary rivers were included in the modelcalculation.
RESULTS AND DISCUSSION
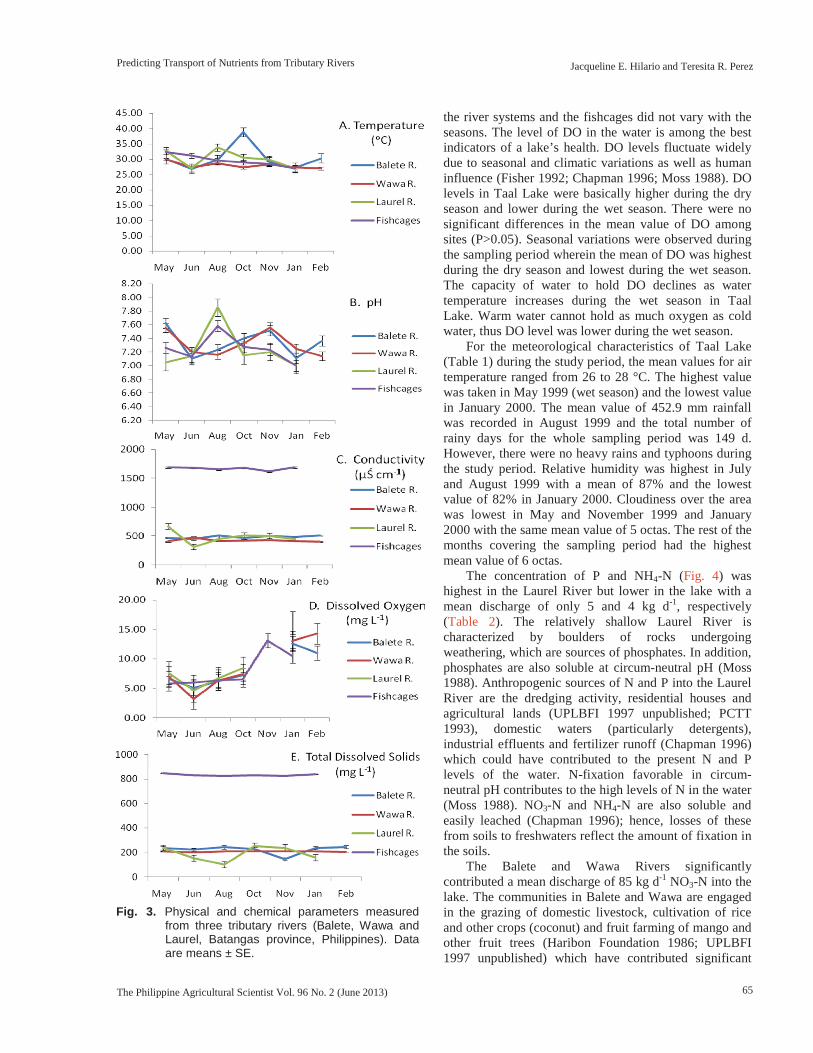
Physical conditions (temperature, DO, pH, TDS andconductivity) were documented to establish a record onthe water quality condition of the lake. Among thephysical parameters measured in situ, TDS andconductivity were relatively higher (P<0.01) in the fishcages than in the river systems (Fig. 3). Taal Lake wasonce connected to the sea (UPLBFI 1997 unpublished;
Hargrove 1991; Aypa et al. 1990; Castillo and Gonzales1976) and this is probably the reason why there is higherconductivity in the fish cages compared with the tributaryinflows. Conductivity measures salinity by determininghow well the water conducts an electrical current.However, as the concentration of salts in the waterincreases, electrical conductivity rises (Fisher 1992;Thomann and Mueller 1987).
Temperature was highest in fishcages and in theLaurel River during the wet season (Fig. 3). No typhoonsor heavy rains occurred in the area during the studyperiod. There were no significant differences in the meanwater temperature among the four sites (P>0.05).However, seasonal variations were observed in all thestudy sites where water temperature was higher duringthe wet season and lower during the dry season. Thisresult supports the findings of UPLBFI (1997unpublished), Zafaralla et al. (1992) and Zafaralla et al.(1989 unpublished). Temperature is one of the mostsignificant parameters in limnological studies for threereasons: (1) the discharges of excess heat from industrialand municipal effluents may positively or negativelyaffect the ecology of the aquatic ecosystem; (2) they mayalso influence the biological or chemical reactions; and(3) the variations in temperature affect the density ofwater and, hence, the transport of water (Thomann andMueller 1987; Talling and Lemoalle 1998).
The pH of lakewaters is critical to the survival ofmost aquatic plants and animals (Chapman 1996: Fisher1992). In Taal Lake during the sampling period, the pHof the rivers and fishcages had been neutral at 7throughout the study. There were no significantdifferences among sites (P>0.05). The mean pH values of
Table 1. Climatological data from May 1999 to February 2000, adapted from the Philippine Atmospheric, geophysical andAstronomical Services Administration (PAG-ASA).Station : 432 - Ambulong, Tanauan, Batangas, PhilippinesLatitude : 14°05' NLongitude : 121°03' EElevation : 10.0 mPeriod : May 1999 – February 2000
Month
Rainfall TemperatureRelativeHumidity
WindCloudAmt.
No. ofDayswith
Amt(mm)
No.of
RD*Max Min Mean
DryBulb
WetBulb
DewPt.
MSLP(mps)
DirSpeed(mps)
TS Lgtg
May 96.40 8 32.8 24.4 28.6 28.6 26.3 25.5 83 1010.5 S - 190o 1 5 21 24June 319.60 22 31.4 24.1 27.8 27.7 25.8 25.1 86 1009.4 WNW - 300o 1 6 18 22July 324.30 22 31.1 24.5 27.8 27.4 25.5 24.9 87 1009 WNW - 300o 3 6 13 18August 452.90 21 30.4 24.4 27.4 27.2 25.5 24.9 87 1009.6 SW - 230o 2 6 9 14September 170.80 14 30.8 24.2 27.5 27.4 25.5 24.9 86 1010 SW - 230o 2 6 7 9October 299.40 12 31.1 24.2 27.6 27.5 25.5 24.9 86 1011 NE - 50o 1 6 11 19November 159.20 16 30.4 24.0 27.2 26.9 24.9 24.2 85 1011.1 NE - 50o 1 5 1 13December 161.90 15 29.6 23.6 26.6 26.4 24.3 23.6 85 1011.4 NE - 50o 2 6 1 3January 44.30 10 30.4 22.5 26.4 26.1 23.7 22.8 82 1012.8 NE - 50o 1 5 0 0February 79.40 9 30.1 22.9 26.5 26.3 24.1 23.4 83 1012.8 NE - 50o 2 6 2 0ANNUAL 2108.2 149 30.8 23.9 27.3 27.2 25.1 24.4 85 1010.8 NE - 50o 2 6 83 122*RD – Rainy Days; MSLP – Mean Surface Low Pressure; Dir – direction; TS – thunderstorm; Lgtg – lightning
2
2
2
2
y
cky
x
ckx
y
cv
x
cuc
t
The Philippine Agricultural Scientist Vol. 96 No. 2 (June 2013)
Predicting Transport of Nutrients from Tributary Rivers Jacqueline E. Hilario and Teresita R. Perez
65
the river systems and the fishcages did not vary with theseasons. The level of DO in the water is among the bestindicators of a lake’s health. DO levels fluctuate widelydue to seasonal and climatic variations as well as humaninfluence (Fisher 1992; Chapman 1996; Moss 1988). DOlevels in Taal Lake were basically higher during the dryseason and lower during the wet season. There were nosignificant differences in the mean value of DO amongsites (P>0.05). Seasonal variations were observed duringthe sampling period wherein the mean of DO was highestduring the dry season and lowest during the wet season.The capacity of water to hold DO declines as watertemperature increases during the wet season in TaalLake. Warm water cannot hold as much oxygen as coldwater, thus DO level was lower during the wet season.
For the meteorological characteristics of Taal Lake(Table 1) during the study period, the mean values for airtemperature ranged from 26 to 28 °C. The highest valuewas taken in May 1999 (wet season) and the lowest valuein January 2000. The mean value of 452.9 mm rainfallwas recorded in August 1999 and the total number ofrainy days for the whole sampling period was 149 d.However, there were no heavy rains and typhoons duringthe study period. Relative humidity was highest in Julyand August 1999 with a mean of 87% and the lowestvalue of 82% in January 2000. Cloudiness over the areawas lowest in May and November 1999 and January2000 with the same mean value of 5 octas. The rest of themonths covering the sampling period had the highestmean value of 6 octas.
The concentration of P and NH4-N (Fig. 4) washighest in the Laurel River but lower in the lake with amean discharge of only 5 and 4 kg d-1, respectively(Table 2). The relatively shallow Laurel River ischaracterized by boulders of rocks undergoingweathering, which are sources of phosphates. In addition,phosphates are also soluble at circum-neutral pH (Moss1988). Anthropogenic sources of N and P into the LaurelRiver are the dredging activity, residential houses andagricultural lands (UPLBFI 1997 unpublished; PCTT1993), domestic waters (particularly detergents),industrial effluents and fertilizer runoff (Chapman 1996)which could have contributed to the present N and Plevels of the water. N-fixation favorable in circum-neutral pH contributes to the high levels of N in the water(Moss 1988). NO3-N and NH4-N are also soluble andeasily leached (Chapman 1996); hence, losses of thesefrom soils to freshwaters reflect the amount of fixation inthe soils.
The Balete and Wawa Rivers significantlycontributed a mean discharge of 85 kg d-1 NO3-N into thelake. The communities in Balete and Wawa are engagedin the grazing of domestic livestock, cultivation of riceand other crops (coconut) and fruit farming of mango andother fruit trees (Haribon Foundation 1986; UPLBFI1997 unpublished) which have contributed significant
Fig. 3. Physical and chemical parameters measuredfrom three tributary rivers (Balete, Wawa andLaurel, Batangas province, Philippines). Dataare means ± SE.
The Philippine Agricultural Scientist Vol. 96 No. 2 (June 2013)
Predicting Transport of Nutrients from Tributary Rivers Jacqueline E. Hilario and Teresita R. Perez

66
Fig. 4. Chemical parameters (in µg L-1) measured from three tributary rivers (Balete, Wawa and Laurel, Batangasprovince, Philippines). Data are means ± SE.
Table 2. General profile of the river systems of Taal Lake and their nutrient discharges.
Depth(m)
Width(m)
Velocity(m s-1)
Area(m2)
Streamflowm3 s-1
Nutrient DischargesTP
(kg d-1)SP
(kg d1)NO3-N(kg d-1)
NH4-N(kg d-1)
Laurel River 0.25 8 0.02 2 0.05 3 2 nd ndBalete River 2 10 0.067 20 1.34 46 39 33 13Wawa River 0.75 7 0.117 5.25 0.614 23 18 15 17
OctoberLaurel River 0.3 12 0.03 3.6 0.108 3 3 2 3Balete River 1.5 10 0.67 15 1.005 51 14 113 10Wawa River 0.95 7 0.11 6.65 0.732 43 7 77 5
NovemberLaurel River 0.28 11 0.06 3.08 0.185 10 2 2 5Balete River 0.9 12 0.08 10.8 0.896 36 17 96 14Wawa River 1 8 0.13 8 1.04 32 17 105 28
JanuaryLaurel River 0.27 11.5 0.04 3.1 0.1242 4 1 1 3Balete River 95 11 0.083 10.45 0.867 16 9 180 14Wawa River 95 7 0.12 6.65 0.798 20 7 169 4
FebruaryLaurel River 0.006 6 0.034 0.036 0.0005 2 1 0 1
Balete River 0.98 10.85 0.075210.63
3 0.8081 24 8 3 13Wawa River 0.85 6.5 0.1154 5.525 0.5525 16 6 58 10
AverageLaurel River 0.2212 9.7 0.034 2.15 0.0731 5 2 2 4Balete River 1.266 10.77 0.0752 13.63 1.025 35 17 85 13Wawa River 0.9 7.1 0.1154 6.39 0.737 27 11 85 13
TP – total phosphorus, SP – soluble phosphorusDischarges were calculated by multiplying the streamflow by the nutrient concentration (see Fig. 4).
August
The Philippine Agricultural Scientist Vol. 96 No. 2 (June 2013)
Predicting Transport of Nutrients from Tributary Rivers Jacqueline E. Hilario and Teresita R. Perez

67
amount of N into the two rivers. The circum-neutral pHof the water throughout the study period also enhanced N(Moss 1988). Fixation was observed to be higher in soilsderived from rocks of volcanic origin. Both NH4-N andNH3-N are relatively soluble ions and are easily leached(Chapman 1996) to freshwaters (Moss 1988; Thomannand Mueller 1987). The Balete and Wawa Riverscontributed more of NO3-N (85 kg d-1, Table 2) into thelake due to their water volume both of which were highcompared with that of the Laurel River. The fishcageswithin the lake are located at the southwestern part of theCrater Lake and had a remarkable contribution of Pconcentration with a mean of 258 µg L-1. P comes fromweathering rocks and since Taal Lake is volcanic inorigin, this could be the reason for the high Pconcentration. The fishcages have a remarkablecombined odor of fish and sulfur (H2S) in the area andhave an average depth of 30 m, clear water and oftenwith slight waves.
Nutrients, especially N and P, are of particularconcern in the ecosystem of a lake because theiravailability can limit the growth of aquatic plants(Chapman 1996; Fisher 1992; Moss 1988; Thomann andMueller 1987). N and P, along with water temperatureand sunlight, control phytoplankton abundance.However, an excess of N and P may trigger a string ofevents that seasonally depletes DO levels in the water.On a longer time scale, excess nutrients accelerateeutrophication – an aging process whereby organicdebris, along with sediments, fills up a body of water.
There has been a growing interest in the transportmodel regarding the role of episodic (wind-driven)currents in sediment transport and more broadly in theecosystems of large lakes (Beletsky 2001). Recent studiesby Schwab et al. (2009) and Leon et al. (2005) showedhow a high-resolution numerical model of a lake has alsobeen used to gain insight into the spatial and temporalvariability of P in the lake.
In this study, the nutrient transport model of TaalLake was formulated for a quantitative analysis of thetransport and the fate of P and N nutrients that enter thelake via tributaries. Data on nutrient concentrationscollected from the river systems and their correspondingwind data were used as entries to the modified transportmodel. Spatial and temporal distribution of nutrients fromthe tributaries was manifested in the simulateddistribution patterns of nutrients during a 720-h period(30 d). From the model, we observed that the nutrientdischarges from the Laurel and Balete Rivers during theNE monsoon moved southward with a wind speed of 1 ms-1 and a wind direction of 50° while the nutrients comingfrom the Wawa River moved in two directions: northwestand southeast (Fig. 5-D, E and F; Fig. 6-D, E and F), withthe same wind speed and direction. As the nutrientdischarges moved farther, their concentration decreased.During the SW monsoon, nutrients from the Laurel River
were transported northwest (Fig. 5-C) while those fromthe Wawa and Balete Rivers moved in the southwestdirection (Fig. 5-C; Fig. 6-C) with a wind speed of 2 m s-
1 and a wind direction of 230°.The wide-range distribution of nutrients in August
2000 (Fig. 5-C; Fig. 6-C) and February 2000 (Fig. 5-G;Fig. 6-G) was due to the 2 m s-1 wind speed. Nutrientdischarges into the lake were transported by watermovements which were influenced by three main factors:height differences of surface level with gravitationalflow, density with buoyancy or sinking, and surface windstress with transfer of momentum, as well as energy(Talling and Lemoalle 1998). Wind stress is the mostpowerful agent for generating water movements in lakes(Talling and Lemoalle 1998). It is roughly proportional tothe square of wind velocity, so that stronger winds havedisproportionately more influence. Velocity of flowpartly determines the time of travel between two pointsof changes in water levels (Hurst 1952). Higher velocityof the flow promotes the suspension and transport of siltthat is often abundant in floodwater and in deposition,which can slowly alter the channels and landscapes ofrivers and lakes (Walling 1984). Wind stress wasresponsible for the slow transport of nutrients in LakeTaal.
CONCLUSION AND RECOMMENDATIONS
The three major river systems and the fish cages in TaalLake contributed significantly to the nutrient inputs of thelake. Both the Balete and Wawa Rivers contributedalarming nutrient loading of 85 kg d-1 NO3-N to the lake.Although the Laurel River had a very significantcontribution of P (5 kg d-1) and NH4-N (4 kg d-1), itscontribution to the lake was minimal due to its lowvolume of water inflow. In fish cages, a mean of 205 µgL-1 NH4-N was recorded. That alone would indicate ahigh concentration of N in the fish cages. Furtherexcessive use of pelletized feeds without adequatemanagement and control measures could eventually leadto the total deterioration of the lake’s water quality.
The two-dimensional nutrient transport model usingdaily tributary loads was shown to provide comparablenutrient concentration values to the spatial and temporaldistribution of nutrient concentrations into the lake fromthe three tributary rivers. The modified nutrient transportmodel showed that the flow of nutrients was attributed towind stress which would generate water movementspredicting nutrient accumulation in the lake. From theresults of this study, the three tributary rivers contributedcritical concentrations of N and P into the lake per theirdaily discharges shown in the simulated model and basedon other collected data. In the fishcages, theconcentration of N, specifically NH4-N, was alsoalarming. Taal Lake is considered to be in its eutrophic
The Philippine Agricultural Scientist Vol. 96 No. 2 (June 2013)
Predicting Transport of Nutrients from Tributary Rivers Jacqueline E. Hilario and Teresita R. Perez

68
Fig. 5. Simulated nutrient dispersion model showing the flow of total phos-phorus (TP) concentration from three tributary rivers (Balete, Wawaand Laurel, Batangas province, Philippines) during the month of A)May with a wind speed of 1 m s-1 and a wind direction of 190°, B)June with a wind speed of 1 m s-1 and a wind direction of 300°, C)August with a wind speed of 2 m s-1 and a wind direction of 230°, D)October with a wind speed of 1 m s-1 and a wind direction of 50°, E)November with a wind speed of 1 m s-1 and a wind direction of 50°,F) January with a wind speed of 1 m s-1 and a wind direction of 50°,and G) February with a wind speed of 2 m s-1 and a wind direction of50°.
A
G
FED
CB
The Philippine Agricultural Scientist Vol. 96 No. 2 (June 2013)
Predicting Transport of Nutrients from Tributary Rivers Jacqueline E. Hilario and Teresita R. Perez

69
Fig. 6. Simulated nutrient dispersion model showing the flow of nitratenitrogen (NO3-N) and ammonium nitrogen (NH4-N)concentrations from three tributary rivers (Balete, Wawa andLaurel, Batangas province, Philippines) during the month of A)May with a wind speed of 1 m s-1and a wind direction of 190°, B)June with a wind speed of 1 m s-1 and a wind direction of 300°,C) August with a wind speed of 2 m s-1 and a wind direction of230°, D) October with a wind speed of 1 m s-1 and a winddirection of 50°, E) November with a wind speed of 1 m s-1 and awind direction of 50°, F) January with a wind speed of 1 m s-1
and a wind direction of 50°, and G) February with a wind speedof 2 m s-1 and a wind direction of 50°.
A
G
FED
CB
The Philippine Agricultural Scientist Vol. 96 No. 2 (June 2013)
Predicting Transport of Nutrients from Tributary Rivers Jacqueline E. Hilario and Teresita R. Perez

70
state. Further studies should therefore be carried out tofocus on the most affected areas shown in the simulatednutrient transport model: Laurel, Talisay, San Nicolas,Agoncillo, Mataas na Kahoy and Balete, to determineexcessive nutrient loading that would aggravate theworsening condition and further eutrophication of thelake. Out of 37 river inflows, only three rivers wereconsidered in this study. Other river inflows would haveto be monitored, although probably not all of these riversstill exist.
ACKNOWLEDGMENTS
The authors wish to thank Dr. Jonas P. Quilang, Dr. ReneN. Rollon, Dr. Edna Oconer and Dr. Ronnie Calugay foruseful information and comments. The authoracknowledges FISHSTRAT team (the EC-INCO-DCfunded project) and the Institute of Biology, Universityof the Philippines (UP-IB), the Philippine Council forAquatic and Marine Research and Development(PCAMRD) and the Bureau of Fish and AgriculturalResources (BFAR) for both technical and financialsupport that allowed the completion of this work. Wealso acknowledge the IFRS Laboratory of BFAR inAmbulong, Tanauan, Batangas for allowing us to usetheir laboratory in processing our samples.
REFERENCES CITED
[APHA] American Public Health Association, AmericanWaterworks Association and Water Pollution Federation.1989. Standard Methods for the Examination of Water andWastewater. 17th ed. Washington, D.C.: APHA. 1268 p.
AYPA SM, GALICIA JR AM, LAPASARAN ES. 1990. Acontribution to the biology of Harengula tawilis in TaalLake, Batangas. Paper presented during the 5th DA-BARNational Research Symposium. Quezon City, Philippines:Department of Agriculture. 31 p.
BELETSKY D. 2001. Modeling wind-driven circulation inLake Ladoga. Boreal Environ Res 6:307–316.
CASTILLO BB, GONZALES CL. 1976. Hydrology of TaalLake. Fisheries Resources Journal of the Philippines 1(2):62–75.
CHAPMAN D. 1996. Water Quality Assessment. 2nd ed.Cambridge: Great Britain at the University Press. 651 p.
FISHER NA. 1992. Volunteer Estuary Monitoring. A MethodsManual. Washington, D.C.: U. S. EnvironmentalProtection Agency (USEPA). 176 p.
HARGROVE TR. 1991. The Mysteries of Taal: A PhilippineVolcano and Lake, Her Sea Life and Lost Towns. Manila:Bookmark-Publishing. 204 p.
HARIBON FOUNDATION. 1986. List of different Lakes andReservoirs of the Philippines.
HURST HE. 1952. The Nile. London: Constable. 356 p.
KOUTITAS CG. 1988. Mathematical Models in CoastalEngineering. London: Pentech Press Limited. 357 p.
LEON LF, IMBERGER J, SMITH REH, HECKY RE, LAMDCL, SCHERTZER WM. 2005. Modeling as a tool fornutrient management in Lake Erie: A hydrodynamicsstudy. J Great Lakes Res 31 (Suppl. 2): 309–318.
MOSS B. 1988. Ecology of Freshwaters, Man and Medium. 2nd
ed. Melbourne, Australia: Blackwell ScientificPublications. 417 p.
E �D Z/�� EĂƟŽŶĂů� D ĂƉƉŝŶŐ� ĂŶĚ� ZĞƐŽƵƌĐĞ� /ŶĨŽƌŵĂƟŽŶ�Authority. 1997. Bathymetry Map.
[PAGASA] Philippine Atmospheric, Geophysical andAstronomical Services. 1996. Monthly summary report.Ambulong, Tanuan, Batangas Station.
[PHIVOLCS] Philippine Institute of Volcanology andSeismology. 1993. Undated. Operation Taal. PHIVOLCSPress. 29 p.
[PCTT] Presidential Commission on Tagaytay-Taal. 1993.Agriculture and Fisheries Program. Vol. 1. p. 21–24 and2.1.2 Fisheries, Vol. 4 p. 30–72 and 101–110. Manila:PCTT, Department of Tourism.
RIVERA PC. 1997. Hydrodynamics, Sediment Transport andLight Extinction Off Cape Bolinao, Philippines. [Ph.D.Dissertation]. The Netherlands: Wageningen AgriculturalUniversity and Institute for Infrastructural, Hydraulic andEnvironmental Engineering. 244 p.
SCHWAB JD, BELETSKY D, DePINTO J, DOLAN DM.2009. A hydrodynamic approach to modeling phosphorusdistribution in Lake Erie. J Great Lakes Res 35: 50–60.
TALLING JF, LEMOALLE J. 1998. Ecological Dynamics ofTropical Inland Waters. Melbourne, Australia: CambridgeUniversity Press. 441 p.
THOMANN RV, MUELLER JA. 1987. Principles of SurfaceWater Quality Modeling and Control. Harper and Row,Publishers Inc. 644 p.
WALLING DE. 1984. The sediment yields of African rivers.In: Walling DE, Webb BW, editors. Challenges in AfricanHydrology and Water Resources. Proceedings of theHarare Symposium; 1984 July; University of Exeter,Exeter, Devon, UK: IAHS Publ. No. 144.
WETZEL R, LIKENS G. 1991. Limnological Analyses. NewYork: Springer Verl. 391 p.
ZAFARALLA MT, SANTOS RAV, TORRETA NK,REGALADO MC, OROZCO RP. 1992. Influence onwater quality and phytoplankton community structure inTaal Lake. Fish Res J Philipp 17:75–91.
The Philippine Agricultural Scientist Vol. 96 No. 2 (June 2013)
Predicting Transport of Nutrients from Tributary Rivers Jacqueline E. Hilario and Teresita R. Perez
Copyright © 2022 FDOKUMEN