Predicting Stock Market Returns Based on the Content of Annual Report Narrative: A New Anomaly
36
Electronic copy available at: http://ssrn.com/abstract=2474061 Predicting Stock Market Returns Based on the Content of Annual Report Narrative: A New Anomaly Tomasz Piotr Wisniewski 1 University of Leicester School of Management Ken Edwards Building University Road Leicester LE1 7RH, UK Tel: +44 116 252 3958 E-mail: [email protected] Liafisu Sina Yekini Sheffield Hallam University Sheffield Business School City Campus Howard Street Sheffield S1 1WB, UK Tel: +44 114 225 5555 E-mail: [email protected] 1 Corresponding author.
-
Upload
independent -
Category
Documents
-
view
3 -
download
0
Transcript of Predicting Stock Market Returns Based on the Content of Annual Report Narrative: A New Anomaly
Electronic copy available at: http://ssrn.com/abstract=2474061
Predicting Stock Market Returns Based on the Content
of Annual Report Narrative: A New Anomaly
Tomasz Piotr Wisniewski1
University of Leicester
School of Management
Ken Edwards Building
University Road
Leicester LE1 7RH, UK
Tel: +44 116 252 3958
E-mail: [email protected]
Liafisu Sina Yekini
Sheffield Hallam University
Sheffield Business School
City Campus
Howard Street
Sheffield S1 1WB, UK
Tel: +44 114 225 5555
E-mail: [email protected]
1 Corresponding author.
Electronic copy available at: http://ssrn.com/abstract=2474061
2
Predicting Stock Market Returns Based on the Content
of Annual Report Narrative: A New Anomaly
Abstract
This paper uses the tools of computational linguistics to analyze the qualitative
part of the annual reports of UK listed companies. More specifically, the
frequency of words associated with praise, concreteness and activity is measured
and used to forecast future stock returns. We find that our language indicators
predict subsequent price increases, even after controlling for a wide range of
factors. Elevated values of the linguistic variables, however, are not
symptomatic of exacerbated risk. Consequently, investors are advised to peruse
the annual report narrative, as it contains valuable information that may still not
have been discounted in the prices.
JEL codes: M41; G12; G14
Keywords: Content Analysis, Annual Reports, Stock Market Returns

3
1. Introduction
Annual reports are published to fulfill the reporting requirements imposed on listed
companies and can be used by management to communicate with a variety of audiences
(Stanton and Stanton, 2002). Each report invariably comprises two components, namely the
unaudited narrative and the financial statements. The role that the disclosed accounting numbers
play in the context of capital markets has already been widely discussed in the extant literature
(see for instance Ball and Brown, 1968; Bhandari, 1988; Lev, 1989; Livnat and Zarowin, 1990;
Kothari, 2001; Chen and Zhang, 2007). The body of knowledge regarding the influence of
qualitative information incorporated in the annual reports is smaller, due to initial problems
related to the objective quantification of language. Early attempts at using automated systems to
analyze narrative accounting disclosures were made in the 1980s (Frazier et al., 1984) and the
technologies as well as the computer software have been progressively developing ever since.
The content analysis we employ in our study relies on computing frequencies of words falling
within predetermined tag categories. Each category is defined by its own dictionary including
words characterized by similar qualities or referring to the same theme. We subsequently try to
evaluate whether these word frequencies prognosticate future stock market returns.
More specifically, we focus our attention on expressions of praise, terms that can be
categorized as concrete and those that pertain to activity. We argue that companies that are
praiseworthy, deliver tangible outcomes and compete actively in the marketplace will be well
regarded by stock market investors. This paper demonstrates that these three linguistic gauges
can predict future one-year returns in ways that are both statistically and economically
significant. Our findings remain unaltered, even after we control for a range of company
characteristics and performance indicators. Interestingly, the increased values of these linguistic
measures should not be interpreted as risk contributors, as they are insignificantly and
negatively related to the overall return standard deviation and the level of idiosyncratic risk. The

4
most plausible interpretation of our results is that the markets are informationally inefficient and
that the price reaction to news is substantially delayed. To put it differently, we are observing a
stock market anomaly that could be potentially exploited by traders.
Arguably, the motivations for drafting the narrative may extend beyond providing new
material information. Annual reports can also be used to manage public impression (Neu et al.,
1998) or be deployed as a marketing tool (Stanton and Stanton, 2002). Furthermore, a number of
authors allude to the positivity bias frequently inherent in the reports (Hildebrandt and Snyder,
1981; Rutherford, 2005; Henry 2008). Indeed, listed companies may be tempted to present their
state of affairs in a favorable light, to entice new investors, consumers, and business partners.
Regulatory compliance may also be signaled, in order to appease the regulators. Even if such
practices are present, our paper shows that careful evaluation of the published narrative is a
worthwhile and possibly lucrative exercise.
In many respects, our paper can be differentiated from the wealth of the existing
scholarship. Firstly, we focus on UK data and, in doing so, we depart from the convention of the
existing content analysis papers in the finance and accounting domain, which have been
primarily preoccupied with the US. These markets are not necessarily alike, as the US has
adopted a rules-based approach to reporting, while the UK operates a principle-based system
(Nobes and Parker, 2008). The differential regulations may affect the manner in which corporate
communications are written. Secondly, previous literature has concentrated either on the tone of
the earnings press releases (Henry, 2008; Demers and Vega, 2010; Davis et al., 2012), media
reportage (Tetlock, 2007; Tetlock et al., 2008), Internet posts (Antweiler and Frank, 2004; Das
and Chen, 2007) or the president’s letter to shareholders (McConnell et al., 1986; Swales, 1988;
Abrahamson and Amir, 1996; Smith and Taffler, 2000). We analyze the text of the entire annual
report, excluding the financial statements section. These texts are substantially longer than the
documents examined previously, which allows for a more reliable identification of linguistic

5
style (Grimmer and Stewart, 2013: 6). Thirdly, instead of focusing on a market reaction in a
very short window surrounding the annual report disclosure date, we endeavor to make medium-
term return predictions. Last but not least, we recognize that annual reports are multifaceted
documents and therefore we attempt to measure several linguistic dimensions of the text. This
approach, as the paper will demonstrate, proves to be rather insightful.
The remainder of the paper is organized as follows. The next section reviews literature
related to the design and purpose of annual report narratives, as well as engages with the studies
applying methods of computational linguistics in the field of accounting and finance. Section 3
enumerates our data sources, elaborates on the variable construction and presents summary
statistics for our data. Section 4 reports our empirical results both on return predictability and on
whether the linguistic measures should be regarded as risk proxies. We end the paper with a set
of concluding comments.
2. Literature Review
2.1. Annual Report Narratives
While the process of drafting the annual report narrative is guided by a pre-existing set
of conventions and regulations, companies still retain a large degree of flexibility in terms of the
content and linguistic characteristics. The design of the text is a complex, purposeful and well-
considered process. Thomas (1997) points out that while the letters of the CEO and president
may be written by the undersigned, a robust consultation process is typically in place involving
the chief legal officer and the chief financial officer. While large segments of the report may be
prepared in-house, UK listed companies often resort to using external design agencies (Stanton

6
and Stanton, 2002). Consequently, many departments and individuals may partake in the
creation of the text, possibly with a common objective in mind.
The content of annual reports may vary substantially across different companies,
however due to regulatory constraints these reports tend to share common characteristics. The
narrative will typically open with the non-statutory and non-audited Chairman’s and CEO’s
statements. The Companies Act 2006 and the Companies Act 2006 (Strategic Report and
Directors’ Report) Regulations 2013 mandate large and medium quoted companies to include a
strategic report/business review section covering a description of company business, its
performance, principal risks, position, trends and factors, as well as financial and non-financial
key performance indicators (KPIs). It also obliges firms to report on environmental matters, the
company’s employees, social and community issues, all of which are typically addressed in a
corporate social responsibility statement, often compiled in accordance with the Global
Reporting Initiative Guidelines. Section 420 of the Companies Act states that quoted firms must
disclose directors’ remuneration report for each financial year, while section 415 refers to the
duty to prepare directors’ report. Guidance on these two sections is also provided in the UK
Corporate Governance Code. A typical annual report will also contain a statement of directors’
responsibilities, confirming that the directors adhered to sections 393, 394 and 396 (3) requiring
the preparation of true and fair accounts. Compliance with the provisions of the Act is
monitored by the Financial Reporting Review Panel that may try to persuade directors to
introduce voluntary corrections, or in extreme cases secure a court order. It is important to
realize that the Listing Rules force companies to either comply with the UK Corporate
Governance Code or explain why they have failed to do so. Just like the Code, the Disclosure
and Transparency Rules are also pertinent to the process of drafting the corporate governance
statements. In their study, PricewaterhouseCoopers (2009) notes that the “compliance mindset”
can often lead to the obfuscation of language in the reports.
7
Ultimately, annual reports are communication instruments through which a particular
viewpoint is presented. In their narratives, companies tend to highlight the positive aspects of
their performance (Bhana, 2009) and in cases where the financial results are favorable, the text
tends to be adorned with graphs (Beattie and Jones, 1992). Similarly, a fusion of pictures and
narratives has been becoming increasingly prevalent and has been frequently deployed as an
image management tool (Lee, 1994). While it may be important to understand what parts of the
report are highlighted and by what means, the act of deemphasizing information is equally
important. One may argue that omitted information can be viewed to be as relevant as that
which is included (Buhr, 1998; Stittle, 2002).
The functions of annual reports have been analyzed from various research perspectives.
One strand of the literature notes that the reports may have an impression management purpose,
with the text, graphs and photographs directing the reader towards a favorable interpretation of
corporate activities (see for instance McKinstry, 1996; Beattie et al., 2008; Clatworthy and
Jones, 2003). Consequently, a number of scholars argue that annual reports can be viewed as
marketing tools designed to build brands, as well as promote products and services to many
audiences (Dröge et al., 1990; Subramanian et al., 1993). A less common perspective is that
related to political economy, which recognizes political, economic and social tensions and
argues that annual reports are ideological instruments that represent specific interests (Burchell
et al., 1980; Cooper and Sherer, 1984; Guthrie and Parker, 1989). Companies may also try,
through the use of this particular communication medium, to legitimize their existence by
convincing society that their actions are in line with community objectives and values
(O’Donovan, 2002; Lanis and Richardson, 2013). Last but not least, annual reports can be
understood from the accountability perspective, which emphasizes legal aspects and argues that
these documents should be used by management to address the concerns of shareholders and

8
stakeholders (Coy et al., 2001; Hooks et al., 2001). An in-depth literature review provided by
Stanton and Stanton (2012) discusses the different theoretical viewpoints on the annual reports.
2.2. Content Analysis and Computational Linguistics in the Accounting and Finance Studies
The task of categorizing text documents or summarizing them using quantitative
measures may be neither straightforward nor easy to implement. Some authors have tried to
achieve these objectives using human judgment. For instance, Bhattacharya et al. (2009)
engaged in a painstaking exercise of reading over 170 thousand news items about Internet IPOs
in order to segregate them into good, bad and neutral news. While they find evidence of media
hype during the Internet bubble phase, this phenomenon was able to explain only a small
proportion of the realized price increases on Internet stocks. Smith and Taffler (1995) look at
whether it is possible to recognize companies which are about to go into receivership, voluntary
or compulsory liquidation simply by reading the chairman’s statement. In order to implement
this experiment they had to engage as many as 146 undergraduate students. Even though such
attempts are admirable, they are clearly time-consuming and probably unsuitable for our study
which tries to analyze 1,262 annual reports. Furthermore, they are problematic, as human
judgment can oftentimes be subjective (Davis et al., 2012: 848).
Recent advances in computational linguistics afford researchers the opportunity to utilize
computerized approaches to content analysis. Such approaches rely on a construction of
dictionaries that compile words with similar characteristics or meanings. For instance, a Praise
thesaurus may incorporate all vocabulary related to expressions of affirmation, esteem,
accolade, appreciation, or commendation. Subsequently, the frequency with which these words
occur in a particular text is measured, providing a reliable gauge of a certain semantic
dimension. A number of studies employ positiveness dictionaries and note that the tone implicit
9
in the US quarterly earnings press releases is related to the announcement period market
response (Henry, 2008; Demers and Vega, 2010; Davies et al., 2012). Demers and Vega (2010)
also document that managers’ language characterized by a lack of certainty is symptomatic of a
higher level of company-specific risk. In a similar spirit, Li (2008) shows that the
communications of companies with poor performance are longer and harder to read. Rogers et
al. (2011) warn managers against the misleading use of language in corporate communications
and note that whenever announcements with a positive tone coincide with insider selling there is
a real danger of shareholder litigation.
Another strand of research looked at the content of the presidents’ and chairmans’ letters
to the shareholders. McConnel et al. (1986) and Swales (1988) argue that the proportions of the
letter devoted to certain themes can be informative with regard to the stock market performance
of a company. The results presented in Abrahamson and Amir (1996) attest to the fact that the
negativity of the letter is inversely linked to both accounting-based performance measures and
returns. Lastly, by applying word-based and theme-based content analysis, Smith and Taffler
(2000) observe that such narratives can help to predict firm failure. While we find these studies
instructive to our own investigation, we would like to note that chairman’s letters in the UK are
typically one or two pages in length. We therefore decided to examine the entire narrative
included in the annual report, as the content analysis of longer texts can provide a more reliable
indication of style and language.
The last motif recurring in the literature that we choose to discuss here is the impact of
media reports. Tetlock (2007) measures the pessimism of the “Abreast of the Market” column in
the Wall Street Journal and shows that it temporarily predicts returns on the Dow Jones
Industrial Average and that extreme values of this indicator tend to be followed by high trading
volume. In a follow-up paper, Tetlock et al. (2008) find that the proportion of negative words in
firm-specific news stories predicts returns and earnings, particularly when these stories are

10
focused on fundamentals. Other researchers have taken a slightly different approach and looked
at the occurrence of very specific phrases in the news items. In their consideration of whether
real estate prices are justified, Case and Shiller (2003) plot the frequencies with which the terms
“housing bubble” and “housing boom” appeared in US newspapers and wire services.
Wisniewski and Lambe (2013) examine the frequencies of such phrases as “credit crunch”,
“financial crisis”, and “bank failures” in the English-language printed media and document that
they Granger-caused the falling valuations of the banking institutions. Consequently, they argue
that media reportage has characteristics akin to a self-fulfilling prophecy.
The extant literature provides guidance for our own study, which concentrates on the
entire narrative of annual reports published in the UK. In what follows we will employ a
computer-assisted approach to counting the frequencies of words falling into particular
categories – categories that appear to matter to financial markets. In doing so, we are able to
uncover a number of interesting regularities and predictable patterns.
3. Data
When compiling our dataset, our focus was on the constituents of the FTSE 350 index
operating outside the financial sector. Consequently, we had to eliminate 72 entities that were
involved in the provision of financial services and a number of companies with insufficient data
on annual reports and financial indicators. As a result of this screening process, we arrived at a
final sample of 209 firms, for which the annual reports were gathered from the corporate web
pages, Morningstar and Bloomberg. In the calculations that follow, we assume that the annual
report publication date is equivalent to either the Morningstar or Bloomberg date, whichever
came first. Several reports were omitted due to the fact that a 250 trading day window after the
announcement is needed to compute the subsequent investment returns. As a result, our dataset
incorporates a total of 1,262 annual reports disseminated between January 2006 and August

11
2012. A complete list of the companies with their corresponding number of observations is
presented in the appendix to this paper. It has to be noted at this stage that UK companies
typically issue this type of communications in PDF format, which necessitates a conversion of
files into text documents for our linguistic analysis. For this purpose, we employed Convert PDF
to Word Desktop Software, and whenever the files included text embedded within pictures, we
resorted to using an optical character recognition system called Smart OCR. Files were
examined for internal consistency and, whenever required, corrected manually.
To operationalize our linguistic analysis we utilized a text-analysis software called
Diction 6.0. By now, this software is well-established within the academic community, with
many studies relying on it as a content analysis method, particularly in the fields of political
science, communication and language analysis as well as in media studies. A full list of books
and academic articles that engage with Diction can be found on the software’s web page.2 In an
accounting context, Demers and Vega (2010) and Davis et al. (2012) use this particular software
package to evaluate the sentiment inherent in the US quarterly earnings press releases. The
primary function of Diction is to compute the frequencies of words falling within a
predetermined tag category within the analyzed text. It takes a 500-word segment to be its
textual norm and computes the frequency of words from a specific vocabulary list expressed as
an average per 500 word units of the text. Words with identical spelling, but different meanings,
are dealt with by the software via statistical weighting procedures.
Our empirical inquiry examines the tag categories labeled Praise, Concreteness and
Activity. Since we examine the returns over a period of about one calendar year following the
publication of each annual report, we have to assume that the markets will have the time
required to peruse the text from different angles and look at different semantic dimensions.
Consequently, we do not want to restrict our investigation to one aspect of the communication
2 Please see http://www.dictionsoftware.com/published-studies/.
12
and believe that a multi-dimensional approach is more suitable in this context. The first category
Praise is based on affirmations of different commendable qualities and includes words such as:
successful, intelligent, accountable, admirable or beneficial. If the narrative of annual reports is
veracious, one will expect that this measure will correlate positively with company performance.
Consequently, we hypothesize that there should be a positive association between investment
returns and our Praise variable.
The second measure Concreteness refers to the occurrence of words characterized by
tangibility and materiality. The related vocabulary on this list includes, for instance: payments,
factory, estate, savings, finance and scientist. One could expect that firms without any manifest
successes will be inclined to use vague statements that are not rooted in material reality.
Similarly, in the absence of a well-defined future strategy, the annual report narrative is likely to
make nebulous and impalpable references. Since the shareholders who commit their money to
the company expect material results, we postulate that the stock returns and our Concreteness
measure will tend to co-vary positively. In earlier research, Wisniewski and Moro (in press)
show that markets react unfavorably when political leaders make abstract, non-concrete
declarations. According to the dual coding theory developed by Paivio (1971), people can
process concrete words better because they can be easily visualized. Furthermore, by engaging
with those words both hemispheres of the brain are activated (Paivio, 1986; Binder et al., 2005).
It may therefore be argued that the concreteness of text is essential to effective communication
and any non-tangibility of expression may potentially suggest the existence of some hidden
motives.
Our last linguistic gauge Activity is a composite construct aggregating several linguistic
categories. Diction converted the frequency of words in each of the categories into z-scores to
make sure that each of the components is of equal importance in the aggregation process. The
software also linearly scaled the resultant measure by adding a constant of 50 to each of the
13
observations in order to avoid negative entries. On the one hand, Activity increases with the
usage of words falling into the categories of aggression, accomplishment, communication and
motion. On the other hand, the z-scores of categories representing cognitive terms, passivity and
embellishment are deducted from the Activity indicator. To illustrate, words such as completion,
launch, achieving or strengthens will increase the value of Activity, while shutdown, standstills,
constrained and puzzled will lead to its decrease. Corporations that operate in the contemporary
dynamic business environment cannot afford prolonged periods of inactivity and need to
continuously adjust to the changing market conditions. Firms failing to vigorously compete in
the marketplace will ultimately perish. It may therefore be reasonable to postulate that investing
in active firms could deliver greater rewards to the shareholders.
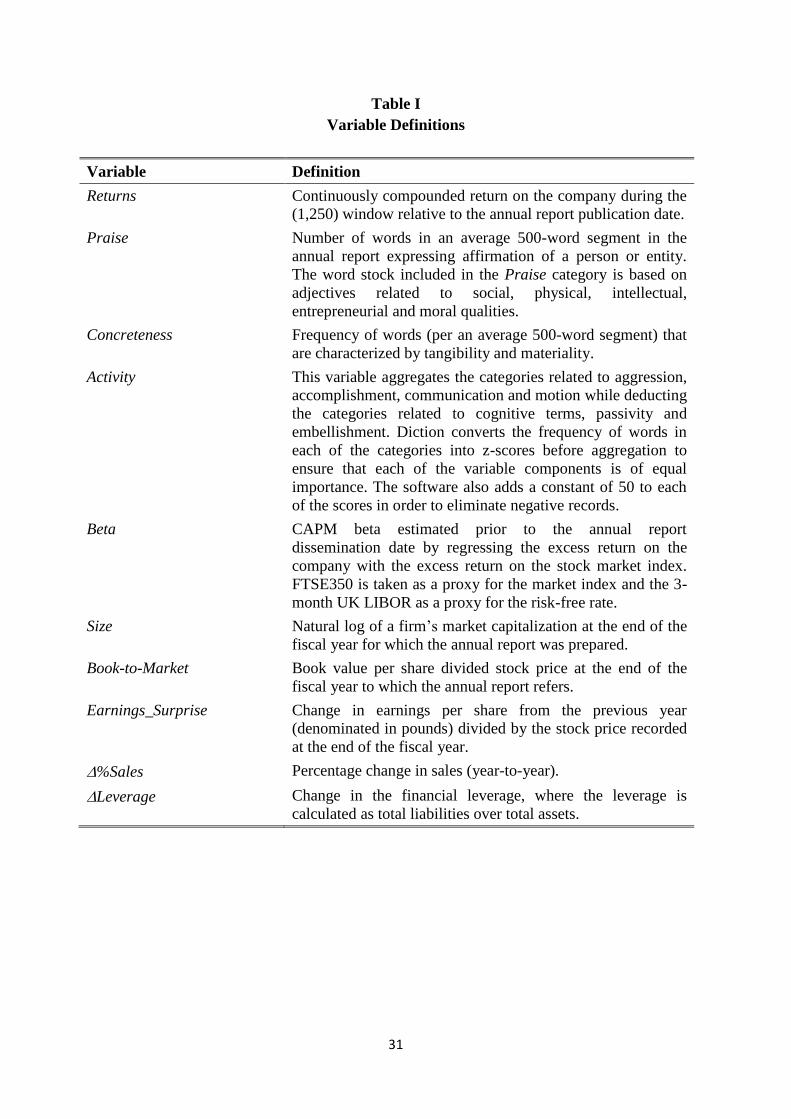
[Table I about here]
Table I summarizes the construction of our linguistic measures and the control variables
used in our study. We try to account for firm-specific characteristics, as well as the financial
figures disclosed simultaneously with the annual report narrative. Firstly, we rely on the insights
of the Capital Asset Pricing Model (CAPM) developed by Sharpe (1964), Lintner (1965) and
Mossin (1966) and include security’s beta as one of the explanatory variables in our regressions.
It needs to be noted that the empirical performance of CAPM has been questioned (see for
instance Fama and French, 1996) and additional variables may be needed to explain the cross-
sectional variation in security returns. Banz (1981) has shown that the size of the company is a
predictor of its returns, which is unsurprising considering that small capitalization stocks are
riskier, more strongly affected by illiquidity and subject to higher transaction costs (Lesmond et
al., 1999; Shumway, 2001; Amihud, 2002). Furthermore, Rosenberg et al. (1985) documents
that firms with higher book-to-market ratios generate greater rewards to investors on average.
These discoveries led to a development of the three-factor Fama-French model (Fama and
French, 1993) which is helpful in the context of our inquiry. In light of this previous evidence,

14
we incorporate the natural logarithm of stock market capitalization (Size) and Book-to-Market
ratio as explanatory variables in the return regressions.
Firms present their annual financial statements concurrently with the annual report
narrative. Disentangling the influence of the narrative from that of the accounting numbers
necessitates controlling for financial performance indicators in the predictive regressions. To
this end, we construct a variable Earnings_Surprise, which measures an increase in earnings per
share relative to a random walk forecast, scaled by the share price. Several comments need to be
made regarding this construction approach. Firstly, one cannot simply compute the percentage
increase in earnings, as the figure from the previous period may have been negative. For this
reason the consistently non-negative price appears in the denominator. Such scaling is consistent
with Easton and Zmijewski (1989), Bartov et al. (2002) and Brown and Caylor (2005).
Secondly, the choice of the benchmark for earnings performance is dictated by data availability.
However, it is by no means inferior, as Hughes and Ricks (1987) observe that analyst forecast
errors do not dominate a seasonal random walk earnings forecast in terms of correlation with
excess returns. Several earlier studies have used an earnings surprise measure identical to ours
(see for instance Wisniewski (2004) and Sponholtz (2008)). Furthermore, we control for the
percentage growth in sales (%Sales), as investors may appreciate companies that expand and
strive to increase their market share. Last but not least, we utilize a change in financial leverage
(Leverage), defined as the total liabilities over total assets. This indicator measures the extent
of financial risk that may be associated with the likelihood of bankruptcy. One would expect
that investors would be compensated for taking on additional risk with more generous stock
returns.
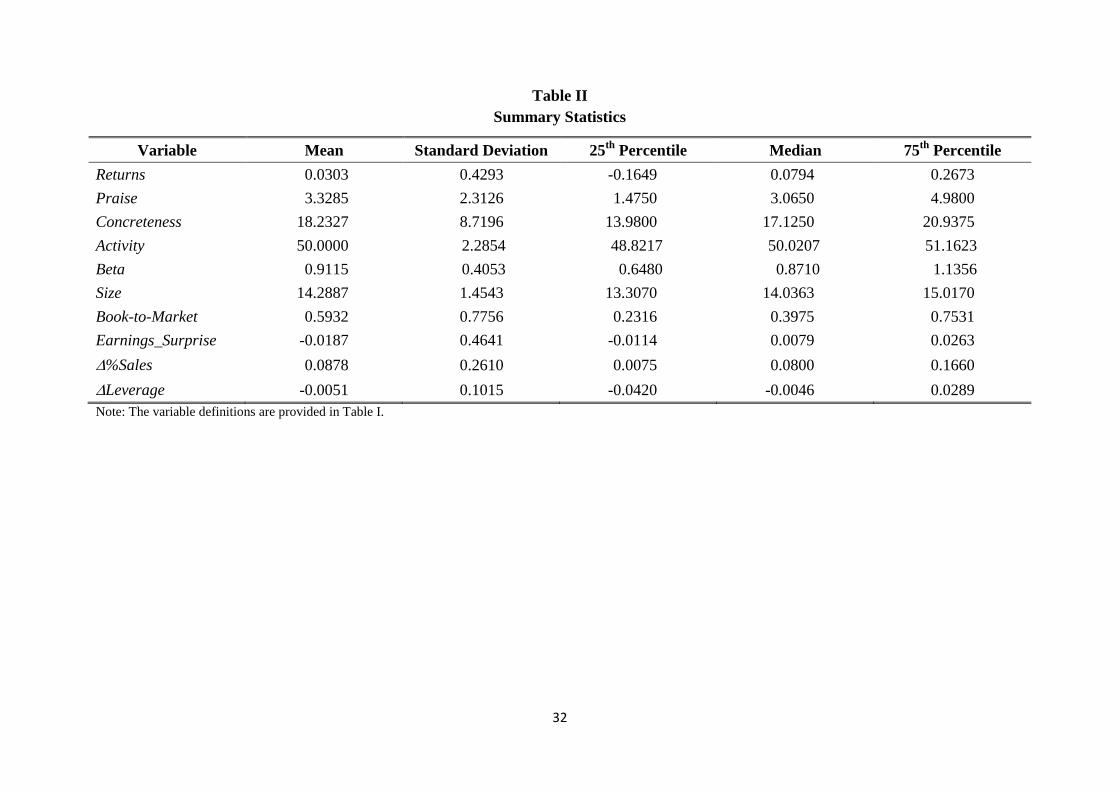
[Table II about here]
15
Table II presents the summary statistics for the variables used in our study. About 0.67%
of words in the narratives of annual reports coincides with our Praise thesaurus. Concrete
words, on the other hand, account for 3.65% of the text. The Activity variable has, by
construction, a mean of 50. When evaluating a representative company in our sample, we
discover that it has a beta of 0.91 and its market price exceeds its book value by about 69%. The
earnings, on average, were declining, which is unsurprising considering that the period covered
fell between 2006 and 2012. This time interval coincides with the credit crunch and prolonged
economic stagnation. Companies, however, managed to maintain decent sales dynamics,
perhaps at the cost of decreasing profit margins. The negative mean of Leverage indicates that
firms were decreasing their reliance on debt, and were perhaps forced to do so by the
circumstances surrounding the credit crunch.
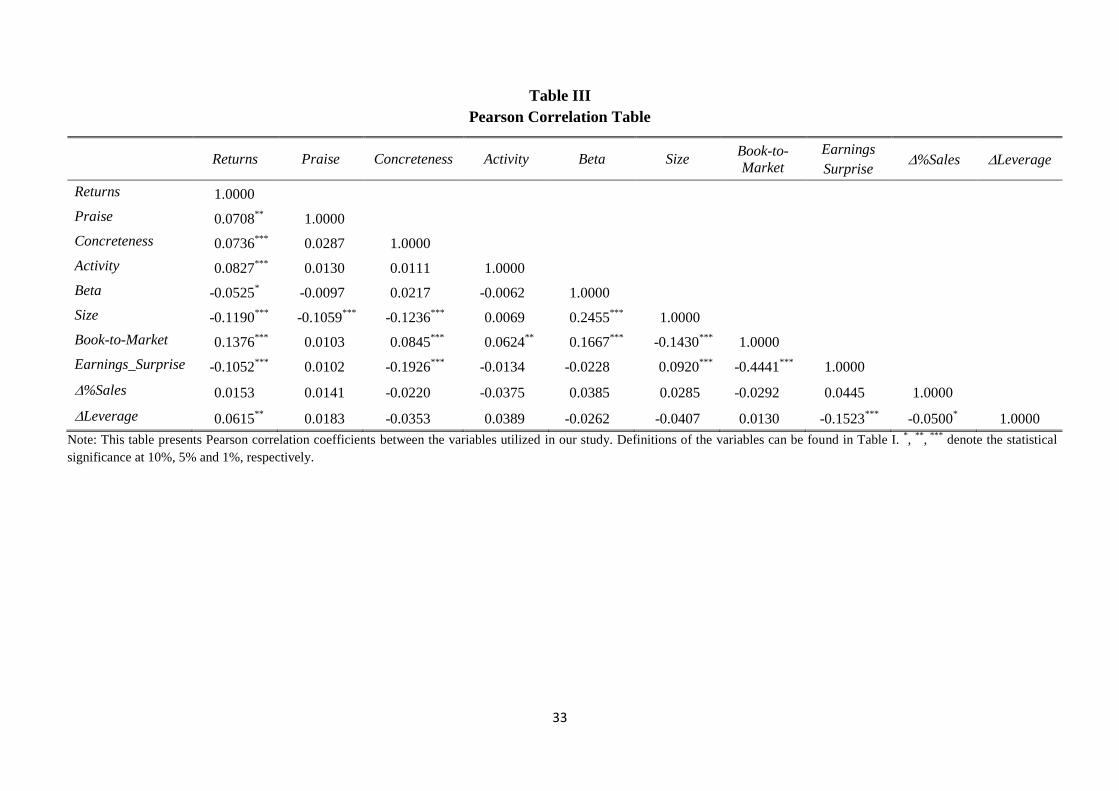
[Table III about here]
Pearson correlation coefficients between the variables together with their significance
levels are reported in Table III. The most important observation is that all of our content
analysis-based indicators have strong associations with future returns that cohere with our a
priori expectations. Praise increases the future returns of the company, indicating that the
narratives do not merely include empty platitudes, but rather convey information that is material
in nature. Similarly, investors tend to appreciate concrete language referring to tangible
considerations and outcomes. Vague and abstract statements may be perceived as a strategy
designed to create a smokescreen behind which the management tries to hide. Companies that
take an active approach to competing in the markets also enjoy higher returns on their stock.
Another conclusion that can arise when evaluating Table III is that the correlations between our
independent variables are reasonably low and the problem of multicollinearity is unlikely to
occur. In the presence of strongly associated regressors, the standard errors of the regression
16
parameter estimates will be inflated. We have computed variance inflation factors (VIFs) for all
of the regressions reported in our paper. Chatterjee and Price (1991) argue that VIFs in excess of
10 are symptomatic of a multicollinearity problem, however the highest VIF recorded in our
specifications is 1.58, alleviating any concerns regarding this issue.
4. Results
4.1. Predicting Future Returns
Prior research measuring the influence of tone inherent in US earnings press releases on
stock returns focused on short, typically 3-day, event windows (Henry, 2008; Davis et al.,
2012). Our objective is distinct from that of those previous studies and, instead of measuring the
immediate price reaction, we intend to assess the predictive power of textual characteristics over
a longer horizon. In our calculations we assume that the investor will be able to analyze the
report using the content analysis software and, should the indications be positive, place a buy
order at close of the day on which the report was disseminated. We look at the cumulative raw
continuously compounded return over a period of about one year (250 trading days), as the
annual reports are, as the name indicates, published annually. Extending this window will lead
to an overlap between observations, causing a range of potential econometric problems. In light
of the abovementioned considerations, the final investment horizon considered here is
equivalent to a (1,250) period, where Day 0 is defined as the first dissemination date of the
report.
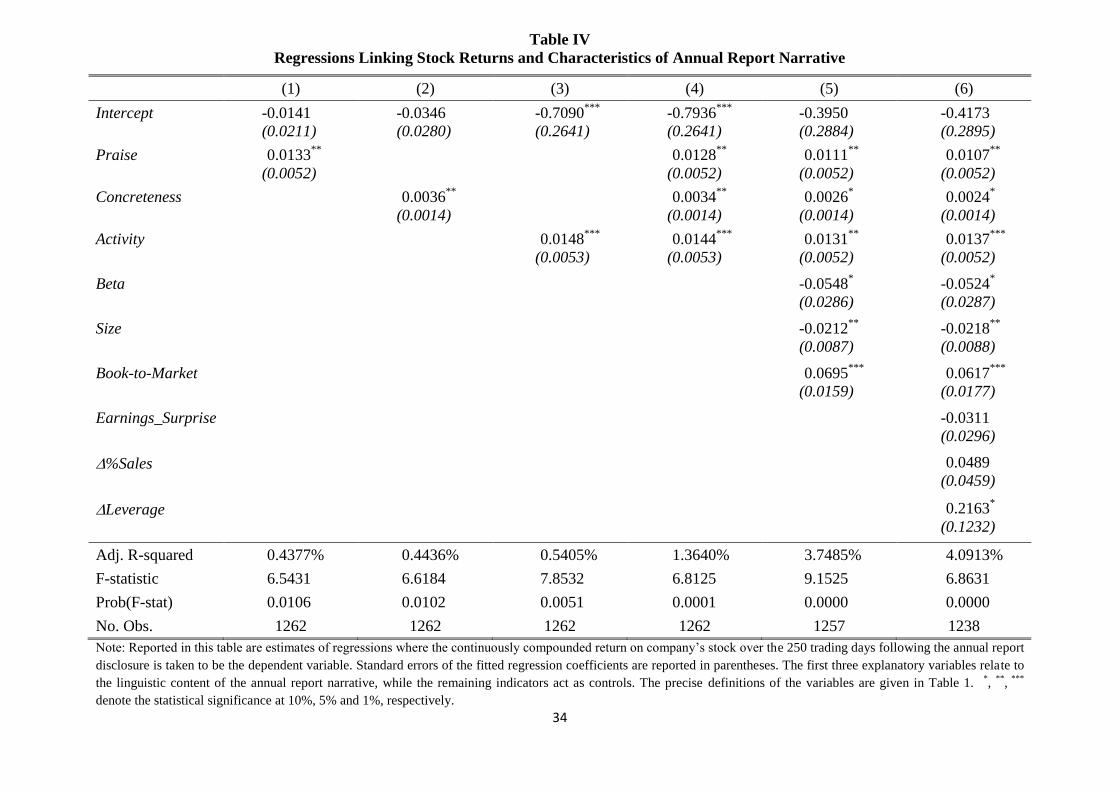
[Table IV about here]
Table IV presents results for regressions linking the firms’ returns to the linguistic
features of their annual reports and additional controls. Firstly, and perhaps most importantly, all
of our lexical variables exert a statistically significant influence, regardless of whether they are

17
considered jointly or individually. These results indicate that investors prefer companies that are
praise-worthy, communicate with the external world in a concrete way and are active in
pursuing their mission. What is more, these findings are a potential violation of the Efficient
Market Hypothesis of Fama (1970). The numerical values of the linguistic indicators can be
used to predict future returns, which should not be possible in efficient markets unless increases
in those indicators are associated with a higher degree of risk. For this anomaly to be eliminated
from the market, investors would have to employ content analysis immediately after the report is
published or, at the very least, read the document very carefully. However, obtaining a copy of a
content analysis software requires paying a fee3, while perusing documents that are sometimes
several hundred pages in length during a short period of time is a rather formidable task.
Regardless of the practical difficulties, investors are advised to engage in these activities, as they
may be potentially lucrative. According to the regression estimates, increasing the Praise
indicator by the value of its one standard deviation raises returns over the next year by between
2.47% and 3.08%. An impact range for the Concreteness variable, computed in the same way, is
2.09%-3.14%, while that for Activity is between 2.99% and 3.38%. These estimates are in
excess of typical transaction costs in the market, making the analysis of annual report narratives
a worthwhile exercise.
The estimated coefficients on Size and Book-to-Market confirm the earlier findings of
Banz (1981), Rosenberg et al. (1985) and Fama and French (1993). Large companies, which are
perceived as more stable, diversified and liquid, command a lower risk premium. On the other
hand, companies with a high book-to-market ratio earn higher returns, either because of risk
compensation, or due to a correction of market undervaluation. The negative and statistically
significant coefficient on Beta mirrors the empirical failure of the Capital Asset Pricing Model,
which has been previously noted by Fama and French (1996). Perhaps this failure is associated
3 These fees are not necessarily prohibitive. At the time of writing this paper, Diction was priced at USD 219 per
copy for educational use and USD 269 for corporate use.
18
with the fact that for much of the period considered here the stock market underperformed the
risk-free asset, which can be attributed to the occurrence of the credit crunch and the European
sovereign debt crisis. Consequently, stocks with high exposure to the market variation produced
an inferior performance, which is opposite to the theoretical predictions of CAPM.
With regard to our accounting controls, the earnings surprise and growth in sales do not
contribute substantially to the explanatory power of our empirical model. These numbers may
be imprecise due to creative accounting/earnings management practices (Healy and Wahlen,
1999). What is more relevant in our context, however, is that these numbers are stale. The
figures reported in the annual reports can be to a large extent predicted based on the quarterly
earnings announcements made earlier. Consequently, the financial sections contained in the
annual reports rarely include significant new information. The only variable that is important
from a statistical point of view is the change in financial leverage. The elevated returns to
companies increasing their gearing can be viewed as a risk premium, rather than a reaction to
news.
While the linguistic measures are significant in all of the regressions, regardless of
whether we use t-tests for individual variables or the F-test for joint significance, the proportion
of the regressant variance explained by the empirical specifications remains relatively low. For
the model including all of our explanatory and control variables, the adjusted R-squared slightly
exceeds 4%. This finding can be easily rationalized in light of the existing literature. It is a well-
established empirical fact that stock prices change too much and according to Shiller (1981)
their volatility is five to fifteen times higher than that implied by a fundamental dividend
discount model. Some evidence presented by the accounting scholars also indicates that the
relationship between accounting numbers and returns is weak and unstable (see Lev, 1989) who
provides a literature review on this topic). Most importantly, we want to note that we are not
trying to explain contemporaneous returns, but rather engage in an act of prediction. Reliable
19
predictions of future stock price movements remain a holy grail for financial economists and
practitioners, with generous material rewards being available to anyone who manages to
accomplish this goal. Consequently, forecasting even a moderate fraction of the movements in
the dependent variable can be considered a meaningful success. At the same time, these
considerations underscore the fact that stock market investments are inherently risky ventures,
characterized by a multiplicity of possible future outcomes.
4.2. Can the Linguistic Variables be Viewed as Risk Proxies?
While it is the case that large values of the indices derived from the content analysis are
prognostic of stock price increases, these increases may potentially represent a compensation for
risk. In this section, we endeavor to examine whether the lexical measures can be interpreted as
risk factors. To this end, we try to link these measures with the standard deviation of daily
returns in the (1,250) period that proxies for the amount of a company’s total risk. In a separate
set of models, we also assess if large values of the linguistic variables lead to elevated levels of
idiosyncratic volatility, which is defined here as the standard deviation of the residuals from the
CAPM regression. This regression links daily returns on a company in excess of the daily
equivalent of the 3-month UK interbank interest rate to the excess returns on the FTSE 350
index. The text of an annual report is essentially unique for each particular company, which
warrants the investigation of the company-specific component of risk.
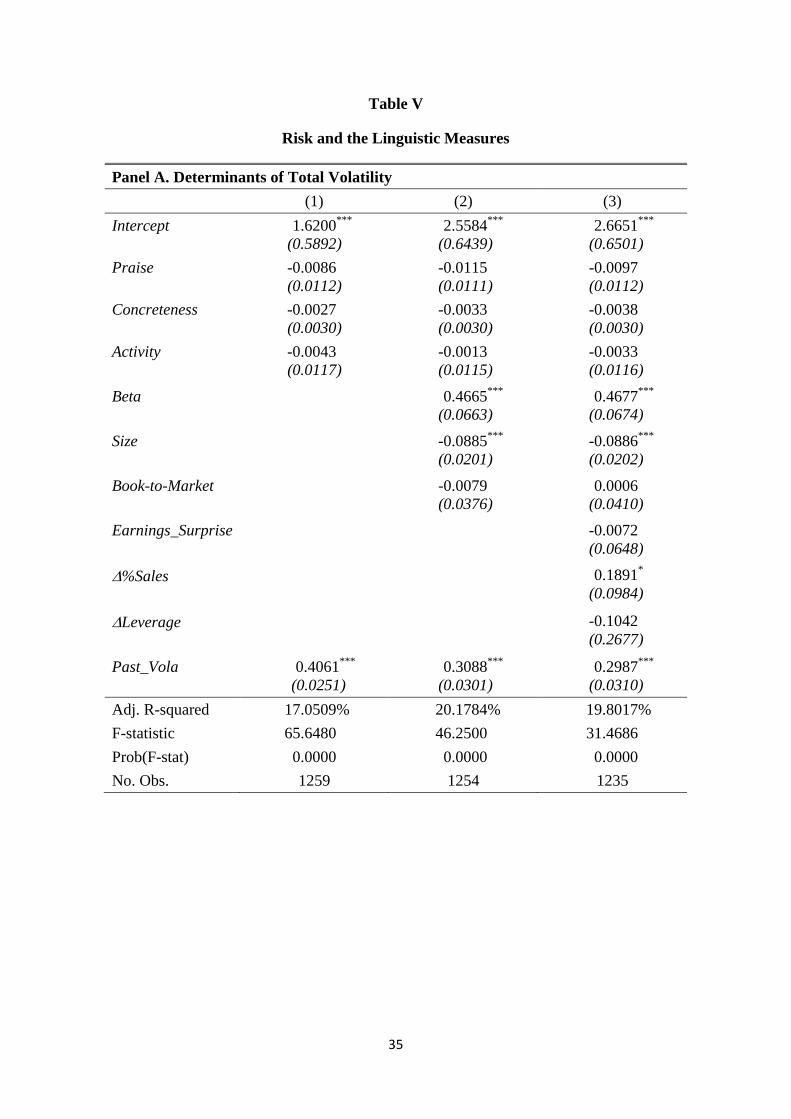
[Table V about here]
Panel A in Table V reports the results of the specifications where total risk is taken to be
the dependent variable. The regressors are identical to those used in the return regressions, with
one notable exception. We also add the standard deviation of daily returns in the 250-day period
preceding the annual report disclosure date (Past_Vola). This has been done in order to take into
account the well-known phenomenon of volatility clustering in the financial time series, which
20
was first noted by Mandelbrot (1963) and subsequently formalized by Engle (1982) and
Bollerslev (1986). Panel B of Table V models idiosyncratic volatility and uses historical
company-specific volatility (Past_Idio_Vola) as one of the regressors. It also omits the beta as
an explanatory factor, as by definition diversifiable risk is independent of beta.
The key observation that can be made is that Praise, Concreteness and Activity always
bear a negative coefficient regardless of the specification and the definition of risk. This means
that these indicators insignificantly reduce both the total and the diversifiable risk of firms.
Consequently, we find no evidence to support the assertion that the predictable returns reported
in the previous section are a manifestation of risk premium. Instead, the forecastability should
be interpreted as a stock market anomaly and a violation of market efficiency. This, in turn, has
important ramifications for stock market investors, their trading strategies and the importance
one should attach to carefully reading the annual reports.
Unsurprisingly, high beta is found to magnify the amount of total risk, while the prices
of large capitalization stock are more stable. Firms aggressively pursuing expansion in sales
generate more uncertainty for shareholders. Perhaps the sole pre-occupation with increasing the
market share can generate a possible retaliative action on the part of the competitors and have
implications for the legal position of the company, as well as the quality and pricing of its
products. Finally, volatility is not an integrated process as the coefficients on Past_Vola and
Past_Idio_Vola are significantly smaller than unity. The values of the adjusted R-squared
coefficients indicate that about one-fifth of the variation in the dependent variables is explained
by the regressions.
5. Conclusions
The aim of this paper was to evaluate whether linguistic characteristics of the narratives
published in the annual reports of UK listed companies can predict future one-year returns. In

21
evaluating these texts we resort to using tools of content analysis. More specifically, we measure
the frequencies of words that are associated with praise, concreteness and activity. We show that
the prevalence of these words is positively associated with future price changes, even after
controlling for a range of company-specific characteristics and accounting variables. Increasing
individually any one of the three observed frequencies by a magnitude of one standard deviation
raises the future return somewhere in the neighborhood of 2.09% to 3.38%. This attests to the
fact that the phenomenon we discovered is not only statistically but also economically
significant.
One may suspect that these linguistic measures are correlated with the uncertainty level
and that the elevated returns represent simply a manifestation of a risk premium. However, we
document empirically that there is no solid basis for such an assertion. In fact, an increase in all
of our linguistic measures decreases insignificantly both the magnitude of the total and
idiosyncratic risk. This leads us to conclude that the regularities observed here amount to a stock
market anomaly and are a violation of the efficient market hypothesis. While this may be the
case, this conclusion is neither astounding nor unexpected. The narratives in annual reports are
lengthy and highly complex texts. Unless the investors use computerized methods of evaluation,
perusal and assessment of these documents across many dimensions can turn into an extremely
protracted exercise. It is therefore not particularly startling to observe that markets require time
to digest this large volume of sophisticated information.
Our findings have important ramifications for stock market participants. It seems that the
annual report narrative incorporates important information that is not instantly discounted in
stock prices. There could be potential material rewards for those who analyze these texts and
adjust their trading strategies accordingly. As long as the annual report can be easily converted
into a text file, the automated assessment of the text is neither time-consuming, nor particularly
costly. We therefore recommend that investors either familiarize themselves with those

22
documents or use appropriate software to obtain summary statistics on them. A word of caution
is necessary at this stage however. Scholars have established that after an anomaly is discovered
and market participants start to trade on it, the anomalies become annihilated (Schwert, 2003;
Macquering et al., 2006). In other words, if investors start to follow our advice en masse, the
price will adjust instantly in response to annual report publication and future return
predictability will disappear.

23
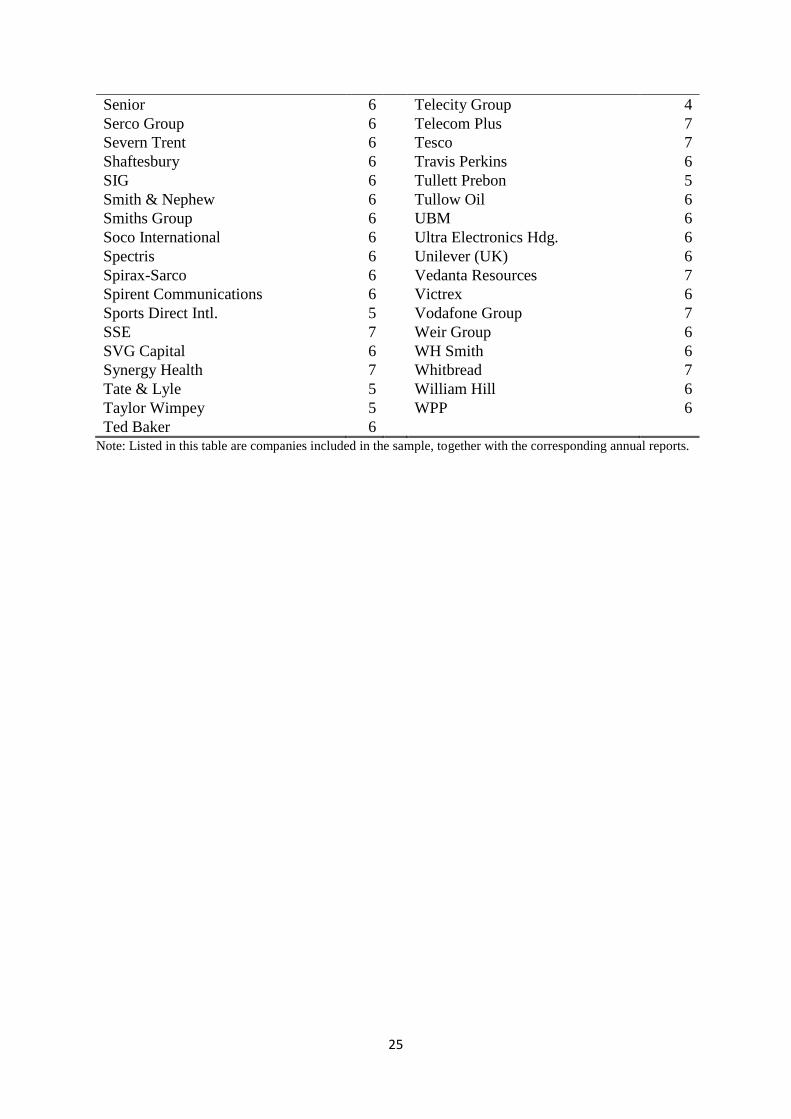
Appendix
Companies with the Corresponding Number of Annual Reports Included in the Sample
3i Group 7
Capita 6
3i Infrastructure 5
Carillion 6
Admiral Group 6
Carnival 6
Amec 6
Carpetright 7
Amlin 6
Catlin Group 6
Anglo American 6
Centrica 6
Antofagasta 6
Close Brothers Group 6
ARM Holdings 6
Cobham 6
Ashmore Group 5
Colt Group 6
Ashtead Group 7
Compass Group 6
Associated Brit.Foods 6
Computacenter 6
Astrazeneca 6
CRH 6
Aveva Group 7
Croda International 6
Aviva 6
CSR 6
Babcock Intl. 7
Daejan Holdings 7
BAE Systems 6
Dairy Crest 7
Balfour Beatty 6
De La Rue 7
Barratt Developments 6
Debenhams 5
BBA Aviation 6
Dechra Pharmaceuticals 6
Beazley 6
Diageo 5
Bellway 6
Dialight 6
Berendsen 6
Diploma 5
Berkeley Group Hdg.(The) 7
Dixons Retail 7
BG Group 6
Domino Printing Sciences 6
BHP Billiton 6
Drax Group 6
Big Yellow Group 7
Dunelm Group 5
Blackrock World Mng. 4
Electrocomp. 7
Bodycote 6
Elementis 6
Booker Group 6
Eurasian Natres.Corp. 4
Bovis Homes Group 6
Experian 5
BP 6
Fenner 6
Brewin Dolphin 6
Ferrexpo 5
British American Tobacco 6
Fidessa Group 6
British Land 7
First Group 7
British Sky Bcast.Group 6
Fresnillo 4
Britvic 6
G4S 6
BT Group 7
Galliford Try 6
BTG 7
Genus 6
Bunzl 6
GKN 6
Burberry Group 7
Glaxosmithkline 6
Bwin Party Digital Entm. 6
Glencore Xstrata 1
Cable & Wireless Comms. 7
Go-Ahead Group 6

24
Grainger 6
Menzies (John) 6
Great Portland Estates 7
Michael Page Intl. 6
Greene King 7
Millennium & Cpth.Htls. 6
Greggs 6
Mitchells & Butlers 6
Halfords Group 7
Mitie Group 7
Halma 7
Mondi 4
Hammerson 6
National Express 6
Hansteen Holdings 6
National Grid 7
Hargreaves Lansdown 4
Next 7
Hays 6
Oxford Instruments 7
Henderson Group 6
Paragon Gp.Of Cos. 6
HICL Infrastructure 6
Paypoint 6
Hikma Pharmaceuticals 6
Pearson 6
Hiscox 6
Pennon Group 7
Hochschild Mining 5
Persimmon 5
Home Retail Group 6
Petrofac 6
Homeserve 7
Phoenix Group Hdg. (Lon) 2
Howden Joinery Gp. 6
Polar Capital Tech.Tst. 7
Hunting 6
Premier Farnell 7
ICAP 7
PZ Cussons 7
Ictl.Htls.Gp. 6
Qinetiq Group 6
IG Group Holdings 6
Randgold Resources 6
IMI 6
Rank Group 5
Imperial Tobacco Gp. 6
Rathbone Brothers 6
Inchcape 6
Reckitt Benckiser Group 6
Informa 6
Redrow 6
Inmarsat 6
Reed Elsevier 6
Intermediate Capital Gp. 7
Regus 6
Interserve 6
Renishaw 7
Intertek Group 6
Rentokil Initial 6
Invensys 7
Resolution 3
IP Group 6
Restaurant Group 6
ITE Group 6
Rexam 6
ITV 5
Rightmove 6
Jardine Lloyd Thompson 6
Rio Tinto 6
Kazakhmys 6
RIT Capital Partners 7
Kcom Group 7
Rotork 6
Kenmare Res. (Lon) 6
RPC Group 7
Kier Group 6
RPS Group 6
Kingfisher 7
Sabmiller 7
Ladbrokes 6
Sage Group 6
Lonmin 6
Salamander Energy 5
MAN Group 7
Savills 6
Marks & Spencer Group 7
Schroders 6
Meggitt 6
Segro 6
25
Senior 6
Telecity Group 4
Serco Group 6
Telecom Plus 7
Severn Trent 6
Tesco 7
Shaftesbury 6
Travis Perkins 6
SIG 6
Tullett Prebon 5
Smith & Nephew 6
Tullow Oil 6
Smiths Group 6
UBM 6
Soco International 6
Ultra Electronics Hdg. 6
Spectris 6
Unilever (UK) 6
Spirax-Sarco 6
Vedanta Resources 7
Spirent Communications 6
Victrex 6
Sports Direct Intl. 5
Vodafone Group 7
SSE 7
Weir Group 6
SVG Capital 6
WH Smith 6
Synergy Health 7
Whitbread 7
Tate & Lyle 5
William Hill 6
Taylor Wimpey 5
WPP 6
Ted Baker 6
Note: Listed in this table are companies included in the sample, together with the corresponding annual reports.

26
References
Abrahamson, E. & Amir, E. (1996). The information content of the presidents letter to
shareholders, Journal of Business Finance & Accounting 23 (8), pp. 1157-1182.
Amihud, Y. (2002). Illiquidity and stock returns: cross-section and time-series effects, Journal
of Financial Markets 5 (1), pp. 31-56.
Antweiler, W. & Frank, M.Z. (2004). Is all that talk just noise? The information content of
internet stock message boards, Journal of Finance 59 (3), pp. 1259-1294.
Ball, R. & Brown, P. (1968). An empirical evaluation of accounting income numbers, Journal of
Accounting Research 6 (2), pp. 159-178.
Banz, R.W. (1981). The relationship between return and market value of common stocks,
Journal of Financial Economics 9 (1), pp. 3-18.
Bartov, E., Givoly, D. & Hayn, C. (2002). The rewards to meeting or beating earnings
expectations, Journal of Accounting and Economics, 33 (2), pp. 173-204.
Beattie, V. & Jones, M. J. (1992). The use and abuse of graphs in annual reports: Theoretical
framework and empirical studies, Accounting and Business Research 22 (88), pp. 291-303.
Beattie, V., Dhanani, A. & Jones, M. J. (2008). Investigating presentational change in U.K.
annual reports, International Journal of Business Communications 45 (2), pp. 181-222.
Bhana, N. (2009). The chairman’s statements and annual reports: Are they reporting the same
company performance to investors?, Investment Analysts Journal 70, pp. 32-46.
Bhandari, L.C. (1988). Debt/equity ratio and expected common stock returns: Empirical
evidence, Journal of Finance 43 (2), pp. 507-528.
Bhattacharya, U., Galpin, N., Ray, R. & Yu, X. (2009). The role of the media in the Internet IPO
bubble, Journal of Financial and Quantitative Analysis 44 (2), pp. 657-682.
Binder, J. R., Westbury, C. F., McKieran, K. A., Possing, E. T. & Medler, D. A. (2005). Distinct
brain systems for processing concrete and abstract concepts, Journal of Cognitive Neuroscience
17(6), pp. 905-917.
Bollerslev, T. (1986). Generalized autoregressive conditional heteroskedasticity, Journal of
Econometrics 31 (3), pp. 307-327.
Brown, L.D. & Caylor, M.L. (2005). A temporal analysis of quarterly earnings thresholds:
Propensities and valuation consequences, Accounting Review 80 (2), pp. 423-440.
Buhr, N. (1998). Environmental performance, legislation and annual report disclosure: The case
of acid rain and Falconbridge, Accounting, Auditing & Accountability Journal 11 (2), pp. 163-
190.
27
Burchell, S., Clubb, C., Hopwood, A. & Hughes, J. (1980). The roles of accounting in
organizations and society, Accounting, Organizations and Society 5 (1), pp. 5-27.
Case, K.E. & Shiller, R.J. (2003). Is there a bubble in the housing market?, Brooking Papers on
Economic Activity 2, pp. 299-362.
Chatterjee, S. and Price, B. (1991). Regression diagnostics, John Wiley, New York.
Chen, P. & Zhang, G. (2007). How do accounting variables explain stock price movements?
Theory and evidence, Journal of Accounting and Economics 43 (2-3), pp. 219-244.
Clatworty, M. & Jones, M. J. (2003). Financial reporting of good news and bad news: Evidence
from accounting narratives, Accounting and Business Research 33 (3), pp. 171-185.
Cooper, D.J. & Sherer, M.J. (1984). The value of corporate accounting reports: Arguments for a
political economy of accounting, Accounting, Organizations and Society 9 (3-4), pp. 207-232.
Coy, D., Fischer, M. & Gordon, T. (2001). Public Accountability: A new paradigm for college
and university annual reports, Critical Perspectives on Accounting 12 (1), pp. 1-31.
Das, S.R. & Chen, M.Y. (2007). Yahoo! for Amazon: Sentiment extraction from small talk on
the Web. Management Science 53 (9), pp. 1375–1388.
Davis, A.K., Piger, J.M. & Sedor, L.M. (2012). Beyond the numbers: Measuring the information
content of earnings press release language, Contemporary Accounting Research 29(3), pp. 845-
868.
Demers, E. & Vega, C. (2010). Soft information in earnings announcements: News or noise?,
INSEAD Faculty & Research Working Paper 2010/33/AC.
Dröge, C., Germain, R. & Halstead, D. (1990). A note on marketing and the corporate annual
report: 1930-1950, Journal of the Academy of Marketing Science 18 (4), pp. 355-364.
Easton, P.D. & Zmijewski, M.E. (1989). Cross-sectional variation in the stock market response
to accounting earnings announcements, Journal of Accounting and Economics, 11 (2-3), pp.
117-141.
Engle, R.F. (1982). Autoregressive conditional heteroscedasticity with estimates of the variance
of United Kingdom inflation, Econometrica 50 (4), pp. 987-1008.
Fama, E.F. (1970). Efficient capital markets: A review of theory and empirical work, Journal of
Finance 25 (2), pp. 383-417.
Fama, E.F. & French, K.R. (1993). Common risk factors in the returns on stocks and bonds,
Journal of Financial Economics 33 (1), pp. 3-56.
Fama, E.F. & French, K.R. (1996). The CAPM is wanted, dead or alive, Journal of Finance 51
(5), pp. 1947-1958.
Frazier, K. B., Ingram, R.W. & Tennyson, B.M. (1984). A methodology for the analysis of
narrative accounting disclosures, Journal of Accounting Research 22 (1), 318-331.
Grimmer, J. & Steward, B.M. (2013). Text as data: The promise and pitfalls of automated
content analysis methods for political texts, Political Analysis 21 (3), pp. 1-31.

28
Guthrie, J. & Parker, L.D. (1989). Corporate social reporting: A rebuttal of legitimacy theory,
Accounting and Business Research 19 (76), pp. 343-352.
Healy, P.M. & Wahlen, J.M. (1999). A Review of the Earnings Management Literature and Its
Implications for Standard Setting, Accounting Horizons 13 (4), pp. 365-383.
Henry, E. (2008). Are investors influenced by how earnings press releases are written?, Journal
of Business Communication, 45 (4), pp. 363-407.
Hildebrandt, H.W. & Snyder, R.D. (1981). The Pollyanna hypothesis in business writing: Initial
results, suggestions for research, International Journal of Business Communication, 18 (1), pp.
5-15.
Hooks, J., Coy, D. & Davey, H. (2001). The annual reports of New Zealand electricity
companies: Assessing quality, Pacific Accounting Review 13 (2), pp. 35-69.
Hughes, J.S. & Ricks, W.E. (1987). Associations between forecast errors and excess returns
near to earnings announcement, Accounting Review, 62 (1), pp. 158-175.
Kothari, S.P. (2001). Capital markets research in accounting, Journal of Accounting and
Economics 31 (1-3), pp. 105-231.
Lanis, R. & Richardson, G. (2013). Corporate social responsibility and tax aggressiveness: A
test of legitimacy theory, Accounting, Auditing & Accountability Journal 26 (1), pp. 75-100.
Lee, T. (1994). The changing form of the corporate annual report, Accounting Historians
Journal 21 (1), pp. 215-232.
Lesmond, D.A., Ogden, J.P. & Trzcinka , C.A. (1999). A new estimate of transaction costs,
Review of Financial Studies 12 (5), pp. 1113-1141.
Lev, B. (1989). On the usefulness of earnings and earnings research: Lessons and directions
from two decades of empirical research, Journal of Accounting Research 27, pp. 153-192.
Li, F. (2008). Annual report readability, current earnings, and earnings persistence, Journal of
Accounting and Economics 45 (2-3), pp. 221-247.
Lintner, J. (1965). The valuation of risk assets and the selection of risky investments in stock
portfolios and capital budgets, Review of Economics and Statistics 47(1), pp. 13-37.
Livnat, J. & Zarowin, P. (1990). The incremental information content of cash-flow components,
Journal of Accounting and Economics 13 (1), pp. 25-46.
Mandelbrot, B. (1963). The variation of certain speculative prices, Journal of Business 36 (4),
pp. 394-419.
Marquering, W., Nisser, J. & Valla, T. (2006). Disappearing anomalies: A dynamic analysis of
the persistence of anomalies, Applied Financial Economics 16 (4), pp. 291-302.
29
McConnell, D., Haslem, J.A. & Gibson, V.R. (1986). The president’s letter to shareholders: A
new look, Financial Analysts Journal 42 (5), Sep-Oct, pp. 66-70.
McKinstry, S. (1996) Designing the annual reports of Burton plc from 1930 to 1994,
Accounting, Organizations and Society 21 (1), pp. 89-111.
Mossin, J. (1966). Equilibrium in a capital asset market, Econometrica 34(4), pp. 768-783.
Neu, D., Warsame, H. & Pedwell, K. (1998). Managing public impressions: Environmental
disclosures in annual reports, Accounting, Organizations and Society 23 (3), pp. 265-282.
Nobes, C. & Parker, R. (2008). Comparative international accounting, 10th
Edition, Pearson
Education Limited, Essex: England.
O’Donovan, G. (2002). Environmental disclosures in the annual report: Extending the
applicability and predictive power of legitimacy theory, Accounting, Auditing & Accountability
Journal 15 (3), pp. 344-371.
Paivio, A. (1971). Imagery and verbal process, Holt: Rinehart & Winston, New York.
Paivio, A (1986). Mental representations: A dual-coding approach, Oxford University Press,
New York.
PricewaterhouseCoopers (2009). A snapshot of FTSE 350 reporting: Compliance mindset
suppresses effective communication, available at pwc.blogs.com/files/a-snapshot-of-ftse-350-
reporting.pdf, last accessed 24th
July 2014.
Rogers, J.L., Van Buskirk, A. & Zechman, S.L.C. (2011). Disclosure tone and shareholder
litigation, Accounting Review 86 (6), pp. 2155-2183.
Rosenberg, B., Reid, K. & Lanstein, R. (1985). Persuasive evidence of market inefficiency,
Journal of Portfolio Management 11 (3), pp. 9-16.
Rutherford, B.A. (2005). Genre Analysis of Corporate Annual Report Narratives: A corpus
linguistics-based approach, International Journal of Business Communications 42 (4), pp. 348-
378.
Schwert, G.W. (2003). Anomalies and market efficiency. In Constantinides, G.M, Harris, M. &
Stulz, R.M. (Eds) Handbook of the Economics of Finance 1 (B), pp. 939-974.
Sharpe, W.F. (1964). Capital asset prices: A theory of market equilibrium under conditions of
risk, Journal of Finance 19(3), pp. 425-442.
Shiller, R. J. (1981). Do stock prices move too much to be justified by subsequent changes in
dividends?, American Economic Review 76 (3), pp. 483–98.
Shumway, T. (2001). Forecasting bankruptcy more accurately: a simple hazard model, Journal
of Business 74 (1), pp. 101-124.
Smith, M. & Taffler, R.J. (1995). The incremental effect of narrative accounting information in
corporate annual reports, Journal of Business Finance & Accounting 22 (8), pp. 1195-1210.
30
Smith, M. & Taffler, R.J. (2000). The chairman’s statement: A content analysis of discretionary
narrative disclosures, Accounting, Auditing & Accountability Journal 13 (5), pp. 624-646.
Sonholtz, C. (2008). The information content of earnings announcements in Denmark,
International Journal of Managerial Finance, 4 (1), pp. 4-36.
Stanton, P. & Stanton, J. (2002). Corporate annual reports: Research perspectives used,
Accounting, Auditing & Accountability Journal 15 (4), pp. 578-500.
Stittle, J. (2002). UK corporate ethical reporting – A failure to inform: Some evidence from
company annual reports, Business and Society Review 107 (3), pp. 349-370.
Subramaninan, R., Insley, R.G & Blackwell, R.D. (1993). Performance and readability: A
comparison of annual reports of profitable and unprofitable corporations, International Journal
of Business Communication 30 (1), pp. 49-61.
Swales, G.S. Jr. (1988). Another look at the president’s letter to stockholders, Financial
Analysts Journal 44 (2), Mar. – Apr., pp. 71-73.
Tetlock, P. C. (2007). Giving content to investor sentiment: The role of media in the stock
market, Journal of Finance 62 (3), pp. 1139-68.
Tetlock, P. C., Saar-Tsechansky, M., & Macskassy, S. (2008). More than words: Quantifying
language to measure firms’ fundamentals, Journal of Finance 63 (3), pp. 1437-67.
Thomas, J. (1997). Disclosure in the marketplace: The making of meaning in annual reports,
Journal of Business Communications 34 (1), pp. 47-66.
Wisniewski, T.P. (2004). Reexamination of the link between insider trading and price
efficiency, Economic Systems, 28 (2), pp. 209-228.
Wisniewski, T.P. & Lambe, B. (2013). The role of media in the credit crunch: The case of the
banking sector, Journal of Economic Behavior and Organization 85, pp. 163-175.
Wisniewski, T.P. & Moro, A. (in press). When EU leaders speak, the markets listen, European
Accounting Review, forthcoming.
31
Table I
Variable Definitions
Variable Definition
Returns Continuously compounded return on the company during the
(1,250) window relative to the annual report publication date.
Praise Number of words in an average 500-word segment in the
annual report expressing affirmation of a person or entity.
The word stock included in the Praise category is based on
adjectives related to social, physical, intellectual,
entrepreneurial and moral qualities.
Concreteness Frequency of words (per an average 500-word segment) that
are characterized by tangibility and materiality.
Activity This variable aggregates the categories related to aggression,
accomplishment, communication and motion while deducting
the categories related to cognitive terms, passivity and
embellishment. Diction converts the frequency of words in
each of the categories into z-scores before aggregation to
ensure that each of the variable components is of equal
importance. The software also adds a constant of 50 to each
of the scores in order to eliminate negative records.
Beta CAPM beta estimated prior to the annual report
dissemination date by regressing the excess return on the
company with the excess return on the stock market index.
FTSE350 is taken as a proxy for the market index and the 3-
month UK LIBOR as a proxy for the risk-free rate.
Size Natural log of a firm’s market capitalization at the end of the
fiscal year for which the annual report was prepared.
Book-to-Market Book value per share divided stock price at the end of the
fiscal year to which the annual report refers.
Earnings_Surprise Change in earnings per share from the previous year
(denominated in pounds) divided by the stock price recorded
at the end of the fiscal year.
%Sales Percentage change in sales (year-to-year).
Leverage Change in the financial leverage, where the leverage is
calculated as total liabilities over total assets.
32
Table II
Summary Statistics
Variable Mean Standard Deviation 25th
Percentile Median 75th
Percentile
Returns 0.0303 0.4293 -0.1649 0.0794 0.2673
Praise 3.3285 2.3126 1.4750 3.0650 4.9800
Concreteness 18.2327 8.7196 13.9800 17.1250 20.9375
Activity 50.0000 2.2854 48.8217 50.0207 51.1623
Beta 0.9115 0.4053 0.6480 0.8710 1.1356
Size 14.2887 1.4543 13.3070 14.0363 15.0170
Book-to-Market 0.5932 0.7756 0.2316 0.3975 0.7531
Earnings_Surprise -0.0187 0.4641 -0.0114 0.0079 0.0263
%Sales 0.0878 0.2610 0.0075 0.0800 0.1660
Leverage -0.0051 0.1015 -0.0420 -0.0046 0.0289
Note: The variable definitions are provided in Table I.
33
Table III
Pearson Correlation Table
Returns Praise Concreteness Activity Beta Size
Book-to-
Market
Earnings
Surprise %Sales Leverage
Returns 1.0000
Praise 0.0708**
1.0000
Concreteness 0.0736***
0.0287 1.0000
Activity 0.0827***
0.0130 0.0111 1.0000
Beta -0.0525* -0.0097 0.0217 -0.0062 1.0000
Size -0.1190***
-0.1059***
-0.1236***
0.0069 0.2455***
1.0000
Book-to-Market 0.1376***
0.0103 0.0845***
0.0624**
0.1667***
-0.1430***
1.0000
Earnings_Surprise -0.1052***
0.0102 -0.1926***
-0.0134 -0.0228 0.0920***
-0.4441***
1.0000
%Sales 0.0153 0.0141 -0.0220 -0.0375 0.0385 0.0285 -0.0292 0.0445 1.0000
Leverage 0.0615**
0.0183 -0.0353 0.0389 -0.0262 -0.0407 0.0130 -0.1523***
-0.0500* 1.0000
Note: This table presents Pearson correlation coefficients between the variables utilized in our study. Definitions of the variables can be found in Table I. *,
**, ***
denote the statistical
significance at 10%, 5% and 1%, respectively.
34
Table IV
Regressions Linking Stock Returns and Characteristics of Annual Report Narrative
(1) (2) (3) (4) (5) (6)
Intercept -0.0141
(0.0211)
-0.0346
(0.0280)
-0.7090***
(0.2641)
-0.7936***
(0.2641)
-0.3950
(0.2884)
-0.4173
(0.2895)
Praise 0.0133**
(0.0052)
0.0128**
(0.0052)
0.0111**
(0.0052)
0.0107**
(0.0052)
Concreteness 0.0036**
(0.0014)
0.0034**
(0.0014)
0.0026*
(0.0014)
0.0024*
(0.0014)
Activity
0.0148***
(0.0053)
0.0144***
(0.0053)
0.0131**
(0.0052)
0.0137***
(0.0052)
Beta
-0.0548*
(0.0286)
-0.0524*
(0.0287)
Size
-0.0212**
(0.0087)
-0.0218**
(0.0088)
Book-to-Market
0.0695***
(0.0159)
0.0617***
(0.0177)
Earnings_Surprise
-0.0311
(0.0296)
%Sales
0.0489
(0.0459)
Leverage
0.2163*
(0.1232)
Adj. R-squared 0.4377% 0.4436% 0.5405% 1.3640% 3.7485% 4.0913%
F-statistic 6.5431 6.6184 7.8532 6.8125 9.1525 6.8631
Prob(F-stat) 0.0106 0.0102 0.0051 0.0001 0.0000 0.0000
No. Obs. 1262 1262 1262 1262 1257 1238
Note: Reported in this table are estimates of regressions where the continuously compounded return on company’s stock over the 250 trading days following the annual report
disclosure is taken to be the dependent variable. Standard errors of the fitted regression coefficients are reported in parentheses. The first three explanatory variables relate to
the linguistic content of the annual report narrative, while the remaining indicators act as controls. The precise definitions of the variables are given in Table 1. *,
**, ***
denote the statistical significance at 10%, 5% and 1%, respectively.
35
Table V
Risk and the Linguistic Measures
Panel A. Determinants of Total Volatility
(1) (2) (3)
Intercept 1.6200***
(0.5892)
2.5584***
(0.6439)
2.6651***
(0.6501)
Praise -0.0086
(0.0112)
-0.0115
(0.0111)
-0.0097
(0.0112)
Concreteness -0.0027
(0.0030)
-0.0033
(0.0030)
-0.0038
(0.0030)
Activity
-0.0043
(0.0117)
-0.0013
(0.0115)
-0.0033
(0.0116)
Beta
0.4665***
(0.0663)
0.4677***
(0.0674)
Size
-0.0885***
(0.0201)
-0.0886***
(0.0202)
Book-to-Market
-0.0079
(0.0376)
0.0006
(0.0410)
Earnings_Surprise
-0.0072
(0.0648)
%Sales
0.1891*
(0.0984)
Leverage
-0.1042
(0.2677)
Past_Vola 0.4061***
(0.0251)
0.3088***
(0.0301)
0.2987***
(0.0310)
Adj. R-squared 17.0509% 20.1784% 19.8017%
F-statistic 65.6480 46.2500 31.4686
Prob(F-stat) 0.0000 0.0000 0.0000
No. Obs. 1259 1254 1235

36
Table V (Continued)
Panel B. Determinants of Idiosyncratic Volatility
(1) (2) (3)
Intercept 1.4184***
(0.5172)
2.7818***
(0.5746)
2.8961***
(0.5800)
Praise -0.0035
(0.0099)
-0.0080
(0.0098)
-0.0070
(0.0099)
Concreteness -0.0020
(0.0026)
-0.0029
(0.0026)
-0.0028
(0.0027)
Activity
-0.0061
(0.0103)
-0.0046
(0.0102)
-0.0068
(0.0103)
Size
-0.0906***
(0.0173)
-0.0919***
(0.0174)
Book-to-Market
0.0147
(0.0331)
0.0368
(0.0357)
Earnings_Surprise
0.0466
(0.0573)
%Sales
0.2188**
(0.0870)
Leverage
0.0366
(0.2366)
Past_Idio_Vola 0.4260***
(0.0247)
0.3636***
(0.0290)
0.3550***
(0.0298)
Adj. R-squared 19.0055% 20.6395% 20.2214%
F-statistic 74.7980 55.3118 35.7534
Prob(F-stat) 0.0000 0.0000 0.0000
No. Obs. 1259 1254 1235
Note: Panel A of this table models the standard deviation of daily returns in the (1,250) window relative to
the annual report disclosure date (Day 0). This standard deviation has been expressed in percentage terms.
The explanatory variables used here are described in Table I, with the exception of Past_Vola which is
defined as the return standard deviation in the (-250,-1) window. Panel B, on the other hand, examines the
determinants of idiosyncratic volatility measured in the (1,250) timeframe. Idiosyncratic volatility is taken to
denote the standard deviation of the CAPM regression residuals and Past_Idio_Vola is its realization in the
250 trading days prior to the disclosure date. Standard errors of the parameter estimates are given in
parentheses. *,
**, ***
denote the statistical significance at 10%, 5% and 1%, respectively.