Predicting malaria seasons in Kenya using multitemporal meteorological satellite sensor data
9
TRANSACTIONS OF THE ROYAL SOCIETY OF TROPICAL MEDICINE AND HYGIENE (1998) 92, 12–20 Predicting malaria seasons in Kenya using multitemporal meteorological satellite sensor data Simon I. Hay 1 , Robert W. Snow 2,3 and David J. Rogers 1 1 Trypanosomiasis and Land-use in Africa ( TALA) Re- search Group, Department of Zoology, University of Oxford, South Parks Road, Oxford, OX1 3PS, UK*; 2 Kenya Medical Research Institute/Wellcome Trust Collaborative Programme, P.O. Box 43640, Nairobi, Kenya; 3 Nuffield Department of Clin- ical Medicine, University of Oxford, John Radcliffe Hospital, Headington, Oxford, OX3 9DS, UK Abstract This article describes research that predicts the seasonality of malaria in Kenya using remotely sensed im- ages from satellite sensors. The predictions were made using relationships established between long-term data on paediatric severe malaria admissions and simultaneously collected data from the Advanced Very High Resolution Radiometer (AVHRR) on the National Oceanic and Atmospheric Administrations (NOAA) polar-orbiting meteorological satellites and the High Resolution Radiometer (HRR) on the Eu- ropean Organization for the Exploitation of Meteorological Satellites’ ( EUMETSAT) geostationary Meteosat satellites. The remotely sensed data were processed to provide surrogate information on land surface temperature, reflectance in the middle infra-red, rainfall, and the normalized difference vegetation index (NDVI). These variables were then subjected to temporal Fourier processing and the fitted Fourier data were compared with the mean percentage of total annual malaria admissions recorded in each month. The NDVI in the preceding month correlated most significantly and consistently with malaria presentations across the 3 sites (mean adjusted r 2 =0·71, range 0·61–0·79). Regression analyses showed that an NDVI threshold of 0·35–0·40 was required for more than 5% of the annual malaria cases to be presented in a given month. These thresholds were then extrapolated spatially with the temporal Fourier- processed NDVI data to define the number of months, in which malaria admissions could be expected across Kenya in an average year, at an 8 × 8 km resolution. The resulting maps were compared with the only existing map (Butler’s) of malaria transmission periods for Kenya, compiled from expert opinion. Conclusions are drawn on the appropriateness of remote sensing techniques for compiling national strat- egies for malaria intervention. Keywords: malaria, Plasmodium falciparum, seasonality, prediction, satellite data, remote sensing, Kenya Introduction It has long been established that the dynamics of dis- ease vector behaviour, abundance and distribution are sensitive to changes in climate. For the mosquito vectors of Plasmodium falciparum, these studies arise from ento- mological observations both across diverse ecological settings and in controlled laboratory investigations (MUIR, 1988). Whilst such investigations have defined climatic ranges which sustain vector life cycles sufficient for parasite development and transmission to human hosts, far fewer studies have examined the ecological variation within these ranges that support the diverse spectrum of seasonal vector activity and disease distri- bution common to sub-saharan Africa. Seasonal fluctuations in the basic reproduction rate (BRR) of infection (DIETZ, 1988) occur in nearly every endemic malaria setting. The absence of empirical mod- els relating the BRR to disease outcome, however, makes it unclear how these seasonal changes relate to patterns of malaria morbidity and mortality. Neverthe- less, seasonality is a widely accepted feature of clinical malaria in Africa. The malaria burden can range from being concentrated into a few months of the year, as in large areas of West Africa (GAZIN et al., 1988; BREWS- TER & GREENWOOD, 1993; BINKA et al., 1994; BOU- VIER et al., 1997), through intermediary stages where disease incidence varies annually, such as on the Ken- yan coast (SNOW et al., 1993), to areas of perennial transmission with little within-year variation, character- istic of the river valley and lake regions of East Africa (SMITH et al., 1993; SLUTSKER et al., 1994). There are academic and pragmatic needs for descrip- tions of the clinical and epidemiological patterns of P. falciparum, to guide and rationalize disease control (SNOW et al., 1996). For example, the timing and fre- quency of insecticide treatment of bed nets or mass drug Address for correspondence: Dr S. I. Hay, TALA Research Group, Department of Zoology, University of Oxford, South Parks Road, Oxford, OX1 3PS, UK; phone +44 (0)1865 271257, fax +44 (0)1865 271240, e-mail [email protected] ox.ac.uk *URL address http://users.ox.ac.uk~zoo10120 administration would best be determined by the periods of maximal disease incidence within a community. This has proved successful in streamlining resources in The Gambia, where a change from annual to seasonal target- ed chemoprophylaxis was adopted after elucidating the basic epidemiological features of disease in the country (GREENWOOD & PICKERING, 1993). Furthermore, the clinical management of febrile events may also be guid- ed by an understanding of the changing risks of fever due to malaria throughout the year (GREENWOOD et al., 1987). There has been recent interest in the use of remotely sensed imagery from satellite sensors at a variety of spec- tral, spatial, and temporal resolutions for mapping the meteorological and other ecological determinants of ar- thropod disease vector distributions (reviewed by HAY et al., 1997). Previous applications of remote sensing techniques in malaria epidemiology have used both aer- ial and space-borne sensors to map mosquito larval hab- itat (WAGNER et al., 1979; LINTHICUM et al., 1987; WOOD et al., 1992; POPE et al., 1994) and to predict adult mosquito abundance (REJMANKOVA et al., 1995; ROBERTS et al., 1996; THOMSON et al., 1996), as well as to estimate malaria risk in specific villages (B ECK et al., 1994, 1997). In this paper we extend these techniques to a comparative analysis of remotely sensed climatic and vegetation variables with epidemiological patterns of clinical malaria common to sub-saharan Africa. It is demonstrated how these descriptions can be used to provide a high temporal resolution map of the seasonal- ity of clinical disease throughout a country, using Kenya as an example. Materials and Methods Study communities and clinical surveillance of paediatric malaria The recent description of severe malaria morbidity in 5 communities in Africa by SNOW et al. (1997) allowed the detailed examination of short-term temporal fluctu- ations in malaria morbidity. In brief, these communities were selected on the basis of their close proximity to in- patient hospital facilities with continuing clinical re- search programmes on severe, life-threatening malaria.
Transcript of Predicting malaria seasons in Kenya using multitemporal meteorological satellite sensor data

TRANSACTIONS OF THE ROYAL SOCIETY OF TROPICAL MEDICINE AND HYGIENE (1998) 92, 12–20
Predicting malaria seasons in Kenya using multitemporal meteorological satellite sensor data
Simon I. Hay1, Robert W. Snow2,3 and David J. Rogers1 1Trypanosomiasis and Land-use in Africa (TALA) Re-search Group, Department of Zoology, University of Oxford, South Parks Road, Oxford, OX1 3PS, UK*; 2Kenya MedicalResearch Institute/Wellcome Trust Collaborative Programme, P.O. Box 43640, Nairobi, Kenya; 3Nuffield Department of Clin-ical Medicine, University of Oxford, John Radcliffe Hospital, Headington, Oxford, OX3 9DS, UK
AbstractThis article describes research that predicts the seasonality of malaria in Kenya using remotely sensed im-ages from satellite sensors. The predictions were made using relationships established between long-termdata on paediatric severe malaria admissions and simultaneously collected data from the Advanced VeryHigh Resolution Radiometer (AVHRR) on the National Oceanic and Atmospheric Administrations(NOAA) polar-orbiting meteorological satellites and the High Resolution Radiometer (HRR) on the Eu-ropean Organization for the Exploitation of Meteorological Satellites’ (EUMETSAT) geostationaryMeteosat satellites. The remotely sensed data were processed to provide surrogate information on landsurface temperature, reflectance in the middle infra-red, rainfall, and the normalized difference vegetationindex (NDVI). These variables were then subjected to temporal Fourier processing and the fitted Fourierdata were compared with the mean percentage of total annual malaria admissions recorded in eachmonth. The NDVI in the preceding month correlated most significantly and consistently with malariapresentations across the 3 sites (mean adjusted r2=0·71, range 0·61–0·79). Regression analyses showedthat an NDVI threshold of 0·35–0·40 was required for more than 5% of the annual malaria cases to bepresented in a given month. These thresholds were then extrapolated spatially with the temporal Fourier-processed NDVI data to define the number of months, in which malaria admissions could be expectedacross Kenya in an average year, at an 8 × 8 km resolution. The resulting maps were compared with theonly existing map (Butler’s) of malaria transmission periods for Kenya, compiled from expert opinion.Conclusions are drawn on the appropriateness of remote sensing techniques for compiling national strat-egies for malaria intervention.
Keywords: malaria, Plasmodium falciparum, seasonality, prediction, satellite data, remote sensing, Kenya
IntroductionIt has long been established that the dynamics of dis-
ease vector behaviour, abundance and distribution aresensitive to changes in climate. For the mosquito vectorsof Plasmodium falciparum, these studies arise from ento-mological observations both across diverse ecologicalsettings and in controlled laboratory investigations(MUIR, 1988). Whilst such investigations have definedclimatic ranges which sustain vector life cycles sufficientfor parasite development and transmission to humanhosts, far fewer studies have examined the ecologicalvariation within these ranges that support the diversespectrum of seasonal vector activity and disease distri-bution common to sub-saharan Africa.
Seasonal fluctuations in the basic reproduction rate(BRR) of infection (DIETZ, 1988) occur in nearly everyendemic malaria setting. The absence of empirical mod-els relating the BRR to disease outcome, however,makes it unclear how these seasonal changes relate topatterns of malaria morbidity and mortality. Neverthe-less, seasonality is a widely accepted feature of clinicalmalaria in Africa. The malaria burden can range frombeing concentrated into a few months of the year, as inlarge areas of West Africa (GAZIN et al., 1988; BREWS-TER & GREENWOOD, 1993; BINKA et al., 1994; BOU-VIER et al., 1997), through intermediary stages wheredisease incidence varies annually, such as on the Ken-yan coast (SNOW et al., 1993), to areas of perennialtransmission with little within-year variation, character-istic of the river valley and lake regions of East Africa(SMITH et al., 1993; SLUTSKER et al., 1994).
There are academic and pragmatic needs for descrip-tions of the clinical and epidemiological patterns of P.falciparum, to guide and rationalize disease control(SNOW et al., 1996). For example, the timing and fre-quency of insecticide treatment of bed nets or mass drug
Address for correspondence: Dr S. I. Hay, TALA ResearchGroup, Department of Zoology, University of Oxford, SouthParks Road, Oxford, OX1 3PS, UK; phone +44 (0)1865271257, fax +44 (0)1865 271240, e-mail [email protected]*URL address http://users.ox.ac.uk~zoo10120
administration would best be determined by the periodsof maximal disease incidence within a community. Thishas proved successful in streamlining resources in TheGambia, where a change from annual to seasonal target-ed chemoprophylaxis was adopted after elucidating thebasic epidemiological features of disease in the country(GREENWOOD & PICKERING, 1993). Furthermore, theclinical management of febrile events may also be guid-ed by an understanding of the changing risks of feverdue to malaria throughout the year (GREENWOOD et al.,1987).
There has been recent interest in the use of remotelysensed imagery from satellite sensors at a variety of spec-tral, spatial, and temporal resolutions for mapping themeteorological and other ecological determinants of ar-thropod disease vector distributions (reviewed by HAYet al., 1997). Previous applications of remote sensingtechniques in malaria epidemiology have used both aer-ial and space-borne sensors to map mosquito larval hab-itat (WAGNER et al., 1979; LINTHICUM et al., 1987;WOOD et al., 1992; POPE et al., 1994) and to predictadult mosquito abundance (REJMANKOVA et al., 1995;ROBERTS et al., 1996; THOMSON et al., 1996), as well asto estimate malaria risk in specific villages (BECK et al.,1994, 1997). In this paper we extend these techniquesto a comparative analysis of remotely sensed climaticand vegetation variables with epidemiological patternsof clinical malaria common to sub-saharan Africa. It isdemonstrated how these descriptions can be used toprovide a high temporal resolution map of the seasonal-ity of clinical disease throughout a country, using Kenyaas an example.
Materials and MethodsStudy communities and clinical surveillance of paediatricmalaria
The recent description of severe malaria morbidity in5 communities in Africa by SNOW et al. (1997) allowedthe detailed examination of short-term temporal fluctu-ations in malaria morbidity. In brief, these communitieswere selected on the basis of their close proximity to in-patient hospital facilities with continuing clinical re-search programmes on severe, life-threatening malaria.

PREDICTING MALARIA SEASONS 13
The Kenyan sites (Kilifi North, Kilifi South and Siaya)were chosen for this investigation (Fig. 4, A).
The communities of Kilifi North and Kilifi South aresituated on Kenya’s coastline and experience a pro-nounced bimodal pattern of annual rainfall with a longrainy period between April and July and a shorter onebetween September and October. The average annualprecipitation during the period of disease surveillancewas 1071 mm and 1155 mm for Kilifi North and Southrespectively. A creek separates the communities and thearea to the south differs from the north as it is traversedby perennial and seasonal rivers. The rural communityof Siaya is 20 km from the shore of Lake Victoria at analtitude of 1130 m. Rainfall occurs in every month of theyear, with peaks between March and May and betweenAugust and November. The average annual rainfall forthe period of study was 1337 mm, similar to that at theKilifi sites.
Admissions to the paediatric wards of the local hospi-tals from each community were monitored for between3 and 5 years. Every admitted patient between onemonth and 10 years of age was examined by a studyphysician or clinical officer and details of the clinical his-tories, observations and the results of laboratory proce-dures were recorded on a standard proforma. A primarydiagnosis for admission was recorded on discharge, fol-lowing a review of all laboratory and additional clinicalinvestigations. Malaria as the primary cause of admis-sion was defined following the detection of P. falciparuminfection in the peripheral blood and a review of all sup-porting haematological, clinical, radiological and micro-biological information to exclude other potential causesfor the clinical presentation.
NOAA–AVHRR dataThe Pathfinder Advanced Very High Resolution Ra-
diometer (AVHRR) Land (PAL) data were obtained fora period of 5 years (1990–1994) coincident with thepaediatric malaria admission records. They were de-rived from the visible and infra-red radiance imagerycollected by the AVHRR on board the National Oceanicand Atmospheric Administration’s NOAA-11 satellite.A detailed guide to the NOAA meteorological satelitesand their AVHRR payload has been given by KIDWELL(1995) and CRACKNELL (1997); the relevant details aresummarized in Table 1. A review of the processing tech-niques used to calibrate, navigate and quality-controlimages from this AVHRR archive, and a definitive de-scription of the resulting PAL data products, has beengiven by JAMES & KALLURI (1994).
The PAL data were provided as digital files of dailyglobal coverage containing the 5 channels of AVHRRdata and 7 bands of ancillary information. The 5 chan-nels of raw waveband data were extracted for Africa andscaled with information provided by AGBU & JAMES(1994) using Earth Resources Data Analysis System
(ERDAS) Imagine 8·2™ on a Silicon Graphics IndyR5000™ workstation. The ancillary information pro-vided with the PAL data was then used to exclude unre-liable picture elements (pixels) from the images. Firstly,cloudy pixels, as determined by the ‘Clouds fromAVHRR’ (CLAVR) algorithm (STOWE et al., 1991),were masked. Secondly, pixels viewed by the AVHRRsensor at an angle greater than 42º were eliminated toreduce view angle distortion. Thirdly, those pixels re-corded at solar zenith angles greater than 80º were ex-cluded, because at these angles the twilight of dawn ordusk affects measurements. Further information on thefactors affecting the quality of remotely sensed data andthe techniques often used to ameliorate such problemshave been discussed by HAY et al. (1996).
These quality-controlled raw waveband data werethen processed to provide ecologically meaningful infor-mation. The normalized difference vegetation index(NDVI) was first calculated. It is defined for theAVHRR as follows:
(channel 2–channel 1)NDVI = ––––––––––––––––––– (1)
(channel 2+channel 1)with possible values ranging from –1 to +1, but in prac-tice lying well within these limits (TUCKER, 1979). TheNDVI, which has no units since it is a ratio, exploits thefact that chlorophyll and carotenoid pigments in planttissues absorb light in the visible red wavelengths (whichcorresponds to AVHRR channel 1) whilst mesophyll tis-sue reflects light in the near infra-red (which corre-sponds to AVHRR channel 2) (SELLERS, 1985;TUCKER & SELLERS, 1986). Actively photosynthesizingvegetation therefore appears darker in the visible andbrighter in the infra-red region than senescent vegeta-tion or the soil background. The NDVI is theoreticallya specific measure of chlorophyll abundance and energyabsorption (MYNENI et al., 1995), but its use has beenextended through multitemporal observations to meas-ure vegetation biomass (TUCKER et al., 1985b) and toclassify vegetation type (TUCKER et al., 1985a) and phe-nology (JUSTICE et al., 1985) in a range of ecosystemsthroughout Africa.
Land surface temperature (LST) estimates were cal-culated from simultaneously collected brightness tem-peratures (K) from AVHRR channels 4 and 5 using anequation derived by PRICE (1984):
T= channel 4 + 3·33 (channel 5–channel 4 ). (2)
The 3·33 term is a value determined empirically forthe NOAA-7 satellite. This relationship holds becausesignal attenuation is much greater in channel 5 than inchannel 4, so the difference between the channels can beused to estimate, and hence correct for, the amount ofatmospheric water vapour attenuation. This equationhas been demonstrated to provide LST estimates accu-
Table 1. Spatial, temporal and spectral resolution of the sensors carried by the NOAA-11 and Meteosat-5satellites
a0·4µm is at the visible end, and 12µm at the thermal end, of the electromagnetic spectrum.bDiameter of the viewing area of the sensor at nadir (i.e., directly below the satellite).cTime taken for the satellite to repeat a measurement over the same Earth location.dBy the time the PAL and FAO-CCD data have been processed and distributed they are at 8 × 8 and 7·6 × 7·6 km resolution,respectively.
ResolutionSatellite/Sensor Spectral (µm)a Spatial (km) Temporal (h)
National Oceanic and Atmospheric 1 0·58–0·68 1·1d 12Administration (NOAA)/Advanced 2 0·72–1·10Very High Resolution Radiometer 3 3·55–3·93(AVHRR) 4 10·30–11·30
5 10·50–11·50Meteosat/High Resolution Radiometer 1 0·40–1·10 2·5 0·5(HRR) 2 10·50–12·50 5d
3 5·70–7·10 5

14 SIMON I. HAY ET AL.
rate to ± 2–3 K (COOPER & ASRAR, 1989; SUGITA &BRUTASAERT, 1993).
The middle infra-red (MIR) radiance data fromAVHRR channel 3 were also processed. Despite beingless well documented than other wavebands, MIRwavelengths appear to suffer less atmospheric attentua-tion than the visible and near infra-red wavelengths(KERBER & SCHUTT, 1986), making these data poten-tially very suitable for monitoring vegetation in the trop-ics. Furthermore, MIR has been shown to be morehighly correlated with various biophysical properties ofvegetation canopies than the visible or near infra-redwavelengths (BOYD et al., 1996). BOYD & CURRAN (inpress) provide an exhaustive review of the proposedmechanisms governing the interaction of MIR and veg-etated land surface.
Maximum value compositingThe daily acquisition of NOAA–AVHRR data ena-
bles sensor data of improved quality to be obtained bycombining images over time. The aim of this composit-ing procedure is to select the most cloud-free and leastatmospherically contaminated value for a pixel withinthe chosen period. Most compositing relies on the factthat the NDVI is reduced by cloud and other atmos-pheric contamination so that the highest NDVI duringa decadal (i.e. 10 d) or monthly period occurs when at-mospheric attenuation, and thus data noise, are least(HOLBEN, 1986). This method of image production iscalled maximum value compositing (MVC). The dailyNDVI, LST and MIR data were all subject to MVCover monthly periods. The LST and MIR data werecomposited using their respective maxima, however, be-cause these values are the least cloud-contaminated inthe series, since clouds are generally colder than the landand vegetation at tropical latitudes (LAMBIN & EHR-LICH, 1995).
Meteosat–HRR dataThe Meteosat–High Resolution Radiometer (HRR)
data were supplied by the African Real Time Environ-mental Monitoring Information System (ARTEMIS) pro-gramme of the United Nations (UN) Food andAgriculture Organization (FAO) as processed monthlycold cloud duration (CCD) images from 1990–1994. Aguide to the Meteosat satellite series and their HRR pay-load has been published (ANONYMOUS, 1994) and de-tails of their spatial, spectral and temporal resolution aregiven in Table 1. The relationship between cloud-toptemperature (recorded by channel 2 of the Meteosat sat-ellite) and the probability of rainfall has been establishedby SNIJDERS (1991). The particular threshold tempera-ture associated with rain-bearing clouds, and the quan-tity of rain they deposit, vary temporally and spatiallyhowever, so must be established empirically. This hasbeen done for large parts of Africa by the Tropical Ap-plications in Meteorology of Satellite and Other Data(TAMSAT) programme (DUGDALE et al., 1995). Kenyalies outside this region, where simple seasonally adjust-ed thresholds are applied. Africa-wide analyses, howev-er, have shown that CCD–rainfall correlations in thesezones are equally robust (HAY, 1996). These resultswere used by the FAO–ARTEMIS project to generatemonthly CCD images, where each pixel represents thenumber of hours during which there was cloud covercolder than the threshold value for the compositing pe-riod.
Temporal Fourier analysisThe 5 years series of monthly NDVI, LST, MIR and
CCD images were then subjected to temporal Fourieranalysis, since this technique has been demonstrated toachieve significant data reduction of remotely sensedtime series without a commensurate loss of biologicalinformation (ROGERS & WILLIAMS, 1994). The analysisdecomposes seasonal changes in the satellite-sensor var-
iables into the sum of their sinusoidal components withfrequencies of one up to 6 cycles per year, so that thefirst term in the Fourier expansion gives the annual cy-cle, the second the biannual cycle, and so on (ROGERSet al., 1996). The sum of the different components thendescribes the observed annual variation at the site inquestion. The first 3 Fourier terms capture most of thevariation in the signal, and only these were used in thepresent study. The analysis also gives information onboth the phase (timing in the year of maximum value)and amplitude (maximum range around the mean an-nual value) of each component and these were used toconstruct the fitted signal, from which may be extractedthe number of months above or below any threshold val-ue.
Data analysis and malaria seasonality predictionThe latitude and longitude of each hospital were used
to extract values from the Fourier-processed satellitesensor data. A mean value was taken from a 3 × 3 pixelarray around the centre pixel (corresponding to an areaof approximately 24 × 24 km), since this area encom-passed the whole of the community in each of the study
Fig. 1. Monthly percentages of the total annual malaria casesmeasured over the duration of surveillance. These data aretherefore the average annual pattern of admissions shown for(A) Kilifi North, (B) Kilifi South and (C) Siaya.
PREDICTING MALARIA SEASONS 15
areas. If any of the selected pixels was masked as sea orinland water they were excluded from the calculations.This resulted in a single pixel overlap in the arrays usedto calculate the information for Kilifi North and KilifiSouth. These values were then transferred to a databaseand statistical associations explored using the StatisticalPackage for the Social Sciences (SPSS) version 7.5.1.
Linear regressions were performed to compare themean monthly percentage of total annual malaria ad-missions with corresponding monthly Fourier-proc-essed NDVI, LST, MIR and CCD values for each site.Threshold values were then derived from these linear re-gressions and used to determine the number of monthswith conditions above these thresholds and thereforelikely to be associated with the presentation of clinicalmalaria in each pixel of the Fourier-processed images ofKenya. The number of months in which clinical malariacould be supported (range 0–12 for each pixel) was thenaggregated into zones for comparison with the only oth-er malaria transmission map for Kenya, developed dur-ing the colonial era and based on expert opinion of thelength of malaria transmission seasons (BUTLER, 1959;see Fig. 4, D). The 1959 map divided the country intozones of malaria transmission periods of less than 3months, 3–6 months, and over 6 months per year, withlarge areas classified as ‘malarious near water’ or ‘malar-ia free’.
ResultsTime series data and regression analyses
The different seasonal patterns of malaria admissionsrecorded are shown in Fig. 1. In Kilifi North (Fig. 1, A)there was a bimodal pattern in annual malaria cases withpeaks in admissions around January and July followingthe short and long rainy seasons respectively. In KilifiSouth there was a similar pattern, but it was less pro-nounced (Fig. 1, B). In contrast, cases of malaria inSiaya (Fig. 1, C) were recorded relatively evenlythroughout the year.
The annual time series of the remotely sensed varia-bles (MIR, LST, NDVI and CCD) were derived foreach site and compared with the monthly malaria ad-mission data. The general pattern observed at each sitewas for the peak in vegetation activity to occur approxi-mately one month after the rains, and for it to take a fur-ther month for the peak in malaria admissions tobecome evident. The coefficient of determination (ad-justed r2) resulting from the linear regression of themean monthly MIR, LST, NDVI and CCD variables
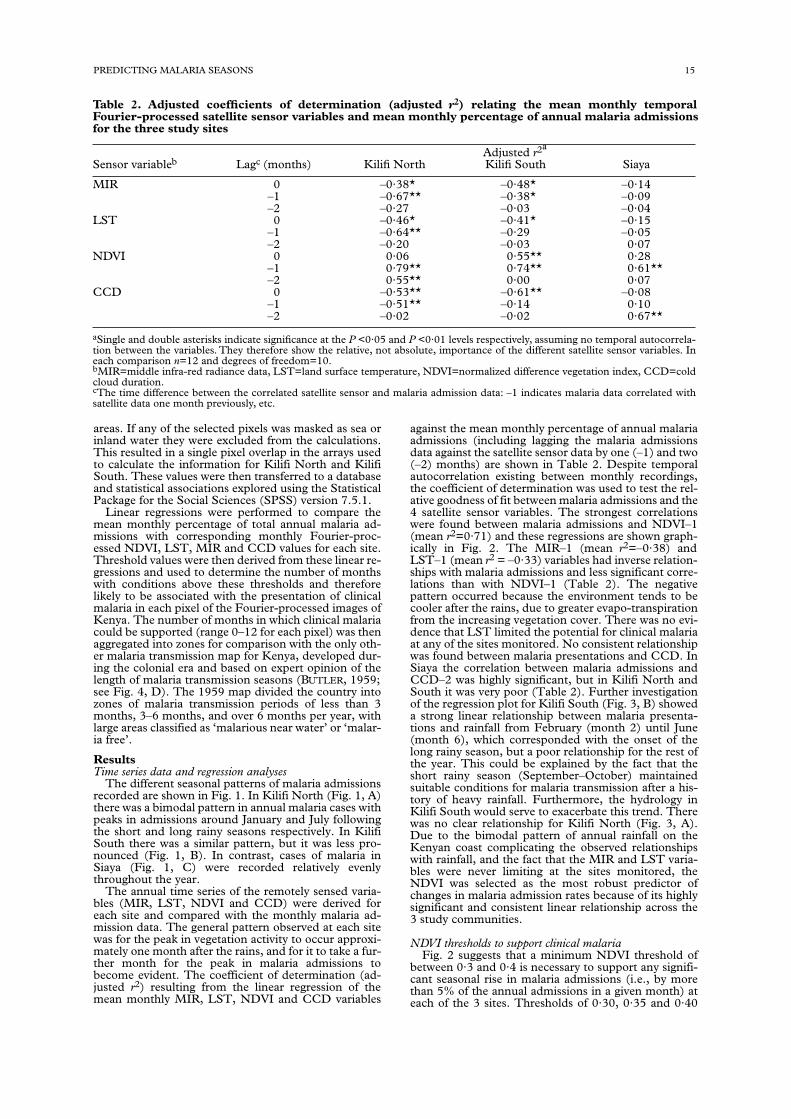
against the mean monthly percentage of annual malariaadmissions (including lagging the malaria admissionsdata against the satellite sensor data by one (–1) and two(–2) months) are shown in Table 2. Despite temporalautocorrelation existing between monthly recordings,the coefficient of determination was used to test the rel-ative goodness of fit between malaria admissions and the4 satellite sensor variables. The strongest correlationswere found between malaria admissions and NDVI–1(mean r2=0·71) and these regressions are shown graph-ically in Fig. 2. The MIR–1 (mean r2=–0·38) andLST–1 (mean r2 = –0·33) variables had inverse relation-ships with malaria admissions and less significant corre-lations than with NDVI–1 (Table 2). The negativepattern occurred because the environment tends to becooler after the rains, due to greater evapo-transpirationfrom the increasing vegetation cover. There was no evi-dence that LST limited the potential for clinical malariaat any of the sites monitored. No consistent relationshipwas found between malaria presentations and CCD. InSiaya the correlation between malaria admissions andCCD–2 was highly significant, but in Kilifi North andSouth it was very poor (Table 2). Further investigationof the regression plot for Kilifi South (Fig. 3, B) showeda strong linear relationship between malaria presenta-tions and rainfall from February (month 2) until June(month 6), which corresponded with the onset of thelong rainy season, but a poor relationship for the rest ofthe year. This could be explained by the fact that theshort rainy season (September–October) maintainedsuitable conditions for malaria transmission after a his-tory of heavy rainfall. Furthermore, the hydrology inKilifi South would serve to exacerbate this trend. Therewas no clear relationship for Kilifi North (Fig. 3, A).Due to the bimodal pattern of annual rainfall on theKenyan coast complicating the observed relationshipswith rainfall, and the fact that the MIR and LST varia-bles were never limiting at the sites monitored, theNDVI was selected as the most robust predictor ofchanges in malaria admission rates because of its highlysignificant and consistent linear relationship across the3 study communities.
NDVI thresholds to support clinical malariaFig. 2 suggests that a minimum NDVI threshold of
between 0·3 and 0·4 is necessary to support any signifi-cant seasonal rise in malaria admissions (i.e., by morethan 5% of the annual admissions in a given month) ateach of the 3 sites. Thresholds of 0·30, 0·35 and 0·40
Table 2. Adjusted coefficients of determination (adjusted r2) relating the mean monthly temporalFourier-processed satellite sensor variables and mean monthly percentage of annual malaria admissionsfor the three study sites
aSingle and double asterisks indicate significance at the P <0·05 and P <0·01 levels respectively, assuming no temporal autocorrela-tion between the variables. They therefore show the relative, not absolute, importance of the different satellite sensor variables. Ineach comparison n=12 and degrees of freedom=10.bMIR=middle infra-red radiance data, LST=land surface temperature, NDVI=normalized difference vegetation index, CCD=coldcloud duration.cThe time difference between the correlated satellite sensor and malaria admission data: –1 indicates malaria data correlated withsatellite data one month previously, etc.
Adjusted r2a
Sensor variableb Lagc (months) Kilifi North Kilifi South Siaya
MIR 0 –0·38* –0·48* –0·14–1 –0·67** –0·38* –0·09–2 –0·27 –0·03 –0·04
LST 0 –0·46* –0·41* –0·15–1 –0·64** –0·29 –0·05–2 –0·20 –0·03 0·07
NDVI 0 0·06 0·55** 0·28–1 0·79** 0·74** 0·61**–2 0·55** 0·00 0·07
CCD 0 –0·53** –0·61** –0·08–1 –0·51** –0·14 0·10–2 –0·02 –0·02 0·67**

16 SIMON I. HAY ET AL.
were therefore applied to the fitted Fourier NDVI timeseries for Kenya to define the numbers of months inwhich NDVI exceeded these thresholds and thereforeprovided conditions suitable for clinical malaria. The re-sults are shown in Fig. 4, B-C for NDVI thresholds of
0·35 and 0·40, respectively; the maps change substan-tially over this very small NDVI range. In order to com-pare these patterns of seasonality based upon empiricalobservations of clinical disease objectively with previousexpert opinion of transmission seasons, the monthly
Fig. 2. Regression between monthly temporal Fourier-processed normalized difference vegetation index (NDVI) and the monthlymean percentage of total annual malaria admissions. The NDVI data are lagged by one month. A: Kilifi North (adjusted r2=0·79,n=12, P<<0·01); B: Kilifi South (r2=0·74, n=12, P<<0·01); C: Siaya (r2=0·61, n=12, P<<0·01); D: all 3 sites combined (r2=0·73,n=36, P<<0·01). (See Table 2 for notes on levels of significance.)
Fig. 3. Regression between monthly temporal Fourier-processed cold cloud duration (CCD) and the monthly mean percentage oftotal annual malaria admissions. The CCD data are lagged by 2 months (and therefore shown as –2). The months for the malariarecords are indicated by numerals adjacent to the points (1 = January, etc.) A: Kilifi North (adjusted r2 = –0·02, n=12, not signifi-cant); B: Kilifi South (r2 = –0·02, n = 12, not significant). (See Table 2 for notes on levels of significance.)

PR
ED
ICT
ING
MA
LA
RIA
SE
AS
ON
S17Fig. 4. Maps of predicted malaria seasonality in Kenya. Map A shows the location of the study sites and principle landmarks in Kenya. Maps B and C show the number of months for which malaria
transmission is possible, determined by the 0·35 and 0·40 normalized difference vegetation index (NDVI) threshold respectively. Map D is a reproduction of BUTLER’s (1959) map of malaria trans-mission periods in Kenya (the hatched section of this map is simply defined as malaria free and does not relate to the hatched areas above 2400 m in the predicted map; the white area is defined asmalarious near water). Maps E and F again show the number of months for which malaria transmission is possible, determined by the 0·35 and 0·40 NDVI threshold respectively but recoded intoBUTLER’s 1959) categories for visual comparison with D. The keys to the first and second rows of maps are provided on the right of the Figure. North is at the top of each map.

18 SIMON I. HAY ET AL.
data were recombined according to the definitions usedby BUTLER (1959) in preparing the map of malariatransmission in Kenya (Fig. 4, D) using threshold crite-ria of 0·35 (Fig. 4, E) and 0·40 (Fig. 4, F). Areas above2400 m were masked in these figures using a digital ele-vation model (DEM)* because previous investigationsin Kenya have found a temperature-dependent absenceof transmission above that altitude (GARNHAM, 1948).There is considerable visual correspondence betweenthe predicted maps of malaria transmission periods(Fig. 4, E, F) and expert opinion (Fig. 4, D). The mainmalaria areas surrounding the central highlands are welldefined in kind and extent, as well as variations alongthe Kenyan coast and the Ethiopian border in the ex-treme north-east. The malaria seasonality map based onthe 0·4 NDVI threshold is the most accurate approxi-mation to BUTLER’S (1959) map.
DiscussionMost clinical staff working in malaria endemic areas
of Africa recognize ‘malaria seasons’ and expert opinionon duration of annual transmission has historically beenused to develop malaria maps. There are, however, fewexamples of empirically developed maps of malaria sea-sonality related to the clinical outcomes of infection.Programme managers have few resources and thus needto rationalize the control options at their disposal. An-nual or biannual treatment of bed nets with insecticidescan make a large financial difference to bed net pro-gramme budgets. Furthermore, with the rapid emer-gence of parasite resistance to pyrimethamine/sulfadoxine, the last affordable front-line antimalarialtreatment in many countries, restricted use for fevertreatment to periods of known disease risk should pro-long this drug’s useful life span. Targeted chemoproph-ylaxis has been shown to have a dramatic effect uponchild survival (GREENWOOD et al., 1988) and, whilstthis intervention is demanding upon resources, logistics,costs and compliance, it is more likely to be acceptableto programme managers and communities when it needbe applied for only a few months each year. Moreover,there is renewed interest in the epidemiological featuresof clinical malaria with the diverse patterns of P. falci-parum transmission seen in Africa (SNOW et al., 1997;THOMSON et al., 1997). It could be argued that signifi-cant proportions of infants born immediately after theacutely seasonal periods of P. falciparum challenge willnot be actively immunized whilst protected by maternalantibody and other putative innate protective mecha-nisms, and will thus be at increased risk after their firstbirthday when first infected in the following season.Furthermore, despite the continued burden malariaplaces upon child survival in Africa, and many argu-ments for the utility of disease risk maps, many nationalmalaria control programmes lack this most basic of epi-demiological tools.
The application of remote sensing techniques to ma-laria control has so far been focused on the identificationof mosquito habitats and the prediction of mosquitonumbers, rather than on the clinical consequences ofvector, parasite and human contact. We have studiedthe characteristically seasonal fluctuations in clinicalmalaria, in relation to a variety of surrogate meteorolog-ical and vegetation variables recorded by sensors onboard polar-orbiting and geostationary satellites. Theinvestigation suggests that, whilst changes in LST, MIRand CCD are associated with seasonal changes in the in-cidence of clinical malaria, they lack sufficient precisionand stability across the sites to be of predictive value.Conversely, there was a high and consistent correlation
*Anonymous (1996). GTOPO30 Documentation. UniversalResource Locator <http://edcwww.cr.usgs.gov/landdac/gtopo30/README.html>. Sioux Falls, South Dakota, USA: EROSData Center, Global Land Information System.
between the temporal changes in the NDVI and thetemporal changes in malaria cases across the Kenyancommunities studied. There is obviously no direct caus-al link between NDVI and malaria cases; both factorsrespond similarly, in direction and magnitude, to chang-es in meteorological conditions. The NDVI has alsobeen shown to be important in predicting the incidenceand prevalence of human trypanosomiasis in Africa(ROGERS, 1991; ROGERS & WILLIAMS, 1993).
The NDVI is potentially, therefore, a very useful pre-dictive tool as it is measured routinely across Africa ona daily basis and is available in the public domain. Itwould be especially useful if similar relationships be-tween NDVI and malaria admissions were to be identi-fied in other parts of Africa. Recent analyses in TheGambia, however, indicate that different thresholdsmay apply in the savannah areas of West Africa (THOM-SON et al., 1997), so that area-specific modelling may berequired. Further complications arise due to the lowspatial resolution of the NDVI data. An 8 × 8 km pixelis a spatial average that is likely to be composed of re-gions above and below the 0·3–0·4 NDVI threshold, sothat in the current analysis small areas suitable for ma-laria transmission would not be detected. Increasing theutility of such observations to location-specific informa-tion on the spatial and temporal patterns of disease willobviously require commensurate increases in the tem-poral and spatial resolutions of the satellite sensor data.
The maps of seasonal clinical disease developed forKenya in this investigation were based upon the empir-ical observation that clinical malaria could be supportedonly whilst NDVI exceeded a threshold value of be-tween 0·3 and 0·4. The maps shown in Fig. 4, E and Fagree with expert opinion of the length of the transmis-sion seasons reported during the late 1950s in excludingthe potential transmission of malaria in the arid regionsof Kenya (north-eastern provinces and the area inlandfrom the coastal strip). The most sensitive indicator isan NDVI index of 0·4 (Fig. 4, F), which provides a closeapproximation to the differentials in transmission sea-sons in western Kenya and along the coast, as suggestedby the 1959 transmission map (BUTLER, 1959). It isstressed that the current maps merely demonstrate amethod and do not constitute a definitive picture of ma-laria seasonality in Kenya. To develop this work there isa need to conduct further validation or ‘ground-truth-ing’ of the relationships between malaria admissions andenvironmental data for much wider geographical areas,as well as to explore predictive models of seasonality.
It is perhaps not by coincidence that previous maps ofthe annual periods of transmission have often been usedas empirical maps of intensity of transmission, on the as-sumption that the longer the period of transmission thegreater is the potential for higher host infection rates.Confusion over appropriate definitions of endemicityhas hampered the use of epidemiological maps for ma-laria control (SNOW et al., 1996). Nevertheless, it is no-table that those areas where NDVI thresholds forclinical disease are exceeded for 11 to 12 months of theyear do support the highest rates of P. falciparum infec-tion among the host population in Kenya (OMUMBO etal., in press), indicating the potential of these remotelysensed images for predicting the intensity of transmis-sion, as well as length of malaria seasons.
To conclude, it has been demonstrated that a signifi-cant correlation exists between the timing of changes ofmeteorological and vegetation variables recorded by sat-ellite sensors and the relative changes in prevalence ofclinical malaria, and these correlations have been usedto produce clinical disease seasonality maps for Kenya.Moreover, satellite systems scheduled for orbit in thenear future will carry sensors with spectral, spatial andtemporal resolutions far exceeding the specification ofthose on existing satellite series (see HAY, 1997). Forexample, the geostationary Meteostat Second Genera-tion (MSG) satellite to be launched in the year 2000 will

PREDICTING MALARIA SEASONS 19
be able to acquire NDVI images for the whole of Africa,at 1 × 1 km resolution, every 15 min during daylighthours (SCHMETZ et al., 1995). These existing and fu-ture information sources, which will be provided freelyto African countries, when combined with models ofdisease transmission intensity and other available demo-graphic, socioeconomic and health service information,could be used to create maps to guide in the selectionand timing of interventions. This would provide a morecost-effective and objective basis for malaria control.
AcknowledgementsThis study received financial support from the Wellcome
Trust and the Medical Research Council, UK, the Centers forDisease Surveillance and National Center for Infectious Dis-eases, USA, and the Kenyan Medical Research Council.R.W.S. is a Senior Wellcome Trust Fellow in Basic BiomedicalSciences (no. 033340). In addition, this publication is an out-put from research equipment funded by the Department forInternational Development (DfID), UK (Livestock Produc-tion Programme ZC0012). However, the DfID can accept noresponsibility for information provided or views expressed.The following formal acknowledgement is requested of thosewho use PAL data: ‘data used in this study include data pro-duced through funding from the Earth Observing SystemPathfinder Program of NASA’s Mission to Planet Earth in co-operation with National Oceanic and Atmospheric Adminis-tration. The data were provided by the Earth Observing Sys-tem Data and Information System (EOSDIS), DistributedActive Archive Center (DAAC) at Goddard Space FlightCenter which archives, manages and distributes this dataset’.We also thank Dr Kevin Marsh for general support and DrsByron Wood, Sarah Randolph, Madeleine Thomson, RobertGreen, Tim Robinson, Mike Packer and Peter Stevenson, and2 anonymous referees, for comments on the manuscript. DrWilliam Wint provided much valued help with Geographic In-formation System manipulations and in the final preparation ofthe colour figures. This paper is published with the permissionof the director of the Kenya Medical Research Institute.
ReferencesAgbu, P. A. & James, M. E. (1994). The NOAA/NASA Path-
finder AVHRR land data set user’s manual. Greenbelt, Mary-land: Goddard Distributed Active Archive Center.
Anonymous (1994). Information on meteorological and other en-vironmental satellites, 3rd edition. Geneva: World Meteoro-logical Organization, publication no. 411.
Beck, L. R., Rodriguez, M. H., Dister, S. W., Rodriguez, A. D.,Rejmankova, E., Ulloa, A., Meza, R. A., Roberts, D. R., Par-is, J. F., Spanner, M. A., Washino, R. K., Hacker, C. &Legters, L. J. (1994). Remote sensing as a landscape epide-miologic tool to identify villages at high risk for malariatransmission. American Journal of Tropical Medicine and Hy-giene, 51, 271–280.
Beck, L. R., Rodriguez, M. H., Dister, S. W., Rodriguez, A. D.,Washino, R. K., Roberts, D. R. & Spanner, M. A. (1997).Assessment of a remote sensing-based model for predictingmalaria transmission risk in villages of Chiapas, Mexico.American Journal of Tropical Medicine and Hygiene, 56,99–106.
Binka, F. N., Morris, S. S., Ross, D. A., Arthur, P. & Aryeetey,M. R. (1994). Patterns of malaria morbidity and mortality inchildren in northern Ghana. Transactions of the Royal Societyof Tropical Medicine and Hygiene, 88, 381–385.
Bouvier, P., Breslow, N., Ogobara, D., Robert, C. F., Picquet,M., Mauris, A., Dolo, A., Dembele, H. K., Delley, V. &Rougemont, A. (1997). Seasonality, malaria and impact ofprophylaxis in a West African village. II: Effect on birthweight. American Journal of Tropical Medicine and Hygiene,56, 384–389.
Boyd, D. S. & Curran, P. J. (in press). Using remote sensing toreduce uncertainties in the global carbon budget: the poten-tial of radiation acquired in the middle infrared wavelengths.Remote Sensing Reviews.
Boyd, D. S., Foody, G. M., Curran, P. J., Lucas, R. M. &Honzak, M. (1996). An assessment of radiance in LandsatTM middle and thermal infrared wavebands for the detec-tion of tropical forest regeneraiton. International Journal ofRemote Sensing, 17, 249–261.
Brewster, D. R. & Greenwood, B. M. (1993). Seasonal varia-tion of paediatric diseases in The Gambia, West Africa. An-nals of Tropical Paediatrics, 13, 133–146.
Butler, R. J. (1959). Atlas of Kenya: a comprehensive series of newand authenticated maps prepared from the national survey and
other governmental sources with gazetteer and notes on pronunci-ation and spelling, 1st edition. Nairobi: The Survey of Kenya.
Cooper, D. R. & Asrar, G. (1989). Evaluating atmospheric cor-rection models for retrieving surface temperatures from theAVHRR over a tallgrass prairie. Remote Sensing of Enviro-ment, 27, 93–102.
Cracknell, A. P. (1997). The Advanced Very High Resolution Ra-diometer. London: Taylor & Francis.
Dietz, K. (1988). Mathematical models for transmission andcontrol of malaria. In: Malaria: Principles and Practice of Mal-ariology, volume 2, Wernsdorfer, W. H. & McGregor, I. (edi-tors). London: Churchill Livingstone, pp. 1091–1133.
Dugdale, G., McDougall, V. & Thorne, V. (1995). The TAMSATmethod for estimating rainfall over Africa and its implica-tions. In: RSS95: Remote Sensing in Action. Proceedings of the21st Annual Conference of the Remote Sensing Society. Notting-ham: The Remote Sensing Society, pp. 773–780.
Garnham, P. C. C. (1948). The incidence of malaria at high al-titudes. Journal of the National Malaria Society, 7, 275–284.
Gazin, P., Robert, V., Cot, M., Simon, J., Halna, J. M., Darriet,F., Legrand, D., Carnevale, P. & Ambroise-Thomas, P.(1988). Le paludisme dans l’Oudalan, région Sahelienne duBurkina Faso. Annales de la Société Belge de Médecine Tropicale,68, 255–264.
Greenwood, B. M. & Pickering, H. (1993). A malaria controltrial using insecticide-treated bed nets and targeted chemo-prophylaxis in a rural area of The Gambia, West Africa. A re-view of the epidemiology and control of malaria in TheGambia, West Africa. Transactions of the Royal Society of Trop-ical Medicine and Hygiene, 87, supplement 2, S3–S11.
Greenwood, B. M., Bradley, A. K., Greenwood, A. M., Byass,P., Jammeh, K., Marsh, K., Tullock, S., Oldfield, F. J. S. &Hayes, R. (1987). Mortality and morbidity from malariaamong children in a rural area of The Gambia, West Africa.Transactions of the Royal Society of Tropical Medicine and Hy-giene, 81, 478–486.
Greenwood, B. M., Bradley, A. K., Byass, P., Greenwood, A.M., Snow, R. W., Hayes, R. J. & N’Jie, A. B. H. (1988).Comparison of two strategies for control of malaria within aprimary health care programme in The Gambia. Lancet, i,1121–1127.
Hay, S. I. (1996). An investigation of the utility of remotely sensedmeteorological satellite data for predicting the distribution andabundance of the tsetse fly (Diptera: Glossinidae). University ofOxford, DPhil thesis.
Hay, S. I. (1997). Remote sensing and disease control: past,present and future. Transactions of the Royal Society of TropicalMedicine and Hygiene, 91, 105–106.
Hay, S. I., Tucker, C. J., Rogers, D. J. & Packer, M. J. (1996).Remotely sensed surrogates of meteorological data for thestudy of the distribution and abundance of arthropod vec-tors of disease. Annals of Tropical Medicine and Parasitology,90, 1–19.
Hay, S. I., Packer, M. J. & Rogers, D. J. (1997). The impact ofremote sensing on the study and control of invertebrate in-termediate hosts and vectors for disease. International Jour-nal of Remote Sensing, 18, 2899–2930.
Holben, B. N. (1986). Characteristics of maximum value com-posite images from temporal AVHRR data. InternationalJournal of Remote Sensing, 7, 1417–1434.
James, M. E. & Kalluri, S. N. V. (1994). The pathfinderAVHRR land data set—an improved coarse resolution dataset for terrestrial monitoring. International Journal of RemoteSensing, 15, 3347–3363.
Justice, C. O., Townshend, J. R. G., Holben, B. N. & Tucker,C. J. (1985). Analysis of the phenology of global vegetationusing meteorological satellite data. International Journal ofRemote Sensing, 6, 1271–1318.
Kerber, A. G. & Schutt, J. B. (1986). Utility of AVHRR chan-nel 3 and 4 in land-cover mapping. Photogrammetric Engi-neering and Remote Sensing, 52, 1877–1883.
Kidwell, K. B. (1995). NOAA polar orbiter data users’ guide (TI-ROS-N, NOAA-6, NOAA-7, NOAA-8, NOAA-9, NOAA-10,NOAA-11, NOAA-12, NOAA-13 and NOAA-14). Washing-ton, DC: National Oceanic and Atmospheric Administra-tion.
Lambin, E. F. & Ehrlich, D. (1995). Combining vegetation in-dexes and surface temperature for land-cover mapping atbroad spatial scales. International Journal of Remote Sensing,16, 573–579.
Linthicum, K. J., Bailey, C. L., Glyn Davies, F. & Tucker, C. J.(1987). Detection of Rift Valley fever viral activity in Kenyaby satellite remote sensing imagery. Science, 235,1656–1659.
Muir, D. A. (1988). Anopheline mosquitoes: vector reproduc-

20 SIMON I. HAY ET AL.
tion, life-cycle and biotype. In: Malaria: Principles and Prac-tice of Malariology, volume 2, Wernsdorfer, W. H. &McGregor, I. (editors). London: Churchill Livingstone, pp.431–451.
Omumbo, J., Ouma, J., Rapouda, B., Craig, M. H., Le Sueur,D. & Snow, R. W. (in press). Mapping malaria transmissionintensity using geographical information systems (GIS): anexample from Kenya. Annals of Tropical Medicine and Parasi-tology.
Myneni, R. B., Maggion, S., Iaquinto, J., Privette, J. L.,Gobron, N., Pinty, B., Kimes, D. S., Verstraete, M. M. &Williams, D. L. (1995). Optical remote sensing of vegeta-tion: modeling, caveats, and algorithms. Remote Sensing ofEnvironment, 51, 169–188.
Pope, K. O., Rejmankova, E., Savage, H. M., Arredondo-Jimenez, J. I., Rodriguez, M. H. & Roberts, D. R. (1994).Remote sensing of tropical wetlands for malaria control inChiapas, Mexico. Ecological Applications, 4, 81–90.
Price, J. C. (1984). Land surface temperature measurementsfrom the split window channels of the NOAA 7 advancedvery high resolution radiometer. Journal of Geophysical Re-search, 89, 7231–7237.
Rejmankova, E., Roberts, D. R., Pawley, A., Manguin, S. &Polanco, J. (1995). Predictions of adult Anopheles albimanusdensities in villages based on distances to remotely sensedlarval habitats. American Journal of Tropical Medicine and Hy-giene, 53, 482–488.
Roberts, D. R., Paris, J. F., Manguin, S., Harbach, R. E.,Woodruff, R., Rejmankova, E., Polanco, J., Wullschleger, B.& Legters, L. J. (1996). Predictions of malaria vector distri-bution in Belize based on multispectral satellite data. Amer-ican Journal of Tropical Medicine and Hygiene, 54, 304–308.
Rogers, D. J. (1991). Satellite imagery, tsetse and trypano-somiasis in Africa. Preventive Veterinary Medicine, 11,201–220.
Rogers, D. J. & Williams, B. G. (1993). Monitoring trypano-somiasis in space and time. Parasitology, 106, S77–S92.
Rogers, D. J. & Williams, B. G. (1994). Tsetse distribution inAfrica: seeing the wood and the trees. In: Large-scale Ecologyand Conservation Biology, Edwards, P. J., May, R. M. &Webb, N. R. (editors). Oxford: Blackwell Scientific Publica-tions, pp. 249–273.
Rogers, D. J., Hay, S. I. & Packer, M. J. (1996). Predicting thedistribution of tsetse flies in West Africa using temporal Fou-rier processed meteorological satellite data. Annals of TropicalMedicine and Parasitology, 90, 225–241.
Schmetz, J., Klaes, D. & Rattenborg, M. (1995). Meteorolog-ical products from current and future EUMETSAT satellitesystems. In: Proceedings of the 1995 Meteorological SatelliteData Users’ Conference. Darmstadt: EUMETSAT, publicationno. EUM P 17, pp. 233–240.
Sellers, P. J. (1985). Canopy reflectance, photosynthesis andtranspiration. International Journal of Remote Sensing, 6,1335–1372.
Slutsker, L., Taylor, T. E., Wirima, J. J. & Steketee, R. W.(1994). In-hospital morbidity and mortality due to malaria-associated severe anaemia in two areas of Malawi with differ-ent patterns of malaria infection. Transactions of the Royal So-ciety of Tropical Medicine and Hygiene, 88, 548–551.
Smith, T., Charlwood, J. D., Kihonda, J., Mwankuyse, S., Bil-lingsley, P., Meuwissen, J., Lyimo, E., Takken, W., Teuscher,T. & Tanner, M. (1993). Absence of seasonal variation in
malaria parasitaemia in an area of intense seasonal transmis-sion. Acta Tropica, 54, 55–72.
Snijders, F. L. (1991). Rainfall monitoring based on Meteosatdata — a comparison of techniques applied to the westernSahel. International Journal of Remote Sensing, 12,1331–1347.
Snow, R. W., Armstrong-Schellenberg, J. R. M., Peshu, N.,Forster, D., Newton, C. R. J. C., Winstanley, P. A., Mwangi,I., Waruiru, C., Warn, P. A., Newbold, C. & Marsh, K.(1993). Periodicity and space–time clustering of severechildhood malaria on the coast of Kenya. Transactions of theRoyal Society of Tropical Medicine and Hygiene, 87, 386–390.
Snow, R. W., Marsh, K. & le Sueur, D. (1996). The need formaps of transmission intensity to guide malaria control inAfrica. Parasitology Today, 12, 455–457.
Snow, R. W., Omumbo, J. A., Lowe, B., Molyneux, S. M., Obi-ero, J. O., Palmer, A., Weber, M. W., Pinder, M., Nahlen, B.,Obonyo, C., Newbold, C., Gupta, S. & Marsh, K. (1997).Relation between severe malaria morbidity in children andlevel of Plasmodium falciparum transmission in Africa. Lancet,349, 1650–1654.
Stowe, L. L., McClain, E. P., Carey, R., Pellegrino, P., Gut-man, G. G., Davia, P., Long, C. & Hart, S. (1991). Globaldistribution of cloud cover derived from NOAA/AVHRR op-erational satellite data. Advances in Space Research, 11,51–54.
Sugita, M. & Brutasaert, W. (1993). Comparison of land sur-face temperatures derived from satellite observations withground truth during FIFE. International Journal of RemoteSensing, 14, 1659–1676.
Thomson, M. C., Connor, S. J., Milligan, P. J. M. & Flasse, S.P. (1996). The ecology of malaria — as seen from Earth ob-servation satellites. Annals of Tropical Medicine and Parasitolo-gy, 90, 243–264.
Thomson, M. C., Connor, S. J., Milligan, P. & Flasse, S. P.(1997). Mapping malaria risk in Africa: what can satellitedata contribute? Parasitology Today, 13, 313–318.
Tucker, C. J. (1979). Red and photographic infrared linearcombinations for monitoring vegetation. Remote Sensing ofEnvironment, 8, 127–150.
Tucker, C. J. & Sellers, P. J. (1986). Satellite remote sensing ofprimary production. International Journal of Remote Sensing,7, 1395–1416.
Tucker, C. J., Townshend, J. R. G. & Goff, T. E. (1985a). Afri-can land-cover classification using satellite data. Science, 227,369–375.
Tucker, C. J., Vanpraet, C. L., Sharman, M. J. & Van Ittersum,G. (1985b). Satellite remote sensing of total herbaceous bio-mass production in the Senegalese Sahel: 1980–1984. Re-mote Sensing of Environment, 17, 233–249.
Wagner, V. E., Hill-Rowley, R., Narlock, S. A. & Newson, H.D. (1979). Remote sensing: a rapid and accurate method ofdata acquisition for a newly formed mosquito control dis-trict. Mosquito News, 39, 283–287.
Wood, B. L., Beck, L. R., Washino, R. K., Hibbard, K. A. &Salute, J. S. (1992). Estimating high mosquito-producingrice fields using spectral and spatial data. International Jour-nal of Remote Sensing, 13, 2813–2826.
Received 11 September 1997; revised 14 October 1997; ac-cepted for publication 5 November 1997