Predicting HCN gas generation in the SART process
12
Predicting HCN gas generation in the SART process Humberto Estay ⁎, Juan Becker, Pablo Carvajal, Francisco Arriagada Arcadis Chile, Antonio Varas 621, Providencia, Santiago, Chile abstract article info Article history: Received 15 October 2011 Received in revised form 22 December 2011 Accepted 22 December 2011 Available online 29 December 2011 Keywords: Gold–copper cyanidation SART process Cyanide recovery Hydrogen cyanide Modeling The SART (Sulphidization, Acidification, Recycling and Thickening) process is a novel industrial technology used in gold mining to recover cyanide and copper from cyanide solutions. Since the operation of this process involves hydrogen cyanide (HCN) generation, the design of the process must provide full control on gaseous HCN evolution to ensure personnel safety. Even though gas extraction and scrubber systems play a fundamental role in the control and reduction of potentially dangerous HCN levels, currently there are no formal methods to estimate the HCN generation in the SART process in order to afford a robust design for the extraction and scrubber systems. The objective of the present work is to propose a general methodology to predict the generation of HCN gas in the SART process. For this purpose, a mathematical model was developed, supported by the phenomenology of the process and considering the system's operational conditions. This model considers the chemical equilibrium of HCN in solution, the liquid–gas phase equilibrium and the mass transfer phenomena between the liquid and gas phases. The results predicted by the model have indicated very low rates of HCN gas generation (1–12 mg/hm 2 ), showing HCN concentrations below 4 ppm at the inlet of the scrubbing system under typical operational condi- tions. In addition, it was found that the generation of HCN gas is controlled by the liquid mass transfer resistance and, due to this reason, that the correct adjustment of operational parameters of the SART process can maximize the liquid mass transfer resistance, avoiding HCN volatilization. © 2011 Elsevier B.V. All rights reserved. 1. Introduction In recent years the gold mining industry has been greatly stimulated by a significant increase in gold prices, from 600 US$/Oz, average 2006, up to 1800 US$/Oz, in the second quarter 2011 (Mining Journal, 2011). World production has grown with commissioning and/or expansion of large projects such as Veladero in Argentina and Yanacocha in Peru, while others are in a development phase such as Pascua-Lama along the Argentinean-Chilean border, and Cerro Casale, Lobo-Marte, El Peñón expansion, Alhué expansion or Maricunga expansion in Chile. The high gold price has made possible to consider low grade ore reserves and/or ores having high copper content, usually present in the form of secondary sulphides. The presence of cyanide-soluble copper species in the ore produces a gradual increment in the concen- tration of copper-cyanide complexes in the solution circuit, which in- creases the cyanide consumption in the process. This fact is detrimental to the gold recovery process by reducing gold extraction in the carbon adsorption stage, increasing the elusion cycle and con- taminating the dore metal in some cases (Coderre and Dixon, 1999; Dai et al., 2010; Guzman, 2009; Marsden and House, 2006; Sceresini, 2005). The SART process for Au–Cu ores is a new technology which has received the industry's increasing interest. The process has first been developed by Lakefield Research in Canada for the Lobo-Marte project in Chile, which at that time was owned by a joint venture between Teck Corporation and Mantos Blancos (MacPhail et al., 1998). The Telfer plant in Australia owned by Newcrest Mining Limited pioneered the ap- plication of this technology (Barter et al., 2001) by running a 40 m 3 /h SART plant. Nowadays, there are four new SART plants: 1400 m 3 /h in Yanacocha, Newmont Mining Corporation, Peru, (Botz and Acar, 2008; Guzman, 2009); 350 m 3 /h in Lluvia de Oro, Columbia Metals, Mexico; 140 m 3 /h in Gedabek, Azerbaijan International Mining Company, Azer- baijan; and 120 m 3 /h in Mastra, Koza Gold, Turkey. Currently Kinross Gold Corporation is building a 750 m 3 /h SART plant at Maricunga in Chile (Ford et al., 2008). The key objective of the SART process is to recover copper and cya- nide from heap leaching solutions. Previous technologies were developed in order to recover cyanide, such as acidification–volatilization– regeneration (AVR) process, Cyanisorb process and Metallgeselt- shaft Natural Resources (MNR) process. The AVR and Cyanisorb processes have been mainly implemented to recover cyanide from tailings in the gold mining, whereas the MNR process has been only applied in pilot scale (Fleming, 2005). The SART process operates at conditions below pH 5.0 and, at this condition, the cyanide content is present as hydrogen cyanide, the most toxic form of cyanide when volatilized (Logsdon et al., 1999; Mudder and Botz, 2004). Hydrometallurgy 113–114 (2012) 131–142 ⁎ Corresponding author. Tel.: +56 2 386 20 54; fax: +56 2 381 60 01. E-mail addresses: [email protected], [email protected] (H. Estay). 0304-386X/$ – see front matter © 2011 Elsevier B.V. All rights reserved. doi:10.1016/j.hydromet.2011.12.019 Contents lists available at SciVerse ScienceDirect Hydrometallurgy journal homepage: www.elsevier.com/locate/hydromet
-
Upload
arcadis-us -
Category
Documents
-
view
2 -
download
0
Transcript of Predicting HCN gas generation in the SART process

Hydrometallurgy 113–114 (2012) 131–142
Contents lists available at SciVerse ScienceDirect
Hydrometallurgy
j ourna l homepage: www.e lsev ie r .com/ locate /hydromet
Predicting HCN gas generation in the SART process
Humberto Estay ⁎, Juan Becker, Pablo Carvajal, Francisco ArriagadaArcadis Chile, Antonio Varas 621, Providencia, Santiago, Chile
⁎ Corresponding author. Tel.: +56 2 386 20 54; fax:E-mail addresses: [email protected], humbe
(H. Estay).
0304-386X/$ – see front matter © 2011 Elsevier B.V. Aldoi:10.1016/j.hydromet.2011.12.019
a b s t r a c t
a r t i c l e i n f oArticle history:Received 15 October 2011Received in revised form 22 December 2011Accepted 22 December 2011Available online 29 December 2011
Keywords:Gold–copper cyanidationSART processCyanide recoveryHydrogen cyanideModeling
The SART (Sulphidization, Acidification, Recycling and Thickening) process is a novel industrial technologyused in gold mining to recover cyanide and copper from cyanide solutions. Since the operation of this processinvolves hydrogen cyanide (HCN) generation, the design of the process must provide full control on gaseousHCN evolution to ensure personnel safety. Even though gas extraction and scrubber systems play a fundamentalrole in the control and reduction of potentially dangerous HCN levels, currently there are no formal methods toestimate the HCN generation in the SART process in order to afford a robust design for the extraction and scrubbersystems. The objective of the present work is to propose a general methodology to predict the generation of HCNgas in the SART process. For this purpose, amathematicalmodelwas developed, supportedby the phenomenologyof the process and considering the system's operational conditions. Thismodel considers the chemical equilibriumof HCN in solution, the liquid–gas phase equilibrium and themass transfer phenomena between the liquid and gasphases. The results predicted by the model have indicated very low rates of HCN gas generation (1–12 mg/hm2),showing HCN concentrations below 4 ppm at the inlet of the scrubbing system under typical operational condi-tions. In addition, it was found that the generation of HCN gas is controlled by the liquid mass transfer resistanceand, due to this reason, that the correct adjustment of operational parameters of the SART process can maximizethe liquid mass transfer resistance, avoiding HCN volatilization.
© 2011 Elsevier B.V. All rights reserved.
1. Introduction
In recent years the goldmining industry has been greatly stimulatedby a significant increase in gold prices, from 600 US$/Oz, average 2006,up to 1800 US$/Oz, in the second quarter 2011 (Mining Journal, 2011).World production has grown with commissioning and/or expansion oflarge projects such as Veladero in Argentina and Yanacocha in Peru,while others are in a development phase such as Pascua-Lama alongthe Argentinean-Chilean border, and Cerro Casale, Lobo-Marte, ElPeñón expansion, Alhué expansion or Maricunga expansion in Chile.
The high gold price has made possible to consider low grade orereserves and/or ores having high copper content, usually present inthe form of secondary sulphides. The presence of cyanide-solublecopper species in the ore produces a gradual increment in the concen-tration of copper-cyanide complexes in the solution circuit, which in-creases the cyanide consumption in the process. This fact isdetrimental to the gold recovery process by reducing gold extractionin the carbon adsorption stage, increasing the elusion cycle and con-taminating the dore metal in some cases (Coderre and Dixon, 1999;Dai et al., 2010; Guzman, 2009; Marsden and House, 2006;Sceresini, 2005).
+56 2 381 60 [email protected]
l rights reserved.
The SART process for Au–Cu ores is a new technology which hasreceived the industry's increasing interest. The process has first beendeveloped by Lakefield Research in Canada for the Lobo-Marte projectin Chile, which at that time was owned by a joint venture betweenTeck Corporation andMantos Blancos (MacPhail et al., 1998). The Telferplant in Australia owned byNewcrestMining Limited pioneered the ap-plication of this technology (Barter et al., 2001) by running a 40 m3/hSART plant. Nowadays, there are four new SART plants: 1400 m3/h inYanacocha, Newmont Mining Corporation, Peru, (Botz and Acar, 2008;Guzman, 2009); 350 m3/h in Lluvia de Oro, Columbia Metals, Mexico;140 m3/h in Gedabek, Azerbaijan International Mining Company, Azer-baijan; and 120 m3/h in Mastra, Koza Gold, Turkey. Currently KinrossGold Corporation is building a 750 m3/h SART plant at Maricunga inChile (Ford et al., 2008).
The key objective of the SART process is to recover copper and cya-nide fromheap leaching solutions. Previous technologieswere developedin order to recover cyanide, such as acidification–volatilization–regeneration (AVR) process, Cyanisorb process and Metallgeselt-shaft Natural Resources (MNR) process. The AVR and Cyanisorbprocesses have been mainly implemented to recover cyanidefrom tailings in the gold mining, whereas the MNR process hasbeen only applied in pilot scale (Fleming, 2005).
The SART process operates at conditions below pH 5.0 and, at thiscondition, the cyanide content is present as hydrogen cyanide, themost toxic form of cyanide when volatilized (Logsdon et al., 1999;Mudder and Botz, 2004).
132 H. Estay et al. / Hydrometallurgy 113–114 (2012) 131–142
The design of SART plants is new and little information can befound from literature and bench marking. Still, several engineeringchallenges must be undertaken in the design in order to ensure theoperators' safety and the metallurgical performance (Estay et al.,2010).
In this scenario there is a need to predict and quantify the gener-ation of HCN gas during the SART process operation in order to sup-port the design of scrubbing systems, detect the most dangerousunit operations and to design ventilation systems that minimize therisk to personnel.
2. Description of the SART process
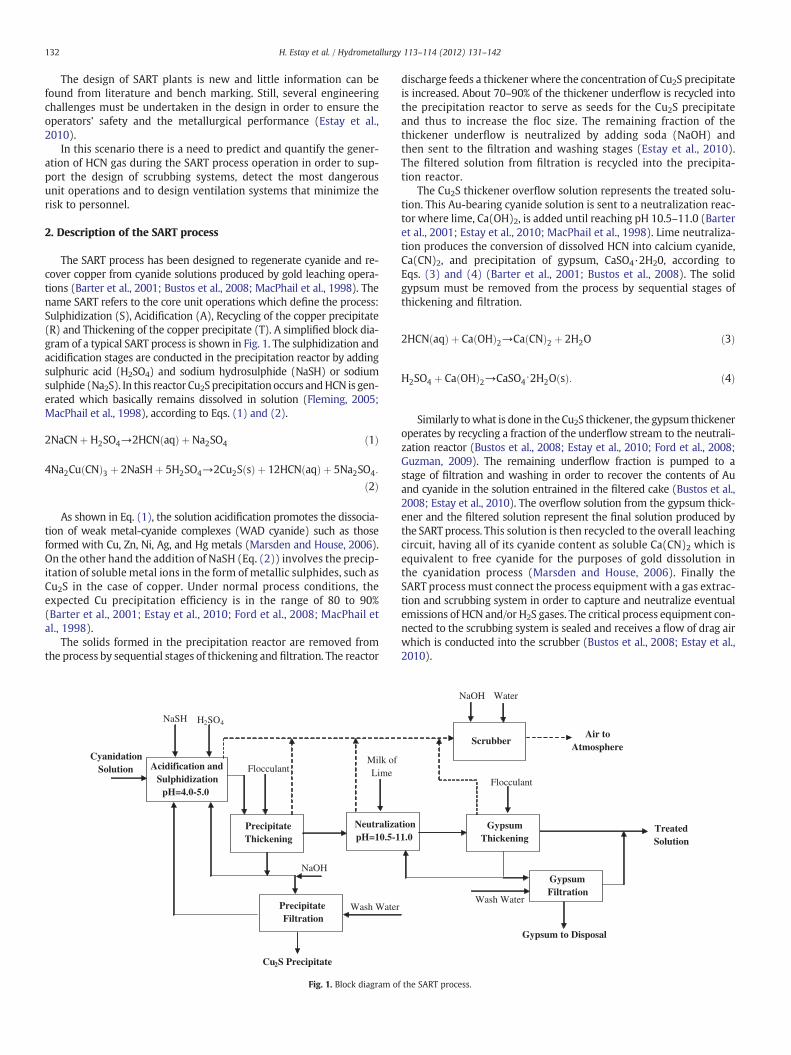
The SART process has been designed to regenerate cyanide and re-cover copper from cyanide solutions produced by gold leaching opera-tions (Barter et al., 2001; Bustos et al., 2008; MacPhail et al., 1998). Thename SART refers to the core unit operations which define the process:Sulphidization (S), Acidification (A), Recycling of the copper precipitate(R) and Thickening of the copper precipitate (T). A simplified block dia-gram of a typical SART process is shown in Fig. 1. The sulphidization andacidification stages are conducted in the precipitation reactor by addingsulphuric acid (H2SO4) and sodium hydrosulphide (NaSH) or sodiumsulphide (Na2S). In this reactor Cu2S precipitation occurs andHCN is gen-erated which basically remains dissolved in solution (Fleming, 2005;MacPhail et al., 1998), according to Eqs. (1) and (2).
2NaCNþ H2SO4→2HCN aqð Þ þNa2SO4 ð1Þ
4Na2Cu CNð Þ3 þ 2NaSHþ 5H2SO4→2Cu2S sð Þ þ 12HCN aqð Þ þ 5Na2SO4:
ð2Þ
As shown in Eq. (1), the solution acidification promotes the dissocia-tion of weak metal-cyanide complexes (WAD cyanide) such as thoseformed with Cu, Zn, Ni, Ag, and Hg metals (Marsden and House, 2006).On the other hand the addition of NaSH (Eq. (2)) involves the precip-itation of soluble metal ions in the form of metallic sulphides, such asCu2S in the case of copper. Under normal process conditions, theexpected Cu precipitation efficiency is in the range of 80 to 90%(Barter et al., 2001; Estay et al., 2010; Ford et al., 2008; MacPhail etal., 1998).
The solids formed in the precipitation reactor are removed fromthe process by sequential stages of thickening and filtration. The reactor
Fig. 1. Block diagram of
discharge feeds a thickener where the concentration of Cu2S precipitateis increased. About 70–90% of the thickener underflow is recycled intothe precipitation reactor to serve as seeds for the Cu2S precipitateand thus to increase the floc size. The remaining fraction of thethickener underflow is neutralized by adding soda (NaOH) andthen sent to the filtration and washing stages (Estay et al., 2010).The filtered solution from filtration is recycled into the precipita-tion reactor.
The Cu2S thickener overflow solution represents the treated solu-tion. This Au-bearing cyanide solution is sent to a neutralization reac-tor where lime, Ca(OH)2, is added until reaching pH 10.5–11.0 (Barteret al., 2001; Estay et al., 2010; MacPhail et al., 1998). Lime neutraliza-tion produces the conversion of dissolved HCN into calcium cyanide,Ca(CN)2, and precipitation of gypsum, CaSO4·2H20, according toEqs. (3) and (4) (Barter et al., 2001; Bustos et al., 2008). The solidgypsum must be removed from the process by sequential stages ofthickening and filtration.
2HCN aqð Þ þ Ca OHð Þ2→Ca CNð Þ2 þ 2H2O ð3Þ
H2SO4 þ Ca OHð Þ2→CaSO4⋅2H2O sð Þ: ð4Þ
Similarly towhat is done in theCu2S thickener, the gypsum thickeneroperates by recycling a fraction of the underflow stream to the neutrali-zation reactor (Bustos et al., 2008; Estay et al., 2010; Ford et al., 2008;Guzman, 2009). The remaining underflow fraction is pumped to astage of filtration and washing in order to recover the contents of Auand cyanide in the solution entrained in the filtered cake (Bustos et al.,2008; Estay et al., 2010). The overflow solution from the gypsum thick-ener and the filtered solution represent the final solution produced bythe SART process. This solution is then recycled to the overall leachingcircuit, having all of its cyanide content as soluble Ca(CN)2 which isequivalent to free cyanide for the purposes of gold dissolution inthe cyanidation process (Marsden and House, 2006). Finally theSART process must connect the process equipment with a gas extrac-tion and scrubbing system in order to capture and neutralize eventualemissions of HCN and/or H2S gases. The critical process equipment con-nected to the scrubbing system is sealed and receives a flow of drag airwhich is conducted into the scrubber (Bustos et al., 2008; Estay et al.,2010).
the SART process.

133H. Estay et al. / Hydrometallurgy 113–114 (2012) 131–142
3. Modeling HCN gas generation in the SART process
3.1. Chemical equilibrium in solution
The cyanide anion in water forms hydrocyanic acid according tothe following dissociation reaction (Marsden and House, 2006):
HCN↔Hþ þ CN−: ð5Þ
The logarithmic exponent of the dissociation constant pKa of HCNat 25 °C is 9.21 (Izzat et al., 1962; Lu et al., 2002). pKa values higherthan 9.21 increase the cyanide anion content in comparison withthe dissolved HCN content while pKa values lower than 9.21 promotethe presence of dissolved HCN in the solution. A typical curve of HCNand cyanide anion distribution in aqueous solution at 25 °C is shownin Fig. 2. Thus, the amount of HCN in solution depends on the systempH and, for this reason, the characteristic processing condition callsfor a low pH range (pH 4.0–5.0) (Barter et al., 2001; MacPhail et al.,1998). Therefore the HCN and CN− contents in solution can be deter-mined at a fixed temperature by the equilibrium constant (Ka) de-scribed by Eq. (6):
Ka ¼Hþ� �
CN−½ �HCN½ � : ð6Þ
In the SART process, WAD cyanide complexes can be dissociatedby decreasing the pH of the cyanide solution. The percentage of dis-solved HCN, at any pH value, can be estimated using theWAD cyanideconcentration, which is composed by the HCN and CN− concentra-tions as Eq. (7) shows:
CN½ �WAD ¼ CN−½ � þ HCN½ �: ð7Þ
Combining Eqs. (6) and (7), a mathematical model is obtained toestimate the effect of pH on the HCN concentration in the solution:
HCN½ � ¼ CN½ �WAD10−pH
10−pH þ 10−pKa: ð8Þ
On the other hand, the dissolved HCN content depends on tempera-ture, since the chemical equilibrium of Eq. (5) depends on temperature.This relationship is described by the Van't Hoff's equation as (Marsdenand House, 2006):
dLnKa
dT¼ Δh
RT2 ð9Þ
where Δh is the standard enthalpy change of reaction and R is the uni-versal gas constant (8.314 J/mol K). The value of Δh is 43.5 kJ/mol at
0.0
0.2
0.4
0.6
0.8
1.0
5 6 7 8 9 10 11 12
pH
Ioni
zati
on F
ract
ion,
[H
CN
]/[C
N- ]
HCN
CN-
Fig. 2. HCN and cyanide anion distribution in aqueous solution at 25 °C.
25 °C (Izzat et al., 1962; Lu et al., 2002). It has been considered as a con-stant value for the operation temperatures analyzed in the currentstudy (Lu et al., 2002).
3.2. Liquid–gas phase equilibrium of HCN
As mentioned above the SART process includes a gas extractionand scrubbing system connected to the process equipment wheredrag air flows over the cyanide solution which they contain. This condi-tion generates a liquid–gas interface, where dissolved HCN is volatilizedinto the air as HCN gas. At the interface the equal chemical potentialsbetween both phases generates a liquid–gas phase equilibrium whichcan be determined by Henry's law for HCN (Smith et al., 2005):
P yHCN ¼ HHCN xHCN ð10Þ
where P is the pressure of the system (atm), yHCN is themolar fraction ofHCN in the gas phase,HHCN is the Henry's law constant (atm/molar frac-tion) and xHCN is themolar fraction of HCN in the liquid phase. The Hen-ry's law constant depends on temperature in a logarithmic relationship.E.I. du Pont (1991) reported data of HCN phase equilibrium, which hasbeen adjusted in this work, to obtain the following Eq. (11):
Ln HHCN ¼ −3638:8T
þ 18:539 ð11Þ
whereHHCN is Henry's law constant (kPa/mol fraction) and T is absolutetemperature (K). E.I. du Pont's data were measured between 0 and50 °C and 0–3.5 wt.% of HCN in solution. For typical operational condi-tions of the SART process, Henry's law constant ranges from 2 to7 atm/molar fraction, values which are 100-times lower than thosefound for other gases such as H2S (Perry and Green, 1997). This fact isrelevant for the SART process, because the HCN contained in the liquidphase tends to remain in solution inhibiting rapid HCN volatilization.
However, estimation of HCN gas generation by thermodynamicsphase equilibrium is valid for static systems, where the chemical po-tentials in both phases are equal. For dynamic systems, like the SARTprocess, the chemical potentials are not equal in the bulk phases, butonly at the liquid–gas interface. Thus, HCN transfer from the bulk ofthe liquid phase to the gas phase is determined by the kinetics ofmass transfer.
3.3. Mass transfer of HCN in the SART process
Mass transfer of HCN from cyanide solution into the air is deter-mined by the difference of chemical potentials between liquid phaseand gas phase (Bird et al., 2007; Cussler, 2009). The HCN transferrate for this system can be estimated by a HCN concentration gradientbetween the bulk and the interface in the gas phase, and amass transfercoefficient, which is dependent on the geometry of the system, physicalproperties of fluids and operational conditions (Cussler, 2009; Treybal,1980). Thus, the HCN transfer rate can be described by:
JHCN ¼ kg C0HCNg−CHCNg
� �ð12Þ
where JHCN is the HCN molar flux per transfer area (mol/m2s), kg thelocal mass transfer coefficient of gas phase (m/s), C0
HCNg the concentra-tion of HCN in equilibrium at the interface of gas phase (mol/m3), andCHCNg the concentration of HCN in the bulk of gas phase (mol/m3).Eq. (12) could be rewritten based on the liquid phase, in such a waythat the magnitude of the HCN transfer rate would be similar to theone when using the gas phase (Treybal, 1980). Fig. 3 shows a schematicdiagram for theHCNmass transfer promoted by a concentration gradientfrom the bulk of the liquid phase to the bulk of the gas phase, HCN beingvolatilized at the interface.

Ni
Air flow
Solution flowCHCNl
CHCNl0
CHCNg0
Liquid phase
Gas phase
CHCNl>CHCNl0
CHCNg>CHCNg0
Fig. 3. Schematic diagram of the HCN mass transfer from the bulk of the liquid phase tothe bulk of the gas phase.
ΔCHCNg
ΔCHCNl
CHCNg1
Solution flow CHCNl=CHCNl*CHCNg* >CHCNg
Air flow
Gas phase
Liquid phase
Ni
CHCNg2*
CHCNl2*
CHCNg1*
CHCNl1*
CHCNl1
CHCNg2
CHCNl2
Fig. 4. Schematic model of the gaseous HCN generation in the equipment of the SARTprocess. Subscripts 1 and 2 correspond to the ends of the equipment.
134 H. Estay et al. / Hydrometallurgy 113–114 (2012) 131–142
The above description of HCN mass transfer represents only localprofiles. However, an overall analysis should be made if continuoussystems such as the SART process are being studied. The overallHCN transfer rate is specified by the concentration profiles in thevolume of each equipment operating in the process. Thus, to quantifythe overall HCN transfer rate in the system, it is necessary to solveEq. (12) for each equipment with an infinitesimal mass balance.Treybal (1980) developed these expressions and proposed the followinggeneral equation:
Ni ¼ Kg AT ΔC gml: ð13Þ
In Eq. (13) Ni is the overall HCN transfer rate (mol/s), Kg is theoverall mass transfer coefficient based on gas phase (m/s), AT is thetotal area of mass transfer (m2), and ΔCml
g is the logarithmic meandriving force in the gas phase (mol/m3) (Bird et al., 2007; Treybal,1980) expressed by:
ΔC gml ¼
C�HCNg−CHCNg
� �1− C�
HCNg−CHCNg
� �2
lnC�HCNg−CHCNg
� �1
C�HCNg−CHCNig
� �2
� ð14Þ
where 1 and 2 represent the equipment input/output conditions andCHCNg⁎ is the pseudo-equilibrium concentration of HCN in the gasphase, represented as follows by Henry's phase equilibrium(usingconcentration units):
C�HCNg ¼ mHCN CHCNl: ð15Þ
Here CHCNl is the concentration of HCN in the bulk of the solution(mol/m3) and mHCN is the partition constant (HHCN/P), in mol ofHCN in the gas phase per mol of HCN in the liquid phase.
The pseudo-equilibrium concentration used in this analysis is use-ful to incorporate the overall mass transfer coefficient in the estima-tion of the transferred solute flow. The overall mass transfercoefficients are widely used to estimate mass transfer of solutes bythe incorporation of the mass transfer resistance concept (Cussler,
2009; Treybal, 1980). In terms of the SART process, the volatilizationof HCN is controlled by the mass transfer resistance in the liquid andgas phases (Cussler, 2009; Dzombak et al., 2006; Treybal, 1980),which can be estimated by using a mass transfer model ofresistances-in-series, expressed as follows:
1Kg
¼ 1kg
þmHCN
klð16Þ
where kg is the local mass transfer coefficient in the gas phase and kl isthe local mass transfer coefficient in the liquid phase. The overallmass transfer resistance in the SART process is represented by 1/Kg,while the local mass transfer resistances in the gas and liquid phasesare described by 1/kg and 1/kl, respectively. The resistances-in-seriesmass transfer model is based on one-phase diffusion (i.e. gas phase)and assumes that the overall mass transfer resistance only occurs inthis phase. Thus, the phase equilibrium at the interface can be deter-mined by using the bulk concentration of the other phase (i.e. liquidphase), which is in equilibrium with the pseudo-equilibrium concen-tration. A schematic model of the process using pseudo-equilibriumconcentrations is shown in Fig. 4.
The resistances-in-series mass transfer model is useful for indus-trial processes where the determination of concentrations at the in-terface is complex. This model has been applied in differentseparation or volatilization processes such as gas absorption inpacked towers (Treybal, 1980), supercritical separation of fluids inmembrane contactors (Estay et al., 2007), and HCN volatilization intailings (Lotter, 2006).
3.4. Estimation of local mass transfer coefficients in the SART process
The estimation of the local mass transfer coefficients is based onthe Chilton–Colburn's correlations (Bird et al., 2007; Cussler, 2009),which consider the geometry of the system and the following dimen-sionless numbers: Reynolds (Re), Schmidt (Sc) and Sherwood (Sh).The local mass transfer coefficient in every equipment can be deter-mined by mass transfer correlations, assuming that the air flow isdriven in a countercurrent configuration with respect to the solutionflow. In addition, it is assumed that a flat plate geometry representsthe HCN mass transfer in the gas phase for each equipment of the

135H. Estay et al. / Hydrometallurgy 113–114 (2012) 131–142
process. Treybal (1980) proposed a mass transfer correlation for flatplate systems in laminar flow conditions (i.e. Reb50,000),
Sh ¼ 0:664 Re0:5Sc1=3 ð17Þ
where:
Sh ¼ kgDHCN−air
LFPð18Þ
Re ¼ ρairvairLFPμair
ð19Þ
Sc ¼ μair
ρairDHCN−air: ð20Þ
In the above equations, DHCN-air is the diffusion coefficient of HCNin air, LFP is the length of flat plate (e.g. equivalent to the equipmentdiameter), ρair is the air density, vair is the air flow velocity in theequipment, and μair is the air viscosity. Due to the low HCN concentra-tions in the gas phase, density and viscosity for this phase are as-sumed similar to those specified for the air.
On the other hand, the mass transfer correlations for the liquidphase are strongly dependent on the equipment geometry (e.g. reac-tion vessels, agitated tanks and thickeners). Cussler (2009) reported amass transfer correlation for agitated tanks systems, which is relatedto the agitation power/tank volume ratio (W/V), length of the tank(LAT) and physical properties of the liquid:
Sh ¼ 0:13L4AT W=Vð Þρ2
μ3
" #1=4
Sc1=3: ð21Þ
The Sh and Sc numbers in Eq. (21) are described by:
Sh ¼ klDHCN−liq
LATð22Þ
Sc ¼ μ liq
ρliqDHCN−liq: ð23Þ
where DHCN-liq is the diffusion coefficient of HCN in liquid phase, μliq isthe viscosity of the liquid phase, and ρliq is the density of the liquidphase. Due to the low HCN concentrations in the SART process liquidphase, the density and viscosity for this phase are assumed similar tothose specified for water.
In the SART process, HCNmass transfer occurs also in the thickeners.Here the solutionflowvelocitymust be sufficiently low to ensure settlingof the solids and in that condition a natural convection model (Treybal,1980) could be used to estimate the local mass transfer coefficient inthe liquid phase. This parameter is given by:
kl ¼DHCN−liq
zð24Þ
where z is the distance between the bulk of solution in the thickener andthe liquid–gas interface.
The estimation of the local mass transfer coefficients requires deter-mination of the physical properties of the liquid and gas phases. Thesephysical properties can be estimated by empirical and semi-empiricalmodels dependent on the operational conditions of the system. Thusfor the air phase the density can be calculated by the ideal gas law(Smith et al., 2005), while the viscosity can be estimated by theChapman–Enskog's model (Bird et al., 2007). Likewise experimen-tal data of density and viscosity for the liquid phase can be obtainedfrom Perry and Green (1997), which has been correlated as a func-tion of temperature by Estay et al. (2007).
Finally HCN diffusion coefficient values for different temperatureand pressure conditions in the air phase are extrapolated from exper-imental data, based on the Chapman-Enskog's theory of gaseousdiffusion (Cussler, 2009). Klotz and Miller (1947) measured a DHCN-air
equals to 0.173 cm2/s at 0 °C and 1 atm and from this value it ispossible to specify the DHCN-air for other temperature and pressureconditions as follows:
DHCN−air TA; PAð ÞDHCN−air TB; PBð Þ ¼
T3=2A PB
T3=2B PA
: ð25Þ
Similarly, the HCN diffusion coefficient in water can be estimatedfrom experimental data dependent on water temperature and viscos-ity, based on the Stokes–Einstein's equation (Cussler, 2009). Lotter(2006) adapted the HCN diffusion coefficient in water from Dodgeand Zabban (1952), obtaining a value of 1.72×10⁻⁵ cm2/s at 20 °C.Considering the above value the HCN diffusion coefficient in waterfor different conditions can be finally determined by:
DHCN−liq TAð ÞDHCN−liq TBð Þ ¼
TAμB
TBμA: ð26Þ
4. Model development
The model of gaseous HCN generation constructed in this study isbased on the theoretical background described above and on the de-sign criteria of the SART process. Equations were derived in order todetermine the HCN transferred from the cyanide solution into theair and the HCN concentration reached in the air. The model proposedis applied only to the equipment connected to the scrubber system inthe SART process (see Fig. 1), such as reactors and thickeners.
4.1. Design criteria of the SART process
The HCN volatilization in the SART process depends on the siteconditions (temperature and pressure), operational parameters (pHand cyanide concentration in the feed solution) and design criteriaof SART process (residence time of reactors, rise rate of thickeners,drag air velocity on the liquid surface in each equipment, agitationpower in the reactors and mechanical conditions of the equipment).
The Cu2S precipitation stage in the SART processmust operate belowpH 5.0 tomaximize the copper precipitation (Barter et al., 2001; Estay etal., 2010; MacPhail et al., 1998). Additionally Barter et al. (2001) andFord et al. (2008) recommended operating conditions over pH 4.5 to re-duce acid and lime consumptions. In turn, the neutralization stage mustoperate in conditions ranging frompH10.5 to pH 11.0 in order to recyclethe treated solution to the cyanidation process (Barter et al., 2001;MacPhail et al., 1998).
The volume (V) of the reactors is defined by the residence time (τ)and the volumetric flow F of the cyanide solution (Eq. (27)), wherethe ratio length/diameter of the reactors defines the surface area ormass transfer area.
V ¼ F⋅τ ð27Þ
It has been suggested that a residence time of 10 min is quite ad-equate to operate the precipitation reactor (Barter et al., 2001; Estayet al., 2010; Ford et al., 2008; MacPhail et al., 1998). Also the residencetime in the neutralization reactor should fluctuate between 5 and15 min. according to the data reported by MacPhail et al. (1998).However, to ensure process efficiency the residence time of the neu-tralization reactor could be longer than 20 min. Ultimately, the de-sign of the reactors is completed using a ratio length/diameter of1.0.

Table 1Design criteria of the SART process used for simulation.
Parameter Value
pH in the precipitation stage 5.0pH in the neutralization stage 11.0Residence time in the precipitation stage (min) 10.0Residence time in the neutralization stage (min) 20.0Length/diameter ratio for reactors (m/m) 1.0Rise rate in the precipitation thickener (m3/hm2) 2.5Rise rate in the gypsum thickener (m3/hm2) 3.5Power/volume ratio for reactors (W/m3) 75.0Drag-air velocity in the liquid-free volume of sealed equipment (m/s) b0.05Free volume in reactors (%) 5.0Free volume in thickeners (%) 20.0
136 H. Estay et al. / Hydrometallurgy 113–114 (2012) 131–142
Thickeners are also key equipment in the SART process, providingclarification of the cyanide solution as a main role. Thickener size isdetermined by the rise rate (vRR), defined as the up-flow velocity ofthe solution in the equipment which must be lower than the settlingrate of solids. Eq. (28) describes the relationship between the rise rateand the settling area (AS). Estay et al. (2010) reported rise rate valuesof 2–4 m3/hm2 for precipitation thickeners in the SART process. On the
Fig. 5. Schematic diagram of the algorithm used to estimat
other hand, Barter et al. (2001) reported rise rate values for gypsumthickener of 2–6 m3/hm2.
AS ¼FvRR
: ð28Þ
Moreover, precipitate handling in theprocess is a key factor to guaran-tee the correct performance of the thickening and filtering processes.Thus, the accurate selection of recirculation pumps and agitation velocityin the reactors and tanks is relevant (Estay et al., 2010). In this work theagitation velocity in the reactors of 50 rpmhas been established as designcriterion in order to promote the solution homogenizationwhile avoidingparticle breakdown. Agitation velocity, impeller diameter and reactor vol-ume determine the agitation power (Perry and Green, 1997; Treybal,1980) and consequently the power/volume ratio. A low agitation velocityin the reactors can be adjustedwith power/volume ratios between50 and100W/m3.
Finally the drag-air velocity in sealed equipment depends on theirliquid-free volume. This velocity must be lower than the respectivevelocity in ducts in order to minimize the local mass transfer coeffi-cient. It is recommended to control the air flow distribution in eachequipment, reaching an air velocity of less than 0.05 m/s, accordingto the geometry analyzed. The liquid-free volume in reactors andthickeners is assumed as 5% and 20% of total volume, respectively.
e the generation of gaseous HCN in the SART process.

Table 2Standard conditions of the SART process.
Parameter Value
pH in the precipitation stage 5.0pH in the neutralization stage 11.0Temperature (K) 278.15Ambient pressure (kPa) 93.3WAD cyanide concentration (mg/L) 800.0
39
40
41
42
43
0.5 1.5 2.5 3.5 4.5 5.5
0.5 1.5 2.5 3.5 4.5 5.5
HC
N t
rans
ferr
ed r
atio
(m
g/m
2 h)H
CN
tra
nsfe
rred
rat
io (
mg/
m2 h)
Drag-air flow/feed solution volumentric ratio
Drag-air flow/feed solution volumentric ratio
(a)
0.0
0.5
1.0
1.5
2.0
2.5
SART PlantNeutralization reactorGypsum thickenerPrecipitation thickener
(b)
Fig. 6. Influence of the drag-air/feed solution volumetric ratio on the HCN transferredratio in each equipment of the SART process, (a) precipitation reactor, (b) neutralizationreactor, thickeners and overall SART plant.
85
90
95
100
0.5 1.5 2.5 3.5 4.5 5.5
Per
cent
age
of m
ass
tran
sfer
re
sist
ance
(%
)
Neutralization reactorGypsum thickenerPrecipitation thickenerPrecipitation reactor
Drag-air flow/feed solution volumentric ratio
Fig. 7. Effect of the drag-air/feed solution volumetric ratio on the percentage of localmass transfer resistance in the liquid phase.
137H. Estay et al. / Hydrometallurgy 113–114 (2012) 131–142
The summary of the SART process design criteria and parametersfor the model of HCN gas generation is shown in Table 1.
4.2. Assumptions
In order to apply the simulation model proposed in this study,specific considerations and assumptions were introduced into thetheoretical approach. These are the following:
a) The SART process is an isothermal process, operated under steady-state conditions.
b) Copper recovery is assumed as 100% for purposes of HCN generationestimation.
c) Mass transfer correlations for agitated tank systems in the precip-itation and neutralization reactors have been defined for the liquidphase. Also mass transfer correlations for natural convection inthickeners have been defined for the liquid phase.
d) In the gas phase mass transfer correlations have considered flatplate geometry.
e) The model assumes that the solution flow and the air flow areconducted in countercurrent configuration.
f) The physical properties of water were used to define the physicalproperties of the liquid phase.
g) The physical properties of air were used to define the physicalproperties of the gas phase.
h) The results of the model are reported on air-dry basis.
4.3. Numerical solution of the model
The model of HCN gas generation in the SART process has been de-veloped by a numerical algorithm that estimates the transferred HCNfrom cyanide solution into the air for each process equipment. The al-gorithm estimates HCN transfer by comparing the value obtainedfrom the resistances-in-series mass transfer model (Eqs. (13–16))and the cyanide mass balance described by Eq. (29). When the differ-ence between the HCN transferred values is lower than the set target,the iterative routine is finished.
Finlet xinlet þ Ginlet yinlet ¼ Foutlet xoutlet þ Goutlet youtlet : ð29Þ
In Eq. (29) F is the total solution flow, G is the drag-air flow, x isthe cyanide concentration in the solution, and y is the cyanide con-centration in the air. The results of the model are reported as evapo-rated HCN mass per equipment, HCN concentration in the gas phaseand the total mass of evaporated HCN going to the scrubbing system.A schematic diagram of the algorithm outlined is shown in Fig. 5. Ad-ditionally the model includes a cyanide overall mass balance in theprocess which is solved on the basis of the results obtained by themodel of gaseous HCN generation.
5. Results and discussion
The simulation of HCN gas generation in the SART process has per-mitted to identify the key parameters in the system. In this context,ambient conditions (temperature and atmospheric pressure) and op-erational parameters (drag-air flow/feed solution ratio, cyanide
concentration in the feed solution and pH in the precipitation stage)have been analyzed. Additionally, percentages of the mass transfer re-sistances in the liquid and gas phases under standard conditions ofthe SART process (Table 2) have been estimated. HCN gas generationin the SART process is presented as mass of HCN transferred from so-lution to air per mass transfer area. This parameter has been calledHCN transferred ratio, mg/hm2. All simulations have been conductedunder the design parameters and operational conditions as shown inTables 1 and 2.
5.1. Effect of drag-air flow on HCN generation
A simulation of the SART process was carried out by varying thedrag air/feed solution volumetric ratio in order to obtain the HCNtransferred ratio, mg/hm2, from solution into the air. The globalHCN gas generation increases about 8%when the drag-air/feed solutionvolumetric ratio is increased from 0.5 to 5.0 (Fig. 6). The highest HCN

0
10
20
30
40
50
60
0.5 1.5 2.5 3.5 4.5 5.5
0.5 1.5 2.5 3.5 4.5 5.5
(a)
0.0
1.0
2.0
3.0
4.0
5.0
HC
N c
once
ntra
tion
in t
he a
ir
flow
(pp
m)
HC
N c
once
ntra
tion
in t
he a
ir
flow
(pp
m)
Scrubber inletNeutralization reactorGypsum thickenerPrecipitation thickener
(b)Drag-air flow/feed solution volumentric ratio
Drag-air flow/feed solution volumentric ratio
Fig. 8. HCN concentration for different drag-air flow/feed solution volumetric ratios ineach equipment of the SART process, (a) precipitation reactor, (b) neutralization reactor,thickeners and scrubber inlet.
35
37
39
41
43
3 4 5 6 7 8 9
3 4 5 6 7 8 9
pH in the precipitation reactor
pH in the precipitation reactor
(a)
0.0
0.5
1.0
1.5
2.0
2.5
SART PlantNeutralization reactorGypsum thickenerPrecipitation thickener
(b)
HC
N t
rans
ferr
ed r
atio
(m
g/m
2 h)H
CN
tra
nsfe
rred
rat
io (
mg/
m2 h)
Fig. 9. HCN transferred ratio as a function of pH in the precipitation reactor, (a) precipitationreactor, (b) neutralization reactor, thickeners and overall SART plant.
138 H. Estay et al. / Hydrometallurgy 113–114 (2012) 131–142
gas generation was obtained in the precipitation reactor where thevalues of the HCN transferred ratio ranged from 39 to 42 mg/hm2. Onthe other hand the lowest HCN transferred ratios, b0.25 mg/hm2,were found for the gypsum and precipitation thickeners.
According to the above results, the drag-air flow/feed solution vol-umetric ratio induces a minor impact on HCN gas generation. This be-havior is determined by the distribution of the local mass transferresistances, which were estimated as a quotient between the valueof the local mass transfer coefficient and the overall mass transfer co-efficient. As shown in Fig. 7, all equipment of the SART process pre-sented local mass transfer resistances in the liquid phase of morethan 87%. No relevant effects on the percentages of liquid mass trans-fer resistance were found for the gypsum and precipitation thickenerswhen different drag-air flow/feed solution volumetric ratios were an-alyzed, which is the result of the difference between the values of thelocal mass transfer coefficients of the liquid (1×10⁻⁷ m/s) and thegas (1×10⁻⁴ m/s) phases in both equipment. On the other handthere is little difference in the order of magnitude of the local masstransfer coefficients in liquid and gas phases (1×10⁻⁵ vs.1×10−4 m/s) for the agitated reactors which promoted an increasein the percentages of the liquid mass transfer resistance up to 13%for different drag-air flow/feed solution volumetric ratios. The differ-ence found for the local mass transfer resistances between the precip-itation and neutralization reactors is influenced by the mass balancein the SART process, which establishes a minor difference betweenthe treated solution flow and the velocities of the drag-air flow.
The overall HCN gas generation in the SART process is the result ofthe HCN gas generation within each process equipment in conjunc-tion with their drag-air flow distribution. Hence, the overall value ofHCN gas generation is determined by the transferred HCN ratio andthe drag-air flow distribution in the thickeners.
On the other hand the drag-air flow determines the HCN concen-tration in the gas phase. The effect of the drag-air flow/feed solutionvolumetric ratio on the HCN concentration per equipment and in
the scrubber inlet is shown in Fig. 8. As expected the HCN concentra-tion decreases when the drag-air flow is increased. This outcome isdetermined by the effect of dilution of the air flow. In general, theHCN concentration in the SART process equipment was lower than4 ppm, which is a limit value recommended for personnel exposure(Logsdon et al., 1999). Thus, values of HCN concentration below4.0 ppm are not considered dangerous to the personnel in case ofair leaks or direct exposure. Only the precipitation reactor presentedHCN concentrations in the air flow higher than 5.5 ppm for thewhole range of drag-air flow/feed solution volumetric ratios thathave been studied. Therefore, the HCN concentration in the precipita-tion reactor could be reduced if the system is operated with a drag-airflow/feed solution volumetric ratio over 5.0 or by increasing the ve-locity of the drag-air to more than 0.05 m/s. This last condition allowsthe change in the drag-air flow distribution in the whole system bywhich the local drag-air flow/feed solution volumetric ratio in theprecipitation reactor is increased, which in turn dilutes the HCN con-centration. With the objective of evaluating the HCN concentrationgenerated in the precipitation reactor when a drag-air velocity over0.05 m/s is conducted, exploratory runs have been were carried out(data not shown) by using the simulation algorithm. For the aboveoperational condition, the HCN gas generation in the precipitation re-actor only increased up to 8%. However, there was a decrease in theHCN gas concentration higher than 50%, reducing the HCN concentra-tion in the drag air of the precipitation reactor.
5.2. Effect of pH in the precipitation reactor on HCN generation
The solution pH in the precipitation reactor is one of the most im-portant parameters in the SART process since copper precipitationtakes place when pH is lower than pH 5.0. According to Eq. (8), thepH determines the quantity of dissolved HCN in solution, and thehighest HCN transferred ratio in the SART process has been found in

20
25
30
35
40
45
50
50 60 70 80 90 100
System pressure (kPa)
System pressure (kPa)
(a)
(b)
0.0
0.5
1.0
1.5
2.0
2.5
3.0
50 55 60 65 70 75 80 85 90 95 100
SART PlantNeutralization reactorGypsum thickenerPrecipitation thickener
HC
N t
rans
ferr
ed r
atio
(m
g/m
2 h)H
CN
tra
nsfe
rred
rat
io (
mg/
m2 h)
Fig. 11. HCN transferred ratio as a function of system pressure, (a) precipitation reactor,(b) neutralization reactor, thickeners and overall SART plant.
30
40
50
60
70
80
0 5 10 15 20 25 30 35
0 5 10 15 20 25 30 35
System temperature (°°C)
System temperature (°°C)
(a)
(b)
0.0
0.5
1.0
1.5
2.0
2.5
3.0
3.5
4.0SART PlantNeutralization reactorGypsum thickenerPrecipitation thickener
HC
N t
rans
ferr
ed r
atio
(m
g/m
2 h)H
CN
tra
nsfe
rred
rat
io (
mg/
m2 h)
Fig. 10. Influence of system temperature on the HCN transferred ratio, (a) precipitationreactor, (b) neutralization reactor, thickeners and overall SART plant.
139H. Estay et al. / Hydrometallurgy 113–114 (2012) 131–142
the precipitation reactor. Thus, the simulation of pH in the precipita-tion reactor on the HCN transferred ratio was of interest.
As shown in Fig. 9, by varying the pH in the precipitation reactorand thickener from pH 9.0 to pH 7.0 an increase of about 17% in theHCN transferred ratio was produced. However pH values lower thanpH 7.0 did not affect the HCN transferred ratio due to the fact thatthe pKa value for HCN at 25 °C is 9.76, which results in a fraction ofHCN in solution near 100% under the simulated operational condi-tions. Furthermore it has been found that the HCN transferred ratioin the neutralization reactor and gypsum thickener did not dependon the pH in the precipitation reactor since an operational pH of11.0 has been assumed in these equipment.
5.3. Effect of system temperature
Many parameters which determine the HCN transferred ratio inthe system such as chemical equilibrium of the cyanide dissociationreaction in the solution, Henry's law constant, diffusion coefficientsin both phases and viscosities of the solution and air depend on tem-perature. It is known that Henry's law constant and the diffusion co-efficient of HCN in both phases increase with temperature increase.On the contrary a decrease in the system temperature promotes anincrease in the viscosity of both phases and in the equilibrium con-stant for the cyanide dissociation reaction.
In order to evaluate the overall effect of system temperature onthe HCN transferred ratio, the effect of temperatures ranging from 5to 30 °C has been simulated.
As it is calculated from the results shown in Fig. 10, the HCN trans-ferred ratio in the precipitation reactor, precipitation thickener andSART process were increased by 103%, 95% and 88%, respectivelywhen the system temperature was increased from 5 to 30 °C. Asshown in Fig. 10, there is no linear relationship between the trans-ferred HCN ratio and the system temperature, which is due to the in-crease of Henry's law constant and the increase of the HCN diffusioncoefficient in the solution. This reduces mass transfer resistance in
the liquid phase. In fact, the HCN diffusion coefficient in the solutionand Henry's law constant increase by 100% and 200%, respectivelywith a system temperature rise from 5 to 30 °C. Then, according tothe above results the liquid mass transfer resistance determines theHCN gas generation in the SART process because the system temper-ature has similarly affected the HCN diffusion coefficient in the solu-tion and the HCN transferred ratio.
On the other hand, the HCN transferred ratio in the neutralizationreactor was reduced by 170% when the system temperature increasedfrom 5 to 30 °C. This behavior is influenced by the change of the pKa
value with temperature from 9.76 to 9.08, drastically reducing theHCN content in solution like HCN(aq) from 54 to 12% when tempera-ture rises from 5 to 30 °C at pH 11.0. The variation of the HCN contentin solution minimizes the effect of other variables of the system, suchas the diffusion coefficient. From this point of view the HCN contentin solutions in the precipitation reactor displayed a constant valuewith temperature, due to the lower pH value used in the operationof this equipment.
5.4. Effect of system pressure
Current gold mining operations are located at different geographicaltitude levels, ranging from 0 to 5000 masl. The geographic altitudedetermines the pressure, which decreases while increasing the alti-tude. From the perspective of the SART process the ambient pressureaffects the phase equilibrium and the mass transport through the air,determining HCN gas generation. Therefore the impact of the systempressure on the HCN transferred ratio was evaluated by using – forthis purpose – the equivalent pressures (in kPa) for the range of geo-graphic altitude of interest.
The rise of the ambient pressure from 53.3 to 103.3 kPa increasedthe HCN transferred ratio by around 85%, as shown in Fig. 11. Accordingto Eq. (16), the percentage of mass transfer resistance depends on thepartition constant, which is a ratio between Henry's law constant andpressure. Thus, the variation of the pressure affects directly the partition

0
100
200
300
50 1050 2050 3050 4050 5050
50 1050 2050 3050 4050 5050
WAD CN concentration in the feed solution (mg/L)
WAD CN concentration in the feed solution (mg/L)
(a)
(b)
0
2
4
6
8
10
12
14
SART PlantNeutralization reactorGypsum thickenerPrecipitation thickener
HC
N t
rans
ferr
ed r
atio
(m
g/m
2 h)H
CN
tra
nsfe
rred
rat
io (
mg/
m2 h)
Fig. 12. Dependence of the WAD cyanide concentration in the feed solution on HCNtransferred ratio, (a) precipitation reactor, (b) neutralization reactor, thickeners andoverall SART plant.
35
40
45
50
55
60
50 100 150 200 250
Power/volume ratio in the reactors (W/m3)
50 100 150 200 250
Power/volume ratio in the reactors (W/m3)
(a)
(b)
1.5
2.0
2.5
3.0
SART PlantNeutralization reactor
HC
N t
rans
ferr
ed r
atio
(m
g/m
2 h)H
CN
tra
nsfe
rred
rat
io (
mg/
m2 h)
Fig. 13. Effect of the power/volume ratio in the reactors on HCN transferred ratio,(a) precipitation reactor, (b) neutralization reactor and overall SART plant.
140 H. Estay et al. / Hydrometallurgy 113–114 (2012) 131–142
constant and subsequently the mass transfer resistance of the liquidphase.
5.5. Effect of the WAD cyanide concentration in the feed solution
The WAD cyanide concentration in gold plants is variable, due toeither the metal contents in the ore, the cyanide consumption orthe free cyanide target concentration in the PLS (Pregnant Leach Solu-tion). Thus, theWAD cyanide concentration in agitated leaching opera-tions could range from 2000 to 4000 mg/L, while for heap leachingoperations it could fluctuate between 1000 and 2000 mg/L (Logsdonet al., 1999;Marsden andHouse, 2006). Since the cyanide concentrationin the feed solution is a relevant parameter for the SART process andconsequently for the HCN gas generation, the effect of WAD cyanideconcentration has been explored,
The impact of WAD cyanide concentration on the HCN transferredratio is presented in Fig. 12. The WAD cyanide concentration in thefeed solution presented the most significant influence on the HCNtransferred ratio in comparison with other parameters of the SARTprocess evaluated above. The highest values of the HCN transferredratio were obtained in the overall SART process, 11.9 mg/hm2, aswell as in the precipitation reactor, 260.0 mg/hm2 when the WAD cy-anide concentration was adjusted up to 5000 mg/L. For these values,the HCN concentrations in air estimated by the model were 2.7 and55.0 ppm at the scrubber inlet and precipitation reactor respectively.The high value of HCN concentration in the precipitation reactorshould be minimized by increasing the local velocity of the drag-airto dilute the system, as mentioned before.
5.6. Effect of the power/volume ratio in the reactors
The most incidental parameter in the gaseous HCN generation isthe liquid mass transfer resistance (see Fig. 7), which is impacted bythe power/volume ratio in the reactors. In this connection an increase
in the agitation power reduces the liquid mass transfer resistance,thus affecting the HCN transferred ratio as shown in Fig. 13. In gener-al, the recommended power/volume ratio for the SART process variesbetween 50 and 100 W/m3; however, if the design of agitated sys-tems is overpowered the HCN gas generation will increase by around50% in the overall SART process in case the power/volume ratio israised by about 400%. Thus, the effect of agitation power on HCNgas generation should be taken into account for the SART processdesign.
6. Conclusions
A general methodology has been constructed to predict HCN gasgeneration in the SART process as a function of operational parame-ters (drag-air flow, pH in the precipitation reactor, system tempera-ture, system pressure, WAD cyanide concentration and power/volume ratio in the reactors). According to the results obtainedfrom the model simulations, the most relevant parameters in HCNgas generation were the system temperature and pressure, theWAD cyanide concentration in the feed solution and the power/vol-ume ratio in the reactors. However although the drag-air flow pre-sented a minor impact on the HCN transferred ratio, it has beendemonstrated that this parameter is of utmost importance regardingthe HCN concentration in the air flow, by which the drag-air flow reg-ulates the dilution of the HCN volatilized in the system.
The results predicted by themodel indicate that HCN gas generationis very low, 1–12 mg/hm2 and that the HCN concentrations at the inletof the scrubbing system are lower than 4 ppmunder typical operationalconditions. These values indicate that under normal processing condi-tions the overall HCN gas generation should not present dangerouslevels to personnel in case of leaks. On the other hand the precipitationreactor presented the highest HCN transferred ratio and for this reasonthe design criteria used for engineering the reactor should be carefullyestablished in order to minimize the HCN concentration in the air.

141H. Estay et al. / Hydrometallurgy 113–114 (2012) 131–142
From themodel simulation results, it can be concluded that HCN gasgeneration is controlled by the liquid mass transfer resistance whichpresented values higher than 90% (of the total resistance) due to thefour order of magnitude difference in HCN diffusion coefficients inwater and in air (10−9 m2/s vs. 10−5 m2/s). This difference establishesthat the liquid phase exerts a high mass transfer resistance.
The model and its conclusions should be tested against the opera-tional values for HCN contents in the gas streams of SART plants cur-rently operating around the world. However, the compilation ofaccurate HCN concentration measurements in the drag-air flow forthe different equipment involved in the process is restricted to thefew operating plants and greatly complicated by the absence of sensorsin the SART process equipment. This fact does not limit the resultsobtained in this work because the accuracy of the model is determinedby the liquid mass transfer resistance which under most conditions isthe phase controlling HCN transfer.
Finally, it is believed that the model developed in this study can beapplied as a useful tool to predict risk conditions in the SART processand to guide a correct design of their scrubbing and extraction systems,ensuring safety in the process.
Nomenclatureμ Viscosity, kg/msρ Density, kg/m3
τ Residence time, sA Area, m2
C Molar concentration, mol/m3
D Diffusion coefficient, m2/sF Flow rate of solution, m3/sG Flow rate of air, m3/sh Standard enthalpy, J/molH Henry's law constant, kPa/mol fractionJ Molar flow per transfer unit area, mol/s m2
k Local mass transfer coefficient, m/sKa Equilibrium constant, dimensionlessK Overall mass transfer coefficient in Eq. (13), m/sL Characteristic length, mm Partition coefficient, dimensionlessN Overall transfer rate, mol/spKa Logarithmic exponent of dissociation constant, dimensionlessP Pressure, PaR Universal gas constant, J/(mol K)Re Reynolds number, dimensionlessSc Schmidt number, dimensionlessSh Sherwood number, dimensionlessT Temperature, Kv Velocity, m/sV Volume of tanks, m3
W/V Agitation power-tank volume ratio, W/m3
x Molar fraction in the liquid phase, dimensionlessy Molar fraction in the gas phase, dimensionlessz Distance between the bulk solution and the interface, m/s
Subscripts1 Referred to the end of the module in Eq. (14)2 Referred to the end of the module in Eq. (14)a Referred to thermodynamic equilibriumA Referred to the system condition in Eqs. (25) and (26)air Referred to the air phaseAT Referred to agitated tanksB Referred to the system condition in Eqs. (25) and (26)FP Referred to flat plateg Referred to the gas phaseHCN Referred to HCNHCN-air Referred to the diffusion of HCN in air
HCN-waterReferred to the diffusion of HCN in wateri Referred to i-specieinlet Referred to the inletl Referred to the liquid phaseml Referred to the logarithmic mean driving forceoutlet Referred to the outletRR Referred to rise rateS Referred to settlingT Referred to mass transferWAD Referred to weak acid dissociable species
Superscripts* Referred to the pseudo-equilibrium interface0 Referred to the interfaceg Referred to the gas phase
Acknowledgments
The authors are grateful to Sergio Bustos for his work and vision inthe development of the SART process. In addition, H.E. would like tothank Elizabeth Troncoso for valuable discussions and a critical readingof the manuscript.
References
Barter, J., Lane, G., Mitchell, D., Kelson, R., Dunne, R., Trang, C., Dreisinger, D., 2001. Cyanidemanagement by SART. In: Young, C. (Ed.), Cyanide: Social, Industrial and EconomicalAspects. TMS (The Minerals, Metals & Materials Society), pp. 549–562.
Bird, R., Stewart, W., Lightfoot, E., 2007. Transport Phenomena, Second edition. JohnWiley and Sons, New York, USA.
Botz, M., Acar, S., 2008. Copper Precipitation and Cyanide Recovery Pilot Testing for theNewmont Yanacocha Project. Society for Mining, Metallurgy & Exploration (SME)Annual Meeting, Denver, February, 25–28.
Bustos, S., Estay, H., Arriagada, F., 2008. El Proceso SART: Una Oportunidad para Yacimientosde Oro-Cobre. VII Simposio Internacional de Mineralurgia, TECSUP 2008, Lima,Septiembre 13–15.
Coderre, F., Dixon, D., 1999. Modeling the cyanide heap leaching of cupriferous goldores, part I: introduction and interpretation of laboratory column leaching data.Hydrometallurgy 52, 151–175.
Cussler, E., 2009. Diffusion: Mass Transfer in Fluid Systems, Third edition. CambridgeUniversity Press, Cambridge, UK.
Dai, X., Jeffrey, M., Breuer, P., 2010. A mechanistic model of the equilibrium adsorption ofcopper cyanide species onto activated carbon. Hydrometallurgy 101, 99–107.
Dodge, B., Zabban, W., 1952. Disposal of plating room wastes: IV. Batch volatilization ofhydrogen cyanide from aqueous solutions of cyanides. Plat. Surf. Finish. 29,1133–1139.
Dzombak, D., Ghosh, R., Wong-Chong, G., 2006. Cyanide in Water and Soil: Chemistry,Risk and Management. CRC Press, Taylor & Francis Group, Boca Raton, USA.
E.I. du Pont de Nemours, Company, 1991. Hydrogen Cyanide: Properties, Uses, Storageand Handling, Delaware, USA.
Estay, H., Bocquet, S., Romero, J., Sanchez, J., Rios, G., Valenzuela, F., 2007. Modeling andsimulation of mass transfer in near-critical extraction using a hollow fiber membranecontactor. Chem. Eng. Sci. 62, 5794–5808.
Estay, H., Arriagada, F., Bustos, S., 2010. Design, Development and Challenges of theSART Process. Proceedings — HydroProcess 2010 — 3th International Workshopon Process Hydrometallurgy, Santiago, Chile.
Fleming, C., 2005. Cyanide recovery. Dev. Miner. Process. 15, 703–727.Ford, K., Fleming, C., Henderson, R., 2008. Application of the SART process to heap
leaching of gold–copper ores at Maricunga, Chile. 40th AnnualMeeting of the CanadianMineral Processors, Ottawa, January 22–24.
Guzman, G., 2009. Proceso SART y su influencia en el proceso CIC Minera YanacochaS.R.L. 29 Convención Minera, Perumin 2009, Arequipa, Perú, Septiembre14–18.
Izzat, R., Christensen, J., Pack, R., Bench, R., 1962. Thermodynamics of metal-cyanide co-ordination. I. pK, ΔH0, ΔS0 values as a function of temperature for hydrocyanic aciddissociation in aqueous solution. Inorg. Chem. 1, 828–831.
Klotz, I., Miller, D., 1947. Diffusion coefficients and molecular radii of hydrogen cyanide,cyanogen chloride, phosgene and chloropicrin. J. Am. Chem. Soc. 69 (10),2557–2558.
Logsdon, M., Hagelstein, K., Mudder, T., 1999. The Management of Cyanide in Gold Ex-traction. International Council on Metals and the Environment, Ottawa, Ontario,Canada.
Lotter, N., 2006. Cyanide volatilization from gold leaching operations and tailing storagefacilities. Thesis to obtain a master's degree in Metallurgical Engineering, Faculty of

142 H. Estay et al. / Hydrometallurgy 113–114 (2012) 131–142
Engineering, Built Environment and Information Technology, University of Pretoria,Republic of South Africa.
Lu, J., Dreisinger, D., Cooper, W., 2002. Thermodynamics of the aqueous copper-cyanidesystem. Hydrometallurgy 66, 23–36.
MacPhail, P.K., Fleming, C., Sarbutt, K., 1998. Cyanide Recovery by the SART Process forthe Lobo-Marte Project, Chile. Randol Gold and Silver Forum, Denver, April 26–29.
Marsden, J., House, C., 2006. The Chemistry of Gold Extraction, Second edition. Societyfor Mining, Metallurgy & Exploration SME, Colorado, USA.
Mining Journal. The mining industry's weekly newspaper. (2011). Market update sec-tion. August 19, pp. 22.
Mudder, T., Botz, M., 2004. Cyanide and society: a critical review. Eur. J. Miner. Process.Environ. Prot. 4, 62–74.
Perry, R., Green, D., 1997. Perry's Chemical Engineers' Handbook, Seventh edition.McGraw-Hill, New York, USA.
Sceresini, B., 2005. Gold–copper ores. Dev. Miner. Process. 15, 789–824.Smith, J., Van Ness, H., Abbott, M., 2005. Introduction to Chemical Engineering Thermo-
dynamics, Seventh edition. McGraw-Hill, New York, USA.Treybal, R., 1980. Mass Transfer Operations, Third edition. McGraw-Hill, New York,
USA.