
Practical Pricing of Synthetic CDOs | CVA Central
33
Practical Pricing of Synthetic CDOs Jon Gregory 1 and Jean-Paul Laurent 2 First Draft : March 2007 This Version : July 2008 To be published in “The Definitive Guide to CDOs”, RiskBooks 2008. I. Introduction The credit derivatives market has developed massively during the last decade. A large part of this can be attributed to the popularity of the synthetic CDO (Collateralised Debt Obligation) which is a product that has dominated the structured credit landscape. The massive expansion of the market has necessitated a rapid development of simple and pragmatic modelling approaches, mainly the so-called Gaussian copula model and base correlation approach. These approaches are derived from the well- known Merton idea of using asset correlation as a means to describe co-dependence between default events in a portfolio utilised in the KMV TM and CreditMetrics TM frameworks for credit risk management. The fact that the Gaussian copula approach to credit derivatives pricing has well-known roots, is simple to understand and easy to implement via analytically tractable methods, explains its popularity. Whilst there has been much criticism aimed at the copula and base correlation approaches for pricing CDO tranches and many alternative and more advanced approaches have been proposed, the process of such advanced models being adopted for use has seemingly been slow. This can be put down to a number of points, for example that they are slower and do cannot typically fit the market precisely (and may also require deeper thinking on the risk management implications). Although one can expect more advanced approaches to be increasingly used in the coming years, it is likely that we will rely on the current market standard approaches in one way or another for some time to come. In this chapter, we will review such standard approaches at the current time and whilst highlighting their deficiencies also show how they can be reasonably useful techniques if used intelligently and with caution. Finally, we will show some ways in which these methods can be applied to more recently developed products such as long/short CDOs and tranches on leveraged loan portfolios. 1 SS Consulting, 31 Harvey Road, Guildford. [email protected] 2 ISFA Actuarial School, Université Lyon 1, Université de Lyon and BNP Paribas, http://laurent.jeanpaul.free.fr , [email protected]
-
Upload
khangminh22 -
Category
Documents
-
view
6 -
download
0
Transcript of Practical Pricing of Synthetic CDOs | CVA Central

Practical Pricing of Synthetic CDOs
Jon Gregory1 and Jean-Paul Laurent2
First Draft : March 2007 This Version : July 2008
To be published in “The Definitive Guide to CDOs”, RiskBooks 2008. I. Introduction The credit derivatives market has developed massively during the last decade. A large part of this can be attributed to the popularity of the synthetic CDO (Collateralised Debt Obligation) which is a product that has dominated the structured credit landscape. The massive expansion of the market has necessitated a rapid development of simple and pragmatic modelling approaches, mainly the so-called Gaussian copula model and base correlation approach. These approaches are derived from the well-known Merton idea of using asset correlation as a means to describe co-dependence between default events in a portfolio utilised in the KMVTM and CreditMetricsTM frameworks for credit risk management. The fact that the Gaussian copula approach to credit derivatives pricing has well-known roots, is simple to understand and easy to implement via analytically tractable methods, explains its popularity. Whilst there has been much criticism aimed at the copula and base correlation approaches for pricing CDO tranches and many alternative and more advanced approaches have been proposed, the process of such advanced models being adopted for use has seemingly been slow. This can be put down to a number of points, for example that they are slower and do cannot typically fit the market precisely (and may also require deeper thinking on the risk management implications). Although one can expect more advanced approaches to be increasingly used in the coming years, it is likely that we will rely on the current market standard approaches in one way or another for some time to come. In this chapter, we will review such standard approaches at the current time and whilst highlighting their deficiencies also show how they can be reasonably useful techniques if used intelligently and with caution. Finally, we will show some ways in which these methods can be applied to more recently developed products such as long/short CDOs and tranches on leveraged loan portfolios.
1 SS Consulting, 31 Harvey Road, Guildford. [email protected] 2 ISFA Actuarial School, Université Lyon 1, Université de Lyon and BNP Paribas, http://laurent.jeanpaul.free.fr, [email protected]

II. Basic Credit Correlation Modelling i) The Gaussian Copula Model So-called copula models that have dominated the structured credit market are based on the modelling of default times characterised by the following mapping for each name in the portfolio
iii VF 1 ,
where iV represent some underlying (correlated) variables for which (.) is the cumulative distribution function, (.)iF is the cumulative default probability and i is the default time. The most popular copula to use for iV is the Gaussian one and furthermore this is normally used in a 1-factor setting. Although in principal there is some flexibility, this generally means that the underlying correlation matrix is flat3. In a 1-factor Gaussian model we can generate iV by
ii VVV ~1 ,
where V and iV~ are uncorrelated Gaussian variables and is the correlation. This characterises what has generally become known as the Gaussian Copula Model (GCM). The function (.)iF can be implied from single name hedging instruments (typically CDS) for risk-neutral pricing. We can note that by instead deriving this default probability function from historical data we arrive at a similar approach to that taking by the rating agencies. The popularity of the GCM can be attributed to its inherent simplicity in creating a one-to-one mapping between price and correlation, similarly to the Black-Scholes model creating a link between option price and (implied) volatility. The synthetic CDO can be priced directly from a computation of the underlying loss distribution for the portfolio in question. This can be done via a number of approaches, such as the “large pool approximation” of Vasicek [2002], Fast Fourier transform as described by Gregory and Laurent [2003], recursion as in Andersen et al. [2003] or the algorithm of Hull and White [2004]. The reader is referred to other chapters in this book for CDO pricing details which can also be found in Gregory and Laurent [2005]. For the purposes of this chapter we simply need to comment that the computation approaches rely on conditioning on the systemic variable. This leads to conditional default probabilities given by: -
1)(1 Vp
p iVi .
3 By this we mean that all pairwise correlations are equal to the same value.

So the impact of correlation in the GCM (or indeed any copula model) can be thought of as defining an uncertainty over realised default probabilities. ii) A Traded Correlation Market In this chapter we will use a number of examples to illustrate the pricing impact of various assumptions. All of these will be based on the market prices shown in Table 1 which correspond to actual iTraxx Europe quotes. The index level denotes the price for the [0-100%] tranche and in reality, the single name CDS curves will normally be scaled to as to match this level4 (since there otherwise exists a basis). We also note that the [22-100%] tranche is normally not liquid and its value has been implied from the rest of the capital structure, a point we will return to later.
Table 1. Market prices of 5-year iTraxx IG index tranches. Note that the [0-3%] equity tranche trades on an up-front basis with a 500 basis points per annum running premium. All other tranches are quoted in basis points per annum.
Market Price Index 35.0 [0-3%] 25.75% [3-6%] 60.5 [6-9%] 19.5 [9-12%] 11.0 [12-22%] 6.0 [22-100%] 4.05
This might be an appropriate point to comment on the link between default events and losses. For the N name portfolio with recovery rate denoted by , each default will create a loss of N/)1( . For the 125-name iTraxx portfolio assuming 30% recovery, this will be 0.56% meaning that 6 defaults will be required to wipe out the [0-3%] equity tranche. It is well-known that the standard GCM fails to fit the market prices of index tranches. As an example we show in Table 2 a simple example of a least squares fit to market prices. The deviation is huge, with the model dramatically underpricing equity and super senior risk and overpricing mezzanine tranches.
4 This scaling involves ensuring that the index (which trades with a fixed premium) has a PV of zero and so is not given by a simple formula. 5 This is a theoretical implied value as will be discussed later.

Table 2. Example of fit of Gaussian Copula model to the market prices of 5-year iTraxx IG index tranches. The reference level of the index is 35 bps. The fit is achieved by using a least squares fit to the relative errors on the premiums on all tranches except the [22-100%].
Market Price Implied Correlation Model Price Correlation [0-3%] 25.75% 13.3% 20.39% 20.9% [3-6%] 60.5 1.5% 226.4 20.9% [6-9%] 19.5 8.8% 72.3 20.9% [9-12%] 11.0 14.2% 26.3 20.9% [12-22%] 6.0 20.4% 4.8 20.9% [22-100%] 4.0 49.5% 0.06 20.9%
The inability of the Gaussian Copula model to fit the market can be attributed to the static nature of the model and the homogeneity of the dependence structure. On the latter point, we should note that with a moderate positive correlation, we can neither have idiosyncratic defaults (default of a name having no negative impact on the remainder of the portfolio) or significant systemic defaults (many defaults as a result of, for example, a global meltdown). These two points can to some extend explain the pricing discrepancies seen; more idiosyncratic risk would increase the value of the equity tranche while systemic risk would put more value in the senior part of the capital structure, in particular the default remote [22-100%] tranche. iii) Compound Correlation The fact that we observe a correlation skew is not a particular surprise. Skews and smiles are a common characteristic of many markets and just like pricing different options at different implied volatilities we could look to apply different correlations to each tranche. However, there is an additional problem here specific to CDOs. A mezzanine CDO tranche will have a non-monotonic behaviour with respect to correlation. This means that there may be two correlations that can match the market price. This is illustrated in Figure 1. The two correlations may be extremely different as shown in this example where they are very close to 0% and 100% but they could also be much closer together.

Figure 1. Premium of [3-6%] tranche using the GCM as a function of correlation illustrating the two distinct correlation points that fit the market price.
0
50
100
150
200
250
300
0% 10% 20% 30% 40% 50% 60% 70% 80% 90% 100%
Correlation
Tran
che
Pre
miu
m (b
ps)
Market Model
The dual implied correlation phenomenon can be explained by the fact that there are two elements of risk to the tranche, specifically the probability it will be hit and the expected recovery. In the low correlation case, it is reasonably likely to take loses but the chance that the entire tranche is eroded is small. In the high correlation case, the tranche is much more likely to be wiped out completely but is also more likely to survive any loss. In terms of expected losses or price, these two outcomes can lead to the same value. This is illustrated in Figure 2 via the loss distribution at maturity (this illustrates the basic point although that we note that interest rates mean that the loss distribution at all other points in time has an impact on pricing.

Figure 2. Illustration of the loss distribution at maturity under low and high correlations illustrated by the exceedance probabilities (i.e. probability the loss is greater than or equal to a certain amount).
0%
10%
20%
30%
40%
50%
60%
70%
80%
90%
100%
0% 1% 2% 3% 4% 5% 6% 7% 8% 9% 10%
Loss
Prob
abili
ty
0.0%
0.5%
1.0%
1.5%
2.0%
2.5%
3.0%
3.5%
Payo
ff
Low Correlation High Correlation Tranche Payoff
III. Base Correlation i) Base Correlation Basics The idea of base correlation (McGinty and Ahluwalia [2004]) solves the problem of dual correlation as described above. It basically splits a tranche exposure into two equity tranches according to: -
),0(),0(),( ACDOBCDOBACDO .
This is a model-independent idea that simply divides what is effectively a call-spread payoff (mezzanine tranche) into two call options (equity tranches). The component equity tranches are also known as base tranches. We still need to apply some model to price each equity tranche. Although others approaches could be used the simple GCM approach is standard. We will therefore express the base correlation pricing approach as: -
);,0();,0(),( AB ACDOBCDOBACDO ,
where A and B represent the correlations for the attachment and detachment points repectively that are used as inputs to the GCM. More formally, since a CDO tranche can be valued as the present value of the loss and coupon payments. We write the present value of the loss payment leg (or discounted expected loss), ),( BAEL , as: -

);,0();,0(),( AB AELBELBAEL .
The duration ),( BAD or present value of a unit premium leg of the tranche (i.e. the risky discounted value of the future premium payments) can be similarly computed via: -
AB
ADABDBBAD AB
);,0();,0(
),(
Since the present value of a tranche is then given by ),()(),( , BADABXBAEL BA where BAX , is the market premium for the ],[ BA tranche in basis points per annum we finally obtain: -
);,0();,0();,0();,0( , ABBAAB ADABDBXAELBEL .
We can immediately note that this decomposition is inconsistent in that is uses two different correlations to come up with a tranche value. This has a direct impact of creating arbitrage (which we deal with next) but also a more indirect implication that the assumption of the distribution of loses over time is not consistent which we will re-address later.
ii) The strike dimension The decomposition represented by the above equation allows us to price any tranche by just making assumptions about interpolating correlations to obtain A and B . However, the problem is far more complex than first might appear as valuing the tranche involves pricing at two different correlation values and this inconsistency produces arbitrages. As an example, we show in Figure 3 the premiums of 1% wide tranches or “tranchelets” in increments of 1% (i.e. for a detachment point of x we show the running premium of the [x-1%, x] tranchelet). It is noticeable that the prices are not arbitrage-free in both the mezzanine region (which is clearly important for pricing of many CDOs) and the super senior region which is a potential problem for structures such as leveraged super seniors. The price of a tranche is very sensitive to the slope of the base correlation curve.

Figure 3. Base correlation curve and tranchelet premiums corresponding to our standard tranche prices in Table 2. The correlation curve is interpolated with cubic splines with additional [Detachment, Base Correlation] points of [0%, 5%] and [60%, 80%].
1
10
100
1000
10000
0% 5% 10% 15% 20%
Detachment point
Tran
chel
et p
rem
ium
(bps
)
0%
10%
20%
30%
40%
50%
60%
70%
Bas
e C
orre
latio
n
Tranchelet Premium Base Correlation Market Points
0
2
4
6
8
10
12
14
16
18
20
22% 27% 32% 37% 42% 47% 52% 57%
Detachment point
Tran
chel
et p
rem
ium
(bps
)
0%
10%
20%
30%
40%
50%
60%
70%
80%
90%
Bas
e C
orre
latio
n
Tranchelet Premium Base Correlation Market Points
The problem with correlation interpolation is that the base correlation curve may be extremely smooth6 but the resulting tranche premiums be inconsistent. In Figure 3 we can clearly identifying arbitrages where the tranchelet premiums increase with strike in the 6% to 9% region and also the 22% to 40% region. We might try many ways to treat our base correlation curve such that arbitrage is not permitted but ultimately for a truly robust solution we are required to interpolate on a different quantity altogether.
6 The curve in the example has continuous second derivative, a result of using a cubic spline.

One obvious way in which to avoid arbitrage is to work with the base tranche expected loss curve, );,0( xEL , directly since this is additive across the capital structure and has fairly obvious restrictions. The obvious arbitrage restrictions on tranchelet premiums imply that the base EL should be monotonically increasing (to avoid negative premiums) and concave (to avoid tranchelet spreads increasing with seniority). Finally, since we observe the index %)100,0();,0(lim
1ELxEL
x
and
obviously xxEL );,0( since the value of losses on a tranche cannot be greater than the tranche notional. We refer to Parcell and Wood [2007] for a more in-depth discussion of these points. Obviously since we are dealing with only the loss component in our pricing equation, we will have to make some assumption about the duration of each tranche. For illustrative purposes we will do this in a rather simple way (i.e. not linked the problem of allocating losses across strike with that of allocating them over maturity although we will return to this point later). In Table 3 we illustrate the calculation of tranche expected losses constructed via the market prices and computed durations.
Table 3. Illustration of simple calculation of tranche expected losses (up-front premium). The durations are calculated using a Gaussian Copula model with flat correlation.
Market Premium Duration Tranche EL Base EL [0-3%] 25.75% 3.43 1.287% 1.287% [3-6%] 60.5 bps 4.60 0.167% 1.371% [6-9%] 19.5 bps 4.61 0.081% 1.398% [9-12%] 11.0 bps 4.61 0.061% 1.413% [12-22%] 6.0 bps 4.61 0.061% 1.440% [22-100%] 4.0 bps 4.61 0.203% 1.588% Index 35.0 bps 4.58 1.588% Using the above set of points with a monotonic interpolation7 scheme that ensures all of the constraints outlines above are met and gives us a robust way to price tranchelets or any tranche on the portfolio. This is illustrated in Figure 4 and the resulting tranchelet prices are shown in Figure 5 in comparison with the previous points using the arbitrageable base correlation interpolation approach.
7 There is a rather rich literature on monotonic interpolatation spanning several scientific disciplines. Here we use the algorithm of Steffen [1990].

Figure 4. Example of arbitrage free interpolation on base expected loss points.
0.8%
0.9%
1.0%
1.1%
1.2%
1.3%
1.4%
1.5%
1.6%
1.7%
0% 10% 20% 30% 40% 50% 60% 70% 80% 90% 100%
Detachment Point
Base
Tra
nche
Exp
ecte
d Lo
ssArbitrage-free interpolation Market Points Index
Figure 5. Illustration of tranchelet pricing using the quadratic expected loss interpolation method compared to the previously described base correlation approach.
1
10
100
1000
10000
0% 5% 10% 15% 20%
Detachment point
Tran
chel
et p
rem
ium
(bps
)
Base Expected Loss Base Correlation

0
2
4
6
8
10
12
14
16
18
20
22% 32% 42% 52% 62% 72% 82% 92%
Detachment point
Tran
chel
et p
rem
ium
(bps
)
Base Expected Loss Base Correlation
Aside from some sensitivity to duration assumptions and interpolation methods, the above example would seem to suggest that pricing will be unique and therefore produce prices which are much more well-defined than using base correlation. This is actually not the case as we still need to consider is the behaviour of the base expected loss curve below our lower strike of 3%. We could write that 0)0,0( EL which seems mathematically correct but in reality since we do not have an infinitely large portfolio this point will be misleading and suggest that our interpolation is more well-defined than is really the case (and we may struggle to achieve the concavity required in the 0% to 3% region). A more appropriate first point on the curve might be
UEL ,0 where NU /1 is the “loss unit” of the portfolio with as the recovery rate in percent and N representing the number of names in the index. The value of UEL ,0 corresponds to the upfront premium on a first-to-defaut on the index. As an example of this we show in Table 4 tranchelet pricing using base correlation where we make different assumptions on the correlation extrapolation below 3% and base expected loss interpolation using different assumptions on the extrapolation of the expected loss curve. The assumption of UUEL ,0 corresponds to pricing a first to default on the index at % up-front. Just as we have uncertainty over extrapolation of base correlation below 3%, we have uncertainty over the value of (although in contrast to the base correlation extrapolation, the choice over is more obvious due to the obvious arbitrage points and for a large portfolio we should expect it to be fairly close to unity).

Table 4. Illustration of tranchelet pricing using base correlation and base expected loss methods and applying different extrapolation assumptions. We assumed a recovery value of 30% which gives %56.0125/)3.01( U . All are running premiums in basis points per annum.
Base Correlation Base Expected Loss %5%0
%3%0 %20%0 UUEL ,0
75.0,0U
UEL 00,0 EL
[0-1%] 3272 2719 2377 2875 2174 1760 [1-2%] 1033 1128 1195 866 1083 1199 [2-3%] 368 467 552 511 616 752 The summary of this is that whilst the base expected loss method allows us to be arbitrage-free, it does not provide additional assurance when pricing tranchelets, especially when we are extrapolating below the 3% point. This should not be a surprising general conclusion as knowing the [0-3%] tranche premium should not allow us to make any firm statement on, for example, the [2-3%] value. Since we cannot price tranchelets let us conclude by exploring some boundaries of pricing. For example, knowing the premium for the [0-3%] tranche what is the maximum or minimum premium for the [2-3%] tranchelet? Since our interpolation has to be concave then for a given two points the two extremes will be as represented in Figure 6. For a set of points then the two bounds will be defined by alternating representations corresponding to the two constructions between points B and C. Figure 6. Illustration of the construction leading to the upper and lower bound tranchelet pricing between two given points B and C.
These are equated to tranchelet premia and base correlation curves and shown in Figure 7. In the lower region, there is clearly a huge amount of uncertainty about which base correlation to use. In the more senior area it would seem that the curve is
A
B
C D

more well-defined but this is just a reflection of the fact that the very minor changes in correlation in this region can have a dramatic impact on tranche spreads. Figure 7. Example of limiting case tranchelet premiums (top) and base correlation curves (bottom) that are arbitrage-free.
1
10
100
1,000
10,000
0% 5% 10% 15% 20%
Detachment Point
Tran
chel
et P
rem
ium
Bound1 Bound2
0%
10%
20%
30%
40%
50%
60%
0% 5% 10% 15% 20%
Detachment Point
Base
Cor
rela
tion
Bound1 Bound2 Market Points
In Table 5 we show the first six tranchelet premiums and illustrate the wide range of behaviour that is consistent with the market prices. Note that interpolating linearly on the base expected loss corresponds to equal tranchelet premia (this would correspond to a default process when several defaults occur simultaneously causing a relatively large loss without any chance of intermediate losses). In the the first limiting case

(Bound1), there is the maximum distribution of value in the [0-3%] region (subject to capping the expected loss of the [0-1%] tranche at 0.99 to imply a non-infinite running premium). This can be thought of as a situation where two defaults are almost certain (in order to hit the [0-1%] tranche) but the [2-3%] tranche is unlikely to be hit (requiring five defaults). In order to achieve this maximum distribution, value in the [2-6%] region is attributed equally (a consequence of the linear interpolation in this region) which means that losses must jump from 2% to 6% with certainty without the chance of intermediate losses. Such behaviour may seem unrealistic although it, for example, arise as a consequence of a sectorial effect causing many defaults of highly dependent credits. Regarding the second limiting case (Bound2), the opposite structure is seen as the tranchelets in the [0-3%] region have equal premium (no chance of intermediate losses) but the [3-6%] has maximum distribution of value (corresponding to a high chance of losses up to 3-4% but not much further). Table 5. Tranchelet prices in the [0-6%] corresponding to the limiting cases described in the text. All are running premiums in basis points per annum.
Bound1 Bound2 [0-1%] 9250.28 1199.2 [1-2%] 675.0 1199.2 [2-3%] 61.1 1199.2 [3-4%] 61.1 146.6 [4-5%] 61.1 19.6 [5-6%] 61.1 19.6 iii) The maturity dimension In the previous section we have described the pricing of tranches on a portfolio at a given maturity without reference to any other maturity. We now illustrate that this procedure is not as unique as it may seem and we should really focus on other parts of the credit curve. Assume that we have a tranche market defined by strikes
],....,,,[ 210 nXXXX . By summing the present value of the loss legs we obtain: -
);,0();,0();,0();,0(),( 001
111
1 XELXELXELXELXXEL nn
n
iiiii
n
iii
In a similar way, we sum the durations weighted by tranche notional to obtain: -
);,0();,0(
);,0();,0(),()(
000
1111
1
XDXXDX
XDXXDXBADAB
nnn
n
iiiiiii
n
i
.
We see that if the tranches cover the entire capital structure, we have %00 X and
%100nX giving
8 The up-front premium on the equity tranche was capped at 99% (rather than 100%) so as to give some running premium.

%)100,0(),(1
1 ELXXELn
iii
and %)100,0(),()(
111 DXXDXX
n
iiiii
.
This means whatever our selection of base correlation points, we obtain the required property that a continuum of tranches is equivalent in valuation terms to the index corresponding to losses in the range %]100,0[ (which has no dependency on correlation and holds even if the premiums are not arbitrage-free and even if they are negative). A corollary of this is that if we know the index then it will allow us to compute a “missing” non-traded tranche via: -
1
111 );,(%)100,0(%)100,(
n
iiiin XXELELXEL .
)%100(
),()(%)100,0(%)100,(
1
1
111
1
n
n
iiiii
n X
XXDXXDXD
We can see the price of this tranche is therefore determined without reference to correlation in the %]100,[ 1nX region and is effectively determined fixed in the base correlation construction by the choice of underlying model (GCM in this case). Such a construction, allows us to compute implied prices for the [22-100%] tranche of iTraxx Europe or [30-100%] for the CDX equivalent in the US. Indeed this was the method used for the data in Table 2 to arrive at the conclusion that the [22-100%] tranche should be priced at 4.0 bps9. The implied price of the [22-100%] tranche seems at first to be reasonable. However, we must consider that, whilst the [22-100%] premium is paid on the full notional, the maximum loss this tranche can experience is capped depending on the assumed recovery value . When comparing premiums we should therefore incorporate a scaling factor according to: -
22,12100,22 %22%100%22%100 XX
,
so that if the [12-100%] tranche is paying 6.0 bps then the [22-100%] must pay not more than 3.7 bps at 30% recovery10. The problem illustrated above is a result of the inconsistency inherent with base correlation. For example, taking the duration, although we have ensured that the weighted tranche duration will match the index duration: -
%)100,0();,0();,0(1
111 DXDXXDXn
iiiiiii
,
9 For simplicity we used a constant recovery of 30% and also assume flat and homogeneous credit curves. 10 This is calculated from 6.0 × (100% -30% - 22%) / (100% - 22%)

the fact that the different correlations are used on the left hand side of the above equation means that our assumptions over the distribution of losses over time are inconsistent. Let us illustrate the impact of this with a simple construction. Rather than working with expected loss, we consider the expected notional (which can be compared to the expected loss or up-front premium with no discounting effects and so by integrating over this curve we can rather easily arrive at a price). We use the GCM to define the distribution of losses at the maturity but then manually specify how the expected notional changes over time (we know only that this should be a monotonically decreasing function between 100% and 0%). We focus solely on the equity tranche since this contains the most risk and will therefore create the biggest impact. Figure 8 illustrates two different expected notional curves for the [0-3%] tranche which both reproduce the quoted market price. The close to linear representation will have the shorter duration as the losses are more likely to occur in the early years. Since the [0-3%] trades at a running premium of 500 bps, the different durations will correspond to different expected losses. Finally, these different equity durations will give rise to different implied premiums of the [22-100%] tranche.
Figure 8. Illustration of the distribution of losses within the equity tranche and the resulting impact on the price of super senior risk.
40%
50%
60%
70%
80%
90%
100%
0 1 2 3 4 5
Maturity (years)
Equi
ty T
ranc
he E
xpec
ted
Notio
nal
[22-100%] = 4.1 bps [22-100%] = 2.5 bps
By changing the distribution of the equity tranche expected loss across time (effectively the timing of the first few defaults), we can effectively move the value of the super senior risk significantly. If the curve is convex downwards, then losses will occur later and have less value due to discounting so the expected notional at the maturity date must decrease so as to match the market price. This will require moving value from the rest of the capital structure, effectively causing a decrease in the implied value of the [22-100%] protection. The basic point is that a reasonably

modest change in the distribution of equity losses can move the [22-100%] premium by a significant amount. For equity tranches, since they carry such a significant portion of risk, they are very sensitive to the distribution of losses over time. Typically [0-3%] IG tranches trade with an up-front payment and an additional 500 bps running premium. But IO (interest only) and PO (principal only) variants are also possible. Translation between fair premiums is not trivial as should be apparent from the last example. We note that the impact of this effect has broader implications. Consider the high-yield CDX tranche market. Here, the equity tranches trade on an all up-front basis and so do not require any duration assumptions in order to price. However, such assumptions can be still important for the computation of other quantities such as deltas. We consider the three maturities (3Y, 5Y, 7Y) and as before we allow the distribution expected notional to vary between the points (i.e. assuming we have no information on credit spreads and correlation at intermediate points). We consider two possible shapes of the tranche expected notional curves which differ mainly by the way in which losses evolve in the first 3 years as shown in Figure 9. Figure 9. Illustration of two different tranche expected loss distributions that both fit the [0-10%] HY CDX tranches.
0%
10%
20%
30%
40%
50%
60%
70%
80%
90%
100%
0 1 2 3 4 5 6 7
Maturity (years)
Equi
ty T
ranc
he E
xpec
ted
Notio
nal
Case 1 Case 2
By changing the distribution of losses for the first three years, we can have quite a significant impact on quantities such as the expected loss of the tranche and delta11.
11 Here delta represents the amount of the same maturity index that would be needed to hedge the equity tranche. Since we use the GCM to determine the terminal loss distribution this provides a means to represent the delta.

Table 6. Illustration of different quantities for CDX HY equity tranches implied by the two tranche expected notional profiles in Figure 9.
3Y 5Y 7Y Market Quote 55.38% 76.38% 83.50% Expected Notional (case 1) 41.15% 15.20% 5.46% Expected Notional (case 2) 48.53% 12.59% 2.87% Delta (case 1) 4.12 1.79 0.91 Delta (case 2) 4.10 1.60 0.66 We emphasise that, whilst the impact of term structure might not seem significant in many cases and use of simple base correlation might appear valid, the impact of term structure can be subtle and should ideally be considered for any sophisticated application beyond basic pricing. We will now describe a simple way in which to incorporate this into the standard base correlation approach. By writing conditional default probabilities as: -
)(1
)()( 1|
t
tFVtp
i
iiVit
,
we can introduce a term-structure of correlation with respect to t. It is unlikely that this corresponds to a model in the true sense (i.e. that we can specify some multivariate distribution of default times). This mixing of correlations across maturity is analogous to the mixing over strike done with the standard base correlation technique. We can therefore think of this approach as a 2-dimensional base correlation construction. Just as we have arbitrage in the strike dimension, our time construction as defined above may also create arbitrage in the maturity dimension. However, by choosing a functional form for )(ti we bootstrap a term structure of base correlation across both maturity and strike. This is illustrated in Figure 10 for CDX tranches corresponding to 5, 7 and 10-year maturities.
Figure 10. Schematic overview of calibration procedure for base correlation term structure.
5Y 7Y 10Y
%]30[ Y5%]30[ %]30[ YY 7,5
%]30[ %]30[ YY 10,7%]30[
%]73[ Y5
%]70[ %]73[ YY 7,5%]70[ %]73[ YY 10,7
%]70[
…… …… ….

For example, the premium of the 7Y %]73[ tranche allows us to define the forward12 YY 7,5
%]70[ correlation parameter, knowing the values of Y5%]30[ , Y5
%]70[ and YY 7,5%]30[ . An example of the resulting correlation surface is generated in Figure 11.
This approach can then be used to define tranche premia for intermediate maturities. If we have more information such as IO or PO equity tranches, this can be used to calibrate the shape of the correlation surface over time.
Figure 11. Illustration of maturity term structure using )(t within the base correlation framework to calibrate to iTraxx quotes of 5, 7 and 10-year maturities. We assume piecewise linear interpolation in the maturity dimension.
02
46
8
0%6%
12% 18%
0%
10%
20%
30%
40%
50%
60%
Corr
elat
ion
Maturity
Strike
iv) Bespoke pricing – the spread dimension Finally, we come to the core pricing problem in structured credit which is the pricing of a bespoke tranche. We would like to use the index correlation to imply a bespoke correlation since this will provide a mechanism to hedge correlation risk via the index tranche market. However, the the problem is complex since, a typical bespoke portfolio will differ from the index in many ways such as riskiness, number of names, heterogeneity and so on. The portfolio may have some names that overlap with the index but this is commonly a relatively small fraction. So, in addition to the problems already described, we have this portfolio transformation problem to deal with. In the absense of any more sophisticated approach, we can try and “map” bespoke correlations from index correlations. The principal of such a procedure is to equate each (base) tranche of the bespoke to one of equivalent seniority on some chosen reference index. An obvious approach is to choose the portfolio expected loss as a
12 Forward correlation here just means the specification of )(ti rather than being related to any real dynamic quantity.

method for doing this. Let us denote by NELELS /%)100,0( the scaled expected loss of a given portfolio (where N is the number of names in the portfolio) and write: -
portfolio
indexindexbespoke
ELSELS
BB)( .
The rationale of the above formula is that the most obvious change is due to the relative riskiness of the bespoke portfolio vis a vie the index. The ELS is convenient to work with as it is a model independent measure of the riskyness of the portfolio. As our portfolio becomes more risky, then each unit of subordination has less effect and the tranche is therefore more junior. So scaling by some ratio of the expected losses of the portfolios makes some intuitive sense and is very simple to implement. We will refer to as the rescaling parameter. The scaling of 1 means that equal correlation points occur when we have the same ratio of subordination to expected loss which makes intuitive sense. We will refer to this as “linear scaling”. Setting
0 we have a “sticky scaling” where the correlations are the same, even when the bespoke portfolio might have a very different riskiness.
)()( BB indexbespoke sticky scaling
portfolio
indexindexbespoke
ELSELSBB )( linear scaling
Let us apply the methods to price a bespoke portfolio which is identical to the index but with the average spread level13 at 40 bps rather than 35 bps. We start from arbitrage-free index tranchelet premiums as computed using the monotonic interpolation on expected losses using UUEL ,0 in Table 4. We then apply both sticky and linear scaling methods as described. In Table 7 we show the premiums computed. Clearly the different scaling methods can introduce significantly different behaviour and we also note the re-introduction of arbitrage. Using linear scaling the bespoke [5-6%] tranchelet is more expensive that the [4-5%] tranchelet. Furthermore, the [4-5%] bespoke tranchelet is cheaper than the same tranchelet on the index which since the portfolio is uniformly more risky can be also identified as an arbitrage14.
13 All the spreads were scaled by a constant factor to achieve this. 14 When different aspects are involved such as size of portfolio and heterogeneity, we wouldn’t necessarily identify this as an arbitrage.

Table 7. Illustration of bespoke pricing using both linear and sticky scaling methods compared to the index tranchelet prices defined in an arbitrage-free way using the monotonic interpolation method described previously.
Index Bespoke Linear scaling Sticky scaling [0-1%] 2869.5 3317.7 3213.2 [1-2%] 865.6 1045.2 1027.4 [2-3%] 510.9 608.4 619.4 [3-4%] 98.1 252.9 134.5 [4-5%] 57.4 47.7 79.6 [5-6%] 49.0 62.8 66.0 [6-7%] 27.6 46.2 38.8 [7-8%] 19.9 28.6 28.4 [8-9%] 17.9 22.2 25.2 [9-10%] 15.2 20.3 21.4 [10-11%] 11.9 18.2 17.0 [11-12%] 9.1 15.4 13.3 The tranchelet prices for the bespoke portfolio are illustrated graphically in Figure 12. We can see that both scaling methods can produce arbitrages, even though the initial index tranchelet prices are arbitrage-free. This is particular bad in the senior region where we should also note that we have numerical problems due to the fact that the base correlation curve is close to 100%.

Figure 12. Illustration of bespoke pricing using both linear and sticky scaling methods compared the index tranchelet prices defined in an arbitrage-free way using the monotonic interpolation method described previously.
1
10
100
1,000
10,000
0% 5% 10% 15% 20%
Detachment Point
Tran
chel
et P
rem
ium
(bps
)
Index Linear Scaling Sticky Scaling
0
5
10
15
20
25
30
35
22% 27% 32% 37% 42% 47% 52% 57%
Detachment Point
Tran
chel
et P
rem
ium
(bps
)
Index Linear Scaling Sticky Scaling
The above effects are not dramatic but can become more important when we look at portfolios with significantly different characteristics. It seems that in the market a large number of different scaling methods of differing complexity have been studied. To give a flavour of the issues involved we will discuss one slightly more sophisticated and theoretically sound approach that can be used to scale from index to bespoke portfolio.

A particular characteristic of the scaling methods presented thus-far is that they will scale in exactly the same way across the entire capital structure. Linear scaling only adjusted for the average riskyness of a portfolio. For example, two bespoke portfolios with the same expected loss will be priced on the same correlation curve even if they have rather different other characteristics. In general we can consider that there are many factors that should impact the pricing of a bespoke CDO. 1. Tranche in question 2. Average spread levels 3. Dispersion of spreads 4. Steepness of base correlation curve 5. Size (granularity) of portfolio Intuitively we want our bespoke tranche to be the same seniority as a particular index tranche. Let us consider the ratio %100,0/)(;,0 ELxxEL which represents the relative amount of risk in the base tranche. Then we propose that base tranches with the same ratios are of equivalent seniority.
%100,0
))((;,0%100,0
))((;,0index
indexindex
bespoke
indexbespoke
ELBBBEL
ELBBBEL
.
We then need to solve the above non-linear equation for the function )(B , whereupon we can price any tranche on the bespoke portfolio. Using the same example before of a 40 bps bespoke portfolio, we show the implied normalisation factor in Figure 13.

Figure 13. Normalisation factor (.) computed for the bespoke portfolio described.
0.90
0.95
1.00
1.05
1.10
1.15
0% 10% 20% 30% 40% 50% 60%
Detachment Point
Norm
alis
atio
n Fa
ctor
The TLS prices obtained with this approach are seemingly more reasonable, especially in the senior region, as shown in Figure 14. Obviously, many combinations of model and mapping methodology are possible, for example see the recent article of Smithson and Pearson [2008].

Figure 14. Illustration of bespoke pricing using tranche loss scaling compared to the index prices.
1
10
100
1000
10000
0% 5% 10% 15% 20%
Detachment point
Tran
chel
et p
rem
ium
(bps
)Index Tranche Loss Scaling
0
1
2
3
4
5
6
7
8
9
10
22.0% 27.0% 32.0% 37.0% 42.0% 47.0% 52.0% 57.0%
Detachment point
Tran
chel
et p
rem
ium
(bps
)
Index Tranche Loss Scaling
The last example hopefully illustrates a general theme with base correlation in that whilst the basic idea is not without problems, there are various improvements that can be applied to make the approach more robust. But we should keep in mind that such improvements will not solve the fundamental problems with the base correlation approach. Let us now consider to what degree it is possible to extend the basic modelling framework to more exotic payoffs.

IV. Exotic CDOs So far we have concentrated on single factor correlation approaches, the skew implied by pricing across strike and maturity and the issue of mapping between index and bespoke correlations. We consider some more complex problems that arise commonly in everyday pricing and which can all be broadly considered as relating to multi-factor correlation models. As before, we will aim to illustrate that sensible extensions of the standard modelling approach are possible although the fundamental problems associated with base correlation always will be lurking in the background. i) Barbell and Regional Impacts Even the simplest bespoke CDO tranche will commonly contain both European and US names. Aside from the issues already discussed this creates a problem that we treat all correlations for a given portfolio as being equal which will cause a problem, for example, if iTraxx (Europe) and CDX (US) correlation are unequal. A more extreme case of this might be pricing a “barbelled portfolio” (large dispersion in underlying spreads). We observe both investment grade and high yield correlation surfaces and might want to price a portfolio with both investment grade and high yield names. We can readily extend the basic gaussian copula model as follows: -
iikiki VVV ~1 )()( , so that names are divided into sets denoted by )(ik and each set has its own correlation of )(ik . The different sets may represent a number of things such as geographical region (as in iTraxx/CDX) or spread level (as in a barbelled portfolio with investment grade and high yield spreads). We apply this methodology to our standard example where we simply switch 5 names to be high-yield having a spread of 388 bps. In addition to our standard IG correlation market (Table 1) we used a HY correlation market (CDX HY) as shown in Table 8. High yield correlations tend to differ significantly from investment grade ones, so some mixing of these correlation parameters is not advisable. Table 8. Tranches in the high-yield portfolio (CDX HY) used by pricing. The [0-10%] and [10-15%] tranches trade on an up-front basis whereas the remaining tranches are in basis points per annum.
Premium Correlation [0-10%] 77% 30.55% [10-15%] 47% 32.75% [15-25%] 620 bps 41.10% [25-35%] 207 bps 56.29% [0-100%] 387 bps

We show in Table 9 premiums of tranches on this portfolio (120 IG and 5 high yield names). We consider premiums as defined from both IG and HY correlations separately and those corresponding to the approach outlined above.
Table 9. Illustration of pricing of tranches on a barbelled portfolio with five HY names using linear scaling in all cases. The IG and HY only prices correspond to pricing from just the investment grade and high yield correlation surfaces directly.
125 IG names portfolio 120 IG names, 5 HY names portfolio IG correlation HY correlation Model
[0-3%] 25.75% 38.38% 23.78% 38.26% [3-6%] 60.5 130.6 14.12 150.4 [6-9%] 19.5 28.3 171.80 67.3 [9-12%] 11.0 18.3 118.49 31.3
[12-22%] 6.0 9.1 64.68 12.6 [22-100%] 4.0 2.70 5.54 4.25
It is clear that the linear scaling method directly on the IG or HY correlations can give rise to some rather unusual results. Most obviously is the massive underpricing of the [3-6%] tranche using the HY surface. We can notice that using the more consistent model we will price equity tranche close to their HY correlation price which is natural since most of the equity risk will be due to high yield defaults. On the other hand, the more senior tranches have prices which become increasing driven by the IG price which is not surprising since the IG names make up 80% of the portfolio notional. Finally we can also comment that the model prices are not necessarily bounded by the IG and HY only prices as is the case for the [3-6%] tranche. The method described therefore appears valuable for a reasonably benign case of a few high-yield names but it is also interesting to ask the question as to how far we can push the approach before we see obvious problems emerging. In Table 10 we illustrate the impact of making more and more names high yield. It appears we can push the approach to a reasonable degree with the first arbitrage occuring when we have 25 high yield names in the portfolio (the addition of 5 more high yield names causes a descrease in the [9-12%] tranche premium). Table 10. Illustration of pricing of tranches on increasingly barbelled portfolio using the method described in the text.
125 IG
120 IG 5 HY
115 IG 10 HY
110 IG 15 HY
105 IG 20 HY
100 IG 25 HY
[0-3%] 25.75% 38.26% 49.43% 59.44% 68.66% 77.47% [3-6%] 60.5 150.4 261.6 414.6 592.3 777.0 [6-9%] 19.5 67.3 116.6 136.8 171.3 240.4
[9-12%] 11.0 31.3 65.3 116.2 146.2 141.0* [12-22%] 6.0 12.6 22.7 37.5 58.8 87.5
[22-100%] 4.0 4.25 4.82 5.51 6.36 7.42 The above approach involves representation of the cross-correlations as )()( jkik . We could generalise this to for example the pseudo 2F model proposed by Gregory

and Laurent [2004] which allows flexibility over the cross-correlation parameters at additional computational cost. ii) Long/Short CDOs A long/short CDO is one in which names may represent either a long or short exposure. In the latter case it is a though the name has a negative notional and a default will produce a gain rather than a loss for the total portfolio. The portfolio losses are then made up by the net of losses (from long defaults) and gains (from short defaults). The short names can be seen as adding an extra (stochastic) buffer to the subordination of a tranche. However, as we have the possibility of negative portfolio losses then presumably we must also allow the attachment and detachment points to be negative. Let us consider the expression for the loss )(tM of a CDO tranche as a function of the portfolio loss
)(tL and the attachment and detachment points A and B : -
)(,)(min)( ABAtLtM .
If the attachment point A is negative then then initial notional will be BMAB )0( since 0)0( L . However we know that the maximum tranche
notional can be AB . This can be thought of as a tranche which can increase in notional through time, i.e. any short defaults may reinstate tranche loses caused previously from long defaults15. This creates a perhaps unusual scenario where a tranche that has been completely wiped out still has some value as long as there are enough short names in the portfolio whose default could potentially bring the tranche “back to life”. We see therefore that this type of long/short CDO structure16 would fit the standard pricing methodolody naturally with only a modification for the fact that short names have negative notionals and the possibility of negative losses. This can readily be accomodated in analytical frameworks for computing the underlying loss distribution such as the FFT method or recursion approaches. Extending the expected loss mapping procedure for a long/short CDO would introduce an obvious problem that, since expected losses on short names would be negative, we could in theory end up with a zero denominator in the standard mapping formula. This might not be of obvious concern when the expected loss of the short names is small compared to the long only ones. On the other hand, such a problem is maybe more naturally handled using a more complex mapping method such as the TLS described earlier. Such an approach has the advantage that pricing a long/short
15 We could also think of structuring a “sub-equity” tranche where A is less than zero. Whether or not this is a viable product, it does form part of the full capital structure that represents all possible losses on the long/short portfolio. 16 If we would rather create a long/short portfolio in which tranche notional cannot increase then we create a path-dependency in the pricing. This additional value for the protection buyer might be relatively small in most cases (assuming the short names are dominated by the long names) but will be much harder to price.

portfolio does not obviously represent any additional mapping complexity (such as negative expected losses) compared to the long only case. As an example we take our 125-name example portfolio and flip names from long to short and price with all three scaling methods. The results are shown in Table 11. The ELS method produces arbitrages on the most senior two tranches with only 5 short names. In contrast, the sticky and TLS gives more reasonable prices with only a small arbitrage introduced for 25 short names on the [12-22%] tranche.

Table 11. Illustration of pricing of long/short CDOs with standard expected loss rescaling (ELS) and tranche loss rescaling (TLS). Premiums representing arbitrages are market with an asterisk. a) Linear scaling 125 Long 120 long
5 short 115 long 10 short
110 long 15 short
105 long 20 short
100 long 25 short
[0-3%] 25.75% 23.73% 21.50% 19.05% 16.30% 13.25% [3-6%] 60.5 57.5 54.8 52.5 50.8 49.7 [6-9%] 19.5 19.6* 19.6 19.3 18.9 18.2 [9-12%] 11.0 10.6 10.3 10.1 9.9 9.9 [12-22%] 6.0 8.1 10.1 12.0 13.8* 15.3*
[22-100%] 3.8 3.3 2.8 2.4 1.9 1.4 [0-100%] 35.0 33.55 31.94 30.18 28.26 26.16
b) Sticky scaling 125 Long 120 long
5 short 115 long 10 short
110 long 15 short
105 long 20 short
100 long 25 short
[0-3%] 25.75% 24.08% 22.22% 20.13% 17.76% 15.07% [3-6%] 60.5 58.17 55.9 53.7 51.5 49.4 [6-9%] 19.5 18.7 17.9 17.0 16.2 15.3 [9-12%] 11.0 10.6 10.2 9.7 9.2 8.7 [12-22%] 6.0 5.9 5.8 5.7 5.5 5.2 [22-100%] 3.8 3.1 2.7 2.2 1.7 1.3 [0-100%] 35.0 33.52 31.91 30.15 28.23 26.13
c) TLS 125 Long 120 long
5 short 115 long 10 short
110 long 15 short
105 long 20 short
100 long 25 short
[0-3%] 25.75% 23.88% 21.82% 19.56% 17.06% 14.27% [3-6%] 60.5 56.4 52.3 48.0 43.8 39.7 [6-9%] 19.5 18.8 17.9 16.9 15.6 14.2 [9-12%] 11.0 10.3 9.6 8.9 8.3 7.8 [12-22%] 6.0 5.7 5.5 5.4 5.3 5.7* [22-100%] 3.8 3.6 3.4 3.1 2.8 2.5 [0-100%] 35.0 33.55 31.94 30.18 28.26 26.16
As before we can comment that the long/short methodology using base correlation and TLS seems to work reasonably well up to a point. iii) Prepayment Another evolution of CDOs underlying has been to use other asset classes which may provide enhanced yields compared to standard CDS. One such example is leveraged loan CDS (LCDS) which may be cancelled if the underlying loan is prepayed17. Index
17 The market mainly trades a so-called US style of LCDS contract which means that the prepayment event only occurred when there are no outstanding loans that are suitable reference assets. Under current market standards, all LCDS contracts that reference North American credits cancel with no
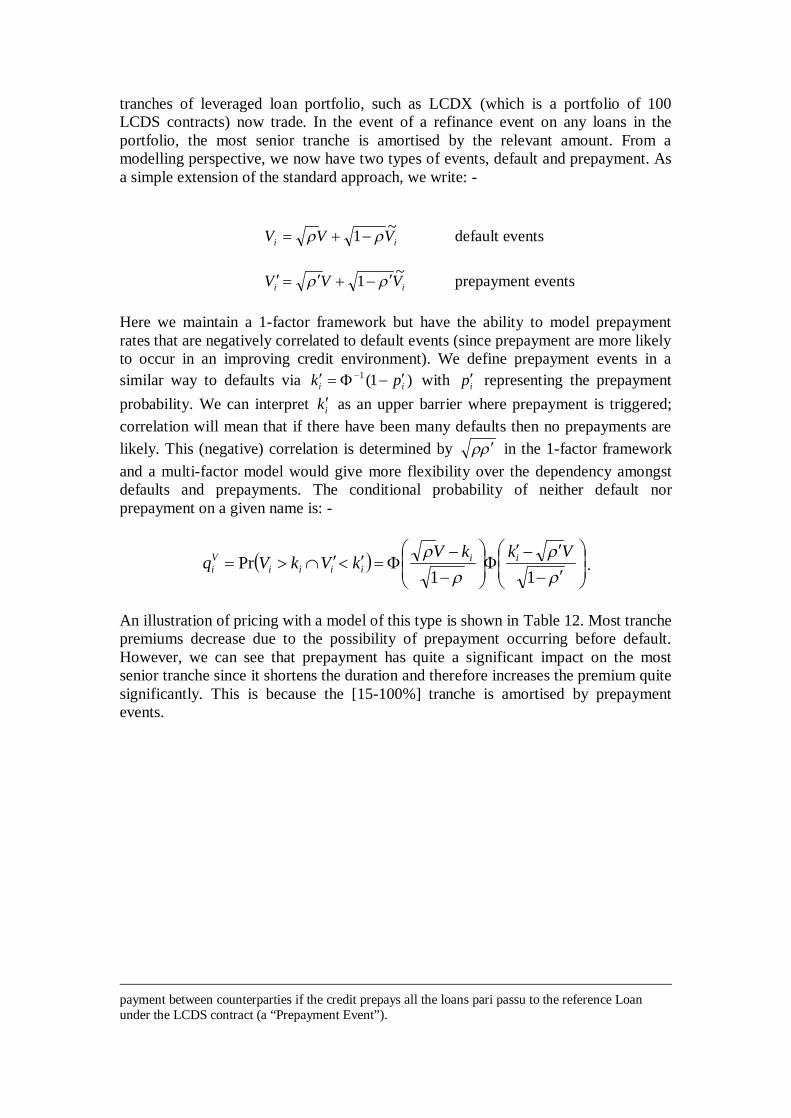
tranches of leveraged loan portfolio, such as LCDX (which is a portfolio of 100 LCDS contracts) now trade. In the event of a refinance event on any loans in the portfolio, the most senior tranche is amortised by the relevant amount. From a modelling perspective, we now have two types of events, default and prepayment. As a simple extension of the standard approach, we write: -
ii VVV ~1 default events
ii VVV ~1 prepayment events Here we maintain a 1-factor framework but have the ability to model prepayment rates that are negatively correlated to default events (since prepayment are more likely to occur in an improving credit environment). We define prepayment events in a similar way to defaults via )1(1
ii pk with ip representing the prepayment probability. We can interpret ik as an upper barrier where prepayment is triggered; correlation will mean that if there have been many defaults then no prepayments are likely. This (negative) correlation is determined by in the 1-factor framework and a multi-factor model would give more flexibility over the dependency amongst defaults and prepayments. The conditional probability of neither default nor prepayment on a given name is: -
11Pr
VkkVkVkVq ii
iiiiVi .
An illustration of pricing with a model of this type is shown in Table 12. Most tranche premiums decrease due to the possibility of prepayment occurring before default. However, we can see that prepayment has quite a significant impact on the most senior tranche since it shortens the duration and therefore increases the premium quite significantly. This is because the [15-100%] tranche is amortised by prepayment events.
payment between counterparties if the credit prepays all the loans pari passu to the reference Loan under the LCDS contract (a “Prepayment Event”).

Table 12. Prices of 5-year LCDX tranches with models with and without prepayment of names. The average spread of the portfolio is around 205 bps and we assume recovery of 60% on each LCDX contract. A flat prepayment rate of 5% is used for illustration purposes. Premiums are up-front for the [0-5%] and [5-8%] tranches and in bp pa for the other tranches.
No Prepayment With prepayment Premium Duration Premium Duration
[0-5%] 74.14% 2.76 70.18% 2.86 [5-8%] 44.45% 3.87 37.89% 3.98 [8-12%] 647.2 4.22 494.2 4.31
[12-15%] 329.9 4.44 190.6 4.53 [15-100%] 56.2 4.29 60.4 3.73 [0-100%] 205.0 4.21 205.0 3.74
Conclusions In this chapter we have described the standard Gaussian copula model and associated base correlation construction that have both been used extensively in the structured credit market. We have considered the different problems associated with CDO pricing, from the strike dimension, the maturity dimension and the bespoke portfolio mapping. Whilst highlighting the drawbacks of these combined approaches, we have also tried to illustrate their value if used with care. We have also illustrated that base correlation can be (cautiously) extended to tackle more exotic CDO payoffs. Although there is much effort going into more advanced methods for pricing synthetic CDOs, it is likely that base correlation approaches will be used in one form or another for some time to come. For this reason, a good understanding of the capabilities and limitations of this standard approach are important. Given the simplicity of some of the ideas described here, we might argue that such approaches may be still widespread until some significant breakthrough in CDO pricing is made. References Andersen, L., J. Sidenius, and S. Basu, “All Your Hedges in One Basket.”, Risk, November 2003. Garcia, J., and S. Goossens. “Base Expected Loss explains Levy Base Correlation Smile”, working paper, 2007. Gregory, J., and J-P Laurent. “Basket Default Swaps, CDOs and Factor Copulas.”, Journal of Risk, 7, 4 (2005), 103-122. Gregory, J., and J-P Laurent. “I will survive.”, Risk, June 2003, 103-107. Hull, J., and A. White. “Valuation of a CDO and Nth to Default CDS without Monte Carlo Simulation.”, Journal of Derivatives, 12, 2 (Winter 2004), 8-23.

Levin, R., “Fitting a Piecewise Linear Loss Distribution to Tranche Prices”, working paper, 2007. McGinty, L., and R. Ahluwalia. “A Model for Base Correlation Calculation”, Credit Derivatives Strategy, JP Morgan, May 2004. Parcell, E., and J. Wood. “Wiping the Smile off your Base (Correlation Curve)”. Derivative Fitch working paper, 2007. Polizu, C., F. L. Neilson and N. Khakee. “Criteria for Rating Global Credit Derivative Product Companies”, Standard and Poor’s working paper. Smithson, C., and N. Pearson, 2008 “Valuing tranches on synthetic CDOs”, Risk, January, pp 92-95. Steffen, M., 1990, “A Simple Method for Monotonic Interpolation in One Dimension”, Astronomy and Astrophysics”, 239:443. Torresetti, R., Brigo, D., and A. Pallavicini, “Implied Expected Tranche Loss Surface from CDO Data”, working paper. Available at http://www.damianobrigo.it Vasicek, O. “Loan Portfolio Value”, Risk, December 2002. Walker, M. “CDO Models. Towards the next generation: incomplete markets and term structure”. Available at http://defaultrisk.com/pp_crdrv109.htm