Power to Detect Risk Alleles Using Genome-Wide Tag SNP Panels
11
Power to Detect Risk Alleles Using Genome-Wide Tag SNP Panels Michael A. Eberle [ , Pauline C. Ng [¤a , Kenneth Kuhn, Lixin Zhou ¤b , Daniel A. Peiffer, Luana Galver, Karine A. Viaud-Martinez, Cynthia Taylor Lawley, Kevin L. Gunderson, Richard Shen * , Sarah S. Murray ¤c,* Illumina, San Diego, California, United States of America Advances in high-throughput genotyping and the International HapMap Project have enabled association studies at the whole-genome level. We have constructed whole-genome genotyping panels of over 550,000 (HumanHap550) and 650,000 (HumanHap650Y) SNP loci by choosing tag SNPs from all populations genotyped by the International HapMap Project. These panels also contain additional SNP content in regions that have historically been overrepresented in diseases, such as nonsynonymous sites, the MHC region, copy number variant regions and mitochondrial DNA. We estimate that the tag SNP loci in these panels cover the majority of all common variation in the genome as measured by coverage of both all common HapMap SNPs and an independent set of SNPs derived from complete resequencing of genes obtained from SeattleSNPs. We also estimate that, given a sample size of 1,000 cases and 1,000 controls, these panels have the power to detect single disease loci of moderate risk (k ; 1.8–2.0). Relative risks as low as k ; 1.1–1.3 can be detected using 10,000 cases and 10,000 controls depending on the sample population and disease model. If multiple loci are involved, the power increases significantly to detect at least one locus such that relative risks 20%– 35% lower can be detected with 80% power if between two and four independent loci are involved. Although our SNP selection was based on HapMap data, which is a subset of all common SNPs, these panels effectively capture the majority of all common variation and provide high power to detect risk alleles that are not represented in the HapMap data. Citation: Eberle MA, Ng PC, Kuhn K, Zhou L, Peiffer DA, et al. (2007) Power to detect risk alleles using genome-wide tag SNP panels. PLoS Genet 3(10): e170. doi:10.1371/ journal.pgen.0030170 Introduction Researchers have used several approaches to identify genetic variation that predispose individuals to common diseases. For Mendelian disease traits, the method of choice has been linkage analysis in families [1]. For many complex disease traits where many alleles contribute to the trait, the effect of any single gene or locus may be relatively small and difficult to detect by linkage analysis. A more sensitive approach to identifying risk alleles with smaller gene effects is to employ a case-control association study in which allelic markers, such as SNPs, are used to find regions of the genome enriched (or depleted) in a particular risk allele or haplotype between the cases and controls. This study design can provide more power to detect relatively small gene effects [1]. Historically, association studies have employed markers in candidate genes; unfortunately this approach requires a priori knowledge about which genes to choose. A more comprehensive and agnostic approach is to employ markers encompassing the entire genome. Whole-genome association studies survey common genetic variation by probing a dense set of SNPs across the genome. Because whole-genome studies allow researchers to identify genes not previously known to be involved with disease etiology and may be more sensitive for detecting the multiple small gene effects often found in complex disease traits, they may be the most appropriate method to identify variants that predispose individuals to common diseases. Whole-genome association studies require a dense map of hundreds of thousands of SNPs across the genome and sufficiently large sample sizes to provide power to detect relatively small gene effects [2,3], but knowledge of the underlying LD (LD) structure can be used to minimize the number of genotyped SNPs [4,5]. The International HapMap Project [6] has provided a densely mapped and validated set of SNP loci genotyped in four populations that can be used to select these SNPs. The complete HapMap dataset (release 21) contains over 2 million common SNPs (minor allele fre- quency [MAF] ‡0.05) in each population studied (Utah residents with ancestry from Northern and Western Europe [CEU], Han Chinese/Japanese in Tokyo, Japan [CHB þ JPT], Editor: Michel Georges, University of Lie `ge, Belgium Received March 30, 2007; Accepted August 21, 2007; Published October 5, 2007 A previous version of this article appeared as an Early Online Release on August 22, 2007 (doi:10.1371/journal.pgen.0030170.eor). Copyright: Ó 2007 Eberle et al. This is an open-access article distributed under the terms of the Creative Commons Attribution License, which permits unrestricted use, distribution, and reproduction in any medium, provided the original author and source are credited. Abbreviations: CEU, Utah residents with ancestry from Northern and Western Europe; CNV, copy number variant; CHB þ JPT, Han Chinese/Japanese in Tokyo, Japan; ECR, evolutionarily conserved region; LD, linkage disequilibrium; MAF, minor allele frequency; PGA, Program for Genomic Applications; YRI, Yoruba in Ibadan, Nigeria * To whom correspondence should be addressed. E-mail: [email protected] (RS); [email protected] (SSM) [ These authors contributed equally to this work. ¤a Current address: J. Craig Venter Institute, Rockville, Maryland, United States of America ¤b Current address: Prognosys Biosciences, La Jolla, California, United States of America ¤c Current address: Scripps Genomic Medicine, La Jolla, California, United States of America PLoS Genetics | www.plosgenetics.org October 2007 | Volume 3 | Issue 10 | e170 1827
-
Upload
independent -
Category
Documents
-
view
1 -
download
0
Transcript of Power to Detect Risk Alleles Using Genome-Wide Tag SNP Panels

Power to Detect Risk AllelesUsing Genome-Wide Tag SNP PanelsMichael A. Eberle
[, Pauline C. Ng
[¤a, Kenneth Kuhn, Lixin Zhou
¤b, Daniel A. Peiffer, Luana Galver,
Karine A. Viaud-Martinez, Cynthia Taylor Lawley, Kevin L. Gunderson, Richard Shen*, Sarah S. Murray
¤c,*
Illumina, San Diego, California, United States of America
Advances in high-throughput genotyping and the International HapMap Project have enabled association studies atthe whole-genome level. We have constructed whole-genome genotyping panels of over 550,000 (HumanHap550) and650,000 (HumanHap650Y) SNP loci by choosing tag SNPs from all populations genotyped by the International HapMapProject. These panels also contain additional SNP content in regions that have historically been overrepresented indiseases, such as nonsynonymous sites, the MHC region, copy number variant regions and mitochondrial DNA. Weestimate that the tag SNP loci in these panels cover the majority of all common variation in the genome as measuredby coverage of both all common HapMap SNPs and an independent set of SNPs derived from complete resequencing ofgenes obtained from SeattleSNPs. We also estimate that, given a sample size of 1,000 cases and 1,000 controls, thesepanels have the power to detect single disease loci of moderate risk (k ; 1.8–2.0). Relative risks as low as k ; 1.1–1.3can be detected using 10,000 cases and 10,000 controls depending on the sample population and disease model. Ifmultiple loci are involved, the power increases significantly to detect at least one locus such that relative risks 20%–35% lower can be detected with 80% power if between two and four independent loci are involved. Although our SNPselection was based on HapMap data, which is a subset of all common SNPs, these panels effectively capture themajority of all common variation and provide high power to detect risk alleles that are not represented in the HapMapdata.
Citation: Eberle MA, Ng PC, Kuhn K, Zhou L, Peiffer DA, et al. (2007) Power to detect risk alleles using genome-wide tag SNP panels. PLoS Genet 3(10): e170. doi:10.1371/journal.pgen.0030170
Introduction
Researchers have used several approaches to identifygenetic variation that predispose individuals to commondiseases. For Mendelian disease traits, the method of choicehas been linkage analysis in families [1]. For many complexdisease traits where many alleles contribute to the trait, theeffect of any single gene or locus may be relatively small anddifficult to detect by linkage analysis. A more sensitiveapproach to identifying risk alleles with smaller gene effectsis to employ a case-control association study in which allelicmarkers, such as SNPs, are used to find regions of the genomeenriched (or depleted) in a particular risk allele or haplotypebetween the cases and controls. This study design can providemore power to detect relatively small gene effects [1].Historically, association studies have employed markers incandidate genes; unfortunately this approach requires apriori knowledge about which genes to choose. A morecomprehensive and agnostic approach is to employ markersencompassing the entire genome. Whole-genome associationstudies survey common genetic variation by probing a denseset of SNPs across the genome. Because whole-genome studiesallow researchers to identify genes not previously known tobe involved with disease etiology and may be more sensitivefor detecting the multiple small gene effects often found incomplex disease traits, they may be the most appropriatemethod to identify variants that predispose individuals tocommon diseases.
Whole-genome association studies require a dense map ofhundreds of thousands of SNPs across the genome andsufficiently large sample sizes to provide power to detectrelatively small gene effects [2,3], but knowledge of the
underlying LD (LD) structure can be used to minimize thenumber of genotyped SNPs [4,5]. The International HapMapProject [6] has provided a densely mapped and validated setof SNP loci genotyped in four populations that can be used toselect these SNPs. The complete HapMap dataset (release 21)contains over 2 million common SNPs (minor allele fre-quency [MAF] ‡0.05) in each population studied (Utahresidents with ancestry from Northern and Western Europe[CEU], Han Chinese/Japanese in Tokyo, Japan [CHB þ JPT],
Editor: Michel Georges, University of Liege, Belgium
Received March 30, 2007; Accepted August 21, 2007; Published October 5, 2007
A previous version of this article appeared as an Early Online Release on August 22,2007 (doi:10.1371/journal.pgen.0030170.eor).
Copyright: � 2007 Eberle et al. This is an open-access article distributed under theterms of the Creative Commons Attribution License, which permits unrestricteduse, distribution, and reproduction in any medium, provided the original authorand source are credited.
Abbreviations: CEU, Utah residents with ancestry from Northern and WesternEurope; CNV, copy number variant; CHB þ JPT, Han Chinese/Japanese in Tokyo,Japan; ECR, evolutionarily conserved region; LD, linkage disequilibrium; MAF, minorallele frequency; PGA, Program for Genomic Applications; YRI, Yoruba in Ibadan,Nigeria
* To whom correspondence should be addressed. E-mail: [email protected] (RS);[email protected] (SSM)
[ These authors contributed equally to this work.
¤a Current address: J. Craig Venter Institute, Rockville, Maryland, United States ofAmerica
¤b Current address: Prognosys Biosciences, La Jolla, California, United States ofAmerica
¤c Current address: Scripps Genomic Medicine, La Jolla, California, United States ofAmerica
PLoS Genetics | www.plosgenetics.org October 2007 | Volume 3 | Issue 10 | e1701827

and Yoruba in Ibadan, Nigeria [YRI]). One of the many resultsshown in the HapMap data is that LD is often discontinuous,appearing as ‘‘block-like’’ structures [7,8], and a typical SNP ishighly correlated with many of its neighbors in any givenpopulation. This correlation can be used to build highlyefficient whole-genome genotyping panels by choosing tagSNPs that serve as proxies for many other highly correlatedneighboring SNPs [9]. A tag SNP approach drastically reducesthe number of genotyped loci while producing moreinformation content than a large set of randomly-chosenloci [8,10].
We have recently developed a whole-genome genotypingassay [11,12] that has the capability of genotyping hundreds ofthousands of markers, enabling whole-genome associationstudies on a single microarray. Using this assay, we haveconstructed whole-genome genotyping panels of over 550,000(HumanHap550) and 650,000 (HumanHap650Y) SNP loci bychoosing tag SNPs from all populations in the InternationalHapMap Project. We estimate that these tag SNP loci coverthe majority of all common variation in the genome and showthat most association studies using these panels should detect
genetic risk factors even for complex traits where each riskallele only confers a moderate risk.
Results
Content SelectionWe constructed the HumanHap550 panel, a whole-genome
genotyping panel of 555,352 SNPs, to effectively tag CEU(European) and CHBþ JPT (Asian) sample populations (Table1). A majority of the SNPs were selected by tagging the morethan 2 million common HapMap SNPs, but the panel alsoincludes variation types that have been found to be over-represented in diseases such as nonsynonymous SNPs [1],SNPs in the MHC region [13], SNPs in commonly reportedCNV regions [14], and mitochondrial SNPs [15]. Becauseindividuals with African ancestry have distinct and lowerlevels of LD compared to those with European or Asianancestry [16], we added another 100,000 common YRI(African) tag SNPs to increase coverage of the YRI samplesfor the HumanHap650Y panel. In this publication, genomecoverage and power are calculated using the HumanHap550panel for CEU and CHB þ JPT samples and the HumanH-ap650Y panel for YRI samples. Coverage calculation has beenpreviously described for a subset of ;314,000 SNPs fromthese panels (the HumanHap300 panel) [17,18].
Genome Coverage EstimationsWe assessed how well the whole-genome genotyping panels
capture all variation in the human genome. To do this, wemeasured how well all variation is captured by at least oneSNP on the array at various levels of LD as measured by r2
[19,20]. Since all variation in the genome is currently notknown, one can use proxies for all variation to estimategenomic coverage. These include SNPs genotyped in theInternational HapMap Project [6], the HapMap ENCODEresequencing and genotyping project [21], and other com-plete resequencing data such as the SeattleSNPs Program forGenomic Applications (PGA) data (http://pga.gs.washington.edu/). Genomic coverage was estimated from HapMap release21 and SeattleSNPs PGA genotype data. Because the PGAdata contains 68 genes whose variants were publicly releasedafter the HapMap SNPs had been selected, and Human-Hap550 and HumanHap650Y tag SNPs were derived from the
Table 1. HumanHap550 and HumanHap650Y Coverage
Content HumanHap550 HumanHap650Y
Number of SNPs 555,352 655,352
HapMap data for tag SNP selection Release 20 Release 20
.2 million common SNPs .2 million common SNPs
MAF threshold (‡) 0.05 0.05
CEU r2 ¼ 0.8 +/�10 kb genes, ECR r2 ¼ 0.8 +/�10 kb genes, ECR
r2 ¼ 0.7 rest of genome r2 ¼ 0.7 rest of genome
CHB+JPT r2 ¼ 0.8, all bins .2 SNPs r2 ¼ 0.8, all bins .2 SNPs
YRI r2 ¼ 0.7, all bins .4 SNPs r2 ¼ 0.7, all bins .2 SNPs
nsSNPs 7,779 7,948
MHC SNPs 1,800 1,800
mtSNPs 177 177
SNPs in CNV regionsa 96,082 111,781
aSNPs in 2,714 CNV regions derived from the Database of Genomic Variants (Feb 2007, http://projects.tcag.ca/variation/)doi:10.1371/journal.pgen.0030170.t001
PLoS Genetics | www.plosgenetics.org October 2007 | Volume 3 | Issue 10 | e1701828
Power of Genome-Wide Tag SNP Panels
Author Summary
Advances in high-throughput genotyping technology and theInternational HapMap Project have enabled genetic associationstudies at the whole-genome level. Our paper describes twogenome-wide SNP panels that contain tag SNPs derived from theInternational HapMap Project. Tag SNPs are proxies for groups ofhighly correlated SNPs. Information can be captured for the entiregroup of correlated SNPs by genotyping only one representativeSNP, the tag SNP. These whole-genome SNP panels also containadditional content thought to be overrepresented in disease, suchas amino acid–changing nonsynonymous SNPs and mitochondrialSNPs. We show that these panels cover the genome with very highefficiency as measured by coverage of all HapMap SNPs and a set ofSNPs derived from completely resequenced genes from the SeattleSNPs database. We also show that these panels have high power todetect disease risk alleles for both HapMap and non-HapMap SNPs.In complex disease where multiple risk alleles are believed to beinvolved, we show that the ability to detect at least one risk allelewith the tag SNP panels is also high.

HapMap, this dataset provides a relatively unbiased estimateof genomic coverage beyond HapMap. Since most of theSNPs genotyped in the HapMap ENCODE regions were partof the HapMap release 16c data, estimates of genomiccoverage in ENCODE regions is not an independent assess-ment of genomic coverage. Coverage of ENCODE regions wasvery similar to coverage of the entire HapMap data and is notshown.
Coverage of common variation (MAF ‡ 0.05) was estimatedfrom the HapMap data (release 21) for each population (CEU,CHB þ JPT, YRI). To calculate coverage, the maximumpairwise r2 value [19,20] between each common HapMaprelease 21 SNP and a SNP in either HumanHap550 orHumanHap650Y was determined. The cumulative proportionof HapMap release 21 loci captured by HumanHap550 andHumanHap650Y is shown in Figure 1. The mean maximum r2
was 0.93 and 0.91 between HumanHap550 SNPs and commonHapMap SNPs in the CEU and CHB þ JPT samples,
respectively, and 0.81 for HumanHap650Y SNPs in the YRIsamples. Using a strict r2 threshold of 0.8, HumanHap550captures 90% and 87% of the common HapMap SNPs in theCEU and CHB þ JPT samples, respectively, and theHumanHap650Y captures 67% of common HapMap SNPsin YRI samples. Using a less-stringent r2 threshold (0.5), theHumanHap550 panel captures 96% and 95% of the commonHapMap variants in the CEU and CHB þ JPT samples,respectively, and the HumanHap650Y captures 85% ofcommon variants in YRI samples. Because both SNP selectionand genomic coverage of the HumanHap550 panel was basedon the same HapMap data, these estimates are likely to be anoverestimate of true genomic coverage.Although the International HapMap Project genotyped
over 5.8 million SNPs in four populations, these SNPs do notnecessarily represent all genomic variation due to biases inSNP discovery and genotyping. Furthermore, as mentionedpreviously, there is a slight upward bias for our estimate ofgenomic coverage because the SNP selection used for thesepanels was based on the samples and markers in the HapMapproject. An unbiased estimate of the coverage of these panelscan be obtained from regions that are fully sequencedindependently from the HapMap project. Regions sequencedbefore the HapMap project may be overrepresented in theHapMap data because more complete knowledge existed forthese regions when SNPs were selected for the HapMapproject. The SeattleSNPs Program for Genomic Applications(PGA; http://pga.gs.washington.edu/) has resequenced 68 genes(as of 29 September 2006) related to inflammatory responsein 23 and 24 individuals in common with the HapMap CEUand YRI samples, respectively. The PGA’s earliest SNP entriesinto dbSNP are build 125 for these 68 genes, after when SNPsfrom the HapMap Project were selected (http://www.hapmap.org/) [6]. The HumanHap550 panel has a mean maximum r2
of 0.84 and captures 72% of common variation in the CEUpopulation (r2 ¼ 0.8), and HumanHap650Y has a meanmaxiumum r2 of 0.68 and captures 45% of the commonvariation in the YRI population (r2¼ 0.8), respectively (Figure1B). These values are 18% and 22% less than what is seen inthe HapMap data for the CEU and YRI samples, respectively.It is possible that the 68 genes in the PGA dataset may notaccurately reflect all variation in the genome since these arecandidate genes for inflammatory response and may beundergoing selection or have atypical patterns of naturalvariation. To test if these genes are undergoing selection, wecalculated the average Tajima’s D statistic for the 68 genesand found that they are close to neutrality and notsignificantly different from all genes for which data isavailable (Table S1).
Power for a Single Risk AlleleQuantifying coverage according to r2 does not fully address
the probability that a study will detect risk alleles ingenotype–phenotype association studies. Because the samplesize required to maintain the same power is inverselyproportional to r2 [3,22,23], LD coverage allows us to estimatethe reduction in power that will occur by not genotypingevery SNP directly. Other factors are more important than r2
for the power of an association study (i.e., the probability thata risk allele will be observed at significantly higher frequen-cies in the cases versus controls), such as the risk conferred bythe allele and the frequency of the disease. In addition, the
Figure 1. Coverage of the HapMap (A) or SeattleSNPs (B) Datasets As
Measured by the Proportion of Common Variation in Each Dataset That Is
Captured by a SNP in Either HumanHap550 (CEU; CHB þ JPT) or
HumanHap650Y (YRI) at Various r2 Thresholds
Lines show coverage for the CEU (red), CHBþ JPT (green), and YRI (blue)populations.doi:10.1371/journal.pgen.0030170.g001
PLoS Genetics | www.plosgenetics.org October 2007 | Volume 3 | Issue 10 | e1701829
Power of Genome-Wide Tag SNP Panels

frequency of the risk allele is a very important factor in howmuch power an association study will have to detect the riskallele because low frequency risk alleles are much moredifficult to detect than high frequency risk alleles. As long asthe genotyped SNPs have some correlation with the risk
alleles, increasing the sample size of a study can overcome allthese factors so that a study can be sufficiently powered with alarge enough sample size. Selecting SNPs in a way thatmaximizes the coverage of all SNPs through LD allows us tomaximize our power for a given sample size.
Power to Detect a Single HapMap Risk AlleleFor a model where there exists a single risk allele, we
estimated the total power to detect a single risk allelerepresented by the HapMap data where each SNP is equallylikely to be the risk allele. For each SNP in the HapMap data,we combined the frequency and maximum r2 with a nearbySNP on the HumanHap550 or HumanHap650Y to estimatethe power to detect that SNP if it is a risk allele for varioussample sizes and disease models. For each risk allelefrequency, sample size, and disease model, the power wasestimated from 10,000 simulated case-control datasets (seeMethods). Then, under the assumption that each SNP in theHapMap dataset is equally likely to be the risk allele, wecalculated the total power, PT, to detect a risk allelerepresented in the HapMap data for a 5% false-positive rateafter applying a Bonferroni correction to account formultiple testing (see Methods).Under the multiplicative disease model, an individual’s
baseline risk of having the disease or phenotype is multipliedby k if they carry one copy of the risk allele and k2 if theycarry two copies of the risk allele. Figure 2 (red line) shows thetotal power to detect an association using HumanHap550(CEU and CHBþ JPT) and HumanHap650Y (YRI) for a studydesign with 1,000 cases and 1,000 controls for differentrelative risks, k. For the CEU and CHB þ JPT samples, thepower drops below 80% when the relative risk is less than;1.69 under the multiplicative model, whereas for the YRIsamples the power drops below 80% when the relative risk isless than ;1.85 (Figure 2).We have also performed the power analysis for an additive
model where an individual’s baseline risk is multiplied by k ifthey carry one copy of the risk allele and 2k if they carry twocopies of the risk allele (see Figure S1). Under the additivemodel the power drops below 80% when the relative risk isless than ;1.61 in the CEU and CHBþ JPT samples and ;1.80in the YRI samples (Figure S2).These simulations were based on sample sizes of 1,000 cases
and 1,000 controls but a lower relative risk can be detected byincreasing the study size. To illustrate this, we also estimatedpower in a variety of study sample sizes to examine theminimum relative risk detectable at 80% power under themultiplicative and additive models for larger sample sizes(Figure 3 [CEU] and Figure S2 [CHBþ JPT and YRI]). Underthe multiplicative model, disease variants with relative risks aslow as ;1.20 for the CEU and CHBþ JPT samples and ;1.24for the YRI samples can be detected with 80% power with10,000 cases and 10,000 controls (Figure S2; Tables S2 and S4).Under the additive model, diseases variants with relative risksas low as ;1.06 for the CEU and CHB þ JPT samples and;1.12 for the YRI samples can be detected with 80% powerwith 10,000 cases and 10,000 controls (Figure S2; Tables S3and S5).These power estimates are strongly influenced by the
frequency spectra of the SNPs in the HapMap data. While thepower is relatively low to detect a single risk allele if theminor allele frequency is less than 0.10, the power is
Figure 2. Total Power to Detect a Single Common Risk Allele in the
HapMap Data Using HumanHap550 for CEU (A) and CHB þ JPT (B) and
HumanHap650Y for YRI (C) in a Study Size of 1,000 cases and 1,000
Controls under a Multiplicative Disease Model
Power is calculated for a 5% false discovery rate after a Bonferronicorrection for multiple testing (red line). The solid black line representsthe power to detect a risk allele if all the common HapMap SNPs in eachrespective population are genotyped using the same significance cutoff.Also shown are the powers for different frequency ranges as dashedlines, where the lower line indicates the power for risk allele frequenciesfrom 5%–10% and the upper line indicates the power for risk allelefrequencies from 40%–50%.doi:10.1371/journal.pgen.0030170.g002
PLoS Genetics | www.plosgenetics.org October 2007 | Volume 3 | Issue 10 | e1701830
Power of Genome-Wide Tag SNP Panels

significantly greater for risk alleles with minor allelefrequencies greater than 0.40 (dashed lines in Figure 2). Forexample, under the multiplicative model, relative risks as lowas 1.50–1.57 can be detected in 1,000 cases and 1,000 controlsif the minor allele frequency is greater than 0.40, but whenthe minor allele frequency is less than 0.10, the risk allele canonly be detected at this sample size if the relative risk isgreater than 2. Unknown factors such as the risk allelefrequency may significantly increase the power to detect aparticular disease even though the above estimates indicatethat a study is underpowered. Conversely, even a supposedlywell-powered study may have little ability to detect associa-tions if the risk allele frequencies are low, unless they confer avery large risk.
Power to Detect a Single Non-HapMap Risk AlleleSince there are ;7.1 million common (MAF ‡ 0.05) SNPs
in the genome [24] and 2.0 million, 2.2 million, and 2.5million common SNPs have been genotyped by the HapMapProject in the CHB þ JPT, CEU, and YRI populations,respectively, approximately 70% of the common risk allelesare not contained in the HapMap data. For SNPs that are notcontained in the HapMap data, the power will be lower thanshown in Figures 2 and 3 because the tag SNPs selected forthe HumanHap550 and HumanHap650Y were chosen specif-ically to maximize coverage of the HapMap SNPs. To explorehow the HumanHap550 and HumanHap650Y will performfor the non-HapMap SNPs, we estimated the coverage of non-HapMap SNPs using the SNPs found in 68 genes that werecompletely resequenced by SeattleSNPs after the release ofthe HapMap data. It is important to note that for this analysiswe excluded all SNPs that are in the HapMap dataset toprovide an unbiased estimate of the power for SNPs outsideof HapMap. Following the same procedure as outlined above,we estimated the power to detect the common SNPs (MAF ‡0.05) that are not in the HapMap data (Figure 4 multiplicativemodel; Figure S3 additive model). In 1,000 cases and 1,000
controls, the minimum relative risks that we can detect at80% power is ;14%–22% higher for non-HapMap SNPscompared with our estimates for just the HapMap data(Tables S2–S5). In 10,000 cases and 10,000 controls, theminimum relative risks that we can detect at 80% power is;6%–11% higher for non-HapMap SNPs compared with ourestimates for just the HapMap data (Tables S2–S5). TheSeattleSNPs dataset represents a small number of SNPs (668for non-HapMap SNPs for CEU and 1,429 for YRI), so eventhough these genes represent over ;2.4 Mb of the humangenome, these are rough estimates and more extensive datawill help refine these numbers. Overall, these estimates ofpower are very promising for studies that wish to detect riskalleles both within and outside of the HapMap SNPs.
Genome-Wide Power Risk LociThe total power to detect a common risk allele in an
association study is a weighted average of the power to detecta HapMap risk allele and the power to detect a non-HapMaprisk allele where the weights are the relative fraction of SNPswithin and outside of the HapMap data (see Methods). We
Figure 3. The Minimum Risk Detectable at 80% Power with p � 0.05
after a Bonferroni Correction for Multiple Testing (v2 ‡ 28.5687) for
Various Sample Sizes under Multiplicative (Red) and Additive (Blue)
Models
Power is calculated as the ability to detect a single common risk allele inthe HapMap data in a whole genome association study within CEUsamples.doi:10.1371/journal.pgen.0030170.g003
Figure 4. Total Power to Detect a Single Common Risk Allele outside of
the HapMap Data Using 1,000 cases and 1,000 Controls under a
Multiplicative Model
The power is estimated using the common SNPs in 68 resequencedSeatleSNPs genes that were not characterized in the HapMap Project for(A) 23 CEU samples using HumanHap550 and (B) 24 YRI samples usingHumanHap650Y. Power is calculated for a 5% false discovery rate after aBonferroni correction for multiple testing (red line). The solid black lineshows the power to detect a common risk allele in the HapMap data (i.e.,solid red lines in Figure 2).doi:10.1371/journal.pgen.0030170.g004
PLoS Genetics | www.plosgenetics.org October 2007 | Volume 3 | Issue 10 | e1701831
Power of Genome-Wide Tag SNP Panels

have combined our power calculations to estimate thegenome-wide power for a variety of disease models and studydesigns (Tables S2–S5). In 1,000 cases and 1,000 controls, theminimum relative risks that we can detect at 80% power is;10%–18% higher genome wide compared with our esti-mates for just the HapMap data. In 10,000 cases and 10,000controls the minimum relative risks that we can detect at 80%power is ;4%–8% higher genome-wide compared with ourestimates for just the HapMap data (Tables S2–S5).
Power for Multiple LociThe power calculations shown above were done assuming
that a single, common risk allele is represented in thegenome. For most complex traits with a significant geneticcomponent, multiple risk alleles and loci are likely to beinvolved [25]; therefore, the power estimates calculated underthe assumption that there is only one risk allele may be overlyconservative. Risk alleles have been detected in multiplegenes for many diseases [26–33].
While the most desirable case power-wise is to have a singlehigh-risk allele that explains the entire genetic component ofa disease, the presence of multiple risk loci will improve thepower for association studies—compared with a single loci of
the same frequency and risk—if the loci are segregatingindependently and noninteractively in the population. Forexample, if there are two risk alleles segregating independ-ently, and one confers a multiplicative relative risk of k¼ 1.5and the other k¼ 1.6, the genome-wide power to detect eachSNP in 1,000 cases and 1,000 controls is 0.42 and 0.59,respectively (Table S2). However, the power to detect at leastone of the two risk loci is one minus the probability that wedo not detect either locus (0.76), greatly improving the powerto detect any particular single locus. To further illustrate howthe power improves when multiple loci are involved, westarted from the whole-genome estimates and examined thecase where a phenotype has genetic risk factors at two or fourunlinked loci (see Methods). If two unlinked loci are involved,studies with the same sample sizes and power may be able todetect smaller gene effects (Figure 5). As shown in Tables 2and 3, at 80% power, the minimum relative risk to detect atleast one of the two risk alleles can be as much as 17% smallerfor the multiplicative model and 23% for the additive model.If four unlinked loci are involved, even smaller gene effectsmay be detected at 80% power given the same sample size.The minimum relative risk detectable with 80% power can beas much as 23% smaller for the multiplicative model and 36%for the additive model when four unlinked loci are involved(Tables 2 and 3). These values require that each risk alleleconfers at least the same relative risk or greater and thus canonly be considered rough estimates. Even so, the presence ofmultiple unlinked risk alleles will greatly improve the powerof association studies.
Discussion
Just as high-throughput sequencing and the humangenome project have greatly advanced the study of genomics[34], so have advances in high-throughput genotyping and theHapMap project enabled association studies at a whole-genome level. Using data from the International HapMapProject [6], we have constructed genotyping panels for whole-genome association studies. These panels are invaluable tools
Figure 5. Power to Detect At Least One Risk Allele in CEU (Human-
Hap550) and YRI (HumanHap650Y) in 1,000 Cases and 1,000 Controls
under a Multiplicative Model
Curves represent the cases where there is a single risk locus (red), twoindependent loci (blue), or four independent loci (green). The red linesare the single risk loci as shown in Figure 4. Under the multiple loci cases,the relative risk represents the minimum risk for all risk alleles and thecorresponding power represents a lower bound on the power.doi:10.1371/journal.pgen.0030170.g005
Table 2. Minimum Risk Detectable at a p-Value � 0.05 after aBonferroni Correction for Multiple Testing (v2 ‡ 28.5687 for CEUand v2 ‡ 28.8976 for YRI) with 80% Power under theMultiplicative Model for Various Sample Sizes and Number ofUnlinked Disease Loci
Samples CEU YRI
1 locus 2 loci 4 loci 1 locus 2 loci 4 loci
500 .2.00 1.884 1.698 .2.00 .2.00 1.833
1,000 1.870 1.581 1.471 .2.00 1.739 1.551
2,000 1.578 1.391 1.318 1.782 1.491 1.376
3,000 1.463 1.311 1.270 1.615 1.392 1.294
4,000 1.391 1.280 1.229 1.523 1.342 1.269
5,000 1.353 1.254 1.191 1.464 1.296 1.238
6,000 1.315 1.221 1.184 1.416 1.278 1.199
7,000 1.291 1.197 1.180 1.384 1.260 1.191
8,000 1.277 1.191 1.177 1.361 1.242 1.186
9,000 1.263 1.187 1.174 1.338 1.223 1.182
10,000 1.250 1.184 1.171 1.316 1.202 1.179
doi:10.1371/journal.pgen.0030170.t002
PLoS Genetics | www.plosgenetics.org October 2007 | Volume 3 | Issue 10 | e1701832
Power of Genome-Wide Tag SNP Panels

for discovering etiologic variants of complex diseases. Wehave shown that, given a sample size of 1,000 cases and 1,000controls, these panels have the power to detect single diseaseloci of moderate risk (k ;1.8–2.0). Relative risks as low as k;1.2–1.3 can be detected using 10,000 cases and 10,000controls, depending on the sample population and diseasemodel. If multiple loci are involved, the power increasessignificantly such that relative risks 20%–35% lower can bedetected with 80% power if between two and four independ-ent loci are involved. Although our SNP selection was basedon HapMap data, which is a subset of all common SNPs, thesepanels effectively capture the majority of all commonvariation and provide high power to detect risk alleles thatare not represented in the HapMap. Additionally, we havefocused on common (MAF ‡ 0.05) variants in this study, andit should be stressed that because there are many more rarevariants in the population, there will likely be many morerare risk alleles. The power for these rare risk alleles will bemuch lower than the average power that we have used (e.g.,dashed lines in Figure 2), and discovering these low-frequencyrisk alleles will likely require resequencing efforts.
Using the known relationship between sample size and r2
[3,22], we estimated the probability of having a positiveoutcome under various scenarios of study size and differentdisease models (i.e., risks). Recently, this relationship betweenr2 and sample size has been questioned [23]. It is true that iftag SNPs are selected using small sample sizes, the LDbetween SNPs will be upwardly biased compared with largerdatasets but this bias will only be large if the training sampleis small and/or the LD criteria used to select the tag SNPs islow. When tag SNPs are selected using high-LD criteria (e.g.,r2 . 0.5 ) and sample sizes are greater than ;50 samples, thisbias is minimal (e.g., Figure 1 of [23]). Because our tag SNPsare selected using a stringent r2 criteria (r2 . 0.8) and morethan 50 individuals were genotyped in each of the CEU, CHBþ JPT, and YRI populations, the bias in LD will be small forthese tag SNPs [35].
One method to increase power in a whole-genomeassociation study is to use imputation methods to infer
genotypes for unobserved markers [30,36,37]. This methodrelies on phased genotype data from a known set ofgenotyped markers, i.e., the HapMap. The reliability of theimputed genotyped data is dependent on how well correlatedthe observed (genotyped) SNPs are to the unobserved(imputed) genotyped SNPs. Therefore, whole-genome geno-typing panels selected using tag SNPs would likely providemore reliably imputed genotypes as the same number of non-tag SNPs. Reliability of the inferred genotypes is alsodependent on the study population being similar to theHapMap population being used to impute genotypes.The use of multi-marker haplotypes would also increase
power in a whole-genome association study by providinggreater specificity for detecting the actual risk allele [38–41].In the extreme example where allelic heterogeneity exists andthe disease variant occurs on two different haplotypes, whereeach haplotype does not contain any alleles in common (i.e.,AB versus ab), the association would be missed using single-marker analysis, but could be detected if a haplotype analysiswas used. The power estimated in this paper used single-marker analysis only, and therefore power could be improvedbeyond what is presented here if multi-marker haplotypes areused.Since we made the assumption that risk alleles exist as
either a single noninteractive SNP or a couple of unlinkedloci, it is important to understand how our results would beaffected if some of the risk alleles are in LD with one another.If multiple risk alleles are in LD with one another then theycould mask the signal of each other and be much moredifficult to detect in simple association studies. An extremeexample of how one risk allele may mask another would occuris if two risk alleles (both of which confer the same risk) werein perfect LD such that every chromosome contained one ofthe risk alleles but never contained both (i.e., D9¼�1). In thisexample, the genetic risk factors would be impossible todetect using simple association studies. While this scenariomay occur, it seems unlikely that this would be any moreprevalent than a scenario where the risk alleles are correlatedin such a way that they increase the probability of detection;e.g., both risk alleles always occur on the same chromosome(i.e., D9¼ 1). Thus, our results probably represent the averagescenario and some association studies will have more powerand some will have less power, due to LD between risk alleles.A more difficult example would occur when there areepistatic interactions between loci that mask the overall geneeffect signal that we would expect to get from each markerindependently. Searching for these types of interactions willrequire at the very least multi-marker analyses. The powercalculations presented here do not cover epistatic diseasemodels and our results would substantially overestimate thepower under these disease models.Complex diseases as a group vary across of range of genetic
risks, environmental factors, and other complexities. At oneextreme are the simpler diseases that contain relatively stronggenetic components, such as Crohn Disease (sibling relativerisk, ks ¼ 17–35 [42,43]) and Type I Diabetes (ks ¼ 15 [44]).Isolating the high-risk genetic components for diseasessimilar to these may not require as many markers or samplesbecause even SNPs that are loosely correlated with markers ofthese risks will be expected to show association. Conversely,diseases towards the other end of the spectrum of complexity,such as Type 2 Diabetes Mellitus (ks¼3 [45]), where many risk
Table 3. Minimum Risk Detectable at a p-Value � 0.05 after aBonferroni Correction for Multiple Testing (v2 ‡ 28.5687 for CEUand v2 ‡ 28.8976 for YRI) with 80% Power under the AdditiveModel for Various Sample Sizes and Number of Unlinked DiseaseLoci
Samples CEU YRI
1 locus 2 loci 4 loci 1 locus 2 loci 4 loci
500 .2.00 1.820 1.504 .2.00 .2.00 1.734
1,000 1.836 1.415 1.183 .2.00 1.654 1.346
2,000 1.494 1.196 ,1.10 1.733 1.362 1.133
3,000 1.367 1.114 ,1.10 1.542 1.252 ,1.10
4,000 1.293 ,1.10 ,1.10 1.439 1.189 ,1.10
5,000 1.250 ,1.10 ,1.10 1.372 1.151 ,1.10
6,000 1.215 ,1.10 ,1.10 1.324 1.121 ,1.10
7,000 1.188 ,1.10 ,1.10 1.288 ,1.10 ,1.10
8,000 1.170 ,1.10 ,1.10 1.264 ,1.10 ,1.10
9,000 1.155 ,1.10 ,1.10 1.242 ,1.10 ,1.10
10,000 1.142 ,1.10 ,1.10 1.221 ,1.10 ,1.10
doi:10.1371/journal.pgen.0030170.t003
PLoS Genetics | www.plosgenetics.org October 2007 | Volume 3 | Issue 10 | e1701833
Power of Genome-Wide Tag SNP Panels
alleles, each with relatively small gene effects, are expected tooccur, will require denser marker sets and larger samples sizesto detect an association [46]. To detect risk alleles, a keycomponent is the design of genome-wide association studies.For example, in choosing patient samples, case subjects withspecific disease subphenotypes are collected to decreasephenotypic heterogeneity and appropriate controls are usedto eliminate false positives from population stratification[31,47] . A second key component to genome-wide associationstudies is the marker set. To address this, we have designedthe HumanHap550 and HumanHap650Y whole-genomegenotyping panels to maximize the likelihood of detectingetiologic variants. By selecting tag SNPs, we reduced theamount of required genotyping of more than 2 millioncommon HapMap SNPs to ;550,000–650,000 while retainingmost of the power (e.g., Figure 2). Furthermore, to increasethe chance of detecting etiologic variants, we have selectedSNPs in gene regions and regions that have historically beenoverrepresented in disease, such as copy-number variationregions and mitochondrial DNA. Already, the success ofgenome-wide association studies are coming to bear andcandidate risk alleles have been discovered for severaldisorders [26–33,47–56]. In summary, whole-genome tagSNP panels, such as the HumanHap550 and HumanHap650Ypanels, should greatly aid in our understanding of howgenetic variation affects both human health and disease.
Methods
Public data used. HapMap release 16c, 20, and 21 data weredownloaded from http://www.hapmap.org/. The filtered, nonredun-dant genotypes were used for all analyses. SeattleSNPs data weredownloaded on 29 September 2006 from http://pga.gs.washington.edu/. SeattleSNPs sequenced 23 CEU and 24 YRI unrelatedindividuals from the HapMap samples. Tajima’s D values for theSeattleSNPs genes were taken directly from the SeattleSNPs website.The 18,411 RefSeq genes and their coordinates were downloadedfrom the University of California Santa Cruz (UCSC) genome browser(hg17; http://genome.ucsc.edu/). Genomic regions demonstratingconservation across species and the respective PHAST scores weredownloaded from the UCSC genome browser (phastConsEle-ments.txt.gz). Copy number variant (CNV) regions of the genomewere obtained from the Database of Genomic Variants (http://projects.tcag.ca/variation/), consisting of 2,714 CNV loci (February2007). All SNP coordinates are shown with respect to build 35 anddbSNP124.
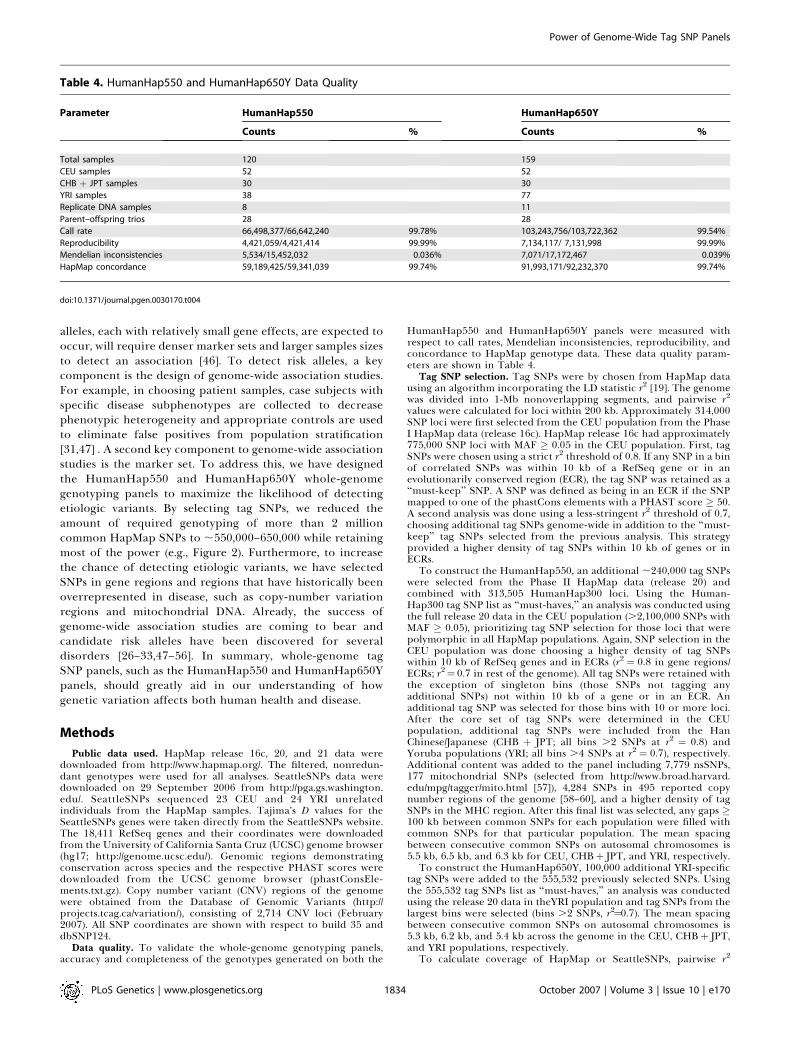
Data quality. To validate the whole-genome genotyping panels,accuracy and completeness of the genotypes generated on both the
HumanHap550 and HumanHap650Y panels were measured withrespect to call rates, Mendelian inconsistencies, reproducibility, andconcordance to HapMap genotype data. These data quality param-eters are shown in Table 4.
Tag SNP selection. Tag SNPs were by chosen from HapMap datausing an algorithm incorporating the LD statistic r2 [19]. The genomewas divided into 1-Mb nonoverlapping segments, and pairwise r2
values were calculated for loci within 200 kb. Approximately 314,000SNP loci were first selected from the CEU population from the PhaseI HapMap data (release 16c). HapMap release 16c had approximately775,000 SNP loci with MAF ‡ 0.05 in the CEU population. First, tagSNPs were chosen using a strict r2 threshold of 0.8. If any SNP in a binof correlated SNPs was within 10 kb of a RefSeq gene or in anevolutionarily conserved region (ECR), the tag SNP was retained as a‘‘must-keep’’ SNP. A SNP was defined as being in an ECR if the SNPmapped to one of the phastCons elements with a PHAST score ‡ 50.A second analysis was done using a less-stringent r2 threshold of 0.7,choosing additional tag SNPs genome-wide in addition to the ‘‘must-keep’’ tag SNPs selected from the previous analysis. This strategyprovided a higher density of tag SNPs within 10 kb of genes or inECRs.
To construct the HumanHap550, an additional ;240,000 tag SNPswere selected from the Phase II HapMap data (release 20) andcombined with 313,505 HumanHap300 loci. Using the Human-Hap300 tag SNP list as ‘‘must-haves,’’ an analysis was conducted usingthe full release 20 data in the CEU population (.2,100,000 SNPs withMAF ‡ 0.05), prioritizing tag SNP selection for those loci that werepolymorphic in all HapMap populations. Again, SNP selection in theCEU population was done choosing a higher density of tag SNPswithin 10 kb of RefSeq genes and in ECRs (r2 ¼ 0.8 in gene regions/ECRs; r2¼ 0.7 in rest of the genome). All tag SNPs were retained withthe exception of singleton bins (those SNPs not tagging anyadditional SNPs) not within 10 kb of a gene or in an ECR. Anadditional tag SNP was selected for those bins with 10 or more loci.After the core set of tag SNPs were determined in the CEUpopulation, additional tag SNPs were included from the HanChinese/Japanese (CHB þ JPT; all bins .2 SNPs at r2 ¼ 0.8) andYoruba populations (YRI; all bins .4 SNPs at r2 ¼ 0.7), respectively.Additional content was added to the panel including 7,779 nsSNPs,177 mitochondrial SNPs (selected from http://www.broad.harvard.edu/mpg/tagger/mito.html [57]), 4,284 SNPs in 495 reported copynumber regions of the genome [58–60], and a higher density of tagSNPs in the MHC region. After this final list was selected, any gaps ‡100 kb between common SNPs for each population were filled withcommon SNPs for that particular population. The mean spacingbetween consecutive common SNPs on autosomal chromosomes is5.5 kb, 6.5 kb, and 6.3 kb for CEU, CHBþ JPT, and YRI, respectively.
To construct the HumanHap650Y, 100,000 additional YRI-specifictag SNPs were added to the 555,532 previously selected SNPs. Usingthe 555,532 tag SNPs list as ‘‘must-haves,’’ an analysis was conductedusing the release 20 data in theYRI population and tag SNPs from thelargest bins were selected (bins .2 SNPs, r2¼0.7). The mean spacingbetween consecutive common SNPs on autosomal chromosomes is5.3 kb, 6.2 kb, and 5.4 kb across the genome in the CEU, CHBþ JPT,and YRI populations, respectively.
To calculate coverage of HapMap or SeattleSNPs, pairwise r2
Table 4. HumanHap550 and HumanHap650Y Data Quality
Parameter HumanHap550 HumanHap650Y
Counts % Counts %
Total samples 120 159
CEU samples 52 52
CHB + JPT samples 30 30
YRI samples 38 77
Replicate DNA samples 8 11
Parent–offspring trios 28 28
Call rate 66,498,377/66,642,240 99.78% 103,243,756/103,722,362 99.54%
Reproducibility 4,421,059/4,421,414 99.99% 7,134,117/ 7,131,998 99.99%
Mendelian inconsistencies 5,534/15,452,032 0.036% 7,071/17,172,467 0.039%
HapMap concordance 59,189,425/59,341,039 99.74% 91,993,171/92,232,370 99.74%
doi:10.1371/journal.pgen.0030170.t004
PLoS Genetics | www.plosgenetics.org October 2007 | Volume 3 | Issue 10 | e1701834
Power of Genome-Wide Tag SNP Panels

values were calculated using the expectation algorithm [20] based onthe genotypes from HapMap release 21 and the 68 genes resequencedin the PGA samples. Maximum r2 values were calculated for each SNPlist (HapMap release 20 or 68 PGA genes) with a SNP on eitherHumanHap550 or HumanHap650Y. All pairwise combinations wereconsidered within 200 kb. For chrX, only female individuals wereused; otherwise, all unrelated individuals were used.
Power to detect risk alleles. To calculate the power to detect a riskallele with a given risk, risk allele frequency and sample size wegenerated a series of simulated datasets. For a single sample, weassigned the genotype homozygous for the risk allele and hetero-zygous or homozygous for the nonrisk allele with Hardy-Weinbergprobabilities p2, 2pq, q2 where p is the frequency of the risk allele and q¼ 1 � p is the frequency of the nonrisk allele. An individual samplewas assigned a disease status with probabilities defined by the diseasemodel and assigned as a case or control accordingly. For example, foran associated risk, k, under a multiplicative model and a baseline risk,p, an individual has the probability being a case of k2p, kp and pdepending on whether that individual is homozygous for the riskallele, heterozygous, or homozygous for the nonrisk allele, respec-tively [61]. Using a program written in C, we generated the allelefrequencies for 10,000 case-control simulations following the aboveprocedure for a wide range of risk allele frequencies, disease models,and sample sizes. We then calculated the v2 value for thecorresponding 2 3 2 table of allele frequencies and estimated thepower for each case as the fraction of times that the v2 valueexceeded the p-value 0.05 after a Bonferroni correction for multipletesting (v2 ‡ 28.5687 for HumanHap550 and v2 ‡ 28.8976 forHumanHap650). This amounted to 188,600,000 simulated casecontrol calculations for each disease model examined (multiplicativeand additive).
Using the above power estimates, for each genotyped SNP or SNPtagged at r2¼ 1, we assigned it a power value according to its minorallele frequency for each disease model and study design (i.e., numberof cases and controls). This allows us to do a single power estimationfor each of the possible minor allele frequencies (5%–50% inincrements of 1%) rather than doing an individual calculation for allpossible ;2.2 million common SNPs. This method works when theSNP is directly genotyped or perfectly correlated with one of thegenotyped SNPs. Alternatively, if the risk allele is not directlygenotyped but instead, one or several nearby markers are genotyped,then the power is expected to be reduced if none of these genotypedmarkers are perfectly correlated with the risk allele. The amount thatthe power is reduced is equivalent to reducing the study sample sizeby r2, where r2 is the maximum LD between the genotyped markersand the risk allele [22]. For example, genotyping a SNP that is in LDwith a risk allele at r2 ¼ 0.5 in 1,000 cases and controls has the samepower as directly genotyping the risk allele in 500 cases and controls.In this example, the effective sample size is 500 and is equal to theactual sample size multiplied by r2. When the power for the effectivesample size was not previously calculated, we linearly interpolatedbetween the power values calculated for sample sizes above and belowto estimate the power.
The probability of detecting a SNP in a case control study is theprobability that the SNP is a risk allele multiplied by the power todetect it if it is a risk allele [62]. Assuming that a single risk allele isinvolved in a disease and each SNP is equally likely to be a risk allele,then the total power, PT, for all SNPs is just the sum of the powers foreach SNP and given by the equation:
PT ¼1N
XN
i¼1Pi; ð1Þ
where Pi is the power to detect an association at SNP i and N is thenumber of SNPs.
Writing the probability that a SNP is in the HapMap data as PH, thetotal power for the entire genome, PA, can be written as:
PA ¼ PHPTH þ ð1� PHÞPT
NH ; ð2Þ
where PH is the probability that the risk allele is in the HapMap dataand (1 � PH) is the probability that that risk allele is outside of theHapMap data, PT
H is the power to detect one of the HapMap SNPs,and PT
NH is the power to detect one of the non-HapMap SNPs. It isestimated that PH, common SNPs represented in the HapMap data,represents 30% of all common SNPs [24], so PH ¼ 0.30. The powervalues, PT
H and PTNH , are taken from the simulated estimates according
to the disease model and study design (e.g., Tables S1–S4).Power to detect multiple risk alleles. For a given set of N risk alleles
of unknown frequency and total powers P0, P1,. . .,PN, the probability
of detecting at least one of these risk alleles—if they are independentof each other—is equal to 1� (1�P0)(1�P1),. . .,(1�PN), assuming therisk alleles are independent of one another. While knowing the risksassociated with all disease markers is not likely, the lower bound ofthis estimate can be calculated as 1� (1� Pi)
N where Pi is the powerfor the lowest-powered risk allele and N is the number ofindependent loci. Thus, if the power to detect a single risk allele is0.5 and there are two risk alleles, then the power to detect one ofthese risk alleles is 0.75, and if there are three risk alleles, then thepower to detect at least one risk allele is 0.875.
Supporting Information
Figure S1. Total Power to Detect a Single Common Risk Allele in theHapMap Data Using HumanHap550 for CEU (A) and CHBþ JPT (B)and HumanHap650Y for YRI (C) in a Study Size of 1,000 Cases and1,000 Controls under an Additive Disease Model
Power is calculated for a 5% false discovery rate after a Bonferronicorrection for multiple testing (red line). The solid black linerepresents the power to detect a risk allele if all the commonHapMap SNPs in each respective population are genotyped using thesame significance cutoff. Also shown are the powers for differentfrequency ranges as dashed lines where the lower line indicates thepower for risk allele frequencies from 5%–10% and the upper lineindicates the power for risk allele frequencies from 40%–50%.
Found at doi:10.1371/journal.pgen.0030170.sg001 (17 KB PDF).
Figure S2. The Minimum Risk Detectable at 80% Power for VariousSample Sizes (N Cases and N Controls) under Multiplicative (Red) andAdditive (Blue) Models
Power is calculated as the ability to detect a single common risk allelein the HapMap data in a whole-genome association study within CHBþ JPT (A) and YRI (B) samples.
Found at doi:10.1371/journal.pgen.0030170.sg002 (17 KB PDF).
Figure S3. Total Power to Detect a Single Common Risk AlleleOutside of the HapMap Data Using 1,000 Cases and 1,000 Controlsunder an Additive Model
The power is estimated using the common SNPs in 68 resequencedSeatleSNPs genes that were not characterized in the HapMap Projectfor (A) 23 CEU samples using HumanHap550 and (B) 24 YRI samplesusing HumanHap650Y. Power is calculated for a 5% false discoveryrate after a Bonferroni correction for multiple testing (red line). Thesolid black line represents the power to detect a common risk allele inthe HapMap data from Figure S1.
Found at doi:10.1371/journal.pgen.0030170.sg003 (13 KB PDF).
Figure S4. The Minimum Risk Detectable for Common SNPs outsideof the HapMap Data at 80% Power for Various Sample Sizes (N Casesand N Controls) under Multiplicative (Red) and Additive (Blue)Models
Power is calculated using the SeattleSNPs data and defined as theability to detect a single common risk allele outside the HapMap datain a whole-genome association study within either CHBþ JPT (A) orYRI (B) samples.
Found at doi:10.1371/journal.pgen.0030170.sg004 (16 KB PDF).
Table S1. Tajima’s D statistic on PGA genes
Found at doi:10.1371/journal.pgen.0030170.st001 (31 KB DOC).
Table S2. Power in CEU Samples for Multiplicative Model
Found at doi:10.1371/journal.pgen.0030170.st002 (102 KB DOC).
Table S3. Power in CEU Samples for Additive Model
Found at doi:10.1371/journal.pgen.0030170.st003 (103 KB DOC).
Table S4. Power in YRI Samples for Multiplicative Model
Found at doi:10.1371/journal.pgen.0030170.st004 (105 KB DOC).
Table S5. Power in YRI Samples for Additive Model
Found at doi:10.1371/journal.pgen.0030170.st005 (103 KB DOC).
Acknowledgments
We thank Alex Montpetit, Debbie Nickerson, Michael Boehnke,Panos Deloukas, Paul de Bakker, and Peter Gregersen for providing
PLoS Genetics | www.plosgenetics.org October 2007 | Volume 3 | Issue 10 | e1701835
Power of Genome-Wide Tag SNP Panels

advice on the content of the tag SNP panels. We thank the Infiniumteam for technology development: Anne Gambel, Bahram Kermani,Carsten Rosenow, Celeste McBride, Chan Tsan, Dave Bullis, EricJohnson, Francisco Garcia, Frank Steemers, Joe Musmacker, JohannaWhitacre, John Stuelpnagel, Michael Graige, Patrick Merritt, PaulKitabjian, Rob Morey, Semyon Kruglyak, Steve Barnard, ToddDickinson, Vivian Zhang, and Weihua Chang.
Author contributions. MAE, PCN, KK, LZ, DAP, KLG, RS, and SSM
conceived and designed the experiments. MAE, PCN, and KKperformed the experiments. MAE, PCN, LG, KAVM, CTL, and SSManalyzed the data. MAE, PCN, and SSM wrote the paper.
Funding. The authors received no specific funding for this study.Competing interests. MAE, KK, DAP, KLG, RS, LG, KAVM, and
CTL are employed by the company that makes the array chipsanalyzed. PCN, LZ, and SSM are former employees.
References1. Botstein D, Risch N (2003) Discovering genotypes underlying human
phenotypes: past successes for mendelian disease, future approaches forcomplex disease. Nat Genet 33 Suppl: 228–237.
2. Collins FS, Guyer MS, Charkravarti A (1997) Variations on a theme:cataloging human DNA sequence variation. Science 278: 1580–1581.
3. Kruglyak L (1999) Prospects for whole-genome LD mapping of commondisease genes. Nat Genet 22: 139–144.
4. de Bakker PI, Yelensky R, Pe’er I, Gabriel SB, Daly MJ, et al. (2005)Efficiency and power in genetic association studies. Nat Genet 37: 1217–1223.
5. Hirschhorn JN, Daly MJ (2005) Genome-wide association studies forcommon diseases and complex traits. Nat Rev Genet 6: 95–108.
6. The International HapMap Consortium (2005) A haplotype map of thehuman genome. Nature 437: 1299–1320.
7. Daly MJ, Rioux JD, Schaffner SF, Hudson TJ, Lander ES (2001) High-resolution haplotype structure in the human genome. Nat Genet 29: 229–232.
8. Gabriel SB, Schaffner SF, Nguyen H, Moore JM, Roy J, et al. (2002) Thestructure of haplotype blocks in the human genome. Science 296: 2225–2229.
9. Carlson CS, Eberle MA, Rieder MJ, Smith JD, Kruglyak L, et al. (2003)Additional SNPs and linkage-disequilibrium analyses are necessary forwhole-genome association studies in humans. Nat Genet 33: 518–521.
10. Patil N, Berno AJ, Hinds DA, Barrett WA, Doshi JM, et al. (2001) Blocks oflimited haplotype diversity revealed by high-resolution scanning of humanchromosome 21. Science 294: 1719–1723.
11. Gunderson KL, Steemers FJ, Lee G, Mendoza LG, Chee MS (2005) Agenome-wide scalable SNP genotyping assay using microarray technology.Nat Genet 37: 549–554.
12. Steemers FJ, Chang W, Lee G, Barker DL, Shen R, et al. (2006) Whole-genome genotyping with the single-base extension assay. Nat Methods 3:31–33.
13. Lie BA, Thorsby E (2005) Several genes in the extended human MHCcontribute to predisposition to autoimmune diseases. Curr Opin Immunol17: 526–531.
14. Feuk L, Marshall CR, Wintle RF, Scherer SW (2006) Structural variants:changing the landscape of chromosomes and design of disease studies.Hum Mol Genet 15 Spec No 1: R57–R66.
15. Pieczenik SR, Neustadt J (2007) Mitochondrial dysfunction and molecularpathways of disease. Exp Mol Pathol 83: 84–92.
16. Hinds DA, Stuve LL, Nilsen GB, Halperin E, Eskin E, et al. (2005) Whole-genome patterns of common DNA variation in three human populations.Science 307: 1072–1079.
17. Barrett JC, Cardon LR (2006) Evaluating coverage of genome-wideassociation studies. Nat Genet 38: 659–662.
18. Pe’er I, de Bakker PI, Maller J, Yelensky R, Altshuler D, et al. (2006)Evaluating and improving power in whole-genome association studiesusing fixed marker sets. Nat Genet 38: 663–667.
19. Carlson CS, Eberle MA, Rieder MJ, Yi Q, Kruglyak L, et al. (2004) Selecting amaximally informative set of single-nucleotide polymorphisms for associ-ation analyses using LD. Am J Hum Genet 74: 106–120.
20. Hill WG, Robertson A (1968) The effects of inbreeding at loci withheterozygote advantage. Genetics 60: 615–628.
21. The ENCODE Project Consortium (2004) The ENCODE (ENCyclopedia OfDNA Elements) Project. Science 306: 636–640.
22. Pritchard JK, Przeworski M (2001) Linkage disequilibrium in humans:models and data. Am J Hum Genet 69: 1–14.
23. Terwilliger JD, Hiekkalinna T (2006) An utter refutation of the ‘‘Funda-mental Theorem of the HapMap’’. Eur J Hum Genet 14: 426–437.
24. Kruglyak L, Nickerson DA (2001) Variation is the spice of life. Nat Genet27: 234–236.
25. Reich DE, Lander ES (2001) On the allelic spectrum of human disease.Trends Genet 17: 502–510.
26. The Wellcome Trust Case Control Consortium (2007) Genome-wideassociation study of 14,000 cases of seven common diseases and 3,000shared controls. Nature 447: 661–678.
27. Easton DF, Pooley KA, Dunning AM, Pharoah PD, Thompson D, et al.(2007) Genome-wide association study identifies novel breast cancersusceptibility loci. Nature 447: 1087–1093.
28. Hunter DJ, Kraft P, Jacobs KB, Cox DG, Yeager M, et al. (2007) A genome-wide association study identifies alleles in FGFR2 associated with risk ofsporadic postmenopausal breast cancer. Nat Genet 39: 870–877.
29. Saxena R, Voight BF, Lyssenko V, Burtt NP, de Bakker PI, et al. (2007)
Genome-wide association analysis identifies loci for type 2 diabetes andtriglyceride levels. Science 316: 1331–1336.
30. Scott LJ, Mohlke KL, Bonnycastle LL, Willer CJ, Li Y, et al. (2007) Agenome-wide association study of type 2 diabetes in Finns detects multiplesusceptibility variants. Science 316: 1341–1345.
31. Sladek R, Rocheleau G, Rung J, Dina C, Shen L, et al. (2007) A genome-wideassociation study identifies novel risk loci for type 2 diabetes. Nature 445:881–885.
32. Stacey SN, Manolescu A, Sulem P, Rafnar T, Gudmundsson J, et al. (2007)Common variants on chromosomes 2q35 and 16q12 confer susceptibility toestrogen receptor-positive breast cancer. Nat Genet 39: 865–869.
33. Zeggini E, Weedon MN, Lindgren CM, Frayling TM, Elliott KS, et al. (2007)Replication of genome-wide association signals in UK samples reveals riskloci for type 2 diabetes. Science 316: 1336–1341.
34. Collins FS, Morgan M, Patrinos A (2003) The Human Genome Project:lessons from large-scale biology. Science 300: 286–290.
35. Zeggini E, Rayner W, Morris AP, Hattersley AT, Walker M, et al. (2005) Anevaluation of HapMap sample size and tagging SNP performance in large-scale empirical and simulated data sets. Nat Genet 37: 1320–1322.
36. Marchini J, Howie B, Myers S, McVean G, Donnelly P (2007) A newmultipoint method for genome-wide association studies by imputation ofgenotypes. Nat Genet 39: 906–913.
37. Servin B, Stephens M (2007) Imputation-based analysis of associationstudies: candidate regions and quantitative traits. PLoS Genet 3: e114.
38. Akey J, Jin L, Xiong M (2001) Haplotypes vs single marker LD tests: what dowe gain? Eur J Hum Genet 9: 291–300.
39. Bader JS (2001) The relative power of SNPs and haplotype as geneticmarkers for association tests. Pharmacogenomics 2: 11–24.
40. Fallin D, Cohen A, Essioux L, Chumakov I, Blumenfeld M, et al. (2001)Genetic analysis of case/control data using estimated haplotype frequen-cies: application to APOE locus variation and Alzheimer’s disease. GenomeRes 11: 143–151.
41. Longmate JA (2001) Complexity and power in case-control associationstudies. Am J Hum Genet 68: 1229–1237.
42. Gaya DR, Russell RK, Nimmo ER, Satsangi J (2006) New genes ininflammatory bowel disease: lessons for complex diseases? Lancet 367:1271–1284.
43. Tysk C, Lindberg E, Jarnerot G, Floderus-Myrhed B (1988) Ulcerative colitisand Crohn’s disease in an unselected population of monozygotic anddizygotic twins. A study of heritability and the influence of smoking. Gut29: 990–996.
44. Hyttinen V, Kaprio J, Kinnunen L, Koskenvuo M, Tuomilehto J (2003)Genetic liability of type 1 diabetes and the onset age among 22,650 youngFinnish twin pairs: a nationwide follow-up study. Diabetes 52: 1052–1055.
45. Kobberling J, Tattersall R (1982) The genetics of diabetes mellitus. London:Academic Press.
46. McCarthy MI, Froguel P (2002) Genetic approaches to the molecularunderstanding of type 2 diabetes. Am J Physiol Endocrinol Metab 283:E217–225.
47. Dewan A, Liu M, Hartman S, Zhang SS, Liu DT, et al. (2006) HTRA1promoter polymorphism in wet age-related macular degeneration. Science314: 989–992.
48. Duerr RH, Taylor KD, Brant SR, Rioux JD, Silverberg MS, et al. (2006) Agenome-wide association study identifies IL23R as an inflammatory boweldisease gene. Science 314: 1461–1463.
49. Frayling TM, Timpson NJ, Weedon MN, Zeggini E, Freathy RM, et al. (2007)A common variant in the FTO gene is associated with body mass index andpredisposes to childhood and adult obesity. Science 316: 889–894.
50. Gudmundsson J, Sulem P, Manolescu A, Amundadottir LT, Gudbjartsson D,et al. (2007) Genome-wide association study identifies a second prostatecancer susceptibility variant at 8q24. Nat Genet 39: 631–637.
51. Helgadottir A, Thorleifsson G, Manolescu A, Gretarsdottir S, Blondal T, etal. (2007) A common variant on Chromosome 9p21 affects the risk ofmyocardial infarction. Science 316: 1491–1493.
52. Klein RJ, Zeiss C, Chew EY, Tsai JY, Sackler RS, et al. (2005) Complementfactor H polymorphism in age-related macular degeneration. Science 308:385–389.
53. Maraganore DM, de Andrade M, Lesnick TG, Strain KJ, Farrer MJ, et al.(2005) High-resolution whole-genome association study of Parkinsondisease. Am J Hum Genet 77: 685–693.
54. McPherson R, Pertsemlidis A, Kavaslar N, Stewart A, Roberts R, et al. (2007)A common allele on chromosome 9 associated with coronary heart disease.Science 316: 1488–1491.
55. Steinthorsdottir V, Thorleifsson G, Reynisdottir I, Benediktsson R,
PLoS Genetics | www.plosgenetics.org October 2007 | Volume 3 | Issue 10 | e1701836
Power of Genome-Wide Tag SNP Panels

Jonsdottir T, et al. (2007) A variant in CDKAL1 influences insulin responseand risk of type 2 diabetes. Nat Genet 39: 770–775.
56. Yeager M, Orr N, Hayes RB, Jacobs KB, Kraft P, et al. (2007) Genome-wideassociation study of prostate cancer identifies a second risk locus at 8q24.Nat Genet 39: 645–649.
57. Saxena R, de Bakker PI, Singer K, Mootha V, Burtt N, et al. (2006)Comprehensive association testing of common mitochondrial DNAvariation in metabolic disease. Am J Hum Genet 79: 54–61.
58. Conrad DF, Andrews TD, Carter NP, Hurles ME, Pritchard JK (2006) Ahigh-resolution survey of deletion polymorphism in the human genome.Nat Genet 38: 75–81.
59. Hinds DA, Kloek AP, Jen M, Chen X, Frazer KA (2006) Common deletionsand SNPs are in LD in the human genome. Nat Genet 38: 82–85.
60. McCarroll SA, Hadnott TN, Perry GH, Sabeti PC, Zody MC, et al. (2006)Common deletion polymorphisms in the human genome. Nat Genet 38:86–92.
61. Long AD, Grote MN, Langley CH (1997) Genetic analysis of complexdiseases. Science 275: 1328; author reply 1329–1330.
62. Schork NJ (2002) Power calculations for genetic association studies usingestimated probability distributions. Am J Hum Genet 70: 1480–1489.
63. Ewens W (1979) Mathematical population genetics. New York: SpringerVerlag.
PLoS Genetics | www.plosgenetics.org October 2007 | Volume 3 | Issue 10 | e1701837
Power of Genome-Wide Tag SNP Panels