Potential of interferometric cantilever detection and its application for SFM/AFM in liquids
6
IOP PUBLISHING NANOTECHNOLOGY Nanotechnology 19 (2008) 384019 (6pp) doi:10.1088/0957-4484/19/38/384019 Potential of interferometric cantilever detection and its application for SFM/AFM in liquids B W Hoogenboom 1 , P L T M Frederix 2 , D Fotiadis 3 , H J Hug 4,5 and A Engel 2 1 London Centre for Nanotechnology and Department of Physics and Astronomy, University College London, 17-19 Gordon Street, London WC1H 0AH, UK 2 MEM¨ uller Institute, Biozentrum, University of Basel, Klingelbergstrasse 70, 4056 Basel, Switzerland 3 Institute of Biochemistry and Molecular Medicine, University of Berne, B¨ uhlstrasse 28, 3012 Berne, Switzerland 4 Swiss Federal Laboratories for Materials Testing and Research, EMPA, ¨ Uberlandstrasse 129, 8600 D¨ ubendorf, Switzerland 5 Department of Physics, University of Basel, Klingelbergstrasse 82, 4056 Basel, Switzerland E-mail: [email protected] Received 15 March 2008, in final form 16 June 2008 Published 12 August 2008 Online at stacks.iop.org/Nano/19/384019 Abstract We have developed an optical cantilever deflection detector with a spot size <3 μm and fm Hz −1/2 sensitivity over a >10 MHz bandwidth. In this work, we demonstrate its potential for detecting small-amplitude oscillations of various flexural and torsional oscillation modes of cantilevers. The high deflection sensitivity of the interferometer is particularly useful for detecting cantilever oscillations in aqueous solutions, enabling us to reach the thermal noise limit in scanning or atomic force microscopy experiments with stiff cantilevers. This has resulted in atomic-resolution images of solid–liquid interfaces and submolecular-resolution images of native membranes. (Some figures in this article are in colour only in the electronic version) 1. Introduction In scanning or atomic force microscopy (SFM/AFM), single- molecular interactions are transduced to movements of microfabricated cantilevers, bridging the gap between the nanoscopic world of atoms and molecules on the one side, and the macroscopic laboratory on the other. In most applications, these interactions are monitored via static cantilever deflections or via changes in the fundamental (flexural) oscillatory mode of the cantilever. There is a substantial amount of information, however, that can be extracted by observing other oscillatory modes as well. Compared to the fundamental resonance, higher flexural modes discriminate towards shorter range interactions [1]; torsional modes enable one to measure not only vertical, but also lateral forces—like friction—on moving the cantilever over a sample surface [2]. To quantitatively address this information, one should be able to determine oscillatory motion over a large range of frequencies in a calibrated way, and at well-defined lateral positions on the cantilever. The latter requirement can be met using optical detection schemes, which—with adequate optics—can focus down to ∼1 μm spot size. Small spot sizes are also necessary for the detection of ultra-small cantilevers [3, 4], such as have been developed to further enhance the signal-to-noise ratio in various force- sensing applications. These cantilevers have lateral dimensions of a few micrometres—compared to tens of micrometres for conventional cantilevers—and lower thermal noise in a given bandwidth. This brings us to another requirement for modern de- flection detectors: the ability to detect ultra-small oscilla- tions. The minimum detectable oscillation should—near the 0957-4484/08/384019+06$30.00 © 2008 IOP Publishing Ltd Printed in the UK 1
Transcript of Potential of interferometric cantilever detection and its application for SFM/AFM in liquids
IOP PUBLISHING NANOTECHNOLOGY
Nanotechnology 19 (2008) 384019 (6pp) doi:10.1088/0957-4484/19/38/384019
Potential of interferometric cantileverdetection and its application forSFM/AFM in liquidsB W Hoogenboom1, P L T M Frederix2, D Fotiadis3, H J Hug4,5 andA Engel2
1 London Centre for Nanotechnology and Department of Physics and Astronomy,University College London, 17-19 Gordon Street, London WC1H 0AH, UK2 M E Muller Institute, Biozentrum, University of Basel, Klingelbergstrasse 70,4056 Basel, Switzerland3 Institute of Biochemistry and Molecular Medicine, University of Berne, Buhlstrasse 28,3012 Berne, Switzerland4 Swiss Federal Laboratories for Materials Testing and Research, EMPA, Uberlandstrasse 129,8600 Dubendorf, Switzerland5 Department of Physics, University of Basel, Klingelbergstrasse 82, 4056 Basel, Switzerland
E-mail: [email protected]
Received 15 March 2008, in final form 16 June 2008Published 12 August 2008Online at stacks.iop.org/Nano/19/384019
AbstractWe have developed an optical cantilever deflection detector with a spot size <3 μm andfm Hz−1/2 sensitivity over a >10 MHz bandwidth. In this work, we demonstrate its potentialfor detecting small-amplitude oscillations of various flexural and torsional oscillation modes ofcantilevers. The high deflection sensitivity of the interferometer is particularly useful fordetecting cantilever oscillations in aqueous solutions, enabling us to reach the thermal noiselimit in scanning or atomic force microscopy experiments with stiff cantilevers. This hasresulted in atomic-resolution images of solid–liquid interfaces and submolecular-resolutionimages of native membranes.
(Some figures in this article are in colour only in the electronic version)
1. Introduction
In scanning or atomic force microscopy (SFM/AFM), single-molecular interactions are transduced to movements ofmicrofabricated cantilevers, bridging the gap between thenanoscopic world of atoms and molecules on the one side, andthe macroscopic laboratory on the other. In most applications,these interactions are monitored via static cantilever deflectionsor via changes in the fundamental (flexural) oscillatory modeof the cantilever. There is a substantial amount of information,however, that can be extracted by observing other oscillatorymodes as well. Compared to the fundamental resonance,higher flexural modes discriminate towards shorter rangeinteractions [1]; torsional modes enable one to measure notonly vertical, but also lateral forces—like friction—on movingthe cantilever over a sample surface [2].
To quantitatively address this information, one should beable to determine oscillatory motion over a large range offrequencies in a calibrated way, and at well-defined lateralpositions on the cantilever. The latter requirement can bemet using optical detection schemes, which—with adequateoptics—can focus down to ∼1 μm spot size.
Small spot sizes are also necessary for the detection ofultra-small cantilevers [3, 4], such as have been developedto further enhance the signal-to-noise ratio in various force-sensing applications. These cantilevers have lateral dimensionsof a few micrometres—compared to tens of micrometres forconventional cantilevers—and lower thermal noise in a givenbandwidth.
This brings us to another requirement for modern de-flection detectors: the ability to detect ultra-small oscilla-tions. The minimum detectable oscillation should—near the
0957-4484/08/384019+06$30.00 © 2008 IOP Publishing Ltd Printed in the UK1

Nanotechnology 19 (2008) 384019 B W Hoogenboom et al
resonance—be smaller than the thermal fluctuations of the can-tilever, as given by the equipartition theorem 1
2 km〈z2m〉 = 1
2 kBTfor each mode m of oscillation. Here 〈z2
m〉 and km are the en-semble average of the squared amplitude fluctuations and thespring constant for mode m, respectively; kB is the Boltzmannconstant and T the temperature in kelvin. This is a particu-larly stringent requirement in viscous liquids like water, wherecantilever oscillations are strongly damped and 〈z2
m〉 is smearedout over a large frequency range, to eventually disappear belowthe noise floor of the deflection detector.
Therefore, highly sensitive deflection detectors arecrucial for obtaining high-resolution dynamic-mode SFMexperiments, as has been demonstrated by recent atomic- and(sub)molecular-resolution images on solid–liquid interfacesand on various biological samples in physiologically relevantenvironments [5–8].
A highly sensitive optical position detector can berealized, for example, using interferometric techniques. Inan interferometric deflection detector [9] the cantilever acts asone side of an optical cavity. Laser light is reflected betweenthe cantilever and the other side of the cavity, which maysimply be a cleaved fibre end. The total back-reflected lightdepends on the optical path difference between the variousreflected light rays—and thus on the cantilever position—resulting in constructive or destructive interference. Somegeneral differences between an interferometric detection andthe more common beam deflection method [10] are that (i)interferometry measures a position, whereas beam deflectionmeasures the cantilever bending, i.e., an angle; (ii) theinterferometer needs only one alignment, that of the opticalfibre or the optics with respect to the cantilever, whereas forbeam deflection the laser needs to be aligned to the cantileverand a split photodiode needs to be aligned to the reflected laserbeam.
In this paper, we describe, test and apply a Fabry–Perot interferometer that is particularly suited for cantileverdetection in environments as diverse as ultra-high vacuum,gas, and liquid [11]. In the following, we demonstrate itspotential to measure various oscillatory modes of cantilevers,to achieve high position sensitivity on cantilevers, and to recordhigh-resolution SFM images—including images of biologicalsamples—of surfaces in aqueous environments.
2. Experimental details
2.1. Interferometer
Cantilever deflections were detected using a home-built Fabry–Perot interferometer (figure 1). The light source for theinterferometer is a temperature-controlled 785 nm diode laser(Sanyo DL7140-201S), coupled to a single-mode optical fibrevia an optical insulator and a beam splitter. A three-lens opticalsystem focuses the light from the fibre core (5 μm diameter)to a <3 μm spot at 0.9 mm distance from the front lens.This distance corresponds exactly to the radius of curvature ofthe front lens, implying that the light rays are perpendicularto its surface. This configuration is also known as a hemi-concentric optical cavity, allowing multiple reflections between
Figure 1. Schematics of the interferometer. A lens system focuseslight from a single-mode fibre (fixed alignment) to a point that lies inthe centre of curvature (radius R = 0.9 mm) of the front lens. Thisoptical system is aligned to the cantilever. The lens holder, cantilever,and sample are all immersed in the imaging medium (vacuum, air,aqueous solution, etc). Inset: the reflectivity of the optical cavityformed by the front lens and the cantilever, as a function of thecantilever position (with arbitrary offset). Arrows indicateappropriate working points for achieving optimum positionsensitivity.
both cavity ends without the light being able to escape. Lightback-reflected from this cavity is recoupled into the fibre and—at the beam splitter—onto the photodiode. The home-builtcurrent–voltage converter at the photodiode (MF446, ZarlinkSemiconductor) has a bandwidth of 11 MHz.
For SFM experiments, this optical configuration has thefollowing advantages. (i) A high finesse (20–25), implyinglarge changes in light intensity for small changes in cantileverposition. The dielectric coating of the front lens has areflectivity of 90% for 785 nm light, matching that of agold-coated cantilever. (ii) There is no refraction at thefront lens surface (perpendicular incidence of the light). Asa consequence, the optical geometry is independent of therefraction index of the medium between the lens and thecantilever. The alignment does not change on going from air toaqueous solution, for example. In fact, the sensitivity becomesslightly better in water (by a factor corresponding to its indexof refraction) because of the shorter wavelength. (iii) Morethan ±10◦ tolerance to angular misalignment, since the lightfrom a tilted cantilever is always refocussed back onto the samespot. (iv) A safe distance of 0.8 mm from the front edge ofthe lens to its focal point. With appropriately set mechanicalstops in the alignment motor, this excludes the possibility ofmechanical contact with the cantilever and its support chip,greatly facilitating the alignment procedure.
Making use of the a priori knowledge about the supportchip geometry, the interferometer can even be aligned withoutvisual access to the cantilever. The interferometer is mountedon a piezo-electric stack scanner to sweep through abouttwo periods in the interference pattern. The interferometeris aligned to the cantilever using a home-built piezo-electricxyz motor of only 42 mm diameter, with x and y in thecantilever plane (tilted by 10◦ with respect to the samplesurface). The cantilever was directly glued (silver paint) onan insulated piezo-electric actuator in a home-built cantilever
2
Nanotechnology 19 (2008) 384019 B W Hoogenboom et al
0
1
2
143 143.2
f0 edge
axis
0
0.1
924.8 925.2 925.6
f1 edge
axis
0
0.1
0.2
1415.4 1415.5 1415.6
Am
plitu
de [
pm rm
s / H
z1/2 ]
Frequency [kHz]
fT0 edge
axis
0
10
20
2575 2576
f2 edge
axis
0
2
4
4254 4256
fT1 edge
axis
0
2
4
4908 4910
Am
plitu
de [
fm rm
s / H
z1/2 ]
Frequency [kHz]
f3 edge
axis
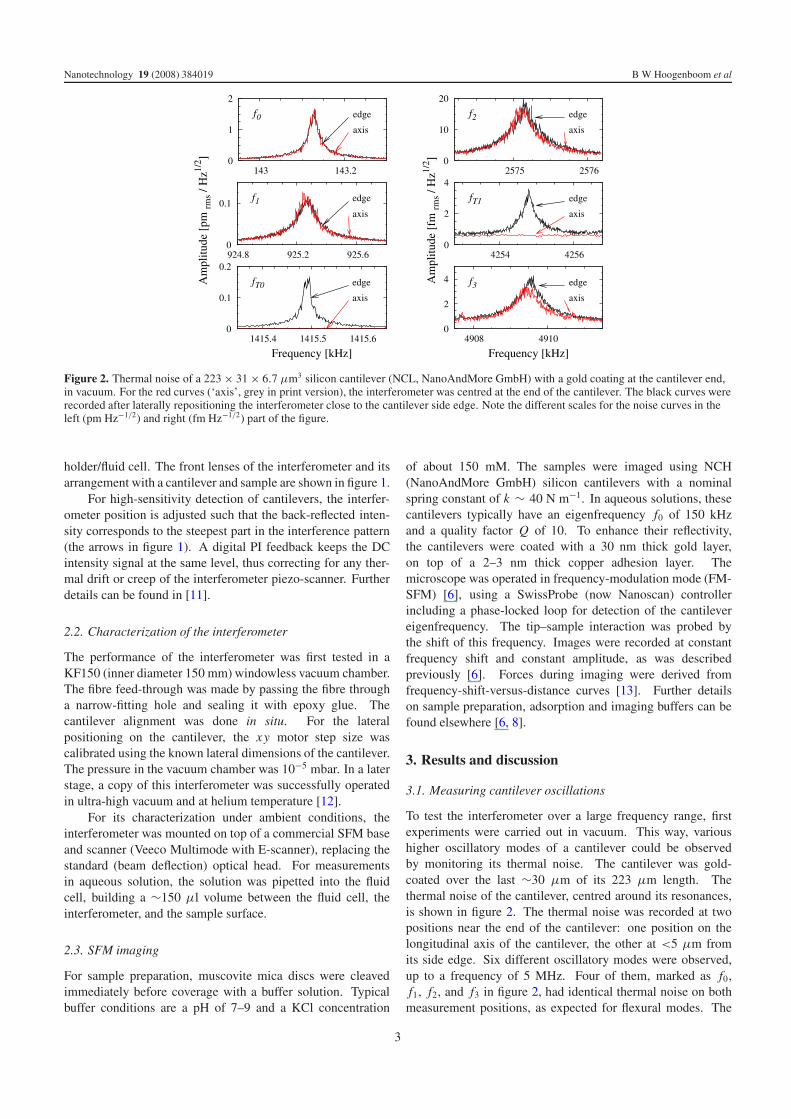
Figure 2. Thermal noise of a 223 × 31 × 6.7 μm3 silicon cantilever (NCL, NanoAndMore GmbH) with a gold coating at the cantilever end,in vacuum. For the red curves (‘axis’, grey in print version), the interferometer was centred at the end of the cantilever. The black curves wererecorded after laterally repositioning the interferometer close to the cantilever side edge. Note the different scales for the noise curves in theleft (pm Hz−1/2) and right (fm Hz−1/2) part of the figure.
holder/fluid cell. The front lenses of the interferometer and itsarrangement with a cantilever and sample are shown in figure 1.
For high-sensitivity detection of cantilevers, the interfer-ometer position is adjusted such that the back-reflected inten-sity corresponds to the steepest part in the interference pattern(the arrows in figure 1). A digital PI feedback keeps the DCintensity signal at the same level, thus correcting for any ther-mal drift or creep of the interferometer piezo-scanner. Furtherdetails can be found in [11].
2.2. Characterization of the interferometer
The performance of the interferometer was first tested in aKF150 (inner diameter 150 mm) windowless vacuum chamber.The fibre feed-through was made by passing the fibre througha narrow-fitting hole and sealing it with epoxy glue. Thecantilever alignment was done in situ. For the lateralpositioning on the cantilever, the xy motor step size wascalibrated using the known lateral dimensions of the cantilever.The pressure in the vacuum chamber was 10−5 mbar. In a laterstage, a copy of this interferometer was successfully operatedin ultra-high vacuum and at helium temperature [12].
For its characterization under ambient conditions, theinterferometer was mounted on top of a commercial SFM baseand scanner (Veeco Multimode with E-scanner), replacing thestandard (beam deflection) optical head. For measurementsin aqueous solution, the solution was pipetted into the fluidcell, building a ∼150 μl volume between the fluid cell, theinterferometer, and the sample surface.
2.3. SFM imaging
For sample preparation, muscovite mica discs were cleavedimmediately before coverage with a buffer solution. Typicalbuffer conditions are a pH of 7–9 and a KCl concentration
of about 150 mM. The samples were imaged using NCH(NanoAndMore GmbH) silicon cantilevers with a nominalspring constant of k ∼ 40 N m−1. In aqueous solutions, thesecantilevers typically have an eigenfrequency f0 of 150 kHzand a quality factor Q of 10. To enhance their reflectivity,the cantilevers were coated with a 30 nm thick gold layer,on top of a 2–3 nm thick copper adhesion layer. Themicroscope was operated in frequency-modulation mode (FM-SFM) [6], using a SwissProbe (now Nanoscan) controllerincluding a phase-locked loop for detection of the cantilevereigenfrequency. The tip–sample interaction was probed bythe shift of this frequency. Images were recorded at constantfrequency shift and constant amplitude, as was describedpreviously [6]. Forces during imaging were derived fromfrequency-shift-versus-distance curves [13]. Further detailson sample preparation, adsorption and imaging buffers can befound elsewhere [6, 8].
3. Results and discussion
3.1. Measuring cantilever oscillations
To test the interferometer over a large frequency range, firstexperiments were carried out in vacuum. This way, varioushigher oscillatory modes of a cantilever could be observedby monitoring its thermal noise. The cantilever was gold-coated over the last ∼30 μm of its 223 μm length. Thethermal noise of the cantilever, centred around its resonances,is shown in figure 2. The thermal noise was recorded at twopositions near the end of the cantilever: one position on thelongitudinal axis of the cantilever, the other at <5 μm fromits side edge. Six different oscillatory modes were observed,up to a frequency of 5 MHz. Four of them, marked as f0,f1, f2, and f3 in figure 2, had identical thermal noise on bothmeasurement positions, as expected for flexural modes. The
3
Nanotechnology 19 (2008) 384019 B W Hoogenboom et al
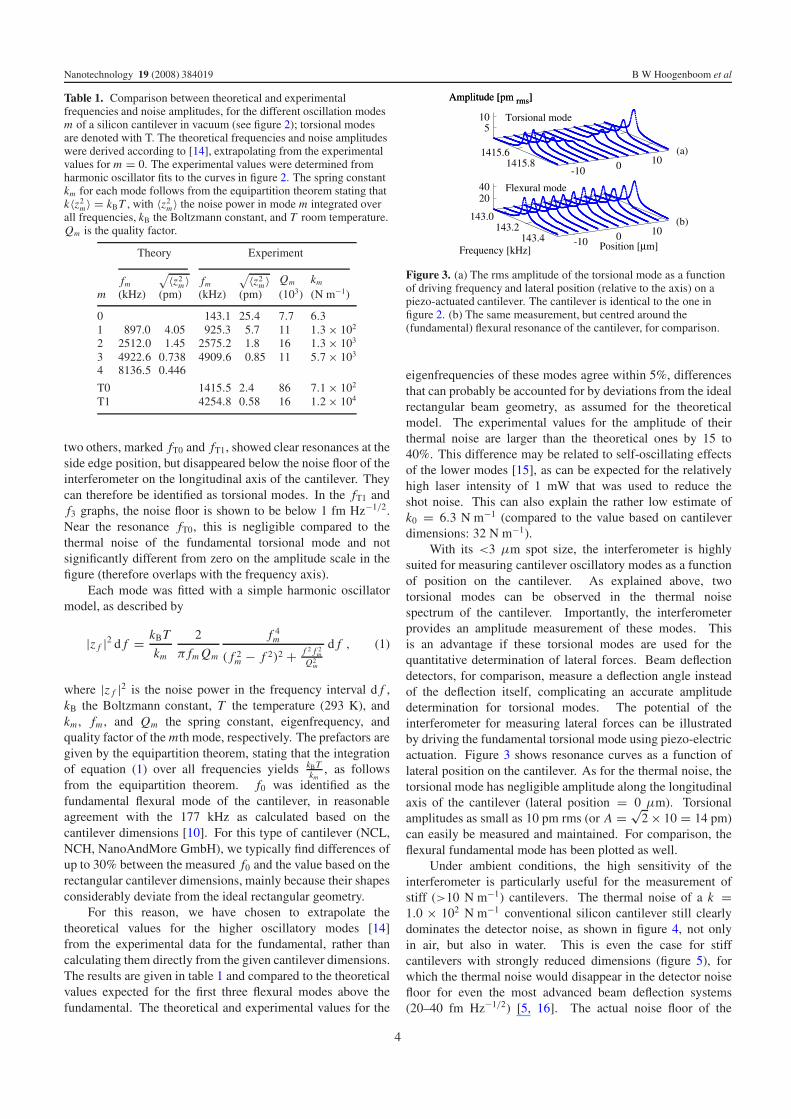
Table 1. Comparison between theoretical and experimentalfrequencies and noise amplitudes, for the different oscillation modesm of a silicon cantilever in vacuum (see figure 2); torsional modesare denoted with T. The theoretical frequencies and noise amplitudeswere derived according to [14], extrapolating from the experimentalvalues for m = 0. The experimental values were determined fromharmonic oscillator fits to the curves in figure 2. The spring constantkm for each mode follows from the equipartition theorem stating thatk〈z2
m〉 = kBT , with 〈z2m〉 the noise power in mode m integrated over
all frequencies, kB the Boltzmann constant, and T room temperature.Qm is the quality factor.
Theory Experiment
mfm
(kHz)
√〈z2m〉
(pm)fm
(kHz)
√〈z2m〉
(pm)Qm
(103)km
(N m−1)
0 143.1 25.4 7.7 6.31 897.0 4.05 925.3 5.7 11 1.3 × 10²
2 2512.0 1.45 2575.2 1.8 16 1.3 × 10³
3 4922.6 0.738 4909.6 0.85 11 5.7 × 10³
4 8136.5 0.446
T0 1415.5 2.4 86 7.1 × 10²
T1 4254.8 0.58 16 1.2 × 10⁴
two others, marked fT0 and fT1, showed clear resonances at theside edge position, but disappeared below the noise floor of theinterferometer on the longitudinal axis of the cantilever. Theycan therefore be identified as torsional modes. In the fT1 andf3 graphs, the noise floor is shown to be below 1 fm Hz−1/2.Near the resonance fT0, this is negligible compared to thethermal noise of the fundamental torsional mode and notsignificantly different from zero on the amplitude scale in thefigure (therefore overlaps with the frequency axis).
Each mode was fitted with a simple harmonic oscillatormodel, as described by
|z f |2 d f = kBT
km
2
π fm Qm
f 4m
( f 2m − f 2)2 + f 2 f 2
mQ2
m
d f , (1)
where |z f |2 is the noise power in the frequency interval d f ,kB the Boltzmann constant, T the temperature (293 K), andkm , fm , and Qm the spring constant, eigenfrequency, andquality factor of the mth mode, respectively. The prefactors aregiven by the equipartition theorem, stating that the integrationof equation (1) over all frequencies yields kBT
km, as follows
from the equipartition theorem. f0 was identified as thefundamental flexural mode of the cantilever, in reasonableagreement with the 177 kHz as calculated based on thecantilever dimensions [10]. For this type of cantilever (NCL,NCH, NanoAndMore GmbH), we typically find differences ofup to 30% between the measured f0 and the value based on therectangular cantilever dimensions, mainly because their shapesconsiderably deviate from the ideal rectangular geometry.
For this reason, we have chosen to extrapolate thetheoretical values for the higher oscillatory modes [14]from the experimental data for the fundamental, rather thancalculating them directly from the given cantilever dimensions.The results are given in table 1 and compared to the theoreticalvalues expected for the first three flexural modes above thefundamental. The theoretical and experimental values for the
Figure 3. (a) The rms amplitude of the torsional mode as a functionof driving frequency and lateral position (relative to the axis) on apiezo-actuated cantilever. The cantilever is identical to the one infigure 2. (b) The same measurement, but centred around the(fundamental) flexural resonance of the cantilever, for comparison.
eigenfrequencies of these modes agree within 5%, differencesthat can probably be accounted for by deviations from the idealrectangular beam geometry, as assumed for the theoreticalmodel. The experimental values for the amplitude of theirthermal noise are larger than the theoretical ones by 15 to40%. This difference may be related to self-oscillating effectsof the lower modes [15], as can be expected for the relativelyhigh laser intensity of 1 mW that was used to reduce theshot noise. This can also explain the rather low estimate ofk0 = 6.3 N m−1 (compared to the value based on cantileverdimensions: 32 N m−1).
With its <3 μm spot size, the interferometer is highlysuited for measuring cantilever oscillatory modes as a functionof position on the cantilever. As explained above, twotorsional modes can be observed in the thermal noisespectrum of the cantilever. Importantly, the interferometerprovides an amplitude measurement of these modes. Thisis an advantage if these torsional modes are used for thequantitative determination of lateral forces. Beam deflectiondetectors, for comparison, measure a deflection angle insteadof the deflection itself, complicating an accurate amplitudedetermination for torsional modes. The potential of theinterferometer for measuring lateral forces can be illustratedby driving the fundamental torsional mode using piezo-electricactuation. Figure 3 shows resonance curves as a function oflateral position on the cantilever. As for the thermal noise, thetorsional mode has negligible amplitude along the longitudinalaxis of the cantilever (lateral position = 0 μm). Torsionalamplitudes as small as 10 pm rms (or A = √
2 × 10 = 14 pm)can easily be measured and maintained. For comparison, theflexural fundamental mode has been plotted as well.
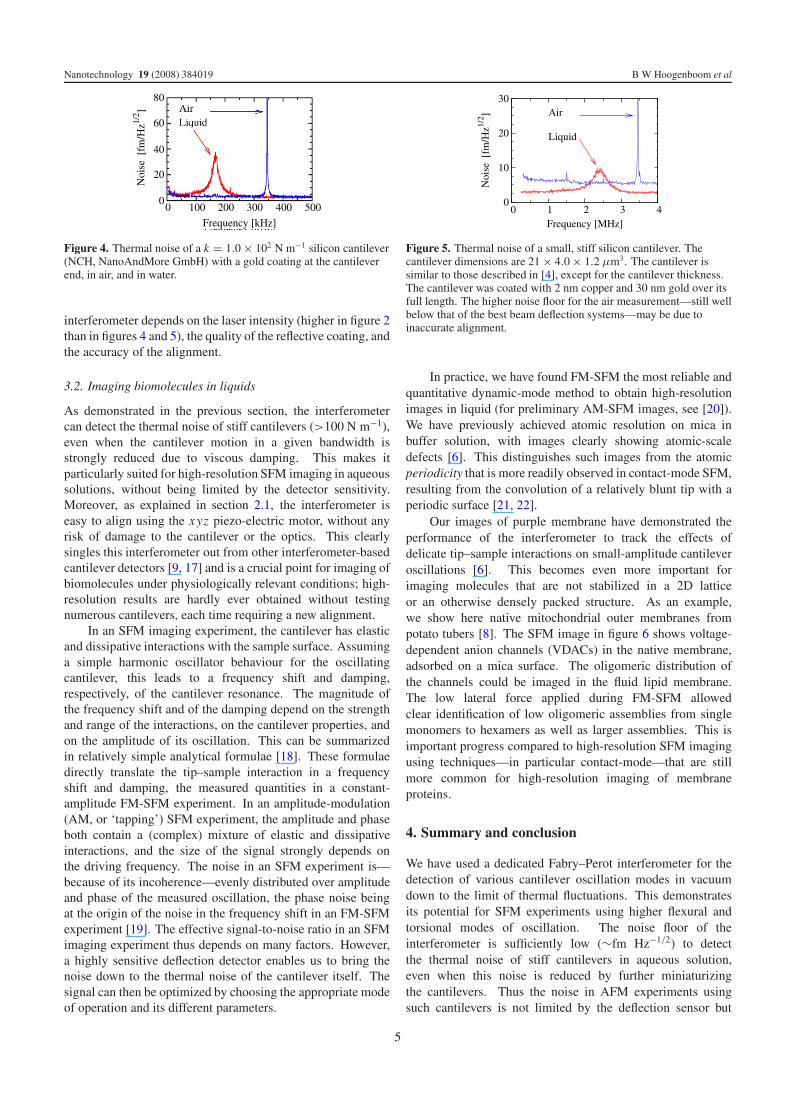
Under ambient conditions, the high sensitivity of theinterferometer is particularly useful for the measurement ofstiff (>10 N m−1) cantilevers. The thermal noise of a k =1.0 × 10² N m−1 conventional silicon cantilever still clearlydominates the detector noise, as shown in figure 4, not onlyin air, but also in water. This is even the case for stiffcantilevers with strongly reduced dimensions (figure 5), forwhich the thermal noise would disappear in the detector noisefloor for even the most advanced beam deflection systems(20–40 fm Hz−1/2) [5, 16]. The actual noise floor of the
4
Nanotechnology 19 (2008) 384019 B W Hoogenboom et al
Figure 4. Thermal noise of a k = 1.0 × 10² N m−1 silicon cantilever(NCH, NanoAndMore GmbH) with a gold coating at the cantileverend, in air, and in water.
interferometer depends on the laser intensity (higher in figure 2than in figures 4 and 5), the quality of the reflective coating, andthe accuracy of the alignment.
3.2. Imaging biomolecules in liquids
As demonstrated in the previous section, the interferometercan detect the thermal noise of stiff cantilevers (>100 N m−1),even when the cantilever motion in a given bandwidth isstrongly reduced due to viscous damping. This makes itparticularly suited for high-resolution SFM imaging in aqueoussolutions, without being limited by the detector sensitivity.Moreover, as explained in section 2.1, the interferometer iseasy to align using the xyz piezo-electric motor, without anyrisk of damage to the cantilever or the optics. This clearlysingles this interferometer out from other interferometer-basedcantilever detectors [9, 17] and is a crucial point for imaging ofbiomolecules under physiologically relevant conditions; high-resolution results are hardly ever obtained without testingnumerous cantilevers, each time requiring a new alignment.
In an SFM imaging experiment, the cantilever has elasticand dissipative interactions with the sample surface. Assuminga simple harmonic oscillator behaviour for the oscillatingcantilever, this leads to a frequency shift and damping,respectively, of the cantilever resonance. The magnitude ofthe frequency shift and of the damping depend on the strengthand range of the interactions, on the cantilever properties, andon the amplitude of its oscillation. This can be summarizedin relatively simple analytical formulae [18]. These formulaedirectly translate the tip–sample interaction in a frequencyshift and damping, the measured quantities in a constant-amplitude FM-SFM experiment. In an amplitude-modulation(AM, or ‘tapping’) SFM experiment, the amplitude and phaseboth contain a (complex) mixture of elastic and dissipativeinteractions, and the size of the signal strongly depends onthe driving frequency. The noise in an SFM experiment is—because of its incoherence—evenly distributed over amplitudeand phase of the measured oscillation, the phase noise beingat the origin of the noise in the frequency shift in an FM-SFMexperiment [19]. The effective signal-to-noise ratio in an SFMimaging experiment thus depends on many factors. However,a highly sensitive deflection detector enables us to bring thenoise down to the thermal noise of the cantilever itself. Thesignal can then be optimized by choosing the appropriate modeof operation and its different parameters.
0
10
20
30
0 1 2 3 4
Noi
se [
fm/H
z1/2 ]
Frequency [MHz]
Air
Liquid
Figure 5. Thermal noise of a small, stiff silicon cantilever. Thecantilever dimensions are 21 × 4.0 × 1.2 μm3. The cantilever issimilar to those described in [4], except for the cantilever thickness.The cantilever was coated with 2 nm copper and 30 nm gold over itsfull length. The higher noise floor for the air measurement—still wellbelow that of the best beam deflection systems—may be due toinaccurate alignment.
In practice, we have found FM-SFM the most reliable andquantitative dynamic-mode method to obtain high-resolutionimages in liquid (for preliminary AM-SFM images, see [20]).We have previously achieved atomic resolution on mica inbuffer solution, with images clearly showing atomic-scaledefects [6]. This distinguishes such images from the atomicperiodicity that is more readily observed in contact-mode SFM,resulting from the convolution of a relatively blunt tip with aperiodic surface [21, 22].
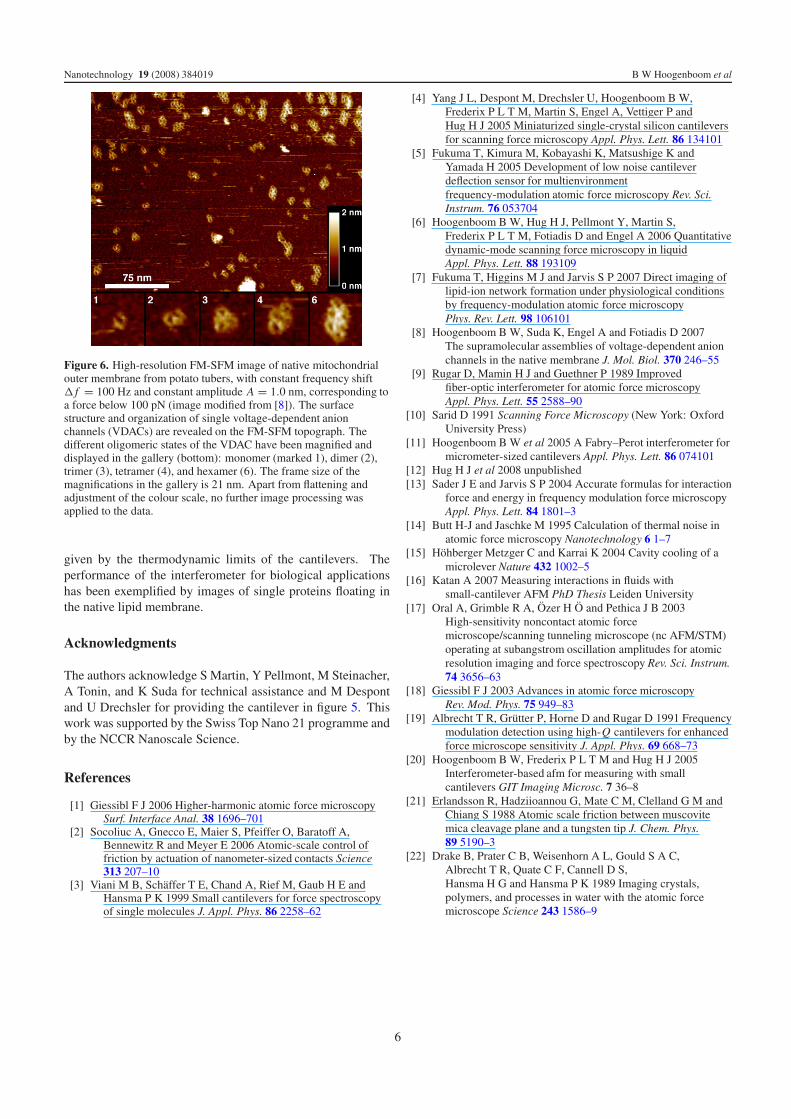
Our images of purple membrane have demonstrated theperformance of the interferometer to track the effects ofdelicate tip–sample interactions on small-amplitude cantileveroscillations [6]. This becomes even more important forimaging molecules that are not stabilized in a 2D latticeor an otherwise densely packed structure. As an example,we show here native mitochondrial outer membranes frompotato tubers [8]. The SFM image in figure 6 shows voltage-dependent anion channels (VDACs) in the native membrane,adsorbed on a mica surface. The oligomeric distribution ofthe channels could be imaged in the fluid lipid membrane.The low lateral force applied during FM-SFM allowedclear identification of low oligomeric assemblies from singlemonomers to hexamers as well as larger assemblies. This isimportant progress compared to high-resolution SFM imagingusing techniques—in particular contact-mode—that are stillmore common for high-resolution imaging of membraneproteins.
4. Summary and conclusion
We have used a dedicated Fabry–Perot interferometer for thedetection of various cantilever oscillation modes in vacuumdown to the limit of thermal fluctuations. This demonstratesits potential for SFM experiments using higher flexural andtorsional modes of oscillation. The noise floor of theinterferometer is sufficiently low (∼fm Hz−1/2) to detectthe thermal noise of stiff cantilevers in aqueous solution,even when this noise is reduced by further miniaturizingthe cantilevers. Thus the noise in AFM experiments usingsuch cantilevers is not limited by the deflection sensor but
5
Nanotechnology 19 (2008) 384019 B W Hoogenboom et al
Figure 6. High-resolution FM-SFM image of native mitochondrialouter membrane from potato tubers, with constant frequency shift� f = 100 Hz and constant amplitude A = 1.0 nm, corresponding toa force below 100 pN (image modified from [8]). The surfacestructure and organization of single voltage-dependent anionchannels (VDACs) are revealed on the FM-SFM topograph. Thedifferent oligomeric states of the VDAC have been magnified anddisplayed in the gallery (bottom): monomer (marked 1), dimer (2),trimer (3), tetramer (4), and hexamer (6). The frame size of themagnifications in the gallery is 21 nm. Apart from flattening andadjustment of the colour scale, no further image processing wasapplied to the data.
given by the thermodynamic limits of the cantilevers. Theperformance of the interferometer for biological applicationshas been exemplified by images of single proteins floating inthe native lipid membrane.
Acknowledgments
The authors acknowledge S Martin, Y Pellmont, M Steinacher,A Tonin, and K Suda for technical assistance and M Despontand U Drechsler for providing the cantilever in figure 5. Thiswork was supported by the Swiss Top Nano 21 programme andby the NCCR Nanoscale Science.
References
[1] Giessibl F J 2006 Higher-harmonic atomic force microscopySurf. Interface Anal. 38 1696–701
[2] Socoliuc A, Gnecco E, Maier S, Pfeiffer O, Baratoff A,Bennewitz R and Meyer E 2006 Atomic-scale control offriction by actuation of nanometer-sized contacts Science313 207–10
[3] Viani M B, Schaffer T E, Chand A, Rief M, Gaub H E andHansma P K 1999 Small cantilevers for force spectroscopyof single molecules J. Appl. Phys. 86 2258–62
[4] Yang J L, Despont M, Drechsler U, Hoogenboom B W,Frederix P L T M, Martin S, Engel A, Vettiger P andHug H J 2005 Miniaturized single-crystal silicon cantileversfor scanning force microscopy Appl. Phys. Lett. 86 134101
[5] Fukuma T, Kimura M, Kobayashi K, Matsushige K andYamada H 2005 Development of low noise cantileverdeflection sensor for multienvironmentfrequency-modulation atomic force microscopy Rev. Sci.Instrum. 76 053704
[6] Hoogenboom B W, Hug H J, Pellmont Y, Martin S,Frederix P L T M, Fotiadis D and Engel A 2006 Quantitativedynamic-mode scanning force microscopy in liquidAppl. Phys. Lett. 88 193109
[7] Fukuma T, Higgins M J and Jarvis S P 2007 Direct imaging oflipid-ion network formation under physiological conditionsby frequency-modulation atomic force microscopyPhys. Rev. Lett. 98 106101
[8] Hoogenboom B W, Suda K, Engel A and Fotiadis D 2007The supramolecular assemblies of voltage-dependent anionchannels in the native membrane J. Mol. Biol. 370 246–55
[9] Rugar D, Mamin H J and Guethner P 1989 Improvedfiber-optic interferometer for atomic force microscopyAppl. Phys. Lett. 55 2588–90
[10] Sarid D 1991 Scanning Force Microscopy (New York: OxfordUniversity Press)
[11] Hoogenboom B W et al 2005 A Fabry–Perot interferometer formicrometer-sized cantilevers Appl. Phys. Lett. 86 074101
[12] Hug H J et al 2008 unpublished[13] Sader J E and Jarvis S P 2004 Accurate formulas for interaction
force and energy in frequency modulation force microscopyAppl. Phys. Lett. 84 1801–3
[14] Butt H-J and Jaschke M 1995 Calculation of thermal noise inatomic force microscopy Nanotechnology 6 1–7
[15] Hohberger Metzger C and Karrai K 2004 Cavity cooling of amicrolever Nature 432 1002–5
[16] Katan A 2007 Measuring interactions in fluids withsmall-cantilever AFM PhD Thesis Leiden University
[17] Oral A, Grimble R A, Ozer H O and Pethica J B 2003High-sensitivity noncontact atomic forcemicroscope/scanning tunneling microscope (nc AFM/STM)operating at subangstrom oscillation amplitudes for atomicresolution imaging and force spectroscopy Rev. Sci. Instrum.74 3656–63
[18] Giessibl F J 2003 Advances in atomic force microscopyRev. Mod. Phys. 75 949–83
[19] Albrecht T R, Grutter P, Horne D and Rugar D 1991 Frequencymodulation detection using high-Q cantilevers for enhancedforce microscope sensitivity J. Appl. Phys. 69 668–73
[20] Hoogenboom B W, Frederix P L T M and Hug H J 2005Interferometer-based afm for measuring with smallcantilevers GIT Imaging Microsc. 7 36–8
[21] Erlandsson R, Hadziioannou G, Mate C M, Clelland G M andChiang S 1988 Atomic scale friction between muscovitemica cleavage plane and a tungsten tip J. Chem. Phys.89 5190–3
[22] Drake B, Prater C B, Weisenhorn A L, Gould S A C,Albrecht T R, Quate C F, Cannell D S,Hansma H G and Hansma P K 1989 Imaging crystals,polymers, and processes in water with the atomic forcemicroscope Science 243 1586–9
6