Observation of Tropical Rain Forest Trees by Airborne High Resolution Interferometric Radar
11
584 IEEE TRANSACTIONS ON GEOSCIENCE AND REMOTE SENSING, VOL. 39, NO. 3, MARCH 2001 Observation of Tropical Rain Forest Trees by Airborne High-Resolution Interferometric Radar Dirk H. Hoekman and Chris Varekamp Abstract—The Indonesian Radar Experiment (INDREX) Cam- paign was executed in Indonesia to study the potential of high-res- olution interferometric airborne radar in support of sustainable tropical forest management. Severe cloud cover limits the use of aerial photography, which is currently applied on a routine basis to extract information at the tree level. Interferometric radar im- ages may be a viable alternative once radar imaging at the tree level is sufficiently understood. It is shown that interferometric height images can contain large height and displacement errors for in- dividual trees but that this problem can be solved to a large ex- tent using models for the vertical distribution of backscatter in- tensity and an extension of the Van Cittert–Zernike theorem. The predicted loss of coherence in lay-over regions of emergent trees is shown to be in good agreement with the loss of coherence as ob- served in the high resolution radar data (Pierson correlation co- efficient 0.94). Several correction methods for height and dis- placement errors are proposed. It is shown that a simple approach already gives a good correction. Semi-empirical correction models, which can be calibrated for forest structure, perform even better. Index Terms—Airborne radar, INDREX Campaign, SAR inter- ferometry, tropical forest. I. INTRODUCTION T O ENFORCE national legislation for sustainable forest management or to verify implementation of guidelines for sustainable forest management as proposed by the International Tropical Timber Organization (ITTO), information on terrain, forest, and tree characteristics is needed. Among others, systems should be available to monitor logging activities and to detect illegal logging, allowing timely action to be taken. Because cloud cover severely limits the application of aerial photography [5], the use of airborne radar is proposed as an appropriate alternative. To study the potential of radar the Indonesian Radar Ex- periment (INDREX) campaign was executed in Indonesia in 1996 under the auspices of the Indonesian Ministry of Forestry (MOF) and the European Space Agency (ESA), Noordwijk, the Netherlands. The Dornier synthetic aperture radar (SAR) system [4] collected data in several modi over Dipterocarp rain forest test sites in the provinces of East Kalimantan and Jambi. In the same period, aerial photographs were acquired and ground observations were made. In this paper, results of high-resolution (1.5 m) C-band interferometric SAR data of two of the East Kalimantan test sites (sites A and C) are discussed. These particular test sites include the Wanariset research forest, the ITTO plot for forest rehabilitation, and the ITCI concession [2]. Manuscript received January 19, 1999; revised August 28, 2000. The authors are with the Department of Environmental Sciences, Wageningen University, Wageningen, The Netherlands. Publisher Item Identifier S 0196-2892(01)02092-7. Fig. 1. Lay-over in tropical rain forest. The antenna positions are numbered as 1 and 2 and are separated by the baseline distance . A local coordinate system ( ) has been defined with the origin halfway to the line connecting two effective scattering layers. The thickness of the upper and lower effective scattering layers are indicated by and . is the distance between these layers. Parameters such as tree position, tree crown dimensions, canopy cover and terrain slope angle, and the location of skid trails and logging roads are of particular interest. In principle, such information can be retrieved on a routine basis over large areas from aerial photographs. Repetitive observation would allow assessment of logging intensity, erosion and fire susceptibility, verification of reforestation obligations, etc. However, cloud cover too often prevents timely observation. Radar does not have this limitation. Moreover, images of short-wave high-resolution radar, in principle may give suffi- cient information. Since other physical mechanisms underlie radar imaging, radar images can not be treated in the same way as aerial photographs. Notably, effects of radar shadow and lay-over should be handled with care. Lay-over, for example, occurs where two tree crowns with different heights are located at the same range distance (see also Fig. 1). In noninterfero- metric radar images, these two tree crowns will be imaged on top of each other without being able to detect such a situation. In interferometric images, this situation can be detected through the measurement of phase coherence. In tropical forests, height differences between individual trees can be substantial and are common. Emergent trees in primary and logged-over forests can reach more than 10 m above other upper canopy trees. The same is true for secondary forest, which often comprises remnants of the former primary forest. In theory, the problem of lay-over may be solved to a large extent by making use of the observed interferometric phase co- 0196–2892/01$10.00 © 2001 IEEE
-
Upload
independent -
Category
Documents
-
view
1 -
download
0
Transcript of Observation of Tropical Rain Forest Trees by Airborne High Resolution Interferometric Radar

584 IEEE TRANSACTIONS ON GEOSCIENCE AND REMOTE SENSING, VOL. 39, NO. 3, MARCH 2001
Observation of Tropical Rain Forest Trees byAirborne High-Resolution Interferometric Radar
Dirk H. Hoekman and Chris Varekamp
Abstract—The Indonesian Radar Experiment (INDREX) Cam-paign was executed in Indonesia to study the potential of high-res-olution interferometric airborne radar in support of sustainabletropical forest management. Severe cloud cover limits the use ofaerial photography, which is currently applied on a routine basisto extract information at the tree level. Interferometric radar im-ages may be a viable alternative once radar imaging at the tree levelis sufficiently understood. It is shown that interferometric heightimages can contain large height and displacement errors for in-dividual trees but that this problem can be solved to a large ex-tent using models for the vertical distribution of backscatter in-tensity and an extension of the Van Cittert–Zernike theorem. Thepredicted loss of coherence in lay-over regions of emergent trees isshown to be in good agreement with the loss of coherence as ob-served in the high resolution radar data (Pierson correlation co-efficient = 0.94). Several correction methods for height and dis-placement errors are proposed. It is shown that a simple approachalready gives a good correction. Semi-empirical correction models,which can be calibrated for forest structure, perform even better.
Index Terms—Airborne radar, INDREX Campaign, SAR inter-ferometry, tropical forest.
I. INTRODUCTION
T O ENFORCE national legislation for sustainable forestmanagement or to verify implementation of guidelines for
sustainable forest management as proposed by the InternationalTropical Timber Organization (ITTO), information on terrain,forest, and tree characteristics is needed. Among others, systemsshould be available to monitor logging activities and to detectillegal logging, allowing timely action tobe taken.Becausecloudcover severely limits the application of aerial photography [5],theuseofairborne radar isproposedasanappropriatealternative.
To study the potential of radar the Indonesian Radar Ex-periment (INDREX) campaign was executed in Indonesia in1996 under the auspices of the Indonesian Ministry of Forestry(MOF) and the European Space Agency (ESA), Noordwijk,the Netherlands. The Dornier synthetic aperture radar (SAR)system [4] collected data in several modi over Dipterocarprain forest test sites in the provinces of East Kalimantan andJambi. In the same period, aerial photographs were acquiredand ground observations were made. In this paper, resultsof high-resolution (1.5 m) C-band interferometric SAR dataof two of the East Kalimantan test sites (sites A and C) arediscussed. These particular test sites include the Wanarisetresearch forest, the ITTO plot for forest rehabilitation, and theITCI concession [2].
Manuscript received January 19, 1999; revised August 28, 2000.The authors are with the Department of Environmental Sciences, Wageningen
University, Wageningen, The Netherlands.Publisher Item Identifier S 0196-2892(01)02092-7.
Fig. 1. Lay-over in tropical rain forest. The antenna positions are numberedas 1 and 2 and are separated by the baseline distanceB. A local coordinatesystem (�; �) has been defined with the origin halfway to the line connectingtwo effective scattering layers. The thickness of the upper and lower effectivescattering layers are indicated by� and� .� is the distance between theselayers.
Parameters such as tree position, tree crown dimensions,canopy cover and terrain slope angle, and the location of skidtrails and logging roads are of particular interest. In principle,such information can be retrieved on a routine basis overlarge areas from aerial photographs. Repetitive observationwould allow assessment of logging intensity, erosion and firesusceptibility, verification of reforestation obligations, etc.However, cloud cover too often prevents timely observation.
Radar does not have this limitation. Moreover, images ofshort-wave high-resolution radar, in principle may give suffi-cient information. Since other physical mechanisms underlieradar imaging, radar images can not be treated in the same wayas aerial photographs. Notably, effects of radar shadow andlay-over should be handled with care. Lay-over, for example,occurs where two tree crowns with different heights are locatedat the same range distance (see also Fig. 1). In noninterfero-metric radar images, these two tree crowns will be imaged ontop of each other without being able to detect such a situation.In interferometric images, this situation can be detected throughthe measurement of phase coherence. In tropical forests, heightdifferences between individual trees can be substantial and arecommon. Emergent trees in primary and logged-over forestscan reach more than 10 m above other upper canopy trees.The same is true for secondary forest, which often comprisesremnants of the former primary forest.
In theory, the problem of lay-over may be solved to a largeextent by making use of the observed interferometric phase co-
0196–2892/01$10.00 © 2001 IEEE
HOEKMAN AND VAREKAMP: OBSERVATION OF TROPICAL RAIN FOREST TREES 585
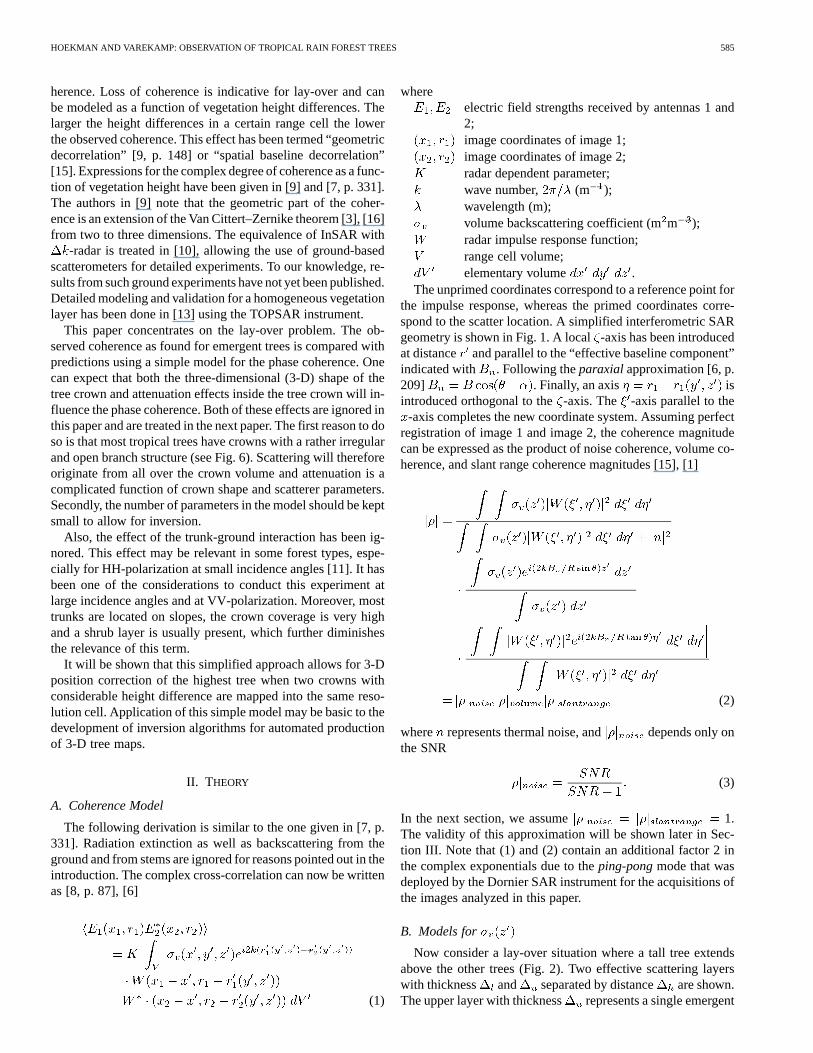
herence. Loss of coherence is indicative for lay-over and canbe modeled as a function of vegetation height differences. Thelarger the height differences in a certain range cell the lowerthe observed coherence. This effect has been termed “geometricdecorrelation” [9, p. 148] or “spatial baseline decorrelation”[15]. Expressions for the complex degree of coherence as a func-tion of vegetation height have been given in [9] and [7, p. 331].The authors in [9] note that the geometric part of the coher-ence is an extension of the Van Cittert–Zernike theorem [3], [16]from two to three dimensions. The equivalence of InSAR with
-radar is treated in [10], allowing the use of ground-basedscatterometers for detailed experiments. To our knowledge, re-sults from such ground experiments have not yet been published.Detailed modeling and validation for a homogeneous vegetationlayer has been done in [13] using the TOPSAR instrument.
This paper concentrates on the lay-over problem. The ob-served coherence as found for emergent trees is compared withpredictions using a simple model for the phase coherence. Onecan expect that both the three-dimensional (3-D) shape of thetree crown and attenuation effects inside the tree crown will in-fluence the phase coherence. Both of these effects are ignored inthis paper and are treated in the next paper. The first reason to doso is that most tropical trees have crowns with a rather irregularand open branch structure (see Fig. 6). Scattering will thereforeoriginate from all over the crown volume and attenuation is acomplicated function of crown shape and scatterer parameters.Secondly, the number of parameters in the model should be keptsmall to allow for inversion.
Also, the effect of the trunk-ground interaction has been ig-nored. This effect may be relevant in some forest types, espe-cially for HH-polarization at small incidence angles [11]. It hasbeen one of the considerations to conduct this experiment atlarge incidence angles and at VV-polarization. Moreover, mosttrunks are located on slopes, the crown coverage is very highand a shrub layer is usually present, which further diminishesthe relevance of this term.
It will be shown that this simplified approach allows for 3-Dposition correction of the highest tree when two crowns withconsiderable height difference are mapped into the same reso-lution cell. Application of this simple model may be basic to thedevelopment of inversion algorithms for automated productionof 3-D tree maps.
II. THEORY
A. Coherence Model
The following derivation is similar to the one given in [7, p.331]. Radiation extinction as well as backscattering from theground and from stems are ignored for reasons pointed out in theintroduction. The complex cross-correlation can now be writtenas [8, p. 87], [6]
(1)
whereelectric field strengths received by antennas 1 and2;image coordinates of image 1;image coordinates of image 2;radar dependent parameter;wave number, (m );wavelength (m);volume backscattering coefficient (mm );radar impulse response function;range cell volume;elementary volume .
The unprimed coordinates correspond to a reference point forthe impulse response, whereas the primed coordinates corre-spond to the scatter location. A simplified interferometric SARgeometry is shown in Fig. 1. A local-axis has been introducedat distance and parallel to the “effective baseline component”indicated with . Following theparaxialapproximation [6, p.209] . Finally, an axis isintroduced orthogonal to the-axis. The -axis parallel to the
-axis completes the new coordinate system. Assuming perfectregistration of image 1 and image 2, the coherence magnitudecan be expressed as the product of noise coherence, volume co-herence, and slant range coherence magnitudes [15], [1]
(2)
where represents thermal noise, and depends only onthe SNR
(3)
In the next section, we assume 1.The validity of this approximation will be shown later in Sec-tion III. Note that (1) and (2) contain an additional factor 2 inthe complex exponentials due to theping-pongmode that wasdeployed by the Dornier SAR instrument for the acquisitions ofthe images analyzed in this paper.
B. Models for
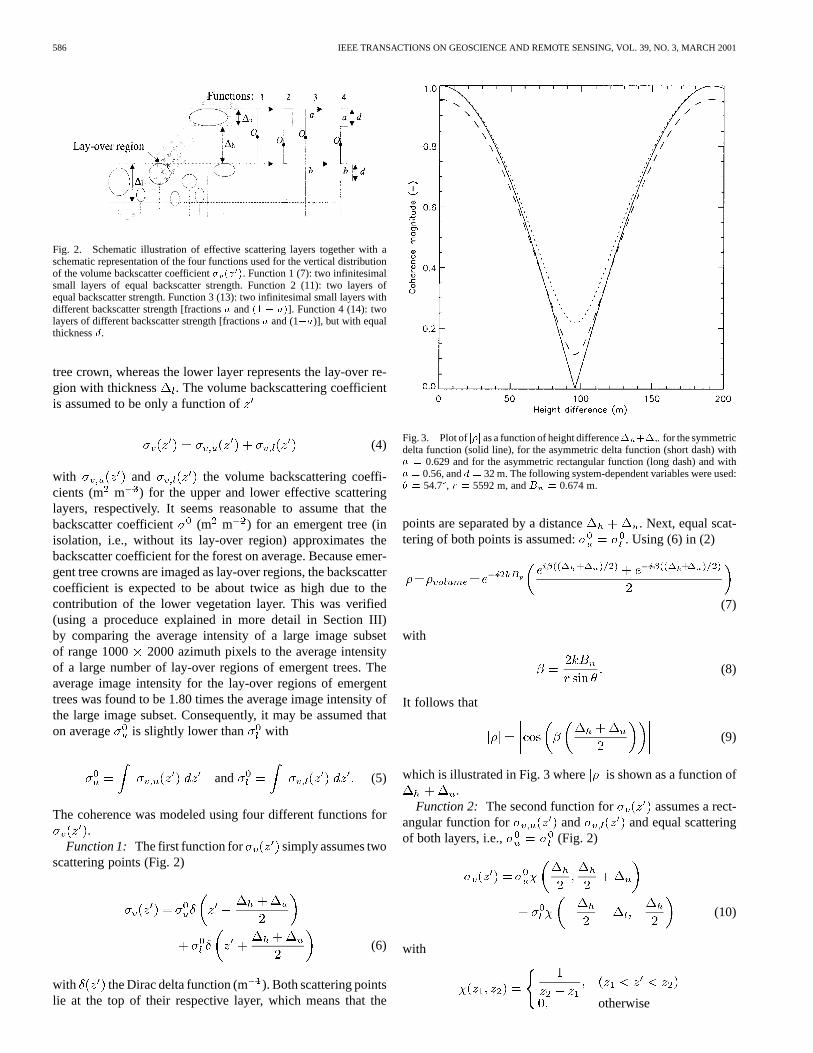
Now consider a lay-over situation where a tall tree extendsabove the other trees (Fig. 2). Two effective scattering layerswith thickness and separated by distance are shown.The upper layer with thickness represents a single emergent
586 IEEE TRANSACTIONS ON GEOSCIENCE AND REMOTE SENSING, VOL. 39, NO. 3, MARCH 2001
Fig. 2. Schematic illustration of effective scattering layers together with aschematic representation of the four functions used for the vertical distributionof the volume backscatter coefficient� (z ). Function 1 (7): two infinitesimalsmall layers of equal backscatter strength. Function 2 (11): two layers ofequal backscatter strength. Function 3 (13): two infinitesimal small layers withdifferent backscatter strength [fractionsa and(1 � a)]. Function 4 (14): twolayers of different backscatter strength [fractionsa and (1�a)], but with equalthicknessd.
tree crown, whereas the lower layer represents the lay-over re-gion with thickness . The volume backscattering coefficientis assumed to be only a function of
(4)
with and the volume backscattering coeffi-cients (m m ) for the upper and lower effective scatteringlayers, respectively. It seems reasonable to assume that thebackscatter coefficient (m m ) for an emergent tree (inisolation, i.e., without its lay-over region) approximates thebackscatter coefficient for the forest on average. Because emer-gent tree crowns are imaged as lay-over regions, the backscattercoefficient is expected to be about twice as high due to thecontribution of the lower vegetation layer. This was verified(using a proceduce explained in more detail in Section III)by comparing the average intensity of a large image subsetof range 1000 2000 azimuth pixels to the average intensityof a large number of lay-over regions of emergent trees. Theaverage image intensity for the lay-over regions of emergenttrees was found to be 1.80 times the average image intensity ofthe large image subset. Consequently, it may be assumed thaton average is slightly lower than with
and (5)
The coherence was modeled using four different functions for.
Function 1: The first function for simply assumes twoscattering points (Fig. 2)
(6)
with the Dirac delta function (m ). Both scattering pointslie at the top of their respective layer, which means that the
Fig. 3. Plot ofj�j as a function of height difference� +� for the symmetricdelta function (solid line), for the asymmetric delta function (short dash) witha = 0.629 and for the asymmetric rectangular function (long dash) and witha = 0.56, andd = 32 m. The following system-dependent variables were used:� = 54.7�, r = 5592 m, andB = 0.674 m.
points are separated by a distance . Next, equal scat-tering of both points is assumed: . Using (6) in (2)
(7)
with
(8)
It follows that
(9)
which is illustrated in Fig. 3 where is shown as a function of.
Function 2: The second function for assumes a rect-angular function for and and equal scatteringof both layers, i.e., (Fig. 2)
(10)
with
otherwise

HOEKMAN AND VAREKAMP: OBSERVATION OF TROPICAL RAIN FOREST TREES 587
with and the start and end of the rectangle, respectively.And follows as
(11)
Functions 3 and 4:As a more general case, it can be assumedthat the backscatter of the upper layer differs from the lowerlayer. When the fractions and are introduced as (also seeFig. 2)
and (12)
then (7) and (11) can be rewritten, respectively, as
(13)and
(14)
In the following, these coherence models will be referred toas: the symmetric delta function (7), the symmetric rectangularfunction (11), the asymmetric delta function (13), and the asym-metric rectangular function (14).
C. Bias of Emergent Tree Crown Position Reconstruction
In the very simple case of the symmetric delta function for, the coherence magnitude is the absolute value of a co-
sine function of the height difference between the top of theemergent tree and the top of the canopy in the lay-over region[(9) and Fig. 3]. The solution to (9) is unique when
(15)
For the system parameters mentioned in the caption of Fig. 3,the corresponding height difference range is 094.8 m. Under the assumption that the position of the scatteringphase centre is halfway the true position of the tree top and thetrue position of its lay-over region, for this specific range ofheight differences, the observed crown coordinates () can becorrected using (9) as
(16)
(17)
In case these correction equations are applied, while the forestlayers in reality are asymmetric, i.e., , a bias in the po-sition reconstruction of the emergent tree results. This bias iscaused by a shift of the scattering phase centre in the directionof the layer with highest backscatter and a lower reconstruction(or correction) shift toward the upper layer (sinceis smaller).
Fig. 4. Bias as a function of the asymmetry parametera for three cases. (a)The layers are described by an asymmetric delta function with a spacing� =
20 m and no correction is applied (lower solid line). (b) The layers are describedby an asymmetric delta function with a spacing� = 20 m, and a correctionis applied assuming a symmetric delta function is valid (upper solid line). (c)The layers are described by an asymmetric rectangular shape with a spacing� = 15 m and layer thicknesses� = � = 5 m, and a correction is appliedassuming a symmetric delta function is valid (dotted line).
TABLE IDORNIER SAR SENSOR ANDIMAGE PARAMETERS FORTRACKS Kal.17A,
Kal.18A, AND Kal.19COF THE INDREX 1996 CAMPAIGN
This bias is graphically depicted in Fig. 4 for both the asym-metric delta function (13) and for the asymmetric rectangularfunction (14) with as the asymmetry parameter. Obviously,under the assumption the forest layers can be modeled by thesymmetric delta function (7), the correction equations (16) and(17) perform well in case there is no lay-over ( 1), and incases where there is a lay-over and the backscatter of the upperand lower layers are equal ( 0.5). In the latter case a large
588 IEEE TRANSACTIONS ON GEOSCIENCE AND REMOTE SENSING, VOL. 39, NO. 3, MARCH 2001
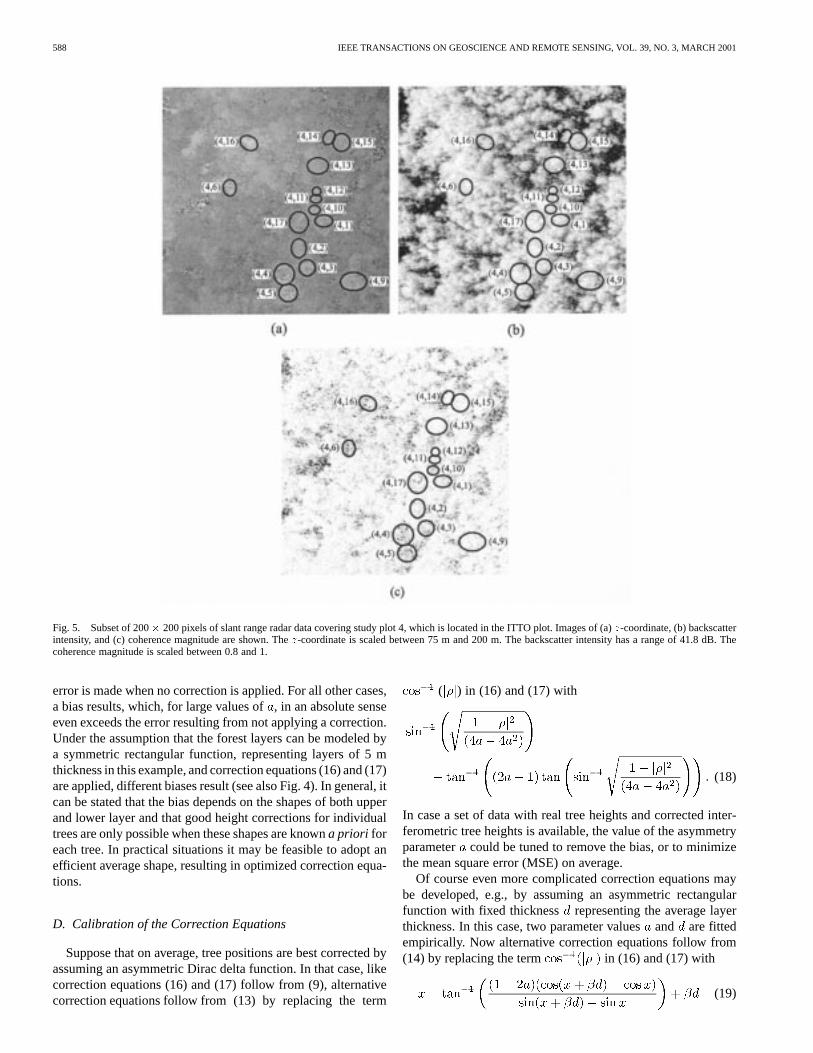
Fig. 5. Subset of 200� 200 pixels of slant range radar data covering study plot 4, which is located in the ITTO plot. Images of (a)z-coordinate, (b) backscatterintensity, and (c) coherence magnitude are shown. Thez-coordinate is scaled between 75 m and 200 m. The backscatter intensity has a range of 41.8 dB. Thecoherence magnitude is scaled between 0.8 and 1.
error is made when no correction is applied. For all other cases,a bias results, which, for large values of, in an absolute senseeven exceeds the error resulting from not applying a correction.Under the assumption that the forest layers can be modeled bya symmetric rectangular function, representing layers of 5 mthickness in this example, and correction equations (16) and (17)are applied, different biases result (see also Fig. 4). In general, itcan be stated that the bias depends on the shapes of both upperand lower layer and that good height corrections for individualtrees are only possible when these shapes are knowna priori foreach tree. In practical situations it may be feasible to adopt anefficient average shape, resulting in optimized correction equa-tions.
D. Calibration of the Correction Equations
Suppose that on average, tree positions are best corrected byassuming an asymmetric Dirac delta function. In that case, likecorrection equations (16) and (17) follow from (9), alternativecorrection equations follow from (13) by replacing the term
( ) in (16) and (17) with
(18)
In case a set of data with real tree heights and corrected inter-ferometric tree heights is available, the value of the asymmetryparameter could be tuned to remove the bias, or to minimizethe mean square error (MSE) on average.
Of course even more complicated correction equations maybe developed, e.g., by assuming an asymmetric rectangularfunction with fixed thickness representing the average layerthickness. In this case, two parameter valuesand are fittedempirically. Now alternative correction equations follow from(14) by replacing the term in (16) and (17) with
(19)
HOEKMAN AND VAREKAMP: OBSERVATION OF TROPICAL RAIN FOREST TREES 589
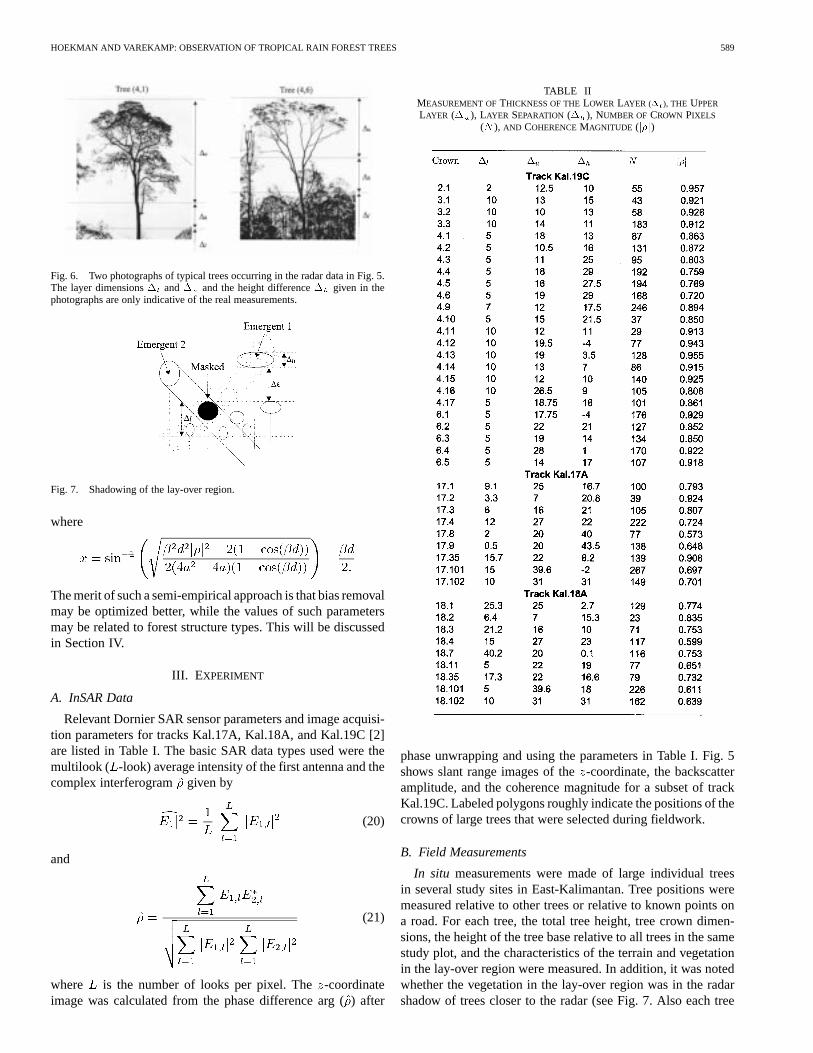
Fig. 6. Two photographs of typical trees occurring in the radar data in Fig. 5.The layer dimensions� and� and the height difference� given in thephotographs are only indicative of the real measurements.
Fig. 7. Shadowing of the lay-over region.
where
The merit of such a semi-empirical approach is that bias removalmay be optimized better, while the values of such parametersmay be related to forest structure types. This will be discussedin Section IV.
III. EXPERIMENT
A. InSAR Data
Relevant Dornier SAR sensor parameters and image acquisi-tion parameters for tracks Kal.17A, Kal.18A, and Kal.19C [2]are listed in Table I. The basic SAR data types used were themultilook ( -look) average intensity of the first antenna and thecomplex interferogram given by
(20)
and
(21)
where is the number of looks per pixel. The-coordinateimage was calculated from the phase difference arg () after
TABLE IIMEASUREMENT OFTHICKNESS OF THELOWER LAYER (� ), THE UPPER
LAYER (� ), LAYER SEPARATION (� ), NUMBER OF CROWN PIXELS
(N ), AND COHERENCEMAGNITUDE (j�j)
phase unwrapping and using the parameters in Table I. Fig. 5shows slant range images of the-coordinate, the backscatteramplitude, and the coherence magnitude for a subset of trackKal.19C. Labeled polygons roughly indicate the positions of thecrowns of large trees that were selected during fieldwork.
B. Field Measurements
In situ measurements were made of large individual treesin several study sites in East-Kalimantan. Tree positions weremeasured relative to other trees or relative to known points ona road. For each tree, the total tree height, tree crown dimen-sions, the height of the tree base relative to all trees in the samestudy plot, and the characteristics of the terrain and vegetationin the lay-over region were measured. In addition, it was notedwhether the vegetation in the lay-over region was in the radarshadow of trees closer to the radar (see Fig. 7. Also each tree
590 IEEE TRANSACTIONS ON GEOSCIENCE AND REMOTE SENSING, VOL. 39, NO. 3, MARCH 2001
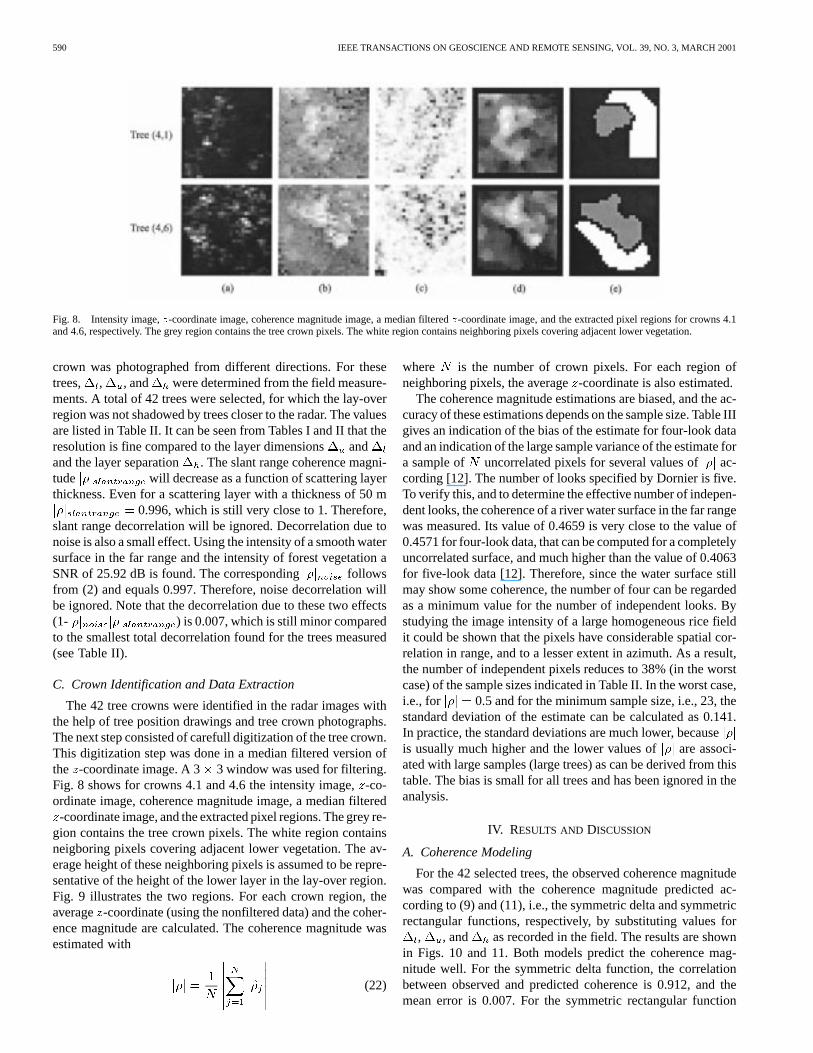
Fig. 8. Intensity image,z-coordinate image, coherence magnitude image, a median filteredz-coordinate image, and the extracted pixel regions for crowns 4.1and 4.6, respectively. The grey region contains the tree crown pixels. The white region contains neighboring pixels covering adjacent lower vegetation.
crown was photographed from different directions. For thesetrees, , , and were determined from the field measure-ments. A total of 42 trees were selected, for which the lay-overregion was not shadowed by trees closer to the radar. The valuesare listed in Table II. It can be seen from Tables I and II that theresolution is fine compared to the layer dimensionsandand the layer separation . The slant range coherence magni-tude will decrease as a function of scattering layerthickness. Even for a scattering layer with a thickness of 50 m
0.996, which is still very close to 1. Therefore,slant range decorrelation will be ignored. Decorrelation due tonoise is also a small effect. Using the intensity of a smooth watersurface in the far range and the intensity of forest vegetation aSNR of 25.92 dB is found. The corresponding followsfrom (2) and equals 0.997. Therefore, noise decorrelation willbe ignored. Note that the decorrelation due to these two effects(1- ) is 0.007, which is still minor comparedto the smallest total decorrelation found for the trees measured(see Table II).
C. Crown Identification and Data Extraction
The 42 tree crowns were identified in the radar images withthe help of tree position drawings and tree crown photographs.The next step consisted of carefull digitization of the tree crown.This digitization step was done in a median filtered version ofthe -coordinate image. A 3 3 window was used for filtering.Fig. 8 shows for crowns 4.1 and 4.6 the intensity image,-co-ordinate image, coherence magnitude image, a median filtered-coordinate image, and the extracted pixel regions. The grey re-
gion contains the tree crown pixels. The white region containsneigboring pixels covering adjacent lower vegetation. The av-erage height of these neighboring pixels is assumed to be repre-sentative of the height of the lower layer in the lay-over region.Fig. 9 illustrates the two regions. For each crown region, theaverage -coordinate (using the nonfiltered data) and the coher-ence magnitude are calculated. The coherence magnitude wasestimated with
(22)
where is the number of crown pixels. For each region ofneighboring pixels, the average-coordinate is also estimated.
The coherence magnitude estimations are biased, and the ac-curacy of these estimations depends on the sample size. Table IIIgives an indication of the bias of the estimate for four-look dataand an indication of the large sample variance of the estimate fora sample of uncorrelated pixels for several values of ac-cording [12]. The number of looks specified by Dornier is five.To verify this, and to determine the effective number of indepen-dent looks, the coherence of a river water surface in the far rangewas measured. Its value of 0.4659 is very close to the value of0.4571 for four-look data, that can be computed for a completelyuncorrelated surface, and much higher than the value of 0.4063for five-look data [12]. Therefore, since the water surface stillmay show some coherence, the number of four can be regardedas a minimum value for the number of independent looks. Bystudying the image intensity of a large homogeneous rice fieldit could be shown that the pixels have considerable spatial cor-relation in range, and to a lesser extent in azimuth. As a result,the number of independent pixels reduces to 38% (in the worstcase) of the sample sizes indicated in Table II. In the worst case,i.e., for 0.5 and for the minimum sample size, i.e., 23, thestandard deviation of the estimate can be calculated as 0.141.In practice, the standard deviations are much lower, becauseis usually much higher and the lower values of are associ-ated with large samples (large trees) as can be derived from thistable. The bias is small for all trees and has been ignored in theanalysis.
IV. RESULTS AND DISCUSSION
A. Coherence Modeling
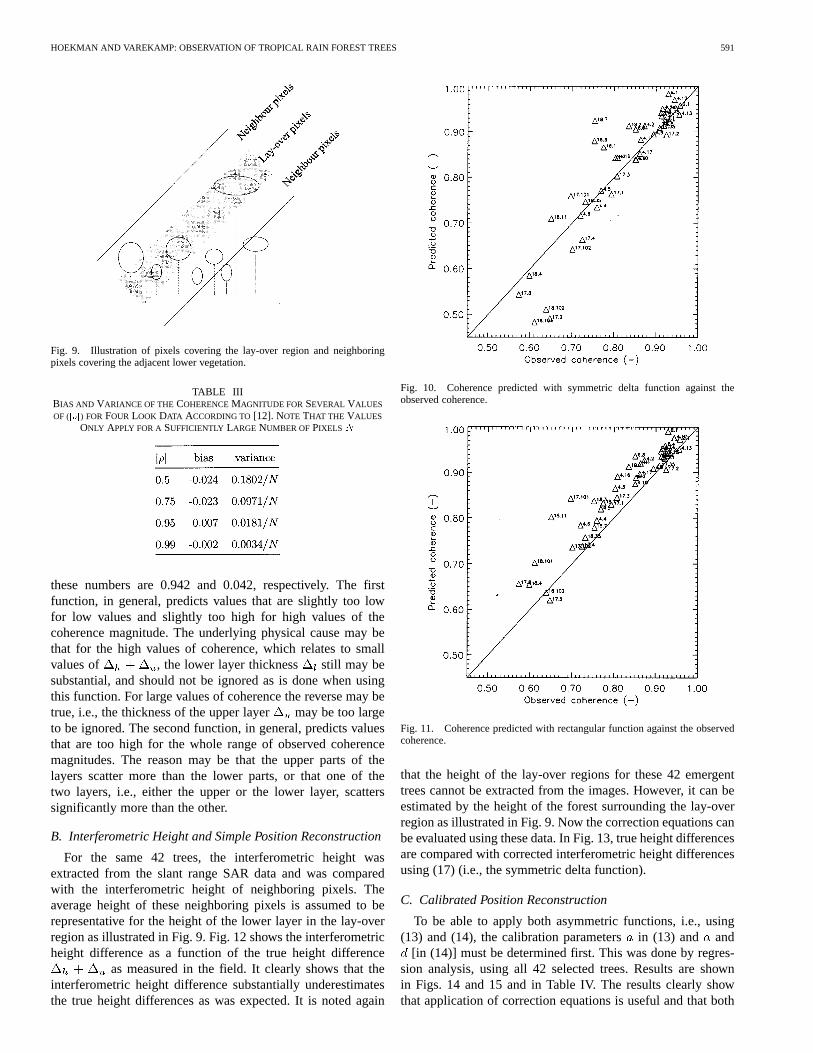
For the 42 selected trees, the observed coherence magnitudewas compared with the coherence magnitude predicted ac-cording to (9) and (11), i.e., the symmetric delta and symmetricrectangular functions, respectively, by substituting values for
, , and as recorded in the field. The results are shownin Figs. 10 and 11. Both models predict the coherence mag-nitude well. For the symmetric delta function, the correlationbetween observed and predicted coherence is 0.912, and themean error is 0.007. For the symmetric rectangular function
HOEKMAN AND VAREKAMP: OBSERVATION OF TROPICAL RAIN FOREST TREES 591
Fig. 9. Illustration of pixels covering the lay-over region and neighboringpixels covering the adjacent lower vegetation.
TABLE IIIBIAS AND VARIANCE OF THE COHERENCEMAGNITUDE FOR SEVERAL VALUES
OF (j�j) FOR FOUR LOOK DATA ACCORDING TO[12]. NOTE THAT THE VALUES
ONLY APPLY FOR ASUFFICIENTLY LARGE NUMBER OF PIXELS N
these numbers are 0.942 and 0.042, respectively. The firstfunction, in general, predicts values that are slightly too lowfor low values and slightly too high for high values of thecoherence magnitude. The underlying physical cause may bethat for the high values of coherence, which relates to smallvalues of , the lower layer thickness still may besubstantial, and should not be ignored as is done when usingthis function. For large values of coherence the reverse may betrue, i.e., the thickness of the upper layer may be too largeto be ignored. The second function, in general, predicts valuesthat are too high for the whole range of observed coherencemagnitudes. The reason may be that the upper parts of thelayers scatter more than the lower parts, or that one of thetwo layers, i.e., either the upper or the lower layer, scatterssignificantly more than the other.
B. Interferometric Height and Simple Position Reconstruction
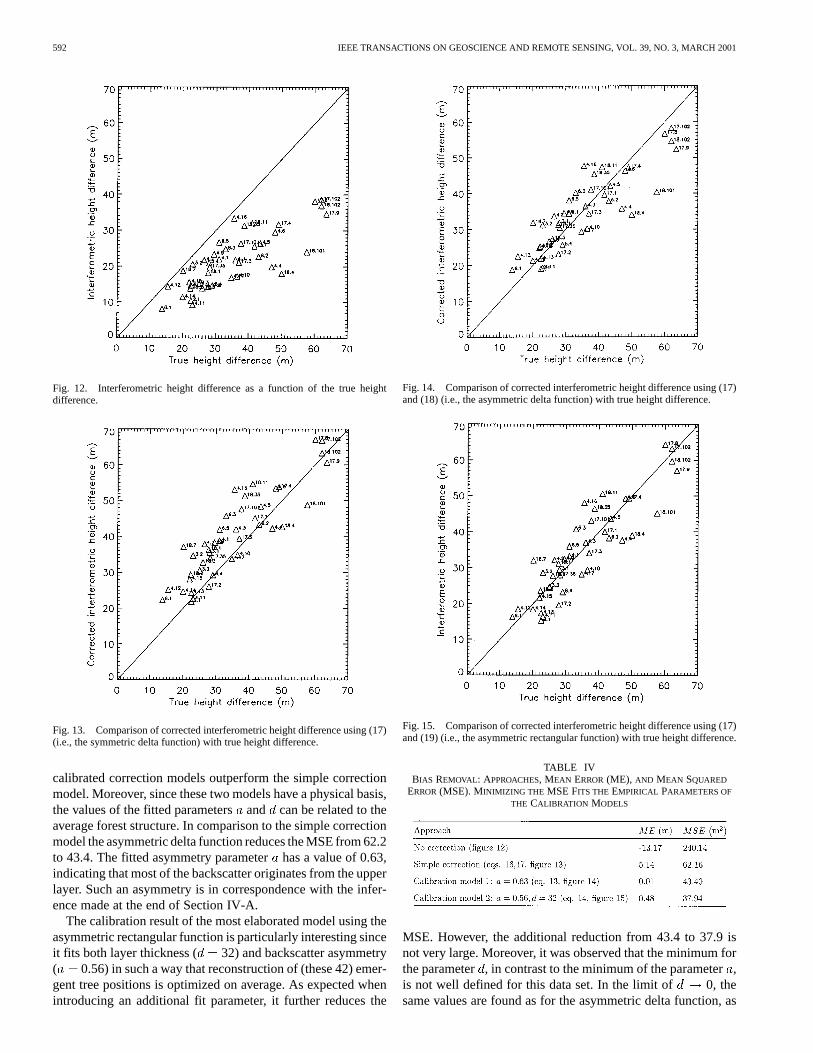
For the same 42 trees, the interferometric height wasextracted from the slant range SAR data and was comparedwith the interferometric height of neighboring pixels. Theaverage height of these neighboring pixels is assumed to berepresentative for the height of the lower layer in the lay-overregion as illustrated in Fig. 9. Fig. 12 shows the interferometricheight difference as a function of the true height difference
as measured in the field. It clearly shows that theinterferometric height difference substantially underestimatesthe true height differences as was expected. It is noted again
Fig. 10. Coherence predicted with symmetric delta function against theobserved coherence.
Fig. 11. Coherence predicted with rectangular function against the observedcoherence.
that the height of the lay-over regions for these 42 emergenttrees cannot be extracted from the images. However, it can beestimated by the height of the forest surrounding the lay-overregion as illustrated in Fig. 9. Now the correction equations canbe evaluated using these data. In Fig. 13, true height differencesare compared with corrected interferometric height differencesusing (17) (i.e., the symmetric delta function).
C. Calibrated Position Reconstruction
To be able to apply both asymmetric functions, i.e., using(13) and (14), the calibration parametersin (13) and and
[in (14)] must be determined first. This was done by regres-sion analysis, using all 42 selected trees. Results are shownin Figs. 14 and 15 and in Table IV. The results clearly showthat application of correction equations is useful and that both
592 IEEE TRANSACTIONS ON GEOSCIENCE AND REMOTE SENSING, VOL. 39, NO. 3, MARCH 2001
Fig. 12. Interferometric height difference as a function of the true heightdifference.
Fig. 13. Comparison of corrected interferometric height difference using (17)(i.e., the symmetric delta function) with true height difference.
calibrated correction models outperform the simple correctionmodel. Moreover, since these two models have a physical basis,the values of the fitted parametersand can be related to theaverage forest structure. In comparison to the simple correctionmodel the asymmetric delta function reduces the MSE from 62.2to 43.4. The fitted asymmetry parameterhas a value of 0.63,indicating that most of the backscatter originates from the upperlayer. Such an asymmetry is in correspondence with the infer-ence made at the end of Section IV-A.
The calibration result of the most elaborated model using theasymmetric rectangular function is particularly interesting sinceit fits both layer thickness ( 32) and backscatter asymmetry( 0.56) in such a way that reconstruction of (these 42) emer-gent tree positions is optimized on average. As expected whenintroducing an additional fit parameter, it further reduces the
Fig. 14. Comparison of corrected interferometric height difference using (17)and (18) (i.e., the asymmetric delta function) with true height difference.
Fig. 15. Comparison of corrected interferometric height difference using (17)and (19) (i.e., the asymmetric rectangular function) with true height difference.
TABLE IVBIAS REMOVAL: APPROACHES, MEAN ERROR(ME), AND MEAN SQUARED
ERROR(MSE). MINIMIZING THE MSE FITS THE EMPIRICAL PARAMETERS OF
THE CALIBRATION MODELS
MSE. However, the additional reduction from 43.4 to 37.9 isnot very large. Moreover, it was observed that the minimum forthe parameter, in contrast to the minimum of the parameter,is not well defined for this data set. In the limit of 0, thesame values are found as for the asymmetric delta function, as
HOEKMAN AND VAREKAMP: OBSERVATION OF TROPICAL RAIN FOREST TREES 593
expected. When is increased, the values forand MSE bothdecrease gently. For , the optimum value of is 0.61 andthe MSE is 42.4; for 10, 0.60 and MSE 41.7; for
20, 0.59 and MSE 40.1; for 32, 0.56 andMSE 37.9 (the minimum); and for 33, 0.56 andMSE 38.1. It is noted that for values ofin excess of 33 (19)gives no valid solution anymore for the tree with the highest co-herence magnitude. It may be concluded that the forest layeringcan not be described well with effective mean layer dimensions.As can also be inferred from Table II, both the thickness of upperand lower layer vary widely. Hence, to describe the complicatedstructure of tropical rain forest in this way may be an oversim-plification, not resulting in major additional corrections of treecrown positions.
V. CONCLUSIONS
The results show that coherence magnitudes of emergent treescan be predicted well on the basis of field observations and theuse of simple models for the vertical distribution of backscatterintensity. It is also shown that in interferometric images, largeheight and displacement errors can occur for individual emer-gent trees and that these errors can be corrected using thesesimple models. It is shown that a representation in which allbackscatter is assumed to be originating from horizontal planeslocated at the top of the emergent tree and at the top of itslay-over region already gives a fairly good result. Further ex-tension to horizontal layers improves the coherence magnitudemodeling for individual trees. However, is seems difficult to findan effective mean layer thickness, which can be used to improvecorrection for height and displacement errors. Apparently, thestructure of the tropical rain forest at the studied site is too com-plex to make this meaningful.
Though the application of correction models is useful sincethey give a major reduction of the MSE, the MSE value itselfshould be interpreted with care. The correction applied is a cor-rection based on the observed coherence magnitude of the emer-gent crown and its lay-over region. The (relative) interferometricheight of the tree can only be measured relative to the (rela-tive) interferometric height of its surroundings. Since the heightof the surroundings of the lay-over region may differ from theheight of the lay-over region, an additional independent erroris introduced. In other words, the expected accuracy of heightcorrection may be larger than the value of the MSE indicates.On the other hand, it should be noted that the best correctionmethods are based on calibrations for which the same trees areused. Moreover, such a calibration is forest structure depen-dent and may not give optimal results when applied in otherforest types. However, from a physical point of view, it is inter-esting to study the values of the parameters fitted for the calibra-tion models since they reveal properties of the forest structure.For the set of 42 trees studied, for example, it could be con-cluded that slightly more backscatter originates from the emer-gent crown as compared to its lay-over region and that the con-cept of effective mean layers is hardly meaningful.
The results indicated in this paper may be very useful for thedevelopment of algorithms for automated tree map production
[14]. Further physical modeling and tree mapping developmentsare planned using data of a fully inventoried 7.2 ha plot, forwhich additional X-band data and additional C-band data witha different look direction exist. The large time elapsed betweenINDREX radar data collection and the various field observationperiods (up to three years now) poses some interpretation prob-lems. For this reason, a new campaign in Kalimantan is underconsideration.
ACKNOWLEDGMENT
The authors wish to thank the Ministry of Forestry and estateCrops (MOFEC) (formerly MOF), Jakarta, Indonesia, and theEuropean Space Agency, Noordwijk, The Netherlands (ESA),for realization of the INDREX campaign, Dornier Satelliten-systeme GmbH, Friedrichshaten, Germany, for SAR data ac-quisition, and the MOFEC-Tropenbos Kalimantan Project forlogistic support. They would also like to thank the Dutch Re-mote Sensing Board, and M. Vissers, A. de Jong, and E. vanValkengoed for assistance and ideas. Finally, they wish to thankthe anonymous reviewers for their valuable suggestions.
REFERENCES
[1] J. I. H. Askne, P. B. G. Dammert, L. M. H. Ulander, and G. Smith,“C-band repeat-pass interferometric SAR observation of the forest,”IEEE Trans. Geosci. Remote Sensing, vol. 35, pp. 25–35, Jan. 1997.
[2] “Tech. Rep., Indonesian Radar Experiment 1996, Final Version,” Eur.Space Agency (ESA)-ESTEC, Noordwijk, The Netherlands, June 1996.
[3] P. H. Van Cittert, “Kohaerenz-probleme,”Physica, vol. 6, no. 10, pp.1129–1139, 1939.
[4] N. P. Faller and E. H. Meier, “First results with the airborne single-passDO-SAR interferometer,”IEEE Trans. Geosci. Remote Sensing, vol. 33,pp. 1230–1237, Sept. 1995.
[5] J. P. Gastellu-Etchegorry, “Cloud cover distribution in Indonesia,”Int.J. Remote Sensing, vol. 9, no. 7, pp. 1267–1276, 1988.
[6] J. Goodman,Statistical Optics. New York: Wiley, 1985.[7] J. O. Hagberg, L. M. H. Ulander, and J. Askne, “Repeat-pass SAR inter-
ferometery over forested terrain,”IEEE Trans. Geosci. Remote Sensing,vol. 33, pp. 331–340, Mar. 1995.
[8] A. Ishimaru, Wave Propagation and Scattering in RandomMedia. New York: Academic, 1978, vol. 1.
[9] E. Rodriguez and J. M. Martin, “Theory and design of interferometricsynthetic aperture radars,”Proc. Inst. Elect. Eng. F, vol. 139, no. 2, pp.147–159, 1992.
[10] K. Sarabandi, “�k-Radar equivalent of interferometric SAR’s: Atheoretical study for determination of vegetation height,”IEEE Trans.Geosci. Remote Sensing, vol. 35, pp. 1267–1276, Sept. 1997.
[11] K. Sarabandi and Y. C. Lin, “Simulation of interferometric SAR re-sponse to deciduous and configerous forest stands,” inProc. Int. Geo-science and Remote Sensing Symp.’97, Singapore, Aug. 3–8, 1997, pp.1887–1889.
[12] R. Touzi, A. Lopes, J. Bruniquel, and P. W. Vachon, “Coherence estima-tion for SAR imagery,”IEEE Trans. Geosci. Remote Sensing, vol. 37,pp. 135–149, Jan. 1999.
[13] R. N. Treuhaft, S. N. Madsen, M. Moghaddam, and J. J. Van Zyl, “Veg-etation characteristics and underlying topography from interferometricradar,”Radio Sci., vol. 31, no. 6, pp. 1449–1485, 1996.
[14] C. Varekamp and D. H. Hoekman, “Interferometric phase differencesegmentation using parameterized deformable templates,” in5th Annu.Conf. Advanced School for Computing and Imaging, Heijen, TheNetherlands, June 15–17, 1999.
[15] H. A. Zebker and J. Villasenor, “Decorrelation in interferometric radarechoes,”IEEE Trans. Geosci. Remote Sensing, vol. 30, pp. 950–959,Sept. 1992.
[16] F. Zernike, “The concept of degree of coherence and its applications tooptical problems,”Physica, vol. 5, pp. 785–795, 1938.

594 IEEE TRANSACTIONS ON GEOSCIENCE AND REMOTE SENSING, VOL. 39, NO. 3, MARCH 2001
Dirk H. Hoekman received the M.Sc. degreein electrical engineering from the Departmentof Electrical Engineering, Delft University ofTechnology, Delft, The Netherlands, in 1981 andthe Ph.D. degree from the Wageningen AgriculturalUniversity, Wageningen, The Netherlands, in 1990.
He has been with the Wageningen AgriculturalUniversity since 1981, where he currently holds theposition of Associate Professor in remote sensingwith main interests in the physical aspects of remotesensing, microwave remote sensing, and applications
of remote sensing in forestry, agriculture, (agro-)hydrology, climate studies,and environmental change. He was involved in several international projectsand radar data acquisition campaigns. He was Coordinator for the ESA/INPEAmazonian Expedition, 1986, the Scienctific Coordinator for the ESA/JRCAGRISCATT Campaign from 1987 to 1989, Coordinating Investigator for theinternational test site Flevoland for the JRC/ESA MAESTRO-1 campaign from1989 to 1991, Coordinating Investigator for the tropical rain forest sites inColombia and Guyana, including ESA’s SAREX-92 Campaign from 1992 to1993 and NASA’s South American AIRSAR Deployment in 1993, EuropeanExpert in the EC-ASEAN ERS-1 Malaysian coastal zone management project,Investigator in ESA’s Windscatterometer study for land applications, ScientificCoordinator for the EC programme TREES’94 ERS-1, and Investigator forClimate Studies within EFEDA-Spain in 1992, HAPEX-Sahel in 1993, andNOPEX Sweden from 1994 to 1995. He is currently coordinating research andtraining programmes for Indonesia to support the realization of an operationalmonitoring system for sustainable forest management. He is Coordinator forESA’s INDREX-96 and NASA’s PACRIM 2 campaign at test sites in Sumatraand Kalimantan.
Chris Varekamp received the M.Sc degree (cumlaude) from Wageningen University, Wageningen,The Netherlands, in 1995, where he is currentlypursuing the Ph.D. degree on high resolution SARinterferometry for tree map retrieval.
His research interests are in microwave remotesensing and inverse problems in remote sensing.