Potassium-Induced Cortical Spreading Depressions During Focal Cerebral Ischemia in Rats:...
10
Journal Cerehral Blood FIolA' and aholism 16:1090-1099 © 1996 The International Society of Cerebral Blood Flow and Metabolism Published by Lippincott-Raven Publishers, Philadelphia Potassium-Induced Cortical Spreading Depressions During Focal Cerebral Ischemia in Rats: Contribution to Lesion Growth Assessed by Diffusion-Weighted NMR and Biochemical Imaging Elmar Busch, Michael L Gyngell, Manfred Eis, Mathias Hoehn-Berlage, and Konstantin-Alexander Hossmann Max-Planck-Institute for Neurological Research, Department of Experimental Neurology, Cologne, FR Germany Summary: In focal ischemia of rats, the volume of ischemic lesion correlates with the number of peri-infarct depolariza- tions, To test the hypothesis that depolarizations accelerate in- farct growth, we combined focal ischemia with externally evoked spreading depression (SD) waves, Ischemic brain in- farcts were produced in halothane-anaesthetized rats by intra- luminal thread occlusion of the middle cerebral artery (MCA), In one group of animals, repeated SDs were evoked at IS-min intervals by microinjections of potassium acetate into the on- tal cortex, In another group, the spread of the potassium-evoked depolarizations was prevented by application of the N-methyl- D-aspartate (NMDA) receptor antagonist dizocilpine (MK- 80 I), The volume of ischemic lesion was monitored for 2 h by diffusion-weighted imaging (DWI) and correlated with electro- physiological recordings and biochemical imaging techniques, In untreated rats, each microinjection produced an SD wave and a stepwise rise of the volume and signal intensity of the In focal cerebral ischemia of rat infarct size correlates with the number of peri-infarct spreading depression (SD)-like depolarizations (Mies et aI., 1993; Chen et aI., 1993). These depolarizations are generated in the border zone of the ischemic lesion and spread into the peri- infarct surrounding (Nedergaard and Hansen, 1993; Ne- dergaard and Astrup, 1986). Glutamate antagonists such as dizocilpine (MK-801) or 2,3-dihydroxy-6-nitro-7- Received January I L 1996; final received May 3. 1996; accepted May 29, 1996. Address correspondence. and reprint requests to Prof. Dr. K.-A. Hossmann, Max-Planck-Institut fUr neurologische Forschung. Gleuelerstrasse 50, D-50931 Kln, FR Germany. Abbreviations used: ADC, apparent diffusion coefficient; ANOY A. analysis of variance; DC, direct current; DWl, diffusion-weighted im- aging; MCA, middle carotid artery; MR, magnetic resonance; NBQX, 2,3-dihydroxy-6-nitro-7-sulfamoyl-benzo (F)-quinoxaline; NMDA, N- methyl-D-aspartate; RF, radiofrequency; ROI, region of interest; SD, spreading depression; TE. spin echo. 1090 DWI-visible cortical lesion, The volume of this lesion in- creased between IS min and 2 h of MCA occlusion from 19 ± 15% to 66 ± 16% of ipsilateral cortex, In dizocilpine-treated animals, microinjections of potassium did not evoke SDs, nor did the volume and signal intensity of the DWI-visible cortical lesion change, At 15 min after MCA occlusion, the DWI- visible lesion was larger than in untreated animals3 ± 16% of the ipsilateral cortex; however, after 2 h, it increased only slightly further to 49 ± 21 %. Slower lesion growth in the ab- sence of SDs was also reflected by the volume of ATP-depleted tissue, which, aſter 2 h of MCA occlusion, involved 26 ± 12% of the ipsilateral cortex in treated and 49 ± 9% in untreated animals < 0.(1). These observations support the hypothesis that peri-infarct depolarizations accelerate cerebral infarct growth. Key Words: Cortical spreading depression-Focal ce- rebral ischemia-Diffusion-weighted MRI-Rat-EEG-DC potential. sulfamoyl-benzo (F)-quinoxaline (NBQX) inhibit peri- infarct SD and reduce infarct size (Iijima et aI., 1992; Gill et aI., 1992; Mies et aI., 1994). It has, therefore, been suggested that reduction in infarct volume after applica- tion of glutamate receptor antagonists is due to the sup- pression of peri-infarct SD (Hossmann, 1994). However, correlation of infarct size with the number of peri-infarct SDs is not necessarily causal since big infarcts may gen- erate more depolarizations than smaller ones. To address this question, we looked at the evolution of brain infarcts by combining focal brain ischemia with microinjections of potassium acetate to produce externally-evoked SDs. For evaluation of infarct growth, we used diffusion- weighted magnetic resonance (MR) imaging (DWI). DWI has found wide application for acute studies of experimental stroke as it is able to detect the ischemic lesion within minutes after onset of circulatory impair- ment (Moseley et al., 1990). Recently, it has been dem-
Transcript of Potassium-Induced Cortical Spreading Depressions During Focal Cerebral Ischemia in Rats:...

Journal (�f Cerehral Blood FIolA.' and lvlt'faholism 16:1090-1099 © 1996 The International Society of Cerebral Blood Flow and Metabolism Published by Lippincott-Raven Publishers, Philadelphia
Potassium-Induced Cortical Spreading Depressions During Focal
Cerebral Ischemia in Rats: Contribution to Lesion Growth
Assessed by Diffusion-Weighted NMR and
Biochemical Imaging
Elmar Busch, Michael L Gyngell, Manfred Eis, Mathias Hoehn-Berlage, and Konstantin-Alexander Hossmann
Max-Planck-Institute for Neurological Research, Department of Experimental Neurology, Cologne, FR Germany
Summary: In focal ischemia of rats, the volume of ischemic lesion correlates with the number of peri-infarct depolarizations, To test the hypothesis that depolarizations accelerate infarct growth, we combined focal ischemia with externally evoked spreading depression (SD) waves, Ischemic brain infarcts were produced in halothane-anaesthetized rats by intraluminal thread occlusion of the middle cerebral artery (MCA), In one group of animals, repeated SDs were evoked at IS-min intervals by microinjections of potassium acetate into the frontal cortex, In another group, the spread of the potassium-evoked depolarizations was prevented by application of the N-methylD-aspartate (NMDA) receptor antagonist dizocilpine (MK-80 I), The volume of ischemic lesion was monitored for 2 h by diffusion-weighted imaging (DWI) and correlated with electrophysiological recordings and biochemical imaging techniques, In untreated rats, each microinjection produced an SD wave and a stepwise rise of the volume and signal intensity of the
In focal cerebral ischemia of rat infarct size correlates with the number of peri-infarct spreading depression (SD)-like depolarizations (Mies et aI., 1993; Chen et aI., 1993). These depolarizations are generated in the border zone of the ischemic lesion and spread into the periinfarct surrounding (Nedergaard and Hansen, 1993; Nedergaard and Astrup, 1986). Glutamate antagonists such as dizocilpine (MK-801) or 2,3-dihydroxy-6-nitro-7-
Received January I L 1996; final received May 3. 1996; accepted May 29, 1996.
Address correspondence. and reprint requests to Prof. Dr. K.-A. Hossmann, Max-Planck-Institut fUr neurologische Forschung. Gleuelerstrasse 50, D-50931 Kiiln, FR Germany.
Abbreviations used: ADC, apparent diffusion coefficient; ANOY A. analysis of variance; DC, direct current; DWl, diffusion-weighted imaging; MCA, middle carotid artery; MR, magnetic resonance; NBQX, 2,3-dihydroxy-6-nitro-7-sulfamoyl-benzo (F)-quinoxaline; NMDA, Nmethyl-D-aspartate; RF, radiofrequency; ROI, region of interest; SD, spreading depression; TE. spin echo.
1090
DWI-visible cortical lesion, The volume of this lesion increased between IS min and 2 h of MCA occlusion from 19 ± 15% to 66 ± 16% of ipsilateral cortex, In dizocilpine-treated animals, microinjections of potassium did not evoke SDs, nor did the volume and signal intensity of the DWI-visible cortical lesion change, At 15 min after MCA occlusion, the DWIvisible lesion was larger than in untreated animals-43 ± 16% of the ipsilateral cortex; however, after 2 h, it increased only slightly further to 49 ± 21 %. Slower lesion growth in the absence of SDs was also reflected by the volume of ATP-depleted tissue, which, after 2 h of MCA occlusion, involved 26 ± 12% of the ipsilateral cortex in treated and 49 ± 9% in untreated animals (p < 0.(1). These observations support the hypothesis that peri-infarct depolarizations accelerate cerebral infarct growth. Key Words: Cortical spreading depression-Focal cerebral ischemia-Diffusion-weighted MRI-Rat-EEG-DC potential.
sulfamoyl-benzo (F)-quinoxaline (NBQX) inhibit periinfarct SD and reduce infarct size (Iijima et aI., 1992; Gill et aI., 1992; Mies et aI., 1994). It has, therefore, been suggested that reduction in infarct volume after application of glutamate receptor antagonists is due to the suppression of peri-infarct SD (Hossmann, 1994). However, correlation of infarct size with the number of peri-infarct SDs is not necessarily causal since big infarcts may generate more depolarizations than smaller ones. To address this question, we looked at the evolution of brain infarcts by combining focal brain ischemia with microinjections of potassium acetate to produce externally-evoked SDs.
For evaluation of infarct growth, we used diffusionweighted magnetic resonance (MR) imaging (DWI). DWI has found wide application for acute studies of experimental stroke as it is able to detect the ischemic lesion within minutes after onset of circulatory impairment (Moseley et al., 1990). Recently, it has been dem-

CORTICAL SPREADING DEPRESSIONS IN RATS 1091
onstrated that SDs also cause changes in signal intensity in DWI (Busch et aI., 1995; Hasegawa et aI., 1995; Latour et a!., 1994; Rother et a!., 1996). Therefore, both the ischemic lesion and the externally evoked SDs can be detected by this imaging modality. Another methodological advancement is the development of electrophysiological recording techniques that allow simultaneous artifact-free registration of electrophysiological and MR data (Busch et a\., 1995). Finally, fluorescence and bioluminescence techniques are available that permit precise volumetric evaluation of biochemical disturbances (Kogure and Furones Alonso, 1978; Csiba et aI., 1983; Paschen et aI., 1981). By combining these techniques, we show that externally-evoked SDs do, in fact, accelerate the evolution of ischemic infarcts.
MATERIALS AND METHODS
Surgical procedures Male Wistar rats (n = 12) were anesthetized with 1.5%
halothane in a 70%/30% (vol/vol) mixture of N20/02• Catheters were inserted into a femoral artery and vein (for blood sampling, blood pressure recording, and intravenous infusion of drugs) and into the abdomen (for the peritoneal injection of dizocilpine). Animals were tracheotomized and artificially ventilated. Pancuronium bromide (0.3 mg/kg/h) was given intravenously for immobilization, and halothane was then reduced to 0.8%.
Middle cerebral artery (MCA) occlusion was carried out in the (MR) tomograph using a remotely controlled intraluminal thread occluder, as described in detail elsewhere (Kohno et aI., 1995). In brief, a guide sheath was fixed next' to the carotid bifurcation at the digastric muscle. A monofilament occluder, thickened with silicone to 0.28 mm at its distal end and connected to an extension tube, was inserted through the guide sheath and into the proximal end of the isolated external carotid stump into the internal carotid artery. After placement of the animal in the magnet and acquisition of control images, the occluder was advanced, under remote control, through the skull base until occlusion of the MCA origin was achieved. Successful occlusion was confirmed by a reduction of the EEG amplitude.
At regular intervals, arterial blood samples were extracted for measurement of blood gases, blood glucose, and hematocrit, and replaced by intravenous saline. Body temperature was recorded with a rectal thermometer and maintained at 37°C with a feedback-controlled warm-water blanket. Animals were fixed prone in a nonmagnetic stereotaxic headholder for accurate positioning in the magnet.
Electrophysiological recordings and induction of
cortical SD Animals were prepared for electrophysiological recordings
and induction of SO within the magnet (Busch et al., 1995). The skull was exposed by a midline incision and calomel electrodes were placed over the frontoparietal cortex 2 mm posterior and 2 mm lateral of the bregma (active electrode) and on the nasal bone (reference electrode). The calomel electrodes were made from L-shaped glass tubes to keep the metallic parts (which could generate artifacts in the images) well out of the imaging plane. Contact to the thinned skull was made with a saline-rinsed cotton wool ball. This method allowed simulta-
neous artifact-free recording of electrophysiological and MR data. EEG and direct current (OC) potential were displayed on a strip-chart recorder and stored on magnetic tape.
SO-waves were evoked by repeated intracortical microinjections of 2 I.d isotonic 0. 15 M potassium acetate (Gorelova et aI., 1987) through a micropipette, whicb was inserted I mm into the frontal cortex through a burrhole prepared 4 mm anterior and 2 mm lateral of the bregma.
MR experiments MR experiments were performed on a 200 MHz BIOSPEC
svstem (Bruker, Karlsruhe, FRG) with a 30 cm diameter horiz�ntal magnet. The system was equipped with an actively shielded gradient coil system (maximum gradient strength 100 mT/m; rise time < 250 JLs). Radiofrequency (RF) pulses were transmitted using a 12-cm Helmholtz coil arrangement. The MR signal was acquired with a 16-mm surface coil placed over the skull. RF coils were decoupled from each other-the transmitter coil actively and the receiver coil passively.
Multislice OWl was performed with a Stejskal-Tanner pulsed gradient spin echo sequence (Stejskal and Tanner, 1965). For this purpose, the diffusion-encoding gradient was applied along the read-direction (i.e. up-to-down orientation in the coronal image planes) with a diffusion-weighting factor: b
= 1,500 s/mm1. Oue to the availability of high gradient power, the sequence could be optimized for short TE, 32 ms, resulting in minimization of T 2-dependent signal loss.
Six coronal slices with a thickness of I mm and a 0.75 mm interslice gap were recorded with a field of view of 40 mm. Recovery time (TR) was 2,325 ms and matrix size was 128 x 128. No averaging was done, resulting in an experimental time of only 5 min for each multi slice set.
Imaging of tissue pH and ATP content At the end of experiments, the heads of rats were frozen in
situ with liquid nitrogen. Brains were removed in a cold box, and cut in the same planes as were the MR slices using a cryostat microtome. Tissue pH of freshly cut sections was imaged using the pH-sensitive fluorescent dye umbelliferone, and ATP content, using the firefly bioluminescence method. Oetails of these methods have been described previously (Kogure and Furones Alonso, 1978; Paschen et aI., 1981; Csiba et aI., 1983).
Experimental protocol Animals were randomly divided into two groups. The un
treated group (n = 6) received an intraperitoneal injection of I ml saline 25 min prior to MCA occlusion, and the treated group (n = 6). an injection of 3 mg/kg dizocilpine (MK-80 1) dissolved in I ml saline to prevent the spread of potassiuminduced depolarizations.
Three control OWl multi slice sets were acquired prior to the first potassium application. Then, two microinjections of potassium were carried out at 15-min intervals and synchronized with the start of a series of three OWl multisliee acquisitions. MCA occlusion was then performed by advancing the intraluminal thread occluder, followed again by the acquisition of three OWl multislice sets. Finally, six potassium microinjections were performed at 15-min intervals, starting 15 min after MCA occlusion, and each microinjection was again synchronized with the acquisition of a series of three OWl multislice sets.
Image processing Images were transferred to a Macintosh Quadra 950 (Apple,
Cupertino, CA, U.S.A.). Image analysis was performed with the image processing software IMAGE (National Institutes of
J Cereb Blood Flow Metab. Vol. 16, No.6, 1996

/092 E. BUSCH ET AL.
Health, Bethesda, MD, U.S.A.). Difference maps of DWIs were produced by subtracting the average of three control images from all the subsequent images. The lesion areas at every individual time point were determined by a semiautomated intensity histogram algorithm (Eis et aI., unpublished data), the threshold of the ischemic lesion being set at two SDs above the mean pixel value of the contralateral nonischemic hemisphere.
The lesion areas in pH and A TP images were calculated by semiautomatic thresholding, with correction for tissue swelling according to Swanson et al. ( 1990). Tissue acidosis was defined as the fall of pH to <6.4, and impaired ATP content as a 30% decrease below the value of the contralateral hemisphere. These thresholds correspond approximately to two standard deviations of the mean pixel values of the opposite, nonischemic hemisphere. Cortical lesion volumes were measured by summing the products of cortical lesion areas and interslice distances and expressed as percentage of the total ipsilateral cortical volume.
In this study, the penumbra is defined as an area of increased DWI signal intensity in which ATP is not depleted (Kohno et aI., 1995). The size of penumbra was, therefore, calculated by subtracting the volume of ATP depletion from the volume of the DWI-visible lesion. DWI signal intensities were obtained from regions of interest (ROls) placed in a central slice at the level of bregma. ROIs were placed in the caudate-putamen for the core of the lesion, in the intermediate part of the cortex for the penumbra, and in the fronto-parietal cortex for nonischemic tissue.
All data are given as means ± 1 standard deviation. Statistical analysis was performed for each parameter by one-way analysis of variance (ANOY A), followed by Scheffe's F-test; p < 0.01 was accepted as significant.
RESULTS
Physiological variables
The physiological parameters before and after MeA occlusion are summarized in Table 1. After application of dizocilpine and before MeA occlusion, a marked drop in blood pressure was observed, as compared to the untreated group (l09 ± 14 versus 85 ± 14 mm Hg, respectively). All other variables were kept within normal range and did not differ significantly between the two groups during the entire length of the experiment.
SDs and peri-infarct depolarizations
Figure 1 shows continuous electrophysiological recordings of an untreated and a MK-801-treated animal throughout the experiment. Under control conditions, microinjections of potassium acetate evoked cortical SDs in all animals. The duration of SD was 3.1 ± 0.4 min and the mean amplitude (recorded monopolarly through the thinned bone) was 1.9 ± l.0 mY.
After MeA occlusion, all untreated animals continued to respond to potassium injections in the same way as during the control period. Five of the six untreated animals also exhibited an early spontaneous depolarization at 6.4 ± 5.6 min after vascular occlusion, with a mean amplitude of 2.4 ± 1.4 mY and a mean duration of 3.1 ± 1.4 min. Altogether, the six animals generated 10 further spontaneous depolarizations at a later time, with a mean amplitude of 1.7 ± 0.6 mY and a mean duration of 2.2 ± 0.5 min. Together with the six externally induced SDs, the mean number of depolarizations thus amounted to 7.2 ± 1.0 per animal in the period between 15 min and 2 h after MeA occlusion.
Treatment with dizocilpine abolished all evoked and all but one of the spontaneously occurring SDs; this SD occurred at 105 min after MeA occlusion. Two animals had a single episode of seizures after MeA occlusion, one in each group.
DWI
MeA occlusion led to an increase in signal intensity in the central parts of the MeA territory in all animals. These hyperintense areas were already detectable in the first multislice set of DWls acquired during the initial 5 min after MeA occlusion. These areas progressed in size and intensity, although to a different degree, depending on the timing of potassium-induced SDs and the treatment of animals. The following analysis is restricted to the cerebral cortex since cortically-induced SDs do not propagate into subcortical regions.
In the untreated group, microinjection of potassium
TABLE 1. Mean physiological variables
Animals with SDs" (n = 6)
Animals without SDs" (n = 6)
Before MCAO After MCAO Before MCAO After MCAO
MABP (mmHg) 109± 14 1 15 ± 18 85 ± 14 102 ± 18 Body temperture (DC) 37.3 ± 0.4 37.S ± 0.5 37.2 ± 0.6 37.3 ± 0.2 Pa02 (mm Hg) 135 ± 1 1 150 ± 23 I SS ± 16 147± 18 Paco2 (mm Hg) 45 ±4 43 ±7 46 ± 13 45±4 Arterial pH 7.33 ± 0.06 7.39 ±0.05 7.35 ± 0.07 7.35 ±0.05 Plasma glucose (mg/dl) 165 ± 63 142 ± 56 163 ± 45 140 ± 35 Hematocrit (%) 43±4 43 ±4 44±4 43 ±2
SDs were evoked by intracortical injection of potassium acetate; suppression of SDs was achieved by treatment with dizocilpine (MK-SOI). Values are means ± SD from six animals. MCAO, middle cerebral artery occlusion; MABP, mean arterial blood pressure.
" Untreated. b Treated with MK-SOl.
J Cereb Blood Flow Metab, Vol. 16. No.6, 1996

CORTICAL SPREADING DEPRESSIONS IN RATS 1093
Potassium -Induced depoLorlsotions untreated K' K' K' K' K' K' K'
I I I I I , DC .,...----'I,-----'t--��..---J,--I,_L [)mV
EEG [ZOO>,V
f 150 SAP ___ ",.. ... ------------ lOOmmHg
50 t MeA occlusion
MK·801 treated K' K' "
,M K.801 , DC ... �-----�----- [Zmv
EEG
SAP __ ",..-------__ ----..... -- t ��mmHg t �
MeA occlUSion
FIG. 1. Polygraphic recordings of EEG, DC-potential, and systemic arterial pressure before and after MCA occlusion in rat. In the untreated animal, each intracortical microinjection of potassium acetate (K+) induced a wave of spreading depression (SD). In addition, two spontaneous SDs were observed. In the animal treated with the glutamate antagonist dizocilpine (MK-801 ) 25 min before MCA occlusion, SDs were totally abolished. Recordings were carried out in the magnet of the 4.7 T BIOSPEC system during acquisition of DWls (note absence of electrical artifacts). DC, cortical steady potential; EEG, electroencephalogram; SAP, systemic arterial pressure.
acetate produced transient hyperintensities throughout the ipsilateral cortex in all cases before and in 33 of 36 applications after MCA occlusion. Before MCA occlusion, SD-induced hyperintensities were fully reversible but, after the onset of ischemia, a small rim around the ischemic lesion did not recover, leading to the stepwise growth of the DWI visible lesion (Fig. 2). This is also shown in Fig. 3, which demonstrates examples of the quantitative evolution of the DWI-visible lesion during the first 2 h after MCA occlusion in a coronal slice passing through the center of the ischemic territory. Each potassium-induced SD caused a sharp increase in the lesion size that was only partially reversed after SD had ceased. The corresponding changes in DWI signal intensity are shown in Fig. 4. In the peripheral part of the nonischemic cortex, SDs produced transient hyperintensities that were fully reversible, in accordance with previous observations of SDs evoked in nonischemic animals. In the core of the ischemic lesions, SDs did not modulate signal intensity since, in this region, tissue was already depolarized. In the penumbral border zone, on contrast, SD-induced hyperintensities were only partially reversed until, after four or five depolarizations, this region was no longer distinguishable from the infarct core.
The effect of SDs on the total volume of cortical lesion
is demonstrated in Table 2. The ischemic lesion involved 19 ± 15% of the ipsilateral cortical volume after 15 min, and 66 ± 16% after 2 h. The difference of 47 ± 13% of ipsilateral cortex is the tissue mass engulfed by the lesion during this interval.
In dizocilpine-treated animals, the initial DWI-visible lesion was larger than that in untreated rats, and involved 43 ± 16% of the ipsilateral cortex after 15 min, This difference was obviously due to the lower blood pressure (Table 1), resulting in a more severe hemodynamic impact. Microinjections of potassium acetate did not produce SDs before or after MCA occlusion (Fig. 1). Accordingly, neither DWI signal intensities (Fig, 4) nor the DWI-visib1e lesion size (Fig. 3) were modulated, and infarct progressed much more slowly. After 2 h of MCA occlusion, the DWI-visible lesion involved 49 ± 21% of the ipsilateral cortical volume; this corresponds to a lesion growth of only 6 ± 17% of the ipsilateral cortex. The comparison of lesion volume increment between the two groups was significantly different (47 ± 13% versus 6 ± l7%, p < 0.01).
Dizocilpine inhibited infarct growth in all directions, as demonstrated by comparing the changes in lesion size in the six slices of the DWI multislice set. Figure 5 shows that the difference between treated and untreated animals was significant in all four slices passing through the MCA territory; this confirms that SD-induced infarct growth is concentric.
A TP and pH imaging
At 2 h after MCA occlusion, regions of ATP depletion and of severe acidosis were visible in all animals (Fig. 6).
In the untreated group, the volume of cortical ATP depletion amounted to 49 ± 9% and that of cortical acidosis to 61 ± 9% of the ipsilateral cortex (Table 2). Comparison of the biochemical changes with the DWIvisible region revealed a closer correspondence with tissue acidosis than with A TP depletion (Fig. 7). This confirms our earlier conclusion that DWI images both the core and the penumbra of the evolving infarct (Kohno et aI., 1995; Hoehn-Berlage et aI., 1995a).
In dizocilpine-treated animals, both the volume of cortical A TP depletion and acidosis were smaller than in the untreated group. The volume of ATP depletion amounted to 26 ± 12%, and that of acidosis to 44 ± 12% of total ipsilateral cortical volume (Table 2). Dizocilpine thus reduced the core volume more than it did the total ischemic lesion, indicating that inhibition of SD retards mainly the progression of the infarct core into the penumbra region.
DISCUSSION
The present study demonstrates that the size and severity of the DWI-visible lesion following MCA occlusion is aggravated by externally-induced SDs. This ag-
J Cereb Blood Flow Metah, Vol. 16, No.6. 1996

1094 E. BUSCH ET AL.
FIG. 2. Evolution of the ischemia-induced hyperintense area in OWl before, during, and after the passage of SO. Potassium injections were synchronized with the start of image acquisition to ensure that SOs fitted into the 5-min time frame for recording of each multislice set of images. Every SO was associated with an expansion of the area of increased OWl signal intensity. After the passage of SO, the area of increased signal intensity decreased but did not return to the pre-SO size.
J Cereb Blood Flow Meta", Vol. 16, No.6, 1996
CORTICAL SPREADING DEPRESSIONS IN RATS 1095
Diffusion-weight ed imaging :corticallesion area
� 80 � o � 60 « c:
� 40 <II ...J
-020 .': -L-a
U 0
o � 60 « c:
.� 40 <II ...J
"820 -L-a
U 0
untreated
0.5 MeA occlusion
MK-801 treated
0.5
MeA occlusion
15 2h
i i 15 2h
FIG. 3. Quantitative evaluation of the cortical lesion areas in OWl before and during the first 2 h after MCA occlusion. Measurements were made in a central slice at the level of the bregma. Time pOints of intracortical potassium injections are indicated by arrows; one late spontaneous SO is indicated by the star. In the untreated animal, all but the last potassium injection triggered SOs. Every SO wave was associated with an expansion of the area of increased OWl signal intensity. After the passage of SO, the area of increased signal intensity decreased but did not return to the pre-SO value. In the MK-801 treated animal, only the first potassium injection, before MK-801 application, resulted in a SO. After treatment, SOs were abolished and no relationship was found between potassium injections and infarct growth. Note that final OWl-visible lesion of the treated animal was smaller despite its markedly larger initial size.
gravating effect is relieved by the N-methyl-o-aspartate (NMDA)-antagonist dizocilpine (MK-80 I ), which blocks the spread of these depolarizations and prevents the associated derangements of ion homeostasis in the periphery of the ischemic territory. This finding supports the hypothesis that SDs accelerate infarct growth (Mies et aI., 1993) and that the therapeutic suppression of SDs minimizes infarct size (Iijima et al., 1992; Gill et aI., 1992; Mies et aI., 1994). The finding is also in line with results of a recent study of Takano et al. (1996), who used quantitative apparent diffusion coefficient (ADC) mapping to estimate lesion size and concluded that externallyinduced SDs cause an expansion of the ischemic lesion. The previously observed relationship between the num-
ber of spontaneous peri-infarct SDs and infarct size (Mies et aI., 1993) is, therefore, not merely an epiphenomenon of the fact that large infarcts produce more SDs.
By comparing the evolution of the DWI-visible lesion with biochemical changes, we are now able to provide more detailed information about the mechanism of the SD-induced infarct growth. During the first 2 h after MeA-occlusion, T2 changes of the ischemic tissue are <10% (Hoehn-Bedage et aI., 1995b). Nevertheless, we optimized our sequence for short TE (32 ms) to minimize T 2-dependent signal loss, and to ensure that DWI signal hyperintensity was due to diffusion changes and was,
Diffusion -weighted imaging: signal intensity
untreated
0--0 core D---{] penumbra
� .0.6 l>---6 non- ischemic VI c: -E .04
g .0.2
.S?l VI C 0
Q) � -0.2 Q) L. Q) :;: -0.4 o
>. � .06 c: Q) C .0.4
g .0.2 .S?l VI c: 0 Q) u � -0.2 LQ)
:; -0.4 o
t 05 MeA occlusion
MK-801 treated
0--0 core G--� penumbra l>---6 non- i schemic
i 0.5
MeA occlusion
15 2h
15 2h
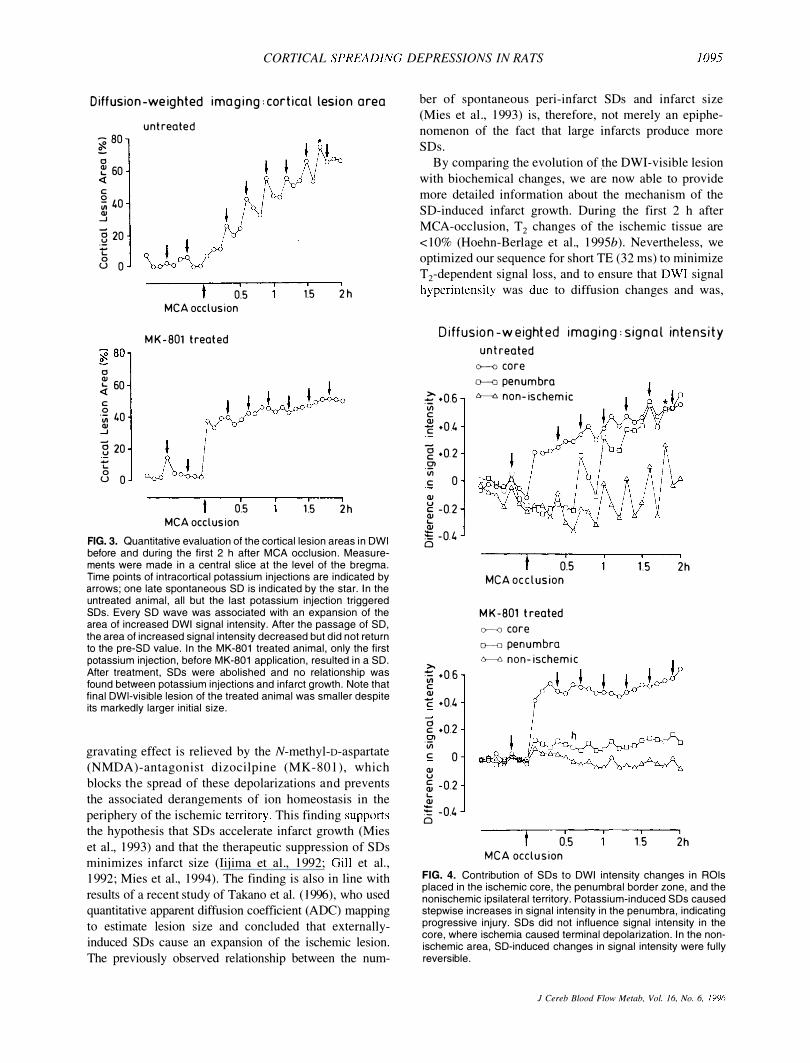
FIG. 4. Contribution of SOs to OWl intensity changes in ROls placed in the ischemic core, the penumbral border zone, and the nonischemic ipsilateral territory. Potassium-induced SOs caused stepwise increases in signal intensity in the penumbra, indicating progressive injury. SOs did not influence signal intensity in the core, where ischemia caused terminal depolarization. In the nonischemic area, SO-induced changes in signal intensity were fully reversible.
J Cereb Blood Flow Metab, Vol. 16. No.6. 1996

1096 E. BUSCH ET AL.
therefore, a measure of lesion severity. As previously shown in our laboratory, DWI detects both the core and penumbra of the evolving infarct (Kohno et aI., 1995; Hoehn-Berlage et a!., 1995a). The size of penumbra can, therefore, be estimated by subtracting the A TP-depleted tissue, which corresponds to the infarct core, from the DWI-visible lesion (Table 2). After 2 h of MeA occlusion, the size of penumbra was distinctly smaller in animals with induced SDs, indicating that the depolarizations contribute to cerebral infarct growth mainly by transforming the penumbra into irreversibly damaged core tissue. The gradual deterioration of the metabolic status of the penumbra is also supported by Gyngell et al. (1994, 1995), who demonstrated that penumbral lactate increases stepwise with each SD until the concentration approaches that of the core region.
Functional evidence for the aggravating effect of repeated penumbral SDs was provided by Graf et al. (1995), who documented (in cats) that the duration of spontaneous SDs in the vicinity of an acute ischemic infarct gradually increases until, after several hours, depolarizations become terminal. It is, therefore, not surprising that neurobehavior is also affected by peri-infarct SDs. This has been shown by Alexis et a!. (1995), who noted a significant aggravation of neurobehavioral disturbances when MeA occlusion was combined with electrically-induced SDs. In this context, it is noteworthy to mention that some of the neurobehavioral changes may be due to selective neuronal loss in the peri-infarct surrounding. In fact, Nedergaard and Astrup (1986) detected selective cell changes in cortical layers 2 and 3 as far as 6 mm away from the infarct, a result that is in agreement with the present finding that SD-induced, DWI-visible hyperintensities expand predominantly in the upper cortical layers (Fig. 2). Selective neuronal loss
TABLE 2. Effect of induced SDs on cortical lesio/l size after MeA occlusion of rat
Animals Animals with SDs" without SDs"
(n = 6) (n = 6) -�----.
DWI-visible lesion (% of cortex)
15 min ischemia 19± 15 43 ± 16' 2 h ischemia 66± 16 49±21
Acidosis (% of cortex) 61 ±9 44± 12 A TP depletion (% of cortex) 49±9 26 ± 12' Penumbra (% of DWJ-visible lesion) 26 47
DWIs were acquired throughout the experiment and the biochemical data at the end of 2 h ischemia. Values are means ± SD. The size of penumbra was calculated from mean values of DWI lesion and A TP depletion.
" Untreated. h Treated with MK-80 I. C P < 0.01.
J Cereb Blood Flow Metab, Vol. 16, No.6, 1996
Diffusion weighted imaging: cortical lesion growth Q--{) untreated fr---6 MK-801 treated
80 * � *
I 0
I *
60 I
* 0 I OJ '-« 1.0 c 9 VI 20 I OJ -'
f--rr-r-1 0 0 .� 15 -20 u <l i
2 3 I. 5 6 Slice number
FIG. 5. Lesion growth in animals with (untreated) and without (MK-801 treated) SOs after intracortical injection of potassium. Lesion growth was measured by OWl at six coronal levels and expressed as the difference between the lesion sizes at 1 5 min and at 2 h after MeA occlusion. The Significant differences in all four central slices suggest that SOs induced concentric growth of the ischemic lesion (*p < 0.01 ).
was also recently described by Back et al. (1996), who combined photo thrombotic MeA occlusion with externally evoked SDs.
Possible mechanisms of SD-induced infarct aggravation have been extensively discussed in the past (for review see Hossmann, in press). In normal nonischemic tissue, repolarization of cell membranes after SD increases metabolic rate (Shinohara et aI., 1979), which, in turn, is coupled to an increase in blood flow and oxygen supply (Mayevsky and Weiss, 1991; Mies and Paschen, 1984). Therefore, despite some increase in lactate content (Kocher, 1990), such depolarizations are associated with increased tissue oxygen pressure (Back et aI., J 994) and do not cause disturbances of energy state or morphological injury (Nedergaard and Hansen, 1988). This is in contrast to the hemodynamically compromised periinfarct zone, in which SD is not coupled to an appropriate flow response and, therefore, causes transient episodes of relative tissue hypoxia (Back et aI., 1994). The disproportion between oxygen demands and oxygen supply causes an impairment of aerobic metabolism, as retlected by the sharp increase of lactate (Gyngell et aI., 1995) and the gradual prolongation of peri-infarct SD waves (Back et aI., 1994; Graf et aI., 1995). Repetition of peri-infarct SD also causes severe suppression of protein synthesis (Mies et aI., 1991) and induction of transcription factors (Herdegen et aI., 1993), i.e., disturbances that are reminiscent of the changes observed in the selectively vulnerable areas after transient global ischemia (Neumann-Haefelin et aI. , 1994). Obviously, these pathological changes accumulate until the initially viable peri-infarct tissue is transformed into an irreversible necrotic lesion.
In contrast to the present experimental situation, SD

CORTICAL SPREADING DEPRESSIONS IN RATS 1097
FIG. 6. Ischemic lesion at 2 h after MeA occlusion as determined by OWl, ATP (bioluminescence), and pH (fluorescence) imaging in corresponding cryostat sections. In animals with externally induced SOs (untreated), areas of OWl hyperintensity, tissue acidosis, and ATP depletion are of similar size, indicating that the core region of the infarct has expanded into the penumbra zone. In contrast, slices of animal without SOs (MK-80 1 -treated) show that the ATP-depleted area is markedly smaller than the areas of OWl hyperintensity and acidosis, indicating preservation of the penumbra. Interestingly, the parietal cortex of the untreated animal shows, additionally, a separate area of tissue acidosis, representing a SO during in-situ freezing.
may also have protective effects against neuronal damage (Kawahara et aI., 1995). However, this protection is achieved by pretreatment several days before the ischemic impact and is mediated by an ischemic tolerance phenomenon that is thought to result from the induction of stress proteins. This is different from the postischemic effect described herein and, therefore, does not invalidate our conclusions.
A reasonable deduction of our analysis is the therapeutic suppression of spontaneously occurring SDs for the treatment of focal ischemia. Although this was not the objective of the present study, our dizocilpine-treated group clearly demonstrated that blockade of SDs stabilized the DWI-visible lesion volume at its initial level and, therefore, minimized the severity of the ischemic injury. This is in accord with similar MR findings of Lo et a1. (1994) and Gill et a!. (1995) and confirms the well-documented fact that glutamate antagonists ameliorate ischemic brain damage (McCulloch, 1994).
In a strict sense, our study does not provide rigorous evidence for a pathogenetic role for SDs since the thera-
peutic effect of MK-80 J could also be mediated by additional protective mechanisms. However, we believe that our study adds strong support to the hypothesis that MK-801 reduces infarct size by alleviating the functional metabolic workload of peri-infarct depolarizations. This evidence is strengthened by the present unintended fact that dizocilpine-treated animals suffered a more severe initial ischemic impact than did untreated rats in the initial period before SDs were elicited. This more severe ischemia was apparently caused by the fall in blood pressure after drug injection (Cole et aI., 1990) and may be different from other experimental situations in which vascular occlusion is performed before application of the drug or after blood pressure has normalized. However, despite this difference, lesion size of the untreated animals increased so rapidly that after only 2 h of ischemia, the infarct core was significantly larger than that of dizocilpine-treated rats.
In conclusion, our study adds further support to the hypotheses that peri-infarct SD plays a dominant role in the evolution of ischemic infarct and that suppression of
] Cereb Blood Flmv Metah. Vol. 16. No.6, 1996

1098 E. BUSCH ET AL.
OWl and biochemical lesion 'Volume
100 II un tr ea t ed
� �MK-801 treat ed 0
<li 80 E ::> a 60 > c a VI [,0 <li
d u 20 ...., L-a
U 0
OWl pH ATP
FIG. 7. Cortical lesion volumes measured by OWl, pH (fluorescence), and ATP (bioluminescence) imaging at 2 h of MCA occlusion. Animals with externally induced SOs (untreated) exhibited larger cortical lesion volume measured by all three imaging modalities. The difference was most pronounced for the volume of ATP depletion, indicating that SO contributes to infarct growth mainly by transforming penumbral into irreversibly damaged tissue.
peri-infarct SDs may be the main mechanism by which glutamate antagonists reduce infarct volume.
Acknowledgment: We thank Mrs. Christiane Stratmann for processing the brains for bioluminescence imaging, Mrs. Miihlhover and Mr. Huth for artwork, and Mrs. Schewetzky and Mrs. Hahmann for secretarial help. The project was supported by the Deutsche Forschungsgemeinschaft (SFB I 94/B I).
REFERENCES
Alexis NE, Back T, Dietrich WD, Zhao W, Watson BD, Ginsberg MD (1995) Induction of spreading depression in the ischemic hemisphere following middle cerebral artery (MCA) occlusion: effect on neurobehavior [abstract]. J Cereh Blood Flow Metah 15:S316
Back T, Kohno K, Hossmann K-A (1994) Cortical negative DC deflections following middle cerebral artery occlusion and KC1-induced spreading depression: effect on blood flow. tissue oxygenation, and electroencephalogram. J Cereh Blood Flow Metah 14: 12�19
Back T, Ginsberg MD, Dietrich WD, Watson BD (1996) Induction of spreading depression in the ischemic hemisphere following experimental middle cerebral artery occlusion: effect on infarct morphology. J Cereh Blood Flow Metah 16:202�213
Busch E, Hoehn-Berlage M, Eis M, Gyngell ML, Hossmann K-A (1995) Simultaneous recording of EEG, DC potential and ditfusion-weighted NMR imaging during potassium induced cortical spreading depression in rats. NMR Biomed 8:59-64
Chen Q, Chopp M, Bodzin G, Chen H (1993) Temperature modulation in cerebral depolarization during focal cerebral ischemia in rats: correlation with ischemic injury. J Cereh Blood Flow Metah 13: 389-394
Cole DJ, Drummond JC, Shapiro HM, Zornow MH (1990) Influence of hypotension and hypotensive technique on the area of profound reduction in cerebral blood flow during focal cerebral ischaemia in the rat. Br J Anaesthesia 64:498�502
Csiba L, Paschen W, Hossmann K-A (1983) A topographic quantitative
J Cereh Blood Flow Metab, Vol. 16, No.6, 1996
method for measuring brain tissue pH under physiological and pathophysiological conditions. Brain Res 289:334�337
Gill R, Andine P, Hillered L, Persson L, Hagberg H (1992) The effect of MK-80 1 on cortical spreading depression in the penumbral zone following focal ischaemia in the rat. J Cereb Blood Flow Metah 12:371�379
Gill R, Sibson NR, Maskell L, Carpenter TA, Hall LD, Pickard 10 (1995) The neuroprotective effects of MK-801 assessed using diffusion weighted MRI over a period of 24 h in the same animals [abstractl. J Cereh Blood Flow Metah l5:S365
Gorelova NA, Krivanek J, Bures J (1987) Functional and metabolic correlates of long series of cortical spreading depression waves in rats. Brain Res 404:379-381
Graf R, Saito R, Hiibel K, Fujita T, Rosner G. Heiss W-D (1995) Spreading depression-like DC-negativations turn into terminal depolarisations after prolonged focal ischemia in cats [abstractJ. J Cereb Blood Flow Metab 15:S 15
Gyngell ML, Back T, Hoehn-Berlage M, Kohno K, Hossmann K-A (1994) Transient cell depolarisation after permanent middle cerebral artery occlusion: an observation by diffusion-weighted MRI and localized IH-MRS. Magn Reson Med 3l:337�341
Gyngell ML, Busch E, Schmitz B, Kohno K, Back T, Hoehn-Berlage M, Hossmann K-A (1995) Evolution of acute focal cerebral ischemia in rats observed by localised I H MRS, diffusion-weighted MRI, and electrophysiological monitoring. NMR Biomed 8:206-214
Hasegawa Y, Latour LL, Formato JE, Sotak CH, Fischer M (1995) Spreading waves of a reduced diffusion coefficient of water in normal and ischemic rat brain . .I Cereh Blood Flow Metah 15: 179-187
Herdegen T, Sandktihler J, Gass P, Kiessling M, Bravo R, Zimmermann M (.1993) JUN, FOS, KROX, and CREB transcription factor proteins in the rat cortex-basal expression and induction by spreading depression and epileptic seizures. J Comp Neurol 333: 271�288
Hoehn-Berlage M. Norris DG, Kohno K, Mies G, Leibfritz D, Hossmann K-A (1995a) Evolution of regional changes in apparent diffusion coefficient during focal ischemia of rat brain: the relationship of quantitative diffusion NMR imaging to reduction in cerebral blood flow and metabolic disturbances. J Cereh Blood Flow Metab 15: 1002-1011
Hoehn-Berlage M, Eis M, Back T, Kohno K, Yamashita K (1995h) Changes of relaxation times (T I' T 2) and apparent diffusion coefficient after permanent middle cerebral artery occlusion in the rat: temporal evolution, regional extent, and comparisou with histology. Magll Reson Med 34:824-834
Hossmann K-A (1994) Glutamate-mediated injury in focal cerebral ischemia: the excitotoxin hypothesis revised. Brain PathoI4:23-36
Hossmann K-A (in press) Peri-infarct depolarizations. Cerehrovasc Brain Metah Rev
Iijima T, Mies G, Hossmann K-A (1992) Repeated negative DC deflections in rat cortex following middle cerebral artery occlusion are abolished by MK-80 l: effect on volume of ischemic injury. J Cereh Blood Flow Merah 12:727�733
Kawahara N, Ruetzler CA, Klatzo I (1995) Protective effect of spreading depression against neuronal damage following cardiac arrest cerebral ischaemia. Neurol Res 17:9�16
Kocher M (1990) Metabolic and hemodynamic activation of postischemic rat brain by cortical spreading depression. J Cereh Blood Flow Metah 10:564-571
Kogure K, Furones Alonso 0 (1978) A pictorial presentation of endogenous brain A TP by a luminescent method. Brain Res 154: 273�284
Kohno K, Back T, Hoehn-Berlage M, Hossmann K-A (1995) Modified rat model of middle cerebral artery occlusion under electrophysiological control for magnetic resonance investigations: Description of technique. Magn Reson Imag 13:65-71
Latour LL, Hasegawa Y, Formato JE, Fisher M, Sotak CH (1994) Spreading waves of decreased diffusion coefficient after cortical stimulation in the rat brain. Magn Reson Med 32:189-198
Lo EH, Matsumoto K, Pierce AR. Garrido L. Luttinger D (1994) Pharmacologic reversal of acute changes in diffusion-weighted mag-

CORTICAL SPREADING DEPRESSIONS IN RATS 1099
netic resonance imaging in focal cerebral ischemia. J Cereb Blood Flow Metab 14:597-603
Mayevsky A, Weiss HR (1991) Cerebral blood now and oxygen consumption in cortical spreading depression. J Cereb Blood Flow Metab 11:829-836
McCulloch J (1994) Glutamate receptor antagonists in cerebral ischaemia. J Neural Transm 43:Suppl 71-79
Mies G, lshimaru S, Xie Y, Seo K, Hossmann K-A (1991) Ischemic thresholds of cerebral protein synthesis and energy state following middle cerebral artery occlusion in rat. J Cereb Blood Flow Metab 11:753-761
Mies G, Iijima T, Hossmann K-A (1993) Correlation between periinfarct DC shifts and ischemic neuronal damage in cerebral cortex of rat. Neurarep 4:709-711
Mies G, Kohno K, Hossmann K-A (1994) Prevention of peri infarct direct current shifts with glutamate antagonist NBQX following occlusion of the middle cerebral artery in the rat. .l Cereb Blood Flow Metab 14:802-807
Mies G, Paschen W (1984) Regional changes of blood now, glucose, and ATP content determined on brain sections during a single passage of spreading depression in rat brain cortex. Exp Neurol 84:249-258
Moseley ME, Cohen Y, Mintorovitch J, Chileuitt L, Shimizu H, Kucharczyk J, Wendland MF, Weinstein PR (1990) Early detection of regional cerebral ischemia in cats: comparison of diffusionand T*-weighted MRI and spectroscopy. Magn Reson Med 14: 330-346
Nedergaard M, Astrup J (1986) Infarct rim: effect of hyperglycemia on direct current potential and [14Cj2-deoxyglucose phosphorylation. .l Cereb Blood Flow Metab 6:607-615
Nedergaard M, Hansen Al (1993) Characterization of cortical depolarizations evoked in focal cerebral ischemia. J Cereb Blood Flow Metab 13:568-574
Nedergaard M, Hansen AJ (1988) Spreading depression is not associated with neuronal injury in the normal brain. Brain Res 449:395-398
Neumann-Haefelin T, Wiessner C, Vogel' P, Back T, Hossmann K-A (1994) Differential expression of the immediate early genes c-fos, c-jun, junB, and NGFI-B in the rat brain following transient forebrain ischemia . .l Cereb Blood Flow Metab 14:206-216
Paschen W, Niebuhr I, Hossmann K-A (1981) A bioluminescence method for the demonstration of regional glucose distribution in brain slices . .l Neurachem 36:513-517
Riither I, de Crespigny AJ, D'Arceuil H, Moseley ME (1996) MR detection of cortical spreading depression immediately after focal ischemia in the rat. .l Cereb Blood Flow Metab 16:214-220
Shin ohara M, Dollinger B, Brown G, Rapoport S, Sokoloff L (1979) Cerebral glucose utilization: local changes during and after recovery from spreading cortical depression. Science 203: 188-190
Stejskal EO, Tanner JE (1965) Spin diffusion measurements: spin echoes in the presence of a time-dependent field gradient. .l Chem Phys 42:288-292
Swanson RA, Morton MT. Tsao-Wu G, Savalos RA, Davidson C, Sharp FR (1990) A semiautomated method for measuring brain infarct volume. J Cereb Blood Flow Metab 10:290-293
Takano K, Latour LL, Formato IE, Carano RAD, Helmer KG, Hasegawa y, Sotak CH, Fisher M (1996) The role of spreading depression in focal ischemia evaluated by diffusion mapping. Ann Neural 39:308-318
J Cereb Blood Flow Metab, Vol. 16, No.6, 1996