POST-PROVO PALEOEARTHQUAKE CHRONOLOGY OF THE BRIGHAM CITY SEGMENT, WASATCH FAULT ZONE, UTAH
53
POST-PROVO PALEOEARTHQUAKE CHRONOLOGY OF THE BRIGHAM CITY SEGMENT, WASATCH FAULT ZONE, UTAH by James P. McCalpin, GEO-HAZ Consulting, Inc., P.O. Box 837, Crestone, CO 81131 [email protected] and Steven L. Forman, Department of Earth and Environmental Sciences, University of Illinois-Chicago, M/C 186, Chicago, IL 60607-7059 [email protected] McCalpin, Forman POST-PROVO PALEOEARTHQUAKE CHRONOLOGY OF THE BRIGHAM CITY SEGMENT, WASATCH FAULT ZONE, UTAH UGS MP 02-9 PALEOSEISMOLOGY OF UTAH, VOLUME 11 MISCELLANEOUS PUBLICATION 02-9 UTAH GEOLOGICAL SURVEY a division of Utah Department of Natural Resources 2002 Photograph of main fault and colluvial wedge in trench. Aerial view of the Provo delta at Brigham City, looking east.
-
Upload
independent -
Category
Documents
-
view
0 -
download
0
Transcript of POST-PROVO PALEOEARTHQUAKE CHRONOLOGY OF THE BRIGHAM CITY SEGMENT, WASATCH FAULT ZONE, UTAH

POST-PROVO PALEOEARTHQUAKECHRONOLOGY OF THE BRIGHAM CITY
SEGMENT, WASATCH FAULT ZONE, UTAHby
James P. McCalpin, GEO-HAZ Consulting, Inc., P.O. Box 837,Crestone, CO 81131
and
Steven L. Forman, Department of Earth and Environmental Sciences, University of Illinois-Chicago,M/C 186, Chicago, IL 60607-7059
McC
alpin, Form
an PO
ST-P
RO
VO
PA
LEO
EA
RT
HQ
UA
KE
CH
RO
NO
LOG
Y O
F TH
E B
RIG
HA
M C
ITY
SE
GM
EN
T, WA
SA
TC
H FA
ULT
ZO
NE
, UTA
H
UG
S M
P 02-9
PALEOSEISMOLOGY OF UTAH, VOLUME 11
MISCELLANEOUS PUBLICATION 02-9UTAH GEOLOGICAL SURVEYa division ofUtah Department of Natural Resources2002
Photograph of main fault and colluvial wedge in trench.
Aerial view of the Provo delta at Brigham City, looking east.

PALEOSEISMOLOGY OF UTAH, VOLUME 11
POST-PROVO PALEOEARTHQUAKE CHRONOLOGY OF THE BRIGHAM
CITY SEGMENT, WASATCH FAULT ZONE, UTAH
By
James P. McCalpin, GEO-HAZ Consulting, Inc., P.O. Box 837, Crestone, CO 81131, [email protected]
Steven L. Forman, Department of Earth and Environmental Sciences, University of Illinois-Chicago, M/C 186, Chicago, IL 60607-7059, [email protected]
Cover: photograph by James McCalpin
ISBN 1-55791-671-3 UTAH GEOLOGICAL SURVEY
Miscellaneous Publication 02-9 2002
The Miscellaneous Publication Series of the Utah Geological Survey provides non-UGS authors with a high-quality format for papers concerning Utah geology and paleontology. Although reviews have been incorporated, this publication does not necessarily conform
to UGS technical, policy, or editorial standards

ii Utah Geological Survey
STATE OF UTAH Michael O. Leavitt, Governor
DEPARTMENT OF NATURAL RESOURCES
Robert Morgan, Executive Director
UTAH GEOLOGICAL SURVEY Richard G. Allis, Director
UGS Board
Member Representing Robert Robison (Chairman) ……………………………………………………………………………. Minerals (Industrial) Geoffrey Bedell …………………………………………………………………………………….. …..…Minerals (Metals) Stephen Church ……………………………………………………………………………………… Minerals (Oil and Gas) E.H. Deedee O’Brien ……………………………………………………………………………………...…. Public-at-Large Craig Nelson ………………………………………………………………………….……………….... Engineering Geology Charles Semborski …………………………………………………………………………………………… Minerals (Coal) Ronald Bruhn ……………………………………………………………………………………………………….. Scientific Stephen Boyden, Trust Lands Administration ……………………………………………………………. Ex officio member
UTAH GEOLOGICAL SURVEY
The UTAH GEOLOGICAL SURVEY is organized into five geologic programs with Administration and Editorial providing necessary support to the programs. The ENERGY & MINERAL RESOURCES PROGRAM undertakes studies to identify coal, geothermal, uranium, hydrocarbon, and industrial and metallic resources; initiates detailed studies of these resources including mining district and field studies; develops computerized resource data bases, to answer state, federal, and industry requests for information; and encourages the prudent development of Utah’s geologic resources. The GEOLOGIC HAZARDS PROGRAM responds to requests from local and state governmental entities for engineering-geologic investigations; and identifies, documents, and interprets Utah’s geologic hazards. The GEOLOGIC MAPPING PROGRAM maps the bedrock and surficial geology of the state at a regional scale by county and at a more detailed scale by quadrangle. The Geologic INFORMATION & OUTREACH PROGRAM answers inquiries from the public and provides information about Utah’s geology in a non-technical format. The ENVIRONMENTAL SCIENCES Program maintains and publishes records of Utah’s fossil resources, provides paleontological and archeological recovery services to state and local governments, conducts studies of environmental change to aid resource management, and evaluates the quantity and quality of Utah’s ground-water resources. The UGS Library is open to the public and contains many reference works on Utah geology and many unpublished documents on aspects of Utah geology by UGS staff and others. The UGS has several computer databases with information on mineral and energy resources, geologic hazards, stratigraphic sections, and bibliographic references. Most files may be viewed by using the UGS Library. The UGS also manages the Utah Core Research Center which contains core, cuttings, and soil samples from mineral and petroleum drill holes and engineering geology investigations. Samples may be viewed at the Utah Core Research Center or requested as a loan for outside study. The UGS publishes the results of its investigations in the form of maps, reports, and compilations of data that are accessible to the public. For information on UGS publications, contact the Natural Resources Map/Bookstore, 1594 W. North Temple, Salt Lake City, Utah 84116, (801) 537-3320 or 1-888-UTAH MAP. E-mail: [email protected] and visit our web site at http://mapstore.utah.gov.
UGS Editorial Staff
J. Stringfellow …………………. Editor Vicky Clarke, Sharon Hamre ………….. Graphic Artists
Patricia H. Speranza, James W. Parker, Lori Douglas ………. Cartographers
The Utah Department of Natural Resources receives federal aid and prohibits discrimination on the basis of race, color, sex, age, national origin, or disability. For information or complaints regarding discrimination, contact Executive Director, Utah Department of Natural Resources, 1594 West North Temple #3710, Box 145610, Salt Lake City, UT 84116-5610 or Equal Employment Opportunity Commission, 1801 L Street, NW, Washington DC 20507.
Printed on recycled paper 1/02

Paleoearthquakes, Brigham City Segment iii
Paleoseismology of Utah, Volume 11
FOREWORD
This Utah Geological Survey Miscellaneous Publication, Post-Provo Paleoearthquake Chronology of the Brigham City Segment, Wasatch Fault Zone, Utah, is the eleventh report in the Paleoseismology of Utah series. This series makes the results of paleoseismic investigations in Utah available to geoscientists, engineers, planners, public officials, and the general public. These studies provide critical information on paleoearthquake parameters such as timing, recurrence, displacement, slip rate, and fault geometry which can be used to characterize potential seismic sources and evaluate the long-term seismic hazard presented by Utah’s Quaternary faults. This report presents the results of the most extensive single paleoseismic-trenching project yet conducted on the Wasatch fault zone (WFZ). Drs. McCalpin and Forman excavated fourteen trenches across seven fault scarps formed on the Provo delta at Brigham City, Utah. The purpose of the study was to lengthen the paleoseismic chronology for the Brigham City segment of the WFZ beyond the 6,000-year record previously available, and to resolve questions regarding the irregular pattern of paleoearthquakes reported by earlier workers for the Brigham City segment. This study makes extensive use of radiocarbon, thermoluminescence, and infrared stimulated luminescence dating techniques to develop a real-time chronology of past surface-faulting earthquakes. The results of this study when compared with other detailed paleoseismic investigations on other segments of the WFZ show that the Brigham City segment has the highest probability of rupture in the next 100 years among the five central, active segments of the WFZ. Dr. James P. McCalpin, GEO-HAZ Consulting, Inc. and Dr. Steven L. Forman of the University of Illinois-Chicago, conducted the Brigham City study with funding received through the U.S. Geological Survey National Earthquake Hazard Reduction Program (NEHRP). Geologists from the Utah Geological Survey participated in the field review of the trenches, and the UGS provided hydraulic trench shoring during the 1992 field season. This study was originally published in 1993 as a NEHRP Final Technical Report. The Utah Geological Survey appreciates the opportunity to work with Drs. McCalpin and Forman to make the results of this important paleoseismic investigation more readily available to the user community. William R. Lund, Editor Paleoseismology of Utah Series

iv Utah Geological Survey

Paleoearthquakes, Brigham City Segment v
CONTENTS Abstract ........................................................................................................................................................................1 Introduction ..................................................................................................................................................................2 Location and Previous Work ...........................................................................................................................2 Scope of This Study.........................................................................................................................................2 Methods ...........................................................................................................................................................3 Radiocarbon Dating............................................................................................................................3 Thermoluminescence Dating..............................................................................................................4 Quantitative Analysis of Soils ............................................................................................................4 Acknowledgments ...........................................................................................................................................4 Geologic and Geomorphic Setting of the Trench Site..................................................................................... ............7 Trenches .......................................................................................................................................................................12 Scarp A, Northern Part ....................................................................................................................................12 Trench 4..............................................................................................................................................12 Trench 9..............................................................................................................................................14 Trench 10............................................................................................................................................14 Trench 11............................................................................................................................................16 Ground-Penetrating Radar Survey of Northern Scarp A....................................................................16 Scarp A, Southern Part ....................................................................................................................................18 Trench 14............................................................................................................................................18 Scarp B ............................................................................................................................................................20 Scarp C ............................................................................................................................................................20 Trench 1..............................................................................................................................................20 Trench 8..............................................................................................................................................20 Scarp D............................................................................................................................................................20 Trench 2..............................................................................................................................................22 Trench 12............................................................................................................................................25 Scarp E ............................................................................................................................................................26 Trench 7..............................................................................................................................................26 Trench 13, lower part .........................................................................................................................28 Scarp F.............................................................................................................................................................30 Trench 3, lower part ...........................................................................................................................30 Trench 5..............................................................................................................................................30 Scarp G............................................................................................................................................................33 Trench 3, upper part ...........................................................................................................................33 Trench 6..............................................................................................................................................33 Trench 13, upper part .........................................................................................................................35 Paleoearthquake Chronology........................................................................................................................................38 Event Z ............................................................................................................................................................38 Event Y............................................................................................................................................................40 Event X............................................................................................................................................................40 Event W...........................................................................................................................................................40 Events U and V................................................................................................................................................40 Event T ............................................................................................................................................................41 Conclusions ..................................................................................................................................................................42 Comparison With Previous Paleoearthquake Chronologies............................................................................42
Implications of the Trench Results for Probability Estimates of Future Large Earthquakes on the Brigham City Segment .................................................................................................................................42 Physical Causes of Longer Recurrence in the Early Holocene .......................................................................44
References ....................................................................................................................................................................45

vi Utah Geological Survey
FIGURES
Figure 1. Map of study area..........................................................................................................................................2 Figure 2. Aerial view of the Provo delta at Brigham City, from Smith and Jol, 1995 .................................................3 Figure 3. Geologic map of the central Brigham City segment, from Personius, 1990.................................................7 Figure 4. Map of trench locations.................................................................................................................................8 Figure 5. Photograph of 21-meter-high scarp across Provo delta on south side of Box Elder Creek ..........................10 Figure 6. Low-sun-angle aerial photograph of the Wasatch Front at the mouth of Box Elder Creek.........................11 Figure 7. Photograph of the east-tilted subdelta surface and northernmost part of Scarp A, containing trenches 4 (background) and 9 (foreground). ..........................................................................................12 Figure 8. Log of trench 4, Scarp A...............................................................................................................................13 Figure 9. Log of trench 9, projection of Scarp A..........................................................................................................14 Figure 10. Photograph of Scarp A, looking south from the subdelta surface...............................................................14 Figure 11. Log of trench 10..........................................................................................................................................15 Figure 12. Photograph of complex conjugate normal faulting in Provo deltaic gravels in trench 10 ..........................16 Figure 13. Comparison of trench 10 (outline at top center) with GPR profile .............................................................17 Figure 14. Photograph of the central part of trench 14.................................................................................................18 Figure 15. Log of trench 14..........................................................................................................................................19 Figure 16. Photograph of deepened trench 1 (foreground) and Scarp C (background)................................................20 Figure 17. Log of trench 1 ............................................................................................................................................21 Figure 18. Log of trench 2 ............................................................................................................................................23 Figure 19. Retrodeformation sequence for trench 2 .....................................................................................................24 Figure 20. Photograph of main fault (between arrows) and colluvial wedges (above dashed line) in trench 12................................................................................................................................................................25 Figure 21. Log of trench 12..........................................................................................................................................26 Figure 22. Retrodeformation sequence of trench 12 ....................................................................................................27 Figure 23. Log of trench 7 ............................................................................................................................................28 Figure 24. Photograph of the organic-filled crack underlying Scarp E........................................................................28 Figure 25. Log of trench 13..........................................................................................................................................29 Figure 26. Log of trench 5 ............................................................................................................................................31 Figure 27. Retrodeformation sequence for trench 5 .....................................................................................................32 Figure 28. Log of trench 3 ............................................................................................................................................34 Figure 29. Photograph of upper part of trench 13, showing caved section in fault zone .............................................35 Figure 30. Log of trench 6 ............................................................................................................................................36 Figure 31. Retrodeformation sequence of trench 6 ......................................................................................................37 Figure 32. Space-time diagram of paleoearthquakes on the various scarps at the Brigham City trench site, plus two paleoearthquakes from Personius (1991) .................................................................................39 Figure 33. Numerical age estimates for the early Holocene loess, and for a thin Av horizon enriched in loess (OTL-503) that is separated from the loess by a colluvial wedge .................................................41
TABLES
Table 1. Numerical ages from this study...................................................................................................................…5 Table 2. Luminescence data and age estimates .............................................................................................................6 Table 3. Map unit abbreviations used in figures 3 and 4...............................................................................................7 Table 4. Limiting ages and mean limiting age for paleoearthquakes at Brigham City ...............................................38 Table 5. Probability estimates of M>7 earthquakes in the next 100 years for the Brigham City segment ....................................................................................................................................................................43

POST-PROVO PALEOEARTHQUAKE CHRONOLOGY OF THE BRIGHAM
CITY SEGMENT, WASATCH FAULT ZONE, UTAH
By
James P. McCalpin, GEO-HAZ Consulting, Inc., P.O. Box 837, Crestone, CO 81131, [email protected]
Steven L. Forman, Department of Earth and Environmental Sciences, University of Illinois-Chicago, M/C 186, Chicago, IL 60607-7059, [email protected]
ABSTRACT Extensive trenching of seven fault scarps on the Provo delta at Brigham City, Utah, and numerical dating have identified seven (possibly eight) paleoearthquakes on the Brigham City segment of the Wasatch fault zone (WFZ) since abandonment of the Provo delta surface about 16,000 to 17,000 calendar-calibrated years ago (16-17 cal ka). Mean paleoearthquake ages are 2,125 ± 104 (Event Z), 3,434 ± 142 (Event Y), 4,674 ± 108 (Event X), 5,970 ± 242 (Event W), 7,500 ± 350 (Event V), 8,518 ± 340 (Event U), (ca. 12 ca. ka), and 14,812 ± 1,300 (Event T) calendar-calibrated years before present (cal yr BP). The recurrence intervals between the mean age estimates of the latest six events (Events U through Z) range from 1,018 to 1,530 years, with a mean of 1,279 years and a standard deviation (sigma) of 164 years. In contrast, the interval between Events T and U appears to be 6,294 years. There is no stratigraphic evidence for an earthquake between Event T (which occurred while the delta surface was active) and Event U, but there is ambiguity in age estimates for the abandonment of the delta and deposition of an early Holocene loess. Because of this ambiguity, we cannot disprove that an additional faulting event (unlettered) caused burial of an early phase of the loess ca. 12 cal ka. The overall temporal pattern of large earthquakes since ca. 17 cal ka consists of one earthquake every 1.3 ky since 8.5 cal ka, with much longer recurrence times or even a long seismic gap between 8.5 cal ka and 17.2 cal ka. These longer latest Pleistocene-early Holocene
recurrence times may have been influenced by changes in the crustal stress regime associated with desiccation of Lake Bonneville. It appears that the couplet-gap model proposed by Nishenko and Schwartz (1990) for the Brigham City segment is inappropriate. Recurrence since 8.5 cal ka has been a rather uniform 1.2-1.3 ky, similar to recurrence intervals from other segments of the WFZ (McCalpin and Nishenko, 1996). The standard deviation of recurrence since 8.5 cal ka is 13 percent of the mean value, which represents very periodic recurrence. The elapsed time of 2,125 years since the last earthquake is about 5 standard deviations larger than the mean recurrence of the latest five earthquakes. Because the elapsed time is so much larger than the mean recurrence, probability models that assume quasi-periodic recurrence (renewal models) predict fairly high probabilities for a M>7 earthquake on this segment in the next 100 years. In fact, the Brigham City segment has the highest probability for rupture in the next 100 years among the five central segments of the WFZ in each of the six renewal models chosen. We have insufficient information at this point to tell which renewal model best characterizes the long-term behavior of the Brigham City segment. The most robust probability value for a M>7 earthquake in the next 100 years is the average of the six renewal model probabilities, which equals 33 percent for the Brigham City segment. This probability is about twice as high as that of the next most likely segment to rupture, the Salt Lake City segment.

2 Utah Geological Survey
INTRODUCTION Location and Previous Work
The project area is directly east of Brigham City, Utah (figures 1,2). Personius (1988, 1990) mapped the surficial geology of this area at a scale of 1:10,000 and identified the fault scarps that we trenched in this study. Personius (1991) also described two trench excavations across the Brigham City segment of the Wasatch fault zone (WFZ), the Bowden Canyon site 1 kilometer north of our trench sites, and the Pole Patch site near the southern segment boundary. In the Bowden Canyon trench, two paleoearthquakes were dated at 3.6±0.5 cal ka (cal ka = 1,000 calendar-calibrated years before present) and 4.7±0.5 cal ka, with a third paleoearthquake inferred between 5 cal ka and 7 cal ka. At the Pole Patch site, only one event was dated at 4.6±0.5 cal ka.
0 25 kilometers
41 55’
41 00’
40 45’
112 00’ 111 45’
Collinston
Honeyville
Brigham City
North Ogden
Ogden
Bountiful
Salt Lake City
WEBER
FAULTSEGMENTS
BRIGHAMCITY
COLLINSTON
THIS STUDYW
ELLSVILLE MO
UNTAINSW
ASATCH RANG
E
Figure 1. Map of the study area. Trace of the Wasatch fault zone is a thick black line. Segment definitions are after Personius, 1990.
Scope of This Study This study seeks to lengthen the paleoseismic chronology for the Brigham City segment of the WFZ beyond the 6 cal ka record reconstructed by Personius (1991). There are several compelling reasons to do this. First, the pattern of paleoearthquake recurrence deduced by Personius (1991) is the most irregular of all the central segments of the WFZ (Machette and others, 1992). According to Personius, the two most recent paleoearthquakes are separated by only 1,100 years, yet it has been 3,600 ky since the latest paleoearthquake. The Brigham City segment would thus be the only segment of the WFZ in which the elapsed time is much longer than the mean recurrence interval. Several authors (Nishenko and Schwartz, 1990; Machette and others, 1992) have used this pattern to suggest that the next major earthquake on the WFZ may occur on the Brigham City segment. However, the anomalous recurrence pattern may also be an artifact of insufficient paleoseismic data. The data may be insufficient for two reasons: (1) failure to identify all the paleoearthquakes in the past 6 cal ka at Personius’ two trench sites, and (2) too short a period of observation compared to a longer complex seismic cycle. For the first reason, it should be noted that Personius’ (1991) Bowden Canyon trench did not intersect a second parallel fault scarp upslope of the larger scarp that he did trench. Therefore, one or more paleoearthquakes in the past 6 cal ka may have gone undetected there. Second, the Bowden Canyon trench, like most trenches on the WFZ (Machette and others, 1992) was situated on a mid-Holocene alluvial-fan, which limits the length of the paleoearthquake chronology preserved. Nishenko and Schwartz (1990) suggested, based on Personius’ data, that the Brigham City segment typically ruptures in two closely spaced events (couplets) separated by a longer time interval. This conclusion was based on a single couplet (3.6 cal ka and 4.7 cal ka) and a single longer time interval (3.6 cal ka to present). As McCalpin and Nishenko (1996) later demonstrated, such couplets and gaps will inevitably appear in a time series when recurrence is quasi-periodic (e.g., there is variation about the mean recurrence value). Our reasoning in this study is that, if a bimodal recurrence pattern of earthquake couplets and gaps between earthquakes is typical of the Brigham City segment, this pattern should be repeated in the past ca.

Paleoearthquakes, Brigham City Segment 3
Bonneville shoreline
Provo shoreline
Brigham City
BoxElderCreek
Figure 4
Figure 2. Aerial view of the Provo delta at Brigham City, looking east; from Smith and Jol (1995). Long dashes outline the main Provo delta deposit, short dashes outline subdeltas. Major fault scarps are solid lines with bar and ball on downthrown side. Black rectangle shows area of figure 4.. 16 cal ka. The goal of this study is therefore to reconstruct the chronology of all large paleoearthquakes that have ruptured the surface at this site from ca. 16 cal ka (age of the Provo shoreline of the Bonneville lake cycle) to present. Fault scarps on Provo deltas throughout the WFZ are typically 15-20 meters high and displacements in Holocene faulting events average about 2 meters (Machette and others, 1992). Therefore, as many as seven to 10 paleoearthquakes may have occurred since 16 cal ka, of which Personius (1990) dated only two late Holocene events. Examination of the entire post-Provo paleoseismic history would then test if the earthquake couplet-gap pattern had persisted throughout post-Bonneville time, and whether the 3.6-4.7 cal ka couplet is typical, or merely the result of quasi-periodic recurrence. If couplets and gaps are typical and we are currently in a “gap,” we need to know the typical duration of gaps in the Holocene, so we can determine our position within the current seismic cycle.
Conversely, if recurrence is quasi-periodic during the Holocene, we need to define the mean and standard deviation of recurrence so we can compare them to the elapsed time, cited by Personius (1991) as 3.6 cal ka.
Methods We excavated our trenches using a track-mounted backhoe and then logged at a scale of 1:30 using standard manual techniques (McCalpin, 1996). Below we describe geochronology methods. Radiocarbon Dating Our approach to radiocarbon dating was dictated by the scarcity of organic carbon that is typical of coarse-grained deltaic deposits along the Wasatch Front. Due to the general aridity of the site, and the free-draining nature of the deltaic gravels, surface vegetation is sparse and consists of tall grasses and sagebrush (Artemesia sp.). Such vegetation does not support a thick or organic-rich A horizon. Thus, all radiocarbon samples (except

4 Utah Geological Survey
one) were bulk, low-carbon-content soil A horizons developed on gravelly colluvium derived from deltaic gravels. The <63 micron fraction was separated by wet sieving, then doused with HCl, and finally rinsed to neutrality. This treatment removed modern rootlets and microfauna that may have post-dated the burial of the soil. No NaOH treatment was used. Samples were dated by conventional beta counting techniques. We converted radiocarbon ages to calendar years after the method of Machette and others (1992, appendix A). The carbon age span (CAS) of the samples was first estimated based on an average 200 years for a typical 10 centimeter-thick soil sample. Thicker or thinner samples were scaled proportionally. The CALIB computer calibration program of Stuiver and Reimer (1993) was then used to convert radiocarbon ages to calendar years. Input used was the 20-year atmospheric calibration curve and sample age span assumed equal to CAS. The resulting calendar age was then altered by the mean residence correction (MRC), which estimates the 14C age of the soil when it was initially buried by colluvium. To calculate the age of A horizon upper contacts (UHC) buried by an overlying deposit, the MRC is subtracted from the calendar age. Thus, an A horizon that had an MRC of 200 years when it was buried, and today yields a calibrated age of 1,000 years, must have been buried 800 years ago. For lower horizon contacts (LHC) the correction is more complicated. Typically we use A horizon LHCs to date the beginning of deposition of the colluvium on which the A horizon is developed, rather than the beginning of deposition of colluvium that buries the A horizon. Therefore we are trying to estimate the age of the base of the colluvial deposit on which the A horizon later developed. This stratigraphic contact is typically many decimeters below the dated sample. Therefore, in these cases we added the MRC to the calendar age of the soil sample. There is no rigorous justification for this addition, except that we know the base of a colluvium must be older (probably considerably older) than the age of the oldest carbon in the A horizon that later developed on the colluvium. All ages are reported in table 1. Thermoluminescence Dating Thermoluminescence (TL) dating was a relatively new dating technique at the time of this investigation (1992-93), and had been applied to few previous paleoseismic studies (Forman and others, 1989, 1991). Sediment that receives prolonged light exposure prior to deposition, for example loess and A horizons of soils, are particularly suitable for TL dating. Exposure of
mineral grains to ionizing radiation after burial causes mineral lattice damage that results in luminescence upon heating. We isolated the 4-11 micron (silt) fraction for TL analyses following the procedures outlined in Forman and others (1989, 1991). We analyzed all samples by the total- and partial-bleach techniques, assuming a mean water content of 15±5 percent; results are in table 2. In addition we performed infrared stimulated luminescence (IRSL) analyses (Forman, 1999) on two sediment samples (BC93TL1 and TL2), which yielded ages concordant with TL analyses (table 2). For a broader overview of TL and IRSL dating applied to Quaternary deposits, the reader is referred to Forman (1999) and Forman and others (2000). Quantitative Analysis of Soils We described soils using horizon nomenclature of the Soil Survey Staff (1990) and Birkeland (1999). The distinction between Bw and Cox is based on Munsell color, with the former being 7.5YR hue and the latter 10YR hue. Particle-size samples were sieved to determine gravel content and analyzed by the hydrometer method to determine sand, silt and clay content (Day, 1965; U.S. Soil Conservation Service, 1972). Bulk-density data are gravel-free values determined using the paraffin-clod method (Singer and Janitzky, 1986). Most soil clay may be derived from eolian dust, an important source of secondary clay in dry-climate soils (Birkeland and others, 1991). Even though the dust itself is a deposit, dust-derived accumulations of silt and clay, in soil profiles are widely regarded as pedogenic components because of their strong influence on soil genesis (e.g., Shroba, 1982, 1992; Muhs, 1983; McFadden and Weldon, 1987; McFadden, 1988; Reheis and others, 1989, 1995; Birkeland and others, 1991; Harden and others 1991). Accordingly, clay derived from eolian dust is herein considered pedogenic as well. Further details are given in McCalpin and Berry (1996).
Acknowledgments This study would not have been possible without the landowner permission kindly granted by Mrs. Irene Sanford, Sun Lakes, Arizona, acting on behalf of the Jensen Family Trust. Mr. Bruce Leonard, Brigham City Corporation, gave permission to dig trench 14 on City property south of the Provo delta. I also thank S.F. Personius (U.S. Geological Survey) and G.C. Christenson, K.M. Harty, and B. Black of the Utah Geological Survey (UGS) for reviewing the trenches. UGS also provided hydraulic trench shoring in 1992.

Paleoearthquakes, Brigham City Segment 5
Table1. Numerical ages from this study, listed by trench. Trench Lab. No.
(â, Beta Analytic)
Material1 Geologic Unit Laboratory Age (14C years BP or raw TL age estimate in ka)
CAS (yrs)2
Calibrated Age (cal yr BP)3
MRC4 Age of Soil Horizon Contact5
Remarks
T2 OTL-403 Av(b) Loess on slope colluvium
2.0±0.5 ka N/A N/A N/A 2.0±0.5 ka UHC Close max. age of MRE on Scarp D
T2 OTL-402 Av(b) Loess on deltaic gravels
7.5±1.0 ka N/A N/A N/A 7.5±1.0 ka UHC Close max. age of 3rd-to-last event on Scarp D
T3 â -59101 A(b) Scarp slope colluvium
3,160±100 200 3404 (-265/+215) 200 MRCL 3,604±270 LHC Min. age, not close, of MRE on main fault, Scarp G
T3 OTL-405 Av(b) Loess on slope colluvium
8.5±1.5 ka N/A N/A N/A 8.5±1.5 ka UHC Close max. age of earliest event on main fault, Scarp G
T5 â -54890 A (b) Scarp slope colluvium
3,430±60 200 3700 (-151/+169) 200 MRCU 3,500±170 UHC Close max. age of MRE on scarp G, N part
T6 OTL-421 Av (b) Loess under landslide debris
8.5±1 ka, total bleach; 12.0±1.5 ka, partial bleach
N/A N/A N/A 8.5±1 ka UHC Close max. age on landslide across Scarps F and G
T6 â -54889 charcoal Loess under landslide debris
13,010±460 N/A N/A N/A 13,010±460 Max. age of landslide across scarps F and G
T9 â -54891 A (b) Alluvial fan 3,120±70 300 3,359 (-190/+140) 200 MRCL 3,559±200 LHC Min. age of MRE on N part of Scarp A T10 â -68252 A (b) Alluvial fan 2,310±90 300 2,353 (-234/+216) 200 MRCL 2,553±240 LHC Min. age of MRE on N part of Scarp A T10 OTL-506 Wash
facies silt Unfaulted distal colluvium
5.0±1.0 ka N/A N/A N/A 5.0±1.0 ka Min. age of MRE
T12 â -68254 A Scarp-slope colluvium
1,720±90 200 1,632 (-202/+228) 200 MRCL 1,832±230 LHC Min. age of MRE on Scarp D
T12 â -68253 A (b) Scarp-slope colluvium
2,630±90 200 2,784 (-295/+135) 200 MRCU 2,584±300 UHC Close max. age on MRE ob Scarp D
T12 OTL-504 A (b) Scarp-slope colluvium
10.0±1.0 ka N/A N/A N/A 10.0±1.0 ka Close max. age of PE
T12 OTL-505 A (b) Scarp-slope colluvium
4.0±0.5 ka N/A N/A N/A 4.0±0.5 ka Close max. age of MRE
T13 â -68256 Organic matter
Crack fill 2,320±70 400 2,362 (-183/+137) 200 MRC 2,362±190 Close max. age of MRE on antithetic fault, scarps F and G
T13 â -68255 A (b) Scarp-slope colluvium
3,320±80 200 3,562 (-163/+197) 200 MRCU 3,362±200 UHC Close max. age of MRE on main scarp F and G
T13 OTL-503 A (b) loess 9.0±1.0 ka N/A N/A N/A 9.0±1.0 ka Close max. age of PE T14 â -68258 A (b) Scarp slope
colluvium 2,580±60 200 2,754 (-245/+65) 200 MRCU 2,554±250 UHC Close max. age of MRE on S part of Scarp A

6 Utah Geological Survey
T14 â-68257 A (b) Scarp slope colluvium
5,380±80 200 6,199 (-210/+150) 200 MRCU 5,999±210 UHC Close max. age of PE on S part of Scarp A
1 A= organic A horizon; Av= vesicular (non-organic) A horizon; (b)= buried horizon. 2 CAS= carbon age span within sample (inferred; see Machette and others, 1992, and appendix A). 3 Using the CALIB computer program of Stuiver and Reimer, 1993, with: 20-year atmospheric calibration data set, carbon time span= CAS 4 MRC= mean residence time correction (see Machette and others, 1992, and appendix A). 5 For UHC (upper horizon contact), age= calibrated age minus MRC; for LHC (lower horizon contact), age= calibrated age plus MRC
MRE = most recent event; PE = penultimate event
Table 2. Luminescence data and age estimates. Field No. Lab No. Strat. Unit Equivalent Dose
Method1 Light Exposure2 Temperature (°C)3 Equivalent Dose (Gy) TL Age Estimate (ka)4
TL-total bleach 16 h sun 240-390 7.7±0.6 2.0±0.5 F92-U1B OTL403 Loess on slope colluvium
TL-partial bleach 1 h sun 240-330 8.47±0.8 2.0±0.5
F92-U3 OTL402 Loess on deltaic gravels
TL-total bleach 16 h sun 250-400 20.7±1.5 7.5±1.0
F92-U5 OTL405 Loessial colluvium TL-total bleach 16 h sun 290-440 35.0±6.1 8.5±1.5 TL-total bleach 16 h sun 290-350 40.6±2.4 8.5±1.0 F92-U8 OTL421 Buried Av
TL-partial bleach 1 h sun 290-350 57.4±6.6 12.0±1.5
TL-total bleach 16 h sun 270-400 32.6±4.2 12.0±1.5 BC93TL1 OTL503 Distal colluvium
IRSL N/A 270-400 22.3±1.0 9.0±1.0
TL-total bleach 16 h sun 250-400 25.4±2.5 10.0±1.0 BC93TL2 OTL504 Buried loess-enriched Bw horizon
IRSL N/A 250-400 25.2±1.0 11.0±1.0
BC93TL3 OTL505 Buried A horizon on proximal colluvium
TL-total bleach 16 h sun 270-400 12.4±0.5 4.0±0.5
BC93TL4 OTL506 Distal colluvium TL-total bleach 16 h sun 250-400 16.3±3.2 5.0±1.0
1 All thermoluminescence (TL) measurements were made with a 5-58 filter (blue wavelengths) and HA-s filters in front of the photomultiplier tube. Samples were preheated to 124oC for 2 days prior to analysis. 2 Hours or minutes of light exposure to define residual level. “Sun” is natural sunlight in Columbus, Ohio. 3 Temperature range used to calculate equivalent dose. 4 All errors are at one sigma and calculated by averaging the errors across the temperature range.

Paleoearthquakes, Brigham City Segment 7
Dr. M.E. Berry (consultant, Evergreen, CO) described and sampled soil profiles at trenches 1 and 3. The trenching crew included D. Wilder, T. Burke, G. Warren, C. Brown, D. Moos, D. Rasmussen, and L.C.A. Jones (all Utah State University). D.L. Fiesinger (Utah State University) and H. Doelling (Utah Geological Survey) provided additional funds for radiocarbon dating. Pete Magee (San Luis Valley GPS/GIS Authority) scanned the original trench logs at 1:20 scale and Dan Haynes (Crestone, CO) and the senior author vectorized the scans in heads-up mode. The manuscript benefited from a thorough review by Bill Lund (UGS). GEOLOGIC AND GEOMORPHIC SETTING
OF THE TRENCH SITE The study area is the gently sloping surface of the Provo delta at the mouth of Box Elder Creek (figures 3, 4; table 3). This delta was deposited after Lake Bonneville fell from the Bonneville highstand shoreline (ca. 5,200 ft elevation here) to the Provo level (4,840 ft elevation here), which the lake occupied from ca. 14,000-14,500 14C yr BP (Oviatt, 1997). This age range is equivalent to a dendrochronologically calibrated (or calendar) year mean range of 17,125 to 17,618 cal yr BP. (Oviatt, pers. comm., 2001). Thus, Lake Bonneville occupied the Provo shoreline for about 1,000 years, during which time this 120-meter-thick, gravelly, Gilbert-type delta accumulated (Gilbert, 1890). Abandonment of the delta surface, due to lake level fall and attendant stream incision, began ca. 14,000 14C yr BP (16,561-17,.027 cal yr BP), and the lake reached the level of the present Great Salt Lake by ca. 11,000 14C yr BP (ca. 13,500 cal yr BP). As the shoreline fell below the Provo shoreline between 17 and 13.5 cal ka there were several stillstands, during which subdeltas formed from material eroded out of the Provo delta. Our excavations were <5 meters deep and exposed only the topset beds of the delta, composed of well-sorted, well-stratified pebble and small cobble gravel with a clean, friable matrix of medium to coarse sand. Roughly 90 percent of the clasts are derived from lower Paleozoic quartz sandstones, yielding a highly quartzose gravel composition (Smith and Jol, 1992). Fine-grained material is only found in the upper 10 to 40 centimeters of the deposit (typically loess), or in rare silt or clay beds in the deltaic sequence (lagoonal deposits?).
Figure 3. Geologic map of the central Brigham City segment, from Personius and Scott (1992). See table 3 for explanation of map units. Table 3. Map unit abbreviations used in figures 3 and 4. Abbreviation Age Deposit al1 late Holocene stream alluvium af1 late Holocene fan alluvium al2 early Holocene stream alluvium af2 early Holocene fan alluvium cls early Holocene-
late Pleistocene landslide
alp late Pleistocene topset beds of Provo delta
lpd late Pleistocene foreset beds of Provo delta
lpg late Pleistocene beach gravels at Provo shoreline
lbg late Pleistocene beach gravels at Bonneville shoreline

8 Utah Geological Survey
Figure 4. Map of fault scarps (thick lines with letters; bar and ball on downthrown side) on the Provo delta. Trenches (short, thick lines perpendicular to scarp) are numbered. Base map from Personius (1991), published scale 1:10,000.

Paleoearthquakes, Brigham City Segment 9
Personius (1990) mapped subdeltas with the same map units as the main delta surface, i.e., the topset beds underlying the broad delta surfaces were mapped as “stream alluvium” (map unit alp; figure 3) and the underlying foreset beds were mapped as “deltaic deposits related to Provo shoreline” (map unit lpd, figure 3). However, Personius (1990) did mark the risers between various subdelta levels with a hachure symbol (figure 3). One important subdelta for this study lies northwest of and 35 meters below the main Provo delta surface; its easternmost part contains three of our 14 trenches (trenches 4, 9, and 10; figure 3). The post-Provo history of our site is dominated by landsliding, incision of the deltas to progressively lower base levels, and deposition of Holocene alluvial-fans. Cross-cutting and superposition relations show that the southern parts of the landslide deposits (unit cls on figure 3) were clearly deposited atop the main Provo delta surface before incision to lower base levels, i.e., about 16-17 cal ka. This age is supported by a radiocarbon age of 14,812 ± 1,300 cal yr BP from a soil formed on Provo gravels and buried by the landslide, as exposed in trench 6. The smaller, isolated landslide outcrops farther north lie 10 to 25 meters below the main delta surface and are surrounded by older Holocene fan alluvium, so they may also represent the same 15-17 ka failure, or perhaps younger failures that were later buried by early- to mid-Holocene fans. However, we placed no trenches on these outcrops so their exact age is unknown. Landsliding was followed by deposition of “upper Pleistocene to middle Holocene alluvial fans” (Personius’ [1990] map unit af2; figure 3). We placed only a single trench in this map unit (trench 11) and it yielded no datable material, so we do not have exact age limits on this deposit, except that it postdates 15-17 cal ka and predates the younger Holocene fans, described next. The youngest deposit mapped by Personius (1990) at the site is “upper Holocene” fan alluvium (Personius’ [1990] map unit af1, figure 3). Our trenches 9 and 10 penetrated through this unit and yielded basal ages of 2,553 ± 240 cal yr BP and 3,559 ± 200 cal yr BP. Thus, these fans began to accumulate ca. 3.6 cal ka and continue to receive sediment from modern floods and debris flows. On the southern side of Box Elder Creek a small part of the Provo delta is preserved, and the WFZ is expressed as a single, 22-meter-high, west-facing fault scarp (figure 5). The remainder of the Provo delta is
north of Box Elder Creek, and displays a gently west-tilted surface roughly 0.5 kilometer in diameter, displaced by seven sub-parallel fault scarps ranging from 1 to 9 meters high (figure 4). Maximum scarp slope angles range from 30 to 33 degrees. Cumulative down-to-the-west throw across the 300-meter-wide fault swarm is about 20 meters. This swarm of fault scarps was our trenching target. The 300-meter-wide zone of fault scarps is somewhat anomalous compared to the rest of the WFZ in the Brigham City segment, which consists of either a single fault scarp, or 2 to 3 fault scarps less than 250 meters apart. Cluff and others (1974) concluded that the scarps were all part of a landslide (figure 6), presumably a complex zone of headscarps, although they did not identify where the flanks or the toe of the landslide might be. We prefer a tectonic rather than landslide origin for the scarps for the following reasons. First, the scarps do not curve as landslide headscarps typically do, but diverge northward in a fan-shaped pattern. Second, there is no visible toe or lateral margins for a landslide. Third, Scarps A, F, and G continue north of the Provo delta to lower terrain, so they cannot have been formed by gravitational failure of the delta. Fourth, the stratigraphy of the delta is not conducive to landsliding. As shown by the gravel pits, the upper 60 meters of the delta are composed of gravelly foreset beds. Where landsliding occurs in Provo deltas elsewhere along the WFZ, it is associated with the contact of permeable Provo gravels overlying impermeable Bonneville-age silts and clays, and the presence of a perched water table. That stratigraphic contact is not exposed by incision of Box Elder Creek into the Provo delta, so the stratigraphic conditions for landsliding are absent The anomalous width of the fault zone is probably the result of bedrock faults propagating up through the anomalously thick delta of Box Elder Creek and refracting to slightly different angles. Alternatively, the zone of bedrock faults beneath the delta may be anomalously wide here, due to the abrupt 50 degree change in strike of the WFZ at Brigham City (figure 1). To reconstruct the most detailed paleoseismic history for the swarm of fault scarps, requires trenching every fault scarp, because each paleoearthquake may have ruptured only one of the seven scarps. Most paleoearthquakes likely ruptured more than one fault scarp. Therefore, to capture the most comprehensive paleoearthquake record, we trenched all identified scarps.

10 Utah Geological Survey
Figure 5. Photograph of 21-meter-high scarp across Provo delta on south side of Box Elder Creek, looking south from across Box Elder Creek. The scarp is directly above the deep gully in shadow at center; the gully is probably eroding along the fault plane.
Even with trenching of all identified scarps, some data gaps remain. The seven north-trending scarps (figure 4) were lettered from A (on the west) to G (on the east). The central part of Scarp A, and all of Scarp B, clearly visible on 1980 aerial photographs, had been removed by commercial gravel pit excavations by the beginning of this study (summer of 1992). We excavated five trenches on other parts of Scarp A, so most if not all events on this strand were hopefully identified. No trenches could be placed on Scarp B due to its complete destruction. It is hoped that all paleoearthquakes that ruptured Scarp B also ruptured Scarp A, with which Scarp B merges to the north and south. We trenched all
other scarps (C through G). Fault scarps A to G displace both Provo delta gravels (map units lpd, alp, figures 3, 4), and other younger deposits. Scarps A and G displace a post-Provo landslide deposit (map unit cls) and older alluvial fans (map unit af2). All other scarps are restricted to the Provo delta and do not extend across younger deposits. Based strictly on these geometric relations, it might be expected that Scarps C through F predate the landslide and alluvial-fan deposits and record the earlier paleoearthquakes here, whereas Scarps A, B (?), and G record the later Holocene paleoearthquakes. However, numerical ages from the trenches show this is not the case.

Paleoearthquakes, Brigham City Segment 11
Figure 6. Low-sun-angle aerial photograph of the Wasatch Front at the mouth of Box Elder Creek. The arrow points to Scarp G; other scarps can be seen farther west, including Scarp A, the center of which had been destroyed by 1992. The original caption of the photograph states “This Low-Sun-Angle aerial photograph shows large-scale landsliding with faulting east of Brigham City. The area of landsliding is indicated by the arrow; landslide scarps cast linear shadows that show as dark lines on the photograph.” From Cluff and others (1974).

12 Utah Geological Survey
TRENCHES We excavated trenches during three separate field campaigns and number the trenches chronologically on figure 4. In the first campaign (June 1992) we excavated trenches 1-6, but little organic material was encountered for radiocarbon dating. Consequently, trenches 7-9 were excavated in August 1992, and some organics were found. However, radiocarbon age control from trenches 1-9 was insufficient to correlate events among the trenches. In June of 1993 we excavated trenches 11-14 and deepened trench 1. In the following sections we describe the trenches across each of the seven scarps, beginning with Scarp A.
Scarp A, Northern Part
We trenched Scarp A at its northern end (trenches 4, 9, 10, 11) and at its southern end (trench 14). The middle section of Scarp A had been removed by gravel mining.
Trench 4 Trench 4 was excavated across a prominent 9 meter-high scarp that displaces a of Provo-age subdelta surface (map unit alp) that lies north of, and 30 meters below, the main aggradational delta surface (figure 7). The downthrown block at this location is strongly tilted east, which is not true of scarps on the Provo delta surface itself. The gravels underlying the “alp” surface were deposited from the southwest to the northeast, as indicated by cross-bedding in the trench (figure 8). This eastward progradation is opposite to the general westward progradation of the delta and suggests that a local (tectonic?) depression existed in this area when the Provo shoreline was occupied at 4,600 feet. Waves then swept gravel eastward into the depression and banked the gravel up against a preexisting fault scarp. Later fault movement rejuvenated the scarp and caused the eastward tilting of the downthrown block. We found no datable material in trench 4, so the following description is brief. The faulted “alp” deposit is an extremely well sorted, cohesionless, very coarse sand that would not support vertical trench sidewalls more than about 1 meter high. This extreme ravelling behavior explains why the trench was so shallow. Each time we attempted to dig the trench deeper 1 meter, the lower parts of the trench walls that were unaffected by soil formation (i.e., totally cohesionless) failed immediately to the angle of repose and filled the trench bottom. Given this behavior, we decided it was better to map the precarious 1 meter-high subvertical walls, than to try to deepen the trench and lose all mappable trench walls.
Figure 7. Photograph of the east-tilted subdelta surface and northernmost part of Scarp A, looking north. Spoil piles are from trenches 4 (background) and 9 (foreground); trench 10 has not been dug yet. From Smith and Jol (1995). There are at least 12 fault zones more or less evenly spaced throughout the length of the trench, but none have vertical displacements of more than 1 meter (figure 8). The easternmost fault is beneath the scarp crest and the westernmost fault is beyond the scarp toe. We infer that this scarp was created by coseismic small-displacement faulting on many strands, and that the weak free faces in cohesionless sand failed to the angle of repose during earthquake shaking. Thus, no free faces survived from which to shed even small colluvial wedges. The pattern of distributed, small-displacement faulting here contrasts sharply with the pattern observed in the other 13 trenches, where the faulted deposits were coarser gravels and possessed more cohesion. We surmise that distributed faulting here was a surficial response to the cohesionless nature of the surface sediments. The thin colluvium that drapes the entire scarp surface carries a textural B horizon, indicating at least a mid-Holocene age, and is not obviously displaced. Therefore, we initially inferred that neither the 3.6 ka or 4.7 ka paleoearthquakes dated by Personius (1991) 1 kilometer to the north ruptured Scarp A. However, given the distributed nature of faulting here, it is possible that some centimeter-scale displacements could have occurred without disturbing the surface soil enough to be recognized today. For example, during the 1992 field review Mike Lowe (personal communication, 1993, Utah Geological Survey) pointed out faint zones of aligned, subvertical clasts in the colluvium over the projection of faults in the underlying deltaic gravels. Thus, the parent material of the colluvium may have been sheared, but the soil horizons developed on the

Paleoearthquakes, Brigham City Segment 13
Figure 8. Log of trench 4, Scarp A. Double-ended arrows are match lines. Five major faults divide the trench into two grabens and two horsts. The horsts expose the oldest beds (units 1-4), composed of Provo deltaic gravels and sands. Parts of unit 5 resemble deltaic deposits, but beneath the toe of the scarp unit 5 resembles colluvium, so it is probably younger than the deltaic subunits of unit 5. The entire scarp is mantled by two thick colluvial deposits (units 6 and 8) which were clearly derived from the underlying deltaic gravels and sands. The top of unit 6 is displaced down-to-the-west by at least 2.5 m. Unit 8 is also faulted, but its irregular geometry makes it difficult to measure cumulative displacement. The thickest parts of unit 8 are in the two grabens, and unit 6 may have a similar geometry, but its base could not be exposed due to caving of trench walls. The moderately strong AB/Bt soil developed on units 8 and 9 is not clearly displaced, because horizon boundaries are not truncated. However, the soil parent material (unit 8) is clearly displaced, and some shears may extend up into unit 9, based on zones of aligned clasts.

14 Utah Geological Survey
colluvium are not displaced. This geometry indicates that the shearing predates the development of the moderately strong (early-mid Holocene) soil on the colluvium. Based on the continuity of the soil across the scarp, we can say with some confidence that no meter-scale displacements of late-Holocene age have occurred at this trench. Trench 9 We excavated trench 9 (figure 9) about 50 meters south of trench 4, across a late Holocene alluvial fan (map unit af1 on figures 3, 4) where Scarp A was projected under the fan. The purpose of this trench was to encounter faulted deltaic gravels under unfaulted alluvial-fan sediments, and perhaps to obtain a minimum limiting age on the latest faulting from the basal unfaulted fan sediments. The 3-meter-deep trench did penetrate through the alluvial fan, but no faults could be observed in the underlying deltaic gravels. Obviously, the broad fault zone encountered in trench 4 must have changed strike such that our projection was erroneous, and our relatively short trench missed the fault. However, the late Holocene alluvial-fan is broad enough that the southern extension of Scarp A must pass beneath it somewhere.
Figure 9. Log of central part of trench 9, projection of Scarp A. No faults were exposed in the ca. 30 meter-long trench, so we only logged the central 9 meters to record the general stratigraphic succession. The basal part of the Holocene alluvial-fan deposit in trench 9 yielded a radiocarbon age of 3,559 ± 200 cal yr BP (table 1). Because this fan surface is not faulted on
the projection of Scarp A, it appears that the 3.6 ka event of Personius (1991) did not rupture this fault strand. The trench exposure does not preclude any older ruptures, such as his 4.7 ka event, from having occurred on Scarp A, but as described in the previous section on trench 4, such displacements would have to be small (centimeter-scale). Trench 10 We excavated trench 10 halfway between trenches 4 and 9 (figure 10), in an attempt to locate (again) the Scarp A fault strand beneath the alluvial-fan. At this distal location on the Holocene fan, only the toe of the fault scarp was covered by Holocene fan deposits; the scarp face and upthrown block were developed in post-Provo subdelta deposits (map unit alp). We dug this trench because we suspected a wide zone of faulting lay under the scarp and that fan deposits overlying the faults should contain datable material. The oldest deposit exposed in the trench (figure 11) was crossbedded, well-sorted gravels laid down as topset beds of the Provo subdelta (figure 11). These gravels (unit 1a) probably correlate with the “middle radar facies” of Smith and Jol (1995), described later. The gravels clearly represent a littoral bar that was prograding east, perhaps into a depression caused by eastward tilting along fault strands, such as affects the ground surface today.
Figure 10. Photograph of Scarp A, looking south from the subdelta surface. The disturbed area in middle ground is the site of backfilled trench 4. Spoil piles for trenches 10 (right middle ground) and 11 (center, distance) are visible. Directly behind trench 11 are the unvegetated spoil banks from the active gravel quarry.

Paleoearthquakes, Brigham City Segment 15
Figure 11. Log of trench 10. Double-arrow lines are match lines
16 Utah Geological Survey
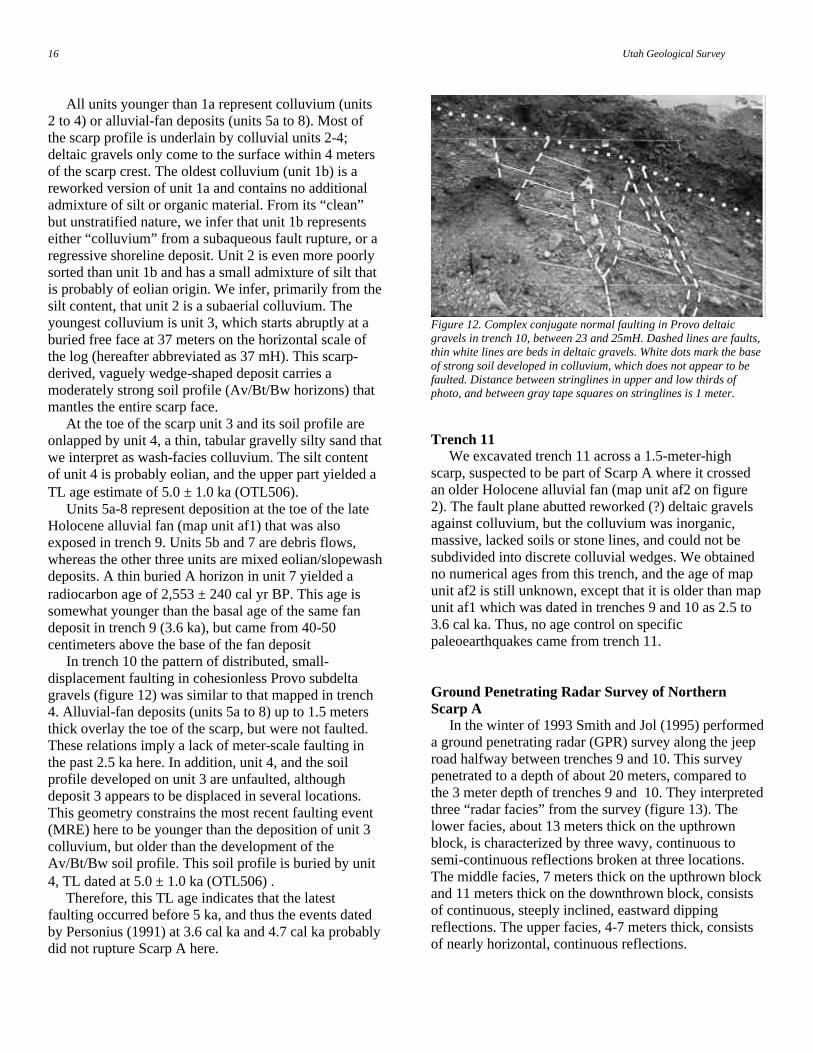
All units younger than 1a represent colluvium (units 2 to 4) or alluvial-fan deposits (units 5a to 8). Most of the scarp profile is underlain by colluvial units 2-4; deltaic gravels only come to the surface within 4 meters of the scarp crest. The oldest colluvium (unit 1b) is a reworked version of unit 1a and contains no additional admixture of silt or organic material. From its “clean” but unstratified nature, we infer that unit 1b represents either “colluvium” from a subaqueous fault rupture, or a regressive shoreline deposit. Unit 2 is even more poorly sorted than unit 1b and has a small admixture of silt that is probably of eolian origin. We infer, primarily from the silt content, that unit 2 is a subaerial colluvium. The youngest colluvium is unit 3, which starts abruptly at a buried free face at 37 meters on the horizontal scale of the log (hereafter abbreviated as 37 mH). This scarp-derived, vaguely wedge-shaped deposit carries a moderately strong soil profile (Av/Bt/Bw horizons) that mantles the entire scarp face. At the toe of the scarp unit 3 and its soil profile are onlapped by unit 4, a thin, tabular gravelly silty sand that we interpret as wash-facies colluvium. The silt content of unit 4 is probably eolian, and the upper part yielded a TL age estimate of 5.0 ± 1.0 ka (OTL506). Units 5a-8 represent deposition at the toe of the late Holocene alluvial fan (map unit af1) that was also exposed in trench 9. Units 5b and 7 are debris flows, whereas the other three units are mixed eolian/slopewash deposits. A thin buried A horizon in unit 7 yielded a radiocarbon age of 2,553 ± 240 cal yr BP. This age is somewhat younger than the basal age of the same fan deposit in trench 9 (3.6 ka), but came from 40-50 centimeters above the base of the fan deposit In trench 10 the pattern of distributed, small-displacement faulting in cohesionless Provo subdelta gravels (figure 12) was similar to that mapped in trench 4. Alluvial-fan deposits (units 5a to 8) up to 1.5 meters thick overlay the toe of the scarp, but were not faulted. These relations imply a lack of meter-scale faulting in the past 2.5 ka here. In addition, unit 4, and the soil profile developed on unit 3 are unfaulted, although deposit 3 appears to be displaced in several locations. This geometry constrains the most recent faulting event (MRE) here to be younger than the deposition of unit 3 colluvium, but older than the development of the Av/Bt/Bw soil profile. This soil profile is buried by unit 4, TL dated at 5.0 ± 1.0 ka (OTL506) . Therefore, this TL age indicates that the latest faulting occurred before 5 ka, and thus the events dated by Personius (1991) at 3.6 cal ka and 4.7 cal ka probably did not rupture Scarp A here.
Figure 12. Complex conjugate normal faulting in Provo deltaic gravels in trench 10, between 23 and 25mH. Dashed lines are faults, thin white lines are beds in deltaic gravels. White dots mark the base of strong soil developed in colluvium, which does not appear to be faulted. Distance between stringlines in upper and low thirds of photo, and between gray tape squares on stringlines is 1 meter.
Trench 11 We excavated trench 11 across a 1.5-meter-high scarp, suspected to be part of Scarp A where it crossed an older Holocene alluvial fan (map unit af2 on figure 2). The fault plane abutted reworked (?) deltaic gravels against colluvium, but the colluvium was inorganic, massive, lacked soils or stone lines, and could not be subdivided into discrete colluvial wedges. We obtained no numerical ages from this trench, and the age of map unit af2 is still unknown, except that it is older than map unit af1 which was dated in trenches 9 and 10 as 2.5 to 3.6 cal ka. Thus, no age control on specific paleoearthquakes came from trench 11. Ground Penetrating Radar Survey of Northern Scarp A In the winter of 1993 Smith and Jol (1995) performed a ground penetrating radar (GPR) survey along the jeep road halfway between trenches 9 and 10. This survey penetrated to a depth of about 20 meters, compared to the 3 meter depth of trenches 9 and 10. They interpreted three “radar facies” from the survey (figure 13). The lower facies, about 13 meters thick on the upthrown block, is characterized by three wavy, continuous to semi-continuous reflections broken at three locations. The middle facies, 7 meters thick on the upthrown block and 11 meters thick on the downthrown block, consists of continuous, steeply inclined, eastward dipping reflections. The upper facies, 4-7 meters thick, consists of nearly horizontal, continuous reflections.

Paleoearthquakes, Brigham City Segment 17
Figure 13. Comparison of trench 10 (outline at top center) with GPR profile. Horizontal and vertical scales are in meters. From Smith and Jol (1995). Smith and Jol (1995) interpreted the lower facies as pre-Provo alluvial-fan deposits. They interpreted the middle facies as cross-bedded gravels that prograded eastward through the area when the Provo shoreline was occupied. They interpreted the upper facies as recent “slopewash material.” Although these interpretations are reasonable, trenches 4, 9 and 10 reveal that the upper radar facies is composed of at least four types of deposits. On the upthrown block the 2.5- to 4-meter-thick upper radar facies must represent the 2-meter-thick, later Holocene alluvial-fan deposit exposed in trenches 9 and 10 (and dated at 2.5 to 3.6 cal ka), plus the uppermost 0.5 to 1.5 meters of horizontally stratified deltaic sands and gravels exposed in trenches 4, 9, and 10. The thickened part of the upper radar facies beneath the lower scarp face (7 meters thick in figure 13) contains several reflectors that lap up against the buried scarp face, and presumably represents scarp-derived colluvium, and/or alluvium/sag-pond deposits that accumulated in the topographic low created by eastward tilting of the hanging wall. The top of the strongly cross-bedded middle radar facies lies 2.5 to 7 meters beneath the ground surface, so should just barely have been exposed in our trenches, which ranged from 1.5 to 3 meters deep. Two small deposits of deltaic gravel display east-dipping cross-beds at the base of trench 4 (units 2a, 5a); these beds are only exposed in a horst between 8-24mH on the trench log
(figure 7), and are probably the uppermost part of the middle radar facies. The lower radar facies was not exposed in our trenches, so we cannot confirm Smith and Jol’s (1995) inference that it is pre-Provo alluvial-fan deposits. However, we note that at most locations along the Wasatch Front, Provo-age littoral gravels at the mouth of major canyons are typically underlain by some thickness of horizontally stratified, deep-water silts and clays deposited when Lake Bonneville stood at the Bonneville shoreline. These deep-water deposits can be 10 meters or more thick, and are in turn underlain by pre-Bonneville alluvium. The most important feature shown by the GPR profile is the abrupt 7 to 8 meter vertical separation of the top and bottom of the middle radar facies in the center of the profile. The top of the middle facies rises 7 meters along a degraded, buried scarp, whereas the bottom of the middle facies is abruptly displaced by the same amount. This geometry indicates that the upper half of the middle facies was exposed in subaerial (or subaqeous) free faces and eroded back, whereas the lower half was never exposed by faulting. The 7-8 meters displacement of Provo gravels is much greater than the cumulative throw of 2.5 meters exposed in trench 4, as measured on the top of a younger colluvium (unit 6). Clearly our four trenches on the northern part of Scarp A were too shallow to expose the full history of

18 Utah Geological Survey
post-Provo faulting on this fault strand. This limitation was partly caused by the caving nature of the cohesionless sediments, which limited trench depth. However, the GPR survey indicates that much deeper trenching, beyond the conventional 2 to 3 meters depth, is needed to uncover a fuller paleoseismic history of an 8 meter-high scarp. A possible rule of thumb should be to excavate a paleoseismic trench as deep as the scarp height; in the case of trench 4, this would require an 8 meter cut. However, even an 8 meter trench would not have exposed the 7-8 meter displacement of the Provo cross-bedded gravels, the base of which lay 15 meters below the ground surface in the center of Scarp A. Thus, to expose the stratigraphy shown in the GPR profile requires a trench 15 to 20 meters deep, and such an excavation is not feasible in cohesionless gravels and sands. We learned several lessons from the GPR survey. First, the displacement record on a scarp in a zone of active littoral deposition may require a trench >200 percent as deep as the scarp is high, not merely 100 percent. This “extra” depth is required because of the thickness of individual strata near Lake Bonneville shorelines (e.g., >10 meters for the cross-bedded gravels) and the tendency of littoral and later deposition to fill up tectonic depressions along the fault, further thickening strata near the fault. Second, geophysics is a critical tool for reconstructing the post-Provo or post-Bonneville faulting history on the WFZ. Third, to maximize knowledge gained from trench studies, geophysics should always precede trenching, not follow it.
Scarp A, Southern Part Trench 14 We excavated trench 14 (figures 14, 15) across a 2.5-meter-high scarp that displaces a post-Provo stream terrace directly north of the active floodplain of Box Elder Creek (figure 2). The small size of this scarp, plus the fact that none of the other six fault strands displace this terrace, suggests that the terrace is mid-Holocene and records only the latest few paleoearthquakes. Personius (1988) shows this scarp connecting with the westernmost scarp (Scarp A) on the delta surface obliquely uphill across the delta sideslope. This connection is probably conjectural, because no traces of a scarp exist on the angle-of-repose delta sideslope. An alternative geometry would connect the scarp at trench 14 to scarps D through G on the delta surface.
Figure 14. Photograph of the central part of trench 14. Arrows show the main normal fault, which abuts light-toned gravelly deltaic deposits of unit 1 (left) against dark-toned clast-poor colluvium of units 3 and 4 (right). The lowest dark-toned deposits on the hanging wall are post-Provo terrace alluvium (unit 2). The oldest beds exposed in the trench are deltaic gravels of probable Provo age (unit 1, figure 15). Unconformably overlying the deltaic gravels is a 1 meter-thick section of moderately well-imbricated stream terrace gravel (unit 2). This gravel is clearly eroded into the top of the deltaic gravels and maintains a uniform thickness across the fault zone. This geometry indicates that the gravel is a lag on top of a strath terrace cut into the deltaic gravels. The terrace gravel has a moderately developed soil profile (AB/Bw horizons) on the downthrown block, which is buried by two colluvial wedges. On the upthrown block, the relict soil on unit 2 is better developed (AB/Bt/Bw), because it developed continuously up to the present. The lower of the two colluvial wedges (unit 3) has a classic tapering wedge shape and reaches a thickness of 1.1 meters on its proximal side. The proximal side is clearly faulted against unit 1a, or it abuts a tension fissure filled with unit 4 colluvium. Only an incipient soil (Ab horizon) is developed atop unit 3, which we interpret as the scarp-derived colluvial wedge of the penultimate event (PE). The upper colluvial wedge (unit 4) is much smaller than unit 3, and is in depositional contact with footwall deltaic strata. A deep tension fissure underlies the proximal part of the wedge.

Paleoearthquakes, Brigham City Segment 19
Figure 15. Log of trench 14. Darker tones indicate older deposit age. Patterns indicate grain size of deposit, or soil horizons. In unit abbreviations, the leading number indicates the deposit, with lower-case letters indicating subunits of different grain size. Following capital and lower-case letters are soil horizon abbreviations. Thus, unit 4Av is a vesicular A horizon (Av) of the surface soil developed on deposit 4 (colluvial wedge of the MRE). Buried soils are indicated by “b1” or “b2” after the horizon abbreviation. Thus, unit 3Ab1 is the A horizon of the first buried soil (counting down from the surface) developed on deposit 3 (colluvial wedge of the penultimate event [PE]); unit 2ABb2 is the AB horizon of the second buried soil developed on deposit 2 (alluvial terrace gravel).The surface soil mantles the entire scarp and is thus developed on the youngest colluvium (unit 4) on the hanging wall, but on older deposits (unit 2) on the footwall. The two colluvial wedges (units 3 and 4) indicate that two faulting events produced this 2.8-meter-high scarp. The earlier event displaced units 1 and 2 and created the free face from which unit 3 was shed, about 6 cal ka (5,380 ± 80 14C yr BP. The later event faulted units 1, 2, and 3 and created the free face from which unit 4 was shed, about 2.5 cal ka (2,580 ± 60 14C yr BP). If colluvial wedge thickness is correlative to the height of the causative fault free face, then the earlier event may have had twice as much vertical displacement (ca. 1.8 meters) than the later event (ca. 1 meter). Secondary faults on the hanging wall displace units 1 and 2 but not unit 3, suggesting that these faults mainly moved during the earlier (larger displacement) event.

20 Utah Geological Survey
A radiocarbon age indicates that soil on the terrace gravel (buried soil 2) was buried by colluvium of the penultimate faulting event about 5,999 ± 210 cal yr BP (â-68257), which forms a close maximum age for the PE. The A horizon on the penultimate colluvium (unit 3) was buried sometime after 2,554 ± 250 cal yr BP by colluvium from the MRE. The actual burial date of the soil was younger than 2,554 cal yr BP, because the dated sample came from the bottom of the buried A horizon rather than the top. Thus, the MRE here was probably 200 to 300 years younger than 2,554 cal yr BP.
Scarp B Scarp B was almost entirely destroyed by the summer of 1992. The authors did locate a single exposure of scarp B faults at the top of the active quarry headwall, where a fault displaced deltaic gravels ca. 1.5 meters down-to-the-west. However, at least 1.5 to 2 meters of ground surface had been scraped off at this location, along with any colluvial wedges that might have existed. So no meaningful tectonic reconstruction was possible.
Scarp C Trench 1 We excavated trench 1 (figure 16) across 6 meter-high Scarp C and exposed a massive, single-event (?) colluvial wedge, but did not encounter a fault beneath the wedge (figure 17). We then hand-dug the trench bottom down an additional 1 meter below the upslope edge of the colluvial wedge, but still could not find a fault. In 1993 we brought the backhoe back to trench 1 and deepened the trench beneath the colluvial wedge by an additional 2 meters (figure 16). This deepened section (not shown on the trench log, figure 17) demonstrated that unit 3 could be traced laterally as a continuous, unfaulted layer beneath the scarp. We thus concluded that Scarp C was not a tectonic scarp, despite the fact that it paralleled the other tectonic scarps. The most likely origin for Scarp C is that of lateral erosion while the Provo delta topset beds were being deposited. The proximal part of the delta surface at that time would presumably have been subaerial, making it a fan delta. In this regard the scarp would be similar to (but older than) the four scarps (risers) that Personius (1990) mapped between the Provo subdelta surfaces south of Box Elder Creek (figure 3). That origin would explain why the 2 meter-thick colluvial wedge does not contain any buried soils, but appears to be the result of a single, continuous episode of colluvial deposition. A
erosional, Provo-age origin for Scarp C would also explain why this trench is the only one of 14 in which
Figure 16. Photograph of deepened trench 1 (foreground) and Scarp C (background). Faint vertical lines (alternately numbered) are 1 meter apart and are correlative with the horizontal scale of the trench log. The eastern edge of the colluvial wedge is at 14mH. Note the continuous deltaic strata (between arrows) beneath the colluvial wedge. A strong relict soil profile (dark tones beneath the ground surface) underlies the entire scarp surface.
the strong surface soil developed on the upthrown fault block is not truncated at the fault plane, but instead continues downslope and across the colluvial wedge surface. As shown by McCalpin and Berry (1996), such geometry shows that the scarp was cut and then declined to its approximate present profile before the entire soil profile developed. As explained later, the soil profile developed on the colluvial wedge represents all of post-Provo time.
Trench 8 We excavated trench 8 ca. 200 meters north of trench 1 to confirm that no fault existed under Scarp C. We dug trench 8 to a depth of 5 meters and exposed a thick colluvial wedge underlain by unfaulted deltaic gravel strata. Because no fault existed in the trench we did not log trench 8, and considered it supporting evidence for the fluvial origin of Scarp C.
Scarp D Scarp D is a short, small, west-facing scarp (figure 4). Despite its small height, the scarp preserved a history of multiple small-displacement ruptures. This history contrasts with that of the taller scarps, which usually reveal a small number of large displacements.

Paleoearthquakes, Brigham City Segment 21
Figure 17. Log of trench 1. Darker tones indicate older Provo delta deposits. Unshaded units are post-Provo colluvium and loess. Patterns indicate grain size of deposit, or soil horizons. In unit abbreviations, the leading number indicates the deposit, with lower-case letters indicating subunits of different grain size. Following capital and lower-case letters are soil horizon abbreviations. Thus, unit 14A is the A horizon of the surface soil developed on deposit 14 (loess).There are no buried soils in or beneath the colluvium . The surface soil mantles the entire scarp and its A horizon is developed in loess (unit 14) on both the hanging wall and foot wall. Lower horizons (Bt, Bw, K) are developed on Provo delta gravels in the footwall, but on post-Provo colluvium in the hanging wall. Deltaic units are not faulted beneath the colluvial wedge. This fact, together the lack of buried soils, suggests that this scarp is erosional and dates to the formation of the Provo delta.

22 Utah Geological Survey
Trench 2 Trench 2 (figure 18) transects a 3.5 meter-high scarp and exposes subhorizontal layers of deltaic gravel displaced 3.3 meters vertically on two major faults and one minor fault. The subhorizontal gravel strata represent topset beds of the main Provo delta. Above the crest of the scarp the gravel surface has a moderately well developed soil profile composed of A/Bw/Bt horizons. This soil presumably has been developing since 13 cal ka, because it is not buried by any younger deposits. Post-faulting erosion and retreat/decline of fault free faces has truncated the soil profile at the upper scarp face. The main fault zone in the trench consists of two subvertical faults about 2.5 meters apart. Each of these faults has experience about 1.5 meters of vertical displacement, and each has shed one or more colluvial wedges. Downslope of the fault zone (i.e., on the hanging wall) the deltaic gravels are overlain by a 10- to 15-centimeter-thick Av horizon developed on massive, slightly gravelly silt that we interpret as loess (unit 1fAvb2 in figure 18). This soil is the oldest buried soil (b2) in the trench and is developed through the loess and into the underlying deltaic gravels, where a Bw horizon is developed (unit 1eBwb2). The vesicular A horizon of buried soil 2 yielded a TL age of 7.5±1.0 ka. The loess is absent on the upthrown fault block in the trench, probably due to post-faulting erosion. Directly overlying the loess is the oldest of three colluvial wedges (units 2a, 2b in figure 18). The unit 2 wedge is faulted against deltaic gravels, which implies at least two faulting events on this western fault strand: (1) one to create the free face from which to shed unit 2, and (2) a second event to fault the upslope margin of unit 2. Overlying the unit 2 wedge are two more colluvial wedges shed from the eastern fault strand. The lower wedge (unit 3) carries buried soil 1, composed of Av and Bw horizons. This soil is buried by the unit 4 wedge, which has the surface soil composed of A and AC horizons. Trench 2 did not contain enough organic material for radiocarbon analyses, but the A horizons of the two buried soils were sufficiently enriched in eolian silt to yield TL age estimates. The vesicular A horizon of buried soil 1 yielded two identical TL age estimates (via the total and partial bleach methods) of 2.0 ± 0.5 ka (tables 1, 2). No recognizable soil underlies the intermediate wedge. The ages cited above thus constrain the MRE and earliest event, but not the PE here. It is notable that this small scarp is not composed of “typical”
2 to 4 meters displacements, but three smaller than usual displacements. In order to determine how much displacement occurred on each fault strand during each paleoearthquake, we constructed a retrodeformation sequence for trench 2 (figure19). The retro sequence indicates that, in order to reproduce the present geometry of the trench, three displacement events are necessary. The earliest event (antepenultimate event, or APE) is necessary to create a free face from which to shed the oldest colluvial wedge, unit 2a. This free face was possibly created by displacement on the secondary fault, where the oldest wedge is currently truncated (as shown in the retro sequence), or the free face may have been created on the main fault. In such an alternative scenario the oldest wedge originally extended all the way to the main fault. The cumulative vertical displacement across the secondary fault is 1.2 meters, and in the retro sequence all of it is assigned to the APE (Stage 4, figure 19). However, some of this cumulative displacement must have occurred in the PE, to shear the upslope edge of the colluvial wedge. Using the assumption that maximum colluvium thickness is roughly half of free face height (McCalpin, 1996), the 0.5 meter-thick wedge would have required a 1.0-meter-high free face. Thus, of the 1.2 meters of cumulative displacement, probably about 1 meter occurred during the APE, and an additional 0.2 meters in the PE. The PE created a free face along the main fault from which the second colluvial wedge (unit 3) was shed. The cumulative displacement on the main fault by this time amounted to 1.4 meters, as measured on the vertical separation of the base of unit 1e. The maximum colluvial thickness of 0.5 meters implies a free face height of at least 1.0 meter, but this is a minimum estimate because the unit 3 wedge was not deposited on a horizontal surface. As noted by McCalpin (1996), maximum colluvium thickness in younger, more elongate wedges tends to be less than 50 percent of free face height, because the eroded material rolls and washes farther downslope in a thinner, more tabular wedge. Thus all 1.4 meters of displacement at this time may have occurred in the PE, with no contributions needed from the APE. Unit 3 overlies unit 2a, but there is no clear soil developed between the two wedges. Probably this results because the soil profile penetrates the entire thickness of unit 3 and penetrates into and overprints any soil developed atop unit 2a. This explanation requires that any soil developed on unit 2 before burial by unit 3 was weakly developed, and thus, that the time span between the PE and MRE was short.

Paleoearthquakes, Brigham City Segment 23
Figure 18. Log of trench 2. Darker tones indicate older deposit age. Patterns indicate grain size of deposit, or soil horizons. In unit abbreviations, the leading number indicates the deposit, with lower-case letters indicating subunits of different grain size. Following capital and lower-case letters are soil horizon abbreviations. Thus, unit 4bAv is a vesicular A horizon (Av) of the surface soil developed on deposit 4b (loess). Buried soils are indicated by “b1” or “b2” after the horizon abbreviation. Thus, unit 3Btb1 is the Bt horizon of the first buried soil (counting down from the surface) developed on deposit 3 (colluvial wedge of the penultimate event [PE}); unit 1fAvb2 is the Av horizon of the second buried soil developed on deposit 1f (post-Provo loess). The surface soil mantles the entire scarp and its A horizon is developed in loess (unit 4b) on both the hanging wall and foot wall. Lower horizons (Bt, Bw) are developed on Provo delta gravels in the footwall, but on post-Provo colluvium in the hanging wall.

24 Utah Geological Survey
Figure 19. Retrodeformation sequence for trench 2. Stage 13 is present geometry, titles in capital letters describe stage of development. Phrases in italics between stages, next to arrows, show actions taken to move backwards in time between stages. An alternative geometry to Stage 4 (not shown) would be that all displacement occurred on the main rather than secondary fault. In such a scenario, the colluvial wedge in Stage 5 (unit 2a) would have originally extended to the main fault. In Stage 6 this proximal part of the wedge would have been uplifted by movement on the secondary fault, and then eroded away (along with the underlying loess) in Stage 7. In this scenario, the 1.2 meters of slip on the secondary fault would have occurred in the penultimate event

Paleoearthquakes, Brigham City Segment 25
The MRE created a free face on the main fault that shed the youngest colluvium, units 4a and 4b. Unit 4a is a highly organic, clast-poor, sandy deposit and was apparently derived by stripping the preexisting A horizon off the upthrown block and redepositing it on the downthrown block. The lack of a strong wedge shape and lack of large clasts argues against the existence of a large free face. The 0.5 meters vertical displacement estimated for this event is based on matching the base of the Bt horizons across the main fault. Unit 4a was succeeded by unit 4b, a thin, nontectonic colluvial layer that drapes across the entire scarp face. The APE caused burial of loess, TL dated at 7.5 ± 1.0 ka (OTL-402), by colluvium. Thus, the APE must have occurred at approximately 7.5 ± 1.0 ka. The PE caused burial of the unit 2a wedge by unit 3, but due to soil overprinting, there is no clearly buried soil atop unit 2a to sample for dating the PE. The MRE caused burial of unit 3 and its loessy Av soil horizon, dated at 2.0 ± 0.5 ka (OTL-403), by unit 4a. Thus, the MRE occurred about 2.0 ± 0.5 ka.
Trench 12 We excavated trench 12 (figures 20, 21) 100 meters north of trench 2 to confirm the anomalous small, multiple displacements inferred for trench 2, and to look for radiocarbon-datable material to confirm the TL ages. Confirmation of TL ages from trench 2 was especially critical for the inferred MRE, because that event was dated in trench 2 at 2.0 ka, or 1.6 ka younger than the MRE of Personius (1991; 3.6 ka). If that age for our MRE could be confirmed, then the 3.6 ka event dated by Personius (1991) would be the penultimate event on the Brigham City segment, not the most recent event. Additionally, a paleoearthquake at ca. 2 ka would “fill in” the large seismic gap from 3.6 ka to present, and would indicate that this segment is not as “overdue” for an earthquake as was previously thought. Trench 12 exposed deltaic and colluvial deposits similar to those exposed in trench 2. We use the same general unit numbering scheme for both trenches. Unit 1 and its subunits (1a, 1b) represent deltaic topset beds composed of pebble gravel to sandy gravel. Unit 1c is a loess-rich layer that is partly mixed with the top of unit 1b. As in trench 2, the deltaic gravels carry a moderately developed relict soil profile on the upthrown block (horizons AB/Bt/Bw/Cox) and a soil nearly as strong on the downthrown block (horizons AB/Bt/Bw away from the fault, weakening to horizons AB/Bt/Cox near the fault). This lateral weakening results from the soil being
Figure 20. Photograph of main fault (between arrows) and colluvial wedge (above dashed line) in trench 12. Faintly visible horizontal stringlines are 1 meter apart. buried by scarp-derived colluvium near the fault, which arrests its development, while farther from the fault the soil remained unburied and continued to develop. Notably, the soil atop unit 1 in the small graben (1cBt/1bCox)), beneath the oldest scarp-derived colluvium, is identical to the buried soil elsewhere on the downthrown block. This geometry indicates that the soil had developed its Bt horizon on loess over deltaic gravels before the first faulting event here. Trench 12, like trench 2, exposed three colluvial wedges (units 2, 3, and 4). The oldest wedge (unit 2) is a sandy gravel confined to a small graben adjacent to the fault. This colluvium is not preserved on the downthrown block outside of the graben, indicating that it was probably restricted to the graben and represented colluvium shed from a fairly small free face. The upper part of unit 2 contains a loessy Bt soil horizon, indicating that loess deposition continued after the faulting event. The loess here yielded TL and IRSL ages of 10.0±1.0 ka and 11.0±1.0 ka, respectively. Therefore, the loess beneath unit 2 (unit 1c) must be even older than 10-11 ka, by the amount of time required to deposit the unit 2 colluvium (may be only a few decades). The largest colluvial wedge in the trench (unit 3) was deposited after the PE. The wedge reaches a maximum thickness of 1 meter, implying a free face on the order of 2 meters high. A relatively weak soil profile (A horizon only) is developed on unit 3. Silt from this soil yielded a TL age estimate of 4.0 ± 0.5 ka (OTL-505). The youngest colluvial wedge (unit 4a) accumulated after the MRE. This wedge is only 0.5 meters thick, implying a free face height on the order of 1 meter, or about half as high as that produced in the PE.

26 Utah Geological Survey
Fig. 21 Log of trench 12. Darker tones indicate older deposit age. Patterns indicate grain size of deposit, or soil horizons. In unit abbreviations, the leading number indicates the deposit, with lower-case letters indicating subunits of different grain size. Following capital and lower-case letters are soil horizon abbreviations. Thus, unit 4bAv is a vesicular A horizon (Av) of the surface soil developed on deposit 4b (loess). Unit 3A is the Bt horizon of the first buried soil (counting down from the surface) developed on deposit 3 (colluvial wedge of the penultimate event); unit 1cAB is the AB horizon of the second buried soil developed on deposit 1f (post-Provo loess). The surface soil mantles the entire scarp and its Av horizon is developed in loess (unit 4b) on both the hanging wall and footwall. Lower horizons (Bw,Cox) are developed on Provo delta gravels in the footwall, but on post-Provo colluvium in the hanging wall.
A radiocarbon age indicates that unit 4a buried the A horizon developed on unit 3 ca. 2,584 ± 300 cal yr BP, which constitutes a close maximum age for the MRE. This age barely overlaps at 2 sigma with the TL from the same location of 4.0 ± 0.5 ka. The older TL age probably results from incomplete zeroing of the TL signal in wash-facies colluvium. When the deposition rate of unit 4a (proximal colluvium) slowed enough for soil formation to begin, an A horizon developed on unit 4a. Organics from the base of this A horizon give a radiocarbon age of 1,832 ± 230 cal yr BP, which constitutes a loose minimum age constraint on the MRE. Together, these age estimates prove that the MRE on Scarp D is considerably younger than Personius’ (1991) youngest event at 3.6 ka, and must constitute a different, younger event. The retrodeformation sequence (figure 22) divides the fault scarp’s evolution into 11 stages. The three inferred paleoearthquakes (from oldest to youngest, X, Y, and Z) have reconstructed net vertical displacements of 0 meters (graben only), 1.9 meters, and 1.0 meter, respectively. This wide variation of displacement among paleoearthquakes seems to contradict the characteristic earthquake model of Schwartz and Coppersmith (1984), but it should be remembered that Scarp D is only one of several scarps that ruptured in these three events, so the net displacement across all active scarps in each event may have been a more consistent value.
Scarp E
Trench 7 Scarp E is an antithetic (east-facing) scarp that ranges in height from 0-2 meters. We excavated trench 7 (figure 23) across the northern part of Scarp E and exposed a fault, but maximum thickness of the colluvial wedge was only about 0.5 meters, and no buried soils existed for dating. No numerical ages were obtained from this trench.

Paleoearthquakes, Brigham City Segment 27
Figure 22. Retrodeformation sequence of trench 12.

28 Utah Geological Survey
Figure 23. Log of trench 7. Deltaic gravel (unit 1) and its Bt horizon soil were faulted along a downward-tapering fissure, which included randomly sorted fissure fill (blank area on log) and a thickened section of scarp colluvium. The only datable material was contained in the A horizon, which post-dated faulting by a considerable time and was buried by a very young loess. Because this A horizon would have provided a poor age constraint on faulting, we did not date it. Trench 13, lower part Trench 13 spanned the entire graben defined by scarps E and G (figure 4) (scarp G is described later). The main structure underlying scarp E here was a vertical tension crack filled with organic soil (figure 24). The basal part of the crack fill yielded an age of 2,362 ± 190 cal yr BP, which compares well to the MRE from trench 12. No other datable material was found, but an older colluvial wedge cut by the fissure (figure 25) implies that two events occurred on this antithetic fault, the earlier of which is undated. Figure 24. Photograph of the organic-filled crack (between arrows) underlying Scarp E, at the extreme west end of trench 13. Dashed line shows the older colluvial wedge cut by the dated fissure.

Paleoearthquakes, Brigham City Segment 29
Figure 25. Log of trench 13.

30 Utah Geological Survey
Scarp F Scarp F is a short, down-to-the-west scarp that forms a step fault together with larger Scarp G to the east (figure 4). In this discussion we also describe trench 5, on the western splay of Scarp G, as belonging to Scarp F. Trench 3, lower part The lower part of trench 3 transects Scarp F where it is about 2.5 meters high. Trench 3 is described in detail in the section on Scarp G. Scarp F is underlain by three fault strands with 2.0 meters of displacement, but the overlying 1.5-meter-thick colluvial wedge was massive, inorganic, and undifferentiable. No numerical ages were recovered. Trench 5 We excavated trench 5 (figure 26) north of the Y branch in Scarp G, on the western splay where it forms a 5.7-meter-high scarp across the post-Provo landslide deposits (map unit cls, figures 3 and 4). The deltaic stratigraphy is composed of two packages, a lower gravelly package (units 1a-3b) that resembles Provo-age strata in other trenches, and an upper, silty and clayey package (units 4a-4c). These two packages are separated by an erosional unconformity (A) exposed on the upthrown block. In the central, deepest part of the trench the fine-grained deltaic sediments are overlain by a sandy colluvium (unit 10). This colluvial unit slopes west in the center of the trench, suggesting it was deposited at the toe of a scarp, yet slopes east in the western part of the trench, as if deposited in a graben or sag. The colluvium is capped by a thin vesicular A horizon developed in silt of probable eolian origin, and an incipient Bw horizon in the underlying colluvium. The degree of soil development indicates a short time of soil formation. Directly overlying the Av horizon is the landslide deposit (map unit cls, figures. 3 and 4). On the downthrown block the landslide overlies either the Av horizon or the oldest colluvium (unit 10) directly, whereas on the upthrown block the landslide overlies the uppermost fine-grained deltaic deposit (unit 4b) and a much stronger soil (A2/K horizons). This soil is stronger because the landslide deposit was eroded away on the scarp crest, and soil processes from the surface
continued to increase the soil’s the development. This geometry suggests that, prior to landsliding, there was a scarp of some type here; east of the modern fault the uppermost deltaic deposits were being eroded, whereas west of the fault colluvium had accumulated and was capped by a soil horizon. Thus, the geometry suggests that a faulting episode occurred prior to landsliding. This faulting could not have had a large throw, however, since the relatively thin units 4b and 4c had not been eroded from the upthrown block. The landslide deposit is as much as 1.3 meters thick on the downthrown fault block, but has been removed by erosion on most of the upthrown block. The landslide deposit is faulted about 3.5 meters by the main fault in the center of the trench and the base of it is displaced 0.6 meters by a secondary fault west of the main fault. Two colluvial wedges of similar size (units 30 and 40) overlie the landslide deposit. The lower colluvium is clearly faulted whereas the upper colluvium is in depositional contact with a buried free face. There is no soil beneath the older colluvial wedge, suggesting it was deposited soon after the landslide was deposited. The soil formed on the lower wedge was buried by the upper scarp-derived colluvium and yielded an age of 3,500 ± 170 cal yr BP (â-54890), which provides a close age constraint on the MRE in this trench. The date is similar to the age of Personius’ (1991) MRE at 3.6 ± 0.5 cal ka. The retrodeformation sequence (figure 27) suggests that the landslide has been faulted during two events with a total throw of 2.4 meters. The MRE displaced the A horizon (unit 30A and its eroded footwall equivalent) that once draped the scarp surface, and led to deposition of the post-MRE colluvium (unit 40). Removing that colluvium and restoring the A horizon to continuity requires reversing about 1.1 meters of displacement on the fault (figure 27, stages 7 and 8). This restoration still leaves the base of the landslide deposit displaced 1.3 meters vertically across the fault, thus we assign that amount of displacement, as well as the subsequent deposition of colluvial unit 30, to the PE. However, even after restoring the base of the landslide to continuity across the fault (figure 27, stage 4), the underlying deltaic beds are displaced 0.4 meters vertically (measured on the base of unit 4c). Thus, we infer a pre-landslide, post-Provo faulting event with 0.4 meters of displacement (figure 27, stage 2).

Paleoearthquakes, Brigham City Segment 31
Figure 26. Log of trench 5. Trench unit abbreviations follow the scheme explained in previous trench logs.

32 Utah Geological Survey
Figure 27. Retrodeformation sequence for trench 5.

Paleoearthquakes, Brigham City Segment 33
Scarp G Scarp G is the longest and highest (9 meters) scarp on the Provo delta surface. The scarp splits into eastern and western branches at its north end, and both branches displace older Holocene alluvial-fan deposits (map unit af2, figures 3 and 4). This relationship indicates that one or both of Personius’ (1991) late Holocene events (3.6 ka, 4.7 ka) should be encountered in trenches on Scarp G (figures 28 to 31). Trench 3, upper part Trench 3 (figure 28) exposes a sequence of deltaic gravel, sand, and clay beds that are displaced at least 7 meters vertically, down-to-the-west. Throughout most of the trench, beds are subhorizontal and tabular, but in mid-trench (31-38 mH) beds are lenticular and two erosional unconformities exist between older and younger topset beds. The unconformities lie at the top and bottom of unit 10 (figure 28C) and indicate that the older beds (older than unit 10) were folded down to the west, draped over or eroded by unit 11, after which units 12 and younger filled the low spot in the fold. In addition, a sand bed (unit 8, figure 28) is highly convoluted and contains small diapirs, suggesting soft-sediment deformation and/or liquefaction. Trench 3 contains three zones of concentrated deformation. Fault zone 1 (FZ1 on figure 28) consists of two normal faults that underlie 8-meter-high Scarp G at the east end of the trench. The eastern fault has 3 meters of throw on unit 13, and the western fault has more than 4 meters of throw (correlative units are absent on the hanging wall). The colluvial wedge shed from these faults has a uniform texture, with only a faint suggestion of two differentiable subunits. However, it is unlikely that the entire 7+ meters of throw here occurred during a single paleoearthquake. The colluvium rests on an Av soil horizon developed in loess, which lies on deltaic gravels. Both this Av horizon and the underlying Bw and Bt horizons are enriched in silt. A TL age of 8.5±1.5 ka on the loess indicates a period of early Holocene loess deposition seen in other trenches here and at other locations on the WFZ (Forman and others, 1989, 1991). All scarp-derived colluvium overlies the loess, so evidently no faulting events occurred on Scarp G between the abandonment of the Provo delta (16.5-17 cal ka) and loess deposition (ca. 8.5 cal ka?). The base of the modern soil developed on scarp-derived colluvium dates at 3,604 ± 270 cal yr BP (â-59101), which is a minimum constraint on the MRE. The lower part of the colluvium contained no datable material.
Fault zone FZ2 is in the center of the trench and consists of a single west-dipping normal fault, a small fissure, and the folds and unconformities described previously. The fault has a total throw of 0.6 meters but is not associated with any scarp-derived colluvial wedges, Fault zone FZ3 lies beneath Scarp F at the western end of the trench, and is composed of three west-dipping normal faults. From east to west, the faults have throws of 0.1, 1.3, and 0.7 meters. Scarp-derived colluvium is present west of the two larger faults, but it could not be differentiated into subunits and contained no datable material. Trench 6 We excavated trench 6 (figure 30) across the eastern splay of Scarp G where it displaces the landslide deposit (figure 4). The trench exposes only one small fault which lies at the bottom of the 3.2-meter-deep trench. The main feature exposed in the trench is a buried erosional scarp with a relief of 3.3 meters, with the landslide deposit draped across the scarp. The oldest strata in trench 6 are similar to the oldest strata in trench 5, described previously, which lies 130 meters farther west and 12 meters lower in elevation on the same scarp. The older deltaic beds (units 1a-3) are gravels and sandy gravels, whereas the younger deltaic units (units 4a-4c) are much finer grained sand and silty clay. The two packages of deltaic beds are separated by a thin Av soil horizon, indicating subaerial exposure. All deltaic beds are truncated erosionally by an old west-facing scarp, on which is developed a loess-rich Av horizon. In most of the trench this Av soil horizon drapes the deltaic beds, but in the deepest part of the trench the Av horizon is developed on a small pocket of scarp-derived (?) colluvium (unit 10). This Av horizon is buried by the landslide deposit throughout the trench. A moderately thick soil A horizon is developed on the landslide deposit. The overall geometry of deposits in the trench suggests that a large-displacement fault lies farther west of and downslope of the west end of the trench. First, the topographic profile of the scarp is segmented, with the steepest segment in the far western end of our trench. This surface gradient alone suggests that main fault lies farther west. Second, the Av horizon that defines the pre-landslide buried scarp is still dipping quite steeply westward where it intersects the trench floor. Third, the landslide deposit is still thickening westward where it

34 Utah Geological Survey
Figure 28. Log of trench 3.

Paleoearthquakes, Brigham City Segment 35
intersects the trench floor. These last two observations suggest that the trench exposes only the upper half of the pre-landslide scarp, and that the lower half of the scarp and the main fault that created it were not exposed. Fourth, according to the retrodeformation analysis (figure 31), there is only 0.8 meter of displacement exposed in the trench, yet the buried scarp has a minimum (exposed) vertical relief of 2.6 meters, and the surface scarp is 3.2 meters high. Clearly, faulting of only 0.8 meters cannot create a fault scarp 2.6 to 3.2 meters high. Thus, we infer that the main fault lies west of the trench. Furthermore, the sharp break in slope between the upper and lower scarp faces, being developed on the landslide deposit, suggests that this unexposed main fault displaces the landslide deposit, as does the main fault exposed in trench 5. Therefore, the retrodeformation sequence (figure 31) is an incomplete assessment, because it implies that all faulting beneath Scarp G here predates the landslide. Charcoal from the Av horizon beneath the landslide dates at 13,010 ± 490 14C yr BP, while TL indicates a younger age for soil burial (8.5±1.0 ka for total bleach TL, 12.0±1.5 ka for partial bleach TL, table 2). The partial bleach TL age overlaps with the charcoal age, so that age range (10.5-13.0 ka) is our preferred estimate for burial of the Av horizon by the landslide. Trench 13, upper part Trench 13 (figures 24, 29) transected the highest part of Scarp G (9 meters high), about 200 meters south of trench 3 on the same scarp. Instability from cohesionless gravels caused repeated caving in the fault zone and proximal colluvial wedge (figure 29). Unlike trench 3, the colluvium exposed in trench 13 is separated into three distinct wedges by two buried soils. The upper two wedges (units 3, 4) are fully exposed, and the top of a third wedge (unit 2) is visible. The youngest colluvium (unit 4) rests on a soil dated at 3,362 ± 200 cal yr BP (â-68255); this wedge represents deposition after the MRE in this trench. By comparison, the base of the soil developed on the youngest colluvium in trench 3 dated at 3,604 ± 270 cal yr BP (â-59101). This pair of dates suggest that the MRE occurred about 3.4-3.6 ka, and is probably correlative to the 3.6 ± 0.5 ka event of Personius (1991). The penultimate colluvial wedge (unit 3) lies on an Av soil horizon that yielded an OSL age of 9.0 ± 1.0 ka and a TL age (total bleach) of 12.0 ± 1.5 ka. (table 2). Theoretically, these ages would form a close maximum
age constraint on the PE here. However, these age estimates are problematic for two reasons. First, the mean TL and IRSL age estimates differ by 3 thousand years, a time span on the same order (or larger) than recurrence intervals on the Brigham City segment. With the rather large uncertainties in the age estimates (1 ky to 1.5 ky), the two age estimates overlap at 2 sigma. The probability that these two age estimates are statistically identical is given by the Z statistic (Sheppard, 1975), where: Z= (T1-T2)/(sq. rt (sigma1
2 + sigma22))
For these two age estimates Z=0.92, which equates to a probability of 35 percent that the ages could represent the same date. Second, the ages overlap the age obtained for the post-delta loess in other trenches (e.g., 8.5 ± 1.5 ka in trench 3), but this soil and its underlying colluvial wedge both overlie the post-Provo loess. This discrepancy is discussed later. The base of the earliest wedge (unit 2) is not exposed near the fault (due to caving), but 8 meters to the west the tip of the wedge overlies an Av/Bw/Bt soil profile that is developed on the thin post-Provo loess and extends into underlying deltaic gravels. Thus, several thousand years must have elapsed after the abandonment of the Provo shoreline (ca. 17 ka) but before this earliest faulting event, in which the loess was deposited and the soil formed.
Figure 29. Photograph of upper part of trench 13, showing caved section in fault zone.

36 Utah Geological Survey
.
Figure 30. Log of trench 6.

Paleoearthquakes, Brigham City Segment 37
Figure 31. Retrodeformation sequence of trench 6.

38 Utah Geological Survey
PALEOEARTHQUAKE CHRONOLOGY Event Z Event Z (the MRE) is constrained by seven maximum limiting ages and by one minimum limiting age (table 1). Of these , five ages are considered to be closely limiting (table 4; figure 32). Because the TL age estimate is concordant with the four radiocarbon ages, we include it in the calculation of the mean of 2,125 ± 104 cal yrs BP as the age of the MRE. This event is clearly younger than the youngest faulting event dated by Personius (1991) at ca. 3.6 cal ka. A recent personal communication from Personius reveals that a possible post-3.6 ka colluvial wedge existed in the Bowden Canyon trench, but it was not dated due to small size and
lack of organics. It is also possible that our event Z ruptured the untrenched scarp upslope of Personius’ (1991) trench. Regardless of why this event was not well preserved in Personius’ trench, it clearly ruptured multiple fault strands on the Provo delta. Just as importantly, our trench logs and numerical ages indicate that there was no recognizable fault displacement event younger than Event Z as defined herein (ca. 2,125 cal yr BP) in any of the 14 trenches. This point is important when calculating conditional probabilities of future large earthquakes on the Brigham City segment.
Table 4. Limiting ages and mean limiting age for paleoearthquakes at Brigham City. Event Trench1 Lab. No.2 Mat-
erial3 Geologic Unit4
Lab 14C age (14C yr BP) or TL age (cal yr BP)
CAS/ MRT5
MRT-Corrected Age of Event Horizon (cal yr BP in parentheses, with 2-sigma limits)
Mean Age of Event (cal yr BP) 6
12 β-68254 A PC 1,720±90 a 1,691(1,412)1,142 2 OTL-403 Av L 2,000±500 N/A 2,500(2,000)1,500 13 β-68256 Ab CF 2,320±70 a 2,251(2,020)1,801 14 β-68258 Ab PC 2,580±60 a 2,680(2,513)2,200
Z
12 β-68253 Ab PC 2,630±90 a 2,767(2,571)2,187
2,125±104
13 β-68255 Ab PC 3,320±80 a 3,615(3,344)3,085 BC-1 USGS-
2535- Ab PC 3,430±70 b 3,687(3,462)3,166
Y
5 β-54890 Ab PC 3,430±60 a 3,700(3,476)3,261
3,434±142
PP-1 PITT-0093 Ab CF 4,190±125 c 4,880(4,579)4,107 BC-1 USGS-
2536 Ab DF 4,330±70 c 4,929(4,695)4,505
X
BC-1 USGS-2604
Ab DF 4,340±100 c 5,120(4,700)4,351
4,674±108
W 14 β-68257 Ab PC 5,380±80 c 6,213(5,970)5,730 5,970±242 V 2 OTL-402 Av L 7,500±1000 N/A 8,500(7,500)6,500 7,500±1000
3 OTL-404 Av L 8,500±1500 N/A 10,000(8,500)7,000 U 6 OTL-421 Av L 8,500±1000 N/A 9,500(8,500)7,500
8,500±845
T 6 β-54889 C L 13,010±460 N/A 13,613(14,812) 16,217
>14,800±1200<17,1007
1 BC and PP trenches from Personius, 19912 β, Beta Analytic; USGS, USGS radiocarbon lab, Menlo Park, CA; PITT, University of Pittsburgh 3 A, organic A horizon; Av, vesicular A horizon; Ab, buried A horizon; C, charcoal 4 PC, proximal (debris-facies) colluvium; CF, tectonic crack fill; DF, debris flow; L, loess 5 CAS, carbon age span within sample (inferred; see Machette and others, 1992, Appendix 1). MRT, mean residence time. Letter codes represent these assumed values for CAS/MRT (in years): a, 300/200±75; b, 200/100±38; c, 200/200±75 6 Calculated by computing the dendro-corrected age, using the computer program CALIB 3.0 of Stuiver and Reimer, 1993, with: 10-year atmospheric calibration data set; carbon age span=CAS; laboratory error multiplier=1. 7 Event must be younger than the Bonneville flood at 17.1 ka

Paleoearthquakes, Brigham City Segment 39
Figure 32. Space-time diagram of paleoearthquakes on the various scarps at the Brigham City trench site, plus three paleoearthquakes (1-3) from Personius (1991). Time scale is in calibrated years, which are assumed equivalent to TL/OSL years. Dashed box around his event 1 indicates age range inferred indirectly from geomorphology. Dashed box around queried event shows age range for Personius’ youngest radiocarbon sample from the Pole Patch trench. Triangles indicate maximum limiting ages on events of uncertain correlation, where luminescence age estimates from different methods span a wide time range (see figure 33).

40 Utah Geological Survey
Event Y Event Y is constrained by three numerical ages, of which two provide close maximum age constraints (table 4). Because these two ages are similar to the age of Personius’ (1991) MRE at Bowden Canyon, we have included Personius’ limiting age as well in table 4. The mean of our two ages and his age is 3,434 ± 142 cal yr BP. Event Y only occurred on Scarp G, which is reasonable since Scarp G is one of only 3 scarps that continues beyond the Provo delta into Holocene deposits.
Event X This event, the penultimate event of Personius (1991), was not observed in any of our 14 trenches. We don’t know why, since this event was well-dated at both the Bowden Canyon and Pole Patch trench sites (Personius, 1991). The numerical ages from our 14 trenches date from both before and after 4 to7 ka, so we exposed the physical stratigraphy spanning this period. The only explanation of how a 4.7 ka rupture could have affected the delta and not been exposed in any of our 14 trenches, is if it only ruptured Scarp B. Scarp B was destroyed by gravel mining prior to this study. Due to the strength of Personius’ (1991) evidence for this event, we have placed it in table 4.
Event W This event is dated by a single maximum age from trench 14. However, the colluvial stratigraphy in that trench was unambiguous that this ca. 6 cal ka event was the only event to displace the post-Provo terrace prior to the MRE at ca. 2.4 cal ka.. So one might ask, where is the evidence for the 3.6 cal ka and 4.7 cal ka ruptures in trench 14? The only reasonable explanation is that those two events ruptured to the west of trench 14, and that the scarps were destroyed when post-3.6 ka stream erosion destroyed this post-Provo terrace at that location.
Events U and V Event V is the faulting event that first shed tectonic colluvium over the early Holocene loess. This loess was encountered in trenches 2, 3, 5, 6, 12, and 13 and dated in all of those except trench 5. In each case the loess lies upon the Provo delta or subdelta topset beds, and forms the Av horizon of a soil profile that extends into the deltaic gravels. In addition, in five of the six trenches, all scarp-derived colluviums lie above the loess. However, in trench 6 (Scarp G) some suspected colluvium lies beneath the loess and above the Provo deltaic gravels.
We obtained numerical ages on this loess in two campaigns. The first campaign samples (OTL-4xx) were dated in 1993 and formed the basis for the paleoearthquake chronology reported in McCalpin and Forman (1993) and McCalpin and Nishenko (1996). Three first-round samples from the pos-Provo loess yielded congruent TL-total bleach age estimates of 7.5 ± 1.0 ka (OTL-402), 8.5 ± 1.0 ka (OTL-421), and 8.5 ± 1.5 ka (OTL-405; figure 36). In contrast, the single TL-partial bleach age of 12.0±1.5 ka on sample OTL-421 was considerably older than its total bleach-based age of 8.5 ± 1.5 ka. Using the Z statistic, there is only a 5 percent probability that these two age estimates are drawn from the same population. McCalpin and Nishenko (1996) assumed the total-bleach age estimate was more accurate, despite the fact that the older, partial-bleach age estimate was similar to that of detrital charcoal from the loess (13,010 ± 490 14C yr BP (14,165-15,557 cal yr BP). (figure 33). McCalpin and Nishenko (1996) believed the 7.5-8.5 ka ages mainly because: (1) stratigraphic and soil relations showed that the loess in each trench was almost certainly the same loess, (2) the three total-bleach ages were relatively similar, and (3) the three ages were also similar to TL ages of loess from the American Fork trench site on the Provo segment of the WFZ (Forman and others, 1989). Based on these ages, McCalpin and Forman (1993) and McCalpin and Nishenko (1996) inferred two paleoearthquakes, event V at ca. 7.5 ka and event U at ca. 8.5 ka. They believed that the differences among the three age estimates were significant, and represented a loess that was buried at ca. 8.5 ka on Scarp G, yet continued to accumulate on the landscape until 7.5 ka, when an event on Scarp D buried it. The alternative explanation is that the three ages were statistically indistinguishable, and only a single displacement event occurred sometime around 7.5-8.5 ka. Part of the reason this alternative was rejected was because there were other interevent times in the paleoearthquake sequence (figure 32) that were within ca. 1 ky of each other; however, this is a poor criterion for accepting numerical ages to constrain paleoearthquakes. The second round of loess samples (OTL-5xx) was collected in 1993 and both TL and IRSL ages were reported in 1995. In general, the two loess samples dated in the second round yielded significantly older ages than identical loesses dated in the first round. For example, based on stratigraphy and soils we assumed that the loess in trench 12 on Scarp D was the same deposit as exposed in trench 2, only 100 meters away on the same

Paleoearthquakes, Brigham City Segment 41
scarp. However, some first and second-round age estimates on loess do not overlap at one sigma (compare OTL-402 at 7.5 ± 1.0 ka to OTL-504 at 10.0 ± 1.0 ka, figure 33), even for the same dating method (total bleach). Those two age estimates yield a Z statistic of 1.77, which implies an 8 percent chance that they represent the same age. In addition, the second-round IRSL and TL ages for this loess do not overlap at one sigma, and barely overlap at two sigma, with the OSL age being older. The Z statistic for these two ages is 2.48, implying a 2 percent probability that the two ages are drawn from the same population. A similar situation exists for Scarp G, except that the dated sample there was not the primary loess atop deltaic gravels, but a loessy Av horizon separated from the primary loess by a 2-m-thick colluvial wedge (figure 24). We anticipated a mid-Holocene age for this Av horizon, but paradoxically it yielded an OSL age of 9.0±1.0 ka, and a TL age of 12.0±1.5 ka. The latter TL age is 3-4 ka older than the first-round TL ages on the primary early Holocene loess, yet the dated Av horizon is stratigraphically higher than that loess. This ambiguity on the age of the early Holocene loess throws into question the concept of the early Holocene aseismic interval proposed by McCalpin and Nishenko (1996) and McCalpin and Nelson (2000). Specifically, the older age estimates from the first round (OTL-421, partial bleach), and second round (OTL-504, OSL age; OTL-503, total bleach age) fall at 12, 11 and 12 ka, respectively, or right in the middle of the proposed aseismic interval (shaded boxes in figure 32). The major source of the ambiguity is the divergence in sample age when two different dating techniques are used on the same loess sample, or on samples from correlative loesses in different trenches.
Event T The evidence for Event T is twofold: (1) scarp-derived (?) colluvium beneath the Av soil horizon in trench 6 that yielded a radiocarbon age of 14,165-15,557 cal yr B.P., and (2) anomalous liquefaction features in the deltaic topset beds exposed in the middle of trench 3. The former colluvium, if derived from a scarp free face, requires a faulting event earlier than 14.2 to 15.6 cal ka but later than the Provo shoreline (ca. 16.5 cal ka). The latter convoluted and diapiric beds were deformed when Provo topset beds were still saturated, a condition that ceased with abandonment of the delta surface ca. 16.5 to 17 cal ka. Depositional loading is not likely the cause of
this deformation, since the deposits are very near to the delta surface. Therefore, we infer an event prior to 14.2 to 15.6 ka, probably while the delta surface was still active 16.5 to 17 thousand years ago.
Figure 33. Numerical age estimates for the early Holocene loess, and for a thin Av horizon enriched in loess (OTL-503) that is separated from the loess by a colluvial wedge. Vertical dimension of box indicates one sigma age limits. Colluv.1, colluv. 2, scarp-derived colluvium, 1 is oldest; TL-tb, total bleach method; TL-pb, partial bleach method; IRSL, infrared-stimulated luminescence; C14, radiocarbon date on charcoal.

42 Utah Geological Survey
CONCLUSIONS Comparison of Previous Paleoearthquake
Chronologies
The most detailed chronology of paleoearthquakes on the Brigham City segment prior to this study was reported by Personius (1991), who dated two events in the past 5 ka at the Bowden Canyon and Pole Patch sites, roughly 1 kilometers north and 10 kilometers south of this study. At Bowden Canyon he inferred three faulting events. The earliest event (1) was indirectly inferred to have occurred between 5-7 ka, based on an inferred age of 7 ka for the faulted alluvial fan, and an age of 4.7 ± 0.5 cal ka for the succeeding faulting event. The second event (2) was dated at ca. 4.7 ± 0.5 cal ka by two close maximum limiting ages from soil A horizons buried by colluvium shed after the second event. The youngest event (3) was similarly dated at 3.6 ± 0.5 cal ka from a younger buried soil A horizon. At the Pole Patch trench Personius (1991) also inferred three faulting events. The earlier two events were not dated directly due to lack of buried soils beneath their colluviums. The youngest event was dated from the basal part of an organic tension-crack fill at 4.6 ± 0.5 cal ka. Personius tentatively correlated the youngest event at Pole Patch (4.6 ± 0.5 cal ka) with the penultimate event (4.7 ± 0.5 cal ka) at the Bowden Canyon site. An interesting sidelight on the Pole Patch trench is Personius’ (1991) attempt to date the oldest event via blocks of soil A horizon incorporated in the youngest (post-faulting) alluvium. Instead of an age of 5-7 ka which he expected, these soil blocks dated at 2.2 ± 0.5 cal ka, or even younger than the penultimate event at Pole Patch. Personius surmised “A third and more likely possibility is that unit 6-A [the dated unit] is a fragment of a much younger soil, eroded from an exposure of unit 6 northwest of the trench. This third explanation infers [sic] continued soil formation on unit 6 northwest of the trench site and a subsequent channel-cutting event (and deposition of units 1 and 2) that postdates all the faulting events on the Pole Patch fault.” It is interesting to note that the age of these soil A horizon blocks (2.2 ± 0.5 cal ka) is essentially identical to the age of the MRE of this study (2,125 ± 104 cal yr BP). Furthermore, in our experience it is rare to find alluvium that contains intact blocks of soil horizons, but relatively common to find proximal colluvium and crack fill that contains such soil fragments. Thus, one possible interpretation of the A horizon blocks in the Pole Patch trench is that they were
shed from a free face during the MRE at about 2.2 ± 0.5 cal ka and became incorporated in the channel alluvium. Implications of this Study for Probability Estimates of Future Large Earthquakes on the Brigham City
Segment
Nishenko and Schwartz (1990) calculated probabilities of M>7 earthquakes in the next 50 and 100 years on the Brigham City segment, based on the two-event paleoseismic record of Personius (1991). In 1992-93 we dug the trenches described in this study, and in 1996 McCalpin and Nishenko (1996) used that evidence to update the rupture probabilities for all five central segments of the WFZ, including the Brigham City segment. They calculated probabilities for both memoryless (Poisson) models of recurrence and also conditional probabilities assuming various renewal models of recurrence (lognormal and Weibull). For the Brigham City segment, Poisson probability in the next 100 years is 5.2 percent, compared to conditional probability estimates ranging from 10 percent to >99 percent (table 5). Table 5 shows that the Brigham City segment has, in each of the seven renewal models, the highest probability of rupture in the next 100 years among the five central segments of the WFZ. Although this fact was supported by the tabular data in McCalpin and Nishenko (1996, their table 6), the fact was not emphasized in that paper for several reasons. First, the recurrence models presented by McCalpin and Nishenko (1996) spanned a very wide range of behavior, but without better long-term paleoseismic records, they were unable to state which model was most appropriate for which segment. Second, the various models implied probabilities for a given segment that varied over more than an order of magnitude, so the decision of which model to prefer had profound consequences. Third, the Brigham City segment had an elapsed time (2,125 years) that was nearly twice the mean recurrence interval between the latest six paleoearthquakes (1,275 years). Accordingly, a renewal model with that recurrence value and a small coefficient of variation (COV, defined as sigma divided by mean) (model 6a, table 5) yielded a probability of >99 percent for rupture in the next 100 years (McCalpin and Nishenko, 1996). Rather than get “stuck” with this high probability, McCalpin and Nishenko (1996) used the following argument. “The fact that the current elapsed time is 2,125 years is, however, problematic. The elapsed time is not merely one or two standard deviations beyond the

Paleoearthquakes, Brigham City Segment 43
Table 5. Probability estimates of M>7 earthquakes in the next 100 years for the Brigham City segment. From McCalpin and Nishenko (1996) table 6. Comparable Probabilities on the Other 4 Central Segments
Behavior Model
Recurrence Model
Mean Recurrence and Source1 (years)
COV of Recurrence or Weibull Shape Parameter (β)
Probability of M>7 Earthquake in the Next 100 Years on BC Segment2 Mean3 Range3
memoryless Poisson NA NA 5.2% 5.2% 3.5-6.8% 1. Renewal (memory)
Lognormal 1767, group 0.21 30.5% 4.1% 0-8.1%
2. Renewal (memory)
Lognormal 1767, group 0.5 10% 5.8% 2.6-7.5%
3. Renewal (memory)
Lognormal 1275, segment
0.21 45.9% 6.3% 0-22%
4. Renewal (memory)
Lognormal 1275, segment
0.5 13.5% 4.9% 0.6-10.7%
5. Renewal (memory)
Weibull 1775, group β=3.36 20% 4.4% 1.5-6.4%
6a. Renewal (memory)
Weibull 1328, short β=17.8 >99% 30.6%4 4.4-56.8%4
6b. Renewal (memory)
Weibull 2346, long β=8.3 13.6% 0.01%5 0-0.2%5
Mean of models 1-6b for the Brigham City Segment 33.2% 1 Source; “group” means derived from averaging all Holocene events on all five central segments of the WFZ; “segments” means derived just from the segment named; “short” refers to the group of short recurrences among the five central segments averaging 1,328 ± 104 years, as opposed to a separate group of “long” recurrences (dominantly observed on the Provo and Nephi segments) averaging 2,346 ± 448 years. See McCalpin and Nishenko (1996) p. 6,248-6,250 for detailed discussion. 2 All estimates assume an elapsed time of 2,125± 104 years. 3 From McCalpin and Nishenko (1996) table 6. 4 Values cited are from the Weber and Salt Lake City segments only. 5 Values cited are from the Provo and Nephi segments only. mean recurrence but is equivalent to nearly two full recurrence times. The extreme length of the current elapsed time, however, does not appear to be due to undiscovered events younger than 2,125 cal yr BP [a statement confirmed by this study]. If we assume a “short” Weibull recurrence model, then the probabilities are >0.99, regardless of the length of the exposure window. (italics added). Since the observed elapsed time is now closer to the mean of the long Weibull model (2,125 years versus 2,346 years, respectively), we chose to use the long model for our estimates.” (underlining added). The underlined statement indicates that McCalpin and Nishenko (1996) did not use the actual 1,275 year recurrence time, or even the similar mean of “short”
recurrence times from the Brigham City, Weber and Salt Lake City segments (1,328 yrs) in this Weibull model, but rather substituted the “long” average recurrence (2,346 yrs) from the Provo and Nephi segments. There was no real justification for this substitution, except the following. The unspoken assumption seems to have been that, since the elapsed time is so much longer than the mean Brigham City segment recurrence of 1,275 years, that the behavior model of the segment must have changed to a cluster and gap pattern, and we are presently in a gap. Although this cluster/gap model had been previously proposed by Nishenko and Schwartz (1990), it is not supported by the numerical dates from this study. Furthermore, such an assumption was not made for any of the other 29 model/segment

44 Utah Geological Survey
combinations reported in McCalpin and Nishenko’s (1996) table 6. The unspoken assumption brings up a philosophical conundrum; if we “switch models” whenever an elapsed time equals or exceeds the mean recurrence, then the probability of future ruptures abruptly decreases with time (due to the new longer assumed recurrence value), instead of increasing with time. This practice sets a dangerous precedent, of “switching” fault behavior models when the conditional probabilities predicted from one model become too high. In such a practice, as soon as elapsed time exceeds mean recurrence by more than 2-3 sigma, we change our model, rather than admitting that in a very long time series, events will inevitably occur outside the 2 or 3 sigma limits. In the 6 years since the McCalpin and Nishenko (1996) report appeared, numerous papers have been published on recurrence behavior models, based on both field data and from synthetic modeling. In general, the studies have shown that quasi-periodic recurrence behavior is typical for fault segments, even though it is complicated somewhat by stress changes induced by surface ruptures on adjacent or nearby faults. For the case of the Brigham City segment, we are still uncertain which recurrence model best characterizes long-term fault behavior. However, we can say with certainty that the probability of an M>7 earthquake in the next 100 years, based on a renewal model of fault behavior, is significantly greater on the Brigham City segment than on the other four central segments of the WFZ. If a specific probability value is desired, then one robust value is the mean value of the 7 renewal models cited in table 7, which is 33.2 percent chance in the next 100 years. This value, basically one chance in three, is roughly twice as large as that in the next most likely segment to rupture (the Salt Lake City segment), which has a probability of about one in six (McCalpin and Nelson, 2000; McCalpin, in press).
Physical Causes of the Longer Recurrence in the Early Holocene
The stratigraphic record in our 14 trenches at Brigham City indicates that there were only 2 or 3 paleoearthquakes (Events U, V and perhaps a 12 ka event) during the period 7.5 cal ka to ca. 17 cal ka. The average span of recurrence interval in this 9.5 ky period would thus be 3-4.5 ky, or 2-3 times as long as the mid- to late-Holocene recurrence. Although recurrence intervals must have been longer on average between 7 to 17 cal ka, the evidence for a single long aseismic interval
is weakened by the possible occurrence of an event at ca 12 cal ka. Whether such an event occurred depends on our correlation of loess units between trenches, and interpretation of divergent luminescence ages. If there is only a single post-Provo loess deposit exposed in our trenches, and its age is about 8 cal ka, then there is no need for a 12 ka event and thus the Holocene aseismic interval is supported. If there are two, similar-looking loesses in our trenches, one about 8 cal ka and the other 11-12 cal ka (that is, diachronous loess deposition), then there may have been faulting events following deposition of each loess, the earlier of which occurred about 11-12 cal ka in the middle of our proposed “early Holocene aseismic interval.” Given our present data we cannot distinguish between these two hypotheses. What might have caused longer recurrence in the latest Pleistocene and early Holocene? The time window 10 to 16.5 cal ka coincides with the desiccation of Lake Bonneville, starting with the abrupt 100-meter drop from the Bonneville highstand to Provo shorelines at ca. 17 cal ka, and continuing to the Holocene lowstand of the lake (below the present level of the Great Salt Lake) at ca. 13 cal ka. This desiccation removed an enormous weight of water from the hanging wall of the WFZ over a period of 4 ka. Could this desiccation have redistributed stress patterns on the hanging wall and footwall of the WFZ in a manner as to suppress fault movement? Conceptually, placing a load on the hanging wall of a normal fault and increasing the regional pore fluid pressure, such as would occur during a lake transgression, would tend to encourage slip on a normal fault. Conversely, a lake regression should have the opposite effect, that of suppressing fault slip. An early Holocene aseismic interval was inferred by McCalpin and Nelson (2000) and McCalpin (in press), based on trenching results on the Salt Lake City segment of the WFZ. Their 1999 “megatrench” in Bonneville-age deposits near Little Cottonwood Canyon was one of the few trench studies that exposed the paleoearthquake record prior to the mid-Holocene. They found stratigraphic and geochronologic evidence that no faulting events had occurred between the occupation of the Bonneville shoreline (ca. 17 ka) and about 9 ka. This quiescent period of 8 ka contrasts strongly with the subsequent, mid- to late-Holocene 1,200-1,300 year recurrence between subsequent events. However, even in that study there was some ambiguity about the existence of an aseismic interval, because early Holocene (9-10 cal ka) alluvial-fan processes may have eroded away the paleoseismic evidence created after recession of Lake Bonneville.

Paleoearthquakes, Brigham City Segment 45
REFERENCES Birkeland, P.W., 1999, Soils and geomorphology: Oxford University Press, 488 p. Birkeland, P.W., Machette, M.N. and Hailer, K.M., 1991. Soils as a tool for applied Quaternary geology: Utah Geological and Mineral Survey Miscellaneous Publication 91-3, 63 p. Cluff, L.S., Glass, C.E., and Brogan, G.E., 1974, Investigation and evaluation of the Wasatch fault zone north of Brigham City and Cache Valley faults, Utah and Idaho; a guide to land-use planning with recom-mendations for seismic safety: Woodward-Lundgren and Associates, unpublished report to U.S. Geological Survey, Contract No. 14-08-001-13665, 147 p. Day, P.R., 1965. Particle fractionation and particle-size analysis, in Black, C.A. (editor), Methods of soil analysis: Monograph Series 9: Madison, WI, American Society of Agronomy, p. 545-567. Forman, S.L., 1999, Infrared and red stimulated luminescence dating of late Quaternary nearshore sediments from Spitsbergen, Svalbard: Arctic, Antarctic, and Alpine Research, v. 31, no. 1, p. 34-49. Forman, S. L., Machette, M.N., Jackson, M.E. and Maat, P., 1989, An evaluation of thermoluminescence dating of paleoearthquakes on the American Fork segment, Wasatch fault zone, Utah: Journal of Geophysical Research, v. 94, p. 1622-1630. Forman, S.L., Pierson, J. and Lepper, K., 2000, Luminescence geochronology, in Noller, J.S., Sowers, J.M. and Lettis, W.R. (editors), Quaternary geochronology; Methods and applications: American Geophysical Union Reference Shelf, v. 4, 582 p. Forman, S.L., Nelson, A.R., and McCalpin, J.P., 1991, Thermoluminescence dating of fault-scarp derived colluvium: Deciphering the timing of paleoearthquakes on the Weber segment of the Wasatch fault zone, north-central Utah: Journal of Geophysical Research, v. 96, no. B1, p. 595-605 Gilbert, G.K., 1890, Lake Bonneville: U.S. Geological Survey, Monograph 1, 435 p. Harden, J.W., Taylor, E.M., Hill, C., Mark, R.K.,McFadden, L.D., Reheis, M.C., Sowers, J.M., and
Wells, S.D., 1991. Rates of soil development from four soil chronosequences in the southern Great Basin. Quaternary Research, v. 35, p. 333-399. Machette, M.N., Personius, S.F. and Nelson, A.R., 1992, Paleoseismology of the Wasatch fault zone: A summary of recent investigations, interpretations, and conclusions, in Gori, P.L and Hays, W.W. (editors), Assessment of Regional Earthquake Hazards and Risk Along the Wasatch Front, Utah: U.S. Geological Survey Professional Paper 1500, p. A1-A71. McCalpin, J.P. (editor), 1996, Paleoseismology: New York, Academic Press, 583 p. McCalpin, J.P., in press, Post-Bonneville paleoearthquake chronology of the Salt Lake City segment, Wasatch Fault Zone, from the 1999 megatrench site: Utah Geological Survey, Miscellaneous Publication, 2002. McCalpin, J.P., and Berry, M.E., 1996, Soil catenas to estimate ages of movements on normal fault scarps, with an example from the Wasatch fault zone, Utah, USA: Catena, v. 27, p. 265-286. McCalpin, J.P., and Forman, S.L., 1993, Assessing the paleoseismic activity of the Brigham City segment, Wasatch fault zone; probable site of the next major earthquake on the Wasatch Front?, in Jacobson, M.L. (compiler), Summaries of Technical Reports, v. XXXIV, U.S. Geological Survey Open-File Report 93-195, p. 485-489. McCalpin, J.P., and Nelson, C.V., 2000, Long recurrence records from the Wasatch fault zone, Utah: Unpublished Final Technical Report submitted to U.S. Geological Survey by GEO-HAZ Consulting, Inc., Contract 99HQGR0058, May 24, 2000, 61 p. McCalpin, J.P., and Niskenko, S.P., 1996, Holocene paleoseismicity, temporal clustering, and probabilities of future large (M>7) earthquakes on the Wasatch fault zone, Utah: Journal of Geophysical Research, v. 101, no. B4, p. 6233-6253. McFadden, L.D., 1988. Climatic influences on rates and processes of soil development in Quaternary deposits of southern California: Geological Society of America Special Paper 216, p. 153-177.

46 Utah Geological Survey
McFadden, L.D., and Weldon, RI., III, 1987, Rates and processes of soil development on Quaternary terraces in Cajon Pass, California: Geological Society of America Bulletin, v. 98, p. 280-293. Muhs, D. R., 1983, Airborne dustfall on the California Channel Islands, U.S.A.: Arid Environments, v. 6, p. 223-238. Nishenko, S. P., and Schwartz, D.P., 1990, Preliminary estimates of large earthquake probabilities along the Wasatch fault zone, Utah: EOS, AGU Transactions, v.71, p.1448. Oviatt, C.G., 1997, Lake Bonneville fluctuations and global climatic change: Geology, v. 25, no.2, p. 155-158. Personius, S.F., 1988, Preliminary surficial geologic map of the Brigham City segment and adjacent parts of the Weber and Collinston segments, Wasatch fault zone, Box Elder and Weber Counties, Utah: U.S. Geological Survey Miscellaneous Field Studies Map MF-2042, scale 1:50,000. Personius, S.F., 1990, Surficial geologic map of the Brigham City segment and adjacent parts of the Weber and Collinston segments, Wasatch fault zone, Box Elder and Weber Counties, Utah: U.S. Geological Survey Miscellaneous Investigations Map I-1979, scale 1:50,000. Personius, S.F., 1991, Paleoseismic analysis of the Wasatch fault zone at the Brigham City trench site, Brigham City, Utah and the Pole Patch trench site, Pleasant View, Utah: Utah Geological and Mineral Survey, Special Study 76, Paleoseismology of Utah, v. 2, 39 p. Reheis, M.C., Harden, J. W., McFadden, L.D. and Shroba, R.R., 1989. Development rates of late Quaternary soils, Silver Lake playa, California: Soil Science Society of America, v. 53, p. 1127-1140. Reheis, M.C., Goodmacher, J.C., Harden, J.W., McFadden, L.D., Rockwell, T.K., Shroba, R.R., Sowers, J.M., and Taylor, E.M., 1995, Quaternary soils and dust deposition in southern Nevada and California: Geological Society of America Bulletin, v. 107, no. 9, p. 1003-1022.
Schwartz, D.P., and Coppersmith, K.J., 1984, Fault behavior and characteristic earthquakes--Examples from the Wasatch and San Andreas fault zones: Journal of Geophysical Research, v. 89, p. 5681-5698. Sheppard, J.C., 1975, A radiocarbon dating primer: Washington State University, College of Engineering Bulletin 338, 77 p. Shroba, R.R., 1982, Soil B-horizon properties as age indicators for late Quaternary deposits along the Wasatch front, north-central Utah: Geological Society of America, Abstracts with Programs, vol. 14, no. 4, p. 233. Shroba, R.R., 1992, Soil B-horizon properties distinguish Holocene from latest Pleistocene surficial deposits near Ogden, Utah. in: American Quaternary Association 12th Biennial Meeting, Abstracts, p. 76. Singer, M.J., and Janitzky, P., editors, 1986. Field and laboratory procedures used in a soil chronosequences study: U.S. Geological Survey Bulletin 1648. Smith, D.G., and Jol, H.M., 1992, Ground-penetrating radar investigations of a Lake Bonneville delta, Provo level, Brigham City, Utah: Geology, v. 20, p. 1083-1086. Smith, D.G., and Jol, H.M., 1995, Wasatch fault (Utah), detected and displacement characterized by ground penetrating radar: Environmental and Engineering Geoscience, v. I, no. 4, p. 489-496. Soil Survey Staff, 1990, Keys to Soil Taxonomy, 4th edition: SMSS Technical Monograph No. 19, Blacksburg, VA. Stuiver, M., and Reimer, P.J., 1993, Extended 14C data base and revised CALIB 3.0 14C age calibration program: Radiocarbon, v. 35, p. 215-230. Taylor, E.M., 1986, Impact of time and climate on Quaternary soils in the Yucca Mountain area of the Nevada test site: University of Colorado, Boulder, CO, M.Sc. Thesis. U.S. Soil Conservation Service, 1972, Soil survey laboratory methods and procedures for collecting soil samples: U.S. Department of Agriculture, Soil Survey Investigation Report No. 1.