Ogden, Utah
149
Ogden, Utah Comprehensive Annual Financial Report Year Ended June 30, 2007
-
Upload
khangminh22 -
Category
Documents
-
view
3 -
download
0
Transcript of Ogden, Utah
Ogden, Utah
Comprehensive Annual
Financial Report
Year Ended June 30, 2007

1
COMPREHENSIVE ANNUAL FINANCIAL REPORT OF OGDEN CITY CORPORATION For Year Ended June 30, 2007 Ogden, Utah
Mayor Matthew R. Godfrey City Council Jesse M. Garcia Amy L. Wicks Dorrene Jeske Rick Safsten Doug Stephens Brandon S. Stephenson Susan Van Hooser Prepared by: Department of Management Services Mark L. Johnson, Director
A. John Arrington, CPA, Comptroller Michael D. Goodwin, Treasurer Tracy R. Probert, CPA, Assistant Finance Manager Lisa Stout, Accountant Janine Sherwood, Grants Accountant
Heidi Turbyfill, Accountant Cindi Hellewell, Accounting Technician
2
OGDEN CITY, UTAH COMPREHENSIVE ANNUAL FINANCIAL REPORT
Year Ended June 30, 2007
Table of Contents ____________________________________________________________________________________________
Introductory Section
Title Page…………………………………………………………………………………………………… Table of Contents…………………………………………………………………………………….……... Letter of Transmittal………………………………………………………………………………………… GFOA Certificate of Achievement..………………………………………………………………………… Ogden City Organization Chart…………………………………………………………………………….. Principal City Officials………………………………………………………………………………………
Financial Section Independent Auditors’ Report……………………………………………………………………………… Management's Discussion and Analysis (Unaudited)…...………………………………………………… Basic Financial Statements Government-wide Financial Statements Statement of Net Assets………………………………………………………………………………… Statement of Activities…………………………………………………………………………………. Governmental Fund Financial Statements Balance Sheet…………………………………………………………………………………………… Reconciliation of the Balance Sheet - Governmental Funds to the Statement of Net Assets………….. Statement of Revenues, Expenditures, and Changes in Fund Balances - Governmental Fund…..…….. Reconciliation of the Statement of Revenues, Expenditures and Changes in Fund Balances - Governmental Funds to the Statement of Activities……………………………………. Proprietary Fund Financial Statements Statement of Net Assets………………………………………………………………………………… Statement of Revenues, Expenditures and Changes in Net Assets…….………….…………………… Statement of Cash Flows……………………………………………….………………………………. Notes to the Financial Statements…………………………………………………………………………. Required Supplementary Information Budgetary Comparison Schedule – General Fund………………………………………………………... Budgetary Comparison Schedule – Ogden Redevelopment Agency (Special Revenue Fund)…………… Notes to Required Supplementary Information ………………………………………………………….. Information About Infrastructure Assets Reported using the Modified Approach…………………….…. Supplementary Information - Combining Statements Governmental Funds Nonmajor Governmental Funds Combining Balance Sheet…………………………………………………………………………. Combining Statement of Revenues, Expenditures and Changes in Fund Balance………………… Budgetary Comparison Schedule - Debt Service…………………………………………………………. Budgetary Comparison Schedule - Capital Improvement Projects...……………………………………... Budgetary Comparison Schedule - Municipal Building Authority……………………………………….. Budgetary Comparison Schedule - Downtown Special Assessment……………………………………… Budgetary Comparison Schedule - Union Station……………………………………………………….... Budgetary Comparison Schedule - Cemetery Perpetual Care Expendable Trust……………………….… Budgetary Comparison Schedule – Permanent Trust Gomer A. Nicholas……………………….……….
1 2 4
11 12 13
15 17
25 26
30 33 34
36
38 42 44
48
74 76 77 79
82 83 84 85 86 87 88 89 90
3
OGDEN CITY, UTAH COMPREHENSIVE ANNUAL FINANCIAL REPORT
Year Ended June 30, 2007
Table of Contents, Continued ____________________________________________________________________________________________
Proprietary Funds
Nonmajor Enterprise Funds Combining Statement of Net Assets……………………………………………………………….. Combining Statement of Revenues, Expenditures and Changes in Net Assets……………… Combining Statement of Cash Flows………………………………………………………………. Internal Service Funds Combining Statement of Net Assets………………………………………………………………… Combining Statement of Revenues, Expenditures and Changes in Net Assets………………. Combining Statement of Cash Flows……………………………………………………………….. State of Utah – Impact Fees……………………………………………………………………………
Statistical Section (Unaudited) Financial Trends………………………………………………………………………………….………… Net Assets by Component…………………………..……………………………………………………… Changes in Net Assets………………………………………………..……………………………………. Changes in Fund Balances, Governmental Funds..………………………………………………………... Fund Balances, Governmental Funds…………………………………………………..………………….. Assessed and Estimated Actual Value of Taxable Property………………………………………………. Principal Taxpayers for the Calendar Year 2004…………………………………………………………… Property Tax Appropriations and Collections…………………..…………………………………………. Property Tax Rates, Direct and Overlapping Governments….…………………………………………….. Tax Revenues by Source……………………………………………………………………………………. Ratios of Outstanding Debt by Type……………………………………………………………………..… Ratios of General Bonded Debt Outstanding to Assessed Value and Per Capita……………………….…. Computation of Direct and Overlapping Debt.…………………………………………………………….. Computation of Legal Debt Margin………………………………………………………………………… Revenue Bond Coverage - Water Utility…………………………..………………………………………. Revenue Bond Coverage - Sewer Utility…………………………………………………………………… Revenue Bond Coverage - Refuse Utility………………………………………………………………….. Industrial Revenue Bonds Outstanding..…………………………………………………………………… Demographic and Economic Information………………………………………………………………….. Demographic and Economic Statistics……………………………………………………………………… Largest Employers………………………………………………………………………………………….. Operating Information………………………………………………………………………………………. Full-Time Authorized Employees Summary by Program………………………………………………..…. Operating Indicators by Function/Program………………………………………………………..……….. Capital Assets Statistics by Function/Program……………………………………………………..………. Miscellaneous Statistics………………………………………………………………………………..…… Schedule of Insurance Coverage……………………………………………………………………..…….. Staff per 1,000 Residents…………………………………………………………………………………… Cost per Resident to Run City Government…………………………………………………………………
Page
92
94 96
99 100 101
102
104 105 106 108 110 112 113 114 115 116 118 119 120 121 122 123 124 125 126 127 128 129 130 131 132 133 134 136 137
4
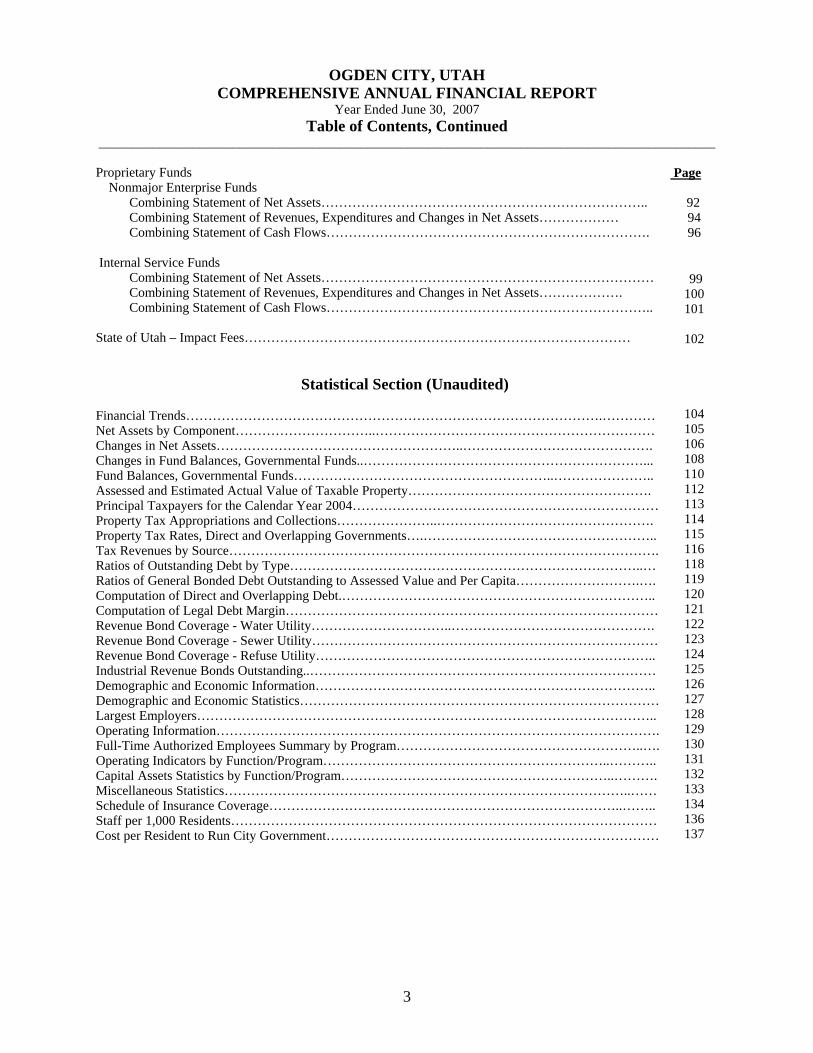
November 16, 2007 Citizens, Honorable Mayor and Members of the City Council City of Ogden Ogden, Utah 84401 Dear Citizens, Mayor and Members of the City Council: We are furnishing you with the Fiscal Year 2006-2007 Comprehensive Annual Financial Report of the City of Ogden, in accordance with Section 10-6-150 of the Utah Code Unannotated 1993. This report has been formatted to comply with the financial reporting model developed by the Governmental Accounting Standards Board (GASB). The statistical section of this report has also been formatted to comply with the new GASB Statement 44. It is intended that this format will provide further information not previously available in governmental financial statements. This report includes Government-Wide Financial Statements. The Government-Wide Financial Statements include a statement of net assets that provide the total net assets of the government, including all capital assets (including infrastructure) and the statement of activities that shows the cost of providing government services. Additional information can be found in Management’s Discussion and Analysis which begins on page 17. Responsibility for both the accuracy of the data, and the completeness and fairness of the presentation, including all disclosures, rests with the City management. To the best of our knowledge, the enclosed data are accurate in all material respects and are reported in a manner designed to fairly present the financial position and results of operations of the City's various funds and account groups. All disclosures necessary to enable the reader to gain an understanding of the City's financial activities have been included. These assertions are based upon a comprehensive framework of internal control that has been established for this purpose. The Comprehensive Annual Financial Report is presented in three sections: Introductory, Financial and Statistical. The Introductory Section includes the title page, the table of contents, this transmittal letter, the City's organization chart, a list of principal officers, and the Certificate of Achievement for Excellence in Financial Reporting for the 2006 Comprehensive Annual Financial Report. The Financial Section includes the basic financial statements and the combining and individual fund financial statements and schedules, as well as the auditors’ report on the financial statements and schedules. This section also includes the management’s discussion and analysis (MD&A). The Statistical Section includes selected financial and demographic information generally presented on a multiyear basis. The City is required to undergo an annual single audit in conformity with the provisions of the Single Audit Act Amendments of 1996 and U.S. Office of Management and Budget Circular A-133, Audits of States, Local Governments, and Non-Profit Organizations. Information related to this single audit, including the Schedule of Federal Awards, findings and recommendations, and auditors’ reports on the internal control structure and compliance with applicable laws and regulations are included in the Single Audit Section of this report. THE REPORTING ENTITY AND ITS SERVICES The City functions under a strong mayor form of government. Under this form of government the Mayor is elected to a full-time position as the Chief Executive over the administration of the City. The City Council serves as the legislative arm of the government and approves and adopts the annual budget. This report includes all the City's funds. The City provides a full range of services. Services provided by the City under general governmental functions include police and fire protection, planning and engineering, code enforcement, street maintenance, traffic control, parks operation and maintenance, recreation services, community development, and general administrative services. In addition, water services, sewer services, solid waste collection and disposal services, the golf courses, certain recreational programs, BDO activities, ambulance and paramedic services are provided under an enterprise fund concept, with user charges set by the City Council to ensure adequate coverage of operating expenses and payments
5
on outstanding debt. The Municipal Airport is handled as an enterprise fund supported, in part, by contributions from the General Fund. Fleet/facilities operations, information technology systems (data processing and telephones) and risk management are handled through internal service funds. The Tax Increment Districts of the Ogden Redevelopment Agency and Union Station are reported as a Special Revenue Fund in this report. The Municipal Building Authority and the Downtown Ogden Special Improvement District are also reported as Special Revenue Funds. The Gomer A. Nicholas Park Endowment is reported as a permanent fund. The interest from this fund is used to improve our parks system.
ACCOUNTING SYSTEM AND BUDGETARY CONTROL In developing and evaluating the City's accounting system, consideration is given to the adequacy of internal accounting controls. Internal accounting controls are designed to provide reasonable, but not absolute, assurance regarding: (1) the safeguarding of assets against loss from unauthorized use or disposition; and (2) the reliability of financial records for preparing financial statements and maintaining accountability for assets. The concept of reasonable assurance recognizes that: (1) the cost of control should not exceed the benefits likely to be derived; and (2) the evaluation of costs and benefits requires estimates and judgments by management. All internal control evaluations occur within the above framework. We believe that the City's internal accounting controls adequately safeguard assets and provide reasonable assurance of proper recording of financial transactions. As a part of the City's single audit, described earlier, tests are made to determine the adequacy of the internal control structure, including that portion related to federal awards, as well as to determine that the City has complied with applicable laws and regulations. The results of the City's single audit for the fiscal year ending June 30, 2007 can be found in a supplemental report, prepared by our auditors, which accompanies this report. In addition, the City maintains budgetary controls. The objective of these budgetary controls is to ensure compliance with legal provisions embodied in the annual appropriated budget approved by the City Council. Activities of all funds used by the City are included in the annual appropriated budget. Project-length financial plans are adopted for the Capital Improvement Projects Fund. The level of budgetary control (that is, the level at which expenditures cannot legally exceed the appropriated amount) is established at department level within an individual fund. The City also maintains an encumbrance accounting system as one technique of accomplishing budgetary control. Encumbered amounts lapse at year-end. However, encumbrances are generally re-appropriated as part of the following year's budget, and reserves for such are indicated as a portion of fund balances. ECONOMIC CONDITION AND OUTLOOK
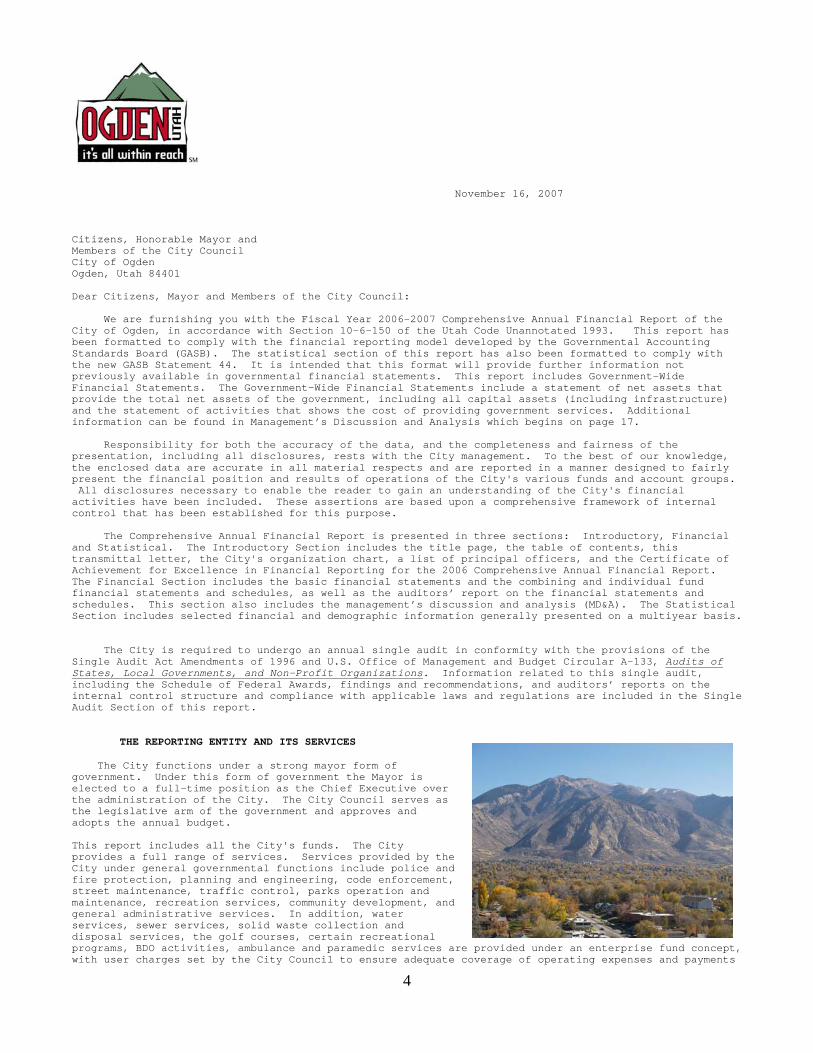
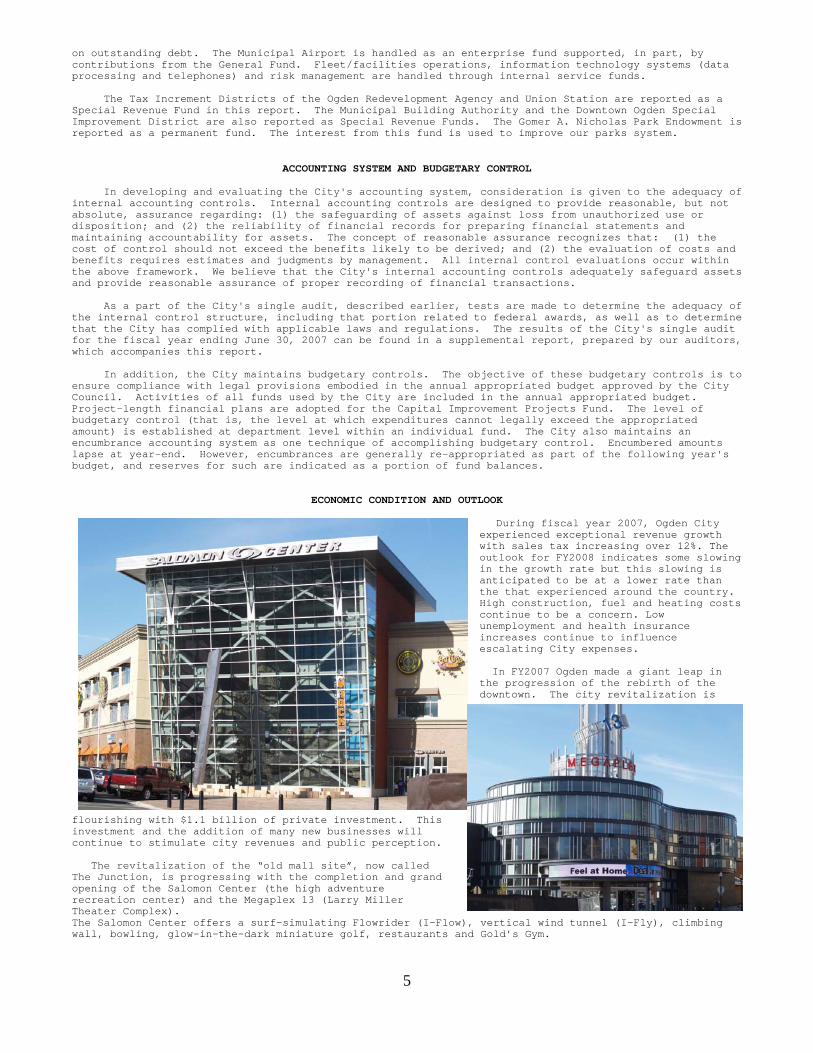
During fiscal year 2007, Ogden City experienced exceptional revenue growth with sales tax increasing over 12%. The outlook for FY2008 indicates some slowing in the growth rate but this slowing is anticipated to be at a lower rate than the that experienced around the country. High construction, fuel and heating costs continue to be a concern. Low unemployment and health insurance increases continue to influence escalating City expenses. In FY2007 Ogden made a giant leap in the progression of the rebirth of the downtown. The city revitalization is
flourishing with $1.1 billion of private investment. This investment and the addition of many new businesses will continue to stimulate city revenues and public perception. The revitalization of the “old mall site”, now called The Junction, is progressing with the completion and grand opening of the Salomon Center (the high adventure recreation center) and the Megaplex 13 (Larry Miller Theater Complex). The Salomon Center offers a surf-simulating Flowrider (I-Flow), vertical wind tunnel (I-Fly), climbing wall, bowling, glow-in-the-dark miniature golf, restaurants and Gold’s Gym.

Ogden City Corporation
Letter of Transmittal
6
The Boyer Company has just completed a six story class “A” office building. They also currently have two restaurants under construction. Property Reserve Inc. is building a 75,000-square-foot office-retail building with underground parking and ground floor retail space. Currently under construction is the Earnshaw Building featuring 28 upscale downtown condominiums. Construction will begin soon on Ashton Square, a 224,000 square-foot condominium and commercial building. The seven stories will house 66 condominiums two restaurants along with commercial space. In the last six years the city has already redeveloped 45 acres in the downtown and still has at least 130 acres coming in varied phases of development. This renaissance is not all brick–and–mortar but the addition of other high adventure improvements such as the XTERRA Mountain Championship, the Ogden Marathon, Farmer’s Market, alpine mountain biking, hiking, fishing, kayaking, rock and ice climbing, Ogden is well on its way to being an outdoor destination. The Ogden River Project is progressing in phase one of the redevelopment, the most ambitious of the city’s redevelopment efforts. The $150 million, three-phase plan encompasses about 60 acres around the river and north of 20th Street. The first phase, a 12-acre parcel between Washington Boulevard and Grant
Avenue, was approved by the City Council for commercial development. The first ground breaking took place in the early spring of 2007 and will be the future home of Bingham Cyclery. Ernest Health, Inc. (EHI) has announced plans to build and operate a 40-bed inpatient rehabilitation facility with preliminary plans calling for ground breaking of the 48,000 square foot facility to be held in the first quarter 2008. Approximately 120 new healthcare related jobs will be created from this endeavor. Commitments are in place on the six remaining parcels in phase I of the project. During the past few years Ogden has become home to a number of new ski
companies including Descente, SnowSports, Nidecker, Interactive, GOODE Ski Technologies, Scott USA and Kahuna Creations. The American Can Complex has been substantially remodeled during this last year to become the new headquarters of Amer Sports Corp. parent company of Salomon, Atomic and Suunto brands. Amer Sports President/General Manager Mike Dowse stated at the recent ribbon cutting, “We considered several Western cities, but now that we’ve moved to Ogden, we are even more convinced we selected the ideal home. Being in Ogden lets us strengthen our platform and brands, and provide the very best customer service.” In the last seven years Ogden has recruited 6,755 new jobs including Adams Aircraft, Fresenius Medical Expansion, Williams International, US Foods, and Hershey’s Chocolate.
The Kemp development at the Airport continues to grow with construction almost complete on a new facility for Adam Aircraft Industries to begin full assembly of its A500 twin-engine piston airplane and A700 AdamJet. The 96,000 square foot facility will have about 400 employees producing
10 planes per month. Senator Orrin Hatch stated at the ground breaking ceremony “Ogden and Weber County are blossoming. I see Ogden becoming a very intense place, with people vying to come here and set up their business.”
Ogden City Corporation
Letter of Transmittal
7
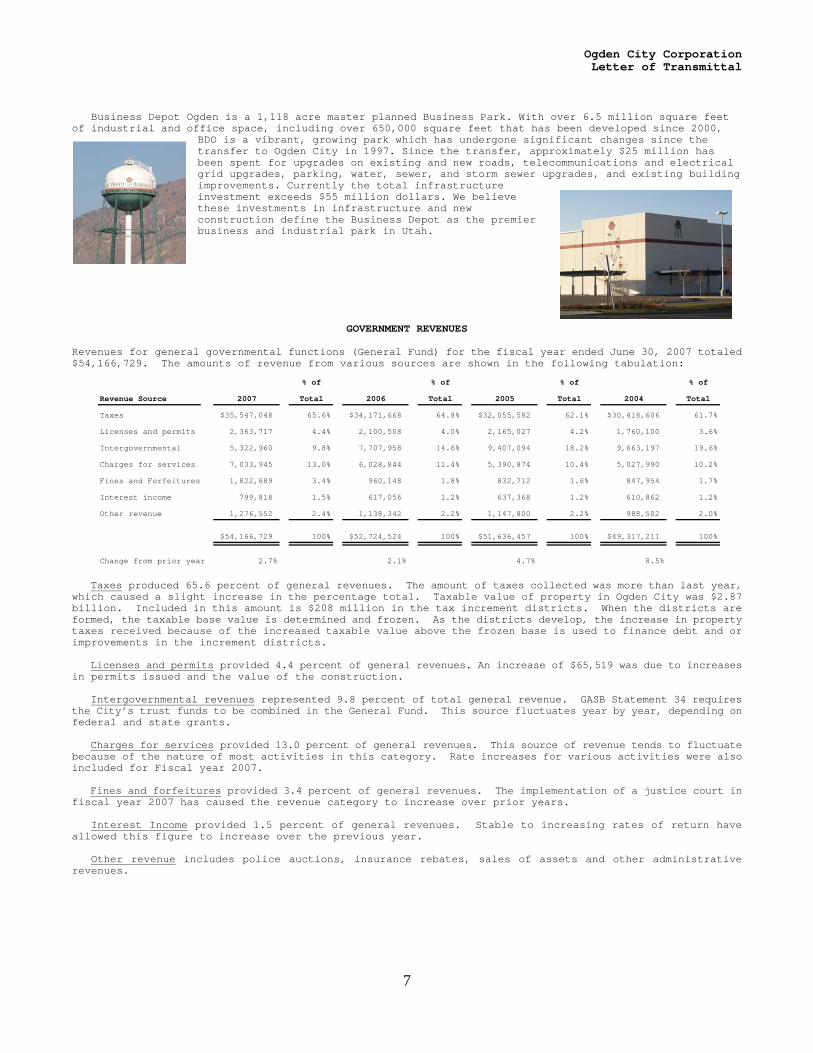
Business Depot Ogden is a 1,118 acre master planned Business Park. With over 6.5 million square feet of industrial and office space, including over 650,000 square feet that has been developed since 2000,
BDO is a vibrant, growing park which has undergone significant changes since the transfer to Ogden City in 1997. Since the transfer, approximately $25 million has been spent for upgrades on existing and new roads, telecommunications and electrical grid upgrades, parking, water, sewer, and storm sewer upgrades, and existing building improvements. Currently the total infrastructure investment exceeds $55 million dollars. We believe these investments in infrastructure and new construction define the Business Depot as the premier business and industrial park in Utah.
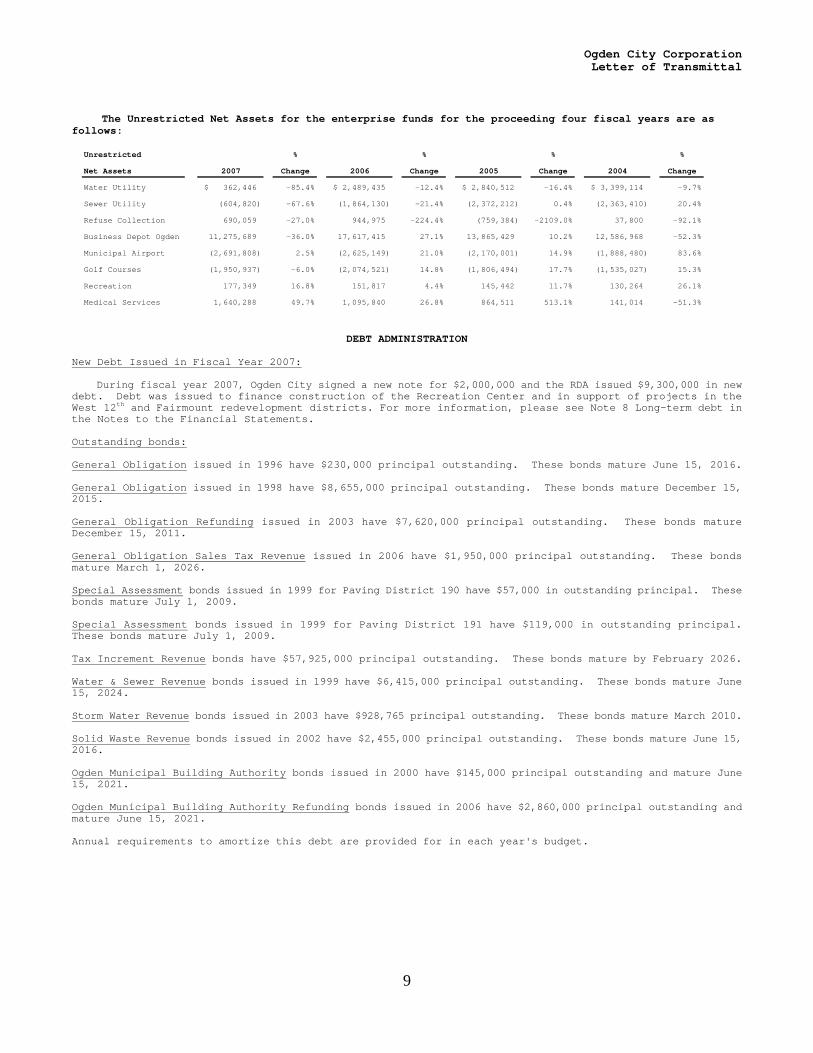
GOVERNMENT REVENUES Revenues for general governmental functions (General Fund) for the fiscal year ended June 30, 2007 totaled $54,166,729. The amounts of revenue from various sources are shown in the following tabulation:
Taxes produced 65.6 percent of general revenues. The amount of taxes collected was more than last year, which caused a slight increase in the percentage total. Taxable value of property in Ogden City was $2.87 billion. Included in this amount is $208 million in the tax increment districts. When the districts are formed, the taxable base value is determined and frozen. As the districts develop, the increase in property taxes received because of the increased taxable value above the frozen base is used to finance debt and or improvements in the increment districts. Licenses and permits provided 4.4 percent of general revenues. An increase of $65,519 was due to increases in permits issued and the value of the construction. Intergovernmental revenues represented 9.8 percent of total general revenue. GASB Statement 34 requires the City’s trust funds to be combined in the General Fund. This source fluctuates year by year, depending on federal and state grants. Charges for services provided 13.0 percent of general revenues. This source of revenue tends to fluctuate because of the nature of most activities in this category. Rate increases for various activities were also included for Fiscal year 2007. Fines and forfeitures provided 3.4 percent of general revenues. The implementation of a justice court in fiscal year 2007 has caused the revenue category to increase over prior years. Interest Income provided 1.5 percent of general revenues. Stable to increasing rates of return have allowed this figure to increase over the previous year. Other revenue includes police auctions, insurance rebates, sales of assets and other administrative revenues.
% of % of % of % of
Revenue Source 2007 Total 2006 Total 2005 Total 2004 Total
Taxes 35,547,048$ 65.6% 34,171,668$ 64.8% 32,055,582$ 62.1% 30,418,606$ 61.7%
Licenses and permits 2,363,717 4.4% 2,100,508 4.0% 2,165,027 4.2% 1,760,100 3.6%
Intergovernmental 5,322,960 9.8% 7,707,958 14.6% 9,407,094 18.2% 9,663,197 19.6%
Charges for services 7,033,945 13.0% 6,028,844 11.4% 5,390,874 10.4% 5,027,990 10.2%
Fines and Forfeitures 1,822,689 3.4% 960,148 1.8% 832,712 1.6% 847,954 1.7%
Interest income 799,818 1.5% 617,056 1.2% 637,368 1.2% 610,862 1.2%
Other revenue 1,276,552 2.4% 1,138,342 2.2% 1,147,800 2.2% 988,502 2.0%
54,166,729$ 100% 52,724,524$ 100% 51,636,457$ 100% 49,317,211$ 100%
Change from prior year 2.7% 2.1% 4.7% 8.5%

Ogden City Corporation
Letter of Transmittal
8
GENERAL FUND EXPENDITURES Expenditures for general governmental purposes (General Fund) for the fiscal year ended June 30, 2007 totaled $50,662,871. Levels of expenditures for major functions of the city are as follows:
This year a 2% cost of living increase and up to a 5% merit increase were budgeted or provided for the employees. The City also covered the increase cost of health care insurance. Because of this compensation position, action was taken to hold employee costs for the City relatively neutral. In total, basic operating costs for the City remained, essentially, the same as last year. Community and Economic Development had a decrease in spending due to the slowing of activities in the central business district related to the new recreation center. There are a couple of reasons for the debt service increase in cost. First, there were some bonds that matured during the year and final year payments were made, which were greater than yearly payments. Secondly, as indicated in the financial statements, there were some new bond issues and loans in the prior year that added to the current year payment schedules.
FUND BALANCE GUIDELINES Utah State Code Section 10-6-116 establishes guidelines on the use of fund balance in the General Fund. As outlined, any fund balance in excess of five percent of estimated revenues may be utilized for budget purposes. The section further indicates the fund balance shall not exceed eighteen percent of estimated revenues. Under these guidelines the City's fund balance parameters are approximately $2,734,254 and $9,843,313 based on next fiscal year's budgeted receipts. The unreserved portion of the General Fund balance at June 30, 2007 is $3,983,421.
ENTERPRISE FUNDS The Income before Transfers and Capital Contributions for the enterprise funds for the proceeding four fiscal years are as follows:
The above table shows the income (loss) generated by each fund rather than presenting the total change in net assets due to the effect of the inclusion of large capital contributions from outside donors and transfers of infrastructure assets from Business Depot Ogden to the Water and Sewer funds.
Income before
transfers and % % % %
capital contributions 2007 Change 2006 Change 2005 Change 2004 Change
Water Utility (301,647)$ -31.3% (438,945)$ -52.7% (928,089)$ -344.8% 379,108$ -81.4%
Sewer Utility 1,113,417 105.0% 543,224 50.2% 361,635 -63.4% 989,018 -58.7%
Refuse Collection (112,059) -106.1% 1,842,288 -392.5% (629,826) 87.1% (336,569) -1235.6%
Business Depot Ogden (1,765,751) -148.7% 3,626,452 -307.8% (1,744,879) -253.7% 1,135,617 -70.5%
Municipal Airport (1,055,005) 9.1% (967,077) 132.2% (416,475) -123.5% 1,769,583 35.5%
Golf Courses (288,679) -15.6% (341,839) -199.2% 344,506 -259.2% (216,345) -37.6%
Recreation 24,754 89.7% 13,046 -14.2% 15,198 -44.0% 27,140 17.3%
Medical Services 544,448 135.4% 231,329 -68.0% 723,497 -587.3% (148,462) -59.9%
Expenditure by % of % of % of % of
Function 2007 Total 2006 Total 2005 Total 2004 Total
General Government 8,486,509$ 16.8% 7,080,910$ 13.8% 6,408,230$ 12.8% 6,678,608$ 13.6%
Police and Fire 20,297,040 40.1% 20,593,990 40.1% 19,288,031 38.5% 19,476,661 39.7%
Public Services 11,476,628 22.7% 9,999,399 19.5% 9,602,042 19.2% 9,690,761 19.8%
Community and
Economic Development 8,069,516 15.9% 11,499,394 22.4% 12,672,324 25.3% 10,801,179 22.0%
Debt Service 2,333,178 4.6% 2,205,759 4.3% 2,166,442 4.3% 2,376,658 4.8%
50,662,871$ 100% 51,379,452$ 100% 50,137,069$ 100% 49,023,867$ 100%
Change from prior year -1.4% 2.5% 2.3% 7.0%
Ogden City Corporation
Letter of Transmittal
9
The Unrestricted Net Assets for the enterprise funds for the proceeding four fiscal years are as follows:
DEBT ADMINISTRATION New Debt Issued in Fiscal Year 2007:
During fiscal year 2007, Ogden City signed a new note for $2,000,000 and the RDA issued $9,300,000 in new debt. Debt was issued to finance construction of the Recreation Center and in support of projects in the West 12th and Fairmount redevelopment districts. For more information, please see Note 8 Long-term debt in the Notes to the Financial Statements. Outstanding bonds: General Obligation issued in 1996 have $230,000 principal outstanding. These bonds mature June 15, 2016. General Obligation issued in 1998 have $8,655,000 principal outstanding. These bonds mature December 15, 2015. General Obligation Refunding issued in 2003 have $7,620,000 principal outstanding. These bonds mature December 15, 2011. General Obligation Sales Tax Revenue issued in 2006 have $1,950,000 principal outstanding. These bonds mature March 1, 2026. Special Assessment bonds issued in 1999 for Paving District 190 have $57,000 in outstanding principal. These bonds mature July 1, 2009. Special Assessment bonds issued in 1999 for Paving District 191 have $119,000 in outstanding principal. These bonds mature July 1, 2009. Tax Increment Revenue bonds have $57,925,000 principal outstanding. These bonds mature by February 2026. Water & Sewer Revenue bonds issued in 1999 have $6,415,000 principal outstanding. These bonds mature June 15, 2024. Storm Water Revenue bonds issued in 2003 have $928,765 principal outstanding. These bonds mature March 2010. Solid Waste Revenue bonds issued in 2002 have $2,455,000 principal outstanding. These bonds mature June 15, 2016. Ogden Municipal Building Authority bonds issued in 2000 have $145,000 principal outstanding and mature June 15, 2021. Ogden Municipal Building Authority Refunding bonds issued in 2006 have $2,860,000 principal outstanding and mature June 15, 2021. Annual requirements to amortize this debt are provided for in each year's budget.
Unrestricted % % % %
Net Assets 2007 Change 2006 Change 2005 Change 2004 Change
Water Utility 362,446$ -85.4% 2,489,435$ -12.4% 2,840,512$ -16.4% 3,399,114$ -9.7%
Sewer Utility (604,820) -67.6% (1,864,130) -21.4% (2,372,212) 0.4% (2,363,410) 20.4%
Refuse Collection 690,059 -27.0% 944,975 -224.4% (759,384) -2109.0% 37,800 -92.1%
Business Depot Ogden 11,275,689 -36.0% 17,617,415 27.1% 13,865,429 10.2% 12,586,968 -52.3%
Municipal Airport (2,691,808) 2.5% (2,625,149) 21.0% (2,170,001) 14.9% (1,888,480) 83.6%
Golf Courses (1,950,937) -6.0% (2,074,521) 14.8% (1,806,494) 17.7% (1,535,027) 15.3%
Recreation 177,349 16.8% 151,817 4.4% 145,442 11.7% 130,264 26.1%
Medical Services 1,640,288 49.7% 1,095,840 26.8% 864,511 513.1% 141,014 -51.3%


OGDEN CITY CORPORATIONORGANIZATIONAL STRUCTURE
CITY MAYORCOUNCIL
COUNCIL CHIEF ADMIN LEGALSTAFF OFFICER
MANAGEMENT PUBLIC FIRE POLICE COMMUNITY &SERVICES SERVICES ECONOMIC DEV
- Administration - Administration - Administration - Administration - Administration
- Comptroller - Animal - Prevention - Support - Planning Services Services
12 - Fiscal - Operations - Community Operations - Parks - Uniform Development
- Medical - Human Resources - Cemetery Services - Business
Development - Recorder - Recreation
- Arts, Culture - Fleet & - Engineering & Events Facilities
- Golf - Airport - Information Courses Technology - BDO (DDO Reuse)
- Streets - Risk - Building Services Management - Water
Utility - Justice Court
- Sewer Utility
- Sanitation Operation
13
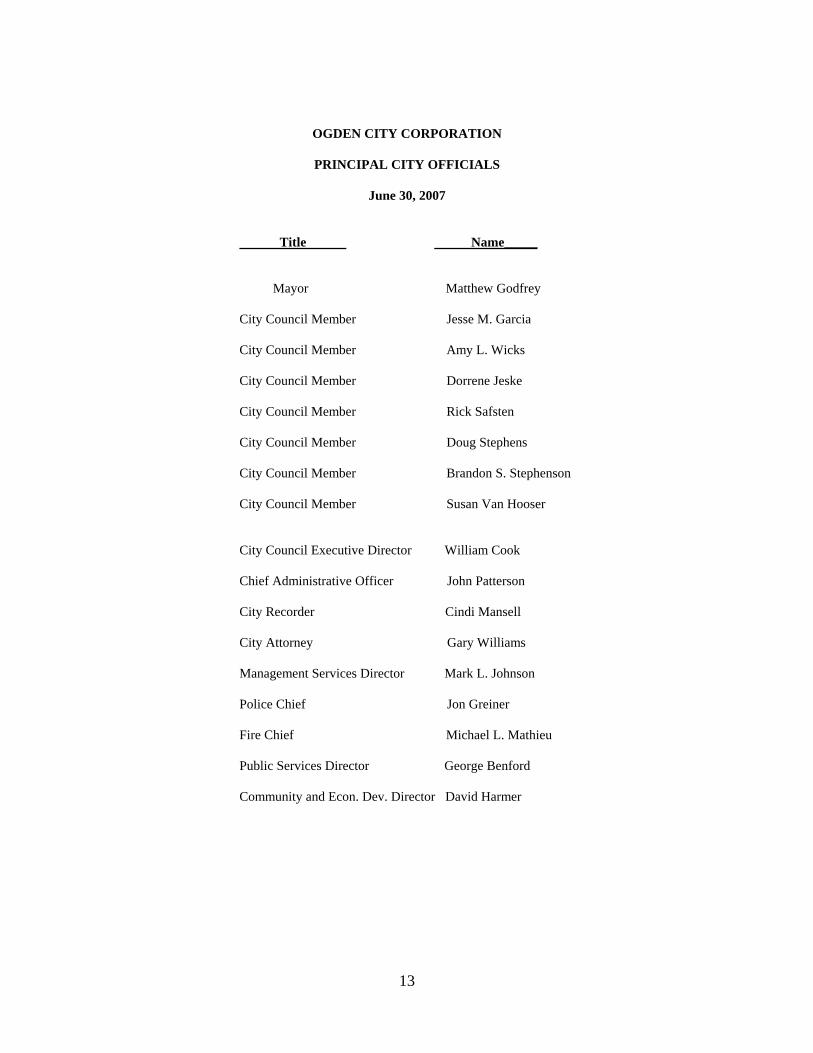
OGDEN CITY CORPORATION PRINCIPAL CITY OFFICIALS June 30, 2007
Title Name_____ Mayor Matthew Godfrey City Council Member Jesse M. Garcia City Council Member Amy L. Wicks City Council Member Dorrene Jeske
City Council Member Rick Safsten
City Council Member Doug Stephens
City Council Member Brandon S. Stephenson
City Council Member Susan Van Hooser City Council Executive Director William Cook
Chief Administrative Officer John Patterson City Recorder Cindi Mansell City Attorney Gary Williams
Management Services Director Mark L. Johnson
Police Chief Jon Greiner
Fire Chief Michael L. Mathieu
Public Services Director George Benford
Community and Econ. Dev. Director David Harmer

14
THIS PAGE INTENTIONALLY LEFT BLANK

Financial Section


OGDEN CITY, UTAH MANAGEMENT’S DISCUSSION AND ANALYSIS (UNAUDITED)
Year Ended June 30, 2007
17
INTRODUCTION The following is a discussion and analysis of Ogden City’s financial performance and activities for the year ended June 30, 2007. Please read it in conjunction with the transmittal letter in the Introductory Section of this report and with the financial statements that follow. HIGHLIGHTS Government-wide
• The City’s total net assets increased $8,284,742 or 2.9 percent from the prior year. Net assets of governmental activities increased $8,669,097 or 8.4 percent, and net assets of business-type activities decreased by $384,355 or 0.3 percent.
Fund Level • Fund balances in the City’s governmental funds decreased $1,015,173 or 3.6 percent from the prior year, mostly
due to debt activities and spending of debt proceeds on the new high adventure recreation center. • Property tax revenues were 3.58 percent lower than the prior year due to stabilization of the property tax base
throughout the City. The City’s total sales taxes increased 12.0 percent indicating that the local economy continues to be very strong and growing at a steady pace.
Long-term Debt • The City’s long-term debt increased due to borrowings in the Redevelopment Agency (RDA) and by the City
for the high adventure recreation center. • The City signed a new HUD 108 loan, while the RDA issued the 2006 and 2007 Tax Increment Revenue Bonds
associated with the West 12th and Fairmount District projects. OVERVIEW OF THE FINANCIAL STATEMENTS This discussion and analysis is an introduction to the City’s Basic Financial Statements. The Basic Financial Statements include three components: 1) government-wide financial statements, 2) fund financial statements, and 3) notes to the financial statements. In addition to the Basic Financial Statements, this report also contains other supplementary information including combining statements for nonmajor funds and a statistical section. Government-wide Statements - Reporting the City as a Whole The Statement of Net Assets and the Statement of Activities beginning on page 25 comprise the government-wide financial statements. These statements provide a broad overview with a long-term focus of the City’s finances as a whole and are prepared using the full-accrual basis of accounting, similar to private-sector companies. This means all revenues and expenses are recognized regardless of when cash is received or spent, and all assets and liabilities, including capital assets and long-term debt, are reported at the entity level. The government-wide statements report the City’s net assets - the difference between total assets and total liabilities - and how they have changed from the prior year. Over time, increases and decreases in net assets measure whether the City’s overall financial condition is getting better or worse. In evaluating the government’s overall condition, however additional non-financial factors should be considered such as the City’s economic outlook, changes in its demographics, and the condition of its capital assets and infrastructure. The government-wide statements distinguish functions of the City that are principally supported by taxes and intergovernmental revenues (governmental activities) from other functions that are intended to recover all or most of their costs through user fees and charges (business-type activities). Ogden City’s governmental activities include general administration, public safety, transportation, environmental protection leisure opportunities, and community development. The City’s business-type activities include certain operations for utilities, medical services, airport, recreation and property management. Fund Financial Statements - Reporting the City’s Most Significant Funds The fund financial statements beginning on page 29 provide detailed information about individual major funds, and not the City as a whole. A fund is a group of related accounts that the City uses to keep track of specific resources that are segregated for a specific purpose. Some funds are required by law to exist, while others are established internally to maintain control over a particular activity. All of the City’s funds are divided into two types, each type uses a different accounting approach.

OGDEN CITY, UTAH MANAGEMENT’S DISCUSSION AND ANALYSIS (UNAUDITED)
Year Ended June 30, 2007
18
Governmental Funds - Most of the City’s basic services are accounted for in governmental funds and are essentially the same functions reported as governmental activities in the government-wide statements. Governmental funds use the modified accrual basis of accounting, which measures the flow of current financial resources that can be converted to cash and the balances left at year-end that are available for future spending. This short-term view of the City’s financial position helps determine whether the City has sufficient resources to cover expenditures for its basic services in the near future. Proprietary Funds - Ogden City uses two different types of proprietary funds. Enterprise funds are used to report the same functions presented as business-type activities in the government-wide financial statements. The City has ten enterprise funds which include water, sewer, airport, pioneer days, golf courses, refuse, BDO (Business Depot Ogden), recreation, Union Station, and medical services activities. Internal service funds are an accounting device used to accumulate and allocate costs internally among the City’s various functions. The City maintains three internal service funds to account for its fleet and facilities, risk management, and management information systems activities. Because those services predominantly benefit governmental rather than business-type activities, they are included with governmental activities in the government-wide statements. Reconciliation between Government-wide and Fund Statements The financial statements include schedules on pages 33 and 36 that reconcile the amounts reported for governmental activities on the government-wide statements (full-accrual accounting, long-term focus) with amounts reported on the governmental fund statements (modified accrual accounting, short-term focus). Following are some of the major differences between the two statements:
• Capital assets and long-term debt are included on the government-wide statements but are not reported on the governmental fund statements.
• Capital outlays result in capital assets on the government-wide statements but are expenditures on the governmental fund statements.
• Bond proceeds result in liabilities on the government-wide statements but are other financing sources on the governmental fund statements.
• Certain tax revenues that are earned but not yet available are reported as revenue on the government-wide statements but are unearned revenue on the governmental fund statements.
Notes to the Financial Statements The notes beginning on page 48 provide additional schedules and information that are essential to a complete understanding of the financial statements. The notes apply to both the government-wide financial statements and the fund financial statements. Required Supplementary Information Ogden City adopts an annual budget for all of its governmental and proprietary funds. Beginning on page 75 are budgetary comparison schedules for the City’s General and major Special Revenue funds. Supplementary Information Supplementary information includes combining statements for the City’s nonmajor governmental funds, internal service funds, and nonmajor enterprise funds. FINANCIAL ANALYSIS OF THE CITY AS A WHOLE Net Assets The largest component of the City’s net assets, 87.1 percent, reflects investments in capital assets (land, buildings, equipment, roads, and other infrastructure) less all outstanding debt that was issued to buy or build those assets. As capital assets, these resources are not available for future spending, nor can they all be readily liquidated to pay off the related liabilities. Resources needed to repay capital-related debt must be provided from other sources. Restricted net assets comprise 8.5 percent of total net assets and are subject to external restrictions on how they may be used. Unrestricted net assets is $12,727,643 or 4.4 percent of total net assets.
OGDEN CITY, UTAH MANAGEMENT’S DISCUSSION AND ANALYSIS (UNAUDITED)
Year Ended June 30, 2007
19
Ogden City Corporation
Net Assets
June 30,
Governmental Business-type
Activities Activities Total
2007 2006 2007 2006 2007 2006
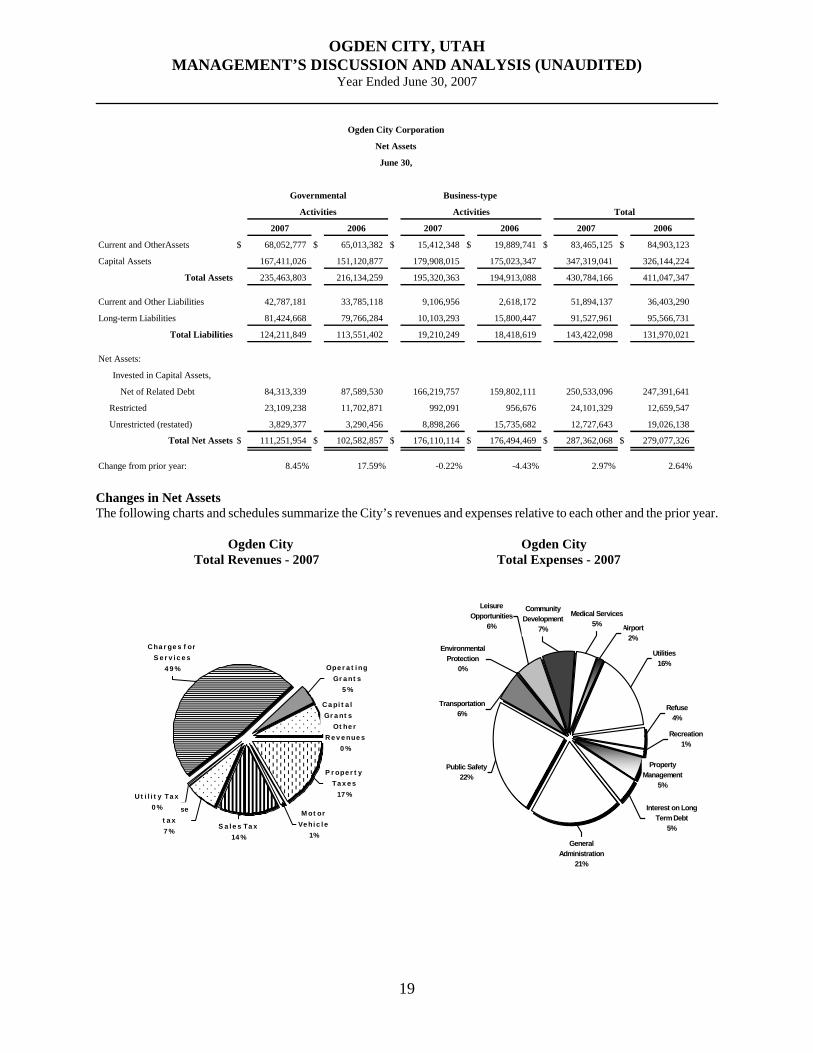
Current and OtherAssets $ 68,052,777 $ 65,013,382 $ 15,412,348 $ 19,889,741 $ 83,465,125 $ 84,903,123
Capital Assets 167,411,026 151,120,877 179,908,015 175,023,347 347,319,041 326,144,224
Total Assets 235,463,803 216,134,259 195,320,363 194,913,088 430,784,166 411,047,347
Current and Other Liabilities 42,787,181 33,785,118 9,106,956 2,618,172 51,894,137 36,403,290
Long-term Liabilities 81,424,668 79,766,284 10,103,293 15,800,447 91,527,961 95,566,731
Total Liabilities 124,211,849 113,551,402 19,210,249 18,418,619 143,422,098 131,970,021
Net Assets:
Invested in Capital Assets,
Net of Related Debt 84,313,339 87,589,530 166,219,757 159,802,111 250,533,096 247,391,641
Restricted 23,109,238 11,702,871 992,091 956,676 24,101,329 12,659,547
Unrestricted (restated) 3,829,377 3,290,456 8,898,266 15,735,682 12,727,643 19,026,138
Total Net Assets $ 111,251,954 $ 102,582,857 $ 176,110,114 $ 176,494,469 $ 287,362,068 $ 279,077,326
Change from prior year: 8.45% 17.59% -0.22% -4.43% 2.97% 2.64% Changes in Net Assets The following charts and schedules summarize the City’s revenues and expenses relative to each other and the prior year.
Ogden City Ogden City Total Revenues - 2007 Total Expenses - 2007
Ca pi t a l Gr a nt s
7 %Ot he r Re v e nue s
0 %
M ot or Ve hi c l e
1%
Ope r a t i ng Gr a nt s
5 %
P r ope r t y Ta x e s
17 %
S a l e s Ta x14 %
Fr a nc hi se t a x7 %
Cha r ge s f or S e r v i c e s
4 9 %
Ut i l i t y Ta x0 %
Property Management
5%
Recreation1%
Refuse4%
Airport2%
Medical Services5%
Environmental Protection
0%
Leisure Opportunities
6%
Transportation6%
Public Safety22%
Interest on Long Term Debt
5%
Community Development
7%
General Administration
21%
Utilities16%
OGDEN CITY, UTAH MANAGEMENT’S DISCUSSION AND ANALYSIS (UNAUDITED)
Year Ended June 30, 2007
20
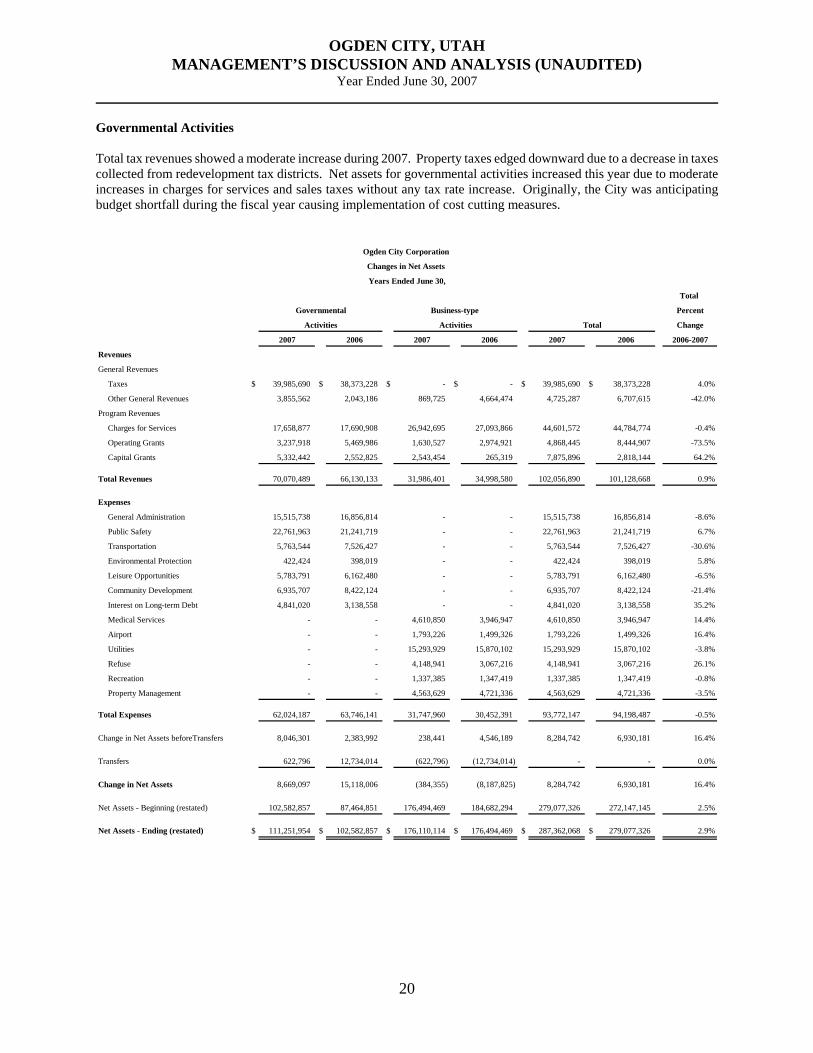
Governmental Activities Total tax revenues showed a moderate increase during 2007. Property taxes edged downward due to a decrease in taxes collected from redevelopment tax districts. Net assets for governmental activities increased this year due to moderate increases in charges for services and sales taxes without any tax rate increase. Originally, the City was anticipating budget shortfall during the fiscal year causing implementation of cost cutting measures.
Ogden City Corporation
Changes in Net Assets
Years Ended June 30,
Total
Governmental Business-type Percent
Activities Activities Total Change
2007 2006 2007 2006 2007 2006 2006-2007
Revenues
General Revenues
Taxes $ 39,985,690 $ 38,373,228 $ - $ - $ 39,985,690 $ 38,373,228 4.0%
Other General Revenues 3,855,562 2,043,186 869,725 4,664,474 4,725,287 6,707,615 -42.0%
Program Revenues
Charges for Services 17,658,877 17,690,908 26,942,695 27,093,866 44,601,572 44,784,774 -0.4%
Operating Grants 3,237,918 5,469,986 1,630,527 2,974,921 4,868,445 8,444,907 -73.5%
Capital Grants 5,332,442 2,552,825 2,543,454 265,319 7,875,896 2,818,144 64.2%
Total Revenues 70,070,489 66,130,133 31,986,401 34,998,580 102,056,890 101,128,668 0.9%
Expenses
General Administration 15,515,738 16,856,814 - - 15,515,738 16,856,814 -8.6%
Public Safety 22,761,963 21,241,719 - - 22,761,963 21,241,719 6.7%
Transportation 5,763,544 7,526,427 - - 5,763,544 7,526,427 -30.6%
Environmental Protection 422,424 398,019 - - 422,424 398,019 5.8%
Leisure Opportunities 5,783,791 6,162,480 - - 5,783,791 6,162,480 -6.5%
Community Development 6,935,707 8,422,124 - - 6,935,707 8,422,124 -21.4%
Interest on Long-term Debt 4,841,020 3,138,558 - - 4,841,020 3,138,558 35.2%
Medical Services - - 4,610,850 3,946,947 4,610,850 3,946,947 14.4%
Airport - - 1,793,226 1,499,326 1,793,226 1,499,326 16.4%
Utilities - - 15,293,929 15,870,102 15,293,929 15,870,102 -3.8%
Refuse - - 4,148,941 3,067,216 4,148,941 3,067,216 26.1%
Recreation - - 1,337,385 1,347,419 1,337,385 1,347,419 -0.8%
Property Management - - 4,563,629 4,721,336 4,563,629 4,721,336 -3.5%
Total Expenses 62,024,187 63,746,141 31,747,960 30,452,391 93,772,147 94,198,487 -0.5%
Change in Net Assets beforeTransfers 8,046,301 2,383,992 238,441 4,546,189 8,284,742 6,930,181 16.4%
Transfers 622,796 12,734,014 (622,796) (12,734,014) - - 0.0%
Change in Net Assets 8,669,097 15,118,006 (384,355) (8,187,825) 8,284,742 6,930,181 16.4%
Net Assets - Beginning (restated) 102,582,857 87,464,851 176,494,469 184,682,294 279,077,326 272,147,145 2.5%
Net Assets - Ending (restated) $ 111,251,954 $ 102,582,857 $ 176,110,114 $ 176,494,469 $ 287,362,068 $ 279,077,326 2.9%

OGDEN CITY, UTAH MANAGEMENT’S DISCUSSION AND ANALYSIS (UNAUDITED)
Year Ended June 30, 2007
21
The table below shows to what extent the City’s governmental activities relied on taxes and other general revenue to cover their costs. For 2007, these programs generated $26,229,237 million or 42.3 percent of their total expenses through charges for services and grants. Taxes and other general revenues covered the remaining 57.7 percent of expenses.
Business-type Activities The business-type activities are generating sufficient revenue, before capital contributions and transfers, to cover costs in the Sewer, Recreation, and Medical Services Funds. Reduction in net assets occurred in the Water, Refuse, BDO Property Management, Golf and Airport funds. This combined with non-operating transfer and capital contribution activities resulted in a decrease in net assets of $384,355 for the combined business activities. CAPITAL ASSETS AND LONG-TERM DEBT ADMINISTRATION Capital Assets Ogden City added $33,027,931 in new capital assets during 2007. Buildings and improvements increased $11,819,782, equipment increased $1,691,322, and construction in progress increased $15,657,019. The City sold or disposed of $304,247 in capital assets. During the year, the BDO Property Management Fund transferred improvements totaling $597,171, $988,689 and $1,585,860 to the Water, Sewer and General fixed assets, respectively, for a total transfer of $3,171,720. Infrastructure The City has elected to use the modified-approach for reporting infrastructure. This election allows the City to forego reporting depreciation on infrastructure assets, provided that the City has made a commitment to maintain those particular assets at predetermined condition levels. Detailed information on the City’s modified approach for reporting infrastructure is presented in the Required Supplementary Information on page 79. During the year, there were no significant changes in condition levels of infrastructure assets. For the past four years, the City has been able to maintain infrastructure at a level approximately 5% above its committed level of maintenance of 50% for “Fair or better” condition on Roads and Bridges. Roads and bridges with a rating of “very poor” were below the 15% maximum allowable level for the past 4 years.
Ogden City
Net Cost of Governmental Activities
Years Ended June 30
Program Revenues
Less Net as a Percentage
Program Program Program of Program
Expenses Revenues Costs Expenses
2007 2007 2007 2006 2007 2006
Activities
General Administration $ 15,515,738 $ (7,748,767) $ 7,766,971 $ 7,189,234 49.9% 64.2%
Public Safety 22,761,963 (3,261,201) 19,500,762 17,853,399 14.3% 16.0%
Transportation 5,763,544 (4,806,214) 957,330 4,973,602 83.4% 33.9%
Environmental Protection 422,424 (3,344,855) (2,922,431) (2,682,500) 791.8% 774.0%
Leisure Opportunities 5,783,791 (1,147,366) 4,636,425 5,055,793 19.8% 18.0%
Community Development 6,935,707 (5,920,834) 1,014,873 2,239,885 85.4% 73.4%
Interest on Long-term Debt 4,841,020 - 4,841,020 3,138,558 0.0% 0.0%
Total Governmental Activities $ 62,024,187 $ (26,229,237) $ 35,794,951 $ 37,767,971 42.3% 43.6%

OGDEN CITY, UTAH MANAGEMENT’S DISCUSSION AND ANALYSIS (UNAUDITED)
Year Ended June 30, 2007
22
The City spent less than estimated for maintenance of condition levels in the current year. Nevertheless, the City spent more in the current year than any of the previous 4 years showing commitment to maintain quality infrastructure. During fiscal year 2007 the City spent $3,600,085 on infrastructure compared to a budget estimate of $4,248,487. More information about capital assets is included in Note 5 on page 59. Long-term Debt During 2007, The City signed a new HUD 108 loan as a partial funding source for the new high adventure recreation center. The RDA issued the 2006 and 2007 Tax Increment Revenue Bonds to finance activities in the West 12th and Fairmount RDA districts. Note 8 on page 61 provides more information on the City’s long-term debt activity for the year. The following table presents changes in Ogden City’s long-term obligations in relation to the previous year.
FINANCIAL ANALYSIS OF THE CITY’S FUNDS Fund Balances At June 30, 2007, Ogden City’s governmental funds reported combined fund balances of $27,751,305. An amount of, $21,456,484 is reserved for various purposes such as prepaids, inventory, loans to other funds, debt service and encumbrances. An amount of, $1,266,268 is designated for compensated absences, the conference center and business information center. The portions of fund balance that are reserved and designated are not available for appropriation for other purposes. The following chart presents the City’s 2007 ending fund balances.
Ogden City
Long-term Liabilities
Years Ended June 30,
Total
Governmental Business-type Percent
Activities Activities Total Change
2007 2006 2007 2006 2007 2006 2006-2007
General Obligation Bonds $ 18,455,000 $ 20,020,000 $ - $ - $ 18,455,000 $ 20,020,000 -7.82%
Lease Revenue Bonds 3,005,000 3,340,000 - - 3,005,000 3,340,000 -10.03%
Tax Increment Revenue Bonds 57,925,000 50,305,000 - - 57,925,000 50,305,000 15.15%
Enterprise Revenue Bonds - - 14,367,716 15,221,236 14,367,716 15,221,236 -5.61%
Notes Payable 6,404,680 3,110,305 - - 6,404,680 3,110,305 105.92%
Capital Leases 763,230 1,033,025 - - 763,230 1,033,025 -26.12%
Claims payable 531,621 - - - 531,621 - 100.00%
Compensated Absences 3,194,657 3,098,220 915,973 827,445 4,110,630 3,925,665 4.71%
Bond Premium 36,127 45,159 - - 36,127 45,159 -20.00%
Bond Discount (302,670) (319,485) - - (302,670) (319,485) 100.00%
Total 90,012,645 80,632,224 15,283,689 16,048,681 105,296,334 96,680,905 8.91%

OGDEN CITY, UTAH MANAGEMENT’S DISCUSSION AND ANALYSIS (UNAUDITED)
Year Ended June 30, 2007
23
General Fund During 2007, the fund balance in the General Fund decreased $3,201,584 or 18.7 percent. Revenues exceeded expenditures, before considering other financing sources and uses, by $3,503,857 due primarily to an increase in sales tax revenues and a slowing need for spending in community and economic development. The overall decrease in fund balance was due to the determination to record a valuation allowance on interfund advances receivables. The effect of the transaction was a $6,332,847 loss reported as a special item in the general fund. Debt Service Fund The fund balance in the Debt Service Fund decreased $83,879 primarily due to a shortage of income compared to debt service requirements. Redevelopment Agency Fund During the fiscal year, the fund balance in the Redevelopment Agency (RDA) Fund increased $758,574. Expenditures exceeded revenues, before considering other financing sources and uses, by $14,400,273 due primarily to the expenditure of prior year bond proceeds used to fulfill the obligations of the Central Business District Mall that were being carried by the Redevelopment Agency Fund. The overall increase in fund balance was due to two items. The RDA recorded proceeds from bond issuances for $9,300,000. In addition, the determination to record a valuation allowance on interfund advances receivable in the general fund, resulted in a simultaneous reduction in interfund advances payable in the RDA fund. The effect of the transaction was a $6,322,847 gain reported as a special item in the RDA special revenue fund.
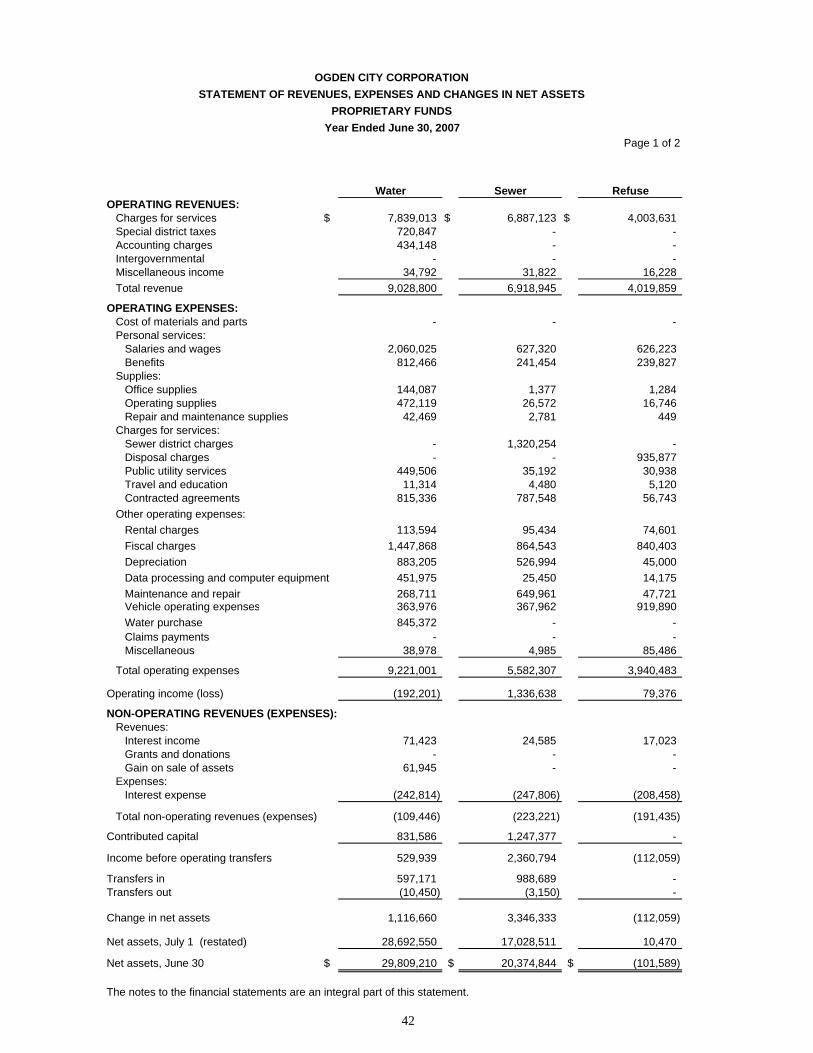
Water Fund In the current year, net assets increased $1,116,660 primarily as a result of the transfer in of infrastructure assets from Business Depot Ogden and donations of infrastructure by contractors and developers. Results from operations were in a deficit position of $192,201 due to the costs of operations and contracted agreements increasing at a faster pace than approved rates being charged to customers. The City has encouraged several conservation measures be taken by its citizens causing a decrease in water consumption. This action plus the increase costs caused by the limited supply are the primary cause for the deficit in operating net income. Sewer Fund Net assets increased $3,346,333 over the previous year, of which $1,336,638 was the result of operations. Operations was able to produce a positive net income in the current year due to rate increases above the capital improvement project approved increases. Refuse Fund Net assets decreased overall by $112,059 in the fund. Increased operating costs, which include the substantially increased cost of fuel, and the cost of debt caused the current year deficit.
Ogden City
Governmental Fund Balances
June 30, 2007
General Debt Redevelopment Nonmajor
Fund Service Agency Funds Total
Reserved $ 8,926,257 $ - $ 11,076,333 $ 1,453,894 $ 21,456,484
Unreserved/Designated 983,584 282,684 - - 1,266,268
Unreserved/Undesignated 3,983,421 - (1,750,917) 2,796,049 5,028,553
Total $ 13,893,262 $ 282,684 $ 9,325,416 $ 4,249,943 $ 27,751,305
Percent Change from Prior Year: -18.73% -22.88% 8.85% 55.21% -3.53%

OGDEN CITY, UTAH MANAGEMENT’S DISCUSSION AND ANALYSIS (UNAUDITED)
Year Ended June 30, 2007
24
BDO Property Management Fund The Business Depot Ogden Property Management Fund decreased fund balance $4,817,457 due to the transfer of infrastructure assets to the City as well as an emphasis on completion of projects that are using funds that were accumulated under the contract with the Army. Leasing revenue decreased $333,004 from the previous year due to transitions in tenants. Nonmajor Governmental Funds Ogden City’s nonmajor governmental funds show a combined increase in fund balance of $1,511,716. This increase appears to be due to consistent funding sources and lower than normal expenditure in the capital projects fund. Nonmajor Enterprise Funds The combined change in net assets of the nonmajor enterprise funds shows an increase of $82,168 from the previous year. This was primarily due to transfers from the general fund to cover losses in the Airport and Golf Funds. General Fund Budgetary Highlights Ogden City prepares its budget according to state statutes. The most significant budgeted fund is the General Fund. The City amended the General Fund budget several times during the year to meet the needs of the departments as issues arose. The most significant change to the original adopted budget was a $3,388,077 increase to planning and inspections due to increased costs associated with the various economic development projects in the City. Actual General Fund revenues were $3,018,029 or 5.6 percent above the original budget and $2,101,064 or 3.7 percent below the final budget. Actual expenditures were $789,579 or 2 percent below the original budget. Actual expenditures were $7,641,114 or 14 percent below the final budget. The original budgeted revenues in the general fund did not anticipate the continued high level of growth in sales tax revenues. For this reason the actual results were significantly higher than the original budget. The original budgeted expenditures in the general fund included a budgeted deficit or use of fund balance. The City made all reasonable efforts, without cutting services or personnel to maintain balance in the budgeted expenditures. Due to the growth in sales tax revenue and containment of costs, the City increased the existing fund balance in the General Fund this year. OTHER MATTERS Current and Future Projects The City and the Ogden Redevelopment Agency are involved in significant development projects downtown including the targeted creation of 4,000 new jobs and the addition of market rate housing units to support an additional 4,000 residents over the next four years. In addition, there are increased opportunities for jobs in the industrial, retail and service markets. The City has been through the downsizing of defense related activities with the closure of Defense Depot Ogden. However, under the terms of the Base Realignment and Closure Act (BRAC), the former Defense Depot Ogden was transferred to City ownership. Significant improvements have been completed and are still underway at the now named Business Depot Ogden (BDO). Under a master lease agreement with a property management and development company, the City is working to redevelop this significant community asset into the premier new business and industrial park in Utah. Marketing efforts have been well received with several local and nationally affiliated businesses relocating to BDO. REQUESTS FOR INFORMATION This financial report is designed to provide our citizens, taxpayers, and creditors with a general overview of Ogden City’s finances and to demonstrate the City’s accountability for the money it receives. Questions concerning any of the information in this report or any other matters related to the City’s finances should be addressed to the Ogden City Comptroller, 2549 Washington Blvd., Ogden, Utah, 84401.

Basic Financial Section


Governmental Business-type Activities Activities Total
ASSETSCurrent assets
Cash and investments $ 11,907,549 $ 12,865,532 $ 24,773,081 Receivables (net of allowance for uncollectibles):
Accounts 4,717,647 5,426,050 10,143,697 Notes 112,688 - 112,688 Taxes 15,386,475 - 15,386,475 Special assesments 556,441 - 556,441
Prepaid items 46,266 360,424 406,690 Inventory, at cost 1,074,246 50,614 1,124,860 Internal balances 5,045,450 (5,045,450) -
Total current assets 38,846,762 13,657,170 52,503,932
Noncurrent assetsRestricted assets:
Cash 1,984,852 39,332 2,024,184 Accounts receivable 78,808 - 78,808 Interest receivable 76,333 - 76,333 Grant loans 10,379,551 - 10,379,551 Investments 10,589,694 953,754 11,543,448
Total restricted assets 23,109,238 993,086 24,102,324 Capital assets:
Land 19,474,551 36,802,240 56,276,791 Construction in progress 21,744,036 - 21,744,036 Infrastructure 74,840,410 - 74,840,410 Buildings and improvements 100,801,974 195,050,729 295,852,703 Machinery and equipment 24,036,632 327,287 24,363,919
Less: accumulated depreciation (73,486,577) (52,272,241) (125,758,818) Net capital assets 167,411,026 179,908,015 347,319,041
Deferred charge 1,280,361 82,634 1,362,995 Assets held-for-resale 4,816,417 - 4,816,417 Water rights - 4,360 4,360 Water stock - 675,098 675,098
Total noncurrent assets 196,617,042 181,663,193 378,280,235
Total assets 235,463,803 195,320,363 430,784,166
LIABILITIESCurrent liabilities
Accounts payable 5,983,064 2,551,056 8,534,120 Accrued wages payable 1,266,161 349,010 1,615,171 Accrued compensated absences 957,646 274,792 1,232,438 Other payables and liabilities 2,684,217 130,234 2,814,451 Unearned revenue 24,265,763 558,602 24,824,365
Other noncurrent liabilities, due within one year 7,630,331 4,905,604 12,535,935 Current liabilities (payable from restricted assets):
Accrued bond interest - 24,862 24,862 Customer deposits - 312,796 312,796
Total current liabilities (payable from restricted assets) - 337,658 337,658 Total current liabilities 42,787,181 9,106,956 51,894,137
Noncurrent liabilitiesDue in more than one year 81,424,668 10,103,293 91,527,961
Total liabilities 124,211,849 19,210,249 143,422,098
NET ASSETSInvestment in general capital assets
net of related debt 84,313,339 166,219,757 250,533,096 Restricted net assets - expendable: Grant and other programs 1,729,343 - 1,729,343 Grant loans 10,379,551 - 10,379,551 Debt Service 10,589,694 992,091 11,581,785 Restricted net assets - nonexpendable 410,650 - 410,650 Unrestricted net assets 3,829,377 8,898,266 12,727,643
Total net assets $ 111,251,954 $ 176,110,114 $ 287,362,068
The notes to the financial statements are an integral part of this statement.
OGDEN CITY CORPORATIONSTATEMENT OF NET ASSETS
June 30, 2007
25

Page 1 of 2
Operating CapitalFunction/Programs Charges for Grants and Grants andPrimary government: Expenses Services Contributions Contributions
Governmental activities:General administration 15,515,738$ 7,748,767$ -$ -$ Public safety 22,761,963 2,762,457 498,744 - Transportation 5,763,544 - - 4,806,214 Environmental protection 422,424 3,344,855 - - Leisure opportunities 5,783,791 1,147,366 - - Community development 6,935,707 2,655,432 2,739,174 526,228 Interest on long-term debt 4,841,020 - - -
Total governmental activities 62,024,187 17,658,877 3,237,918 5,332,442
Business-type activities:Medical services 4,610,850 3,493,928 1,630,527 - Airport 1,793,226 273,730 - 464,491 Utilities 15,293,929 15,947,745 - 2,078,963 Refuse 4,148,941 4,019,859 - - Recreation 1,337,385 1,066,098 - - Property management 4,563,629 2,141,335 - -
Total business-type activities 31,747,960 26,942,695 1,630,527 2,543,454 Total primary government 93,772,147$ 44,601,572$ 4,868,445$ 7,875,896$
General revenues:Taxes:Property Sales Franchise City UtilityMotor vehicle
Unrestricted investment earningsGain on sale of capital assets
Transfers
Total general revenues
Change in net assets
Net assets - beginning - restated
Net assets - ending
The notes to the financial statements are an integral part of this statement.
OGDEN CITY CORPORATIONSTATEMENT OF ACTIVITIES
Year Ended June 30, 2007
Program Revenues
26

Page 2 of 2
Governmental Business-typeActivities Activities Total
(7,766,971)$ -$ (7,766,971)$ (19,500,762) - (19,500,762)
(957,330) - (957,330) 2,922,431 - 2,922,431
(4,636,425) - (4,636,425) (1,014,873) - (1,014,873) (4,841,020) - (4,841,020)
(35,794,951) - (35,794,951)
- 513,605 513,605 - (1,055,005) (1,055,005) - 2,732,779 2,732,779 - (129,082) (129,082) - (271,287) (271,287) - (2,422,294) (2,422,294)
- (631,284) (631,284) (35,794,951) (631,284) (36,426,235)
17,586,040 - 17,586,040 14,572,788 - 14,572,788 7,561,973 - 7,561,973
264,889 - 264,889 920,361 - 920,361
1,964,150 807,780 2,771,930 971,051 61,945 1,032,996 622,796 (622,796) -
44,464,048 246,929 44,710,977
8,669,097 (384,355) 8,284,742
102,582,857 176,494,469 279,077,326
111,251,954$ 176,110,114$ 287,362,068$
Primary Government
Net (Expense) Revenue and Changes in Net Assets
27

28
THIS PAGE INTENTIONALLY LEFT BLANK

29
Governmental Fund Financial Statements General Fund To account for resources traditionally associated with governments which are not required to be accounted for in another fund. Debt Service Debt service funds are used to account for the accumulation of resources for, and the payment of, general long-term debt principal, interest, and related costs. Redevelopment Agency A special revenue fund used to account for the specific revenues that are legally restricted to expenditures for the City's redevelopment activities, including payment of redevelopment agency debt. Nonmajor Governmental Funds Nonmajor governmental funds are presented beginning on page 86.

Page 1 of 2
Special Revenue
Debt RedevelopmentGeneral Service Agency
ASSETS Cash and investments $ 3,142,266 $ 134,357 $ 3,659,359 Due from other funds 3,524,645 - - Receivables (net of allowance for uncollectibles): Accounts 3,996,674 - 339,636 Taxes 9,682,032 - 5,704,443 Special assessments - 148,327 - Note - - 112,688 Inventory, at cost 93,091 - - Restricted assets: Cash 791,005 - 1,193,847 Interest receivable - - -
Prepaid expenses 46,266 - - Investments / grant loans 10,379,551 - 9,882,486
Loans to other funds, net of allowance 6,364,932 - 346,498 Other assets - - 4,816,417
Total assets $ 38,020,462 $ 282,684 $ 26,055,374
LIABILITIES Due to other funds $ - $ - $ - Accounts payable 1,098,513 - 3,322,261 Accrued wages payable 1,168,158 - - Other payables and liabilities 2,656,732 - - Loans from other funds 346,498 - 4,720,000 Short-term notes payable 367,000 - 2,821,680 Unearned revenue 18,490,299 - 5,866,017
Total liabilities 24,127,200 - 16,729,958
FUND BALANCE Reserved fund balance: Reserved - restricted cash and investments 1,177,505 - 11,076,333 Reserved - encumbrances 2,941,359 - - Reserved - prepaid expenses 46,266 - - Reserved - inventory 41,127 - - Reserved - loans to other funds 4,720,000 - - Unreserved, designated for: Designated - debt service - 282,684 - Designated - accrued compensated absences 911,040 - - Designated - conference center 50,868 - - Designated - business information center 21,676 - - Unreserved, undesignated reported in: Capital projects fund - - - Special revenue funds - - (1,750,917) General fund 3,983,421 - -
Total fund balances 13,893,262 282,684 9,325,416 Total liabilities and fund balances $ 38,020,462 $ 282,684 $ 26,055,374
The notes to the financial statements are an integral part of this statement.
GOVERNMENTAL FUNDS
OGDEN CITY CORPORATIONBALANCE SHEET
June 30, 2007
30
Page 2 of 2
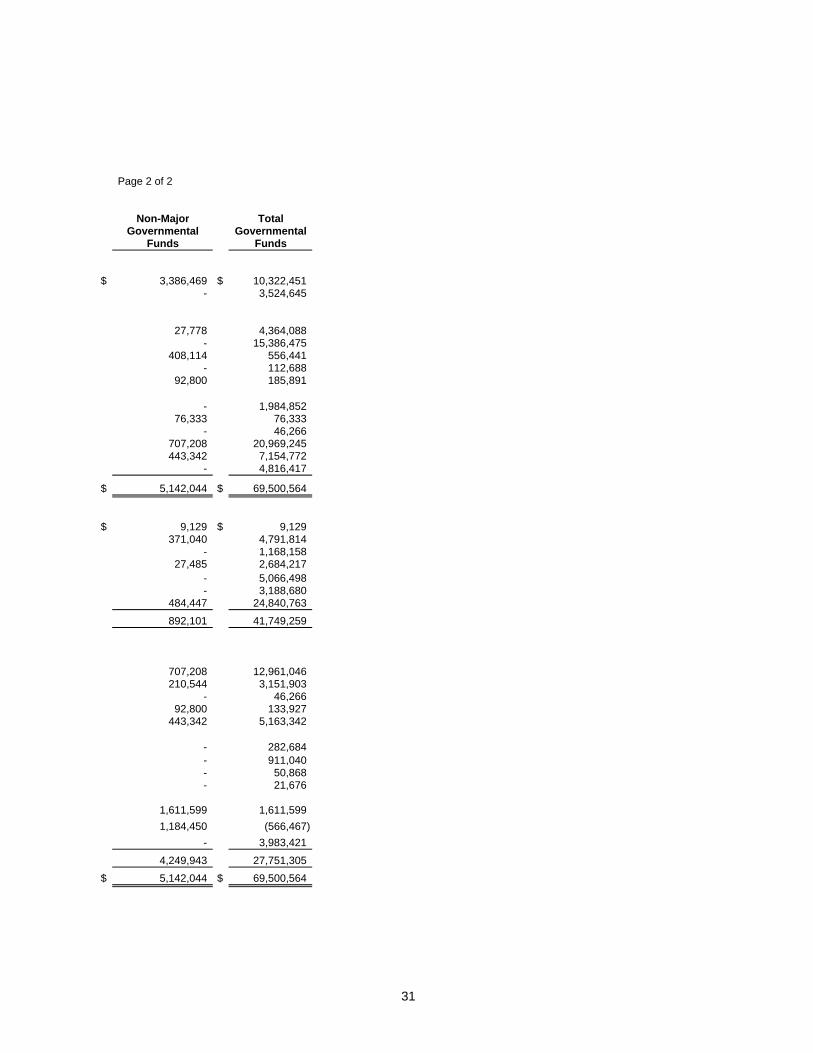
Non-Major TotalGovernmental Governmental
Funds Funds
$ 3,386,469 $ 10,322,451 - 3,524,645
27,778 4,364,088 - 15,386,475
408,114 556,441 - 112,688
92,800 185,891
- 1,984,852 76,333 76,333
- 46,266 707,208 20,969,245 443,342 7,154,772
- 4,816,417
$ 5,142,044 $ 69,500,564
$ 9,129 $ 9,129 371,040 4,791,814
- 1,168,158 27,485 2,684,217
- 5,066,498 - 3,188,680
484,447 24,840,763
892,101 41,749,259
707,208 12,961,046 210,544 3,151,903
- 46,266 92,800 133,927
443,342 5,163,342
- 282,684 - 911,040 - 50,868 - 21,676
1,611,599 1,611,599 1,184,450 (566,467)
- 3,983,421
4,249,943 27,751,305 $ 5,142,044 $ 69,500,564
31

32
THIS PAGE INTENTIONALLY LEFT BLANK
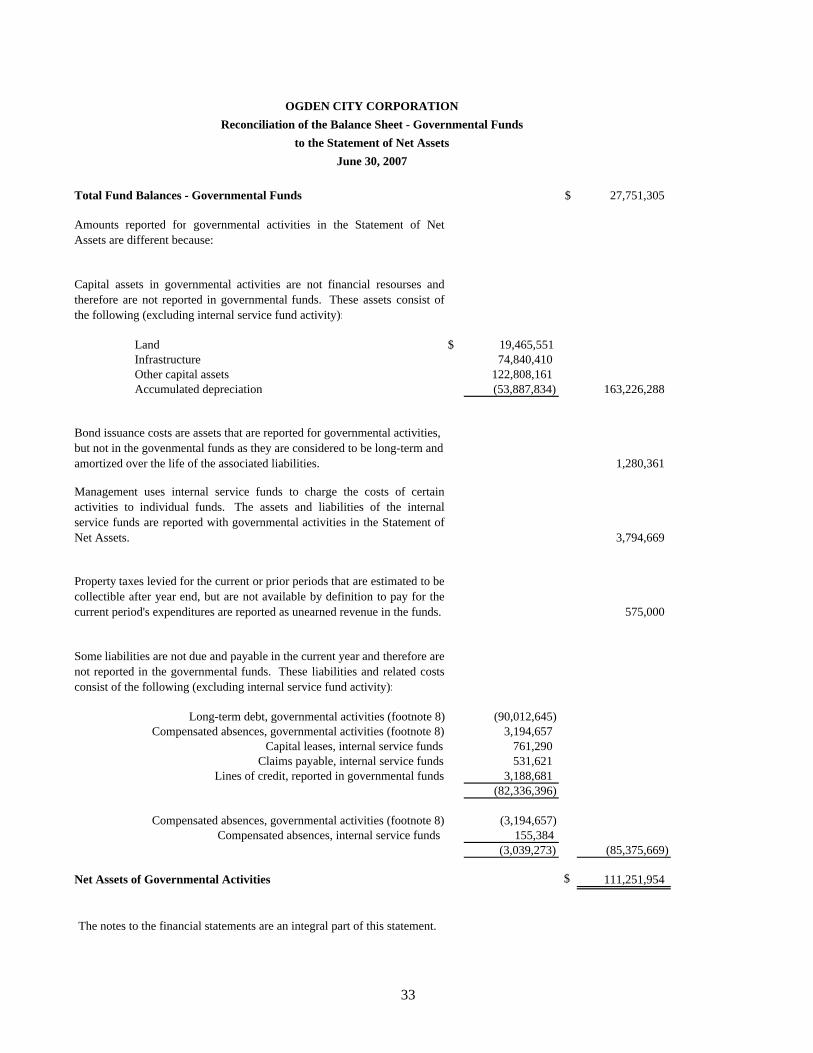
OGDEN CITY CORPORATIONReconciliation of the Balance Sheet - Governmental Funds
to the Statement of Net AssetsJune 30, 2007
Total Fund Balances - Governmental Funds $ 27,751,305
Amounts reported for governmental activities in the Statement of NetAssets are different because:
Capital assets in governmental activities are not financial resourses andtherefore are not reported in governmental funds. These assets consist ofthe following (excluding internal service fund activity):
Land $ 19,465,551 Infrastructure 74,840,410 Other capital assets 122,808,161 Accumulated depreciation (53,887,834) 163,226,288
Bond issuance costs are assets that are reported for governmental activities, but not in the govenmental funds as they are considered to be long-term and amortized over the life of the associated liabilities. 1,280,361
Management uses internal service funds to charge the costs of certainactivities to individual funds. The assets and liabilities of the internalservice funds are reported with governmental activities in the Statement ofNet Assets. 3,794,669
Property taxes levied for the current or prior periods that are estimated to becollectible after year end, but are not available by definition to pay for thecurrent period's expenditures are reported as unearned revenue in the funds. 575,000
Some liabilities are not due and payable in the current year and therefore arenot reported in the governmental funds. These liabilities and related costsconsist of the following (excluding internal service fund activity):
Long-term debt, governmental activities (footnote 8) (90,012,645) Compensated absences, governmental activities (footnote 8) 3,194,657
Capital leases, internal service funds 761,290 Claims payable, internal service funds 531,621
Lines of credit, reported in governmental funds 3,188,681 (82,336,396)
Compensated absences, governmental activities (footnote 8) (3,194,657) Compensated absences, internal service funds 155,384
(3,039,273) (85,375,669)
Net Assets of Governmental Activities $ 111,251,954
The notes to the financial statements are an integral part of this statement.
33

Page 1 of 2
Special RevenueDebt Redevelopment
General Service AgencyREVENUES: Taxes and special assessments $ 35,547,048 $ 1,706 $ 6,787,687 Licenses and permits 2,363,717 - - Intergovernmental 5,322,960 - - Charges for services 7,033,945 - 1,200 Fines and forfeitures 1,822,689 - - Miscellaneous 1,135,376 - 727,610 Outside donations 128,464 - - Interest 799,818 10,776 904,982 Sale of property 12,712 - 789,560
Total revenues 54,166,729 12,482 9,211,039 EXPENDITURES: Current: Mayor 496,415 - - City council 737,048 - 15,135 Management services 3,366,890 - - Circuit court 34,020 - - Corporate counsel 922,204 - - Non-departmental 2,929,936 - - Police 14,187,387 - - Fire 6,109,653 - - Public services 11,476,628 - - Community and economic development 7,949,513 - 18,022,466 Debt service: Principal 1,685,000 81,000 1,680,000 Interest and fiscal charges 768,178 15,361 3,893,711
Total expenditures 50,662,872 96,361 23,611,312 Excess (deficiency) of revenues over expenditures 3,503,857 (83,879) (14,400,273) OTHER FINANCING SOURCES (USES): Issuance of debt 2,000,000 - 9,300,000 Bond discount - - - Payment to refunded bond escrow - - - Special item (6,332,847) - 6,332,847 Transfers in 1,052,831 - 3,758,236 Transfers out (3,425,425) - (4,232,236)
Total other financing sources (uses) (6,705,441) - 15,158,847
Net change in fund balances (3,201,584) (83,879) 758,574
Fund balance at beginning of year 17,094,846 366,563 8,566,842
Fund balance at end of year $ 13,893,262 $ 282,684 $ 9,325,416
The notes to the financial statements are an integral part of this statement.
OGDEN CITY CORPORATIONSTATEMENT OF REVENUES, EXPENDITURES AND CHANGES IN
FUND BALANCES - GOVERNMENTAL FUNDYear Ended June 30, 2007
34
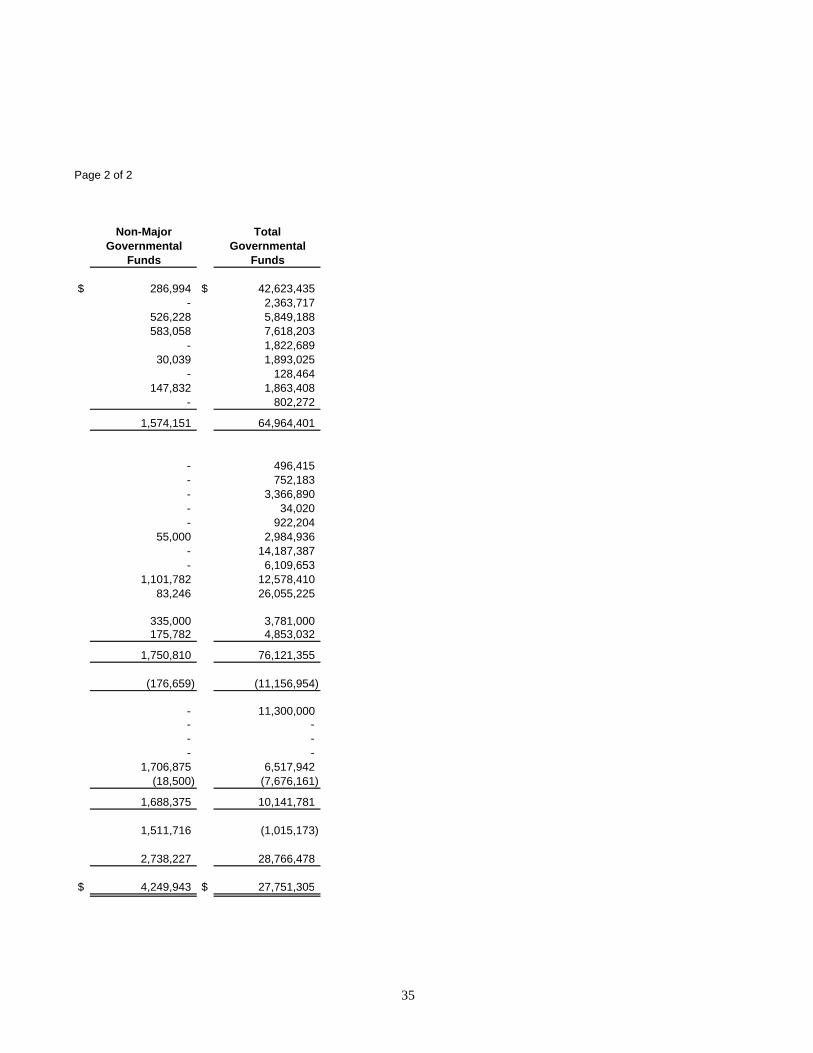
Page 2 of 2
Non-Major TotalGovernmental Governmental
Funds Funds
$ 286,994 $ 42,623,435 - 2,363,717
526,228 5,849,188 583,058 7,618,203
- 1,822,689 30,039 1,893,025
- 128,464 147,832 1,863,408
- 802,272
1,574,151 64,964,401
- 496,415 - 752,183 - 3,366,890 - 34,020 - 922,204
55,000 2,984,936 - 14,187,387 - 6,109,653
1,101,782 12,578,410 83,246 26,055,225
335,000 3,781,000 175,782 4,853,032
1,750,810 76,121,355
(176,659) (11,156,954)
- 11,300,000 - - - - - -
1,706,875 6,517,942 (18,500) (7,676,161)
1,688,375 10,141,781
1,511,716 (1,015,173)
2,738,227 28,766,478
$ 4,249,943 $ 27,751,305
35

OGDEN CITY CORPORATIONReconciliation of the Statement of Revenues, Expenditures, and Changes in
Fund Balances of Government Funds to the Statement of ActivitiesYear Ended June 30, 2007
Net Change in Fund Balances-Total Governmental Funds (1,015,173)$
Amounts reported for governmental activities in the statement of activitiesare different because:Capital outlays are reported as expenditures in the governmental funds.However, in the Statement of Activities, the cost of capital assets isallocated over their estimated useful lives as depreciation expense. In thecurrent year, these amounts were as follows (excluding internal service fundactivity):
Capital outlay 16,430,252$ Depreciation expense (3,819,163)
12,611,089
Debt proceeds provide current financial resources to governmental funds;however, issuing debt increases long-term liabilities in the Statement of NetAssets. In the current year, proceeds were received from issuing bondsincluding bond discounts. (11,300,000)
Repayment of long-term debt is reported as an expenditure in thegovernmental funds, but the repayment reduces long-term liabilities in theStatement of Activities 3,781,000
Property taxes levied for the current or prior periods that are estimated to becollectible after year end, but are not available by definition to pay for thecurrent period's expenditures are reported as unearned revenue in the funds. 575,000
Management uses internal service funds to charge the costs of certainactivities to individual funds. The net revenue (expense) of the internalservice funds is reported with governmental activities 215,720
Management reassigned certain infrastructure assets of an enterprise fund to the general fixed assets of the City. Since capital contributions can not benegative, the transaction is treated as a transfer-out in the enterprise fundwithout a corresponding recipent governmental fund. The transfer-in isrecognized in the government-wide statement of activities 1,780,846
Capital contribution of infrastructure assets are made to the City throughoutthe year by various outside contractors which are not recorded in thegovernmental funds. 2,078,962
Some expenses reported in the Statement of Activities do not require theuse of current financial resources and therefore are not reported asexpenditures in governmental funds. These activities consist of thefollowing:
Capitalization of bond issuance costs 96,191 Amortization of bond premiums, discounts and costs (154,537)
(58,346)
Change in Net Assets of Governmental Activities 8,669,097$
The notes to the financial statements are an integral part of this statement.
36

37
Proprietary Fund Financial Statements Water Utility Fund To account for the provision of water to City residents and some residents of Weber County. All activities necessary to provide such services are accounted for in this fund including, but not limited to: administration (utility director), operations, maintenance, financing, related debt service, billing and collection. Sewer Utility Fund To account for the provision of sewer services to City residents and some residents of Weber County. All activities necessary to provide such services are accounted for in this fund including, but not limited to: operations, maintenance, financing, related debt service, billing and collection. Refuse Utility Fund To account for the service of refuse collection and disposal for City residents and some residents of Weber County. All activities necessary to provide such services are accounted for in this fund including, but not limited to: administration, operation, maintenance, billing and collecting. Business Development Ogden (BDO) Property Management To account for revenues and expenditures related to the development of the Business Development Ogden business park formally known as the Defense Depot of Ogden. Nonmajor Enterprise Funds Nonmajor enterprise funds are presented beginning on page 91. Governmental Activities - Internal Service Funds These funds account for certain activities that are charged to the other departments on a cost-reimbursement basis. These funds are presented beginning on page 98.

Page 1 of 4
Water Sewer RefuseASSETSCurrent assets
Cash $ 138,178 $ - $ - Accounts receivable (net) 980,135 574,877 376,741 Notes receivable - - - Inventory, at cost - - - Prepaid expenses 360,424 - -
Total current assets 1,478,737 574,877 376,741
Noncurrent assetsLoans to other funds - 177,569 2,000,000 Deferred charge 55,117 27,517 -
Total loans to other funds and deferred charges 55,117 205,086 2,000,000
Restricted assets:Cash 8,740 - 29,597 Employee PC loans receivable - - - Investments 422,626 210,996 320,132
Total restricted assets 431,366 210,996 349,729
Capital assets:Land 297,512 944,867 502,250 Buildings 2,139,395 - 1,110,983 Improvements 44,842,307 27,942,183 - Office furniture 40,442 - - Equipment 247,255 5,295 - Vehicles - - -
Total capital assets 47,566,911 28,892,345 1,613,233
Less accumulated depreciation (14,952,166) (5,058,716) (299,610)
Net capital assets 32,614,745 23,833,629 1,313,623
Water rights 4,360 - - Water stock 675,098 - -
Total noncurrent assets 33,780,686 24,249,711 3,663,352
Total assets $ 35,259,423 $ 24,824,588 $ 4,040,093
The notes to the financial statements are an integral part of this statement.
OGDEN CITY CORPORATIONSTATEMENT OF NET ASSETS
PROPRIETARY FUNDSJune 30, 2007
38

Page 2 of 4
BDO Non-MajorProperty Enterprise Total
Management Funds Total Internal Service
$ 12,510,549 $ 216,805 $ 12,865,532 $ 1,585,098 639,776 2,854,521 5,426,050 353,559
- - - - - 50,614 50,614 888,355 - - 360,424 -
13,150,325 3,121,940 18,702,620 2,827,012
- - 2,177,569 - - - 82,634 - - - 2,260,203 -
- 995 39,332 - - - - 78,808 - - 953,754 - - 995 993,086 78,808
33,081,350 1,976,261 36,802,240 9,000 97,891,837 1,599,139 102,741,354 723,002
- 19,524,885 92,309,375 364,760 - 26,205 66,647 5,528 - 8,090 260,640 8,644,926 - - - 14,036,265
130,973,187 23,134,580 232,180,256 23,783,481
(21,166,703) (10,795,046) (52,272,241) (19,598,743)
109,806,484 12,339,534 179,908,015 4,184,738
- - 4,360 - - - 675,098 -
109,806,484 12,340,529 183,840,762 4,263,546
$ 122,956,809 $ 15,462,469 $ 202,543,382 $ 7,090,558
39
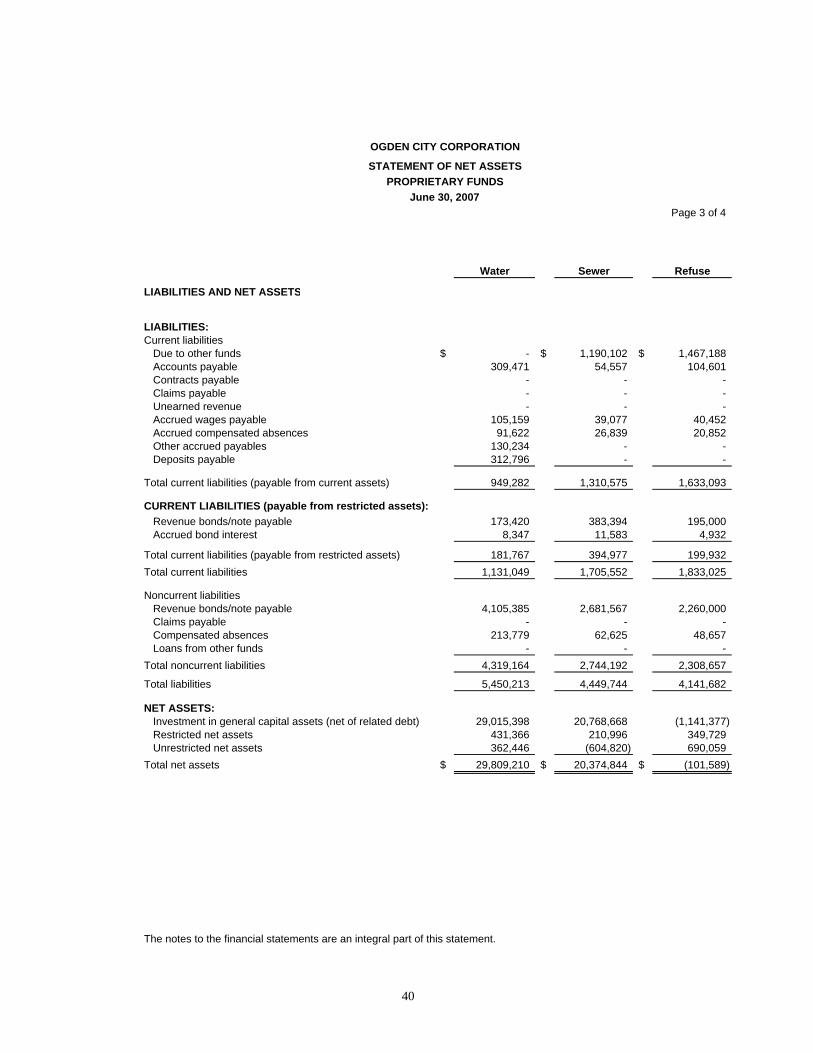
OGDEN CITY CORPORATION
STATEMENT OF NET ASSETSPROPRIETARY FUNDS
June 30, 2007Page 3 of 4
Water Sewer Refuse
LIABILITIES AND NET ASSETS
LIABILITIES:Current liabilities
Due to other funds $ - $ 1,190,102 $ 1,467,188 Accounts payable 309,471 54,557 104,601 Contracts payable - - - Claims payable - - - Unearned revenue - - - Accrued wages payable 105,159 39,077 40,452 Accrued compensated absences 91,622 26,839 20,852 Other accrued payables 130,234 - - Deposits payable 312,796 - -
Total current liabilities (payable from current assets) 949,282 1,310,575 1,633,093
CURRENT LIABILITIES (payable from restricted assets):Revenue bonds/note payable 173,420 383,394 195,000Accrued bond interest 8,347 11,583 4,932
Total current liabilities (payable from restricted assets) 181,767 394,977 199,932 Total current liabilities 1,131,049 1,705,552 1,833,025
Noncurrent liabilitiesRevenue bonds/note payable 4,105,385 2,681,567 2,260,000 Claims payable - - - Compensated absences 213,779 62,625 48,657 Loans from other funds - - -
Total noncurrent liabilities 4,319,164 2,744,192 2,308,657
Total liabilities 5,450,213 4,449,744 4,141,682
NET ASSETS:Investment in general capital assets (net of related debt) 29,015,398 20,768,668 (1,141,377) Restricted net assets 431,366 210,996 349,729 Unrestricted net assets 362,446 (604,820) 690,059
Total net assets $ 29,809,210 $ 20,374,844 $ (101,589)
The notes to the financial statements are an integral part of this statement.
40

Page 4 of 4
BDO Non-MajorProperty Enterprise Total
Management Funds Total Internal Service
$ - $ 299,886 $ 2,957,176 $ 558,340 1,871,206 211,221 2,551,056 551,161
- - - 761,290 - - - 640,090 - 558,602 558,602 -
1,795 162,527 349,010 98,003 490 134,989 274,792 46,606
- - 130,234 - - - 312,796 -
1,873,491 1,367,225 7,133,666 2,655,490
4,153,790 - 4,905,604 - - - 24,862 -
4,153,790 - 4,930,466 - 6,027,281 1,367,225 12,064,132 2,655,490
415,160 - 9,462,112 - - - - 531,621
1,145 314,975 641,181 108,778 - 4,265,843 4,265,843 -
416,305 4,580,818 14,369,136 640,399
6,443,586 5,948,043 26,433,268 3,295,889
105,237,534 12,339,534 166,219,757 4,184,739 - - 992,091 -
11,275,689 (2,825,108) 8,898,266 (390,070) $ 116,513,223 $ 9,514,426 $ 176,110,114 $ 3,794,669
41
Page 1 of 2
Water Sewer RefuseOPERATING REVENUES:
Charges for services $ 7,839,013 $ 6,887,123 $ 4,003,631Special district taxes 720,847 - - Accounting charges 434,148 - - Intergovernmental - - - Miscellaneous income 34,792 31,822 16,228 Total revenue 9,028,800 6,918,945 4,019,859
OPERATING EXPENSES:Cost of materials and parts - - - Personal services:
Salaries and wages 2,060,025 627,320 626,223 Benefits 812,466 241,454 239,827
Supplies:Office supplies 144,087 1,377 1,284 Operating supplies 472,119 26,572 16,746 Repair and maintenance supplies 42,469 2,781 449
Charges for services:Sewer district charges - 1,320,254 - Disposal charges - - 935,877 Public utility services 449,506 35,192 30,938 Travel and education 11,314 4,480 5,120 Contracted agreements 815,336 787,548 56,743
Other operating expenses:Rental charges 113,594 95,434 74,601 Fiscal charges 1,447,868 864,543 840,403 Depreciation 883,205 526,994 45,000 Data processing and computer equipment 451,975 25,450 14,175 Maintenance and repair 268,711 649,961 47,721 Vehicle operating expenses 363,976 367,962 919,890 Water purchase 845,372 - - Claims payments - - - Miscellaneous 38,978 4,985 85,486
Total operating expenses 9,221,001 5,582,307 3,940,483
Operating income (loss) (192,201) 1,336,638 79,376
NON-OPERATING REVENUES (EXPENSES):Revenues:
Interest income 71,423 24,585 17,023 Grants and donations - - - Gain on sale of assets 61,945 - -
Expenses:Interest expense (242,814) (247,806) (208,458)
Total non-operating revenues (expenses) (109,446) (223,221) (191,435)
Contributed capital 831,586 1,247,377 -
Income before operating transfers 529,939 2,360,794 (112,059)
Transfers in 597,171 988,689 - Transfers out (10,450) (3,150) -
Change in net assets 1,116,660 3,346,333 (112,059)
Net assets, July 1 (restated) 28,692,550 17,028,511 10,470
Net assets, June 30 $ 29,809,210 $ 20,374,844 $ (101,589)
The notes to the financial statements are an integral part of this statement.
OGDEN CITY CORPORATIONSTATEMENT OF REVENUES, EXPENSES AND CHANGES IN NET ASSETS
PROPRIETARY FUNDSYear Ended June 30, 2007
42

Page 2 of 2
BDO Non-Major Internal Property Enterprise Service
Management Funds Total Funds
$ 2,141,335 $ 4,789,797 $ 25,660,899 $ 11,839,162- - 720,847 - - - 434,148 - - 1,630,527 1,630,527 - - 43,959 126,801 903,054
2,141,335 6,464,283 28,573,222 12,742,216
- 154,281 154,281 2,516,872
53,638 3,022,181 6,389,387 1,765,900 17,685 1,043,934 2,355,366 624,806
541 8,657 155,946 63,571 - 200,042 715,479 59,908 - 55,901 101,600 5,231
- - 1,320,254 - - - 935,877 -
1,388 211,612 728,636 1,269,808 - 33,190 54,104 24,569
207,903 582,391 2,449,921 2,808,752
- 10,145 293,774 3,111 - 282,984 3,435,798 -
3,913,846 842,270 6,211,315 1,732,475 8,275 53,750 553,625 544,047
- 304,208 1,270,601 51,283 6,307 583,585 2,241,720 120,070
- - 845,372 - - - - 1,146,494
241 143,451 273,141 9,479
4,209,824 7,532,582 30,486,197 12,746,376
(2,068,489) (1,068,299) (1,912,975) (4,160)
656,543 38,206 807,780 100,742 - 464,491 464,491 - - - 61,945 168,779
(353,805) (208,880) (1,261,763) (49,641)
302,738 293,817 72,453 219,880
- - 2,078,963 -
(1,765,751) (774,482) 238,441 215,720
1,400,000 857,150 3,843,010 1,800,367 (4,451,706) (500) (4,465,806) (1,800,367)
(4,817,457) 82,168 (384,355) 215,720
121,330,680 9,432,258 176,494,469 3,578,949
$ 116,513,223 $ 9,514,426 $ 176,110,114 $ 3,794,669
43

Year Ended June 30, 2007
Page 1 of 4
Water Sewer RefuseCASH FLOWS FROM OPERATING ACTIVITIES:
Cash received from customers $ 9,313,397 $ 6,848,091 $ 4,690,168 Cash received (paid) from (to) other funds 493,227 (1,337,066) 230,435 Cash payments to suppliers for goods and services (5,294,172) (4,166,575) (3,042,028) Cash payments to employees for services (2,873,889) (850,467) (875,848)
Net cash from operating activities 1,638,563 493,983 1,002,727
CASH FLOWS FROM NONCAPITAL FINANCING ACTIVITIES:Change in long-term compensated absences 20 16,262 (23,063) Grants and donations - - - Transfers in - - - Transfers out (10,450) (3,150) - PC loans paid - - -
Net cash from noncapital financing activities (10,430) 13,112 (23,063)
CASH FLOWS FROM CAPITAL AND RELATED FINANCING ACTIVITIESAcquisition of capital assets (1,824,141) - - Proceeds from capital debt - - - Capital grants - - - Principal paid on revenue bonds (166,750) (367,980) (185,000) Interest paid on revenue bonds (234,467) (240,331) (207,310) Change in deferred charges (5,454) (2,723) - Change in interfund loans - - - Payments on contracts payable - - - Interest expense on loans - - - Proceeds from sale of assets 61,945 - -
Net cash from capital and related financing activities (2,168,867) (611,034) (392,310)
CASH FLOWS FROM INVESTING ACTIVITIES:Interest on investments 71,423 24,585 17,023 Change in restricted investments (22,587) (9,971) (2,857) Miscellaneous nonoperating income - - - Principal payments received on loans to other funds - 89,325 - Issuance of funds on loans to other funds - - (600,000) Interest expense on cash deficit - - -
Net cash from investing activities 48,836 103,939 (585,834)
Net increase (decrease) in cash equivalents (491,898) - 1,520
Cash/equivalents at beginning of year 638,816 - 28,077 Cash/equivalents at end of year 146,918 - 29,597
Cash/equivalents, end of year (unrestricted) 138,178 - - Cash/equivalents, end of year (restricted) 8,740 - 29,597
Total cash/equivalents, end of year $ 146,918 $ - $ 29,597
The notes to the financial statements are an integral part of this statement.
OGDEN CITY CORPORATIONSTATEMENT OF CASH FLOWS
PROPRIETARY FUNDS
44
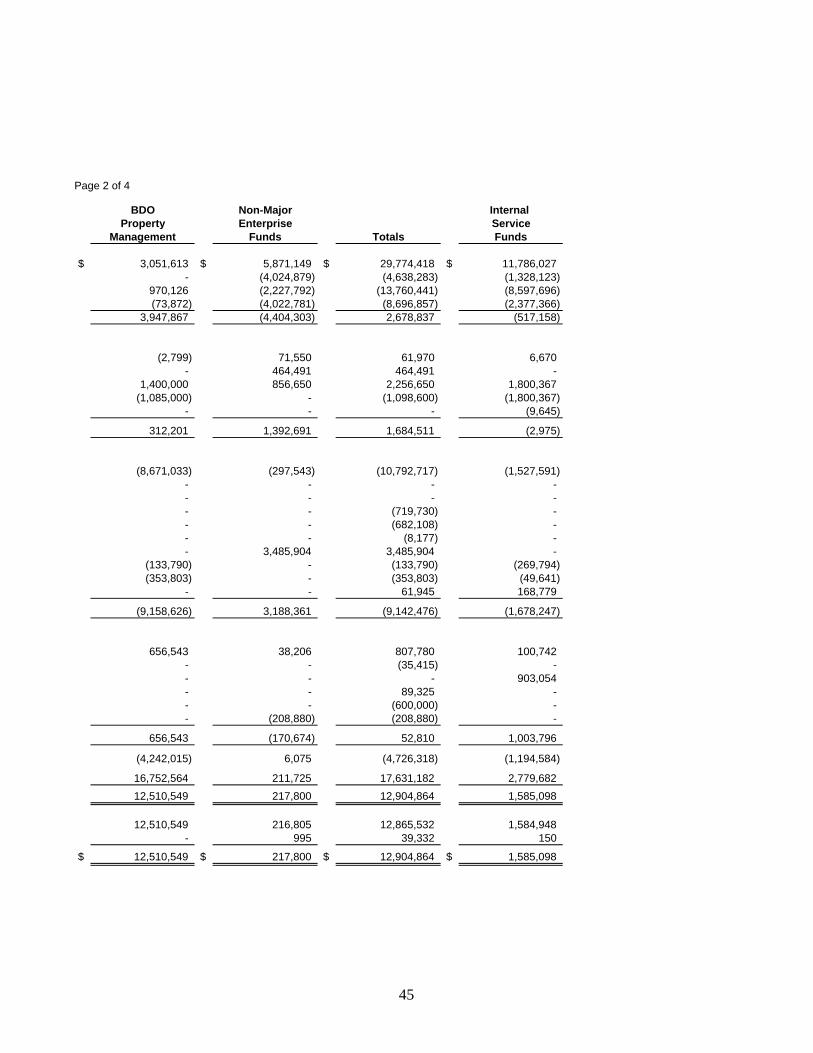
Page 2 of 4
BDO Non-Major Internal Property Enterprise Service
Management Funds Totals Funds
$ 3,051,613 $ 5,871,149 $ 29,774,418 $ 11,786,027 - (4,024,879) (4,638,283) (1,328,123)
970,126 (2,227,792) (13,760,441) (8,597,696) (73,872) (4,022,781) (8,696,857) (2,377,366)
3,947,867 (4,404,303) 2,678,837 (517,158)
(2,799) 71,550 61,970 6,670 - 464,491 464,491 -
1,400,000 856,650 2,256,650 1,800,367 (1,085,000) - (1,098,600) (1,800,367)
- - - (9,645)
312,201 1,392,691 1,684,511 (2,975)
(8,671,033) (297,543) (10,792,717) (1,527,591) - - - - - - - - - - (719,730) - - - (682,108) - - - (8,177) - - 3,485,904 3,485,904 -
(133,790) - (133,790) (269,794) (353,803) - (353,803) (49,641)
- - 61,945 168,779
(9,158,626) 3,188,361 (9,142,476) (1,678,247)
656,543 38,206 807,780 100,742 - - (35,415) - - - - 903,054 - - 89,325 - - - (600,000) - - (208,880) (208,880) -
656,543 (170,674) 52,810 1,003,796
(4,242,015) 6,075 (4,726,318) (1,194,584)
16,752,564 211,725 17,631,182 2,779,682 12,510,549 217,800 12,904,864 1,585,098
12,510,549 216,805 12,865,532 1,584,948 - 995 39,332 150
$ 12,510,549 $ 217,800 $ 12,904,864 $ 1,585,098
45

OGDEN CITY CORPORATIONSTATEMENT OF CASH FLOWS
PROPRIETARY FUNDSYEAR ENDED JUNE 30, 2007
Page 3 of 4RECONCILIATION OF OPERATING INCOME TO NET CASHPROVIDED BY OPERATING ACTIVITIES:
Water Sewer Refuse
Operating income (loss) $ (192,201) $ 1,336,638 $ 79,376 Reconciliation adjustments: Depreciation 883,205 526,994 45,000 Changes in assets and liabilities: Change in due from other funds 493,227 - - Change in accounts receivable 284,597 (70,854) 670,309 Change in inventory - - - Change in prepaid expenses 2,662 - - Change in due to other funds - (1,337,066) 230,435 Change in accounts payable 221,572 42,500 (12,595) Change in deposits payable (101,315) - - Change in unearned revenue - - - Change in other accrued liabilities 48,214 (22,536) - Change in wages payable and compensated absences (1,398) 18,307 (9,798) Total adjustments 1,830,764 (842,655) 923,351 Net cash provided by operating activities $ 1,638,563 $ 493,983 $ 1,002,727
NONCASH INVESTING, CAPITAL AND FINANCING ACTIVITIES:
The BDO property management fund transferred infrastructure assets to the Water and Sewer funds in the amount of $597,171 and $988,689, respectively.
The Water and Sewer funds recorded capital contributions from outside donors in the amount of $831,586 and $1,247,377, respectively.
46

Page 4 of 4
BDO Non-Major Internal Property Enterprise Service
Management Funds Totals Funds
$ (2,068,489) $ (1,068,299) $ (1,912,975) $ (907,214)
3,913,846 842,270 6,211,315 1,732,475
- - 493,227 910,278 (830,065) 964,265 (53,135)
- 5,541 5,541 (127,258) - - 2,662 - - (3,560,388) (4,667,019) (1,328,123)
1,194,781 177,186 1,623,444 (106,516) - - (101,315) - - (13,882) (13,882) - - - 25,678 259,273
(2,549) 43,334 47,896 13,340 6,016,356 (3,336,004) 4,591,812 390,056
$ 3,947,867 $ (4,404,303) $ 2,678,837 $ (517,158)
47

OGDEN CITY, UTAH NOTES TO THE FINANCIAL STATEMENTS
Year Ended June 30, 2007
48
NOTE 1. SUMMARY OF SIGNIFICANT ACCOUNTING POLICIES The accounting policies of the City of Ogden conform in all material respects to generally accepted accounting principles (GAAP) as applicable to governments. The City has adopted the provisions of the Governmental Accounting Standards Board (GASB). Preparation of the financial statements in conformity with GAAP requires management to make estimates and assumptions that affect the reported amounts and disclosures in the financial statements. The following is a summary of the more significant policies and is presented to assist the reader in interpreting the financial statements and other data in this report. These policies, as presented, should be viewed as an integral part of the accompanying financial statements. A. Reporting Entity Ogden City Corporation was incorporated February 6, 1851 by the General Assembly of the State of Deseret. Ogden became a home rule charter city on June 29, 1851. The City operates under a Mayor-Council form of government and provides the following services as authorized by its charter: police and fire protection, planning and engineering, code enforcement, street maintenance, traffic control, parks operation and maintenance, recreation services, community development, general administrative services, water, sewer and solid waste services and airport services. The criteria set forth by generally accepted accounting principles (GAAP) was used to determine which entities to include in this report. GASB Concepts Statement-1 (Objectives of Financial Reporting) concludes that the basic foundation for governmental financial reporting is accountability. The Concepts Statement asserts that accountability requires governments to answer to the citizenry - to justify the raising of public resources and the purposes for which they are used. In turn, the concept of accountability becomes the basis for defining the financial reporting entity. Under GASB-14 (The Financial Reporting Entity) the financial reporting entity consists of the following: A. The primary government
B. Organizations for which the primary government is financially accountable C. Other organizations that, because of the nature and significance of their relationship with the primary government, exclusion from the reporting entity would render the financial statements misleading or incomplete
Blended component units, although legally separate entities, are in substance part of the government’s operations. They are reported as part of the primary government and blended with the appropriate funds. The accompanying financial statements include all activities of the City and Ogden Redevelopment Agency (RDA). The RDA was included because the separate governing bodies of both entities are comprised of the same individuals and the City is financially accountable for the RDA. The financial statements also include activities of the Ogden Municipal Building Authority. The Building Authority governing body is comprised of the same individuals as the City Council and was created to purchase condominium space in the office building that houses most city administrative departments as well as the City Council. Revenue comes from a lease with the City. Both the Ogden Redevelopment Agency and the Ogden Municipal Building Authority are included in the accompanying financial statements as blended component units. B. Government-wide And Fund Financial Statements The City’s basic financial statements consist of both government-wide statements and fund statements. The government-wide statements focus on the City as a whole, while the fund statements focus on individual funds.

OGDEN CITY, UTAH NOTES TO THE FINANCIAL STATEMENTS
Year Ended June 30, 2007
49
Government-wide Financial Statements The government-wide statements present information on all non-fiduciary activities of the primary government. Primary government activities are distinguished between governmental and business-type activities. Governmental activities generally are financed through taxes, intergovernmental revenues, and other non-exchange revenues. Business-type activities are financed in whole or in part by fees charged to external parties for goods or services. The effects of interfund activity have been eliminated from the government-wide statements except for the residual amounts due between governmental and business-type activities. The Statement of Net Assets presents the City’s non-fiduciary assets and liabilities, with the difference reported as net assets. Net assets are restricted when constraints placed upon them are either externally imposed or are imposed by constitutional provisions or enabling legislation. The Statement of Activities demonstrates the degree to which the direct expenses of a given function or segment are offset by program revenues. Direct expenses are those that are clearly identifiable within a specific function. The City does not allocate general government (indirect) expenses to other functions. Program revenues include: 1) charges to customers or applicants who purchase, use, or directly benefit from goods, services, or privileges provided by a given function; and 2) grants and contributions that are restricted to meeting the operational or capital requirements of a particular function. Taxes and other revenues not meeting the definition of program revenues are reported as general revenues. Fund Financial Statements The financial transactions of the City are recorded in individual funds. A fund is a separate accounting entity with a self-balancing set of accounts. Fund accounting is used to demonstrate legal compliance and to aid financial management by segregating transactions related to certain government functions or activities. Separate statements are provided for governmental and proprietary funds. For governmental and proprietary funds, the emphasis is on major funds, with each displayed in a separate column. The City reports the following major governmental funds: • General Fund - This fund is the principal operating fund of the City. It is used to account for all financial
resources not required to be accounted for in another fund.
• Debt Service Fund - This fund accounts for the accumulation of resources for payment of principal, interest, and related costs on the City’s general long-term debt.
• Ogden Redevelopment Agency Fund - This special revenue fund accounts for the agency’s redevelopment
activities. The Ogden Redevelopment Agency debt is included in this fund. Ogden City’s remaining nonmajor governmental funds account for specific revenue sources that are legally restricted to expenditures for specific purposes. Funds included are the Municipal Building Authority, Union Station, Downtown Special Assessment, and Cemetery Perpetual Care (Special Revenue Funds), the Gomer A. Nicholas Fund, a Permanent Fund, and the Capital Improvement Projects Fund. The nonmajor funds are grouped together in a single column in the basic financial statements and they are displayed individually in the combining statements. The City reports the following major proprietary funds:
• Water Utility Fund - This enterprise fund accounts for activities necessary to provide water services to residents.
• Sewer Utility Fund - This enterprise fund accounts for activities necessary to provide sewer services to residents.
• BDO Property Management Fund – This enterprise fund is used to account for operations of the Business Development Ogden project.
• Refuse Fund - This enterprise fund accounts for the services of refuse collection and disposal for residents.
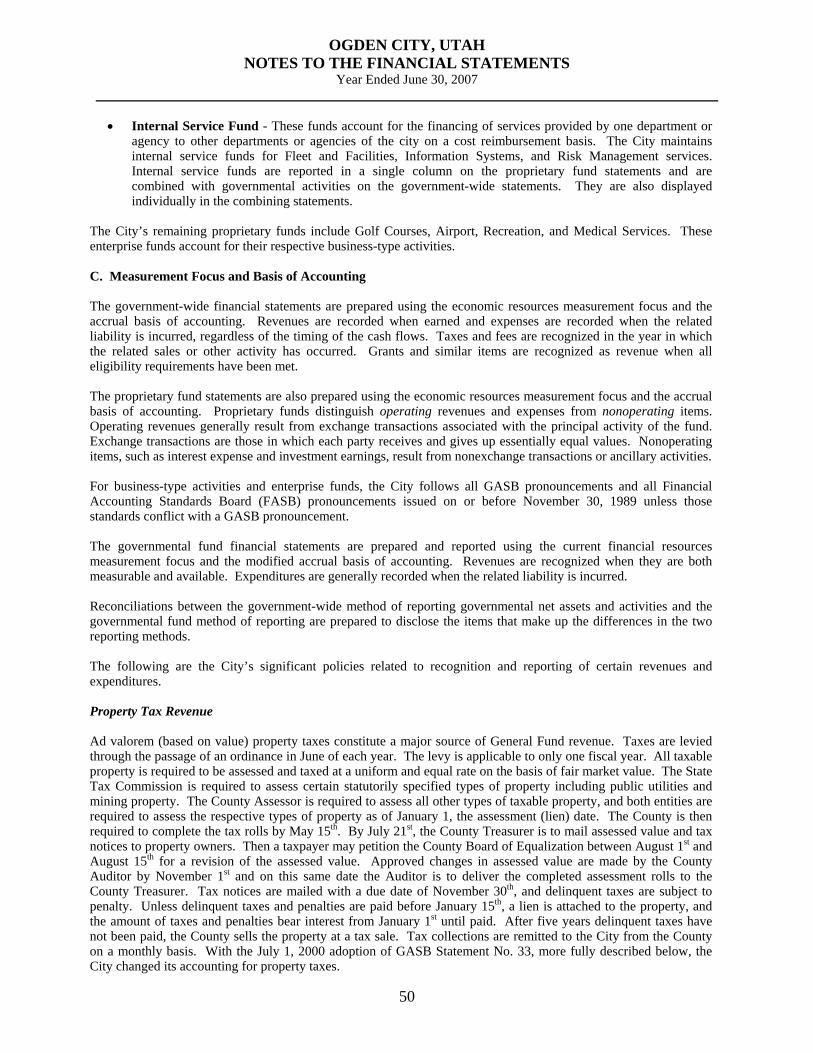
OGDEN CITY, UTAH NOTES TO THE FINANCIAL STATEMENTS
Year Ended June 30, 2007
50
• Internal Service Fund - These funds account for the financing of services provided by one department or agency to other departments or agencies of the city on a cost reimbursement basis. The City maintains internal service funds for Fleet and Facilities, Information Systems, and Risk Management services. Internal service funds are reported in a single column on the proprietary fund statements and are combined with governmental activities on the government-wide statements. They are also displayed individually in the combining statements.
The City’s remaining proprietary funds include Golf Courses, Airport, Recreation, and Medical Services. These enterprise funds account for their respective business-type activities. C. Measurement Focus and Basis of Accounting The government-wide financial statements are prepared using the economic resources measurement focus and the accrual basis of accounting. Revenues are recorded when earned and expenses are recorded when the related liability is incurred, regardless of the timing of the cash flows. Taxes and fees are recognized in the year in which the related sales or other activity has occurred. Grants and similar items are recognized as revenue when all eligibility requirements have been met. The proprietary fund statements are also prepared using the economic resources measurement focus and the accrual basis of accounting. Proprietary funds distinguish operating revenues and expenses from nonoperating items. Operating revenues generally result from exchange transactions associated with the principal activity of the fund. Exchange transactions are those in which each party receives and gives up essentially equal values. Nonoperating items, such as interest expense and investment earnings, result from nonexchange transactions or ancillary activities. For business-type activities and enterprise funds, the City follows all GASB pronouncements and all Financial Accounting Standards Board (FASB) pronouncements issued on or before November 30, 1989 unless those standards conflict with a GASB pronouncement. The governmental fund financial statements are prepared and reported using the current financial resources measurement focus and the modified accrual basis of accounting. Revenues are recognized when they are both measurable and available. Expenditures are generally recorded when the related liability is incurred. Reconciliations between the government-wide method of reporting governmental net assets and activities and the governmental fund method of reporting are prepared to disclose the items that make up the differences in the two reporting methods. The following are the City’s significant policies related to recognition and reporting of certain revenues and expenditures. Property Tax Revenue Ad valorem (based on value) property taxes constitute a major source of General Fund revenue. Taxes are levied through the passage of an ordinance in June of each year. The levy is applicable to only one fiscal year. All taxable property is required to be assessed and taxed at a uniform and equal rate on the basis of fair market value. The State Tax Commission is required to assess certain statutorily specified types of property including public utilities and mining property. The County Assessor is required to assess all other types of taxable property, and both entities are required to assess the respective types of property as of January 1, the assessment (lien) date. The County is then required to complete the tax rolls by May 15th. By July 21st, the County Treasurer is to mail assessed value and tax notices to property owners. Then a taxpayer may petition the County Board of Equalization between August 1st and August 15th for a revision of the assessed value. Approved changes in assessed value are made by the County Auditor by November 1st and on this same date the Auditor is to deliver the completed assessment rolls to the County Treasurer. Tax notices are mailed with a due date of November 30th, and delinquent taxes are subject to penalty. Unless delinquent taxes and penalties are paid before January 15th, a lien is attached to the property, and the amount of taxes and penalties bear interest from January 1st until paid. After five years delinquent taxes have not been paid, the County sells the property at a tax sale. Tax collections are remitted to the City from the County on a monthly basis. With the July 1, 2000 adoption of GASB Statement No. 33, more fully described below, the City changed its accounting for property taxes.

OGDEN CITY, UTAH NOTES TO THE FINANCIAL STATEMENTS
Year Ended June 30, 2007
51
GASB Statement No. 33, Accounting and Financial Reporting for nonexchange Transactions, defines a nonexchange transaction as one in which, “a government either gives value to another party without directly receiving equal value in exchange or receives value from another party without giving equal value in exchange.” For property taxes, at January 1 of each year (the assessment date), the City has the legal right to collect the taxes, and in accordance with the provisions of the statement, has now recorded a receivable and a corresponding deferred revenue for the assessed amount of those property taxes as of January 1, 2007. Revenue Availability Under the modified accrual basis of accounting, revenues are considered to be “available” when they are collected within the current period or expected to be collected soon enough thereafter to pay liabilities of the current period. Ogden City considers property tax revenues to be available if they are collected within 60 days after the end of the current year. Grants and similar items are recognized as revenue when all eligibility requirements have been met. All other revenues, including sales taxes, are considered to be available if they are collected within 60 days after year-end. Expenditure Recognition In governmental funds, expenditures are generally recorded when the related liability is incurred. However, debt service expenditures, as well as expenditures related to compensated absences and claims and judgments, are recorded only when payment is due. Capital asset acquisitions are reported as expenditures, and proceeds of long-term debt and acquisitions under capital leases are reported as other financing sources. When an expenditure is incurred for purposes for which both restricted and unrestricted resources are available, the City generally uses restricted resources first, then unrestricted resources. Program Revenues Amounts reported as program revenues include 1) charges to customers or applicants for goods and services, or priviledges provided, 2) operating grants and contributions, and 3) capital grants and contributions, including special assessments. Internally dedicated resources are reported as general revenues rather than as program revenues. Likewise, general revenues include all taxes. Proprietary funds Proprietary funds distinguish operating revenues and expenses from nonoperating items. Operating revenues and expenses generally result from providing services and producing and delivering goods in connection with a proprietary fund’s principal ongoing operations. The principal operating revenues of the enterprise funds and internal service funds are the result of charges to customers for sales and services. Operating expenses for enterprise and internal service funds include the cost of sales and services, administrative expenses and depreciation on capital assets. All revenues and expenses not meeting this definition are reported as nonoperating revenues and expenses. D. Assets, Liabilities, and Fund Balances/Net Assets The following are the City’s significant policies regarding recognition and reporting of certain assets, liabilities, and equity. Cash and Cash Equivalents Unrestricted and restricted cash balances of all funds are combined to form a pool of cash and investments which is managed by the City Treasurer. Utah State Statutes allow for investments in the Utah Public Treasurer’s Investment Fund and Utah Money Management Act (UMMA) approved financial institutions. The UMMA provides for a committee to evaluate financial institutions and provide a list of those qualified as depositories for public funds, including the amount they are authorized to maintain over and above insured amounts. The City Treasurer invests unrestricted cash with the Utah Public Treasurer’s Investment Fund and with financial institutions on the approved list. Investments in the pooled cash fund consist primarily of certificates of deposit, repurchase agreements, time deposits, commercial paper and government agency securities and are carried at cost which approximates market value. Interest income earned as a result of pooling is distributed to the appropriate funds based on month end balances of cash and investments. Short term investments that are readily convertible to known amounts of cash and have an original maturity date of three months less are defined as cash equivalents for purposes of the Cash Flow statements.

OGDEN CITY, UTAH NOTES TO THE FINANCIAL STATEMENTS
Year Ended June 30, 2007
52
Long-term Investments Investments are reported in accordance with GASB Statement 31. Investments are reported at fair market value or amortized cost. Interest Rate Swap
The Ogden City Redevelopment Agency (RDA) entered into two Libor-indexed interest rate swaps with Bear Stearns Capital Markets Inc. on November 10, 2005 in conjunction with the issuance of its $8,900,000 RDA Taxable Variable Rate Revenue Bonds Series 2005B and its $22,400,000 RDA Taxable Variable Rate Bonds Series 2005C-1 and 2005C-2. The Series 2005B Bonds will be paid from lease revenues derived from a commercial lease agreement. The Series 2005C-1 and 2005C-2 bonds will be paid with tax increment revenues from the American Can Redevelopment District and lease revenues. The Series 2005B and Series 2005C-1 and 2005C-2 bonds are further secured by a letter of credit issued by Bank of New York. The Bank of New York letter of credit terminates on November 28, 2008.
Objective: The RDA entered into the Swap Agreements to hedge its exposure to interest rate volatility on the Bonds and to create a synthetic fixed rate for the bonds during the first 10 years of the 2005 Bond financing.
Terms: The Series2005 Bonds were issued November 29, 2005, which is the same day the Swap became effective. The Series 2005B bonds amortize over a 25 year period ending January 1, 2031 and the Series 2005C bonds amortize over a 20 year period ending January 1, 2026. The swap terminates on December 1, 2015. Under terms of the Bear Stearns swap, the RDA pays the counterparty (Bank of New York) a fixed rate of 4.95% on the Series 2005B Bonds and 5.507% on the Series 2005C Bonds on the first business day of January, April, July, and October during the term of the Transaction. The RDA receives a floating rate on the same dates equal to 1 month Libor plus .20% applicable for the same calculation period. Fair Value: As of 06/30/2007 the following mid-market values based upon the market close rate data provided by Bloomberg Financial were: $ 8.9M - 100% Libor Swap $328,056 and $22.4M - 100% Libor Swap $58,413
Basis risk: The floating rate paid to the RDA under the Bear Stearns Swap is the actual 1 month Libor plus .20% on the Series 2005 Bonds. There is no mismatch between the amortization schedule for the Series 2005 Bonds and the Notional Amount Reduction schedule for the Bear Stearns Swap, either in the amount or timing of payments. Early Termination Risk: The RDA has the option to terminate the Bear Stearns Swap upon 30 days notice. The amount due with respect to an early termination shall be determined as though the counterparty is the sole affected party and “Market Quotation and Second Method” shall apply. Either party may terminate only upon an “Event of Default” caused by a “Failure to Pay or Deliver” as specified in Section 5 of the International Swaps and Derivatives Association (ISDA) Master Agreement. Any amounts due to the counterparty upon termination are payable from lease payments and tax increment revenue. Short-term Interfund Receivables and Payables During the course of operations, numerous transactions occur between individual funds for goods provided or services rendered. These receivables and payables are classified as due from other funds, or due to other funds on the balance sheet. Short-term interfund loans are classified as interfund receivables and payables. Loans to Other Funds Non-current portions of long-term interfund loan receivables are reported as loans and are offset equally by a fund balance reserve account which indicates that they do not constitute expendable available financial resources and therefore are not available for appropriation. Inventories Inventory is valued at cost using the first-in, first-out (FIFO) method, which approximates market. Inventory in the General Fund consists of cemetery lots for sale. The cost of governmental fund type inventories are recorded as expenditures when consumed rather than when purchased. Reported inventories are equally offset by a reserve to fund balance which indicates that they do not constitute available spendable resources even though they are a component of current assets.
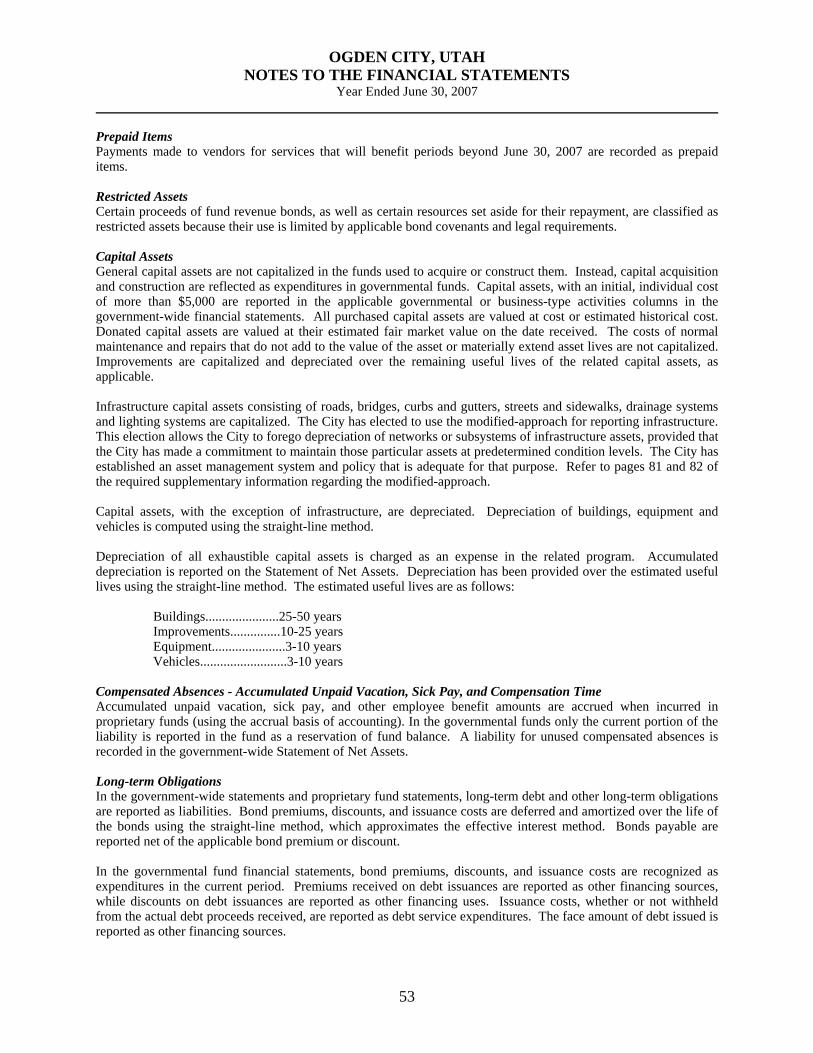
OGDEN CITY, UTAH NOTES TO THE FINANCIAL STATEMENTS
Year Ended June 30, 2007
53
Prepaid Items Payments made to vendors for services that will benefit periods beyond June 30, 2007 are recorded as prepaid items. Restricted Assets Certain proceeds of fund revenue bonds, as well as certain resources set aside for their repayment, are classified as restricted assets because their use is limited by applicable bond covenants and legal requirements. Capital Assets General capital assets are not capitalized in the funds used to acquire or construct them. Instead, capital acquisition and construction are reflected as expenditures in governmental funds. Capital assets, with an initial, individual cost of more than $5,000 are reported in the applicable governmental or business-type activities columns in the government-wide financial statements. All purchased capital assets are valued at cost or estimated historical cost. Donated capital assets are valued at their estimated fair market value on the date received. The costs of normal maintenance and repairs that do not add to the value of the asset or materially extend asset lives are not capitalized. Improvements are capitalized and depreciated over the remaining useful lives of the related capital assets, as applicable. Infrastructure capital assets consisting of roads, bridges, curbs and gutters, streets and sidewalks, drainage systems and lighting systems are capitalized. The City has elected to use the modified-approach for reporting infrastructure. This election allows the City to forego depreciation of networks or subsystems of infrastructure assets, provided that the City has made a commitment to maintain those particular assets at predetermined condition levels. The City has established an asset management system and policy that is adequate for that purpose. Refer to pages 81 and 82 of the required supplementary information regarding the modified-approach. Capital assets, with the exception of infrastructure, are depreciated. Depreciation of buildings, equipment and vehicles is computed using the straight-line method. Depreciation of all exhaustible capital assets is charged as an expense in the related program. Accumulated depreciation is reported on the Statement of Net Assets. Depreciation has been provided over the estimated useful lives using the straight-line method. The estimated useful lives are as follows: Buildings......................25-50 years Improvements...............10-25 years Equipment......................3-10 years Vehicles..........................3-10 years Compensated Absences - Accumulated Unpaid Vacation, Sick Pay, and Compensation Time Accumulated unpaid vacation, sick pay, and other employee benefit amounts are accrued when incurred in proprietary funds (using the accrual basis of accounting). In the governmental funds only the current portion of the liability is reported in the fund as a reservation of fund balance. A liability for unused compensated absences is recorded in the government-wide Statement of Net Assets. Long-term Obligations In the government-wide statements and proprietary fund statements, long-term debt and other long-term obligations are reported as liabilities. Bond premiums, discounts, and issuance costs are deferred and amortized over the life of the bonds using the straight-line method, which approximates the effective interest method. Bonds payable are reported net of the applicable bond premium or discount. In the governmental fund financial statements, bond premiums, discounts, and issuance costs are recognized as expenditures in the current period. Premiums received on debt issuances are reported as other financing sources, while discounts on debt issuances are reported as other financing uses. Issuance costs, whether or not withheld from the actual debt proceeds received, are reported as debt service expenditures. The face amount of debt issued is reported as other financing sources.

OGDEN CITY, UTAH NOTES TO THE FINANCIAL STATEMENTS
Year Ended June 30, 2007
54
Net Assets/Fund Balances The difference between assets and liabilities is reported as net assets on the government-wide and proprietary fund statements, and fund balance on the governmental fund statements. In the governmental fund statements, fund balances are classified as reserved or unreserved. Reserves represent those portions of fund balance that are not available for expenditures or are legally segregated for a specific future use. Unreserved fund balances are available for future appropriation, though some portions may be designated to represent management’s tentative plans for specific future uses. Temporarily (expendable) restricted net assets are those assets on which the City or an outside party has imposed a restriction use, however the funds are considered to be expendable. Permanently (non-expendable) restricted net assets are those assets on which an outside party has imposed a restriction of use, and the funds are not expendable. Net appreciation in the City’s permanent fund amounted to $18,255. The original grantor of the funds specified that any annual increase above the original principal endowment are to be invested in the recreational facilities of the City. Based on the original agreement, City policy allows the appropriation of annual interest earnings as reimbursement to departments that have invested in recreational facilities. E. Interfund Activity and Balances Government-wide Statements In general, eliminations have been made to minimize the double counting of internal activity, including internal service fund type activity. However, interfund services provided and used between different functional categories have not been eliminated in order to avoid distorting the direct costs and program revenues of the applicable functions. Interfund receivables and payables have been eliminated from the Statement of Net Assets, except for the residual amounts due between governmental and business-type activities, which are shown as “internal balances”. Governmental Fund Statements Interfund transactions for goods and services provided and used are reported as revenues and expenditures/expenses in the funds involved. Cash transfers between funds of the City are reported as other financing sources and uses in the governmental fund statements. NOTE 2. DEPOSITS AND INVESTMENTS Deposits and investments for Ogden City are governed by the Utah Money Management Act (Utah Code Annotated, Title 51, Chapter 7, “the Act”) and by rules of the Utah Money Management Council (“the Council”). Following are discussions of the City’s exposure to various risks related to its cash management activities. A. Custodial Credit Risk Deposits. Custodial credit risk for deposits is the risk that in the event of a bank failure, the City’s deposits may not be recovered. The City’s policy for managing custodial credit risk is to adhere to the Act. The Act requires all deposits of City funds to be in a qualified depository, defined as any financial institution whose deposits are insured by an agency of the federal government and which has been certified by the Commissioner of Financial Institutions as meeting the requirements of the Act and adhering to the rules of the Utah Money Management Council. The City’s deposits in the bank in excess of the insured amount are uninsured and are not collateralized, nor do state statutes require them to be. The City’s deposits at June 30, 2007 were $24,122,696 of which $23,622,696 were uninsured and uncollateralized. Investments. Custodial credit risk for investments is the risk that in the event of the failure of the counterparty, the City will not be able to recover the value of its investments that are in the possession of an outside party. The City does not have a formal policy for custodial credit risk of investments. The entire $14,218,017 of the City’s investments in government agency securities, corporate bonds, commercial paper, corporate notes and money market funds are uninsured, unregistered, and held by the counterparty’s trust department. However, the investments are held in the City’s name and therefore are not exposed to custodial credit risk.

OGDEN CITY, UTAH NOTES TO THE FINANCIAL STATEMENTS
Year Ended June 30, 2007
55
B. Credit Risk Credit risk is the risk that the counterparty to an investment transaction will not fulfill its obligations. The City’s policy for limiting the credit risk of investments is to comply with the Act. The Act requires investment transactions to be conducted only through qualified depositories, certified dealers, or directly with issuers of the investment securities. Permitted investments include deposits of qualified depositories; repurchase agreements; commercial paper that is classified as “first-tier” by two nationally recognized statistical rating organizations, one of which must be Moody’s Investor Services or Standard & Poors; bankers acceptances; obligations of the U.S. Treasury and U.S. government sponsored enterprises; bonds and notes of political subdivisions of the State of Utah; fixed rate corporate obligations and variable rate securities rate “A” or higher by two nationally recognized statistical rating organizations; and shares in a money market fund as defined in the Act. The City is also authorized to invest in the Utah Public Treasurer’s Investment Fund (PTIF), an external pooled investment fund managed by the Utah State Treasurer and subject to the Act and Council requirements. The PTIF is not registered with the SEC as an investment company, and deposits in the PTIF are not insured or otherwise guaranteed by the State of Utah. The PTIF operated and reports to participants on an amortized cost basis. The income, gains, and losses, net of administration fees, of the PTIF are allocated based upon the participants’ average daily balances. The fair value of the PTIF investment pool is approximately equal to the value of the pool shares. Following are the City’s cash and investments at June 30, 2007:
C. Interest Rate Risk Interest rate risk is the risk that changes in interest rates of debt investments that will adversely affect the fair value of an investment. The City manages its exposure to declines in fair value by investing mainly in the PTIF and by adhering to the Money Management Act. The Act requires that the remaining term to maturity of investments may not exceed the period of availability of the funds to be invested. The Act further limits the remaining term to maturity of commercial paper to 270 days or less and fixed rate negotiable deposits and corporate obligations to 365 days or less. Maturities of the City’s investments are noted in the previous table.
Cash deposit and Fair QualityInvestment Type Value Maturity RatingsCash on deposit ** $ 491,870 n/a not ratedPTIF Investments 6,168,911 n/a not ratedCerticates of deposit 5,918,827 n/a not ratedTrust accounts 11,543,088 n/a not ratedGovernment agency 999,422 605 days* AaaCorporate bond 992,600 146 days AaaCommercial paper 7,433,948 15 days* P-1Corporate notes 2,582,185 180 days* AaaMoney Market Funds 2,209,861 n/a not rated
Total $ 38,340,713
** Cash on deposit is equivalent to cash deposited with an insured financial institution.
Cash and investments $ 24,773,081 Restricted cash 2,024,184 Restricted investments 11,543,448
Total $ 38,340,713
* Weight-average maturity

OGDEN CITY, UTAH NOTES TO THE FINANCIAL STATEMENTS
Year Ended June 30, 2007
56
D. Concentration of Credit Risk Concentration of credit risk is the risk of loss attributed to the magnitude of a government’s investment in a single issuer. The City’s policy to limit this risk is to adhere to the rules of the Money Management Council. The Council rules do not limit the amount of investments a government may make in any one issuer except for Rule 2 regarding certain endowments and funds with a long-term perspective, and Rule 17 which limits investments in a single issuer of commercial paper and corporate obligations to between 5 and 10 percent depending upon the total dollar amount held in the government’s portfolio at the time of purchase. The City’s investments are diversified in such a manner that no individual investment represents more than 5% of the City’s total investments at June 30, 2007. These investments are reported within the General Fund, and Gomer A. Nicholas Park Fund
NOTE 3. RECEIVABLES AND PAYABLES A. Interfund Payables and Receivables: Due To/From other funds - Cash overdrafts: Funds which have overdrawn their share of pooled cash show a due to other funds on the balance sheet for the amount of the overdraft. Funds which management selected because of their strong cash position show an offsetting due from other funds on the balance sheet. Funds which had overdrawn their share of pooled cash and the offsetting funds as of June 30, 2007 were as follows:
The terms of repayment of the cash overdraft amounts are discussed in footnote 17 – Contingencies. B. Loans To/From Other Funds: Funds which have received loans from other funds as of June 30, 2007 were:
Payable Fund AmountGeneral Sewer $ 1,190,102 General Refuse 1,467,188 General Airport 27,569 General Internal service (facilities) 558,340 General Medical services 272,317 General Gomer Nicholas (non-major gov't) 9,129
Total $ 3,524,645
Receivable Fund
Payable Fund AmountRedevelopment Agency General $ 346,498 General Redevelopment Agency 9,052,847$ Allowance for uncollectible advances (see note 21) (6,332,847) 2,720,000 General Golf Course 1,336,419 General Airport 2,308,513 Sewer Golf Course 177,569 Cemetery Golf Course 443,342 Refuse Redevelopment Agency 2,000,000
Total $ 9,332,341
Receivable Fund

OGDEN CITY, UTAH NOTES TO THE FINANCIAL STATEMENTS
Year Ended June 30, 2007
57
NOTE 3. RECEIVABLES AND PAYABLES, CONTINUED B. Loans To/From Other Funds, Continued Repayment terms – Interfund Lending Activity : Redevelopment Agency loan to the General fund : The terms specify that this loan is for affordable housing projects and will be repaid as the associated homes are sold to qualifying homeowners. General fund to the Golf Courses Fund : The terms and City Council resolution indicate that principal and interest payments are to be budgeted for payment annually. General fund to the Airport fund : The terms and City Council resolution indicate that principal and interest payments are to be budgeted for payment annually. Sewer fund loan to Golf Courses fund : Terms of the note indicate that principal and interest payments are to be made from Golf Courses fund excess or by general fund operating transfer to the golf fund. Cemetery perpetual care fund loan to Golf Courses fund : Terms of the note indicate that principal and interest payments are to be made from Golf Courses fund excess or by general fund operating transfer to the golf fund. Refuse fund loan to the Redevelopment Agency fund : Terms of the note indicate that principal and interest are to be paid in full on or before June 30, 2011. General fund to the Redevelopment Agency : These loans have been reserved for in the general fund to the extent that they are considered collectible. Terms of the note specify that tax increment revenue from the individually identified project areas is to be used to repay these loans. Allowance for uncollectible advances As of June 30, 2007, it was determined that a valuation allowance was necessary regarding the above mentioned General fund to Redevelopment Agency interfund advances. This determination was made based on the anticipated revenues from the payment funding sources. The advances and associated valuation allowance are detailed as follows :
C. Management Information Services: Upon Recommendation of the Administration, the City Council approved an interest free computer purchase loan program for City employees. $100,000 was set aside in the MIS (Date Processing) Internal Service Fund as the funding mechanism. The program has strict controls to ensure that quality equipment is purchased and payment is handled automatically through payroll deduction with additional protection for early termination. $4,000 is the maximum allowed for each employee and as payments are received to replenish the funding for additional purchases, employees on a waiting list are given the opportunity to participate. In addition to the increased morale of City employees, this program benefits the City through increased employee computer literacy. The Management information Systems Internal Service Fund showed a receivable of $78,808 at June 30, 2007 for these PC loans to employees.
Payable Fund AmountGeneral RDA - Central Business District $ 1,751,601 General RDA - 25th Street District 3,821,794 General RDA - Washington Blvd. District 3,479,452
9,052,847
Allowance for uncollectible advances (6,332,847)
$ 2,720,000
Receivable Fund

OGDEN CITY, UTAH NOTES TO THE FINANCIAL STATEMENTS
Year Ended June 30, 2007
58
NOTE 3. RECEIVABLES AND PAYABLES, CONTINUED
D. Special Assessments Receivable:
NOTE 4. INTERFUND TRANSFERS Transfers between funds occur primarily to finance programs accounted for in one fund with resources collected in other funds in accordance with budgetary authorizations. For Ogden City, the following transfers are as shown:
Transfers are used to move revenues between funds to finance various programs that the government must account for in other funds in accordance with budgetary authorizations, including amounts provided as subsidies or matching funds for various grants. During the year ended June 30, 2007, the City made the following non-routine transfers: A transfer from the BDO Property Management Fund (a proprietary fund) to the Water Fund, Sewer Fund and the general government of capital infrastructure assets. The total transfer amount of $3,366,706 was allocated to these funds in the amount of $831,586, $1,247,377 and $1,780,846, respectively. A transfer from the management information systems internal service fund (ISF) of $1,300,000 and from the currently active fleet and facilities (ISF) of $316,334 for a total of $1,616,334 to the inactive facilities internal service fund to cover an accumulated deficit fund balance. A transfer from the currently active fleet and facilities fund (ISF) to the inactive central stores (ISF) in the amount of $184,033 to cover an accumulated deficit fund balance.
Redevel- Water and Internal Gov't Wide TotalGeneral opment Sewer BDO Nonmajor Service Statement Transfers
Fund Agency Funds Fund Funds Funds of Activities InTransfers out reported in:
General Fund $ - 994,000 - - 2,431,425 - - $ 3,425,425 Debt Service Fund - - - - - - - - Redevelopment Agency 67,831 2,764,236 - 1,400,000 - - - 4,232,067 Water Fund - - - - 10,450 - - 10,450 Sewer Fund - - - - 3,150 - - 3,150 BDO Property Management 985,000 - 1,585,860 - 100,000 - 1,780,846 4,451,706 Internal Service Funds - - - - - 1,800,367 - 1,800,367 Nonmajor Funds - - - - 19,000 - - 19,000
Total Transfers Out $ 1,052,831 $ 3,758,236 $ 1,585,860 $ 1,400,000 $ 2,564,025 $ 1,800,367 $ 1,780,846 $ 13,942,165
Transfers in reported in:
Current…………………………………….. $ 65,647 Delinquent………………………………… 275,789 Deferred…………………………………… 66,678
Total…………………………………… $ 408,114
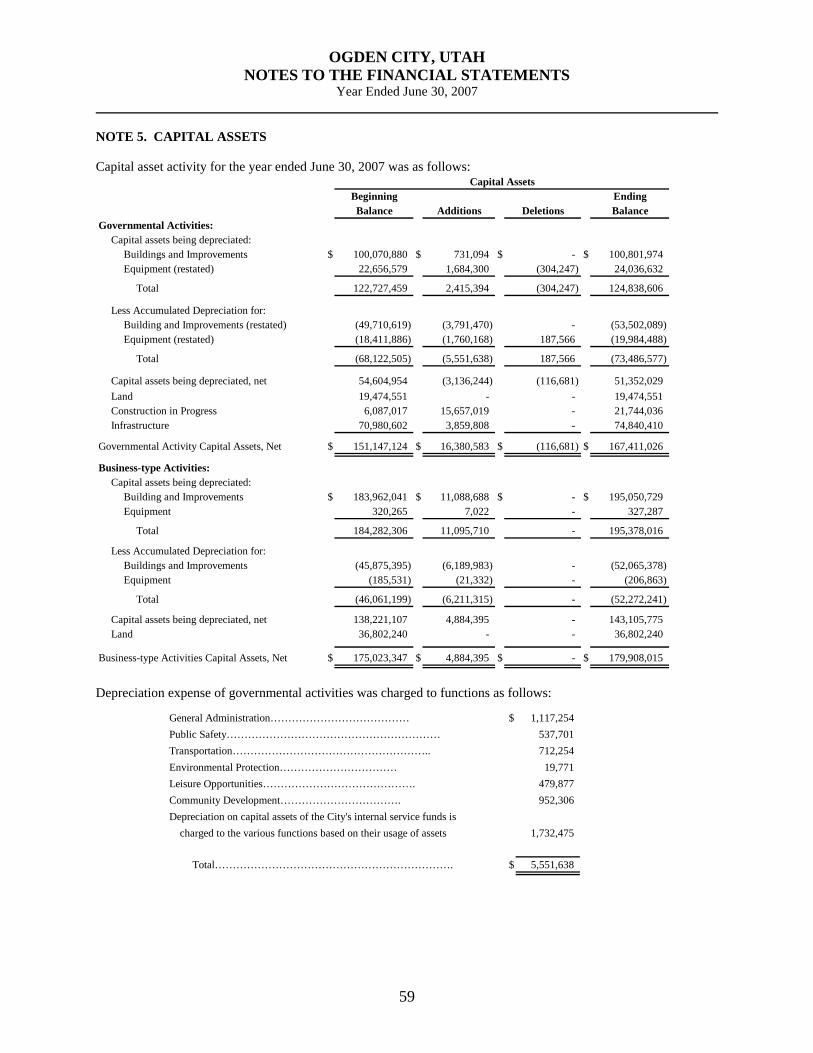
OGDEN CITY, UTAH NOTES TO THE FINANCIAL STATEMENTS
Year Ended June 30, 2007
59
NOTE 5. CAPITAL ASSETS Capital asset activity for the year ended June 30, 2007 was as follows:
Beginning EndingBalance Additions Deletions Balance
Governmental Activities:Capital assets being depreciated:
Buildings and Improvements $ 100,070,880 $ 731,094 $ - $ 100,801,974 Equipment (restated) 22,656,579 1,684,300 (304,247) 24,036,632
Total 122,727,459 2,415,394 (304,247) 124,838,606
Less Accumulated Depreciation for:Building and Improvements (restated) (49,710,619) (3,791,470) - (53,502,089) Equipment (restated) (18,411,886) (1,760,168) 187,566 (19,984,488)
Total (68,122,505) (5,551,638) 187,566 (73,486,577)
Capital assets being depreciated, net 54,604,954 (3,136,244) (116,681) 51,352,029 Land 19,474,551 - - 19,474,551 Construction in Progress 6,087,017 15,657,019 - 21,744,036 Infrastructure 70,980,602 3,859,808 - 74,840,410
Governmental Activity Capital Assets, Net $ 151,147,124 $ 16,380,583 $ (116,681) $ 167,411,026
Business-type Activities:Capital assets being depreciated:
Building and Improvements $ 183,962,041 $ 11,088,688 $ - $ 195,050,729 Equipment 320,265 7,022 - 327,287
Total 184,282,306 11,095,710 - 195,378,016
Less Accumulated Depreciation for:Buildings and Improvements (45,875,395) (6,189,983) - (52,065,378) Equipment (185,531) (21,332) - (206,863)
Total (46,061,199) (6,211,315) - (52,272,241)
Capital assets being depreciated, net 138,221,107 4,884,395 - 143,105,775 Land 36,802,240 - - 36,802,240
Business-type Activities Capital Assets, Net $ 175,023,347 $ 4,884,395 $ - $ 179,908,015
Capital Assets
Depreciation expense of governmental activities was charged to functions as follows:
General Administration………………………………… $ 1,117,254 Public Safety…………………………………………………… 537,701 Transportation……………………………………………….. 712,254 Environmental Protection…………………………… 19,771 Leisure Opportunities……………………………………. 479,877 Community Development……………………………. 952,306 Depreciation on capital assets of the City's internal service funds is
charged to the various functions based on their usage of assets 1,732,475
Total…………………………………………………………. $ 5,551,638

OGDEN CITY, UTAH NOTES TO THE FINANCIAL STATEMENTS
Year Ended June 30, 2007
60
The City has an active construction projects as of June 30, 2007. At year-end the City’s commitments with contractors are as follows:
NOTE 6. ASSETS HELD-FOR-RESALE As part of the redevelopment of the Central Business District and the Ogden River District, the City has purchased a number of real properties. As of June 30, 2007, the City held $4,816,417 in property for resale to purchasers meeting the criteria for the redevelopment district. NOTE 7. LEASE COMMITMENTS The City has entered into non-cancelable leases for equipment. Leases that in substance are purchases are reported as capital lease obligations. In the government-wide and proprietary fund statements, assets and liabilities resulting from capital leases are recorded at the inception of the lease at either the lower of fair value or the present value of the future minimum lease payments. The principal portion of lease payments reduces the liability, and the interest portion is expensed. In governmental fund statements, both the principal and interest portions of capital lease payments are recorded as expenditures of the applicable governmental function. These lease obligations are shown in the Fleet and Facilities and Management Information Systems funds which are both internal service funds. Lease Commitment Table:
Expended RemainingProject Commitment @ 6/30/07 Commitment
Recreation Center (Mall) $ 22,000,000 $ 21,744,036 $ 255,964
Governmental Business-typeActivities Activities Total
$ 301,558 $ - $ 301,558 228,553 - 228,553 228,553 - 228,553
65,344 - 65,344 - - - - - -
Total 824,008 - 824,008
Less amounts representing interest 60,778 - 60,778
Present value of future minimumlease payments $ 763,230 $ - $ 763,230
Equipment $ 1,241,236 Less accumulated depreciation (726,325)
Net book value $ 514,911
201020112012
thereafter
Year20082009

OGDEN CITY, UTAH NOTES TO THE FINANCIAL STATEMENTS
Year Ended June 30, 2007
61
NOTE 8. LONG-TERM LIABILITIES A. Changes in Long-term Liabilities Changes in long-term liabilities for the year ended June 30, 2007 were as follows:
The compensated absence liability of governmental activities is liquidated in the General Fund, Enterprise Funds, or Internal Service Funds where the related employing department operates. Governmental funds report only the amount that has matured but has not yet been paid. Additional information related to these long-term liabilities is found in the following tables including debt service requirements to maturity and information related to the City’s defeased bonds. B. General Obligation Bonds General Obligation Bonds Payable at June 30, 2007 consists of the following:
Issue Maturity Interest Original BalanceDate Date Rate Amount June 30, 2007
1996 Series Bonds 12/15/96 06/15/16 3.00% to 4.85% $ 23,000,000 $ 230,000 1998 Refunding Bonds 11/03/98 12/15/15 3.35% to 4.35% 9,375,000 8,655,000 2003 Refunding Bonds 12/15/03 12/15/11 2.50% to 3.15% 8,000,000 7,620,000 2006 Sales Tax Revenue Bonds 03/01/06 03/01/26 5.10% to 6.00% 1,995,000 1,950,000
$ 18,455,000
General Obligation Bonds Payable
Total General Obligation Bonds Outstanding
Beginning Ending Due WithinBalance Additions Reductions Balance One Year
Governmental Activities:General Obligation Bonds $ 20,020,000 $ - $ 1,565,000 $ 18,455,000 $ 1,645,000 Lease Revenue Bonds 3,340,000 - 335,000 3,005,000 160,000 Tax Increment Revenue Bonds 50,305,000 9,300,000 1,680,000 57,925,000 2,025,000 Special Assessment 257,000 - 81,000 176,000 86,000 Section 108 Notes 1,160,000 2,000,000 120,000 3,040,000 220,000 Lines-of-credit 1,693,305 1,495,375 - 3,188,680 3,188,680 Capital leases 1,033,025 - 269,795 763,230 279,804 Compensated absences 3,098,220 96,437 - 3,194,657 957,646 Claims payable - 531,621 - 531,621 - Add: Bond Premium 45,159 - 9,032 36,127 9,032 Less: Bond Discounts (319,485) - 16,815 (302,670) 16,815
Total Governmental Long-term Liabilities 80,632,224 13,423,433 4,076,642 90,012,645 8,587,977
Business-type Activities:Revenue Bonds and Notes $ 15,221,236 $ - $ 853,520 $ 14,367,716 $ 4,905,604 Compensated Absences 827,445 88,528 - 915,973 274,792
Total Business-type Long-term Liabilities 16,048,681 88,528 853,520 15,283,689 5,180,396
Long-term Liabilities

OGDEN CITY, UTAH NOTES TO THE FINANCIAL STATEMENTS
Year Ended June 30, 2007
62
B. General Obligation Bonds, Continued
Year Principal Interest Principal Interest Principal Interest2008 230,000 76,503 105,000 369,130 1,250,000 203,113 2009 105,000 364,904 1,525,000 166,519 2010 - - 105,000 360,650 1,565,000 124,031 2011 - - 110,000 356,242 1,615,000 77,479 2012 - - 120,000 351,410 1,665,000 26,223
2013-2017 - - 8,110,000 719,470 - - 2017 - - - - - - Total $ 230,000 $ 76,503 $ 8,655,000 $ 2,521,806 $ 7,620,000 $ 597,365
Year Principal Interest Principal Interest2008 60,000 100,575 1,645,000 749,321 2009 65,000 96,975 1,695,000 628,398 2010 70,000 93,075 1,740,000 577,756 2011 75,000 89,505 1,800,000 523,226 2012 75,000 85,680 1,860,000 463,313
2013-2017 450,000 295,925 8,560,000 1,015,395 2018-2027 1,155,000 384,160 1,155,000 384,160
Total $ 1,950,000 $ 1,145,895 $ 18,455,000 $ 4,341,569
General Obligation Bonds-Debt Service Requirements to Maturity
2006 Sales Tax
1996 Series 1998 Refunding 2003 Refunding
Total
C. Lease Revenue Bonds Lease Revenue Bonds Payable at June 30, 2007 consists of the following:
Issue Maturity Interest O riginal BalanceDate Date Rate Amount June 30, 2007
Series 2000A Bonds (refunded) 03/01/00 06/15/21 4.90% to 6.00% 3,680,000 145,000 Series 2006 refunding 04/04/06 06/15/21 4.35% 2,865,000 2,860,000
$ 3,005,000
Lease Revenue Bonds Payable
Total Lease Revenue Bonds Payable

OGDEN CITY, UTAH NOTES TO THE FINANCIAL STATEMENTS
Year Ended June 30, 2007
63
C. Lease Revenue Bonds, Continued
D. Tax Increment Revenue Bonds During 2007, the Redevelopment Agency issued tax increment revenue bonds for work in the West 12th Street and Fairmount Districts related to projects and business development in those Districts. Tax Increment Revenue Bonds Payable at June 30, 2007 consists of the following:
Year Principal Interest Principal Interest Principal Interest2008 145,000 157,680 15,000 278,873 160,000 436,553 2009 - - 170,000 123,873 170,000 123,873 2010 - - 175,000 118,873 175,000 118,873 2011 - - 185,000 108,873 185,000 108,873 2012 - - 190,000 103,873 190,000 103,873
2013-2017 - - 1,080,000 389,365 1,080,000 389,365 2018-2022 - - 1,045,000 116,619 1,045,000 116,619
Total $ 145,000 $ 157,680 $ 2,860,000 $ 1,240,349 $ 3,005,000 $ 1,398,029
Lease Revenue Bonds-Debt Service Requirements to MaturitySeries 2000A Series 2006 Refunding Total
Issue Maturity Interest Original BalanceDate Date Rate Amount June 30, 2007
25th Street (Crown Plaza) 09/18/01 02/01/18 variable 1,610,000 1,310,000 BDO Tax Increment Series 2001D 12/28/01 12/30/16 4.58% 6,670,000 5,880,000 BDO Tax Increment Series 2002B 01/10/02 12/30/16 4.58% 3,330,000 2,995,000 Wall Ave Tax Increment 08/29/02 02/01/19 variable 675,000 645,000 2005 Series A - Recreation Center 11/01/05 04/01/25 variable 7,280,000 6,840,000 2005 Series B - Recreation Center 11/01/05 04/01/25 variable / swap 8,900,000 8,900,000 2005 Series C - Recreation Center 11/29/05 01/01/26 variable / swap 22,400,000 22,400,000 2006 Series A - West 12th (tax-exempt) 12/20/06 04/01/17 4.43% 3,500,000 3,500,000 2006 Series B - West 12th (taxable) 12/20/06 04/01/12 6.35% 2,500,000 2,155,000 2007 Fairmount District 06/05/07 03/01/18 6.75% 3,300,000 3,300,000
$ 57,925,000
Tax Increment Bonds Payable
Total Tax Increment Revenue Bonds Payable
Year Principal Interest Principal Interest Principal Interest2008 $ 35,000 $ 9,352 $ 80,000 $ 39,300 $ 480,000 $ 269,304 2009 35,000 8,845 85,000 36,900 500,000 247,320 2010 40,000 8,337 90,000 34,350 520,000 224,420 2011 40,000 7,757 100,000 31,650 550,000 200,604 2012 45,000 7,177 105,000 28,650 570,000 175,414
2013-2017 295,000 24,649 680,000 90,000 3,260,000 460,748 2018-2022 155,000 3,407 170,000 5,100 - - 2023-2027 - - - - - -
Total $ 645,000 $ 69,524 $ 1,310,000 $ 265,950 $ 5,880,000 $ 1,577,810
Tax Increment Revenue Bonds-Debt Service Requirements to Maturity
(Crown Plaza) Series 2001DWall Ave Tax Increment25th Street BDO Tax Increment

OGDEN CITY, UTAH NOTES TO THE FINANCIAL STATEMENTS
Year Ended June 30, 2007
64
D. Tax Increment Revenue Bonds, Continued
Swap payments and associated debt Using rates as of June 30, 2007, debt service requirements of the Adjustable Rate 2005 Series B, 2005 Series C-1 and 2005 Series C-2 contain provisions for net swap payments. These payments assume current interest rates remain the same. As rates vary, variable-rate bond interest payments and net swap payments will vary. For the year ended June 30, 2007, the net swap receipts on the 2005 Series B and 2005 Series C Bonds were $52,107 and $4,159, respectively. These receipts effectively reduced the total paid for the fiscal year ended June 30, 2007 and are a reduction to the interest expense represented in the chart above.
Year Principal Interest Principal Interest Principal Interest2008 $ 240,000 $ 137,171 $ 245,000 $ 288,187 $ 180,000 $ 383,235 2009 255,000 126,179 275,000 277,530 190,000 375,187 2010 265,000 114,500 455,000 272,581 200,000 366,705 2011 275,000 102,363 475,000 255,127 215,000 357,733 2012 290,000 89,768 505,000 234,465 225,000 348,163
2013-2017 1,670,000 236,786 2,400,000 829,326 1,340,000 1,576,656 2018-2022 - - 1,515,000 420,426 1,775,000 1,240,564 2023-2027 - - 970,000 82,649 2,350,000 795,068 2028-2032 - - - - 2,425,000 214,334
Total $ 2,995,000 $ 806,767 $ 6,840,000 $ 2,660,291 $ 8,900,000 $ 5,657,645
Year Principal Interest Principal Interest Principal Interest2008 $ 640,000 $ 1,171,083 $ - $ 155,050 $ 125,000 $ 136,842 2009 685,000 1,134,668 - 155,050 370,000 128,905 2010 730,000 1,095,637 - 155,050 590,000 105,410 2011 775,000 1,049,266 - 155,050 645,000 67,945 2012 825,000 1,055,210 250,000 155,050 425,000 26,987
2013-2017 4,955,000 4,513,329 3,250,000 431,482 - - 2018-2022 6,725,000 2,918,088 - - - - 2023-2027 7,065,000 809,596 - - - -
Total $ 22,400,000 $ 13,746,877 $ 3,500,000 $ 1,206,732 $ 2,155,000 $ 466,089
Year Principal Interest Principal Interest2008 - $ 222,750 2,025,000 $ 2,812,274 2009 - 222,750 2,395,000 2,713,334 2010 225,000 222,750 3,115,000 2,599,740 2011 240,000 207,562 3,315,000 2,435,057 2012 255,000 191,362 3,495,000 2,312,246
2013-2017 1,290,000 698,961 19,140,000 8,861,937 2018-2022 1,290,000 87,075 11,630,000 4,674,660 2023-2027 - - 10,385,000 1,687,313 2028-2032 - - 2,425,000 214,334
Total 3,300,000 $ 1,853,210 57,925,000 $ 28,310,895
West 12th (Taxable)
Total
Recreation Center2005 Series C 2006 Series B2006 Series A
West 12th (Tax-exempt)
Recreation Center2005 Series A
Fairmount District2007 Series
2005 Series BRecreation CenterBDO Tax Increment
Series 2002B

OGDEN CITY, UTAH NOTES TO THE FINANCIAL STATEMENTS
Year Ended June 30, 2007
65
E. Special Assessment Bonds The City did not issue additional Special Assessment Bonds during the fiscal year ending June 30, 2007. Special Assessment Bonds payable at year end consists of the following:
F. Section 108 HUD Section 108 loan for $1,370,000 was created in fiscal year 1998 to refurbish the Eccles Building located in the heart of the City’s downtown district. The loan is scheduled to be retired in August of 2012. HUD Section 108 loan for $2,000,000 was created in fiscal year 2007 to purchase equipment for the City’s new high adventure recreation center. The loan was originally applied for in fiscal year 2005 and the purchase of the loan specified equipment took place in fiscal year 2006 using an advance from the City to the redevelopment district of the Ogden Redevelopment Agency. As of June 30, 2007, the loan had received final approval by HUD, but had not received final approval by the Mayor nor had the proceeds been received by the City. The City recorded the loan and a receivable and other financing source of revenue in fiscal year 2007 after making the determination that the expenditures should be reported on the fiscal year 2007 schedule of federal awards. Proceeds from the loan were received subsequent to year end. G. Enterprise Fund Revenue Bonds The individual balances of Enterprise Fund Revenue Bonds and notes are listed as follows:
Issue Maturity Interest Original BalanceDate Date Rate Amount June 30, 2007
District 190 06/30/99 07/01/09 4.80% to 5.40% $ 233,000 $ 57,000 District 191 06/30/99 07/01/09 4.80% to 5.40% 491,000 119,000
$ 176,000
Special Assessment Bonds Payable
Total Special Assessment Bonds Payable
Year Principal Interest Principal Interest Principal Interest2008 $ 28,000 $ 3,064 $ 58,000 $ 12,095 $ 86,000 $ 15,159 2009 29,000 1,566 61,000 9,339 90,000 10,905
Total $ 57,000 $ 4,630 $ 119,000 $ 21,434 $ 176,000 $ 26,064
Special Assessment Bonds-Debt Service Requirements to MaturityDistrict 190 District 191 Total
Issue Maturity Interest Original BalanceDate Date Rate Amount June 30, 2007
Series 1999 Refunding Bond (water and sewer) 04/01/99 06/15/24 5.00% to 6.20% $ 8,160,000 $ 6,415,000 Series 2001 Bonds (solid waste) 08/29/01 06/15/16 4.90% 3,300,000 2,455,000 Series 2003 Refunding Bonds 02/24/03 03/03/10 4.20% 2,000,000 928,765 Note Payable (BDO) 11/09/04 05/01/07 Prime or 4.00% 4,080,000 4,050,000 Note Payable (BDO) 04/22/05 04/22/11 None Contracted 726,530 518,950
$ 14,367,715
Enterprise Fund Revenue and Note
Total Bonds and Note Outstanding
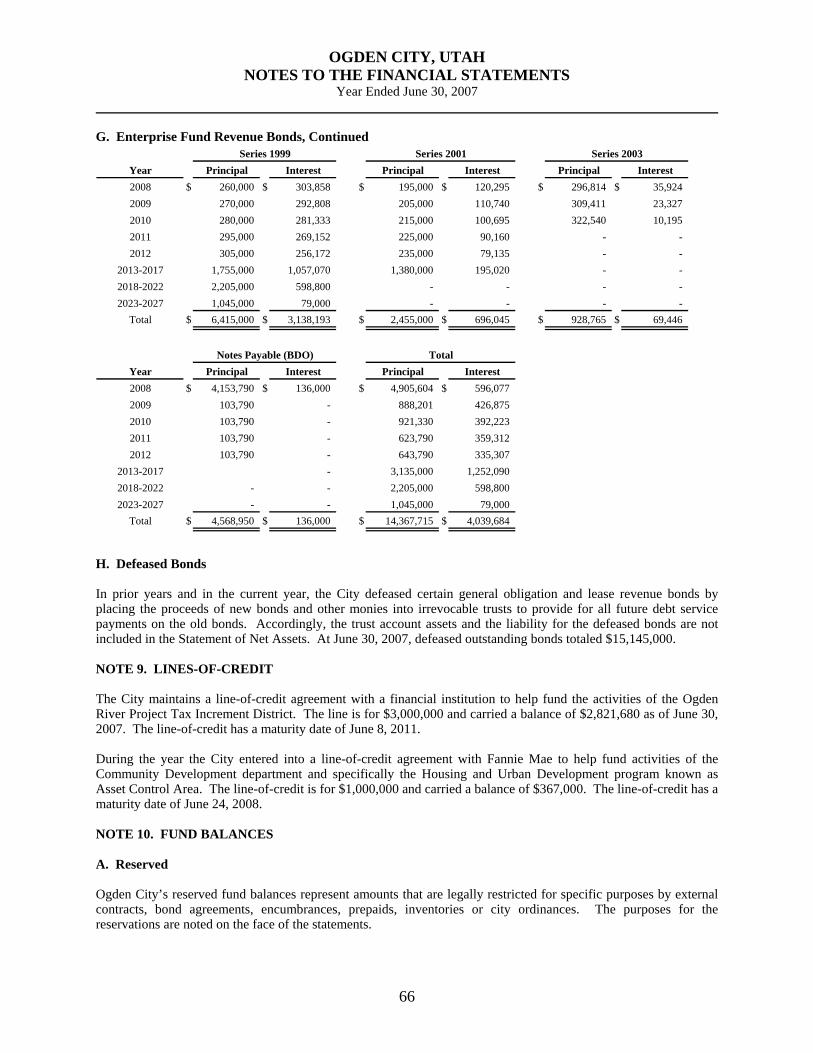
OGDEN CITY, UTAH NOTES TO THE FINANCIAL STATEMENTS
Year Ended June 30, 2007
66
G. Enterprise Fund Revenue Bonds, Continued
H. Defeased Bonds In prior years and in the current year, the City defeased certain general obligation and lease revenue bonds by placing the proceeds of new bonds and other monies into irrevocable trusts to provide for all future debt service payments on the old bonds. Accordingly, the trust account assets and the liability for the defeased bonds are not included in the Statement of Net Assets. At June 30, 2007, defeased outstanding bonds totaled $15,145,000. NOTE 9. LINES-OF-CREDIT
The City maintains a line-of-credit agreement with a financial institution to help fund the activities of the Ogden River Project Tax Increment District. The line is for $3,000,000 and carried a balance of $2,821,680 as of June 30, 2007. The line-of-credit has a maturity date of June 8, 2011. During the year the City entered into a line-of-credit agreement with Fannie Mae to help fund activities of the Community Development department and specifically the Housing and Urban Development program known as Asset Control Area. The line-of-credit is for $1,000,000 and carried a balance of $367,000. The line-of-credit has a maturity date of June 24, 2008. NOTE 10. FUND BALANCES A. Reserved Ogden City’s reserved fund balances represent amounts that are legally restricted for specific purposes by external contracts, bond agreements, encumbrances, prepaids, inventories or city ordinances. The purposes for the reservations are noted on the face of the statements.
Year Principal Interest Principal Interest Principal Interest2008 $ 260,000 $ 303,858 $ 195,000 $ 120,295 $ 296,814 $ 35,924 2009 270,000 292,808 205,000 110,740 309,411 23,327 2010 280,000 281,333 215,000 100,695 322,540 10,195 2011 295,000 269,152 225,000 90,160 - - 2012 305,000 256,172 235,000 79,135 - -
2013-2017 1,755,000 1,057,070 1,380,000 195,020 - - 2018-2022 2,205,000 598,800 - - - - 2023-2027 1,045,000 79,000 - - - -
Total $ 6,415,000 $ 3,138,193 $ 2,455,000 $ 696,045 $ 928,765 $ 69,446
Year Principal Interest Principal Interest2008 $ 4,153,790 $ 136,000 $ 4,905,604 $ 596,077 2009 103,790 - 888,201 426,875 2010 103,790 - 921,330 392,223 2011 103,790 - 623,790 359,312 2012 103,790 - 643,790 335,307
2013-2017 - 3,135,000 1,252,090 2018-2022 - - 2,205,000 598,800 2023-2027 - - 1,045,000 79,000
Total $ 4,568,950 $ 136,000 $ 14,367,715 $ 4,039,684
Total
Series 1999 Series 2001 Series 2003
Notes Payable (BDO)

OGDEN CITY, UTAH NOTES TO THE FINANCIAL STATEMENTS
Year Ended June 30, 2007
67
B. Designated The City has various designations of unreserved fund balance in certain funds for specific programs or projects. Fund balances are also designated for debt service, compensated absences, conference center and business information center as these amounts are not available for future appropriation or expenditure. Other purposes for the designations are noted on the face of the statements. C. Deficits At June 30, 2007, Refuse and Golf Courses had deficit fund balances/net assets of $101,589 and $589,118 respectively. The City expects these deficits to be eliminated through increased revenue or transfers in future years. NOTE 11. UNEARNED REVENUE Unearned revenues are resource inflows that do not yet meet the criteria for revenue recognition. Deferred amounts are reported as unearned revenue, when assets are recognized prior to the completion of the earnings process for a given transaction. In governmental funds, amounts that are unavailable are reported as unearned revenue until they are available to liquidate liabilities of the current period. Ogden City has unearned revenues as of June 30, 2007 as follows:
NOTE 12. RETIREMENT PLANS A. Pension Plans Ogden City contributes to the Local Government Contributory Retirement System, the Local Government Noncontributory Retirement Systems (collectively, the Systems), all of which are cost-sharing multiple-employer defined benefit pension plans. The Systems are administered by Utah Retirement Systems (URS) under the direction of the URS Board, which consists of the State Treasurer and six members appointed by the governor. URS is established under and governed by Title 49 of Utah Code Annotated, 1953, as amended (UCA). URS publishes an annual financial report that includes financial statements and required supplementary information for all retirement systems and deferred compensation plans administered by it. Copies of the report may be obtained by writing to Utah Retirement Systems, 560 East 200 South, Salt Lake City, Utah 84102; by calling 1-800-365-8772; or by visiting www.urs.org.
General Fund $ 18,490,299 Special Revenue Fund (Redevelopment Agency) 5,866,017 Nonmajor Governmental Funds 484,447
Unearned revenue, governmental funds, balance sheet 24,840,763
Property taxes levied for current and prior periods (delinquent) (575,000)
Unearned revenue, governmental activities, statement of net assets $ 24,265,763
Taxes receivable $ 14,073,569 Grant loans receivable 10,155,556 Utility customer account prepayments and overpayments 26,083 Special assessments receivable 484,447 Unspent grant advances 54,407 Prepaid interments 41,330 Miscellaneous 5,371
Total $ 24,840,763
Nonmajor enterprise fund, airport prepaid lease $ 558,602

OGDEN CITY, UTAH NOTES TO THE FINANCIAL STATEMENTS
Year Ended June 30, 2007
68
A. Pension Plans, Continued Retirement benefits, as specified by UCA Title 49, cover substantially all employees of the State, public education, and other political subdivisions of the State. Only the State Legislature can modify benefits. The Systems provide pension, death, and disability benefits for employees who meet all eligibility requirements. Employees are eligible for retirement benefits upon attainment of the age specified for their employment classification or a combination of age plus years of service. A brief summary of eligibility, benefits, and contribution rates of the Systems is provided in the table below. Expenditures or expenses for retirement costs are recorded in the City’s funds as contributions are made to the Systems. Contributions made each year were equal to the contributions required by the City’s contract with URS. Therefore, the City has no liability for pension obligations.
Public Safety/Contributory Noncontributory Fire Fighter
System System SystemHighest Average Salary……………………………… Highest 5 years Highest 3 years Highest 3 years
Years of Service and Age of Eligibility……………… 30 years any age 30 years any age 20 years any age20 years any age 25 years any age (a) 10 years age 6010 years any age 20 years age 60 (a) 4 years age 654 years any age 10 years age 62 (a)
4 years age 65
Benefit Percent per Year of Service………………… 1.10% to June 1967 2.00% per year 2.50% per year up to 20 years1.25% to June 1975 2.00% per year over 20 years
2.00% thereafter Benefit cannot exceed 70%of final average salary
Annual Cost of Living Adjustment…………………… up to 4.00% up to 4.00% up to 2.50%
2006 Rates as Percent of Covered Payroll:Employer……………………………………… 7.58% 11.59% 30.44%Member………………………………………… 6.00% - 8.72% (b)
Actual City Contributions Made, by year:2007…………………………………………… 205,441$ 1,288,761$ 1,962,455$ 2006…………………………………………… 193,136 1,211,046 1,608,275 2005…………………………………………… 186,190 1,096,567 1,524,131 2004…………………………………………… 185,009 1,024,102 1,438,456
(a) Requires full actuarial reductions
Local Government
(b) All or part may be paid by the City for the Employee
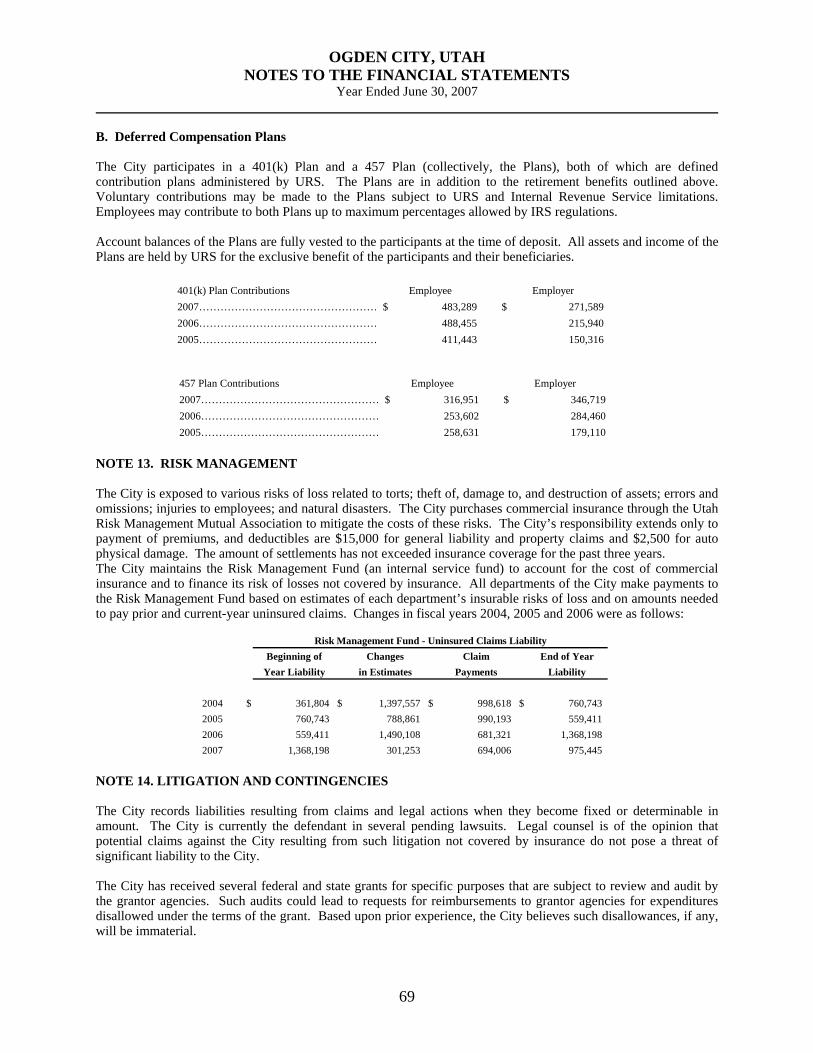
OGDEN CITY, UTAH NOTES TO THE FINANCIAL STATEMENTS
Year Ended June 30, 2007
69
B. Deferred Compensation Plans The City participates in a 401(k) Plan and a 457 Plan (collectively, the Plans), both of which are defined contribution plans administered by URS. The Plans are in addition to the retirement benefits outlined above. Voluntary contributions may be made to the Plans subject to URS and Internal Revenue Service limitations. Employees may contribute to both Plans up to maximum percentages allowed by IRS regulations. Account balances of the Plans are fully vested to the participants at the time of deposit. All assets and income of the Plans are held by URS for the exclusive benefit of the participants and their beneficiaries.
NOTE 13. RISK MANAGEMENT The City is exposed to various risks of loss related to torts; theft of, damage to, and destruction of assets; errors and omissions; injuries to employees; and natural disasters. The City purchases commercial insurance through the Utah Risk Management Mutual Association to mitigate the costs of these risks. The City’s responsibility extends only to payment of premiums, and deductibles are $15,000 for general liability and property claims and $2,500 for auto physical damage. The amount of settlements has not exceeded insurance coverage for the past three years. The City maintains the Risk Management Fund (an internal service fund) to account for the cost of commercial insurance and to finance its risk of losses not covered by insurance. All departments of the City make payments to the Risk Management Fund based on estimates of each department’s insurable risks of loss and on amounts needed to pay prior and current-year uninsured claims. Changes in fiscal years 2004, 2005 and 2006 were as follows:
NOTE 14. LITIGATION AND CONTINGENCIES The City records liabilities resulting from claims and legal actions when they become fixed or determinable in amount. The City is currently the defendant in several pending lawsuits. Legal counsel is of the opinion that potential claims against the City resulting from such litigation not covered by insurance do not pose a threat of significant liability to the City. The City has received several federal and state grants for specific purposes that are subject to review and audit by the grantor agencies. Such audits could lead to requests for reimbursements to grantor agencies for expenditures disallowed under the terms of the grant. Based upon prior experience, the City believes such disallowances, if any, will be immaterial.
Beginning of Changes Claim End of YearYear Liability in Estimates Payments Liability
2004 $ 361,804 $ 1,397,557 $ 998,618 $ 760,743 2005 760,743 788,861 990,193 559,411 2006 559,411 1,490,108 681,321 1,368,198 2007 1,368,198 301,253 694,006 975,445
Risk Management Fund - Uninsured Claims Liability
401(k) Plan Contributions Employee Employer2007…………………………………………… 483,289$ 271,589$ 2006…………………………………………… 488,455 215,940 2005…………………………………………… 411,443 150,316
457 Plan Contributions Employee Employer2007…………………………………………… 316,951$ 346,719$ 2006…………………………………………… 253,602 284,460 2005…………………………………………… 258,631 179,110

OGDEN CITY, UTAH NOTES TO THE FINANCIAL STATEMENTS
Year Ended June 30, 2007
70
NOTE 15. REDEVELOPMENT AGENCY The Ogden Redevelopment Agency had the following project areas which collected tax increment monies in the Fiscal Year ended June 30, 2007:
Outstanding principal amounts on bonded debt and other debt for the project areas at June 30, 2007:
NOTE 16. LEASE AGREEMENTS The City, as landlord, has entered into a master lease agreement with a property management and development company (the Company). Under the terms of the agreement, the Company has leased substantially all of the property known as Business Depot Ogden (BDO). Parcels not subject to the lease have been identified therein. The initial term for such lease is 50 years with rents based on calculations and other stipulations as detailed in the lease agreement. The activities of this lease arrangement are recorded in the BDO Property Management Enterprise fund of the City along with other City activities at the BDO facility. In addition, the City, as landlord, has entered into various tract leases with the Company at the Business Depot Ogden Project. The initial term for such leases is 40 years with rents based on a percentage of net operating revenue. The income generated from these lease arrangements is recorded in the BDO Property Management Enterprise fund of the City along with other City activities at the BDO facility.
Fairmont District……………………………………. $ 604,817 Central Business District Mall……………. 116,462 South Central Business District…………. 16,426 Lincoln Redevelopment……………………….. 217,821 Washington Blvd……………………………………. 439,651 Lester Park……………………………………………… 90,483 Golden Links…………………………………………… 740 Park Blvd…………………………………………………. 58,595 25th Street……………………………………………….. 601,239 St. Benedicts Manor……………………………… 215,279 Union Gardens………………………………………… 12,134 12th Street………………………………………………… 140,225 BDO………………………………………………………….. 2,158,335 American Can ……………………………………… 383,678 Wall Ave ……….…………………………………………. 79,707 West 12th Street………………………………………. 740,205 Hinckley Dr.………………………………………………. 515,416 Hinckley Airport……………………………………. 89,363
Bonded Debt Other Loans
Central Business District……………………………. $ 38,140,000 $ - Fairmount…………………………………………….. 3,300,000 - 25th Street……………………………………………… 1,310,000 - BDO……………………………………………………… 8,875,000 - Wall Ave………………………………………………… 645,000 - West 12th Street…………………………………….. 5,655,000

OGDEN CITY, UTAH NOTES TO THE FINANCIAL STATEMENTS
Year Ended June 30, 2007
71
NOTE 16. LEASE AGREEMENTS, CONTINUED The Redevelopment Agency, as landlord, has entered into a commercial lease agreement with a health and fitness company (the Company). Under the terms of the agreement, the Company has leased substantially all of the property known as the Solomon Center. The initial term of the lease is for 20 years with two five year renewal options. Base rents are scheduled to commence the first month following substantial completion of the facility, which as of June 30, 2007, was confirmed to be July 2007. According to the agreement the future minimum lease payments are $694,800 annually for a total of $13,896,000 over the initial term. The current estimated value of the assets is $22,000,000. As of June 30, 2007, the assets were reported as construction in progress and thus no depreciation we recorded in the current year. NOTE 17. CONTINGENCIES As shown in the accompanying financial statements, the City incurred a deficiency of expenditures over revenues of $1,015,173 for the year in the Governmental Funds. These deficits are the results of past and present activity related to the redevelopment of the City. Management considers these deficits as an investment in the City’s needed revitalization development. Management also feels the increased property values generated by the revitalization will increase future tax increment payments. Management also believes these tax increment payments and the related tax increment financing should eliminate this deficit over the next few years. The City will likewise benefit from additional taxes and other revenue sources from this investment. As of June 30, 2007, it was determined that negative cash balances being carried by the Airport and Medical funds are recoverable under the current operating arrangement. NOTE 18. RECLASSIFICATION Certain amounts in the prior year Comprehensive Annual Financial Report were reclassified to be comparable with the 2007 presentation. NOTE 19. RESTATEMENT OF NET ASSETS AND FUND BALANCES Certain amounts reported in the prior period (June 30, 2006) were improperly reported causing a restatement of beginning fund balances and net assets in the current period. These errors occurred in the following areas:
The follow details identify the specific causes for the restatement of beginning fund balances and net assets: Fixed assets balance correction of an error – spreadsheets used to track and depreciation the fixed assets of the City contained calculation errors that caused negative amortization of a few fixed assets. Long-term debt as presented in the statement of net assets, presented accumulated errors from prior year restatements that did not allow long-term debt to tie to the schedule of long-term debt in the footnotes. Line-of-credit balance correction of an error – review of the current year confirmation identified an error made in the prior year reporting of a line-of-credit balance. The adjustment was necessary for the long-term debt schedule to tie to the statement of net assets.
Governmental Funds /Governmental-Type Activities
Fixed assets balance, correction of an error (201,666)$ Long-term debt schedule, correction of an error (57,672) Line-of-credit balance, correction of an error (5,113)
Governmental-Type Net Assets (264,451)$

OGDEN CITY, UTAH NOTES TO THE FINANCIAL STATEMENTS
Year Ended June 30, 2007
72
NOTE 20. SUBSEQUENT EVENTS State of Utah Industrial Assistance Fund Grant – In a letter dated August 31, 2007, the Utah State Auditor’s Office issued an opinion on the City’s compliance with the grant requirements for the use of a $900,000 IAF grant. The State auditor’s opinion indicates that the City is in compliance with the requirements of the grant. Ogden Community Foundation – In a letter dated August 31, 2007, the Utah State Auditor’s Office issued an opinion on the relationship between the Ogden Community Foundation and Ogden City Corporation. The State auditor determined that based on the Foundations current operations, the Foundation does not qualify as a component unit of the City and therefore should not be included in the City Comprehensive Annual Financial Report as a discretely presented component unit. Ogden River Redevelopment District - In August 2007, the Ogden Redevelopment Agency sold lot #8 in the Ogden River redevelopment district The gain on the sale of the lot resulted in a reduction in the line-of-credit and assets held-for-sale balances in the statement of net assets. Fairmount Redevelopment District Project – In August 2007, the Fairmount District of the Ogden Redevelopment Agency (RDA) received a payment in the amount of $500,000 from the Utah State Industrial Assistance Fund to be used toward bonded debt recently issued in the District. The payment was part of the negotiated contract to bring a new distribution company to the State and City. Fairmount Redevelopment District – In September 2007, the Fairmount District of the RDA used proceeds from bonded debt escrow to purchase property within the District with a purchase price of $2,870,000. West 12th Street Redevelopment District – In July 2007, the West 12th Street District of the RDA, in an agreement negotiated with the Weber School District (WSD), used proceeds ($2,500,000) from bonded debt escrow to purchase property formerly used as the WSD bus maintenance facility to hold as an investment for future expansion of nearby commercial developments. In addition, in accordance with the above mentioned agreement the District used proceeds ($1,300,000) from bonded debt escrow to purchase property for the relocation of the WSD bus maintenance facility. Ownership of this property was simultaneously transferred to the Weber School District. NOTE 21. SPECIAL ITEM As of June 30, 2007, it was determined by management that certain interfund advances receivable would not be fully collectible. Analysis of the funding sources for the various payments indicated that funding for certain payments will expire in advance of complete repayment. A valuation allowance was recorded against the advances receivable with simultaneous reduction in the associated advances payable (See Note 3). This valuation transaction is recorded as a special item given that it has not been the practice of the City to forgive interfund advances nor has it been the experience of the City that interfund advances be determined uncollectible. This policy and history qualify the event as unusual in nature. The magnitude of the valuation was determined to be significant and under the control of management. The effect of the valuation transaction is reported as a reduction in current year fund balance in the general fund and an increase in current year fund balance in the redevelopment agency. Given that the effect of the transaction is eliminated in the governmental funds it is not present in the statement of governmental activities.

Required Supplementary
Information


73
THIS PAGE INTENTIONALLY LEFT BLANK
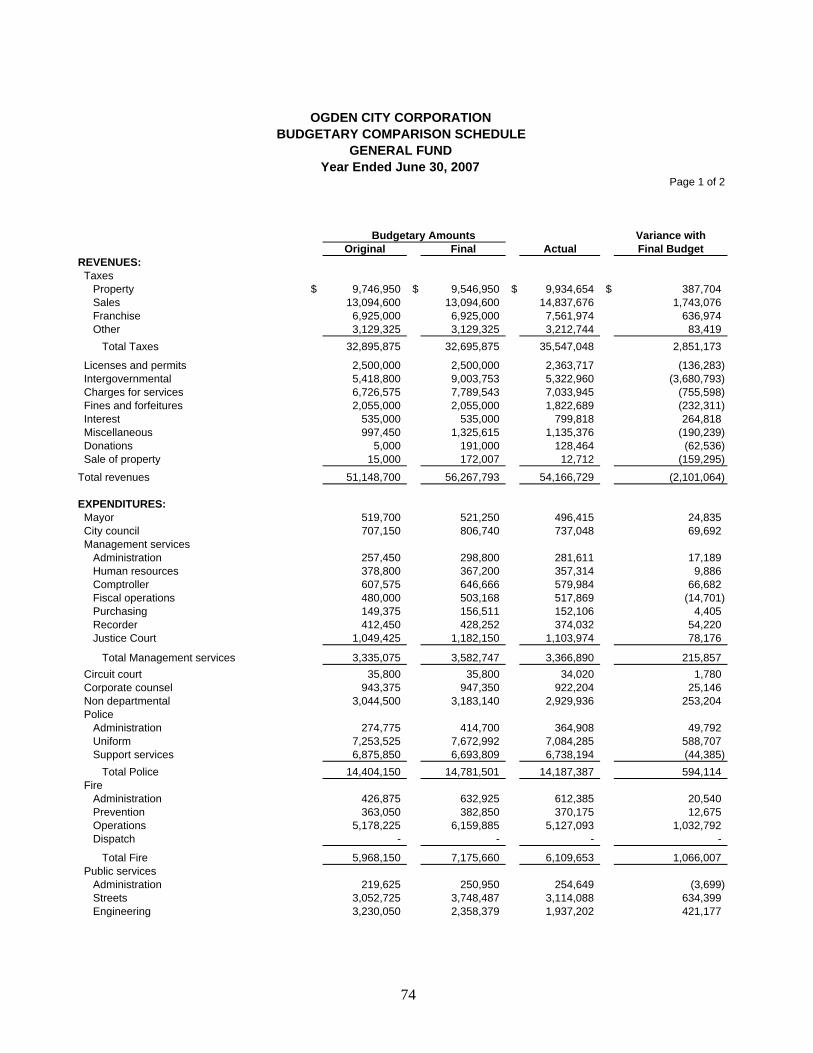
Page 1 of 2
Budgetary Amounts Variance withOriginal Final Actual Final Budget
REVENUES: Taxes Property $ 9,746,950 $ 9,546,950 $ 9,934,654 $ 387,704 Sales 13,094,600 13,094,600 14,837,676 1,743,076 Franchise 6,925,000 6,925,000 7,561,974 636,974 Other 3,129,325 3,129,325 3,212,744 83,419 Total Taxes 32,895,875 32,695,875 35,547,048 2,851,173
Licenses and permits 2,500,000 2,500,000 2,363,717 (136,283) Intergovernmental 5,418,800 9,003,753 5,322,960 (3,680,793) Charges for services 6,726,575 7,789,543 7,033,945 (755,598) Fines and forfeitures 2,055,000 2,055,000 1,822,689 (232,311) Interest 535,000 535,000 799,818 264,818 Miscellaneous 997,450 1,325,615 1,135,376 (190,239) Donations 5,000 191,000 128,464 (62,536) Sale of property 15,000 172,007 12,712 (159,295) Total revenues 51,148,700 56,267,793 54,166,729 (2,101,064)
EXPENDITURES: Mayor 519,700 521,250 496,415 24,835 City council 707,150 806,740 737,048 69,692 Management services Administration 257,450 298,800 281,611 17,189 Human resources 378,800 367,200 357,314 9,886 Comptroller 607,575 646,666 579,984 66,682 Fiscal operations 480,000 503,168 517,869 (14,701) Purchasing 149,375 156,511 152,106 4,405 Recorder 412,450 428,252 374,032 54,220 Justice Court 1,049,425 1,182,150 1,103,974 78,176
Total Management services 3,335,075 3,582,747 3,366,890 215,857 Circuit court 35,800 35,800 34,020 1,780 Corporate counsel 943,375 947,350 922,204 25,146 Non departmental 3,044,500 3,183,140 2,929,936 253,204 Police Administration 274,775 414,700 364,908 49,792 Uniform 7,253,525 7,672,992 7,084,285 588,707 Support services 6,875,850 6,693,809 6,738,194 (44,385) Total Police 14,404,150 14,781,501 14,187,387 594,114 Fire Administration 426,875 632,925 612,385 20,540 Prevention 363,050 382,850 370,175 12,675 Operations 5,178,225 6,159,885 5,127,093 1,032,792 Dispatch - - - -
Total Fire 5,968,150 7,175,660 6,109,653 1,066,007 Public services Administration 219,625 250,950 254,649 (3,699) Streets 3,052,725 3,748,487 3,114,088 634,399 Engineering 3,230,050 2,358,379 1,937,202 421,177
OGDEN CITY CORPORATIONBUDGETARY COMPARISON SCHEDULE
GENERAL FUNDYear Ended June 30, 2007
74

Page 2 of 2
Budgetary Amounts Variance withOriginal Final Actual Final Budget
Public services (cont.) Arts, culture & events $ 339,300 $ 311,261 $ 226,407 $ 84,854 Animal services 716,500 720,300 698,638 21,662 Parks and cemetery 3,526,625 4,112,663 3,852,208 260,455 Recreation 1,507,475 1,523,337 1,393,436 129,901 Total Public services 12,592,300 13,025,377 11,476,628 1,548,749 Community & economic development Administration 1,133,875 1,530,538 1,151,455 379,083 Property development 4,597,200 5,154,630 3,330,912 1,823,718 Planning 396,700 1,637,507 1,242,328 395,179 Inspections 857,975 3,005,245 2,224,818 780,427 Total Community and economic development 6,985,750 11,327,920 7,949,513 3,378,407 Debt service Principal 1,685,000 1,685,000 1,685,000 - Interest 1,231,500 1,231,500 768,178 463,322 Fees and assessments - - - - Capital outlay - - - -
Total expenditures 51,452,450 58,303,985 50,662,872 7,641,113
Excess (deficiency) of revenues over expenditures (303,750) (2,036,192) 3,503,857 5,540,049
OTHER FINANCING SOURCES (USES):Bond proceeds - - 2,000,000 2,000,000 Special item - - (6,332,847) (6,332,847) Transfers in 150,000 1,135,000 1,052,831 (82,169) Transfers out (596,425) (3,753,925) (3,425,425) 328,500
Total other financing sources/(uses) (446,425) (2,618,925) (6,705,441) (4,086,516)
Excess (deficiency) of revenues and other financing sources over (under) expendituresand other financing uses (750,175) (4,655,117) (3,201,584) 1,453,533
Fund balances at beginning of year 17,094,846 17,094,846 17,094,846 -
Fund balances at end of year $ 16,344,671 $ 12,439,729 $ 13,893,262 $ 1,453,533
75

Variance withFinal Budget
FavorableOriginal Final Actual (Unfavorable)
REVENUES: Taxes and special assessments $ 7,772,000 $ 7,772,000 $ 6,787,687 $ (984,313) Charges for services 2,000 2,000 1,200 (800) Miscellaneous income 1,013,300 2,653,300 727,610 (1,925,690) Interest income 408,475 1,058,475 904,982 (153,493) Sale of property - 956,850 789,560 (167,290)
Total revenues 9,195,775 12,442,625 9,211,039 (3,231,586)
EXPENDITURES: Current: City Council 80,000 31,369 15,135 16,234 Community & Economic Development 3,756,850 30,199,354 18,022,466 12,176,888 Debt service: Debt service principal 2,394,975 3,172,684 1,680,000 1,492,684 Debt service interest 1,448,350 1,448,350 3,893,711 (2,445,361)
Total expenditures 7,680,175 34,851,757 23,611,312 11,240,445
Excess (deficiency) of revenues over expenditures 1,515,600 (22,409,132) (14,400,273) 8,008,859
OTHER FINANCING SOURCES (USES): Bond proceeds - 9,600,000 9,300,000 (300,000) Special item - - 6,332,847 6,332,847 Operating transfers in 850,000 850,000 3,758,236 2,908,236 Operating transfers out (2,365,600) (2,660,600) (4,232,236) (1,571,636)
Total other financing sources (uses) (1,515,600) 7,789,400 15,158,847 7,369,447
Excess (deficiency) of revenues and other financing sources over (under) expenditures and other financing uses - (14,619,732) 758,574 15,378,306
Fund balance at beginning of year 8,566,842 8,566,842 8,566,842
Fund balance at end of year $ 8,566,842 $ (6,052,890) $ 9,325,416
Budgeted Amounts
OGDEN CITY CORPORATIONBUDGETARY COMPARISON SCHEDULE
OGDEN REDEVELOPMENT AGENCY - SPECIAL REVENUE FUNDYear Ended June 30, 2007
76

OGDEN CITY, UTAH NOTES TO THE REQUIRED SUPPLEMENTARY INFORMATION
Year Ended June 30, 2007
77
Budgets and Budgetary Accounting Budgets are adopted on a basis consistent with generally accepted accounting principles. Annual appropriated budgets are adopted for all the funds. All annual appropriations lapse at the fiscal year end. Project-length financial plans are adopted for all capital projects funds. Summary of City Budget Procedures and Calendar: 1. The City Council can amend the budget to any extent, provided the budgeted expenditures do not exceed budgeted revenues and appropriated fund balance. 2. Budgets are required by the State of Utah for the General, Special Revenue, Debt Service, and Capital Improvement Project Funds. The city also prepares budgets for Enterprise and Internal Service Funds 3. The City’s organizational structure is divided into major administrative areas of management responsibility for an operation or group of related operations within a functional area referred to as “departments.” Within a department may be several related operations. Each of which is referred to as a “division.” The legal level of control (defined as the level at which the governing body must approve any expenditures in excess of appropriations or transfers of appropriated amounts) required by the State of Utah is at the departmental level. Each year the City publishes a separate budget document prepared according to this legal level of control. 4. The City’s budget is a Financial Plan of all estimated revenues and all appropriations for expenditures. Revenues and Expenditures must balance for the funds required by the State Code as indicated in item 2 above. 5. A tentative budget is presented by the Mayor to the City Council by the first regularly scheduled council meeting in May. The tentative budget is reviewed and tentatively adopted by the Council no later than June 22. 6. The tentative budget is a public record and is available for inspection at the County library, City finance department, and City Recorder’s office for at least ten days prior to adoption of the final budget. 7. Notice of public hearing on adoption of the final budget is published seven days prior to the public hearing. 8. The public hearing on the tentatively adopted budget is held no later than June 22. Final adjustments are made to the tentative budget by the council after the public hearing. 9. Occasionally the City Council will exercise their option to open the budget to indicate additional financing sources that become available. One each year, as the financial report for the prior year is completed, there is a substantial budget opening. At that time carryover funds in the form of encumbrance reserves, capital projects funding and unallocated federal funds are included in the next year’s budget. 10. The final budget is adopted by ordinance before June 22 and a copy of the budget certified by the Budget Officer is filed with the State Auditor within thirty days of adoption. 11. In connection with budget adoption: a. An annual tax ordinance establishing the property tax rate is adopted before June 22.
b. The City Recorder is to certify the property tax rate to the County Auditor before June 22.
12. Budgets for the General, Special Revenue, Debt Service and Capital Improvement Projects Funds are adopted on a basis consistent with generally accepted accounting principles (GAAP).
OGDEN CITY, UTAH NOTES TO THE REQUIRED SUPPLEMENTARY INFORMATION
Year Ended June 30, 2007
78
Summary of Action Required for Budget Changes: Transfers of unexpended appropriations from one division to another and from one expenditure account to another in the same department within a fund can be made with the consent of the Budget Officer and CAO. The Council may, by resolution, transfer unexpended appropriations from one department to another department within the same fund. The budget appropriation for any department may be reduced by resolution. Fund budgets may be increased by ordinance after a public hearing. Final amendments to budgets in the current year shall be adopted by the Council by the last day of the fiscal year. Budgets of Enterprise Funds may be increased by ordinance of the governing body (public hearing not required).

79
OGDEN CITY, UTAH Year Ended June 30, 2007
Required Supplementary Information
INFORMATION ABOUT INFRASTRUCTURE ASSETS REPORTED USING THE MODIFIED APPROACH As allowed by GASB Statement No. 34, Basic Financial Statements – and Management's Discussion and Analysis - for State and Local Governments, the City has adopted an alternative to reporting depreciation on roads and bridges (infrastructure assets) maintained by Ogden City. Under this alternative method, referred to as the “modified approach”, infrastructure assets are not depreciated, and maintenance and preservation costs are expensed. In order to utilize the modified approach, the City is required to: • Maintain an asset management system that includes an up-to-date inventory of eligible infrastructure assets.
• Perform and document replicable condition assessments of the eligible infrastructure assets and summarize the results using a
measurement scale.
• Estimate each year the annual amount to maintain and preserve the eligible infrastructure assets at the condition level established and disclosed by the City.
• Document that the infrastructure assets are being preserved approximately at, or above the condition level established by the City.
Roads
Ogden City uses the Utah State Local Technology Assistance Program (LTAP) to determine the condition of 305 centerline miles of City roads. The assessment is based on the Remaining Service Life (RSL). Our goal is to keep the overall RSL at or above ten years. This is the point at which pavement maintenance is able to keep up with deterioration of pavement and much more expensive street reconstruction projects are not needed. The cost to maintain a pavement with preventative maintenance treatments is about one-third the cost of rehabilitation, or one-sixth the cost of reconstruction.
Category RSL Description
Very Good 19+ New or nearly new pavements that are mainly free of distress.
Good 13-18 Pavements exhibit few, if any, visible signs of distress.
Fair 10-12 Surface defects in this category such as cracking, rutting, and raveling.
Poor 4-9 These roadways have deteriorated to such an extent that they are in need of resurfacing.
Very Poor 0-3 Pavements in this category are severely deteriorated.
Condition Level The City's established condition level is to maintain 50 percent of its roads with a rating of “fair” or better and no more than 15 percent of roads with a rating of “very poor”. All streets are surveyed annually to determine their condition. This data is used to determine changes in pavement condition and to prioritize the type and quantity of pavement maintenance work that is to be accomplished during the coming summer. The City performs complete assessments on a calendar year basis. The following table reports the result of pavements with ratings of “fair” or better or “very poor for the last five years: Rating 2007 2006 2005 2004 2003 Fair or Better 56% 55.2% 54.9% 55.0% 55.1% Very Poor 2% 2.3% 2.4% 2.0% 1.1%

80
OGDEN CITY, UTAH Year Ended June 30, 2007
Required Supplementary Information Bridges Utah Department of Transportation (UDOT), Bridge Operations Section, maintains the inventory of all bridge structures in Ogden City. Each spring, UDOT staff members inspect the bridges in Ogden City. A report is submitted to Ogden City indicating what maintenance and repair actions are required. Three categories of condition are established as follows:
Category Description
Good Preventive maintenance requirements include repair leaking deck joints, apply deck overlays and seals, place concrete sealers to splash zones, paint steel surfaces, and minor beam repairs.
Fair Corrective repairs include deck, beam, and substructure repairs, fixing settled approaches, and repairing collision damage.
Poor Major rehabilitation and replace includes deck, beam, or substructure replacements or replacement of the entire bridge.
Condition Level In response to the annual UDOT bridge inspection report, the recommended actions are either accomplished by Ogden City Public Works Operations Division Staff or by contract. Based on the cost of the resultant contract estimates, projects will be funded using road fund money already in our budget for contract work or materials purchased for in-house staff to accomplish the work. If necessary, a CIP project will be created to accomplish any major repair or alteration work. The City's established condition level is to maintain 50 percent of its bridges with a rating of “good” and no more than 25 percent of bridges with a rating of “poor”. Rating 2007 2006 2005 2004 2003 Good 63% 56% 56% 51 % 57% Poor 10% 7% 7% 7 % 7% The following table presents the City’s estimated amounts needed to maintain and preserve the roads and bridges at or above the established condition levels addressed above, and the amounts actually spent for each of the past five reporting periods:
FISCAL YEAR ESTIMATED SPENDING ACTUAL SPENDING 2007 $4,248,487 $3,600,085 2006 5,232,744 4,712,018 2005 3,978,556 3,522,452 2004 4,204,103 3,672,784 2003 9,993,688 3,750,530

Supplementary
Information


81
Nonmajor Governmental Funds Capital Improvement Projects Fund The Capital Improvement Projects Fund is used to account for financial resources to be used for the construction of major capital facilities (other than those financed by Proprietary Funds and Trust Funds). Municipal Building Authority Fund A special revenue fund used to account for the lease revenues that are legally restricted to expenditures for the City's development associated with Municipal Building Authority. Downtown Special Assessment Fund A special revenue fund used to account for the special assessment revenues that are legally restricted to expenditures for the City's promotion of downtown business activities. Union Station Fund A special revenue fund used to account for the specific revenues that are legally restricted to expenditures for Union Station. Union Station was established as a museum in 1976. It is listed on the National Register of Historical Places and the Utah Bicentennial Project. The Grand Opening was in October 1978. Activities include: guided tours, dances, live theater productions, exhibits, research and acquisition programs and a scale model railroad depicting the nation's first transcontinental railroad. Museums include: railroad, John M. Browning firearms and the Browning-Kimball Car Museum. Special facilities include: M. S. Browning Theater, Myra Powell Gallery, convention and meeting rooms, restaurant and a gift shop. Cemetery Perpetual Care Fund To account for monies received on sale of grave plots which will provide for perpetual upkeep of the graves. Gomer A. Nicholas Park Endowment Fund A permanent Fund to account for the interest earnings of this fund and the transfer of these earnings to the Capital Improvement Projects Fund for use in parks development.

OGDEN CITY CORPORATIONCOMBINING BALANCE SHEET
NONMAJOR GOVERNMENTAL FUNDS
PermanentCapital Municipal Downtown Cemetery Gomer
Improvement Building Special Union Perpetual A. Projects Authority Assessment Station Care Nicholas Totals
ASSETS Cash $ 2,220,668 $ 266,250 $ 330,610 $ 8 $ 568,933 $ - $ 3,386,469 Due from other funds - - - - - - - Accounts receivable (net) - - - - 18,644 9,134 27,778 Inventory, at cost - - - - 92,800 - 92,800 Special assess. receivable - - 408,114 - - - 408,114 Interest receivable - - 76,333 - - - 76,333 Restricted assets: Cash - - - - - - - Loans due from other funds - - - - 443,342 - 443,342 Investments - 296,563 - - - 410,645 707,208 Interest receivable (net) - - - - - - - Total restricted assets - 296,563 - - 443,342 410,645 1,150,550
Total assets $ 2,220,668 $ 562,813 $ 815,057 $ 8 $ 1,123,719 $ 419,779 $ 5,142,044
82 LIABILITIES AND FUND BALANCE
LIABILITIES Due to other funds $ - $ - $ - $ - $ - $ 9,129 $ 9,129 Accounts payable 371,040 - - - - - 371,040 Deposits payable - - - - - - - Other payables 27,485 - - - - - 27,485 Deferred revenue - - 484,447 - - - 484,447 Total current liabilities 398,525 - 484,447 - - 9,129 892,101
LONG-TERM LIABILITIES: Compensated absences - - - - - - - Total long-term liabilities - - - - - - -
Total liabilities 398,525 - 484,447 - - 9,129 892,101
FUND BALANCE Reserved for restricted investments - 296,563 - - - 410,645 707,208 Reserved for encumbrances 210,544 - - - - - 210,544 Unreserved, Designated Designated for loans to other funds - - - - 443,342 - 443,342 Designated for inventory - - - - 92,800 - 92,800 Designated for debt service - - 330,610 - - - 330,610 Unreserved/undesignated 1,611,599 266,250 - 8 587,577 5 2,465,439
Total fund equity 1,822,143 562,813 330,610 8 1,123,719 410,650 4,249,943
Total liabilities and fund balances $ 2,220,668 $ 562,813 $ 815,057 $ 8 $ 1,123,719 $ 419,779 $ 5,142,044
June 30, 2007
Special Revenue
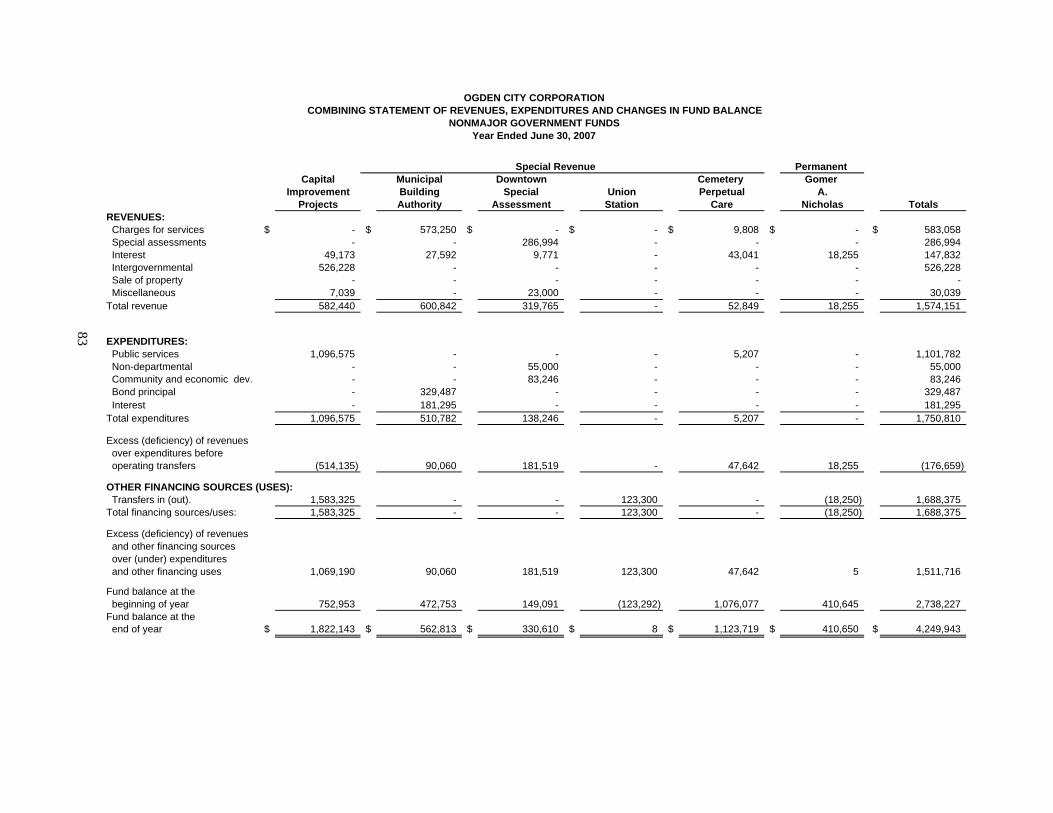
Permanent Capital Municipal Downtown Cemetery Gomer
Improvement Building Special Union Perpetual A.Projects Authority Assessment Station Care Nicholas Totals
REVENUES: Charges for services $ - $ 573,250 $ - $ - $ 9,808 $ - $ 583,058 Special assessments - - 286,994 - - - 286,994 Interest 49,173 27,592 9,771 - 43,041 18,255 147,832 Intergovernmental 526,228 - - - - - 526,228 Sale of property - - - - - - - Miscellaneous 7,039 - 23,000 - - - 30,039 Total revenue 582,440 600,842 319,765 - 52,849 18,255 1,574,151
83 EXPENDITURES: Public services 1,096,575 - - - 5,207 - 1,101,782 Non-departmental - - 55,000 - - - 55,000 Community and economic dev. - - 83,246 - - - 83,246 Bond principal - 329,487 - - - - 329,487 Interest - 181,295 - - - - 181,295 Total expenditures 1,096,575 510,782 138,246 - 5,207 - 1,750,810
Excess (deficiency) of revenues over expenditures before operating transfers (514,135) 90,060 181,519 - 47,642 18,255 (176,659)
OTHER FINANCING SOURCES (USES): Transfers in (out). 1,583,325 - - 123,300 - (18,250) 1,688,375 Total financing sources/uses: 1,583,325 - - 123,300 - (18,250) 1,688,375
Excess (deficiency) of revenues and other financing sources over (under) expenditures and other financing uses 1,069,190 90,060 181,519 123,300 47,642 5 1,511,716
Fund balance at the beginning of year 752,953 472,753 149,091 (123,292) 1,076,077 410,645 2,738,227 Fund balance at the end of year $ 1,822,143 $ 562,813 $ 330,610 $ 8 $ 1,123,719 $ 410,650 $ 4,249,943
Special Revenue
OGDEN CITY CORPORATIONCOMBINING STATEMENT OF REVENUES, EXPENDITURES AND CHANGES IN FUND BALANCE
NONMAJOR GOVERNMENT FUNDSYear Ended June 30, 2007

OGDEN CITY CORPORATIONBUDGETARY COMPARISON SCHEDULE
DEBT SERVICEYEAR ENDED JUNE 30, 2007
Budgeted Amounts Variance withOriginal Final Actual Final Budget
REVENUES: Taxes and special assessments 110,000 $ 110,000 $ 1,706 $ (108,294) Charges for services - - - - Miscellaneous - - - - Interest 20,000 20,000 10,776 (9,224) Sale of property - - - - Total revenues 130,000 130,000 12,482 (117,518)
EXPENDITURES: Current: Non-departmental - - - - Debt service: Principal 77,000 77,000 81,000 (4,000) Interest and fiscal charges 17,900 17,900 15,361 2,539 Capital outlay 35,100 35,100 - 35,100 Total expenditures 130,000 130,000 96,361 33,639 Excess (deficiency) of revenues over expenditures - - (83,879) (151,157)
OTHER FINANCING SOURCES (USES): Transfers in - - - - Transfers out - - - - Total other financing sources (uses) - - - - Excess (deficiency) of revenues/sources over (under) expenditures/uses - - (83,879) (151,157)
Fund balance at beginning of year 366,563 366,563 366,563 -
Fund balance at end of year 366,563$ $ 366,563 $ 282,684 $ (151,157)
84

OGDEN CITY CORPORATIONBUDGETARY COMPARISON SCHEDULE
CAPITAL IMPROVEMENT PROJECTSYear Ended June 30, 2007
Budgeted Amounts Variance withOriginal Final Actual Final Budget
REVENUES:Intergovernmental - $ 526,141 $ 526,228 $ 87 Miscellaneous 100 586,843 7,039 (579,804) Interest 25,100 25,100 49,173 24,073
Total revenues 25,200 1,138,084 582,440 (555,644)
EXPENDITURES: Current: Non-departmental 190,950 330,609 - 330,609 Public services 1,307,375 2,548,759 1,096,575 1,452,184 Debt service: Principal - - - - Interest and fiscal charges - - - - Capital outlay - - - - Total expenditures 1,498,325 2,879,368 1,096,575 1,782,793
Excess (deficiency) of revenues over expenditures (1,473,125) (1,741,284) (514,135) 1,227,149
OTHER FINANCING SOURCES (USES): Transfers in 1,473,125 1,575,075 1,583,325 8,250 Transfers out - - - - Total other financing sources (uses) 1,473,125 1,575,075 1,583,325 8,250 Excess (deficiency) of revenues/sources over (under) expenditures/uses - (166,209) 1,069,190 1,235,399
Fund balance at beginning of year 752,953 752,953 752,953 -
Fund balance at end of year 752,953 $ 586,744 $ 1,822,143 $ 1,235,399
85

OGDEN CITY CORPORATIONBUDGETARY COMPARISON SCHEDULE
MUNICIPAL BUILDING AUTHORITYYear Ended June 30, 2007
Budgeted Amounts Variance withOriginal Final Actual Final Budget
REVENUES: Charges for services $ 503,575 $ 503,575 $ 573,250 $ 69,675 Miscellaneous - - - - Interest 10,500 10,500 27,592 17,092
Total revenues 514,075 514,075 600,842 86,767
EXPENDITURES: Debt service: Principal 330,000 330,000 329,487 513 Interest and fiscal charges 184,075 184,075 181,295 2,780
Total expenditures 514,075 514,075 510,782 3,293 Excess (deficiency) of revenues over expenditures - - 90,060 90,060
Fund balance at beginning of year 472,753 472,753 472,753 -
Fund balance at end of year $ 472,753 $ 472,753 $ 562,813 $ 90,060
86

OGDEN CITY CORPORATIONBUDGETARY COMPARISON SCHEDULE
DOWNTOWN SPECIAL ASSESSMENTYear Ended June 30, 2007
Budgeted Amounts Variance withOriginal Final Actual Final Budget
REVENUES: Taxes and special assessments 136,500 $ 136,500 $ 286,994 $ 150,494 Miscellaneous 23,000 23,000 23,000 - Interest 500 500 9,771 9,271
Total revenues 160,000 160,000 319,765 159,765
EXPENDITURES: Current: Non-departmental 60,000 60,000 55,000 5,000 Community and Economic Development 100,000 100,000 83,246 16,754
Total expenditures 160,000 160,000 138,246 16,754 Excess (deficiency) of revenues over expenditures - - 181,519 176,519
Fund balance at beginning of year 149,091 149,091 149,091 -
Fund balance at end of year 149,091$ $ 149,091 $ 330,610 $ 181,519
87

OGDEN CITY CORPORATIONBUDGETARY COMPARISON SCHEDULE
UNION STATIONYear Ended June 30, 2007
Budgeted Amounts Variance withOriginal Final Actual Final Budget
REVENUES: Intergovernmental $ - $ - $ - $ - Charges for services - - - - Miscellaneous - - - - Total revenues - - - -
EXPENDITURES: Current: Public services - 123,300 - 123,300 Total expenditures - 123,300 - 123,300 Excess (deficiency) of revenues over expenditures - (123,300) - (123,300)
OTHER FINANCING SOURCES (USES): Transfers in - 123,300 123,300 - Transfers out - - - - Total other financing sources (uses) - 123,300 123,300 - Excess (deficiency) of revenues/sources over (under) expenditures/uses - - 123,300 (123,300)
Fund balance at beginning of year (123,292) (123,292) (123,292) -
Fund balance at end of year $ (123,292) $ (123,292) $ 8 $ (123,300)
88

OGDEN CITY CORPORATIONBUDGETARY COMPARISON SCHEDULE
CEMETERY PERPETUAL CAREYear Ended June 30, 2007
Budgeted Amounts Variance withOriginal Final Actual Final Budget
REVENUES: Charges for services $ 6,000 $ 6,000 $ 9,808 $ 3,808 Interest 45,000 45,000 43,041 (1,959) Total revenues 51,000 51,000 52,849 1,849
EXPENDITURES: Current: Public services 51,000 51,000 5,207 45,793 Total expenditures 51,000 51,000 5,207 45,793 Excess (deficiency) of revenues over expenditures - - 47,642 47,642
Fund balance at beginning of year 1,076,077 1,076,077 1,076,077 -
Fund balance at end of year $ 1,076,077 $ 1,076,077 $ 1,123,719 $ 47,642
89

OGDEN CITY CORPORATIONBUDGETARY COMPARISON SCHEDULE
Permanent Trust FundGOMER A. NICHOLAS
Year Ended June 30, 2007
Budgeted Amounts Variance withOriginal Final Actual Final Budget
REVENUES: Interest $ 10,000 $ 10,000 $ 18,255 $ 8,255 Total revenues 10,000 10,000 18,255 8,255
EXPENDITURES: Current: Management services - - - - Total expenditures - - - - Excess (deficiency) of revenues over expenditures 10,000 10,000 18,255 8,255
OTHER FINANCING SOURCES (USES): Transfers in - - - - Transfers out (10,000) (10,000) (18,250) (8,250) Total other financing sources (uses) (10,000) (10,000) (18,250) (8,250) Excess (deficiency) of revenues/sources over (under) expenditures/uses - - 5 5
Fund balance at beginning of year 410,645 410,645 410,645 -
Fund balance at end of year $ 410,645 $ 410,645 $ 410,650 $ 5
90

91
Nonmajor Enterprise Funds Airport Fund To account for administration, operation and maintenance of the Ogden Hinckley Airport. Golf Courses Fund To account for the provision of two recreational golf facilities to Ogden City residents and residents of the surrounding area. Recreation Fund To account for adult and youth recreational programs administered by Ogden City. Medical Services Fund To account for ambulance and paramedic services provided by the City.
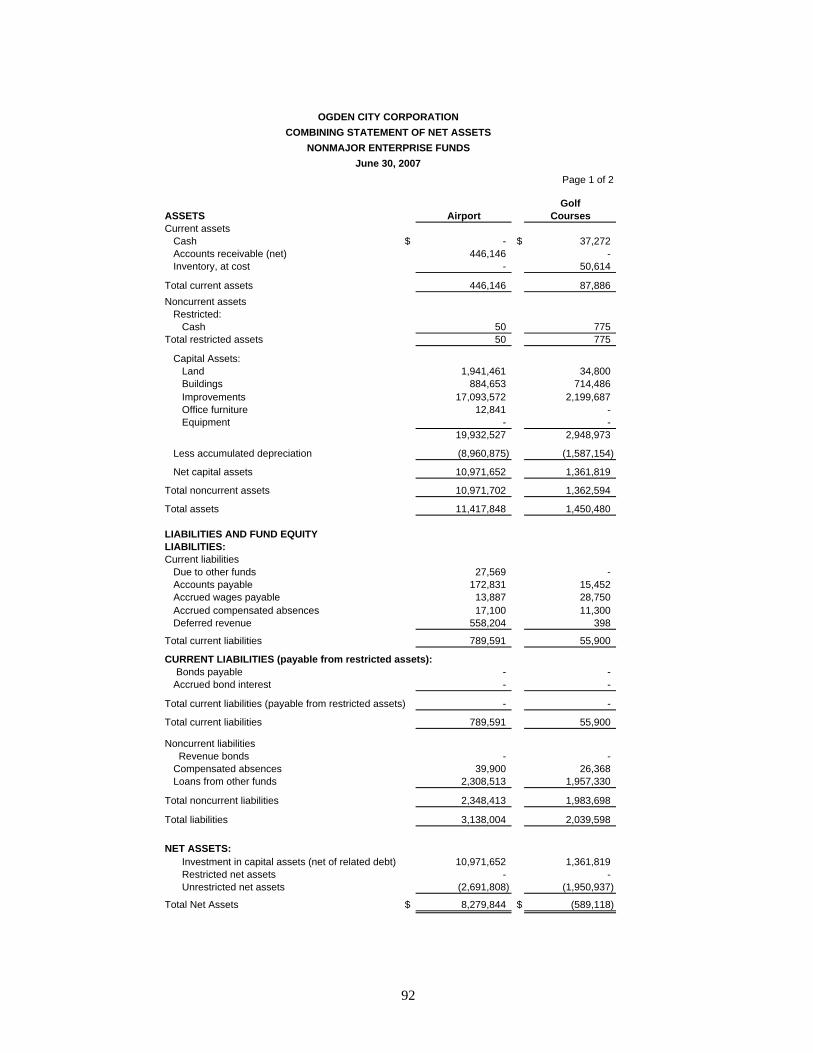
Page 1 of 2
GolfASSETS Airport CoursesCurrent assets
Cash $ - $ 37,272 Accounts receivable (net) 446,146 - Inventory, at cost - 50,614
Total current assets 446,146 87,886 Noncurrent assets
Restricted:Cash 50 775
Total restricted assets 50 775
Capital Assets:Land 1,941,461 34,800 Buildings 884,653 714,486 Improvements 17,093,572 2,199,687 Office furniture 12,841 - Equipment - -
19,932,527 2,948,973
Less accumulated depreciation (8,960,875) (1,587,154)
Net capital assets 10,971,652 1,361,819
Total noncurrent assets 10,971,702 1,362,594
Total assets 11,417,848 1,450,480
LIABILITIES AND FUND EQUITYLIABILITIES:Current liabilities
Due to other funds 27,569 - Accounts payable 172,831 15,452 Accrued wages payable 13,887 28,750 Accrued compensated absences 17,100 11,300 Deferred revenue 558,204 398
Total current liabilities 789,591 55,900
CURRENT LIABILITIES (payable from restricted assets): Bonds payable - - Accrued bond interest - -
Total current liabilities (payable from restricted assets) - -
Total current liabilities 789,591 55,900
Noncurrent liabilities Revenue bonds - -
Compensated absences 39,900 26,368 Loans from other funds 2,308,513 1,957,330
Total noncurrent liabilities 2,348,413 1,983,698
Total liabilities 3,138,004 2,039,598
NET ASSETS:Investment in capital assets (net of related debt) 10,971,652 1,361,819 Restricted net assets - - Unrestricted net assets (2,691,808) (1,950,937)
Total Net Assets $ 8,279,844 $ (589,118)
OGDEN CITY CORPORATIONCOMBINING STATEMENT OF NET ASSETS
NONMAJOR ENTERPRISE FUNDSJune 30, 2007
92

Page 2 of 2
Medical Recreation Services Total
$ 179,533 $ - $ 216,805 - 2,408,375 2,854,521 - - 50,614
179,533 2,408,375 3,121,940
170 - 995 170 - 995
- - 1,976,261 - - 1,599,139
231,626 - 19,524,885 - 13,364 26,205
8,090 - 8,090 239,716 13,364 23,134,580
(233,653) (13,364) (10,795,046)
6,063 - 12,339,534
6,233 - 12,340,529
185,766 2,408,375 15,462,469
- 272,317 299,886 62 22,876 211,221
2,292 117,598 162,527 - 106,589 134,989 - - 558,602
2,354 519,380 1,367,225
- - - - - -
- - -
2,354 519,380 1,367,225
- - - - 248,707 314,975 - - 4,265,843
- 248,707 4,580,818
2,354 768,087 5,948,043
6,063 - 12,339,534 - - -
177,349 1,640,288 (2,825,108)
$ 183,412 $ 1,640,288 $ 9,514,426
93
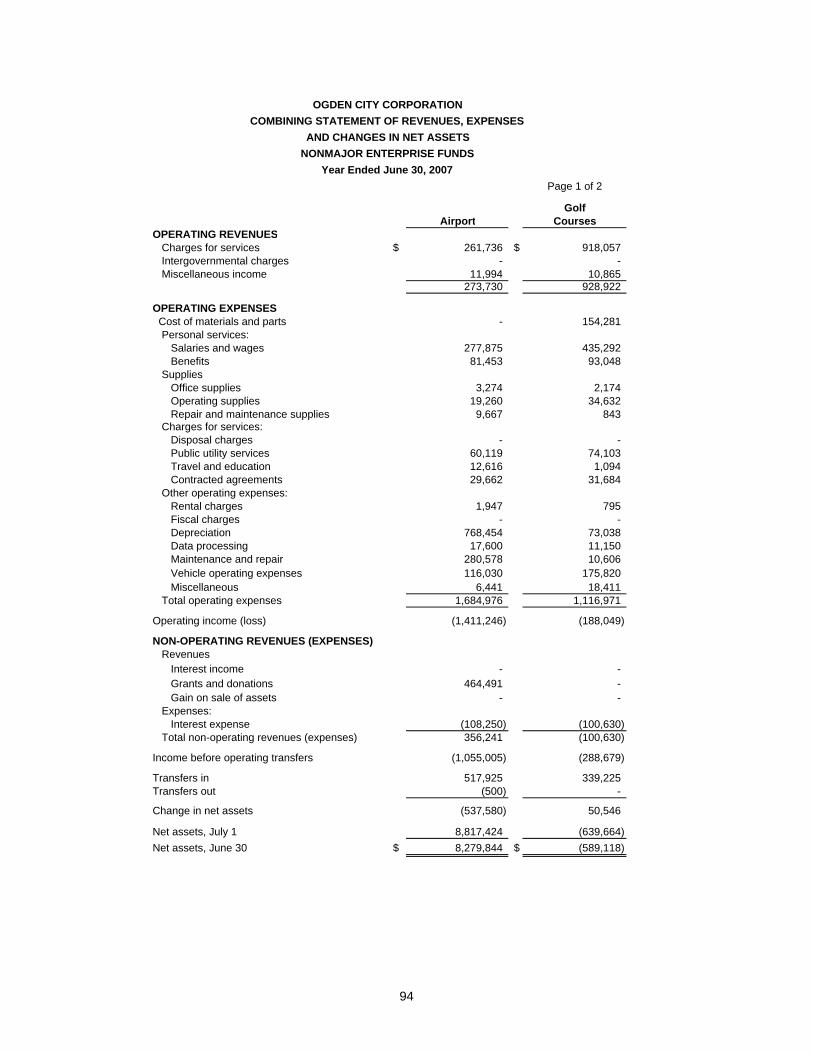
COMBINING STATEMENT OF REVENUES, EXPENSESAND CHANGES IN NET ASSETS
Page 1 of 2
GolfAirport Courses
OPERATING REVENUESCharges for services $ 261,736 $ 918,057 Intergovernmental charges - - Miscellaneous income 11,994 10,865
273,730 928,922
OPERATING EXPENSES Cost of materials and parts - 154,281
Personal services:Salaries and wages 277,875 435,292 Benefits 81,453 93,048
SuppliesOffice supplies 3,274 2,174 Operating supplies 19,260 34,632 Repair and maintenance supplies 9,667 843
Charges for services:Disposal charges - - Public utility services 60,119 74,103 Travel and education 12,616 1,094 Contracted agreements 29,662 31,684
Other operating expenses:Rental charges 1,947 795 Fiscal charges - - Depreciation 768,454 73,038 Data processing 17,600 11,150 Maintenance and repair 280,578 10,606 Vehicle operating expenses 116,030 175,820 Miscellaneous 6,441 18,411
Total operating expenses 1,684,976 1,116,971
Operating income (loss) (1,411,246) (188,049)
NON-OPERATING REVENUES (EXPENSES)Revenues
Interest income - - Grants and donations 464,491 - Gain on sale of assets - -
Expenses:Interest expense (108,250) (100,630)
Total non-operating revenues (expenses) 356,241 (100,630)
Income before operating transfers (1,055,005) (288,679)
Transfers in 517,925 339,225 Transfers out (500) -
Change in net assets (537,580) 50,546
Net assets, July 1 8,817,424 (639,664) Net assets, June 30 $ 8,279,844 $ (589,118)
OGDEN CITY CORPORATION
NONMAJOR ENTERPRISE FUNDSYear Ended June 30, 2007
94
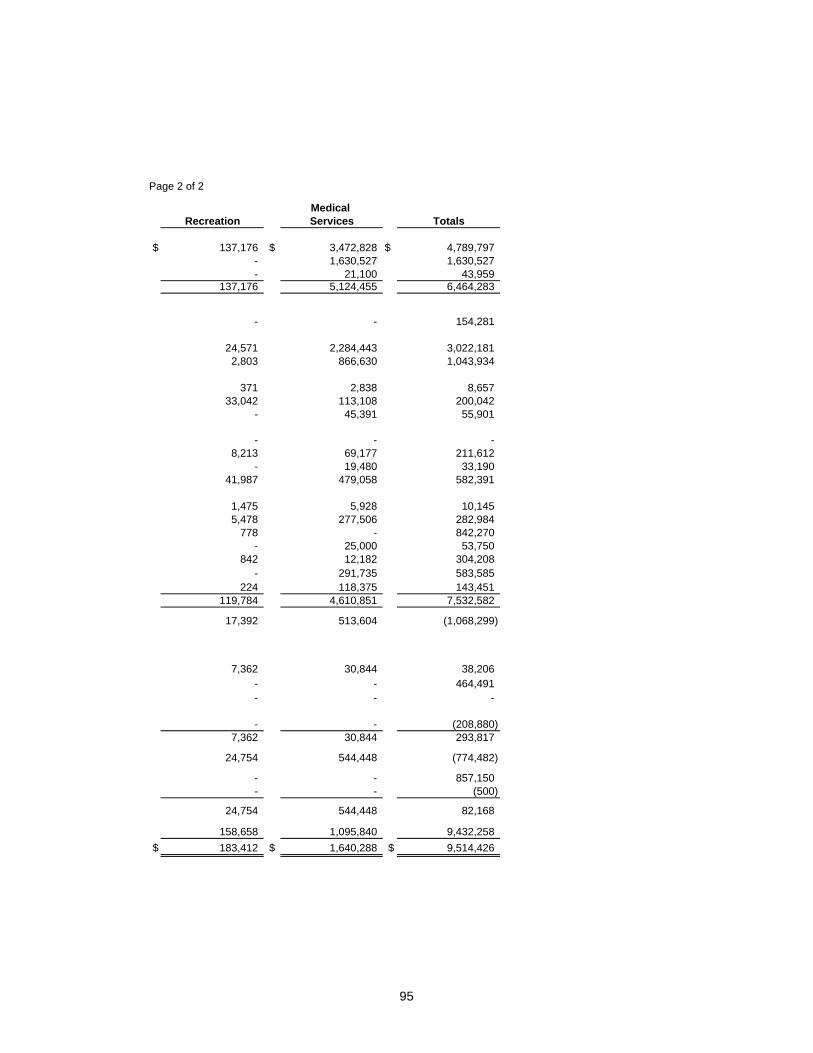
Page 2 of 2
Medical Recreation Services Totals
$ 137,176 $ 3,472,828 $ 4,789,797 - 1,630,527 1,630,527 - 21,100 43,959
137,176 5,124,455 6,464,283
- - 154,281
24,571 2,284,443 3,022,181 2,803 866,630 1,043,934
371 2,838 8,657 33,042 113,108 200,042
- 45,391 55,901
- - - 8,213 69,177 211,612
- 19,480 33,190 41,987 479,058 582,391
1,475 5,928 10,145 5,478 277,506 282,984
778 - 842,270 - 25,000 53,750
842 12,182 304,208 - 291,735 583,585
224 118,375 143,451 119,784 4,610,851 7,532,582
17,392 513,604 (1,068,299)
7,362 30,844 38,206 - - 464,491 - - -
- - (208,880) 7,362 30,844 293,817
24,754 544,448 (774,482)
- - 857,150 - - (500)
24,754 544,448 82,168
158,658 1,095,840 9,432,258 $ 183,412 $ 1,640,288 $ 9,514,426
95

Page 1 of 2
Airport GolfCASH FLOWS FROM OPERATING ACTIVITIES:
Cash received from customers $ 179,916 $ 928,922 Cash received (paid) from (to) other funds (2,531,935) (1,272,034)
Cash payments to suppliers for goods and services (175,012) (514,608) Cash payments to employees for services (358,629) (526,150)
Net cash provided by operating activities (2,885,660) (1,383,870)
CASH FLOWS FROM NONCAPITAL FINANCING ACTIVITIES:Grants/donations 464,491 - Change in long-term compensated absences 1,024 5,156 Transfers in 517,425 339,225 Transfers (out) - -
Net cash provided by noncapital financing activities 982,940 344,381
CASH FLOWS FROM CAPTIAL AND RELATED FINANCING ACTIVITIES:Acquisition of capital assets (297,543) - Capital grants - - Interest paid on revenue bonds - - Change in loans from other funds 2,308,513 1,177,391 Proceeds form sale of assets - -
Net cash provided by capital and related financing activities 2,010,970 1,177,391
CASH FLOWS FROM INVESTING ACTIVITIES:Interest on investments - - Interest expense on deficit balances (108,250) (100,630)
Net cash for investing activities (108,250) (100,630)
Net increase (decrease) in cash equivalents - 37,272 Cash/equivalents at beginning of year 50 775
Cash/equivalents at end of year 50 38,047
Cash/equivalents, end of year (unrest.) - 37,272 Cash/equivalents, end of year (restricted) 50 775
Total cash/equivalents, end of year $ 50 $ 38,047
RECONCILIATION OF OPERATING INCOME TO NET CASH PROVIDED BY OPERATING ACTIVITIES:
Operating income (loss) $ (1,411,246) $ (188,049) Reconciliation adjustments: Depreciation 768,454 73,038 Miscellaneous non-operating revenues (expenses) - - Changes in assets and liabilities: Change in accounts receivable (330,745) - Change in inventory - 5,541 Change in due from other funds - - Change in due to other funds (2,067,444) (1,272,034) Change in accounts payable 168,222 (4,274) Change in deposits payable - - Change in unearned revenue (13,600) (282) Change in wages payable and compensated absences 699 2,190
Total adjustments (1,474,414) (1,195,821)
Net cash provided by operating activities $ (2,885,660) $ (1,383,870)
OGDEN CITY CORPORATIONCOMBINING STATEMENT OF CASH FLOWS
NONMAJOR ENTERPRISE FUNDSYear Ended June 30, 2007
96

Page 2 of 2Medical
Recreation Services Total
$ 137,176 $ 4,625,135 $ 5,871,149 - (220,910) (4,024,879)
(92,834) (1,445,338) (2,227,792) (27,651) (3,110,351) (4,022,781)
16,691 (151,464) (4,404,303)
- - 464,491 - 65,370 71,550 - - 856,650 - - -
- 65,370 1,392,691
- - (297,543) - - - - - -
3,485,904 - - -
- - 3,188,361
7,362 30,844 38,206 - - (208,880)
7,362 30,844 (170,674)
24,053 (55,250) 6,075 155,650 55,250 211,725
179,703 - 217,800
179,533 - 216,805 170 - 995
$ 179,703 $ - $ 217,800
$ 17,392 $ 513,604 $ (1,068,299)
778 - 842,270 - - -
- (499,320) (830,065) - - 5,541 - - - - (220,910) (3,560,388)
(1,202) 14,440 177,186 - - - - - (13,882)
(277) 40,722 43,334
(701) (665,068) (3,336,004)
$ 16,691 $ (151,464) $ (4,404,303)
97
98
Internal Service Funds Fleet & Facilities Fund To account for the costs of operating a maintenance facility for automotive, mechanical, and electrical equipment used by other departments. Such costs are billed to the other departments at actual cost, which includes depreciation on the garage building and improvements and the machinery and equipment used to provide the service. This fund also accounts for the City's physical facilities maintenance activities. Management Information Systems Fund Provides services to other departments using a Hewlett Packard 9000 K series computer and accounts for the costs of these services. Costs are charged to the departments on an estimated usage basis. Risk Management Fund Accounts for the risk management activities of the City which include monitoring and administering liability and workman's compensation claims against the City, determining the City's insurance needs and implementing safety programs. Costs are charged to departments on percentage basis according to type of employees and total payroll.
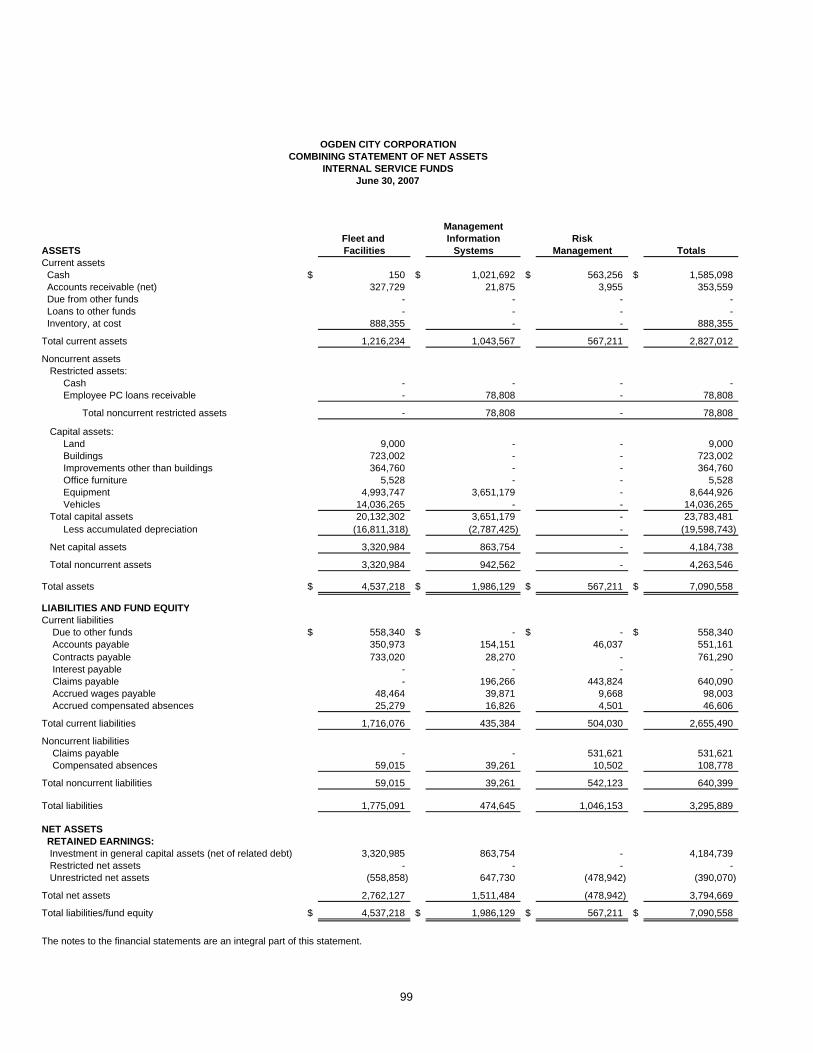
ManagementFleet and Information Risk
ASSETS Facilities Systems Management TotalsCurrent assets Cash $ 150 $ 1,021,692 $ 563,256 $ 1,585,098 Accounts receivable (net) 327,729 21,875 3,955 353,559 Due from other funds - - - - Loans to other funds - - - - Inventory, at cost 888,355 - - 888,355
Total current assets 1,216,234 1,043,567 567,211 2,827,012
Noncurrent assetsRestricted assets:
Cash - - - - Employee PC loans receivable - 78,808 - 78,808
Total noncurrent restricted assets - 78,808 - 78,808
Capital assets: Land 9,000 - - 9,000 Buildings 723,002 - - 723,002 Improvements other than buildings 364,760 - - 364,760 Office furniture 5,528 - - 5,528 Equipment 4,993,747 3,651,179 - 8,644,926 Vehicles 14,036,265 - - 14,036,265
Total capital assets 20,132,302 3,651,179 - 23,783,481 Less accumulated depreciation (16,811,318) (2,787,425) - (19,598,743)
Net capital assets 3,320,984 863,754 - 4,184,738
Total noncurrent assets 3,320,984 942,562 - 4,263,546
Total assets $ 4,537,218 $ 1,986,129 $ 567,211 $ 7,090,558
LIABILITIES AND FUND EQUITYCurrent liabilities Due to other funds $ 558,340 $ - $ - $ 558,340 Accounts payable 350,973 154,151 46,037 551,161 Contracts payable 733,020 28,270 - 761,290 Interest payable - - - - Claims payable - 196,266 443,824 640,090 Accrued wages payable 48,464 39,871 9,668 98,003 Accrued compensated absences 25,279 16,826 4,501 46,606
Total current liabilities 1,716,076 435,384 504,030 2,655,490
Noncurrent liabilities Claims payable - - 531,621 531,621 Compensated absences 59,015 39,261 10,502 108,778
Total noncurrent liabilities 59,015 39,261 542,123 640,399
Total liabilities 1,775,091 474,645 1,046,153 3,295,889
NET ASSETS RETAINED EARNINGS:
Investment in general capital assets (net of related debt) 3,320,985 863,754 - 4,184,739 Restricted net assets - - - - Unrestricted net assets (558,858) 647,730 (478,942) (390,070)
Total net assets 2,762,127 1,511,484 (478,942) 3,794,669
Total liabilities/fund equity $ 4,537,218 $ 1,986,129 $ 567,211 $ 7,090,558
The notes to the financial statements are an integral part of this statement.
OGDEN CITY CORPORATIONCOMBINING STATEMENT OF NET ASSETS
INTERNAL SERVICE FUNDSJune 30, 2007
99

ManagementFleet and Information RiskFacilities Systems Management Totals
OPERATING REVENUES: Charges to departments $ 7,146,236 $ 3,434,909 $ 1,258,017 $ 11,839,162
OPERATING EXPENSES: Cost of materials and parts 2,516,872 - - 2,516,872 Personal services: Salaries and wages 906,442 712,912 146,546 1,765,900 Benefits 324,748 265,464 34,594 624,806 Supplies: Office supplies 51,095 8,313 4,163 63,571 Operating supplies 56,432 3,476 - 59,908 Repair and maint. Supplies 5,231 - - 5,231 Charges for services: Public utility services 719,142 543,200 7,466 1,269,808 Travel and education 4,293 18,479 1,797 24,569 Contracted agreements 1,426,284 1,199,363 183,105 2,808,752 Other operating expenses: Computer equipment - 386,212 - 386,212 Depreciation 1,378,446 354,029 - 1,732,475 Data processing 115,752 8,558 33,525 157,835 Maintenance and repair 39,426 11,774 83 51,283 Vehicle operating expenses 120,070 - - 120,070 Claims payments - - 1,146,494 1,146,494 Rental expense 2,972 - 139 3,111 Miscellaneous 6,222 1,562 1,695 9,479 Total operating expenses 7,673,427 3,513,342 1,559,607 12,746,376 Operating income (loss) (527,191) (78,433) (301,590) (907,214)
NON-OPERATING REVENUES (EXPENSES): Revenues: Interest income 10,576 82,776 7,390 100,742 Gain on sale of assets 168,779 - - 168,779 Miscellaneous income 80,114 521,733 301,207 903,054 Expenses: Interest expense (49,641) - - (49,641) Total non-operating revenue (expense) 209,828 604,509 308,597 1,122,934
Income before operating transfers (317,363) 526,076 7,007 215,720
Transfers out (500,367) (1,300,000) - (1,800,367) Transfers in 1,800,367 - - 1,800,367
Change in net assets 982,637 (773,924) 7,007 215,720 Net Assets, July 1 (restated) 1,779,490 2,285,408 (485,949) 3,578,949
Net Assets, June 30 $ 2,762,127 $ 1,511,484 $ (478,942) $ 3,794,669
The notes to the financial statements are an integral part of this statement.
OGDEN CITY CORPORATIONCOMBINING STATEMENT OF REVENUES, EXPENSES AND CHANGES IN NET ASSETS
INTERNAL SERVICE FUNDSYear Ended June 30, 2007
100
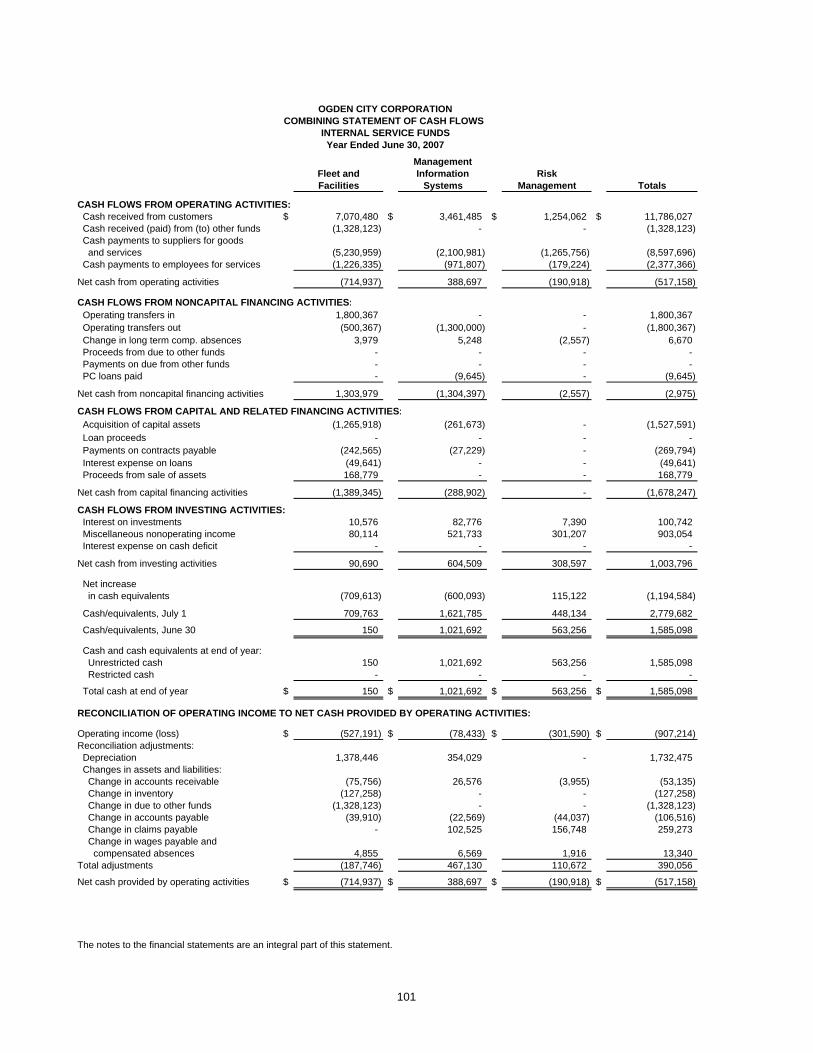
ManagementFleet and Information RiskFacilities Systems Management Totals
CASH FLOWS FROM OPERATING ACTIVITIES: Cash received from customers $ 7,070,480 $ 3,461,485 $ 1,254,062 $ 11,786,027 Cash received (paid) from (to) other funds (1,328,123) - - (1,328,123) Cash payments to suppliers for goods and services (5,230,959) (2,100,981) (1,265,756) (8,597,696) Cash payments to employees for services (1,226,335) (971,807) (179,224) (2,377,366)
Net cash from operating activities (714,937) 388,697 (190,918) (517,158)
CASH FLOWS FROM NONCAPITAL FINANCING ACTIVITIES: Operating transfers in 1,800,367 - - 1,800,367 Operating transfers out (500,367) (1,300,000) - (1,800,367) Change in long term comp. absences 3,979 5,248 (2,557) 6,670 Proceeds from due to other funds - - - - Payments on due from other funds - - - - PC loans paid - (9,645) - (9,645)
Net cash from noncapital financing activities 1,303,979 (1,304,397) (2,557) (2,975)
CASH FLOWS FROM CAPITAL AND RELATED FINANCING ACTIVITIES: Acquisition of capital assets (1,265,918) (261,673) - (1,527,591) Loan proceeds - - - - Payments on contracts payable (242,565) (27,229) - (269,794) Interest expense on loans (49,641) - - (49,641) Proceeds from sale of assets 168,779 - - 168,779
Net cash from capital financing activities (1,389,345) (288,902) - (1,678,247)
CASH FLOWS FROM INVESTING ACTIVITIES: Interest on investments 10,576 82,776 7,390 100,742 Miscellaneous nonoperating income 80,114 521,733 301,207 903,054 Interest expense on cash deficit - - - -
Net cash from investing activities 90,690 604,509 308,597 1,003,796
Net increase in cash equivalents (709,613) (600,093) 115,122 (1,194,584)
Cash/equivalents, July 1 709,763 1,621,785 448,134 2,779,682
Cash/equivalents, June 30 150 1,021,692 563,256 1,585,098
Cash and cash equivalents at end of year: Unrestricted cash 150 1,021,692 563,256 1,585,098 Restricted cash - - - -
Total cash at end of year $ 150 $ 1,021,692 $ 563,256 $ 1,585,098
RECONCILIATION OF OPERATING INCOME TO NET CASH PROVIDED BY OPERATING ACTIVITIES:
Operating income (loss) $ (527,191) $ (78,433) $ (301,590) $ (907,214) Reconciliation adjustments: Depreciation 1,378,446 354,029 - 1,732,475 Changes in assets and liabilities: Change in accounts receivable (75,756) 26,576 (3,955) (53,135) Change in inventory (127,258) - - (127,258) Change in due to other funds (1,328,123) - - (1,328,123) Change in accounts payable (39,910) (22,569) (44,037) (106,516) Change in claims payable - 102,525 156,748 259,273 Change in wages payable and compensated absences 4,855 6,569 1,916 13,340 Total adjustments (187,746) 467,130 110,672 390,056
Net cash provided by operating activities $ (714,937) $ 388,697 $ (190,918) $ (517,158)
The notes to the financial statements are an integral part of this statement.
OGDEN CITY CORPORATIONCOMBINING STATEMENT OF CASH FLOWS
INTERNAL SERVICE FUNDSYear Ended June 30, 2007
101
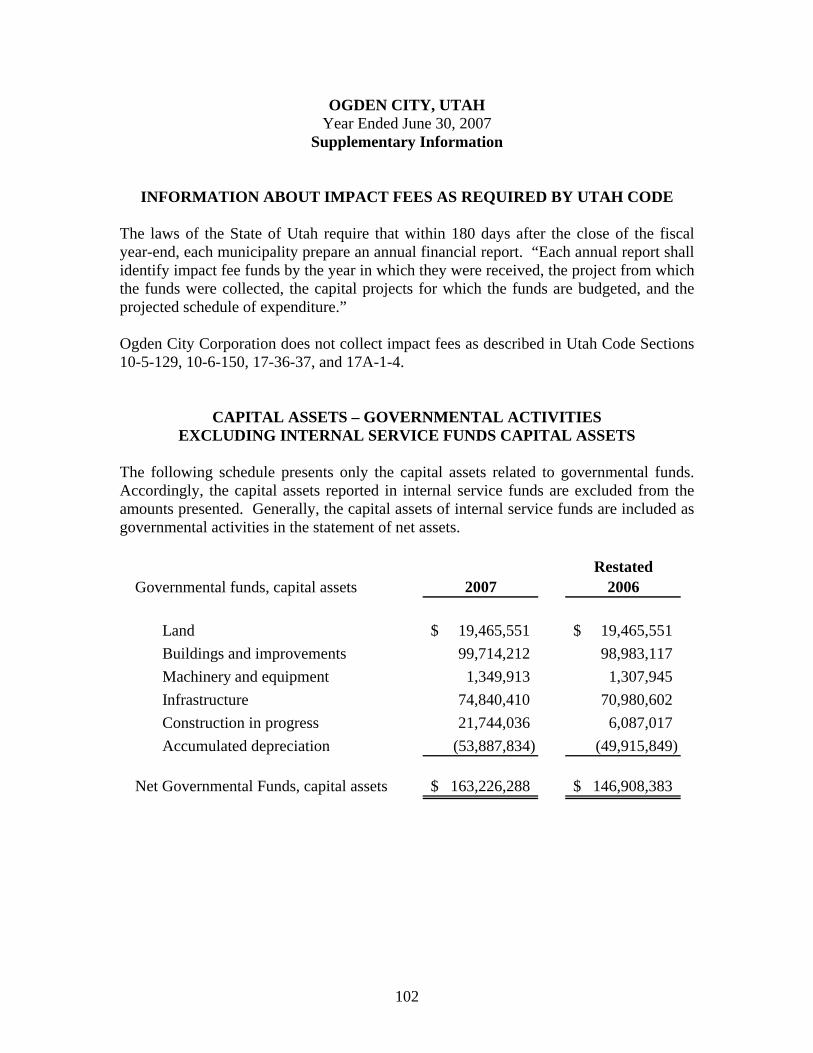
102
OGDEN CITY, UTAH Year Ended June 30, 2007
Supplementary Information
INFORMATION ABOUT IMPACT FEES AS REQUIRED BY UTAH CODE The laws of the State of Utah require that within 180 days after the close of the fiscal year-end, each municipality prepare an annual financial report. “Each annual report shall identify impact fee funds by the year in which they were received, the project from which the funds were collected, the capital projects for which the funds are budgeted, and the projected schedule of expenditure.” Ogden City Corporation does not collect impact fees as described in Utah Code Sections 10-5-129, 10-6-150, 17-36-37, and 17A-1-4.
CAPITAL ASSETS – GOVERNMENTAL ACTIVITIES EXCLUDING INTERNAL SERVICE FUNDS CAPITAL ASSETS
The following schedule presents only the capital assets related to governmental funds. Accordingly, the capital assets reported in internal service funds are excluded from the amounts presented. Generally, the capital assets of internal service funds are included as governmental activities in the statement of net assets.
RestatedGovernmental funds, capital assets 2007 2006
Land 19,465,551$ 19,465,551$ Buildings and improvements 99,714,212 98,983,117 Machinery and equipment 1,349,913 1,307,945 Infrastructure 74,840,410 70,980,602 Construction in progress 21,744,036 6,087,017 Accumulated depreciation (53,887,834) (49,915,849)
Net Governmental Funds, capital assets 163,226,288$ 146,908,383$

Statistical Section


Statistical Section(Unaudited)
This part of the Ogden City's comprehensive annual financial report presents detailed informationas a context for understanding what the information in the financial statements, note disclosuresand required supplementary information says about the City's overall financial health.
Contents
Financial TrendsThese schedules contain trend information to help the reader understand how the City'sfinancial performance and well-being have changed over time.
Revenue CapacityThese schedules contain information to help the reader assess the City's mostsignificant local revenue source, the property tax.
Debt CapacityThese schedules present information to help the reader assess the affordability of theCity's current levels of outstanding debt and the City's ability to issue additional debtin the future.
Demographic and Economic InformationThese schedules offer demographic and economic indicators to help the readerunderstand the environment within which the City's financial activities take place.
Operating InformationThese schedules contain service and infrastructure data to help the reader understandhow the information in the City's financial report relates to the services the City providesand the activities it performs.
Sources: Unless otherwise noted, the information in these schedules is derived from thecomprehensive annual financial reports for the relevant year. The City implementedGASB Statement 34 in 2003; schedules presenting government-wide informationinclude information beginning in that year.
103

FINANCIAL TRENDS(Unaudited)
104

Ogden CityNet Assets by Component
Last Five Fiscal Years(accrual basis of accounting)
(UNAUDITED)
Fiscal Fiscal Fiscal Fiscal FiscalYear Year Year Year Year2007 2006 2005 2004 2003 ¹
Governmental activitiesInvested in capital assets, net of related debt $ 84,313,339 $ 87,589,530 $ 88,862,111 $ 90,026,228 $ 90,469,850Restricted 23,109,238 11,702,871 11,419,430 11,917,845 14,956,114Unrestricted 3,829,377 3,290,456 (12,816,700) (14,377,522) 1,225,344
Total governmental activities net assets $ 111,251,954 $ 102,582,857 $ 87,464,841 $ 87,566,551 $ 106,651,308
Business-type activitiesInvested in capital assets, net of related debt $ 166,219,757 $ 159,802,111 $ 172,829,482 $ 173,651,238 $ 137,083,566Restricted 992,091 956,676 1,971,539 2,045,380 1,986,251Unrestricted 8,898,266 15,735,682 9,881,273 10,687,031 34,547,615
Total business-type activities net assets $ 176,110,114 $ 176,494,469 $ 184,682,294 $ 186,383,649 $ 173,617,432
Primary governmentInvested in capital assets, net of related debt $ 250,533,096 $ 247,391,641 $ 261,691,593 $ 263,677,466 $ 227,553,416Restricted 24,101,329 12,659,547 13,390,969 13,963,225 16,942,365Unrestricted 12,727,643 19,026,138 (2,935,427) (3,690,491) 35,772,959
Total primary government net assets $ 287,362,068 $ 279,077,326 $ 272,147,135 $ 273,950,200 $ 280,268,740
Source: Ogden City Comptroller Division
1 GASB 34 and 44 conversion. Ten years of comparative data is not yetavailable.
Further discussion of this data is available in the Management Discussion and Analysis, the transmittal letter, and the notes found in the financial section.
Net Assets by Component
0
50,000,000
100,000,000
150,000,000
200,000,000
250,000,000
300,000,000
2007 2006 2005 2004 2003
Year
Valu
e by
Dol
lars
Gov. ActivitiesBus. ActivitiesPrimary Gov.
105
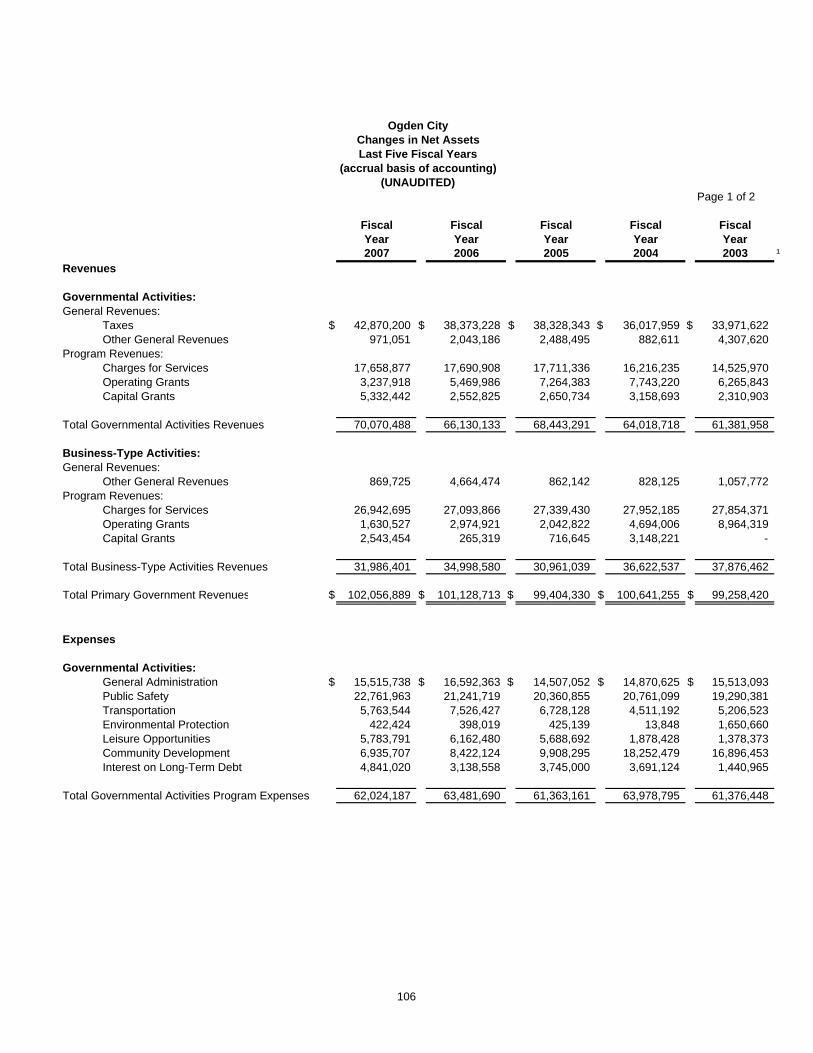
Ogden CityChanges in Net AssetsLast Five Fiscal Years
(accrual basis of accounting)(UNAUDITED)
Page 1 of 2
Fiscal Fiscal Fiscal Fiscal FiscalYear Year Year Year Year2007 2006 2005 2004 2003 ¹
Revenues
Governmental Activities:General Revenues:
Taxes $ 42,870,200 $ 38,373,228 $ 38,328,343 $ 36,017,959 $ 33,971,622Other General Revenues 971,051 2,043,186 2,488,495 882,611 4,307,620
Program Revenues:Charges for Services 17,658,877 17,690,908 17,711,336 16,216,235 14,525,970Operating Grants 3,237,918 5,469,986 7,264,383 7,743,220 6,265,843Capital Grants 5,332,442 2,552,825 2,650,734 3,158,693 2,310,903
Total Governmental Activities Revenues 70,070,488 66,130,133 68,443,291 64,018,718 61,381,958
Business-Type Activities:General Revenues:
Other General Revenues 869,725 4,664,474 862,142 828,125 1,057,772Program Revenues:
Charges for Services 26,942,695 27,093,866 27,339,430 27,952,185 27,854,371Operating Grants 1,630,527 2,974,921 2,042,822 4,694,006 8,964,319Capital Grants 2,543,454 265,319 716,645 3,148,221 -
Total Business-Type Activities Revenues 31,986,401 34,998,580 30,961,039 36,622,537 37,876,462
Total Primary Government Revenues $ 102,056,889 $ 101,128,713 $ 99,404,330 $ 100,641,255 $ 99,258,420
Expenses
Governmental Activities:General Administration $ 15,515,738 $ 16,592,363 $ 14,507,052 $ 14,870,625 $ 15,513,093Public Safety 22,761,963 21,241,719 20,360,855 20,761,099 19,290,381Transportation 5,763,544 7,526,427 6,728,128 4,511,192 5,206,523Environmental Protection 422,424 398,019 425,139 13,848 1,650,660Leisure Opportunities 5,783,791 6,162,480 5,688,692 1,878,428 1,378,373Community Development 6,935,707 8,422,124 9,908,295 18,252,479 16,896,453Interest on Long-Term Debt 4,841,020 3,138,558 3,745,000 3,691,124 1,440,965
Total Governmental Activities Program Expenses 62,024,187 63,481,690 61,363,161 63,978,795 61,376,448
106

Page 2 of 2Fiscal Fiscal Fiscal Fiscal FiscalYear Year Year Year Year2007 2006 2005 2004 2003 ¹
Business-Type Activities:Medical Services $ 4,610,850 $ 3,946,947 $ 3,528,822 $ 3,165,958 $ 3,183,742Airport 1,793,226 1,499,326 1,408,112 1,603,342 1,176,054Utilities 15,293,929 18,937,363 18,871,487 17,474,990 15,662,746Recreation 4,148,941 1,347,419 1,585,168 1,498,993 1,507,983Property Management 1,337,385 4,721,336 7,966,783 9,156,306 6,279,954
4,563,629Total Business-Type Activities Program Expenses 31,747,960 30,452,391 33,360,372 32,899,589 27,810,479
Total Primary Government Program Expenses $ 93,772,147 $ 93,934,081 $ 94,723,533 $ 96,878,384 $ 89,186,927
Change in Net Assets Before Transfers:Net (Expense)/RevenueGovernmental activities $ 8,046,301 $ 2,648,443 $ 7,080,130 $ 39,923 $ 5,510Business-type activities 238,441 4,546,189 (2,399,333) 3,722,948 10,065,983
Total primary government net (expense)/revenue $ 8,284,742 $ 7,194,632 $ 4,680,797 $ 3,762,871 $ 10,071,493
General Revenues and Other Changes in Net AssetsGovernmental Activities:
Transfers $ 622,796 $ 12,734,014 $ (2,960,213) $ (7,817,707) $ (4,545,300)
Total Governmental Activities 622,796 12,734,014 (2,960,213) (7,817,707) (4,545,300)
Business-Type Activities:Transfers (622,796) (12,734,014) 2,960,213 7,817,707 4,545,300
Total Business-Type Activities (622,796) (12,734,014) 2,960,213 7,817,707 4,545,300
Total Primary Government $ - $ - $ - $ - $ -
Change in Net AssetsGovernmental Activities $ 8,669,097 $ 15,382,457 $ 4,119,917 $ (7,777,784) $ (4,539,790)Business-Type Activities (384,355) (8,187,825) 560,880 11,540,655 14,611,283
Total primary government $ 8,284,742 $ 7,194,632 $ 4,680,797 $ 3,762,871 $ 10,071,493
Source: Ogden City Comptroller Division
1 GASB 34 and 44 conversion. Ten years of comparative data is not yet available.
Further discussion of this data is availible in the Management Discussion & Analysis, the Transmittal Letter, and the notes foundin the Financial Section.
107
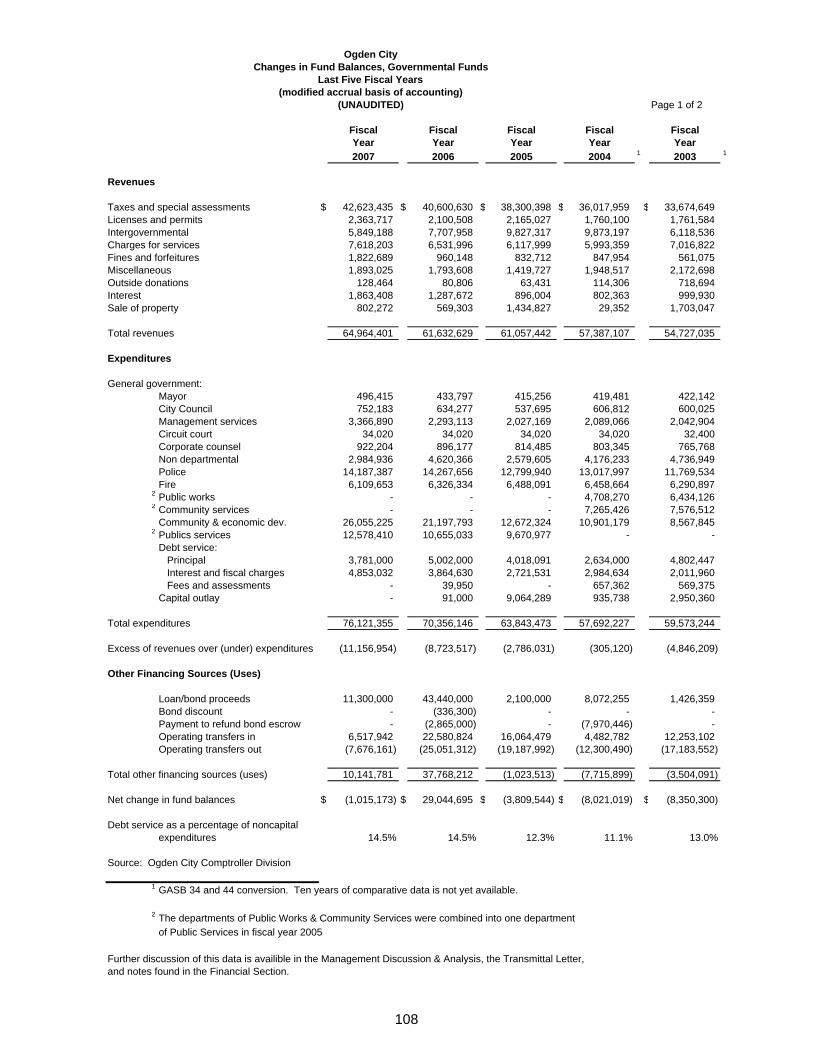
Ogden CityChanges in Fund Balances, Governmental Funds
Last Five Fiscal Years(modified accrual basis of accounting)
(UNAUDITED) Page 1 of 2
Fiscal Fiscal Fiscal Fiscal FiscalYear Year Year Year Year2007 2006 2005 2004 1 2003 1
Revenues
Taxes and special assessments $ 42,623,435 $ 40,600,630 $ 38,300,398 $ 36,017,959 $ 33,674,649Licenses and permits 2,363,717 2,100,508 2,165,027 1,760,100 1,761,584 Intergovernmental 5,849,188 7,707,958 9,827,317 9,873,197 6,118,536 Charges for services 7,618,203 6,531,996 6,117,999 5,993,359 7,016,822 Fines and forfeitures 1,822,689 960,148 832,712 847,954 561,075 Miscellaneous 1,893,025 1,793,608 1,419,727 1,948,517 2,172,698 Outside donations 128,464 80,806 63,431 114,306 718,694 Interest 1,863,408 1,287,672 896,004 802,363 999,930 Sale of property 802,272 569,303 1,434,827 29,352 1,703,047
Total revenues 64,964,401 61,632,629 61,057,442 57,387,107 54,727,035
Expenditures
General government:Mayor 496,415 433,797 415,256 419,481 422,142 City Council 752,183 634,277 537,695 606,812 600,025 Management services 3,366,890 2,293,113 2,027,169 2,089,066 2,042,904 Circuit court 34,020 34,020 34,020 34,020 32,400 Corporate counsel 922,204 896,177 814,485 803,345 765,768 Non departmental 2,984,936 4,620,366 2,579,605 4,176,233 4,736,949 Police 14,187,387 14,267,656 12,799,940 13,017,997 11,769,534 Fire 6,109,653 6,326,334 6,488,091 6,458,664 6,290,897
2 Public works - - - 4,708,270 6,434,126 2 Community services - - - 7,265,426 7,576,512
Community & economic dev. 26,055,225 21,197,793 12,672,324 10,901,179 8,567,845 2 Publics services 12,578,410 10,655,033 9,670,977 - -
Debt service: Principal 3,781,000 5,002,000 4,018,091 2,634,000 4,802,447 Interest and fiscal charges 4,853,032 3,864,630 2,721,531 2,984,634 2,011,960 Fees and assessments - 39,950 - 657,362 569,375 Capital outlay - 91,000 9,064,289 935,738 2,950,360
Total expenditures 76,121,355 70,356,146 63,843,473 57,692,227 59,573,244
Excess of revenues over (under) expenditures (11,156,954) (8,723,517) (2,786,031) (305,120) (4,846,209)
Other Financing Sources (Uses)
Loan/bond proceeds 11,300,000 43,440,000 2,100,000 8,072,255 1,426,359 Bond discount - (336,300) - - - Payment to refund bond escrow - (2,865,000) - (7,970,446) - Operating transfers in 6,517,942 22,580,824 16,064,479 4,482,782 12,253,102 Operating transfers out (7,676,161) (25,051,312) (19,187,992) (12,300,490) (17,183,552)
Total other financing sources (uses) 10,141,781 37,768,212 (1,023,513) (7,715,899) (3,504,091)
Net change in fund balances $ (1,015,173) $ 29,044,695 $ (3,809,544) $ (8,021,019) $ (8,350,300)
Debt service as a percentage of noncapitalexpenditures 14.5% 14.5% 12.3% 11.1% 13.0%
Source: Ogden City Comptroller Division
1 GASB 34 and 44 conversion. Ten years of comparative data is not yet available.
2 The departments of Public Works & Community Services were combined into one departmentof Public Services in fiscal year 2005
Further discussion of this data is availible in the Management Discussion & Analysis, the Transmittal Letter,and notes found in the Financial Section.
108

Page 2 of 2
2007Governmental Funds Revenues
65%4%
9%
12%
3%
3%
0%1%
3% Taxes and specialassessments
Licenses and permits
Intergovernmental
Charges for services
Fines and forfeitures
Miscellaneous
Outside donations
Interest
Sale of property
2007General Government Expenditures
0%
4%
19%
8%
17%
34%
11% 0%
4%
1%1%
1%
Mayor
City Council
ManagementServices
Circuit Court
Corporate Counsel
Non Departmental
Police
Fire
Public Services
Community &EconomicDevelopmentDebt Service:
109

Ogden CityFund Balances, Governmental Funds
Last Five Fiscal Years(modified accrual basis of accounting)
(UNAUDITED)
Fiscal Fiscal Fiscal Fiscal FiscalYear Year Year Year Year2007 2006 2005 2004 2003 ¹
General FundReserved $ 8,926,257 $ 12,431,274 $ 11,361,573 $ 10,875,511 $ 11,476,944Unreserved/Designated 983,584 84,109 276,897 321,722 302,961Unreserved/Undesignated 3,983,421 4,579,463 6,443,605 4,059,669 4,377,072
Total General Fund $ 13,893,262 $ 17,094,846 $ 18,082,075 $ 15,256,902 $ 16,156,977
All Other Governmental FundsReserved $ 12,530,227 $ 16,732,816 $ 698,431 $ 311,438 $ 976,366Unreserved/Designated, reported in:
Debt Service 282,684 366,563 2,894,858 (8,897,891) (8,201,873)Redevelopment Agency Funds - 1,777,515 - - - Nonmajor Funds 0 610,345 592,314 561,133 561,133
Unreserved/Undesignated, reported in:Redevelopment Agency Funds (1,750,917) (8,971,457) (24,378,933) (5,787,733) 969,739Nonmajor Funds 2,796,049 1,155,850 1,833,038 1,322,178 324,705
Total all Other Governmental Funds $ 13,858,043 $ 11,671,632 $ (18,360,292) $ (12,490,875) $ (5,369,930)
Total Primary Government $ 27,751,305 $ 28,766,478 $ (278,217) $ 2,766,027 $ 10,787,047
Note: Fund balances are discussed in detail in Management's Discussion and Analysis
Source: Ogden City Comptroller Division
1 GASB 34 and 44 conversion. Ten years of comparative data is not yet available.
Governmental Fund Balances
(25,000,000)(20,000,000)(15,000,000)(10,000,000)
(5,000,000)0
5,000,00010,000,00015,000,00020,000,00025,000,00030,000,000
2007 2006 2005 2004 2003Year
Valu
e in
Dol
lars
General FundOther Gov. FundPrimary Gov.
110

REVENUE CAPACITY(Unaudited)
111

OGDEN CITY CORPORATIONASSESSED AND ESTIMATED ACTUAL VALUE OF TAXABLE PROPERTY
LAST TEN FISCAL YEARS(UNAUDITED)
Real Property Personal Property TotalTotal
Est. Est. Est. DirectFiscal Taxable Market Taxable Market Taxable Market TaxYear Value 2 Value 2 Value 2 Value 2 Value 4 Value 4 Rate 5
1998 $ 1,712,815,675 $ 3 $ 541,662,411 $ 3 $ 2,254,478,086 $ 3 4.8911999 1,777,846,557 3 621,942,949 3 2,399,789,506 3 4.9292000 2,017,785,103 3 434,263,817 3 2,452,048,920 3 4.7842001 1,934,343,839 3 440,861,847 3 2,375,205,686 3 4.2952002 2,224,267,428 3 366,364,801 3 2,590,632,229 3 4.1352003 1 2,323,499,514 3,423,332,047 381,171,565 385,751,543 2,704,671,079 3,809,083,590 4.0822004 2,397,547,847 3,533,599,330 404,124,480 408,578,318 2,801,672,327 3,942,177,648 4.0612005 2,420,191,163 3,574,141,695 398,027,860 402,294,494 2,818,219,023 3,976,436,189 4.1612006 2,448,901,445 3,614,684,061 424,839,874 428,998,796 2,873,741,319 4,043,682,857 4.2532007 2,534,955,309 4,045,823,892 424,233,158 424,233,158 2,959,188,467 4,470,057,050 3.905
Source: The Annual Report of the Weber County Auditor (1997-2006)Weber County Auditor's Office
1 GASB 34 and 44 conversion; comparative data in previous years provided as available
2 Taxable and market values as provided by Weber County Auditor's office. Includes State Assessed Utilities.
3 Information not available in previous years
4 Calendar year valuations (i.e., FY 2007 is the 2006 calendar year valuation)
5 Total direct tax rate is the Ogden City General Fund tax rate for the calendar year as provided by Weber County.(I.e., FY 2007 is the 2006 calendar year tax rate)
Value of Taxable Property
0
500,000,000
1,000,000,000
1,500,000,000
2,000,000,000
2,500,000,000
3,000,000,000
1998 1999 2000 2001 2002 2003 2004 2005 2006 2007
Year
Valu
e in
dol
lars
Real Property Personal Property Total Value
112

OGDEN CITY CORPORATIONPRINCIPAL TAXPAYERS FOR THE CALENDAR YEAR 2006
June 30, 2007
TEN LARGEST PROPERTY TAXPAYERS(UNAUDITED)
2006 Percentage of 1997Taxable Total Taxable Taxable
Taxpayer Type of Business Value Value Value Ranking
Boyer Company Construction/space leasing $ 123,372,373 4.2% na
Fresenius USA (Delmed Medical) Health care products 72,725,516 2.5% na
IHC Health Services Health services 72,602,083 2.5% na
Morton International/Autoliv Automotive safety products 54,724,490 1.8% $ 62,130,333 1
Williams International Manufacture of jet airplane engines 52,733,278 1.8% 16,579,000 5
Pacificorp (Utah Power) Electric utility 35,204,809 1.2% 31,670,740 3
McDonnell Douglas Air force subcontractor 34,629,823 1.2% na (The Boeing Company)
Newgate Mall Space leasing for retail sales 28,330,594 1.0% 14,674,483 6
Cit Group Finance and leasing 27,692,922 0.9% na
Qwest Communications Telephone/communications 26,723,749 0.9% 35,050,330 2 (US West)
Connecticut General Life Space leasing for retail sales 19,814,714 4 (Ogden City Mall)
Ogden City Mall Parking Terrace Parking structure for mall 13,614,295 7
Mountain Fuel Supply Natural gas utility 12,925,596 8
Cargill Inc. Grain processing 7,517,562 9
Dillards Retail sales 7,221,681 10
Total taxable value of 10 largest taxpayers……………………… 528,739,637 17.9% 221,198,734
Total taxable value of all other taxpayers……………………….. 2,430,448,830 82.1% 1,783,760,762
Total taxable value of all taxpayers……………………………….. $ 2,959,188,467 100.0% $ 2,004,959,496
Sources: Weber County Treasurer's Office Most Recent Available Data Weber County Auditor's Office
113
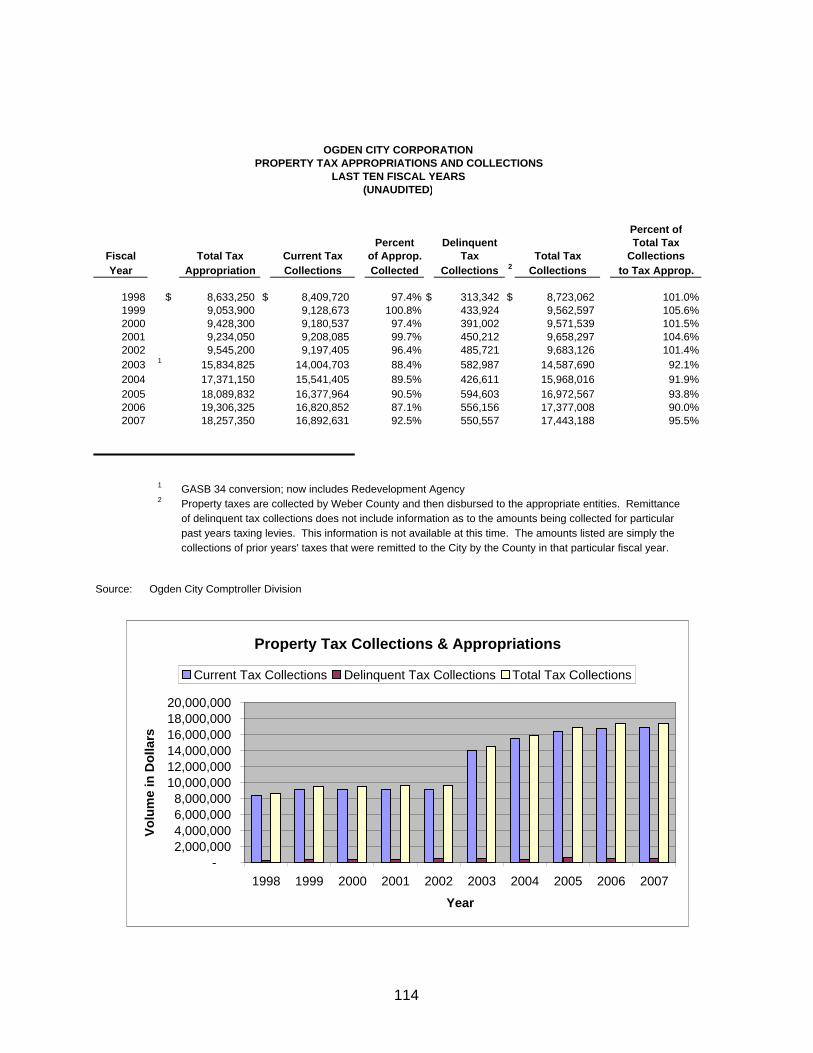
(UNAUDITED)
Percent ofPercent Delinquent Total Tax
Fiscal Total Tax Current Tax of Approp. Tax Total Tax CollectionsYear Appropriation Collections Collected Collections 2 Collections to Tax Approp.
1998 $ 8,633,250 $ 8,409,720 97.4% $ 313,342 $ 8,723,062 101.0%1999 9,053,900 9,128,673 100.8% 433,924 9,562,597 105.6%2000 9,428,300 9,180,537 97.4% 391,002 9,571,539 101.5%2001 9,234,050 9,208,085 99.7% 450,212 9,658,297 104.6%2002 9,545,200 9,197,405 96.4% 485,721 9,683,126 101.4%2003 1 15,834,825 14,004,703 88.4% 582,987 14,587,690 92.1%2004 17,371,150 15,541,405 89.5% 426,611 15,968,016 91.9%2005 18,089,832 16,377,964 90.5% 594,603 16,972,567 93.8%2006 19,306,325 16,820,852 87.1% 556,156 17,377,008 90.0%2007 18,257,350 16,892,631 92.5% 550,557 17,443,188 95.5%
1 GASB 34 conversion; now includes Redevelopment Agency2 Property taxes are collected by Weber County and then disbursed to the appropriate entities. Remittance
of delinquent tax collections does not include information as to the amounts being collected for particularpast years taxing levies. This information is not available at this time. The amounts listed are simply the collections of prior years' taxes that were remitted to the City by the County in that particular fiscal year.
Source: Ogden City Comptroller Division
OGDEN CITY CORPORATIONPROPERTY TAX APPROPRIATIONS AND COLLECTIONS
LAST TEN FISCAL YEARS
Property Tax Collections & Appropriations
-2,000,0004,000,0006,000,0008,000,000
10,000,00012,000,00014,000,00016,000,00018,000,00020,000,000
1998 1999 2000 2001 2002 2003 2004 2005 2006 2007
Year
Volu
me
in D
olla
rs
Current Tax Collections Delinquent Tax Collections Total Tax Collections
114

OGDEN CITY CORPORATIONPROPERTY TAX RATES
DIRECT AND OVERLAPPING GOVERNMENTSPER $1,000 ASSESSED VALUATION
LAST TEN CALENDAR YEARS(UNAUDITED)
Weber WeberOgden Weber Weber Basin Basin Ogden State
City County County Consolidated Weber Mosquito Water Water Central City AssessCalendar General General Library Health County Abatement General Ogden Weber School and
Year Fund Fund Fund Fund Paramedic Dist. Levy Special Sewer District Collect Total
1997 4.891 2.106 0.866 0.206 0.258 0.125 0.145 0.240 0.635 7.846 0.414 17.732115 1998 4.929 1.246 1.234 0.210 0.263 0.127 0.141 0.240 0.638 7.865 0.406 17.299
1999 4.784 2.109 1.250 0.210 0.262 0.125 0.139 0.237 0.638 7.722 0.400 17.876
2000 4.295 1.973 1.221 0.198 0.247 0.118 0.200 0.222 0.603 7.761 0.373 17.211
2001 4.135 1.853 1.028 0.186 0.232 0.111 0.193 0.216 0.578 7.476 0.348 16.356
2002 4.082 1.868 1.004 0.187 0.234 0.111 0.193 0.159 0.575 7.458 0.336 16.207
2003 4.061 1.880 0.968 0.187 0.234 0.111 0.196 0.282 0.574 7.284 0.340 16.117
2004 4.161 1.893 1.006 0.188 0.236 0.112 0.198 0.358 0.552 7.342 0.340 16.386
2005 4.253 2.405 1.124 0.193 0.185 0.110 0.193 0.310 0.567 7.312 0.377 17.029
2006 3.905 2.309 1.056 0.185 0.480 0.106 0.178 0.306 0.573 8.380 0.335 17.813
Source: Weber County Auditor's Office
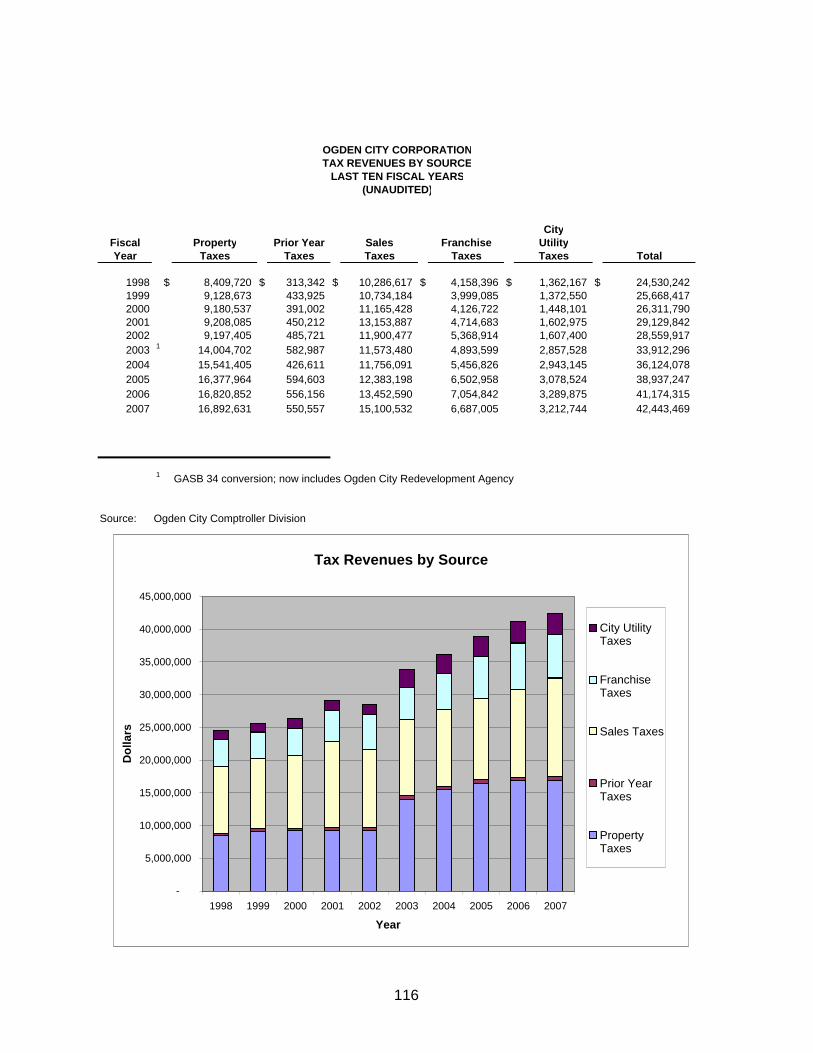
OGDEN CITY CORPORATIONTAX REVENUES BY SOURCE
LAST TEN FISCAL YEARS(UNAUDITED)
CityFiscal Property Prior Year Sales Franchise UtilityYear Taxes Taxes Taxes Taxes Taxes Total
1998 $ 8,409,720 $ 313,342 $ 10,286,617 $ 4,158,396 $ 1,362,167 $ 24,530,242 1999 9,128,673 433,925 10,734,184 3,999,085 1,372,550 25,668,417 2000 9,180,537 391,002 11,165,428 4,126,722 1,448,101 26,311,790 2001 9,208,085 450,212 13,153,887 4,714,683 1,602,975 29,129,842 2002 9,197,405 485,721 11,900,477 5,368,914 1,607,400 28,559,917 2003 1 14,004,702 582,987 11,573,480 4,893,599 2,857,528 33,912,296 2004 15,541,405 426,611 11,756,091 5,456,826 2,943,145 36,124,078 2005 16,377,964 594,603 12,383,198 6,502,958 3,078,524 38,937,247 2006 16,820,852 556,156 13,452,590 7,054,842 3,289,875 41,174,315 2007 16,892,631 550,557 15,100,532 6,687,005 3,212,744 42,443,469
1 GASB 34 conversion; now includes Ogden City Redevelopment Agency
Source: Ogden City Comptroller Division
Tax Revenues by Source
-
5,000,000
10,000,000
15,000,000
20,000,000
25,000,000
30,000,000
35,000,000
40,000,000
45,000,000
1998 1999 2000 2001 2002 2003 2004 2005 2006 2007
Year
Dol
lars
City UtilityTaxes
FranchiseTaxes
Sales Taxes
Prior YearTaxes
PropertyTaxes
116

DEBT CAPACITY(Unaudited)
117

General Lease Tax Increment Notes and Fiscal Personal Obligation Revenue Revenue Special LeasesYear Population Income 2 Bonds Bonds Bonds Assessment Payable
2003 1 80,599 $ 5,053,300,000 $ 21,410,000 $ 4,315,000 $ 14,655,000 $ 543,000 $ 1,737,3092004 81,416 5,228,500,000 20,850,000 3,905,000 13,770,000 477,000 1,619,0562005 82,007 5,454,700,000 19,475,000 3,475,000 12,875,000 408,000 4,221,4352006 82,007 5,744,900,000 20,020,000 3,340,000 50,305,000 257,000 3,886,3302007 82,843 6,152,800,000 18,455,000 3,005,000 57,925,000 176,000 6,989,883
Total PercentageFiscal Revenue Notes Primary of Personal PerYear Bonds Payable Government Income Capita
2003 $ 12,500,000 $ - $ 55,160,309 1.09 % $ 684.382004 11,868,650 - 52,489,706 1.00 644.712005 11,206,633 4,806,530 56,467,598 1.04 688.572006 10,518,494 4,702,742 93,029,566 1.62 1,134.412007 9,798,765 4,568,950 100,918,598 1.64 1,218.19
Notes:Details regarding the City's outstanding debt can be found in the notes to the financial statements.These ratios are calculated using personal income and population for the prior calendar year.
Source: Ogden City Comptrollers OfficeUtah Department of Workforce Services
1 GASB 34 and 44 conversion. Ten years of comparative data is not available.
2 Personal income numbers are for Weber County. This data is not available on a city level. Ogden City is the largest city inWeber County. Calendar year numbers (i.e., FY 2007 is calendar year 2006 numbers); 2006 is a preliminary number, 2007 isa forecasted number.
118 Business-Type Activities
Governmental Activities
Ogden CityRatios of Outstanding Debt by Type
Last Five Fiscal Years(UNAUDITED)

OGDEN CITY CORPORATIONRATIOS OF GENERAL BONDED DEBT OUTSTANDING
TO ASSESSED VALUE AND PER CAPITALAST TEN FISCAL YEARS
(UNAUDITED)Ratio
Debt of Net NetPayable Bonded Bonded
Gross from Net Debt to DebtFiscal Taxable Value/ Bonded Enterprise Bonded Assessed perYear Population 2 Est. Market Value 3 Debt Revenues Debt Value Capita
1998 68,226 $ 2,254,478,086 $ 26,730,000 $ 1,775,000 $ 24,955,000 1.11 $ 365.77 1999 69,262 2,399,789,506 34,015,000 8,335,000 25,680,000 1.07 370.77 2000 69,262 2,452,048,920 32,650,000 7,970,000 24,680,000 1.01 356.33 2001 77,226 2,375,205,686 31,410,000 7,770,000 23,640,000 1.00 306.11 2002 79,757 2,590,632,229 33,415,000 10,865,000 22,550,000 0.87 282.73 2003 1 80,599 3,809,083,590 53,423,000 12,500,000 40,923,000 1.07 507.74 2004 81,416 3,942,177,648 50,870,650 11,868,650 39,002,000 0.99 479.05 2005 82,007 5,246,039,171 47,439,633 11,206,633 36,233,000 0.69 441.83 2006 82,007 4,043,682,857 84,440,484 10,518,494 73,921,990 1.83 901.41 2007 82,843 4,470,057,050 89,359,765 9,798,765 79,561,000 1.78 960.38
Sources: The Annual Report of the Weber County Auditor (1997-2006)Weber County Auditor's OfficeOgden City Planning and U.S. Census Bureau
Notes: Details regarding the City's outstanding debt can be found in the notes to the financial statements.
1 GASB 34 and 44 conversion. Debt now includes Redevelopment Agency.
2 Calendar year estimates prepared by the Ogden City Planning Division(i.e., FY 2007 population is the calendar year 2006 estimate)Population from the 1990 census was 63,909. The population figureshave been revised to bring them in line with the census.
3 Calendar year valuations (i.e., FY 2007 is calendar year 2006 valuation) . Taxable and market values as provided by WeberCounty Auditor's office. Includes State Assessed Utilities. Estimated market value not available prior to FY 2003; numbersprovided in FY 2002 and prior are taxable values.
4 Includes all long-term general obligation debt
119

OGDEN CITY CORPORATIONCOMPUTATION OF DIRECT AND OVERLAPPING DEBT
June 30, 2007(UNAUDITED)
Percentage AmountApplicable Applicable
Net Debt to toJurisdiction Outstanding Ogden City Ogden City
Ogden City Corporation $ 76,380,000 100% $ 76,380,000
Ogden City School District 60,390,000 100% 60,390,000
Weber County 21,125,000 33% 7,012,030
Weber Basin Water Conservancy Dist. 32,397,387 9% 2,779,275
Total Overlapping General Obligation Debt $ 146,561,304
Notes: Percentage applicable to Ogden City calculated usingtaxable value data as provided by the entities listed above or from the Weber County Auditor's Office
The State of Utah general obligation debt is not includedin the calculation of Overlapping General ObligationDebt because the State currently levies no property taxfor payment of general obligation bonds.
Sources: Ogden City Comptrollers OfficeOgden City School DistrictWeber County Auditor/Clerk/Treasurer's OfficeWeber Basin Water Conservancy District
120

OGDEN CITY CORPORATIONCOMPUTATION OF LEGAL DEBT MARGIN
Last Ten Fiscal YearsJune 30, 2007(UNAUDITED)
Net assessed value for 2006: Residential valuation $ 1,462,283,191 @ 55% 1 804,255,755 Non-residential valuation 1,496,905,276 @ 100% 1,496,905,276
Total taxable value………………………………………………… $ 2,301,161,031
Debt limit:4% of total taxable value 2 $ 92,046,441 4% of total taxable value for utilities 92,046,441
$ 184,092,882
Amount of debt applicable to debt limit: Total bonded debt 3
(including Special Assessment Bonds)……………….. 18,631,000 Less: Assets in Debt Service Fund available for payment of principal……………………………… - Other deductions allowed by law: Special Assessment Bonds………………………… (176,000)
Total amount of debt applicable to debt limit 18,455,000
General debt margin……………………………………………… 73,591,441 Utilities debt margin………………………………………………. 92,046,441
Total legal debt margin…………………………………………… $ 165,637,882
121 Fiscal Year1998 1999 2000 2001 2002 2003 2004 2005 2006 2007
Debt limit $ 133,261,504 $ 142,990,488 $ 149,816,983 $ 146,522,762 $ 160,360,586 $ 168,112,203 $ 174,262,311 $ 175,095,774 $ 178,724,547 $ 184,092,882
Total net debt applicable to limit 24,955,000 25,680,000 24,680,000 23,640,000 22,550,000 21,410,000 20,850,000 19,475,000 20,020,000 18,455,000
Legal debt margin $ 108,306,504 $ 117,310,488 $ 125,136,983 $ 122,882,762 $ 137,810,586 $ 146,702,203 $ 153,412,311 $ 155,620,774 $ 158,704,547 $ 165,637,882
Total net debt applicable to the limit as a percentage of debt limit 18.73% 17.96% 16.47% 16.13% 14.06% 12.74% 11.96% 11.12% 11.20% 10.02%
1 Primary residences only. Secondary homes are assessed at 100%.
2 Article XIV. Section 4. Constitution of Utah: Establishes that no city, town, school district or other municipal corporation, shall become indebted to an amount, including existingindebtedness, exceeding four per cent of the value of the taxable property with provisions that an additional four per cent is allowed if the debt is incurred to provide the entity withwater, light or sewer service.
3 Bonded debt applicable to debt limit does not include Enterprise Fund revenue bonds or RDAbonded debt.
Sources: Ogden City Comptrollers OfficeWeber County Auditor's Office
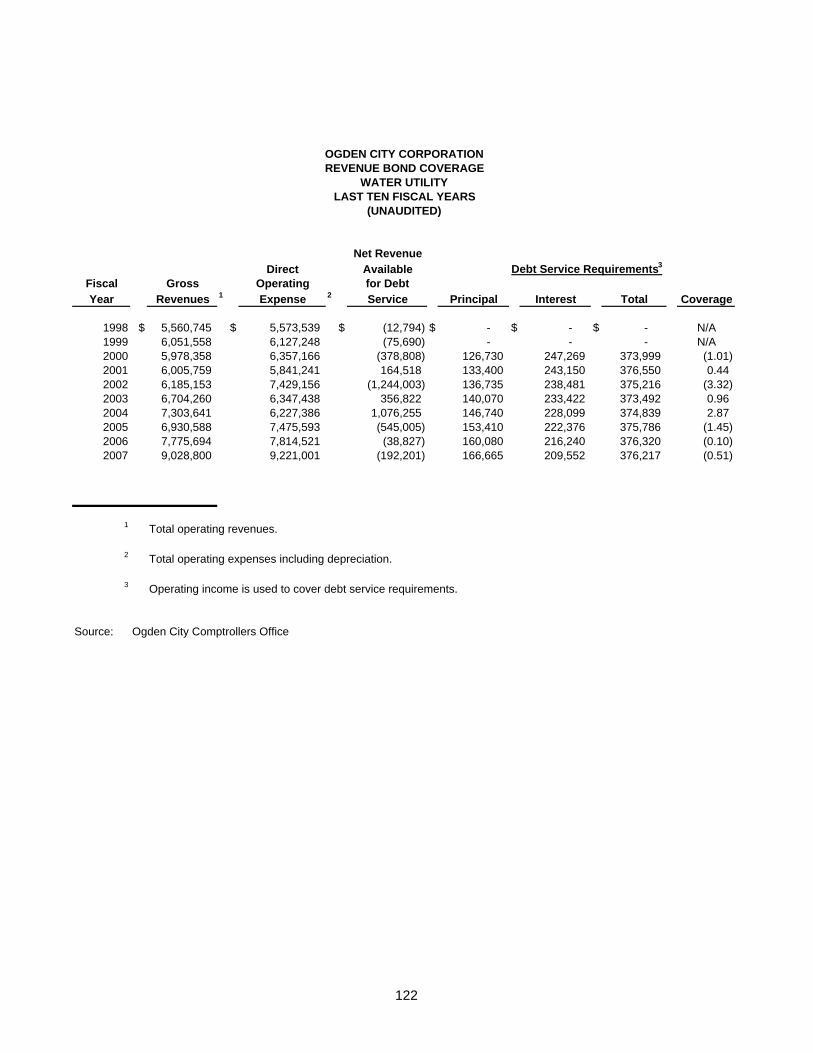
OGDEN CITY CORPORATIONREVENUE BOND COVERAGE
WATER UTILITYLAST TEN FISCAL YEARS
(UNAUDITED)
Net RevenueDirect Available Debt Service Requirements3
Fiscal Gross Operating for DebtYear Revenues 1 Expense 2 Service Principal Interest Total Coverage
1998 $ 5,560,745 $ 5,573,539 $ (12,794) $ - $ - $ - N/A1999 6,051,558 6,127,248 (75,690) - - - N/A2000 5,978,358 6,357,166 (378,808) 126,730 247,269 373,999 (1.01) 2001 6,005,759 5,841,241 164,518 133,400 243,150 376,550 0.44 2002 6,185,153 7,429,156 (1,244,003) 136,735 238,481 375,216 (3.32) 2003 6,704,260 6,347,438 356,822 140,070 233,422 373,492 0.96 2004 7,303,641 6,227,386 1,076,255 146,740 228,099 374,839 2.87 2005 6,930,588 7,475,593 (545,005) 153,410 222,376 375,786 (1.45) 2006 7,775,694 7,814,521 (38,827) 160,080 216,240 376,320 (0.10) 2007 9,028,800 9,221,001 (192,201) 166,665 209,552 376,217 (0.51)
1 Total operating revenues.
2 Total operating expenses including depreciation.
3 Operating income is used to cover debt service requirements.
Source: Ogden City Comptrollers Office
122
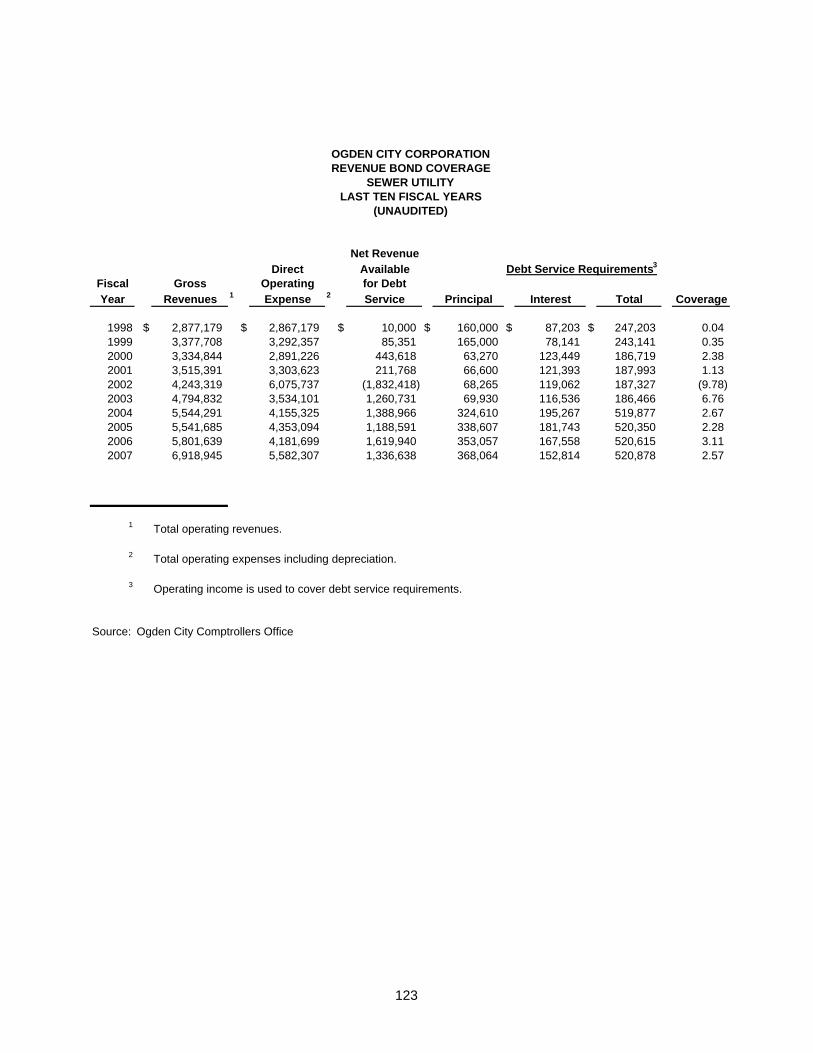
OGDEN CITY CORPORATIONREVENUE BOND COVERAGE
SEWER UTILITYLAST TEN FISCAL YEARS
(UNAUDITED)
Net RevenueDirect Available Debt Service Requirements3
Fiscal Gross Operating for DebtYear Revenues 1 Expense 2 Service Principal Interest Total Coverage
1998 $ 2,877,179 $ 2,867,179 $ 10,000 $ 160,000 $ 87,203 $ 247,203 0.04 1999 3,377,708 3,292,357 85,351 165,000 78,141 243,141 0.35 2000 3,334,844 2,891,226 443,618 63,270 123,449 186,719 2.38 2001 3,515,391 3,303,623 211,768 66,600 121,393 187,993 1.13 2002 4,243,319 6,075,737 (1,832,418) 68,265 119,062 187,327 (9.78) 2003 4,794,832 3,534,101 1,260,731 69,930 116,536 186,466 6.76 2004 5,544,291 4,155,325 1,388,966 324,610 195,267 519,877 2.67 2005 5,541,685 4,353,094 1,188,591 338,607 181,743 520,350 2.28 2006 5,801,639 4,181,699 1,619,940 353,057 167,558 520,615 3.11 2007 6,918,945 5,582,307 1,336,638 368,064 152,814 520,878 2.57
1 Total operating revenues.
2 Total operating expenses including depreciation.
3 Operating income is used to cover debt service requirements.
Source: Ogden City Comptrollers Office
123
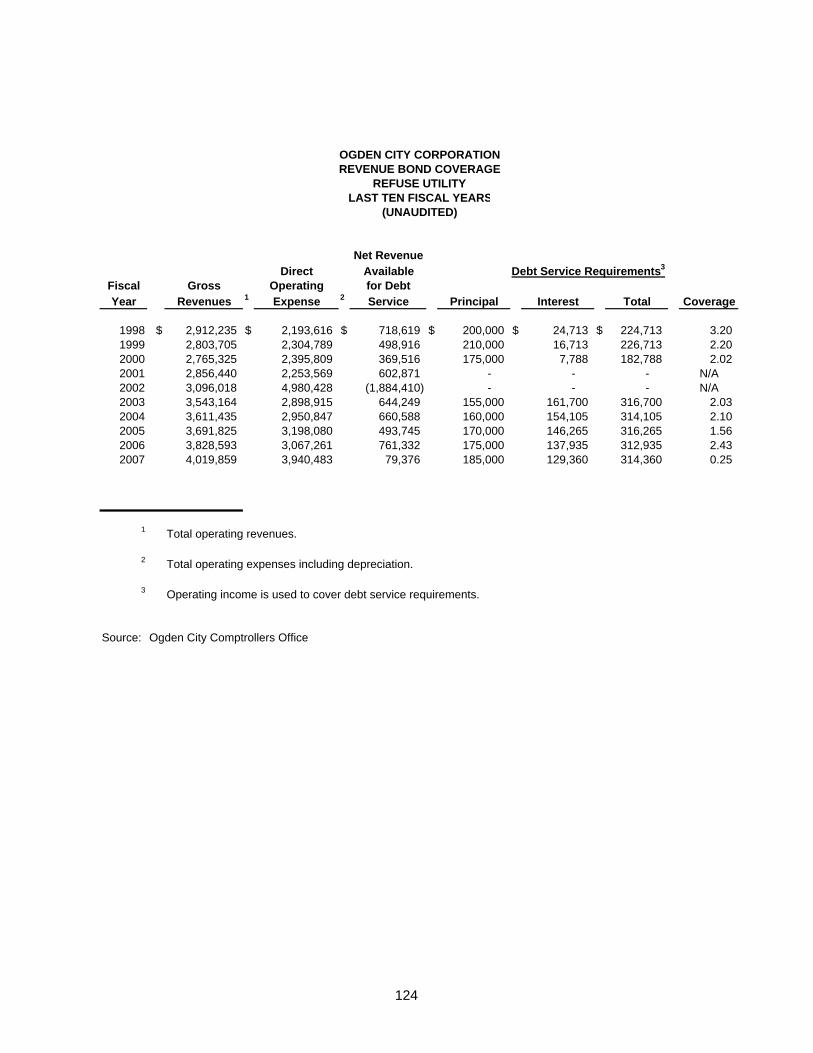
OGDEN CITY CORPORATIONREVENUE BOND COVERAGE
REFUSE UTILITYLAST TEN FISCAL YEARS
(UNAUDITED)
Net RevenueDirect Available Debt Service Requirements3
Fiscal Gross Operating for DebtYear Revenues 1 Expense 2 Service Principal Interest Total Coverage
1998 $ 2,912,235 $ 2,193,616 $ 718,619 $ 200,000 $ 24,713 $ 224,713 3.20 1999 2,803,705 2,304,789 498,916 210,000 16,713 226,713 2.20 2000 2,765,325 2,395,809 369,516 175,000 7,788 182,788 2.02 2001 2,856,440 2,253,569 602,871 - - - N/A2002 3,096,018 4,980,428 (1,884,410) - - - N/A2003 3,543,164 2,898,915 644,249 155,000 161,700 316,700 2.03 2004 3,611,435 2,950,847 660,588 160,000 154,105 314,105 2.10 2005 3,691,825 3,198,080 493,745 170,000 146,265 316,265 1.56 2006 3,828,593 3,067,261 761,332 175,000 137,935 312,935 2.43 2007 4,019,859 3,940,483 79,376 185,000 129,360 314,360 0.25
1 Total operating revenues.
2 Total operating expenses including depreciation.
3 Operating income is used to cover debt service requirements.
Source: Ogden City Comptrollers Office
124
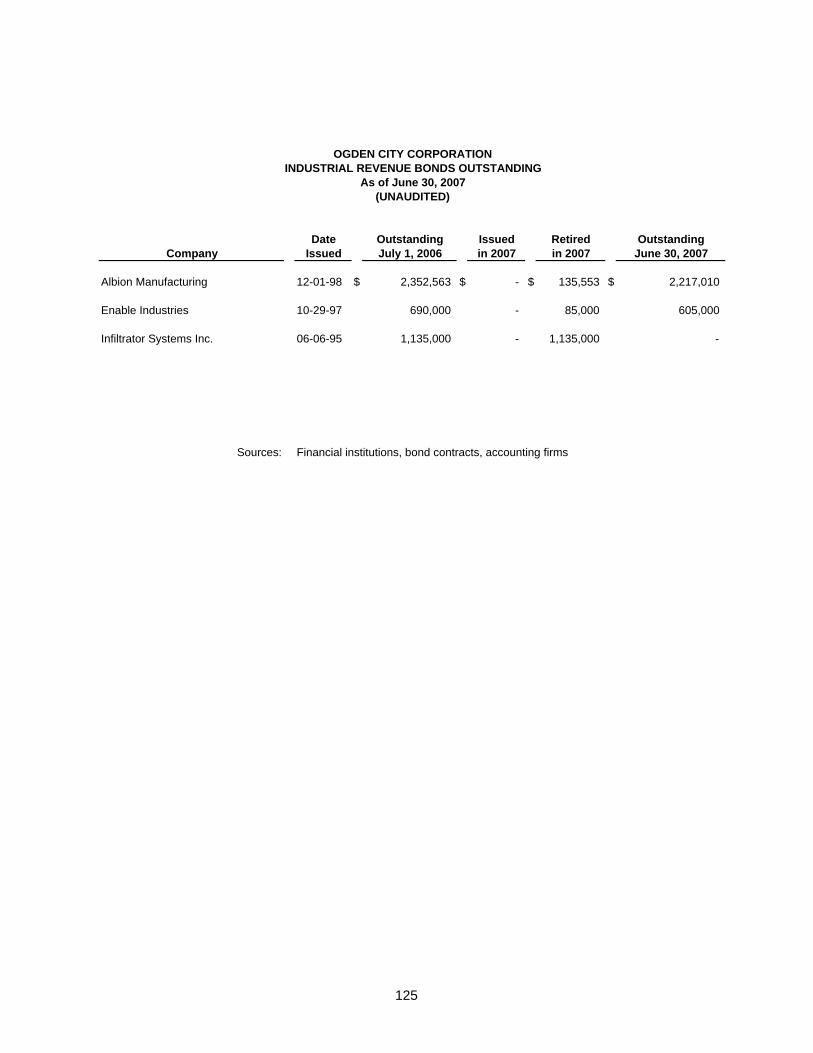
OGDEN CITY CORPORATIONINDUSTRIAL REVENUE BONDS OUTSTANDING
As of June 30, 2007(UNAUDITED)
Date Outstanding Issued Retired OutstandingCompany Issued July 1, 2006 in 2007 in 2007 June 30, 2007
Albion Manufacturing 12-01-98 $ 2,352,563 $ - $ 135,553 $ 2,217,010
Enable Industries 10-29-97 690,000 - 85,000 605,000
Infiltrator Systems Inc. 06-06-95 1,135,000 - 1,135,000 -
Sources: Financial institutions, bond contracts, accounting firms
125

Demographic and Economic Information(Unaudited)
126

OGDEN CITY CORPORATIONDEMOGRAPHIC AND ECONOMIC STATISTICS
LAST TEN FISCAL YEARS(UNAUDITED)
Per CapitaFiscal Personal Personal School UnemploymentYear Population 2 Income 3 Income 3 Enrollment 4 Rate 5
1998 68,226 Not available Not available 12,800 6.9%1999 69,262 Not available Not available 12,809 6.5%2000 69,262 Not available Not available 12,809 6.0%2001 77,226 Not available Not available 12,835 7.2%2002 79,757 Not available Not available 12,816 9.2%2003 1 80,599 $ 5,053,300,000 $ 24,856 13,141 9.6%2004 81,416 5,228,500,000 25,414 12,877 8.1%2005 82,007 5,454,700,000 26,203 12,604 6.8%2006 82,007 5,744,900,000 27,294 12,059 4.6%2007 82,843 6,152,800,000 28,853 12,564 Not Available 5
Sources:Utah Department of Workforce Services, Ogden City Planning,Ogden City School District and U.S. Census Bureau
1 GASB 34 and 44 conversion; comparison data in prior years provided as available
2 Calendar year estimates prepared by the Ogden City Planning Division(i.e., FY 2007 population is the calendar year 2006 estimate).Population from the 1990 census was 63,909. The population figures have beenrevised to bring them more in line with the census. Population from the 1980census was 64,407. FY 2001 population is from the 2000 census.
3 Personal income and per capita personal income numbers are for Weber County. This datais not available on a city level. Ogden City is the largest city in Weber County. Calendar year numbers (i.e., FY 2007 is calendar year 2006 numbers); FY 2006 is a preliminary number, FY 2007 is a forcasted number. Prior year data is adjusted to actual as available.
4 Calendar year data.
5 Rates are raw annual calendar year averages. The unemployment rate for calendar year 2007 is not yet available. The unemployment rates for the years 1990-1996 were revised bythe Utah Dept. of Employment Security based on the 1990 census data.
127
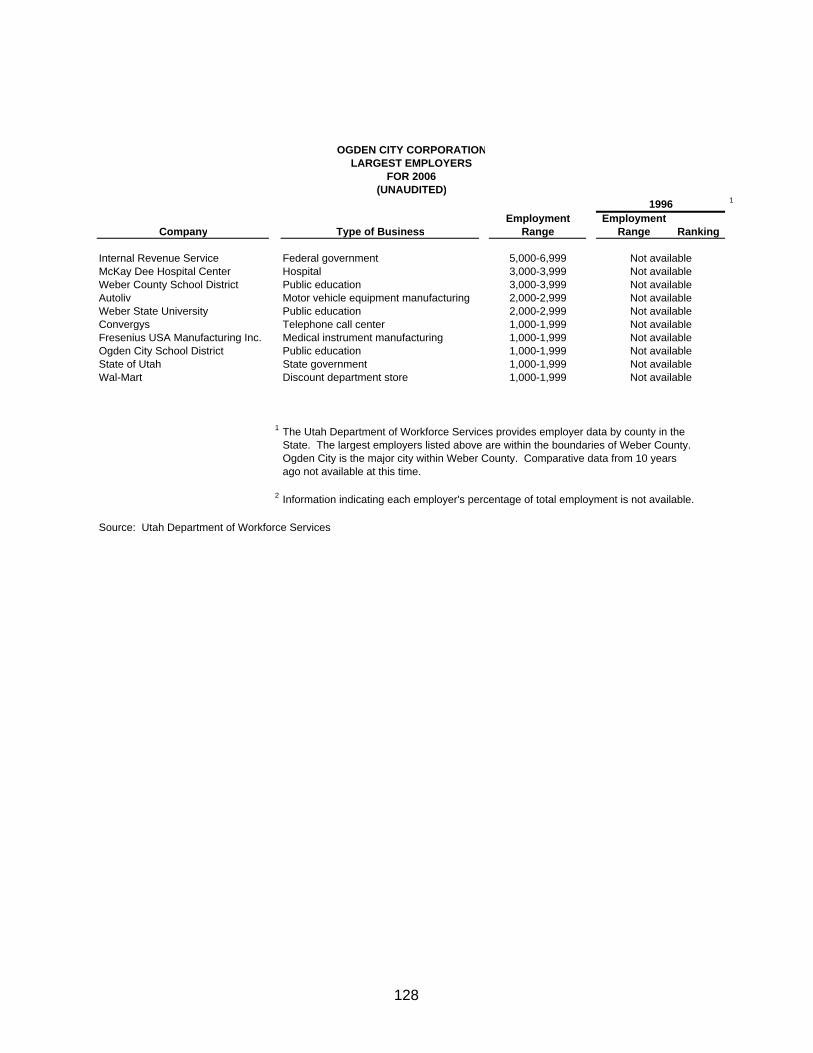
OGDEN CITY CORPORATIONLARGEST EMPLOYERS
FOR 2006(UNAUDITED)
1996 1
Employment EmploymentCompany Type of Business Range Range Ranking
Internal Revenue Service Federal government 5,000-6,999 Not availableMcKay Dee Hospital Center Hospital 3,000-3,999 Not availableWeber County School District Public education 3,000-3,999 Not availableAutoliv Motor vehicle equipment manufacturing 2,000-2,999 Not availableWeber State University Public education 2,000-2,999 Not availableConvergys Telephone call center 1,000-1,999 Not availableFresenius USA Manufacturing Inc. Medical instrument manufacturing 1,000-1,999 Not availableOgden City School District Public education 1,000-1,999 Not availableState of Utah State government 1,000-1,999 Not availableWal-Mart Discount department store 1,000-1,999 Not available
1 The Utah Department of Workforce Services provides employer data by county in theState. The largest employers listed above are within the boundaries of Weber County.Ogden City is the major city within Weber County. Comparative data from 10 yearsago not available at this time.
2 Information indicating each employer's percentage of total employment is not available.
Source: Utah Department of Workforce Services
128
Operating Information(Unaudited)
129
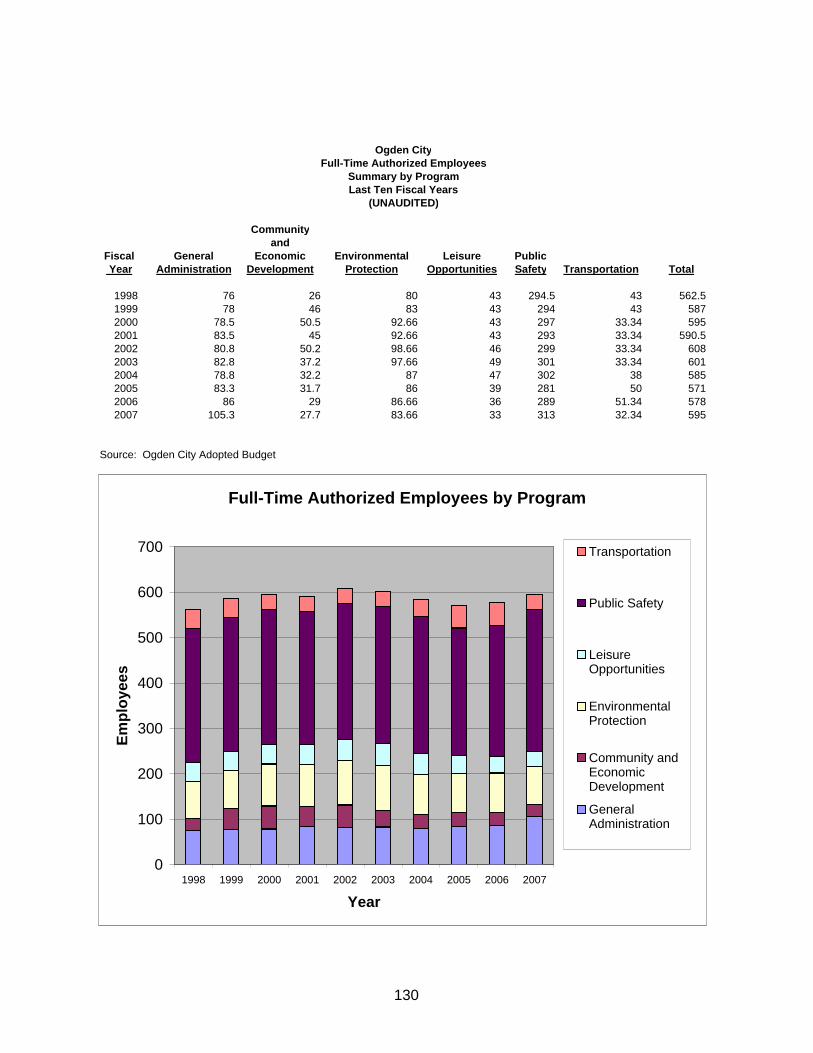
Ogden CityFull-Time Authorized Employees
Summary by ProgramLast Ten Fiscal Years
(UNAUDITED)
Communityand
Fiscal General Economic Environmental Leisure Public Year Administration Development Protection Opportunities Safety Transportation Total
1998 76 26 80 43 294.5 43 562.51999 78 46 83 43 294 43 5872000 78.5 50.5 92.66 43 297 33.34 5952001 83.5 45 92.66 43 293 33.34 590.52002 80.8 50.2 98.66 46 299 33.34 6082003 82.8 37.2 97.66 49 301 33.34 6012004 78.8 32.2 87 47 302 38 5852005 83.3 31.7 86 39 281 50 5712006 86 29 86.66 36 289 51.34 5782007 105.3 27.7 83.66 33 313 32.34 595
Source: Ogden City Adopted Budget
Full-Time Authorized Employees by Program
0
100
200
300
400
500
600
700
1998 1999 2000 2001 2002 2003 2004 2005 2006 2007
Year
Empl
oyee
s
Transportation
Public Safety
LeisureOpportunities
EnvironmentalProtection
Community andEconomicDevelopment
GeneralAdministration
130
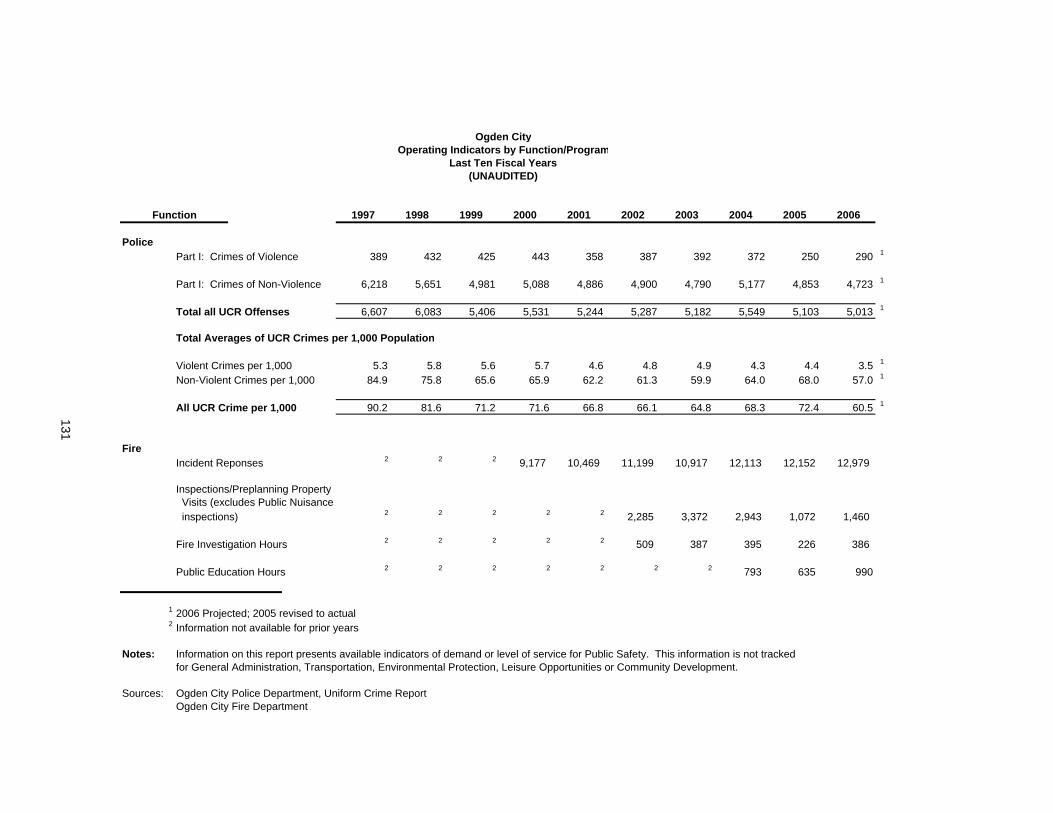
Ogden CityOperating Indicators by Function/Program
Last Ten Fiscal Years(UNAUDITED)
Function 1997 1998 1999 2000 2001 2002 2003 2004 2005 2006
PolicePart I: Crimes of Violence 389 432 425 443 358 387 392 372 250 290 1
Part I: Crimes of Non-Violence 6,218 5,651 4,981 5,088 4,886 4,900 4,790 5,177 4,853 4,723 1
Total all UCR Offenses 6,607 6,083 5,406 5,531 5,244 5,287 5,182 5,549 5,103 5,013 1
Total Averages of UCR Crimes per 1,000 Population
Violent Crimes per 1,000 5.3 5.8 5.6 5.7 4.6 4.8 4.9 4.3 4.4 3.5 1
Non-Violent Crimes per 1,000 84.9 75.8 65.6 65.9 62.2 61.3 59.9 64.0 68.0 57.0 1
All UCR Crime per 1,000 90.2 81.6 71.2 71.6 66.8 66.1 64.8 68.3 72.4 60.5 1
131
FireIncident Reponses 2 2 2 9,177 10,469 11,199 10,917 12,113 12,152 12,979
Inspections/Preplanning Property Visits (excludes Public Nuisance inspections) 2 2 2 2 2 2,285 3,372 2,943 1,072 1,460
Fire Investigation Hours 2 2 2 2 2 509 387 395 226 386
Public Education Hours 2 2 2 2 2 2 2 793 635 990
1 2006 Projected; 2005 revised to actual2 Information not available for prior years
Notes: Information on this report presents available indicators of demand or level of service for Public Safety. This information is not trackedfor General Administration, Transportation, Environmental Protection, Leisure Opportunities or Community Development.
Sources: Ogden City Police Department, Uniform Crime ReportOgden City Fire Department

Ogden CityCapital Asset Statistics by Function/Program
Last Ten Fiscal Years(UNAUDITED)
Function 1997 1998 1999 2000 2001 2002 2003 2004 2005 2006
PoliceStations 1 1 1 1 1 1 1 1 1 1Number of policemen and officers 113 114 116 112 125 125 124 122 126 132 (does not include reserve police officers)
Fire Stations 5 5 5 5 5 5 5 5 5 5Number of firemen and officers 109 109 103 106 111 111 110 104 115 116
132
Source: Ogden City Comptroller's Division
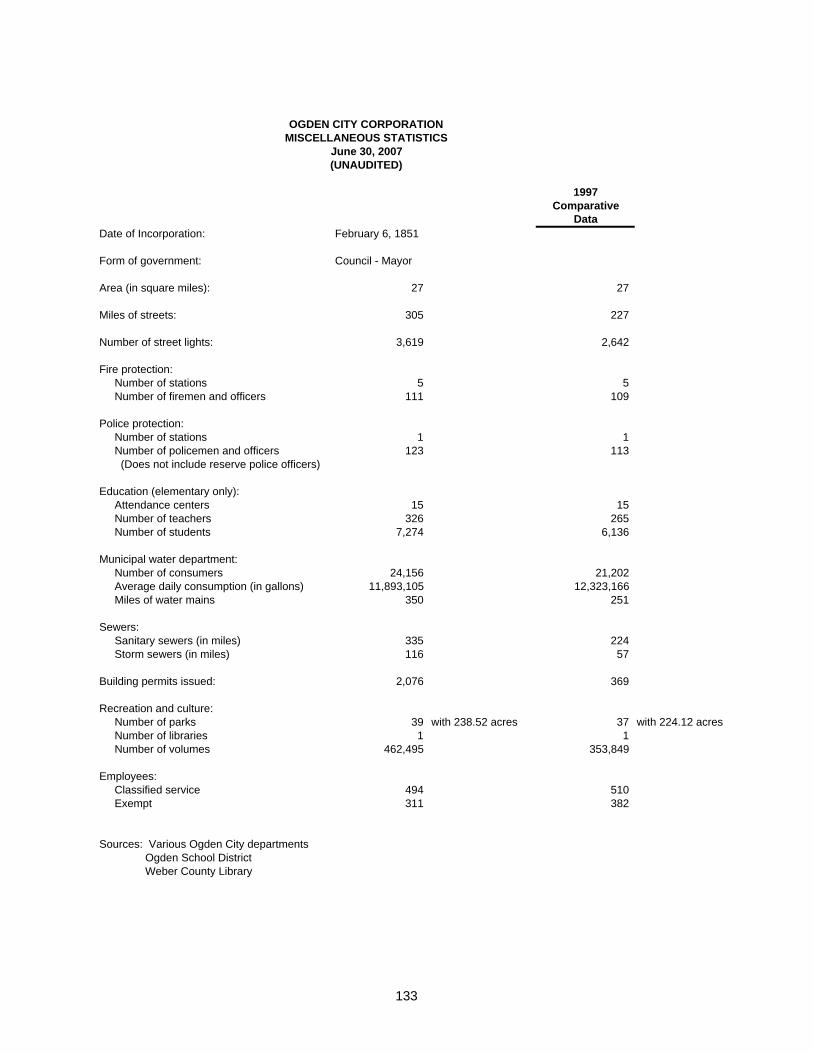
OGDEN CITY CORPORATIONMISCELLANEOUS STATISTICS
June 30, 2007(UNAUDITED)
1997Comparative
DataDate of Incorporation: February 6, 1851
Form of government: Council - Mayor
Area (in square miles): 27 27
Miles of streets: 305 227
Number of street lights: 3,619 2,642
Fire protection: Number of stations 5 5 Number of firemen and officers 111 109
Police protection: Number of stations 1 1 Number of policemen and officers 123 113 (Does not include reserve police officers)
Education (elementary only): Attendance centers 15 15 Number of teachers 326 265 Number of students 7,274 6,136
Municipal water department: Number of consumers 24,156 21,202 Average daily consumption (in gallons) 11,893,105 12,323,166 Miles of water mains 350 251
Sewers: Sanitary sewers (in miles) 335 224 Storm sewers (in miles) 116 57
Building permits issued: 2,076 369
Recreation and culture: Number of parks 39 with 238.52 acres 37 with 224.12 acres Number of libraries 1 1 Number of volumes 462,495 353,849
Employees: Classified service 494 510 Exempt 311 382
Sources: Various Ogden City departments Ogden School District Weber County Library
133
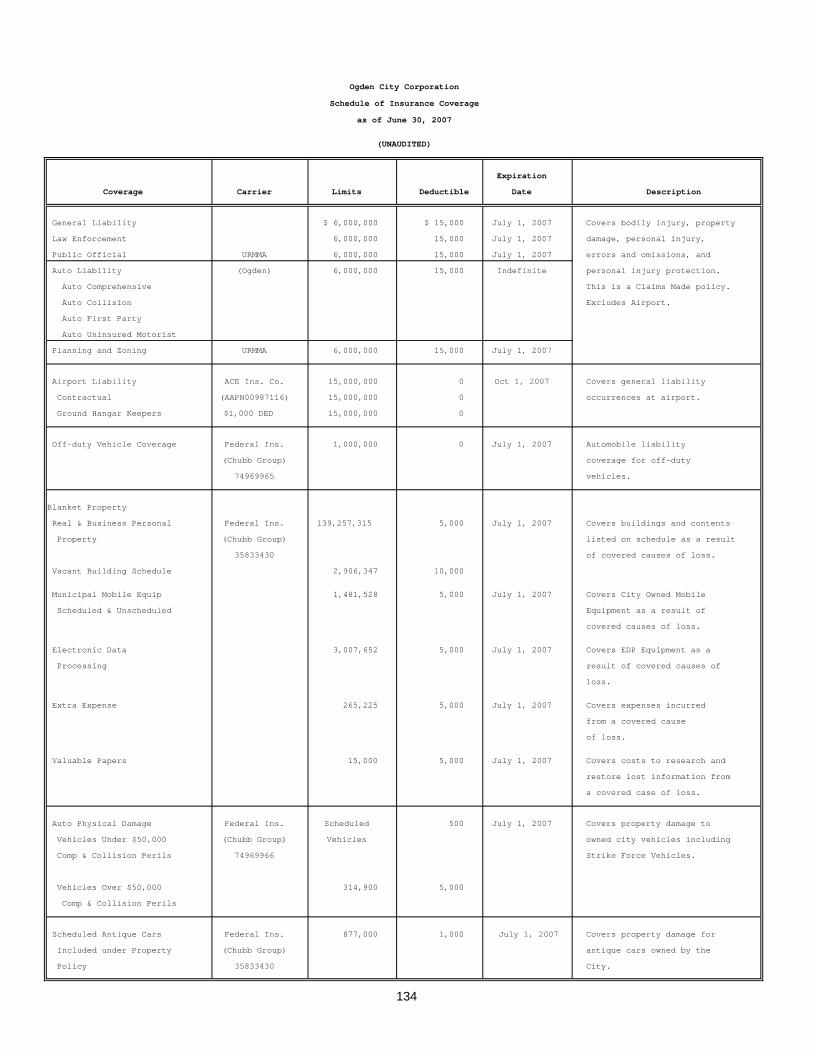
Ogden City Corporation
Schedule of Insurance Coverage
as of June 30, 2007
(UNAUDITED)
Expiration
Coverage Carrier Limits Deductible Date Description
General Liability $ 6,000,000 $ 15,000 July 1, 2007 Covers bodily injury, property
Law Enforcement 6,000,000 15,000 July 1, 2007 damage, personal injury,
Public Official URMMA 6,000,000 15,000 July 1, 2007 errors and omissions, and
Auto Liability (Ogden) 6,000,000 15,000 Indefinite personal injury protection.
Auto Comprehensive This is a Claims Made policy.
Auto Collision Excludes Airport.
Auto First Party
Auto Uninsured Motorist
Planning and Zoning URMMA 6,000,000 15,000 July 1, 2007
Airport Liability ACE Ins. Co. 15,000,000 0 Oct 1, 2007 Covers general liability
Contractual (AAPN00987116) 15,000,000 0 occurrences at airport.
Ground Hangar Keepers $1,000 DED 15,000,000 0
Off-duty Vehicle Coverage Federal Ins. 1,000,000 0 July 1, 2007 Automobile liability
(Chubb Group) coverage for off-duty
74969965 vehicles.
Blanket Property
Real & Business Personal Federal Ins. 139,257,315 5,000 July 1, 2007 Covers buildings and contents
Property (Chubb Group) listed on schedule as a result
35833430 of covered causes of loss.
Vacant Building Schedule 2,906,347 10,000
Municipal Mobile Equip 1,481,528 5,000 July 1, 2007 Covers City Owned Mobile
Scheduled & Unscheduled Equipment as a result of
covered causes of loss.
Electronic Data 3,007,652 5,000 July 1, 2007 Covers EDP Equipment as a
Processing result of covered causes of
loss.
Extra Expense 265,225 5,000 July 1, 2007 Covers expenses incurred
from a covered cause
of loss.
Valuable Papers 15,000 5,000 July 1, 2007 Covers costs to research and
restore lost information from
a covered case of loss.
Auto Physical Damage Federal Ins. Scheduled 500 July 1, 2007 Covers property damage to
Vehicles Under $50,000 (Chubb Group) Vehicles owned city vehicles including
Comp & Collision Perils 74969966 Strike Force Vehicles.
Vehicles Over $50,000 314,900 5,000
Comp & Collision Perils
Scheduled Antique Cars Federal Ins. 877,000 1,000 July 1, 2007 Covers property damage for
Included under Property (Chubb Group) antique cars owned by the
Policy 35833430 City.
134
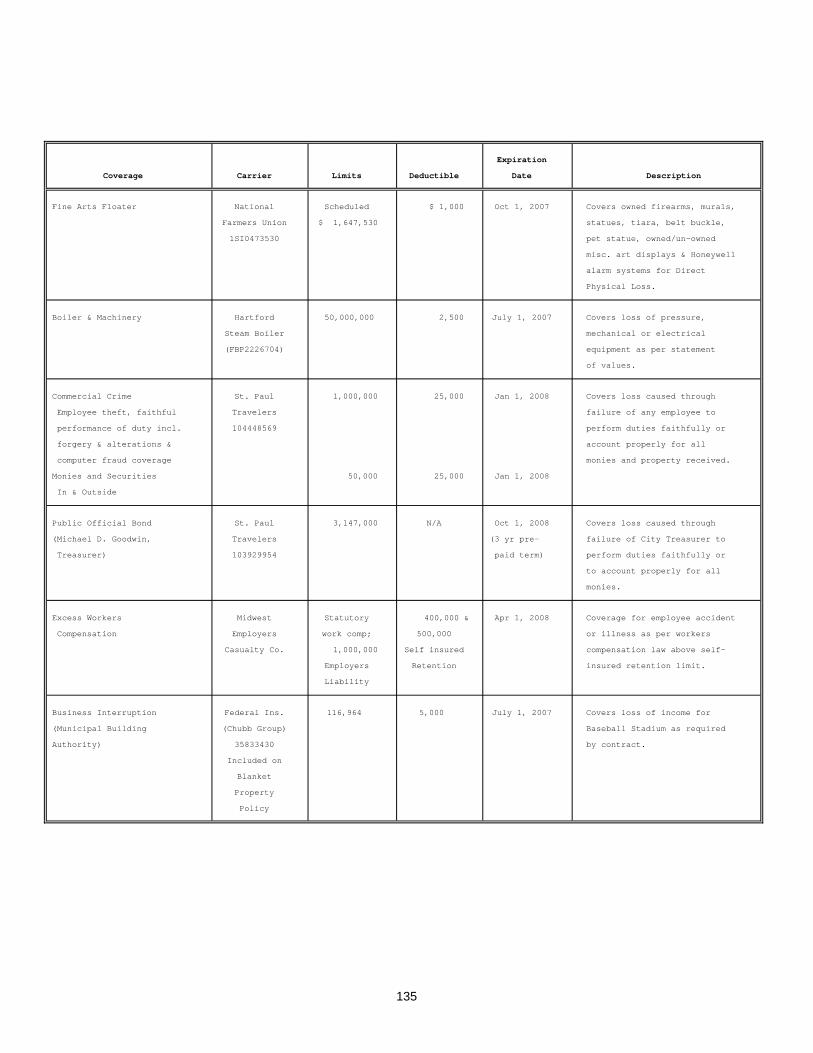
Expiration
Coverage Carrier Limits Deductible Date Description
Fine Arts Floater National Scheduled $ 1,000 Oct 1, 2007 Covers owned firearms, murals,
Farmers Union 1,647,530$ statues, tiara, belt buckle,
1SI0473530 pet statue, owned/un-owned
misc. art displays & Honeywell
alarm systems for Direct
Physical Loss.
Boiler & Machinery Hartford 50,000,000 2,500 July 1, 2007 Covers loss of pressure,
Steam Boiler mechanical or electrical
(FBP2226704) equipment as per statement
of values.
Commercial Crime St. Paul 1,000,000 25,000 Jan 1, 2008 Covers loss caused through
Employee theft, faithful Travelers failure of any employee to
performance of duty incl. 104448569 perform duties faithfully or
forgery & alterations & account properly for all
computer fraud coverage monies and property received.
Monies and Securities 50,000 25,000 Jan 1, 2008
In & Outside
Public Official Bond St. Paul 3,147,000 N/A Oct 1, 2008 Covers loss caused through
(Michael D. Goodwin, Travelers (3 yr pre- failure of City Treasurer to
Treasurer) 103929954 paid term) perform duties faithfully or
to account properly for all
monies.
Excess Workers Midwest Statutory 400,000 & Apr 1, 2008 Coverage for employee accident
Compensation Employers work comp; 500,000 or illness as per workers
Casualty Co. 1,000,000 Self insured compensation law above self-
Employers Retention insured retention limit.
Liability
Business Interruption Federal Ins. 116,964 5,000 July 1, 2007 Covers loss of income for
(Municipal Building (Chubb Group) Baseball Stadium as required
Authority) 35833430 by contract.
Included on
Blanket
Property
Policy
135

Ogden CityStaff per 1000 Residents
Last Ten Fiscal Years(UNAUDITED)
Total Full-Time StaffFiscal Authorized per 1000Year Population 1 Employees 2 Residents
1998 68,226 562.5 8.241999 69,262 587 8.482000 69,262 595 8.592001 77,226 590.5 7.652002 79,757 608 7.622003 80,599 601 7.462004 81,416 585 7.192005 82,007 571 6.962006 82,007 578 7.052007 82,843 595 7.18
1 Calendar year estimates prepared by the Ogden City Planning Division (i.e., FY 2007 population is the calendar year 2006estimate). Population from the 1990 census was 63,909. Thepopulation figures have been revised to bring them more in linewith the census. FY 2001 population is from the 2000 census.
2 Total full-time authorized positions as approved by City Councilwhen fiscal year budget is adopted. Authorized positions maybe temporarily vacant.
136
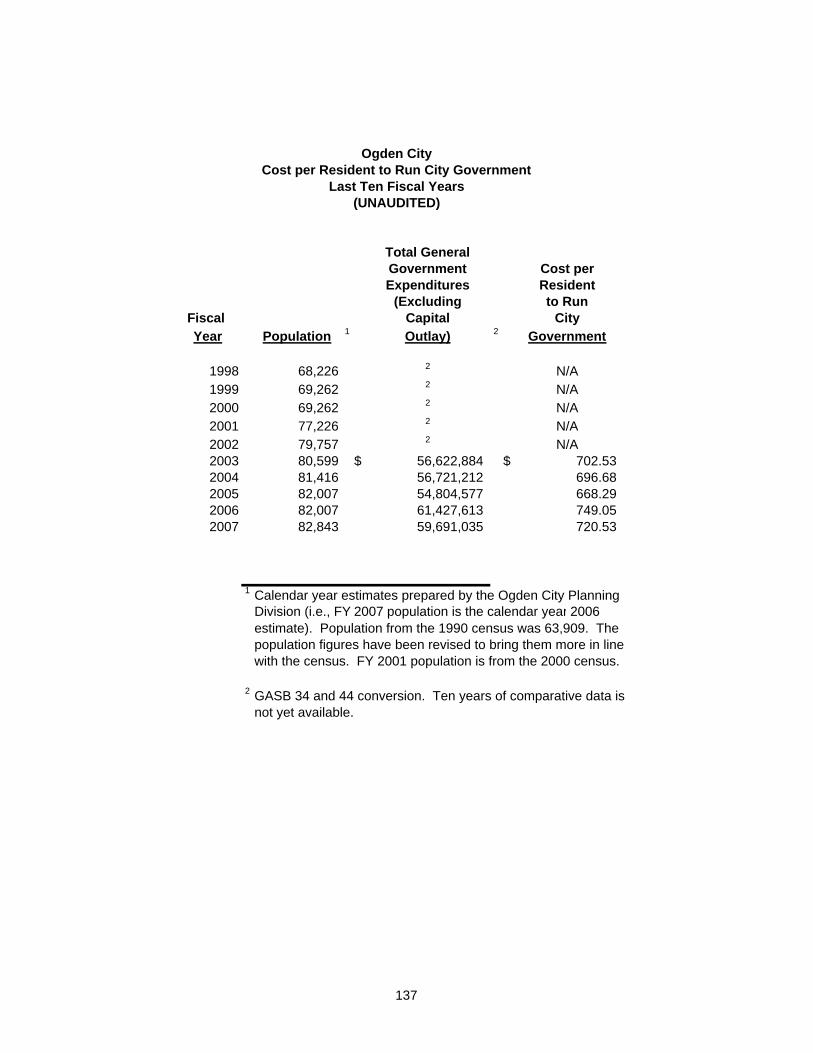
Ogden CityCost per Resident to Run City Government
Last Ten Fiscal Years(UNAUDITED)
Total GeneralGovernment Cost perExpenditures Resident
(Excluding to RunFiscal Capital CityYear Population 1 Outlay) 2 Government
1998 68,226 2 N/A1999 69,262 2 N/A2000 69,262 2 N/A2001 77,226 2 N/A2002 79,757 2 N/A2003 80,599 $ 56,622,884 $ 702.532004 81,416 56,721,212 696.682005 82,007 54,804,577 668.292006 82,007 61,427,613 749.052007 82,843 59,691,035 720.53
1 Calendar year estimates prepared by the Ogden City PlanningDivision (i.e., FY 2007 population is the calendar year 2006estimate). Population from the 1990 census was 63,909. Thepopulation figures have been revised to bring them more in linewith the census. FY 2001 population is from the 2000 census.
2 GASB 34 and 44 conversion. Ten years of comparative data is not yet available.
137