Distributional Shifts of the Orchid Ophrys insectifera L. Due to ...

i
INSTITUTO DE INVESTIGAÇÃO E FORMAÇÃO AVANÇADA
ÉVORA, JUNHO DE 2011
ORIENTAÇÃO: Doutora Helena Cotrim CO-ORIENTAÇÃO: Professor Doutor Manuel Mota
Tese apresentada à Universidade de Évora para obtenção do Grau de Doutor em Biologia
Filipa Isabel de Almeida Monteiro
Post pollination events in a sexually deceptive orchid (Ophrys fusca Link): a
transcriptional and metabolic approach

ii
Contactos:Universidade de Évora
Instituto de Investigação e Formação Avançada - IIFAPalácio do Vimioso | Largo Marquês de Marialva, Apart. 94
7002-554 Évora | PortugalTel: (+351) 266 706 581Fax: (+351) 266 744 677
email: [email protected]

iii
O trabalho apresentado nesta dissertação foi realizado na Unidade de Biologia
Molecular e Biotecnologia de Plantas/BioFIG, no Instituto de Ciência Aplicada e
Tecnologia, Faculdade de Ciências/UL, sob orientação da Doutora Helena Cotrim,
Investigadora Auxiliar do Jardim Botânico do Museu Nacional de História Natural/UL e
co-orientação do Professor Doutor Manuel Mota, Professor Auxiliar com Agregação
(Departamento de Biologia, UE). Parte do trabalho foi realizada em colaboração com
o Professor Doutor Florian Schiestl (Institute for Systematics Botany, University of Zurich,
Suíça).
O presente trabalho foi financiado pela Fundação para a Ciência e
Tecnologia/ Ministério da Ciência, Tecnologia e Ensino Superior, através da bolsa de
Doutoramento SFRH/BD/30152/2006.
O Trabalho realizado inclui resultados que constam nas seguintes publicações
presentes e futuras, resultantes de colaborações com vários investigadores:
Monteiro F, Sebastiana M, Figueiredo A, Sousa L, Cotrim HC and Pais MS. (2012) “Post
pollination events in a sexually deceptive orchid (Ophrys fusca Link): a transcriptional
approach” (Functional & Integrative Genomics, under revision)
Figueiredo A, Monteiro F, Fortes AM, Sousa L, Rex M, Töpfer R, Zyprian E and Pais MS
(2012) “Cultivar-specific kinetics of gene induction during downy mildew early infection
in grapevine" Functional & Integrative Genomics, DOI 10.1007/s10142-012-0261-8.
Cotrim HC*, Monteiro FA*, Sousa ES, Fay MF, Chase MW and Pais MS (2009) "Isolation
and characterization of novel polymorphic nuclear microsatellite markers from Ophrys
fusca (Orchidaceae) and cross-species amplification" Conservation Genetics 10: 739-
742. (* authors contributed equally to this work)
Monteiro F, Figueiredo A, Sebastiana M, Sousa L and Pais MS. “Validation of gene
expression data obtained from amplified RNA” (in prep)
Monteiro F, Sebastiana M, Figueiredo A, Cotrim HC, Pais MS and Schiestl FP. “Towards
the elucidation of sexual deception in Ophrys genus: an O’mics integrative contribute”
(in prep)
Cotrim HC, Monteiro FA, Sousa E and Pais MS. “Species boundaries in sympatric species
of the Portuguese Ophrys section Pseudophrys (Ophrys fusca, O. lutea and O.
omegaifera groups)” (in prep)

iv
AOS MEUS PAIS E AO FILIPE

v
AGRADECIMENTOS
A realização desta Dissertação só foi possível graças ao contributo, de forma directa
ou indirecta, de várias pessoas e instituições, às quais gostaria de dedicar algumas
palavras de agradecimento pela oportunidade de aprendizagem e crescimento
científico/pessoal proporcionados.
À Doutora Helena Cotrim que sempre me apoiou no decorrer de todo o trabalho com
amizade e encorajamento. Obrigado pela motivação, bem como a confiança
depositada no decorrer do desenvolvimento do trabalho. Ao Professor Doutor Manuel
Mota, todo o apoio e disponibilidade demonstrados, fazendo parecer Évora tão perto
de Lisboa. Muito obrigado.
À Professora Doutora Maria Salomé Pais, que me aceitou de braços abertos no seu
laboratório para realizar este trabalho e que sempre me motivou para o estudo das
orquídeas. Agradeço o seu incansável apoio, ensinamentos, discussões de ideias
fundamentais para o desenvolvimento deste trabalho, bem como a confiança
depositada para a realização do mesmo.
Ao Professor Doutor Florian Schiestl (Institute for Systematics Botany, University of Zurich,
Switzerland), que prontamente me aceitou para desenvolver parte do trabalho no seu
laboratório, bem como todo o acompanhamento na compreensão e interpretação
dos dados de GC-MS.
À Doutora Mónica Sebastiana, pela disponibilidade incansável no desenvolvimento do
estudo de transcritómica, pelos ensinamentos preciosos e conselhos imensuráveis que
permitiram a concretização do trabalho. Obrigado pela amizade e todo o apoio ao
longo do trabalho.
À Doutora Lisete Sousa, por todo o apoio, disponibilidade e ajuda no tratamento
estatístico dos dados de microarrays, real-time PCR e de GC-MS.
À Andreia, agradeço todo o apoio, amizade e ajuda no decorrer do trabalho.
Obrigado pela tua disponibilidade em tudo.
À Mané, por toda a amizade e apoio constantes ao longo deste trabalho, bem como
à leitura criteriosa de parte da tese.
vi
À Sílvia Ferreira, pela amizade e apoio durante o todo o desenvolvimento do trabalho.
Obrigado por me apontares diferentes visões da ciência.
Ao Aladje, Fernando, Margarida, Patrícia, Pedro, Sofia, Susana e Vanessa, por todo o
apoio, boa disposição, amizade e compreensão incontestáveis demonstrados. Muito
obrigado a todos.
Ao Edward Connor, por todo o apoio técnico prestado no decorrer das análises de
GC-MS. Obrigado pela boa-disposição e apoio.
Ao Philipp Schlüter, Shuqing Xu, Alok Gupta, Paul Page, Nicolas Vereecken, pela
amizade e boa-disposição durante a minha estadia em Zurique.
À Vanessa, Susana, Sofia, Fernando e Mónica pela incansável disponibilidade no
decorrer do trabalho de campo. Sem vocês não tinha conseguido. Vanessa, obrigado
pelas tuas enérgicas ideias em todo o processo de criação das caixas para as plantas.
À Sandra, pela amizade, apoio e conversas sempre motivadoras ao longo da nossa
vida. À Margarida e Melissa, pela boa-disposição, encorajamento e por me mostrarem
que, mesmo longe, a amizade é inquebrável.
À Rosa e José Maria Serrano, pelo apoio, amizade e compreensão ao longo dos anos.
Ao Putchi e ao Swymmer, os cães da minha vida, sempre bem-dispostos e prontos
para me alegrarem.
À minha avó Ilda, por sempre me transmitir a sua alegria de viver e boa disposição.
Aos meus PAIS, pelo incansável apoio, carinho, amizade e compreensão em todos os
momentos da minha vida. Obrigado por me transmitirem tudo o que sou hoje.
Ao Miguel, meu irmão, pela constante amizade, apoio, compreensão e
encorajamento.
Ao FILIPE, por todo o seu amor, carinho, compreensão, optimismo, alegria de viver que
sempre me transmitiste ao longo dos anos que estamos juntos. Tudo é mais fácil e
simples a teu lado. Obrigado por me apoiares incondicionalmente e me mostrares que
a vida é uma alegria e aventura constantes.

vii
TÍTULO: MECANISMOS DE PÓS-POLINIZAÇÃO EM OPHRYS FUSCA LINK
(ORCHIDACEAE): ABORDAGENS TRANSCRITÓMICA E
METABOLÓMICA
RESUMO A presente dissertação pretende contribuir para o aumento do conhecimento numa
área específica da polinização em orquídeas, designada como polinização deceptiva
(sexual deception) usando a espécie Ophrys fusca como modelo. Tendo por base 100
labelos de 100 plantas diferentes, colhidas no seu habitat natural, recorreu-se a
técnicas de transcritómica e metabolómica com o objectivo de (1) analisar a
expressão génica por microarrays de cDNA após a polinização; (2) proceder à
caracterização metabólica por cromatografia gasosa e espectrometria de massa
(GC-MS). Os resultados obtidos permitiram contribuir para a compreensão dos
mecanismos de polinização por sexual deception, nomeadamente no que respeita às
características do labelo (ex. pigmentação, emissão de compostos), dos processos de
senescência ou da biologia floral das orquídeas. A construção de um chip de cDNA
para O. fusca permitirá realizar hibridações com outras espécies de Ophrys,
possibilitando a determinação do grau de conservação dos mecanismos genéticos na
polinização por sexual deception.
PALAVRAS-CHAVE: polinização deceptiva, pseudocópula, Ophrys, expressão
génica, senescência das pétalas, metabolismo secundário, n- alcanos, n- alcenos,
orquídeas.

viii
TITLE: POST POLLINATION EVENTS IN A SEXUALLY DECEPTIVE ORCHID
(OPHRYS FUSCA LINK): A TRANSCRIPTIONAL AND A METABOLIC
APPROACH.
ABSTRACT
This work aims at contributing to the knowledge on orchid pollination biology,
through the study of the peculiar pollination mechanism of Ophrys fusca by sexual
deception. In this mechanism, Ophrys labellum mimics the female sex pheromones
thereby deceiving male pollinators that attempt to copulate with the orchid labellum.
Labellum transcriptome analysis by a custom-made cDNA microarrays allowed to verify
gene expression modulation of post pollination changes. Processes involved in labellum
morphology, petal senescence and pollination biology were adressed. A metabolic
profiling by gas-chromatography mass- spectrometry was focused on compounds
involved in Ophrys-pollinator crosstalk, in order to determine their dynamics after
pollination. By means of both transcriptional and metabolic analysis, the work here
presented gives an important contribution towards the understanding of orchid
pollination biology by deceit. The custom-made cDNA chip may be useful for
performing cross-species hybridization to track differences on transcripts modulation
thereby disclosing the genetic basis underlying sexual deception.
KEYWORDS: sexual deception, pollination, Ophrys, microarrays, petal senescence,
secondary metabolism, n- alkanes, n- alkenes, orchids.

ix
RESUMO
A família das orquídeas (Orchidaceae) inclui mais de 22 000 espécies,
representando cerca de 10% das plantas com flor. A sua extraordinária diversidade
floral reflecte a importância das relações planta-polinizador na evolução das
orquídeas, sendo as diferentes estratégias de polinização consideradas como uma das
razões para a diversificação e especiação na família. Os mecanismos de polinização
em orquídeas sempre intrigaram os cientistas, incluindo Darwin. Uma das estratégias
mais fascinantes na biologia destas plantas é a capacidade de polinização
deceptiva, ocorrendo em cerca de 1/3 das espécies. A presença de uma pétala
modificada, o labelo, tendo como função principal atrair insectos polinizadores, é
igualmente uma das características mais distintivas das orquídeas. Os mecanismos de
polinização deceptiva mais comuns incluem a imitação de flores que apresentam
néctar (food deception), ocorrendo em 38 géneros; e a imitação de insectos-fêmea
(sexual deception), abrangendo 18 géneros. O género Ophrys sempre foi considerado
um modelo para estudo de polinização deceptiva, nomeadamente do caso de flores
sexualmente deceptivas (sexual deception). As flores deste género emitem
substâncias químicas idênticas às feromonas libertadas pelas fêmeas sexualmente
receptivas dos insectos polinizadores, bem como apresentam características
morfológicas (ex: forma, cor, pilosidade) que mimetizam o corpo dos insectos-fêmea.
Os estudos desenvolvidos em polinização de orquídeas têm sido desenvolvidos nas
áreas da biologia celular, micromorfologia, genética populacional, análise química e
na determinação funcional de determinados genes, bem como em estudos
bioquímicos e fisiológicos. Contudo, para a compreensão global de um processo são
necessárias técnicas que permitam obter dados a larga escala. Este trabalho
pretende constituir um contributo para o conhecimento dos mecanismos regulados
pela polinização em orquídeas. Para tal, uma espécie de orquídea selvagem
abundante em Portugal, Ophrys fusca Link, foi usada como modelo de estudo do
mecanismo de polinização deceptiva (sexual deception). Para atingir o presente
objectivo, foram aplicadas duas técnicas diferentes: a análise da expressão génica
por microarrays de cDNA e a caracterização metabólica por cromatografia gasosa e
espectrometria de massa (GC-MS). O labelo foi seleccionado como foco do estudo,
dada a sua importância na emissão de compostos importantes na comunicação com
o insecto polinizador e no processo geral de polinização em orquídeas. A amostragem
foi efectuada em 100 labelos de 100 plantas diferentes no seu habitat natural, e
seleccionaram-se dois tempos de estudo: 2 dias após a polinização (DAP) e 4 DAP.

x
A análise do labelo por microrrays de cDNA permitiu verificar a modulação da
expressão génica após a polinização. Com este estudo de larga escala conseguiu-se
verificar que aos 2 DAP, o evento de polinização é reconhecido como uma resposta a
um stress e aos 4 DAP, detectaram-se genes que indicam a mobilização de nutrientes
bem como uma nova síntese proteica, necessária para a progressão específica da
senescência do labelo. A polinização despoleta processos de proteólise, mobilização
de nutrientes como o fosfato, carbono e azoto, e desactiva mecanismos
energeticamente dispendiosos, como a fotossíntese e fotorespiração bem como as
principais vias metabólicas que permitem manter a vitalidade do labelo. Os transcritos
identificados revelam processos importantes do metabolismo secundário envolvidos
em características do labelo (ex. pigmentação, emissão de compostos), em proteólise
a larga escala (ex. proteases cisteínicas) e dirigida (ex. fosfatases e quinases), stress e
defesa, além de vias associadas à mobilização de nutrientes. Inicialmente, a expressão
génica de diversos transcritos descritos em situações de stress e de patogenicidade
(ex. GST, proteínas Lea5, metalotioneínas tipos 2 e 3, quitinases, proteínas PR, proteases
cisteínicas, RNases) indicam que a modulação da transcrição é regulada por vias não
específicas de reconhecimento do evento de polinização, semelhantes a uma
situação de stresse abiótico e/ou biótico. Contudo, aos 4 DAP, verificou-se a
transcrição de genes associados à síntese proteica, indicando a activação de um
novo processo de tradução de proteínas específicas que irão dirigir o labelo para a
morte celular irreversível.
A análise do perfil metabólico dos extractos dos labelos foi focada em
compostos da cutícula, especificamente alcanos e alcenos, descritos como
responsáveis por despoletar o comportamento de pseudocópula dos machos
polinizadores. Os resultados demonstram que, após a polinização, a quantidade total
dos compostos não diminui, estando de acordo com resultados anteriores observados
em Ophrys sphegodes. Esta observação poderá dever-se à função que estes
compostos desempenham, nomeadamente como parte integrante das camadas das
ceras prevenindo a desidratação.
A análise do labelo após a polinização por microarrays permitiu a identificação
de transcritos, nomeadamente duas sequências de stearoil ACP desaturase (SAD),
envolvidos nas vias biossintéticas dos compostos da cutícula, importantes na
interacção Ophrys-polinizador. A subexpressão destes transcritos em conjugação com
a manutenção da produção do odor após a polinização indica que a correlação
entre os níveis de expressão dos genes com os seus produtos de síntese não pode ser
directamente efectuada. O estudo do labelo após a polinização por técnicas de
proteómica irá permitirá a detecção das enzimas bem como alterações pós tradução

xi
importantes na regulação das proteínas. Esta abordagem irá possibilitar a
compreensão da regulação das proteínas após o evento de polinização.
O presente estudo permitiu obter uma visão geral no labelo dos mecanismos
regulados pela polinização, contribuindo para a compreensão da polinização por
sexual deception recorrendo a técnicas de Ó’micas. A análise do labelo através de
técnicas de transcritómica e metabolómica após a polinização permitiu dar um
importante contributo para a compreensão dos processos de senescência,
características do labelo (ex. pigmentação, emissão de compostos), bem como da
biologia floral das orquídeas. Além disso, a construção de um chip de cDNA construído
especificamente para a orquídea em estudo irá permitir a realização de hibridações
com outras espécies do mesmo género, possibilitando o estudo da conservação dos
mecanismos genéticos na regulação dos eventos pós-polinização de orquídeas com
flores sexualmente deceptivas.
xii
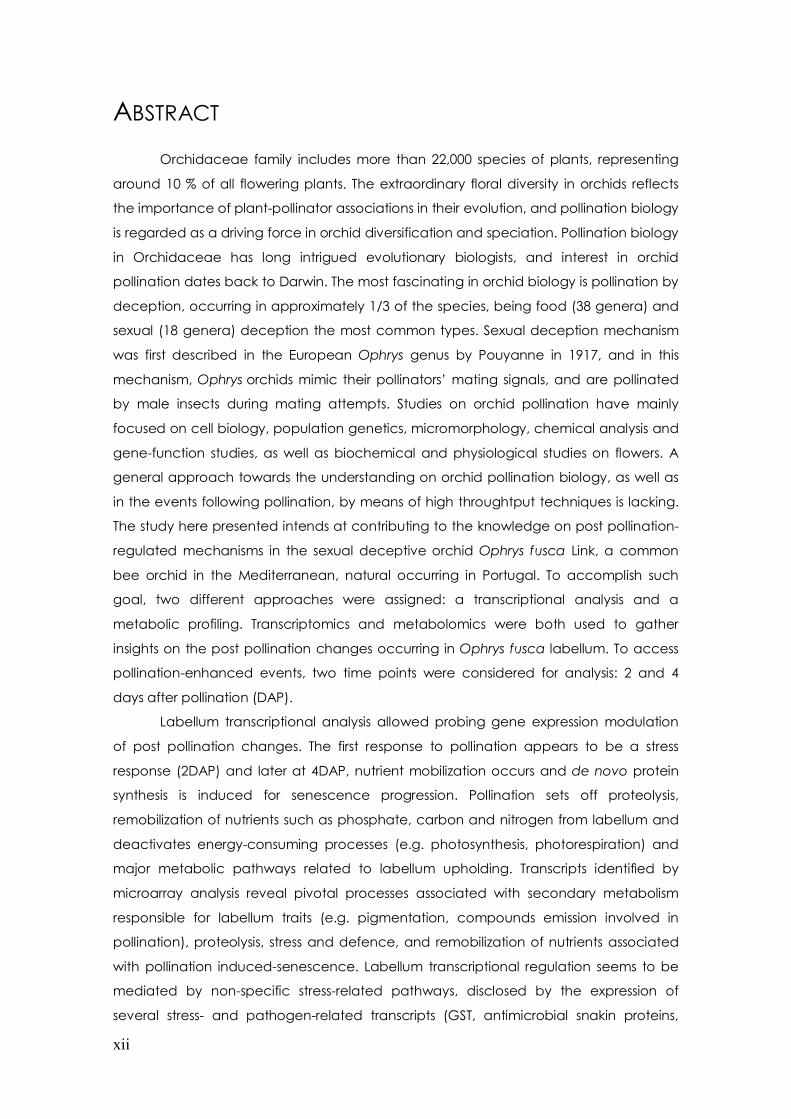
ABSTRACT
Orchidaceae family includes more than 22,000 species of plants, representing
around 10 % of all flowering plants. The extraordinary floral diversity in orchids reflects
the importance of plant-pollinator associations in their evolution, and pollination biology
is regarded as a driving force in orchid diversification and speciation. Pollination biology
in Orchidaceae has long intrigued evolutionary biologists, and interest in orchid
pollination dates back to Darwin. The most fascinating in orchid biology is pollination by
deception, occurring in approximately 1/3 of the species, being food (38 genera) and
sexual (18 genera) deception the most common types. Sexual deception mechanism
was first described in the European Ophrys genus by Pouyanne in 1917, and in this
mechanism, Ophrys orchids mimic their pollinators’ mating signals, and are pollinated
by male insects during mating attempts. Studies on orchid pollination have mainly
focused on cell biology, population genetics, micromorphology, chemical analysis and
gene-function studies, as well as biochemical and physiological studies on flowers. A
general approach towards the understanding on orchid pollination biology, as well as
in the events following pollination, by means of high throughtput techniques is lacking.
The study here presented intends at contributing to the knowledge on post pollination-
regulated mechanisms in the sexual deceptive orchid Ophrys fusca Link, a common
bee orchid in the Mediterranean, natural occurring in Portugal. To accomplish such
goal, two different approaches were assigned: a transcriptional analysis and a
metabolic profiling. Transcriptomics and metabolomics were both used to gather
insights on the post pollination changes occurring in Ophrys fusca labellum. To access
pollination-enhanced events, two time points were considered for analysis: 2 and 4
days after pollination (DAP).
Labellum transcriptional analysis allowed probing gene expression modulation
of post pollination changes. The first response to pollination appears to be a stress
response (2DAP) and later at 4DAP, nutrient mobilization occurs and de novo protein
synthesis is induced for senescence progression. Pollination sets off proteolysis,
remobilization of nutrients such as phosphate, carbon and nitrogen from labellum and
deactivates energy-consuming processes (e.g. photosynthesis, photorespiration) and
major metabolic pathways related to labellum upholding. Transcripts identified by
microarray analysis reveal pivotal processes associated with secondary metabolism
responsible for labellum traits (e.g. pigmentation, compounds emission involved in
pollination), proteolysis, stress and defence, and remobilization of nutrients associated
with pollination induced-senescence. Labellum transcriptional regulation seems to be
mediated by non-specific stress-related pathways, disclosed by the expression of
several stress- and pathogen-related transcripts (GST, antimicrobial snakin proteins,

xiii
Lea5 protein, metallothioneins types 2 and 3, chitinases, PR protein, Cys proteases,
RNases), until the newly protein synthesis is achieved for senescence progression.
Metabolic profiling in labella extracts was focused on cuticular compounds
(alkanes and alkenes), known to trigger the pseudocopulatory behaviour of male
pollinators. Results show that post pollination machinery does not rely on an abrupt
decrease of odour production, which is in agreement with previous reports on other
Ophrys species, probably due to compounds function as part of the desiccation-
preventing wax layers. Through labellum gene expression analysis, transcripts related to
biosynthetic pathways of cuticular compounds, involved in Ophrys pollinator attraction,
were identified: stearoyl ACP desaturases (SAD). Down regulation of these transcripts
along with maintenance of odour production may indicate that correlation between
RNA level and its by-products cannot be directly made. Thus, a labellum post
pollination proteomics approach will allow tracking enzymes responsible for alkenes’
production, thereby giving a more comprehensive walkthrough of their regulation on
pollination event. Such observations could adjoin some awareness on the genetic basis
of pollinator attraction.
By combining both transcriptional and metabolic profiling analysis to study post
pollination events in a sexually deceptive orchid, the work here presented gives an
important contribution for the understanding of this peculiar pollination system.

xiv
ABBREVIATIONS
aa-dUTP-Aminoallyl-deoxyuridine
triphosphate
ADP- Adenosine diphosphate
aRNA- Antisense RNA
ATP- Adenosine triphosphate
BLAST- Basic local alignment sequence tool
bp- base pairs
cDNA- Complementary DNA
CE- capillary electrophoresis
cfu- colony-forming unit
CoA- coenzyme A
cRNA- complementary RNA
Cy3- Cyanine 3
Cy5- Cyanine 5
DAP- days after pollination
dCTP- Deoxycytidine triphosphate
ddH2O- double distilled water
DEPC- Diethyl pyrocarbonate
DIG- Digoxigenin
DMSO- Dimethyl sulfoxide
DNA- Deoxyribonucleic acid
DNase- deoxyribonuclease
dNTP- Deoxyribonucleotide triphosphate
dscDNA- double stranded complementary
DNA
DTT- Dithiothreitol
dTTP- Deoxythymidine triphosphate
dUTP- deoxyuridine triphosphate
EC- Enzyme commission number
EGTA- Ethylene glycol tetraacetic acid
EST- Expression sequence tag
FA- fatty acids
FC- Fold change
FDR- False discovery rate
Fe-S- iron-sulphur
FRET- Fluorescence resonance energy
transfer
GC-MS- Gas- chromatography mass-
spectrometry
GEO- Gene Expression Omnibus
GEPAS- Gene Expression Pattern Analysis
Suite
GO- Gene ontology
HPLC- high- performance liquid
chromatography
iFRET- Induced fluorescence resonance
energy transfer
IVT- in vitro transcription
kb- kilobase
LB - Luria-Bertani
LOWESS- locally weighted scatterplot
smoothing
LSD- Fisher's least significant difference
Ma- million years ago
MAD- mean absolute deviation
MIAME- Minimum Information About a
Microarray Experiment
MIPS- Munich Information Center for Protein
Sequences
MIQE- Minimum Information for Publication
mRNA- Messenger RNA
MS- Mass spectrometry
NADP- Nicotinamide adenine dinucleotide
phosphate
NADPH- reduced NADP+
NCBI- National Centre for Biotechnology
Information
nt- nucleotide
of Quantitative Real-Time PCR Experiments
PCA- principal component analysis
PCD- programmed cell death
PCR- Polymerase chain reaction
Pi- phosphate inorganic
PSI- Photosystem I
PSII- Photosystem II
xv
PTFE- Oolytetrafluoroethylene
PUFA- polyunsaturated fatty acids
PVP-40- Polyvinylpyrrolidone molecular
weight 40,000
qPCR- Quantitative real-time PCR
RankProd- Rank products method
RNA- Ribonucleic acid
Rnase- Ribonuclease
rNTP- Ribonucleotide triphosphate
rRNA- Ribosomal RNA
RT- reverse transcription
SAG- senescence-associated gene
SDS- Sodium dodecyl sulfate
SEM- standard error of the mean
SNP- Single nucleotide polymorphism
SSC- Saline sodium citrate
sscDNA- single-stranded complementary
cDNA
STDEV- standard deviation
TBE- Tris/Borate/EDTA
UniRef- UniProt Reference Clusters
UV- Ultraviolet
nm- Nanometre
ºC- Celsius degrees
Measurement Units
g- Microgram
L- Microliter
m- Micrometres
A230- Absorbance at 230 nm
A260- Absorbance at 260 nm
A280- Absorbance at 280 nm
atm- atmosphere
g- Gram
M- Molar
mg- Milligram
min- Minute
mJ- MilliJoule
mL- Millilitre
mm- Millimetres
mM- Millimolar
mZ- mass-to-charge ratio
rpm- Rotation per minute
s- Second
S- Svedberg unit
U- Unit
v- volume
w- Weight
xg- centrifugal acceleration relative to
Earth's gravity
ηg- Nanogram
ρM- Picomolar
ρmol- Picomole

xvi
“In my examination of Orchids, hardly any fact has struck me so
much as the endless diversities of structure- the prodigality of
resources- for gaining the very same end, namely, the fertilization of
one flower by pollen from another plant. This fact is to a large extent
intelligible on the principle of natural selection.”
Charles Darwin
“On the Various Contrivances by which British and Foreign Orchids are
Fertilised by Insects”, 1866
“And the day came when the risk to remain tight in a bud was more
painful than the risk it took to blossom.”
Anaϊs Nin
“Living on Purpose: Straight Answers to Universal Questions”, 2000

xvii
CONTENTS CHAPTER 1 GENERAL INTRODUCTION TO ORCHID POLLINATION: OPHRYS
FUSCA A SEXUALLY DECEPTIVE FLOWER ....................................... 1
1.1. Family Orchidaceae ...................................................................................... 1
1.2. Ophrys L. .......................................................................................................... 3 1.2.1. Distribution and habitat ............................................................................................... 3
1.2.2. Taxonomy ....................................................................................................................... 4
1.2.3. Ophrys fusca Link .......................................................................................................... 7
1.3. Orchid reproductive biology: focus on flower morphology ....................... 8 1.3.1 Ophrys flower morphology ........................................................................................ 10
1.4. Pollination syndromes: definition and consequences ............................... 11 1.4.1. Orchid’s pollination biology ...................................................................................... 12
1.4.3. Pollination by sexual deception............................................................................... 15
1.4.5. Ophrys fusca as a case study .................................................................................. 17
1.5. Pollination: a molecular perspective .......................................................... 18 1.5.1. Developmental events regulated by pollination ................................................. 18
1.5.2. Petal senescence: a controlled subset of events ................................................ 18
1.5.3. Pollination studies in orchids ..................................................................................... 20
1.5.4. Ethylene and pollination: a close relation ............................................................. 21
1.6. Aims and scope of the work ........................................................................ 22
1.7. Thesis outline ................................................................................................. 23
References ........................................................................................................... 23
CHAPTER 2 LABELLUM TRANSCRIPTOME AFTER POLLINATION ....................... 35
2.1. Abstract ......................................................................................................... 35
2.2. Introduction ................................................................................................... 36 2.2.1. Microarrays: outline and cDNA technology. ........................................................ 36
2.2.2. Microarrays: labelling technologies and overcome RNA limited amounts .... 39
2.2.2.1. Direct labelling ..................................................................................................... 40
2.2.2.2. Indirect labelling .................................................................................................. 41
2.2.2.3. Overcome of RNA limiting amounts ................................................................ 42
2.2.2.3.1. Signal amplification methods ................................................................... 42
2.2.2.3.2. RNA amplification ....................................................................................... 42
2.2.3. cDNA microarrays: advantages and limitations .................................................. 44
2.2.4. Microarrays analysis in natural populations ........................................................... 44

xviii
2.2.5. Quantitative real-time PCR (qPCR) ......................................................................... 45
2.3. Material and methods .................................................................................. 48 2.3.1. Experimental design ................................................................................................... 48
2.3.1.1. Labella collection for cDNA microarray studies ........................................... 49
2.3.2. Total RNA extraction .................................................................................................. 49
2.3.3. mRNA purification ....................................................................................................... 50
2.3.4. Construction of cDNA libraries based in Gateway® technology ...................... 51
2.3.5. Library characterization............................................................................................. 51
2.3.6. Sequencing and sequence analysis ....................................................................... 51
2.3.7. cDNA microarray construction ................................................................................ 52
2.3.7.1. Clone selection and purification ..................................................................... 52
2.3.7.2. Glass slides preparation ..................................................................................... 53
2.3.7.3. Printing parameters ............................................................................................ 53
2.3.7.4. Microarray printing.............................................................................................. 53
2.3.7.5. Gel Star® staining ................................................................................................ 54
2.3.8. RNA labelling and microarray hybridization .......................................................... 54
2.3.8.1. RNA amplification ............................................................................................... 54
2.3.8.2. Target labelling .................................................................................................... 55
2.3.8.3. Pre-hybridization washes ................................................................................... 55
2.3.8.4. Hybridization conditions ..................................................................................... 55
2.3.8.5. Post- hybridization washes ................................................................................. 56
2.3.9. Image and data collection ...................................................................................... 56
2.3.10. Statistical analysis...................................................................................................... 57
2.3.10.1. Data normalization and processing .............................................................. 57
2.3.10.2. Identification of differentially expressed genes .......................................... 58
2.3.11. Sequencing and sequence analysis..................................................................... 58
2.3.12. Quantitative real time PCR (qPCR) ....................................................................... 58
2.3.12.1. Sample preparation ......................................................................................... 58
2.3.12.2. Oligonucleotide design ................................................................................... 59
2.3.12.3. Relative quantification through qPCR: experimental settings ................. 60
2.4. Results and discussion .................................................................................. 61 2.4.1. Characterization of cDNA libraries .......................................................................... 61
2.4.2. cDNA microarrays....................................................................................................... 66
2.4.2.1. Ophrys fusca chip construction and hybridizations ..................................... 66
2.4.2.2. Differentially expressed genes during pollination ......................................... 69
2.4.2.2.1. Metabolism ................................................................................................... 78
2.4.2.2.1.1. Phenylpropanoid metabolism........................................................... 78
2.4.2.2.1.1.1. Coumarate-CoA ligase (4CL).................................................... 81
2.4.2.2.1.1.2. Chalcone synthase (CHS) and bibenzyl synthase (BBS) ...... 82
2.4.2.2.1.1.3. Flavonoid 3’ monooxygenase/hydroxilase (F3’H) and UDP- Glucuronosyltransferase .................................................................................... 83
2.4.2.2.1.1.4. Stilbene synthase (STS) ................................................................ 85
2.4.2.2.1.1.5. Polyphenol oxidase (PPO) .......................................................... 86

xix
2.4.2.2.1.2. Alkaloid metabolism............................................................................ 87
2.4.2.2.1.2.1. Tyrosine/ L-Dopa decarboxylase (TYDC)................................. 87
2.4.2.2.1.2.2. Salutaridinol 7-O-acetyltransferase .......................................... 88
2.4.2.2.1.3. Sugar metabolism ................................................................................ 89
2.4.2.2.1.3.1. β-amylase ...................................................................................... 89
2.4.2.2.1.3.2. β-glucosidase ................................................................................ 90
2.4.2.2.1.3.3. Myo-inositol 1-phosphate synthase .......................................... 91
2.4.2.2.1.4. Lipid metabolism .................................................................................. 92
2.4.2.2.1.4.1. Wax biosynthesis........................................................................... 92
2.4.2.2.1.4.1.1. Eceriferum 1 (CER1) ............................................................. 93
2.4.2.2.1.4.2. Fatty acids metabolism............................................................... 94
2.4.2.2.1.4.2.1. Desaturases: omega-6 fatty acid desaturase (FAD2) and stearoyl ACP-desaturase (SAD) ........................................................... 94
2.4.2.2.1.4.2.2. 3-ketoacyl-CoA thiolase (KAT) ........................................... 96
2.4.2.2.1.4.3. Sphingolipids metabolism ........................................................... 97
2.4.2.2.1.4.3.1. Glucosylceramidase and neutral ceramidase .............. 97
2.4.2.2.1.4.4. Sterol metabolism ........................................................................ 98
2.4.2.2.1.5. Nitrogen, sulfur and selenium metabolism ..................................... 99
2.4.2.2.1.6. Amino acid metabolism ................................................................... 100
2.4.2.2.1.6.1. Ornithine-δ-aminotransferase .................................................. 100
2.4.2.2.1.6.2. Methylcrotonyl-CoA carboxylase α-subunit ......................... 102
2.4.2.2.1.8. Nucleotide/nucleoside/nucleobase metabolism ....................... 102
2.4.2.2.2. Cell fate ....................................................................................................... 103
2.4.2.2.2.1. Cell aging and program cell death (PCD)................................... 103
2.4.2.2.2.2. Cell enlargement ............................................................................... 105
2.4.2.2.3. Cell rescue, defense and virulence ....................................................... 106
2.4.2.2.4. Transcription factors and regulation of transcription ......................... 111
2.4.2.2.5. Protein synthesis ......................................................................................... 114
2.4.2.2.6. Biogenesis of cellular components ........................................................ 115
2.4.2.2.7. Protein fate ................................................................................................. 117
2.4.2.2.8. Cellular transport, transport facilities and transport routes ............... 120
2.4.2.2.9. Cellular communication/signal transduction mechanisms .............. 121
2.4.2.2.10. Energy ........................................................................................................ 122
2.4.2.3. cDNA microarray validation through qPCR ................................................ 127
2.5. Conclusions ................................................................................................. 128
References ......................................................................................................... 132

xx
CHAPTER 3 METABOLIC PROFILING OF OPHRYS FUSCA LABELLUM AFTER
POLLINATION ........................................................................ 175
3.1. Abstract ....................................................................................................... 175
3.2. Introduction ................................................................................................. 176 3.2.1. Floral scent as a powerful communication channel ......................................... 176
3.2.2. Sexual deception in Ophrys.................................................................................... 177
3.2.2.1. Flower cues and pollinator’s behaviour ....................................................... 177
3.2.2.2. Sexual deception mechanism: a chemical perspective ........................ 179
3.2.2.3. Floral odour in reproductive isolation ............................................................ 181
3.2.3. Metabolomics: a diverse functional tool ............................................................. 182
3.2.3.1. Metabolic profiling ............................................................................................ 183
3.2.3.2. Gas chromatography- mass spectrometry (GC-MS) ................................. 183
3.3. Material and methods ................................................................................ 185 3.3.1. Sample collection ..................................................................................................... 185
3.3.2. Chemical analysis ..................................................................................................... 185
3.3.2.1. Quantitative analysis ........................................................................................ 185
3.3.2.2. Qualitative scent analysis ................................................................................ 186
3.3.3. Compound identification ....................................................................................... 186
3.3.4. Statistical analysis ...................................................................................................... 187
3.4. Results and discussion ................................................................................ 188 3.4.1. Descriptive statistics on chemical analysis .......................................................... 188
3.4.2. Chemical changes in Ophrys fusca labellum after pollination ....................... 192
3.4.2.1. Discriminating conditions under study .......................................................... 192
3.4.2.2. Odour and pollination event .......................................................................... 193
a) Alkanes .................................................................................................................... 195
b) Alkenes .................................................................................................................... 196
c) Post pollination mechanism in Ophrys fusca ................................................... 197
3.4.3. Considerations on Ophrys fusca pollinator species ........................................... 198
3.5. Conclusions ................................................................................................. 200
References ......................................................................................................... 201
CHAPTER 4 FINAL REMARKS .................................................................... 207
References ......................................................................................................... 210

xxi
APPENDICES
APPENDIX I. HABITAT 6210 DESCRIPTION .................................................................212
APPENDIX II. PRE- AND POST- NORMALIZATION BOX-PLOTS OF ALL HYBRIDIZATION-CHIPS PERFORMED FOR 2DAP AND 4DAP, BY THE PRINT TIP LOWESS METHOD ....................213
APPENDIX III. QPCR PRIMER EFFICIENCY PLOTS ........................................................214
APPENDIX IV. MELTING CURVES OF STANDARD CURVES OBTAINED IN QPCR EXPERIMENTS ..........................................................................................................................216
APPENDIX V. MEDIAN FOLD CHANGE CALCULATED FOR QPCR AND MICROARRAY DATASETS ............................................................................................................219
APPENDIX VI. MEAN ABSOLUTE AMOUNTS OF OPHRYS FUSCA LABELLA EXTRACTS FOR ALKANES (TABLE I) AND ALKENES (TABLE II) ..............................................................220
APPENDIX VII. MANN-WHITNEY U TEST FOR TOTAL AMOUNTS OF OPHRYS FUSCA LABELLUM EXTRACTS ............................................................................................................222
APPENDIX VIII. STATISCALLY SIGNIFICANT COMPOUNDS ON OPHRYS FUSCA LABELLA EXTRACTS, AFTER LSD POST-HOC TEST ......................................................................223
APPENDIX IX. MEAN RELATIVE AMOUNTS OF ALKANES (A) AND ALKENES (B) IN OPHRYS FUSCA LABELLA EXTRACTS IN UNPOLLINATED FLOWERS AT 2 DAP AND 4DAP ...............224

xxii
LIST OF FIGURES Figure 1.1- Family Orchidaceae diversity. ....................................................................................1
Figure 1.2- Phylogenetic relationships in Orchidaceae. ............................................................2
Figure 1.3- Distribution of Ophrys in Europe ..................................................................................3
Figure 1.4- Mediterranean Basin as a Biodiversity Hotspot ........................................................3
Figure 1.5- Ophrys habitats. .............................................................................................................4
Figure 1.6- Ophrys species phylogenetic relationships, based on morphological characters and on molecular methods .......................................................................................5
Figure 1.7- Abdominal and cephalic pseudocopulation examples. .....................................6
Figure 1.8- Ophrys fusca subspecies reported for Portugal. .....................................................8
Figure 1.9- Orchid perianth structure .............................................................................................9
Figure 1.10- General overview on Orchidaceae flower morphology ................................. 10
Figure 1.11- Gynostemium side view on Ophrys apifera ........................................................ 11
Figure 1.12- Self-pollination mechanisms in Orchidaceae..................................................... 13
Figure 1.13- Example of Batesian floral mimicry ....................................................................... 14
Figure 1.14- Sexual deception in Ophrys speculum ................................................................ 15
Figure 1.15- Sexual deception in two Ophrys species (flower morphology and insect model species) ............................................................................................................................... 16
Figure 2.1- Overview of steps in cDNA microarray experiments. .......................................... 37
Figure 2.2- Direct fluorescent-dye incorporation scheme ..................................................... 40
Figure 2.3 - Indirect fluorescent-dye incorporation scheme ................................................. 41
Figure 2.4- antisense RNA (aRNA) amplification based in Eberwine procedure or in vitro transcription (IVT) ............................................................................................................................ 43
Figure 2.5- Experimental design scheme ................................................................................... 48
Figure 2.6- Ophrys fusca plants covered by the net disposables in the field ..................... 49
Figure 2.7- Gel electrophoresis of mRNA from unpollinated and pollinated Ophrys fusca labella ............................................................................................................................................... 61
Figure 2.8- Gel electrophoresis of PCR products resulted from a 96- well reaction. ......... 66
Figure 2.9- Gel Star® staining from a printing test. .................................................................... 67
Figure 2.10 - Gel Star® staining from the final printing scheme. ............................................ 67
Figure 2.11- Gel electrophoresis of aRNA .................................................................................. 68
Figure 2.12- Ophrys fusca cDNA microarray (partial image) ................................................ 69
Figure 2.13- Differentially expressed genes in Ophrys fusca labellum at 2 DAP and 4 DAP, grouped into functional categories ........................................................................................... 71
Figure 2.14- Photosynthetic electron-flow machinery ......................................................... 123
Figure 2.15- Relative expressions comparision of 7 transcripts from cDNA microarray and qPCR results. .................................................................................................................................. 128
Figure 3.1- Behavioural stages of a male hymenopteran attracted by an Ophrys flower ......................................................................................................................................................... 178
Figure 3.2- Gas chromatography- Mass spectrometry system ............................................ 184

xxiii
Figure 3.3- Error bar of mean relative amounts for compounds in unpollinated and pollinated Ophrys fusca labellum extracts, 2 and 4 days after pollination. ..................... 188
Figure 3.4- Chromatogram of an Ophrys fusca labellum extract focused on the cuticular hydrocarbons retrieved by GC-MS analysis ............................................................................ 189
Figure 3.5- Scatter plot of Ophrys fusca labella extracts of unpollinated and pollinated flowers at 2 DAP by means of a principal component analysis (PCA). ............................ 192
Figure 3.6- Scatter plot of Ophrys fusca labella extracts of unpollinated and pollinated flowers at 4 DAP by means of a principal component analysis (PCA) ............................. 193
Figure 3.7- Mean total absolute amounts of Ophrys fusca labella extracts at 2 DAP and 4 DAP .............................................................................................................................................. 194
Figure 3.8- Mean relative amounts of n-alkanes in Ophrys fusca labella extracts at 2 DAP ......................................................................................................................................................... 195
Figure 3.9- Mean relative amounts of n-alkenes in Ophrys fusca labella extracts at 2 DAP ......................................................................................................................................................... 196
Figure 3.10- Mean relative amounts of n-alkenes in Ophrys fusca labella extracts at 4 DAP. ................................................................................................................................................ 197
Figure 3.11- Relative proportions of alkenes with double bonds at positions 7, 9 and 12 present in labella extracts in three Ophrys species. .............................................................. 199
LIST OF TABLES
Table 1.1. Major functional categories of SAGs expressed in Arabidopsis thaliana leaf senescence transcriptome........................................................................................................... 19
Table 2.1. Oligonucleotide sequence, annealing (Ta) and melting (Tm) temperatures and amplicon size (bp) used for transcript quantification reactions by qPCR.................. 59
Table 2.2. cDNA libraries titer determination ............................................................................ 62
Table 2.3. Clone’s digestion results for both unpollinated and pollinated libraries constructed, with insert size information and recombinant‘s percentage. ....................... 62
Table 2.4. Randomly sequenced cDNA clones from unpollinated cDNA library of Ophrys fusca labella. ................................................................................................................................... 64
Table 2.5. Randomly sequenced cDNA clones from pollinated cDNA library of Ophrys fusca labella. ................................................................................................................................... 65
Table 2.6. Differentially expressed genes identified from Ophrys fusca labellum transcriptome at both 2 days after pollination (DAP) and 4 DAP ........................................ 72
Table 3.1. Mean relative amount with mean standard error of n-alkanes at 2 DAP and 4DAP. .............................................................................................................................................. 190
Table 3.2. Mean relative amount with mean standard error of n-alkenes at 2 DAP and 4 DAP. ................................................................................................................................................ 191


Chapter 1- General introduction to orchid pollination: Ophrys fusca a sexual deceptive flower
1
Chapter 1
GENERAL INTRODUCTION TO ORCHID POLLINATION: OPHRYS FUSCA A SEXUALLY DECEPTIVE FLOWER
1.1. Family Orchidaceae
Orchidaceae Adans (1763) is a morphologically diverse and widespread family
of monocots, with estimated 880 genera and more than 25 000 species (Swarts and
Dixon, 2009; WCSP, 2010). After Asteraceae, Orchidaceae is the second-largest family
of flowering plants, and one of the most recent species-rich plant family undergoing a
major evolutionary radiation (Bateman et al., 2003). Orchids are distributed over all
continents, except Antarctida, being particularly numerous and diverse as epiphytes in
wet tropics (Fay and Chase, 2009). Orchidaceae is divided into five subfamilies:
Apostasioideae, which embraces the most primitive orchids (e.g. Apostasia, Fig. 1.1A);
Cypripedioideae (e.g. Cypripedium, Fig. 1.1B); Epidendroideae, the largest subfamily
(e.g. Dendrobium, Phalaenopsis, Cymbidium- Fig. 1.1C); Vanilloideae (e.g. Vanilla, Fig.
1.1D) and Orchidoideae (e.g. Orchis, Chiloglottis- Fig. 1.1E and Ophrys- Fig. 1.1F)
(Dressler, 1981; Cameron et al., 1999).
Figure 1.1- Family Orchidaceae diversity: (A) Apostasia wallichii, (B) Cypripedium acaule, (C) Cymbidium William Weaver 'Atlantis', (D) Vanilla planifolia, (E) Chiloglottis formicifera and (F) Ophrys fusca.
© Fuukiran
© cmausteller
© Greg Allikas
© EF de Vogel © Thomas GBarnes
© FMonteiro
D F
A B
E
C

Chapter 1- General introduction to orchid pollination: Ophrys fusca a sexual deceptive flower
2
In the last 10 years, a rapid advance towards the understanding of orchid
relationships has been largely addressed mainly by the contribution of molecular
phylogenetic studies (Chase et al., 1994; Cameron et al., 1999; Freudenstein et al.,
2004). Establishing relationships within Orchidaceae family has been a challenge. The
most recent phylogenetic study (Freudenstein et al., 2004) reveals relationships within
the family (Fig. 1.2) highlighting the subfamily Orchidoideae diversity, in which Ophrys is
included.
Figure 1.2- Phylogenetic relationships in Orchidaceae. Jackknife support percentages are shown (.50%). Adapted (Freudenstein et al., 2004).
Only recently with the description of the first reliable fossil in 2007 (Ramirez et al.,
2007) and two new orchid fossils in 2009 (Conran et al., 2009), a direct calibration of
orchid phylogeny pointed out for a common ancestor in the Late Cretaceous (~77
Outgroups
Apostasioideae
Vanilloideae
Cypripedioideae
Orchidoideae
Epidendroideae

Chapter 1- General introduction to orchid pollination: Ophrys fusca a sexual deceptive flower
3
million years ago, Ma) (Gustafsson et al., 2010), these data revolutionizing the
understanding of orchids phylogeny. It was estimated that the crown age of the five
subfamilies may in general be younger (~1-8 Ma) than supposed before (Gustafsson et
al., 2010). This finding encompasses a high evolutionary rate reflecting its successful
fitness and adaptation during a short time period.
1.2. Ophrys L.
1.2.1. Distribution and habitat
Ophrys occurs mainly around the Mediterranean Basin (Fig. 1.3). Additionally,
distribution includes parts of North of Africa (Morocco, Algeria, Libya and Tunisia),
Cyprus, Middle East, Caucasus and Anatolia, as well as parts of the Near Orient
(Caspian Sea and Persian Gulf) (Soliva et al., 2001; Pedersen and Faurholdt, 2007).
Figure 1.3- Distribution of Ophrys in Europe. Adapted (Pedersen and Faurholdt, 2007).
Based on the diversity of species and the frequent occurrence of hybrids,
Nelson (1962) considered that the center of Ophrys origin is located in the eastern
Mediterranean region. In fact, Ophrys species are mainly adapted to the diversity of
Mediterranean Basin habitats. Mediterranean Basin (Fig. 1.4) is recognised as a
biodiversity hotspot (Myers et al., 2000) and therefore is considered a spotlight for
conservation.
Figure 1.4- Mediterranean Basin as a Biodiversity Hotspot. In (Center for applied Biodiversity Science, Conventional International).

Chapter 1- General introduction to orchid pollination: Ophrys fusca a sexual deceptive flower
4
In this area, flora diversity is outstanding with 15,000 to 25,000 species, 60% of
which are unique (Myers et al., 2000). Orchids often arise in species rich-habitats that
are predominantly affected by anthropogenic activities, such as marshes and
calcareous grasslands (Cozzolino et al., 2003). The dry to semi-dry calcareous
grasslands habitat (6210- Appendix I for further information- BFN, 2006), which is widely
distributed around Europe, enclose important populations of orchid species in which
Ophrys species are included (Fig. 1.5). This habitat is considered a priority for
conservation by the European Commission Directive 92/43/EEC on the conservation of
natural habitats and of wild fauna and flora, which generally aims to assure the long-
term survival of Europe's most valuable and threatened species and habitats.
Figure 1.5- Ophrys habitats (A) In Greece. Adapted (Pedersen and Faurholdt, 2007). (B) In Portugal. Picture by FMonteiro.
1.2.2. Taxonomy
Ophrys was first described by Carl von Linné (1753). Based on morphological
characters (Dressler, 1993; Bernardos et al., 2005- Fig. 1.6A) and on molecular methods
(Pridgeon et al., 1997; Cameron et al., 1999; Soliva et al., 2001- Fig. 1.6B), the Euro-
Mediterranean genus Ophrys is regarded as a monophyletic group, placed in the
subfamily Orchidoideae, tribe Orchideae, subtribe Orchidinae. The monophyly of the
genus contrasts with its species relationships, generally poorly resolved as a result of
controversial and morphologically-based classifications. Determining the species
boundaries within the genus will have profound consequences for conservation. Efforts on systematics and taxonomy have been made to clarify the species
number and identity in Ophrys, but no consensus has arisen among specialists.
Regarding Iberian Peninsula, the number of recognized Ophrys species varies among
authors, mainly due to different taxonomic treatments. While Delforge (2005) recognizes
A B

Chapter 1- General introduction to orchid pollination: Ophrys fusca a sexual deceptive flower
5
118 orchid species, Amich and co-workers (2007) considered 122 orchid species, which
accounts for 23 % of endemic species present in the Iberian Peninsula.
Figure 1.6- Ophrys species phylogenetic relationships, based on morphological characters (A, adapted (Bernardos et al., 2005)) and on molecular methods (B, adapted (Soliva et al., 2001)). Black box highlights Ophrys monophyly. Bootstrap with values ˃ 50% are shown in branches.
Studies in sexually deceptive orchids such as Ophrys, present a challenge due
to taxonomic boundaries at species-level which is particularly difficult from morphology
alone (Mant et al., 2005a). This is demonstrated by the degree of synonyms found in
Ophrys species (Delforge, 2005), without mentioning the large number of assumed
hybrids. Delforge (2006), based on the morphological diversity, prompted to recognize
251 species in the widely used Mediterranean orchid Flora, while Pedersen and
Faurholdt (2007) only recognized 19 species, 65 subspecies and five stabilized hybrid
aggregates. Godfery (1928) proposed a different division into two sections,
Pseudophrys and Ophrys, based on labellum micromorphology (i.e. morphological
features of the stigmatic cavity, structure of the labellum and speculum configuration,
for more detail see Devillers and Devillers-Terschuren, 1994), and on pseucopulation
A
B

Chapter 1- General introduction to orchid pollination: Ophrys fusca a sexual deceptive flower
6
type (abdominal or cephalic). The section Pseudophrys consists on the O. fusca-O.
lutea- O. iricolor- O. omegaifera lineage. In this lineage, the pollinating insects remove
pollinia with the abdomen, a process called abdominal pseudocopulation (Fig. 1.7A
and 1.7B). When pollinia are attached to the pollinators’ heads, as it occurs in the
lineages belonging to Ophrys section (which includes species such as O. speculum and
O. sphegodes), the process is known as cephalic pseudocopulation (Fig. 1.7C and
1.7D),). The different locations of pollinia on the insect body generate an efficient
barrier to gene flow between members of these two sections.
Figure 1.7- Abdominal pseudocopulation of (A) Ophrys lupercalis and (B) Ophrys lutea by Andrena sp. males. Cephalic pseudocopulation in (C) mirror orchid Ophrys speculum pollinated by Campsoscolia ciliata and (D) Eucera elongatula male on Ophrys scolopax.
Despite the obvious morphological differences, low interspecific genetic
differentiation at both ITS (Internal Transcribed Spacer) and trnL-F loci hindered a
completely resolved phylogeny of Ophrys. In fact, Ophrys species are interfertile, and a
few or any post-zygotic reproductive barriers exist between species (Cozzolino and
Scopece, 2008). Despite low interspecific taxonomic resolution has been obtained from
recent molecular studies, several phylogenetic reconstructions based on plastidial and
nuclear ribosomal markers independently showed that section Pseudophrys is
monophyletic (Soliva et al., 2001; Bateman et al., 2003; Devey et al., 2008).
Methods for identifying Ophrys species rely mainly on morphological traits and
its specific pollinator species. This limitation makes Ophrys a difficult group of plants to
© NJ Vereecken © Artur Serrano
© B.David-Testanière © NJ Vereecken
A
B
C
D

Chapter 1- General introduction to orchid pollination: Ophrys fusca a sexual deceptive flower
7
conduct evolutionary studies. Véla and co-workers (2007) successfully separated
closely related Ophrys species by analyzing chemical signatures obtained from Gas-
chromatography studies of labellum extracts (i.e. chemotaxonomy). Ophrys has been
highly and controversially split based on morphological characters but more efficient
molecular and morphometric tools are needed for delimiting species and determining
their relationships (Bateman et al., 2003).
1.2.3. Ophrys fusca Link
Ophrys fusca Link (J.Bot. (Schrader) 2(4): 324; 1799), known as the dark bee
orchid, is a species native to the Mediterranean. In Europe a great number of narrow
geographic species and subspecies exist and the pronounced morphological diversity
in Mediterranean basin area is especially remarkable in the O. fusca complex
(Pedersen and Faurholdt, 2007). A great microdiversity of floral details characterizing
relatively homogeneous swarms, separated or not in space or time, may happen in O.
fusca complex, as reported recently (Amich et al., 2009). Ophrys fusca was originally
used to describe only one of the whole Mediterranean Basin species. Yet, detailed
investigations revealed that in fact O. fusca described at least 29 species, which are
poorly distinguished by morphology (Delforge, 2005; Stökl et al., 2005). Within O. fusca,
morphological variation mainly occurs in five groups recognized as subspecies by
Pedersen and Faurholdt (2007): O. fusca subsp. fusca; O. fusca subsp. iricolor (Desf.) K.
Richt.; O. fusca subsp. blitopertha (Paulus and Gack) Faurholdt and Pedersen; O. fusca
subsp. cinereophila (Paulus and Gack) Faurholdt and O. fusca subsp. pallida (Raf.)
Camus. For Portugal, only subspecies fusca (Fig. 1.8A) and iricolor (Fig. 1.8B) are
described (Pedersen and Faurholdt, 2007).
Ophrys fusca subsp. fusca flowers from January to June, in most areas with a
peak in March-April. The main differences for distinguishing subsp. fusca from subsp.
iricolor relies on lip morphology: the first has a lip slightly to strongly curved, with or
without a narrow yellow margin, whereas the second has a lip wine-red underneath
mirror shining and sharply delimited (following Pedersen and Faurholdt, 2007).

Chapter 1- General introduction to orchid pollination: Ophrys fusca a sexual deceptive flower
8
© FMonteiro © ARóis
© Pedersen © Pedersen
B A
D C
Figure 1.8 - Ophrys fusca subspecies reported for Portugal: fusca (A,B) and iricolor (C,D).
1.3. Orchid reproductive biology: focus on flower morphology
The most spectacular evolution in orchids is revealed by their peculiar
reproductive biology. In most flowering plants, such as the model plants Arabidopsis
and rice, the ovary matures during flower development and contains ovules, fully
developed prior to pollination, that become ready for fertilization, generally occurring
soon after pollination (Yu and Goh, 2001; Tsai et al., 2008). In orchids, ovules post
pollination development and maturation, early development and maturation of pollen
grains, packaged as pollinia (pollen grains bound together by viscin threads in masses
for effective pollination) and the release of thousands or millions of immature embryos
(globular stage) in mature capsules, are features characteristic of the remarkable
fitness of orchid diversity and adaptation (Raghavan and Goh, 1994; Nadeau et al.,
1996; Yu and Goh, 2001). These various strategies unique to orchids contributed to the
success of the family. Other innovation assisting adaptation to pollinators is flower
morphology which has been attributed as the main feature for adaptive radiation in

Chapter 1- General introduction to orchid pollination: Ophrys fusca a sexual deceptive flower
9
Orchidaceae (Gavrilets and Losos, 2009). Orchid flowers have a zygomorphic structure,
including three types of perianth organs: three outer tepals (T1–T3; often termed sepals)
in the first floral whorl, and two lateral inner tepals (t1, t2; petals) as well as a median
inner tepal (t3) called the lip (or labellum) in the second floral whorl (Fig. 1.9, reviewed
in Mondragón-Palomino and Theiβen, 2007, 2009).
Figure 1.9- Orchid perianth structure. (A) Scheme on the typical structure of an orchid flower perianth and its correspondence on a Dendrobium cariniferum flower (B). Adapted (Mondragón- Palomino and Theiβen, 2007).
The labellum is a morphologically complex median inner perianth segment
(petal), that in most orchids acts as the primary visual attractant and landing platform
for pollinators, most commonly insects (Bateman and Rudall, 2006).
An interesting feature of the development of most orchid flowers is resupination (180ºC developmental rotation in floral orientation). Resupination (from the Latin
resupinus, which means facing upward) is the phenomenon describing the orientation
of zygomorphic flowers during development so that the median petal (lip) obtains the
lowermost position in the mature flower (Ames, 1938; Fischer et al., 2007). Resupination is
generally assumed to expose the lip as a landing platform and nectar guide, by
emphasizing colours and patterns, to attract pollinators and facilitate pollination (Ernst
and Arditti, 1994; Mondragón-Palomino and Theiβen, 2009). Also, recently it was shown
that resupination occurred after the flower became zygomorphyfic (Mondragón-
Palomino and Theiβen, 2009), and this assumption is well exemplified by
Apostasioideae, the most primitive orchid subfamily, in which resupination occurs in the
zygomorphic genus Neuwiedia but not in the actinomorphic Apostasia (Kocyan and
Endress, 2001). There are several main characteristics that a flower must have to be
called an orchid, such as: a zygomorphic flower, a gynostemium or column, a rostellum,
pollinia, and labellum (lip). The male (stamens with pollen bearing anther) and the
female parts (pistil consisting of an ovary and stigma) are united into a single structure
called column or gynostemium, which is the centre of the flower (Ballings, 2006). The
B A

Chapter 1- General introduction to orchid pollination: Ophrys fusca a sexual deceptive flower
10
rostellum (Fig.1.10, side and front views) consists of a tissue projection near the end of
the gynostemium which separates the stigma from the pollinia (single pollinium),
thereby preventing self-pollination (Withner et al., 1974; Cozzolino and Widmer, 2005).
Figure 1.10- General overview on Orchidaceae flower morphology. Adapted (Lang, 1980). The anther which has two pollen sacs (thecae) is situated at the top of the
column. Pollen may be released as single grains, like in most other plants, in the
subfamilies Apostasioideae, Cypripedioideae and Vanilloideae; whereas in the other
subfamilies, which comprise the great majority of orchids, the anther carries two pollinia
(Ballings, 2006). A pollinium is a waxy mass of pollen grains held together by the glue-like
alkaloid viscin. Each pollinium is connected to a filament which can take the form of a
caudicle (terrestrial orchids, e.g. Dactylorhiza or Ophrys) or a stipe (in most epiphytic
orchids, e.g. Vanda). Caudicles or stipes holds the pollinia to the viscidium (adhesive
discs= retinacles, Martin, 2005), a sticky pad which sticks the pollinia to the pollinators
body (Fig. 1.10, pollinia).
Orchid species have evolved mainly through the development of pollinator
specificity as opposite to the incompatibility mechanisms occurring in other plants
(Jersáková et al., 2006). Such specificity is achieved by a combination of floral scent
and morphological characteristics (such as flower pilosity and/or colour).
1.3.1 Ophrys flower morphology
In all Ophrys species, the labellum specially functions to draw pollinator’s
attention, despite differing in shape, colour, scent and texture from the other parts of
the flower. Also, tepals may display different colours (e.g. green- O.fusca fusca; pink-
O.tenthredinifera). Gynostemium of Ophrys species have the same basic structure: the
anther is situated above the stigma (Fig.1.11). Each anther cells contain a pollinarium,
consisting of pollinium, a caudicle and a viscidium. In turn, each viscidium is enclosed in
a separate bursicle (Fig. 1.11), which is a modification of the rostellum forming a purse-

Chapter 1- General introduction to orchid pollination: Ophrys fusca a sexual deceptive flower
11
like structure (Claessens and Kleynen, 2002; Martin, 2005). Also, caudicles of most
Ophrys species are inflexible in the anther cells, awaiting the insects which will transport
them to another flower (Claessens and Kleynen, 2002). Exceptions have been shown for
O.apifera (see Orchid’s pollination biology section) and O. helenae (Paulus, 2006).
Figure 1.11- Gynostemium side view on Ophrys apifera. Adapted (Claessens and Kleynen, 2002).
1.4. Pollination syndromes: definition and consequences
Plant-pollinator interactions consist on a form of mutualism in which each
member benefits (Labandeira et al., 1994; Fenster et al., 2004). Pollination syndromes
can be considered as morphologically convergent adaptive trends exhibited by floral
features (Fenster et al., 2004; Hoballah et al., 2007). Passive pollination syndromes
include anemopily (wind) and hydrophily (water) pollination, while zoophily (animal) is
considered an active syndrome. In general, pollination by insects and other animals is
more efficient than wind-dependent pollination. Melittophily (bee pollination) is the
most important pollination type (Gullan and Cranston, 2000). In the bee-mediated
pollination the following events are characteristic: flower only opens when bees are
active and the pollen collecting apparatus is ready and specific for each plant-
pollinator association (Fenster et al., 2004). However, in some cases, the pollinator has
specialized features that make it especially suitable for pollinating a particular plant,
which is a common trait encountered in orchids pollination. Such specialized traits in
plants and in pollinators are considered as a process of coevolution (Kareiva, 1999;
Hodges and Whittall, 2008). Instead, some authors account for the occurrence of a
unilateral evolution in orchids, without influencing pollinator’s evolution, rather than a
coevolution (Schiestl, 2005; Jersáková et al., 2006 and references therein). This unilateral

Chapter 1- General introduction to orchid pollination: Ophrys fusca a sexual deceptive flower
12
evolution is based on the following assumptions: orchids appeared when most key
pollinator groups had already evolved and established complex mutualisms with
flowering plants (Labandeira et al., 1994; Jermy, 1999). Also, orchids are often
deceptive (see below) and therefore unlikely to influence the evolution of pollinator
traits (Jersáková et al., 2006). Occasionally, such specialization is so high that the plant
depends on a single pollinator species (e.g. Ophrys). This particular characteristic of
pollinator constancy, which may be responsible for the isolation of small populations, is
especially prevalent in Orchidaceae (Gullan and Cranston, 2000; Coyne and Orr,
2004).
1.4.1. Orchid’s pollination biology
The highly specialised mechanisms by which orchids are pollinated have been
the subject of many studies (Nilsson, 1988; Johnson et al., 1998; Schiestl et al., 2003;
Vereecken and Schiestl, 2008; Micheneau et al., 2009), initiated by Darwin (1862)
observations in the book: The Various Contrivances by which Orchids are Pollinated by
Insects, one of the most well-known study. Since Darwin, orchid pollination complexity
and diversity have been an intriguing matter for biologists. Orchids have developed
highly specialized pollination systems and the chance of being pollinated is often
scarce. This is the reason why flowers usually remain receptive for very long periods and
why most orchids deliver pollen in a single mass, so that each time pollination succeeds
thousands of ovules can be fertilized (Paling, 2007). Most orchids depend on insects for
cross-pollination since their pollen lies in sticky masses preventing pollen dispersal by
wind.
In general, the mechanism of orchid pollination relies on the attraction of the
insect through visual (flower colour and/or shape), chemical (scent emission) and/or
rewardable (nectar) cues displayed by the flower. Usually, the insect perceives a
nutritional offer as a reward, although in some cases (e.g. genera Ophrys, Chiloglottis) it
may be a sexual mate (Grant, 1994). When the insect lands on the labellum, it attempts
to feed on the flowers nectar or to mate with the flower. In orchids that produce
pollinia, pollination usually happens as follows: when the pollinator visits the flower, it
touches a viscidium, which promptly sticks to its body, generally on the head or
abdomen. While leaving the flower, it pulls the pollinium out of the anther, as it is
connected to the viscidium by the caudicle or stipe. The caudicle then bends and the
pollinium is moved forwards and downwards. After, when the insect visits a second
flower of the same species, pollinia are aligned below the rostellum and come into
contact with the stigma. As a result, self-pollination is avoided mainly due to the
rostellum, which separates the pollinia from the stigma. Indeed, Darwin (1862) previously

Chapter 1- General introduction to orchid pollination: Ophrys fusca a sexual deceptive flower
13
suggested that self-pollination was inhibited by physical reconfiguration of pollinia,
hypothesis that received recent support (Peter and Johnson, 2006). Yet, some orchids
mainly or totally rely on self-pollination, especially in colder regions where pollinators are
particularly rare. Several floral features are related to self-pollination, namely: in the
absent of pollinators caudicles may dry out and the pollinia fall directly on the stigma
(e.g. Pterygodium vermiferum, Oliver et al., 2008; Ophrys apifera, Fenster and Martén-
Rodríguez, 2007, Fig.1.12A,B); or, the anther may rotate and then enter the stigma
cavity of the flower (as in Holcoglossum amesianum, Liu et al., 2006, Fig. 1.12C).
Figure 1.12. Self-pollination mechanisms in Ophrys apifera (A,B) and Holcoglossum amesianum (C). (A)- Self-pollination in Ophrys apifera; (B)- Drawing by Charles Darwin on Ophrys apifera self-pollination, adapted (Darwin, 1862); (C)- Holcoglossum amesianum 360-degree twist towards self-pollination; steps 1-6 illustrate the arrangement of floral components and movements during the transport of pollen from the anther to the stigma. Adapted (Liu et al., 2006).
Interestingly, the absence of a true rostellum and the impossibility of pollinarium
removal at any time of the flower lifespan explain the obligatory auto-pollination
mechanism on the Jumellea stenophylla orchid species (Micheneau et al., 2008).
Asexual reproduction also occurs in some species of the genera Phalaenopsis,
Dendrobium and Vanda by producing offshoots in one of the nodes along the stem,
known as keiki (Košir et al., 2004). Further, Orchidaceae is known for its enormous
diversity of pollination mechanisms and unusual high occurrence of non-rewarding
flowers, known as deception mechanisms, compared to other plant families (Jersáková
et al., 2006).
© BerndH
A C
B
1 2
3 4
5 6

Chapter 1- General introduction to orchid pollination: Ophrys fusca a sexual deceptive flower
14
1.4.2. Mechanisms of deception in orchids
From 7500 angiosperm species pollinated through a deception mechanism,
approximately 6500 are orchids (Renner, 2006). Pollination through deception (i.e. an
absence of floral rewards for pollinators) is a widespread phenomenon in angiosperm
plants, and in Orchidaceae family is extremely common (Nilsson, 1992; Streinzer et al.,
2009). Jersáková and co-workers (2006) reviewed extensively the deception
mechanisms in orchids, including food and sexual deception, among others. In fact,
food (38 genera) and sexual (18 genera) deception are the most common types of
pollination in orchids by mimicry, occurring in approximately one-third of the species
(Jersáková et al., 2006; Renner, 2006). In food deception, pollination strategy relies on
the general resemblance of a non-rewarding species with the nectar-rewarding
species, by exploiting the instinctive food-searching ability of pollinators (Cozzolino and
Widmer, 2005). A food deception case is illustrated by the Batesian floral mimicry
(reviewed in Roy and Widmer, 1999), in which non-rewarding species strictly resembles
a specific co-occurring rewarding species (e.g. Disa nivea, Anderson et al., 2005; Eulophia cucullata, Peter and Johnson, 2008). A recent evidence of Batesian mimicry
has been reported in the genus Eulophia (Peter and Johnson, 2008), in which orchid is
presumably a Batesian mimic of the sympatric species Sesamum radiatum (Fig. 1.13).
Figure 1.13- Floral detail of Sesamum radiatum (Pedaliaceae) (A) and Eulophia cucullata (Orchidaceae) (B) growing in sympatry, as an example of Batesian floral mimicry. Both species grow and bloom intermixed. Food-deceptive floral mimicry is associated with pollinators that mainly use
colour, rather than scent, as their primary foraging cue (Juillet and Scopece, 2010). On
the other hand, sexually deceptive orchids attract pollinators primarily through
chemical mimicry of female sexual pheromones, thereby deceiving males into
attempted mating with orchid labellum (Schiestl et al., 2000; Schiestl, 2005). Flower
morphological features, i.e. labellum shape, colour and pilosity that mimic pollinator
© NJ Vereecken
A B

Chapter 1- General introduction to orchid pollination: Ophrys fusca a sexual deceptive flower
15
female body-shape, are also important for drawing male’s attention (Schiestl, 2005; Fig.
1.14A,B). This mechanism of mimicry in plants has been titled Pouyannian mimicry in
honour of M. Pouyanne who first described the phenomenon in genus Ophrys
(Pouyanne, 1917 and references therein). During copulation attempt, known as
pseudocopulation (Fig. 1.14C), the pollinia become attached to the male’s body and is
transferred upon visitation to flowers further visited (Pouyanne, 1917; Kullenberg, 1961;
Schiestl, 2005).
Figure 1.14- Sexual deception in Ophrys speculum (mirror bee orchid). (A)- Flower detail; (B) Pollinator species, Campsoscolia ciliata; (C) Pseudocopulation event.
Over long distances, sexually deceptive orchids lure pollinators by foraging
insect sex pheromones, whereas at close range, visual (e.g. labellum colour and/or
shape) and tactile (e.g. labellum pilosity) cues of the female insect are essential
(Schiestl, 2004; Gaskett and Herberstein, 2010). A number of terrestrial orchid species
which are represented in the European genus Ophrys (Schiestl, 2004), South African Disa
(Johnson et al., 1998) and nine Australian genera of the tribe Diurideae, e.g. Cryptostylis
(Schiestl et al., 2004; Gaskett and Herberstein, 2010) and Chiloglottis (Mant et al., 2005b)
reproduce via this deceptive pollination mechanism. Altogether comprise about 400
described species (Schiestl, 2005 and references therein). Recent studies on orchid
pollination, particularly in Ophrys genus, have focused on the mechanisms by which
flowers attract their insect pollinators (Schiestl et al., 2000; Schiestl, 2005; Spaethe et al.,
2007; Vereecken and Schiestl, 2008; Stökl et al., 2008a, b; 2009; Vereecken et al., 2010).
1.4.3. Pollination by sexual deception
In Ophrys, pollination occurs by means of sexual deception which is unique to
Orchidaceae (Nilsson, 1992; Raguso, 2004). In Europe, only the genus Ophrys is
pollinated by this mechanism. This genus encompass a spectacularly diverse set of
species all pollinated by sexual deception, with a few exceptions such as O. apifera
A B C
© Ivo Rodrigues © Artur Serrano © Artur Serrano

Chapter 1- General introduction to orchid pollination: Ophrys fusca a sexual deceptive flower
16
and O. helenae, which display self-pollination in pollinator’s absence (Paulus, 2006). In
sexual deception mechanism, patrolling male bees (Andrenidae, Anthophoridae,
Colletidae, Megachilidae, and Apidae), predatory and parasitic wasps (Sphecidae
and Scoliidae) and occasionally beetles (Scarabaeidae, Kullenberg, 1961; Borg-Karlson,
1990; Paulus and Gack, 1990), attempt to copulate on flowers that mimic mating signals
(shape, colour and scent) of receptive female insects (Fig. 1.15; Kullenberg, 1961;
Schiestl et al., 1999; Schiestl, 2005).
Figure 1.15- Sexual deception in two Ophrys species. From left to right, Anthophora sicheli female and Ophrys fleischmannii; Anthophora dalmatica and Ophrys omegaifera.
Odours are special floral signals crucially involved in sexual mimicry pollination
systems (Borg-Karlson and Tengö, 1986; Borg-Karlson, 1990). Signals mimicked by
orchids, in particular the sex pheromones of the female insects, are usually described as
species-specific, thus most Ophrys species are pollinated by one or a few closely
pollinator species (Borg-Karlson, 1990; Schiestl, 2004). To attract males and elicit mating
behaviour, these flowers produce active components similar to the sex pheromone of
receptive females of the imitated insect species (Streinzer et al., 2009). Chemical
analysis revealed that Ophrys flowers produce complex species-specific mixtures of
more than 100 compounds, mainly saturated and unsaturated hydrocarbons,
aldehydes, alcohols, esters, ketones, and terpenoids present in minor amounts (Borg-
Karlson, 1990). Floral fragrances contain chemical compounds identical to those of the
pheromonal secretions of the respective female insects (Ayasse et al., 2001; Schiestl,
2005; Vereecken and Schiestl, 2008). Due to its high specific attraction mechanism,
flowers of sexually deceptive orchids usually do not possess obvious colour signals,
thereby avoiding fortuitous attraction of unspecific pollinators (Spaethe et al., 2010).
Additionally, Ascensão and co-workers (2005) described in O.fusca and O.lutea labella
a presence of an osmophore (i.e. floral scent glands) at the apical region near the
central notch. This is formed by the entire border and the abaxial surface from the distal
part of the apical region of the labellum together and consists of a secretory papillate
epidermis and two or three subsecretory parenchyma layers. Also, the adaxial
© Hannes F. Paulus

Chapter 1- General introduction to orchid pollination: Ophrys fusca a sexual deceptive flower
17
indumentum of the labellum was considered to provide important tactile and visual
stimulation to the pollinator species (Ascensão et al., 2005).
Since the sex pheromone compounds emitted by the flower attract only males
of the target species, pollen transfer is highly efficient and pollen lost is low (Spaethe et
al., 2010). The finding that O. sphegodes flowers, namely the labellum, produce the
same compounds (namely, 14 compounds comprising mainly alkanes and alkenes) as
the female sex pheromone of its specific pollinator species, Andrena nigroaenea, has
open a major breakthrough on plant-insect association studies (Schiestl et al., 1997,
1999, 2000; Schiestl and Ayasse, 2001). Ophrys genus can be faced as an attractive
and suitable model to study evolutionary processes underlying plant- insect association.
1.4.5. Ophrys fusca as a case study
Species from Ophrys fusca-group are commonly pollinated by Andrena bees
(Schiestl and Ayasse, 2002; Stölk et al., 2008a, b, 2009). Ophrys species are interfertile
and reproductive isolation is achieved by pre-pollination mechanisms, i.e. attraction of
one single pollinator species reproductively isolated from other sympatrically occurring
species. Floral scent variation ultimately will act as a mechanism of reproductive
isolation (Schiestl and Schlüter, 2009). Flowers of Ophrys sphegodes and O. fusca are
known to be both pollinated by Andrena nigroaenea males (Schiestl et al., 2000;
Schiestl and Ayasse, 2002). The pollinia are deposited on the head of the male O.
sphegodes pollinator bee (cephalic pseudocopulation), whereas O. fusca pollinator
males reverse into the flower and receive pollinia on the tip of the abdomen. As a
result, an effective isolation mechanism between species is achieved and loss of
pollinia to heterospecific orchids is minimized (Schiestl et al., 2000). Studies regarding O.
fusca pollination are scarce; yet, its pollinator species are described as being: males of
the bee Andrena nigroaenea (Schiestl and Ayasse 2002) and Colletes cunicularius
(Ophrys fusca in southern Spain, Peakall and Schiestl, 2004). In Portugal, an effective
identification on O. fusca pollinator species is lacking. Also, a huge variation between
O. fusca populations is easily observed, which ultimately difficult determination of its
pollinator species. Several studies performed in O. sphegodes allowed a
comprehensive view on sexual deception mechanism (Schiestl et al., 1997, 2000;
Schiestl and Ayasse, 2001). Schiestl and Ayasse (2001) related the increase of farnesyl
hexanoate production in pollinated flowers as being responsible for guiding pollinator
visitation to unpollinated flowers of the inflorescence. Consequently, it can be
supposed that this phenomenon may occur in other Ophrys species as well. Several
Ophrys species seem to produce different compounds or differences in relative
proportions of the same compounds. For instance, in O. fusca and O. bilunulata,

Chapter 1- General introduction to orchid pollination: Ophrys fusca a sexual deceptive flower
18
Schiestl and Ayasse (2002) showed that only slight differences in the relative proportions
of both alkanes and alkenes triggered the species-specific attraction of pollinators, with
almost all the compounds being produced by both species.
1.5. Pollination: a molecular perspective
1.5.1. Developmental events regulated by pollination
It is well established that compatible pollination activates a series of post
pollination developmental events which contributes to reproduction and ovary growth,
pigmentation changes and petal senescence (O’Neill, 1997). The developmental
events enhanced by pollination prepare the flower for fertilization and embryogenesis,
while promoting floral organs wilting that have completed their function in pollen
dispersal and reception (Zhang and O’Neill, 1993). Developmental processes
associated with this transition include senescence of the perianth, pigmentation
changes, ovary maturation, ovule differentiation, and female gametophyte
development (O’Neill, 1997). In most orchid flowers, pollination (insertion of a pollinium,
rather than pollinia removal) initiates rapid senescence of orchid flowers thereby
reducing their commercial value (Ketsa and Rugkong, 1999; Abdala-Roberts et al.,
2007; Attri et al., 2007; 2008). Mechanisms underlying petal senescence, particularly in
orchids, are still enigmatic.
1.5.2. Petal senescence: a controlled subset of events
Petals provide an excellent model to study senescence since they have a finite
lifespan and once flower is pollinated or is no longer receptive for pollination purposes,
maintenance of this organ is energy expensive (Jones et al., 2005). Senescence is
considered a type of programmed cell-death (PCD), since it involves structural,
biochemical and molecular changes similar to the characteristic PCD traits (Tripathi
and Tuteja, 2007). According to Engelberg-Kulka and co-workers (2006), PCD is defined
by the death of a cell or cells mediated by an intracellular program. Senescence
involves several physiological changes such as loss of water from the senescing tissue,
leakage of ions, transport of metabolites to different tissues; and biochemical changes,
such as generation of Reactive Oxygen Species (ROS), increase in membrane fluidity
and peroxidation, hydrolysis of proteins, nucleic acids, lipids and carbohydrates (Tripathi
and Tuteja, 2007). Previous reports in petal senescence, have revealed a set of genes
up regulated during senescence, generally considered to be stress related, including:

Chapter 1- General introduction to orchid pollination: Ophrys fusca a sexual deceptive flower
19
metallothioneins, abscisic acid (ABA)-responsive genes (Breeze et al., 2004) and
glutathione S-transferases (Meyer et al., 1991; Price et al., 2008). Besides, significant
number of senescence up regulated genes is also pathogenesis-related (Hanfrey et al.,
1996; Thomas et al., 2003). In senescing plant tissues, cysteine proteases, the closest
functional homologue to caspases- animal cysteine proteases- are commonly found
(Buchanan-Wollaston, 1997; Wagstaff et al., 2002). Membrane damage in senescing
tissues occurs essentially by oxidative stress invoked during the process (Attri et al.,
2008). Membrane integrity loss, increases in neutral lipids, sterol to phospholipid ratio,
and in the saturation:unsaturation index of fatty acids are also consequences of the
senescence event (Thompson et al., 1982). In addition, remobilization of nutrients from
senescing flower tissues occurs and is believed to contribute either to ovary or to new
flowers development (Thomas et al., 2003; Hoeberichts et al., 2007; Mea et al., 2007).
Natural and/or induced senescence in leaves is a very well studied process (Lim et al.,
2003; Gepstein, 2004), generally characterized by a decline in photosynthetic capacity,
chlorophyll degradation and leaf yellowing (van Doorn, 2001; Mishina et al., 2007). In
addition to down regulation of photosynthesis related genes, leaf senescence is
characterized by an amplified expression of a multitude of genes (Table 1.1) that are
often referred as SAGs, i.e. senescence-associated genes (Buchanan-Wollaston, 1997;
Guo et al., 2004). These SAGs can be grouped in several functional categories and are
involved in several pathways (Table 1.1).
Table 1.1. Major functional categories of SAGs (senescence-associated genes) expressed in Arabidopsis thaliana leaf senescence transcriptome. Adapted (Gepstein, 2004; Guo et al., 2004).
Functional category Most frequent genes
Macromolecule degradation (breakdown of lipids, proteins, nucleic acids)
Cysteine proteases, ubiquitin-related genes, RING finger proteins, nucleases, lipases/acylhydrolases, phospholipases and proteinases families.
Nutrient recycling (transport of purines, pyrimides, sugars and ions)
Oligopeptide transporters, purine and pyrimidine transporters, and ABC transporters
Defense and cell rescue mechanisms (Abiotic and biotic stresses, oxidative stress)
Metallothioneins, glutathione S-transferase, glutathione peroxidase.
Transcriptional regulation Zinc finger proteins and transcription factors of the WRKY, NAC, AP2, MYB, HB families
Signal transduction (protein phosphorylation/ dephosphorylation)
Receptor-like and calcium-dependent protein kinases, phosphatases and phospholipases.
NAC, no apical meristem (NAM); AP, Apetala proteins.
Chapter 1- General introduction to orchid pollination: Ophrys fusca a sexual deceptive flower
20
During flower senescence, macromolecules are degraded and organelles are
dismantled in order to engage nutrients remobilization to developing tissues (Chapin
and Jones, 2007; Bai et al., 2010; Müller et al., 2010). This process allows plant to recover
carbon, nitrogen, and phosphorus from the petals before corolla abscission (Price et al.,
2008). The last stages of senescence involve loss of nucleic acids (DNA and RNA),
proteins and organelles, which is achieved by activation of several nucleases,
proteases and cell wall modifiers (Tripathi and Tuteja, 2007). The degradation of
macromolecules (namely proteins, nucleic acids, and lipids), decline in photosynthesis,
remobilization of nutrients and the dismantling of cellular organelles are common
features concerning both leaf and petal senescence events (Lim et al., 2003; Price et
al., 2008).
Studies of both leaf and flower senescence have focused almost exclusively on
the identification of senescence-associated genes (reviewed in Buchanan-Wollaston et
al., 2003; van Doorn and Woltering, 2008). These studies suggested that initiation and
progression of senescence program requires new gene transcription and pointed out to
an additional control of senescence at the post transcriptional level (Thomas et al.,
2003; Bai et al., 2010). Signalling and transcriptional networks are regulators of when
and where senescence starts. Execution, control and integration of constitutive
processes require activation/inactivation of cascades which are strongly post
transcriptionally regulated. Recent studies using a proteomic (e.g. two-dimensional gel
electrophoresis, 2-DE) approach showed that proteins with putative function in large-
scale degradation of macromolecules and organelles are activated after pollination,
therefore highlighting their post transcriptional role in Petunia hybrida flower
senescence (Bai et al., 2010). It is therefore conceivable that a complex network of
both transcriptional and post transcriptional regulation is involved in flower senescence,
as suggested for other cellular processes such as cell cycle (Rogers, 2006).
1.5.3. Pollination studies in orchids
In flowering plants, pollination sets off a cascade of developmental events,
including perianth senescence, changes in pigmentation and ovule differentiation, in
which ethylene plays a regulatory role (O’Neill et al., 1993; O’Neill and Nadeau, 1997;
Taiz and Zieger, 1998; Ketsa et al., 2001). Besides, pollination also affects floral scent
emission, as previously reported for snapdragon and petunia (Negre et al., 2003), and in
orchids (e.g. Ophrys sphegodes, Schiestl et al., 1997). Pollination is often accompanied
by an increase on ethylene levels, a major signal for petal senescence, especially in
long-lived flowers like orchids (Rogers, 2006), which are generally classified as ethylene-
sensitive (van Doorn, 2001). In short-lived flowers, senescence can be controlled

Chapter 1- General introduction to orchid pollination: Ophrys fusca a sexual deceptive flower
21
independently from pollination and modulated by hormones (e.g. brassinosteroids,
positive regulators; cytokinins, negative regulators of senescence) (Rogers, 2006; Lim et
al., 2007). The physiological and molecular mechanisms of pollination induced
senescence have been the subject of several studies in orchids (e.g. Phalaenopsis,
Porat et al., 1994; Cymbidium, Heyes and Johnston, 1998; Dendrobium and
Phalaenopsis, Iwaya-Inoue et al., 2005). Those studies have been mainly focused on the
determination of ethylene sensitivity and on regulation of ethylene biosynthetic genes
(1-aminocyclopropane-1-carboxylic acid (ACC) synthase (ACS) and ACC oxidase
(ACO)) (Nadeau et al., 1993; Mita et al., 2006). It is well known the role of ethylene as a
major signal for petal senescence (van Doorn, 2001; Jones, 2008), which is
characteristic of the ethylene-sensitive flowers, as most orchids are (Rogers, 2006).
O’Neill and co-workers (1993) verified that post pollination events in orchid’s involved
coordinated interorgan regulation of both ACS and ACO expression. Yet, a general
approach regarding post pollination regulated mechanisms in orchids is lacking. In
carnation (Dianthus caryophyllus) and Phalaenopsis sp. orchid, pollination enhanced
genes encoding for ACO and ACS have been associated to the post pollination burst
of ethylene synthesis related to petal senescence (Porat et al., 1994; Tang et al., 1994;
Nadeau and O’Neill, 1995; Woltering et al., 1995). Ethylene-inducible transcripts from
petals including mRNAs with homology to glutathione S transferase (Itzhaki et al., 1994),
phosphoenolpyruvate mutase (Wang et al., 1993) and cysteine proteinase (Jones et al.,
1995) were also described.
1.5.4. Ethylene and pollination: a close relation
The phytohormone ethylene is the primary regulator of floral senescence in a
wide range of plant genera (Kende, 1993; Macnish et al., 2010). In orchids, as in other
ethylene-sensitive flowers, initial response to pollination is an increased ethylene
production by the stigma, often followed by increased ethylene synthesis from ovaries
and petals (Jones and Woodson, 1997; Llop-Tous et al., 2000). Ethylene produced by
different floral organs is responsible for coordinating pollination-associated events such
as ovary growth and senescence of perianth (Llop-Tous et al., 2000; Rieu et al., 2003).
Petal wilting, colour change and abscission occurring after pollination may be
mediated by endogenous ethylene as suggested by experimental data where
inhibitors of ethylene synthesis/action prevent the pollination effect on petal wilting in
carnation, orchids and petunia (Woltering and Somhorst, 1990; Porat et al., 1994; van
Doorn, 2001 and references therein). In contrast, increases on cytokinin levels in petunia
delays flower senescence (Lara et al., 2004). In carnation flowers the increased
ethylene production associated with petal senescence, regulates PCD by

Chapter 1- General introduction to orchid pollination: Ophrys fusca a sexual deceptive flower
22
transcriptional activation of SAGs, which encode for cysteine proteases, RNases and
glutamine synthase (Woodson et al., 1992; Marrs, 1996; Della Mea et al., 2007). In
carnation (Wang and Woodson, 1991), tomato (Holdsworth et al., 1987; Llop-tous et al.,
2000), orchids (Nadeau et al., 1993; Bui and O’Neill, 1998; Mita et al., 2006), mulberry
(Pan and Lou, 2008), petunia (Tang and Woodson, 1996) and Pelargonium (Wang et al.,
1994; Clark et al., 1997; Dervinis et al., 2000) flowers, pollination-induced ethylene
production is associated with the expression of ACC synthase (ACS) and ACC oxidase
(ACO) genes. According to O’Neill and co-workers (1993), post pollination events in
orchids, ranging from perianth senescence to ovule differentiation involve coordinated
inter-organ regulation of both ACS and ACO expression, the two key ethylene
biosynthetic enzymes. In Phalaenopsis, many studies have been performed regarding
ethylene sensitivity due to their high commercial value (Nadeau et al., 1993; Porat et
al., 1994; Bui and O’Neill, 1998). Enzyme levels of ACS and ACO activities in the stigma,
labellum and ovary were initially low, but increased to peak levels at 24 hours after
pollination (ACO, Nadeau et al., 1993; ACS, Bui and O’Neill, 1998), and after their
activities decreased. It cannot be ruled out a post translational regulation of ACS
expression as suggested by recent reports (Wang et al., 2001; Chae et al., 2003; El-
Sharkawy et al., 2008).
1.6. Aims and scope of the work
Flowers that demonstrate strict pollination regulation, as orchids, provide
excellent model systems to unravel regulation mechanisms that are pollination- elicited.
Orchids being, in general, of considerable important for commercial exploitation and
immeasurable beauty and mysticism, justify continuous worldwide natural habitat
conservation efforts and a better understanding of their pollination mechanisms. Since
orchids display unique differences in reproductive biology, as compared to
Arabidopsis, they offer additional advantages for studying gene function and evolution
in pre-pollination and post-pollination stages. Due to its enormous variation colors,
orchids are also ideal as a model for studying floral coloration. Some investigations
have highlighted genes related to orchid flower pigmentation, most of them encoding
enzymes of the flavonoid pathway (Liew et al., 1998; Johnson et al., 1999).
The main objective of this thesis is the study of the peculiar pollination
mechanism of Ophrys fusca by means of sexual deception, as a contribution for the
understanding of orchid pollination biology. Specific objectives of the present study
are:
1. To identify post pollination differentially expressed genes and implied cellular
and metabolic processes;

Chapter 1- General introduction to orchid pollination: Ophrys fusca a sexual deceptive flower
23
2. To disclose the metabolomic profile of pollinated vs unpollinated flowers and
detection of compounds putatively involved in pollination;
3. To relate the post pollination transcriptional profile with processes undergoing in
a sexual deceptive pollination system.
1.7. Thesis outline
This PhD thesis aims at contributing to the knowledge on orchid pollination
biology, through the study of the pollination mechanism of Ophrys fusca by sexual
deception. To accomplish this objective, a transcriptional profiling study was performed
after pollination event. A metabolic profiling approach was also considered to unravel
compounds dynamics in Ophrys pollination.
This thesis is organized in four chapters. The first chapter comprises a general
introduction, focusing on Ophrys, highlighting the main aspects regarding orchid
pollination biology and outlining molecular mechanisms enhanced by pollination. The
second chapter focuses on a transcriptional approach by means of cDNA microarray,
where putative functions assigned to genes differentially expressed after pollination is
discussed. Chapter three comprises a metabolic profiling through GC-MS analysis by
focusing on metabolites putatively involved in plant- insect association, namely in
Ophrys fusca. Chapter four addresses concluding remarks through an integrative
approach.
References
Abdala-Roberts L, Parra-Tabla V and Navarro J (2007) Is floral longevity influenced by reproductive costs and pollination success in Cohniella ascendens (Orchidaceae)? Annals of Botany 100: 1367-1371. Ames O (1938) Resupination as a diagnostic character in the Orchidaceae with special reference to Malaxis monophyllos. Botanical Museum Leaflets, vol. 6 Springer, Pp. 145-183. Amich F, Garcia-Barriuso M and Bernardos S (2007) Polyploidy and speciation in the orchid flora of the Iberian Peninsula. Botanica Helvetica 117: 143-157. Amich F, García-Barriuso M, Crespí A and Bernardos S (2009) Taxonomy, morphometric circumscription and karyology of the Mediterranean African representatives of Ophrys sect. Pseudophrys (Orchidaceae). Plant Biosystems - An International Journal Dealing with all Aspects of Plant Biology 143(1): 47-61. Anderson B, Johnson SD and Carbutt C (2005) Exploitation of a specialized mutualism by a deceptive orchid. American Journal of Botany 92(8): 1342-1349.

Chapter 1- General introduction to orchid pollination: Ophrys fusca a sexual deceptive flower
24
Arditti J (1994) Orchid Biology: Reviews and Perspectives VI, Wiley and Sons: New York, 610 pp. Ascensão L, Francisco A, Cotrim, H and Pais S (2005) Comparative structure of the labellum in Ophrys fusca and O. lutea (Orchidaceae). American Journal of Botany 92: 1059-1067. Attri LK, Nayyar H, Bhanwra RK and Vij SP (2007) Post-pollination biochemical changes in the floral organs of Rhynchostylis retusa (L.) Bl. and Aerides multiflora Roxb. (Orchidaceae). Journal of Plant Biology 50(5): 548-556. Attri LK, Nayyar H, Bhanwra RK and Pehwal A (2008) Pollination-induced oxidative stress in floral organs of Cymbidium pendulum (Roxb.) Sw. and Cymbidium aloifolium (L.) Sw. (Orchidaceae): a biochemical investigation. Scientia Horticulturae 116: 311-317. Ayasse M, Paxton RJ and Tengö J (2001) Mating behaviour and chemical communication in the order Hymenoptera. Annual Review of Entomology 46: 31-78. Bai S, Willard B, Chapin LJ, Kinter MJ, Francis DM, Stead AD and Jones ML (2010) Proteomic analysis of pollination-induced corolla senescence in petunia. Journal of Experimental Botany 61(4): 1089-1109. Ballings P (2006) "About Orchids". Vumba nature. Retrieved 2011-03-28. Bateman RM and Rudall PJ (2006) Evolutionary and morphometric implications of morphological variation among flowers within an inflorescence: a case-study using European orchids. Annals of Botany 98: 975-993. Bateman RM, Hollingsworth PM, Preston J, Yi-Bo, Pridgeon AM and Chase MW (2003) Molecular phylogenetics and evolution of Orchidinae and selected Habenariinae (Orchidaceae). Botanical Journal of Linnean Society 142: 1-40. Bernardos S, Crespí A, Del Rey F and Amich F (2005) The section Pseudophrys (Ophrys, Orchidaceae) in the Iberian Peninsula: a morphometric and molecular analysis. Botanical Journal of the Linnean Society 148: 359-375. BFN - Federal Agency for Nature Conservation (2006) Natura 2000 Habitats in Germany. NATURA 2000 Code: 6210. Seminatural dry grasslands and scrubland facies on calcareous substrates (Festuco-Brometalia, * important orchid sites). Borg-Karlson A-K and Tengö J (1986) Odour mimetism? Key substances in Ophrys lutea–Andrena pollination relationship (Orchidaceae:Andenidae). Journal of Chemical Ecology 12: 1927-1941. Borg-Karlson AK (1990) Chemical and ethological studies of pollination in the genus Ophrys (Orchidaceae). Phytochemistry 29: 1359-1387. Breeze E, Wagstaff C, Harrison E, Bramke I, Rogers HJ, Stead AD, Thomas B and Buchanan-Wollaston V (2004) Gene expression patterns to define stages of post harvest senescence in Alstroemeria petals. Plant Biotechnology Journal 2: 155-168. Buchanan-Wollaston V (1997) The molecular biology of leaf senescence. Journal of Experimental Botany 48:181-199. Buchanan-Wollaston V, Earl S, Harrison E, Mathas E, Navabpour S, Page T and Pink D (2003) The molecular analysis of leaf senescence – a genomics approach. Plant Biotechnology Journal 1: 3-22.

Chapter 1- General introduction to orchid pollination: Ophrys fusca a sexual deceptive flower
25
Bui AQ and O’Neill SD (1998) Three 1-aminocyclopropane-1-carboxylate synthase genes regulated by primary and secondary pollination signals in orchid flowers. Plant Physiology 116: 419-428. Cameron KM, Chase MW, Whitten WM, Kores PJ, Jarrell DC, Albert VA, Yukawa T, Hills HG and Goldman DH (1999) A phylogenetic analysis of the Orchidaceae: evidence from rbcl nucleotide sequences. American Journal of Botany 86(2): 208-224. Chae HS, Faure F and Kieber JJ (2003) The eto1, eto2 and eto3 mutations and cytokinin treatment increase ethylene biosynthesis in Arabidopsis by increasing the stability of ACS protein. The Plant Cell 15: 545-559. Chapin L and Jones ML (2007) Nutrient remobilization during pollination ninduced corolla senescence in Petunia. Acta Horticulturae 55: 181-190. Chase MW, Cameron K, Hills H and Jarrell D (1994) DNA sequences and phylogenetics of the Orchidaceae and other lilioid monocots. In: Pridgeon A [ed.], Proceedings of the Fourteenth World Orchid Conference, 61-73pp. Her Majesty’s Stationery Office, Glasgow, UK. Claessens J and Kleynen J (2002) Investigations on the autogamy in Ophrys apifera Hudson. Jahrseberichten des Naturwissenschaftlichen Vereins Wupperta (Wuppertal) 55: 62-77. Clark DG, Richards C, Hilioti Z, Lind-Iverson S and Brown K (1997) Effect of pollination on accumulation of ACC synthase and ACC oxidase transcripts, ethylene production and flower petal abscission in geranium (Pelargonium X hortorum L.H. Bailey). Plant Molecular Biology 34: 855-865. Conran JG, Bannister JM and Lee DE (2009) Earliest orchid macrofossils: early Miocene Dendrobium and Earina (Orchidaceae: Epidendroideae) from New Zealand. American Journal of Botany 96(2): 466-474. Coyne JA and Orr HA (2004) Speciation, Sinauer Associates, Sunderland, MA, USA, 545p. Cozzolino S, Noce ME, Musacchio A and Widmer A (2003) Variation at a chloroplast minisatellite locus reveals the signature of habitat fragmentation and genetic bottlenecks in the rare orchid Anacamptis palustris (Orchidaceae). American Journal of Botany 90(12): 1681-1687. Cozzolino S and Widmer A (2005) Orchid diversity: an evolutionary consequence of deception? Trends in Ecology and Evolution 20(9): 487-494. Cozzolino S and Scopece G (2008) Specificity in pollination and consequences for postmating reproductive isolation in deceptive Mediterranean orchid. Philosophical Transactions of the Royal Society B 363: 3037-3046. Darwin C (1862) On the various contrivances by which British and foreign orchids are fertilised by insects and on the good effects of intercrossing. London: John Murray, Albermale Street. Delforge P (2005) Guide des orchidées d’Europe, d’Afrique du Nord et du Proche-Orient. Delachaux et Niestlé SA, Lausanne. Delforge P (2006) Orchids of Europe, North Africa and the Middle East. Ed. 3. A. & C. Black, London.

Chapter 1- General introduction to orchid pollination: Ophrys fusca a sexual deceptive flower
26
Della Mea M, De Filippis F Genovesi V Fracassini DS and Del Duca S (2007) The acropetal wave of developmental cell death of tobacco corolla is preceded by activation of transglutaminase in different cell compartments. Plant Physiology 144: 1211-1222. Dervinis C, Clark DG, Barrett JE and Nell TA (2000) Effect of pollination and exogenous ethylene on accumulation of ETR1 homologue transcripts during flower petal abscission in geranium (Pelargonium hortorum L.H. Bailey). Plant Molecular Biology 42: 847-856. Devey DS, Bateman RM, Fay MF and Hawkins JA (2008) Friends or relatives? Phylogenetics and species delimitation in the controversial european orchid genus Ophrys. Annals of Botany 101: 385-402. Devillers P and Devillers-Terschuren J (1994) Essai d'analyse systématique du genre Ophrys. Naturalistes belges 75 (Orchid. 7, suppl.): 273-400. Dressler RL (1981) The Orchids: natural history and classification. Harvard University Press, Cambridge, Massachussets, USA. Dressler RL (1993) Phylogeny and classification of the orchid family. Portland, Oregon: Dioscorides Press. El-Sharkawy I, Kim WS, Jayasankar S, Svircev AM and Brown DCW (2008) Differential regulation of four members of the ACC synthase gene family in plum. Journal of Experimental Botany 59(8): 2009-2027. Engelberg-Kulka H, Amitai S, Kolodkin-Gal I and Hazan R (2006) Bacterial programmed cell death and multicellular behavior in bacteria. PLoS Genetics 2(10): e135; 10.1371/journal.pgen.0020135. Ernst R and Arditti J (1994) Resupination In: Arditti J (ed.), Orchid Biology: Reviews and Perspectives VI. John Wiley and Sons Inc., New York, Pp.135-188. Fay MF and Chase MW (2009) Orchid biology: from Linnaeus via Darwin to the 21st century. Annals of Botany 104(3): 359-364. Fenster CB, Armbruster WS, Wilson P,Dudash MR and Thomson JD (2004) Pollination syndrome and floral specialization. Annual Review of Ecology, Evolution and Systematics 35: 375-403. Fenster CB and Martén-Rodríguez S (2007) Reproductive assurance and the evolution of pollination specialization. International Journal of Plant Science 168(2): 215-228. Fischer GA, Gravendeel B, Sieder A, Andriantiana J, HeiselmayerP, Cribb PJ, Smidt EC, Samuel R and Kiehn M (2007) Evolution of resupination in Malagasy species of Bulbophyllum (Orchidaceae). Molecular Phylogenetics and Evolution 45: 358-376. Freudenstein JV, Berg CVD, Goldman DH, Kores PJ, Molvray M and Chase MW (2004) An expanded plastid DNA phylogeny of Orchidaceae and analysis of jackknife branch support strategy. American Journal of Botany 91(1): 149-157. Gaskett AC and Herberstein ME (2010) Colour mimicry and sexual deception by Tongue orchids (Cryptostylis). Naturwissenschaften 97: 97-102. Gavrilets S and Losos JB (2009) Adaptive radiation: contrasting theory with data. Science 323(5915): 732-737.

Chapter 1- General introduction to orchid pollination: Ophrys fusca a sexual deceptive flower
27
Gepstein S (2004) Leaf senescence - not just a ‘wear and tear’ phenomenon. Genome Biology 5(3): 212; http://genomebiology.com/2004/5/3/212. Godfery MJ (1928) Classification of the genus Ophrys. Journal of Botany of London 66: 33-36. Grant V (1994) Modes and origins of mechanical and ethological isolation in angiosperms. Proceedings of the National Academy of Sciences USA 91: 3-10. Gullan PJ and Cranston PS (2000) Insects and Plants. In: Gullan PJ and Cranston PS (2nd edition) The Insects. An outline of entomology. Blackwell Science, USA, Pp 239-275. Guo Y, Cai Z and Gan S (2004) Transcriptome of Arabidopsis leaf senescence. Plant, Cell and Environment 27: 521-549. Gustafsson ALS, Verola CF and Antonelli A (2010) Reassessing the temporal evolution of orchids with new fossils and a Bayesian relaxed clock, with implications for the diversification of the rare South American genus Hoffmannseggella (Orchidaceae: Epidendroideae). BMC Evolutionary Biology 10: 177; 10.1186/1471-2148-10-177. Hanfrey C, Fife M and Buchanan-Wollaston V (1996) Leaf senescence in Brassica napus: expression of genes encoding pathogenesis-related proteins. Plant Molecular Biology 30: 597-609. Heyes JA and Johnston JW (1998) 1-methylcyclopropene extends Cymbidium orchid vaselife and prevents damaged pollinia from accelerating senescence. New Zealand Journal of Crop and Horticultural Science 26(4): 319-324. Hoballah ME, Gübitz T, Stuurman J, Broger L, Barone M, Mandel T, Dell’Olivo A, Arnold M and Kuhlemeier C (2007) Single gene–mediated shift in pollinator attraction in Petunia. The Plant Cell 19: 779-790. Hodges SA and Whittall JB (2008) One-sided evolution or two? A reply to Ennos. Heredity 100: 541-542. Hoeberichts FA, van Doorn WG, Vorst O, Hall RD and van Wordragen MF (2007) Sucrose prevents up-regulation of senescence-associated genes in carnation petals. Journal of Experimental Botany 58(11): 2873-2885. Holdsworth MJ, Bird CR, Ray J, Schuch W and Grierson D (1987) Structure and expression of an ethylene-related mRNA from tomato. Nucleic Acids Research 15(2): 731-739. Itzhaki H, Maxson JM and Woodson WR (1994) An ethylene responsive enhancer element is involved in the senescence related expression of the carnation glutathione S-transferase (GST1) gene. Proceedings of the National Academy Sciences USA 91: 8925-8929. Iwaya-Inoue M, Watanabe Y, Tomizawa A, Ishibashi Y, Sekiguchi K, Chikushi and Sagara Y (2005) Petal senescing processes monitored by dynamic states of water in orchid plants exposed to exogenous ethylene. Environmental Control in Biology 43(2): 121-130. Jermy T (1999) Deep flowers for long tongues: a final word. Trends in Ecology and Evolution 14: 34. Jersáková J, Johnson SD and Kindlmann P (2006) Mechanisms and evolution of deceptive pollination in orchids. Biological Reviews 81(2): 219-235.
Chapter 1- General introduction to orchid pollination: Ophrys fusca a sexual deceptive flower
28
Johnson SD, Linder HP and Steiner KE (1998) Phylogeny and radiation of pollination systems in Disa (Orchidaceae). American Journal of Botany 85: 402-411. Johnson ET, Yi H, Shin B, Oh BJ, Cheong H and Choi G (1999) Cymbidium hybrida dihydroflavonol 4-reductase does not efficiently reduce dihydrokaempferol to produce orange pelargonidin-type anthocyanins. The Plant Journal 19(1): 81-85. Jones ML, Larsen PB and Woodson WR (1995) Ethylene-regulated expression of a carnation cysteine proteinase during flower petal senescence. Plant Molecular Biology 28: 505-512. Jones ML and Woodson WR (1997) Pollination-induced ethylene in carnation: role of stylar ethylene in corolla senescence. Plant Physiology 115: 205-212. Jones ML, Chaffin GS, Eason JR and Clark DG (2005) Ethylene-sensitivity regulates proteolytic activity and cysteine protease gene expression in petunia corollas. Journal of Experimental Botany 56(420): 2733-2744. Jones ML (2008) Ethylene signalling is required for pollination accelerated corolla senescence in Petunias. Plant Science 175: 190-196. Juillet N and Scopece G (2010) Does floral trait variability enhance reproductive success in deceptive orchids? Perspectives in Plant Ecology, Evolution and Systematics 12: 317-322. Kareiva P (1999) Coevolutionary arms races: Is victory possible? Proceedings of the National Academy of Sciences USA 96: 8-10. Kende H (1993) Ethylene biosynthesis. Annual Review of Plant Physiology and Plant Molecular Biology 44: 283-307. Ketsa S and Rugkong A (1999) Senescence of Dendrobium ‛Pompadour’ flowers following pollination. The Journal of Horticultural Science and Biotechnology 74: 608-613. Ketsa S, Bunya-Atichart K and van Doorn WG (2001). Ethylene production and post-pollination development in Dendrobium flowers treated with foreign pollen. Australian Journal of Plant Physiology 28: 409-415. Kocyan A and Endress PK (2001) Floral structure and development of Apostasia and Neuwiedia (Apostasioideae) and their relationships to other orchids. International Journal of Plant Science 162: 847-867. Košir P, Škof S and Luthar Z (2004) Direct shoot regeneration from nodes of Phalaenopsis orchids. Acta Agriculturae Slovenica 83(2): 233-242. Kullenberg B (1961) Studies on Ophrys pollination. Zoologiska Bidrag frarz Uppsala 34: 1-340. Labandeira CC, Dilchert DL, Davis DR and Wagner DL (1994) Ninety-seven million years of angiosperm-insect association: paleobiological insights into the meaning of coevolution. Proceedings of the National Academy of Sciences USA 91: 12278-12282. Lang D (1980) Orchids of Britain: a field guide. Oxford University Press, UK.

Chapter 1- General introduction to orchid pollination: Ophrys fusca a sexual deceptive flower
29
Lara MEB, Garcia MCG, Fatima T, Ehness R, Lee TK, Proels R, Tanner W and Roitsch T (2004) Extracellular invertase is an essential component of cytokinin-mediated delay of senescence. The Plant Cell 16: 1276-1287. Liew CF, Loh CS, Goh CJ and Lim SH (1998) The isolation, molecular characterization and expression of dihydroflavonol 4-reductase cDNA in the orchid, Bromheadia finlaysoniana. Plant Science 135: 161-169. Lim PO, Woo HR and Nam HG (2003) Molecular genetics of leaf senescence in Arabidopsis. Trends in Plant Science 8(6): 272-278. Lim PO, Kim HJ and Nam HG (2007) Leaf senescence. Annual Review of Plant Biology 58: 115-136. Linné C (1753) Species Plantarum. 945p. Stockholm. Liu K, Liu Z, Huang L, Li L, Chen L and Tang G (2006) Self-fertilization strategy in an orchid. Nature 441: 945. Llop-Tous I, Barry CS and Grierson D (2000) Regulation of ethylene biosynthesis in response to pollination in tomato flowers. Plant Physiology 123: 971-978. Macnish AJ, Jiang C-Z, Negre-Zakharova F and Reida MS (2010) Physiological and molecular changes during opening and senescence of Nicotiana mutabilis flowers. Plant Science 179: 267-272. Mant J, Peakall R and Schiestl FP (2005a) Does selection on floral odour promote differentiation among populations and species of the sexually deceptive orchid genus Ophrys? Evolution 59(7): 1449-1463. Mant J, Peakall R and Weston PH (2005b) Specific pollinator attraction and the diversification of sexually deceptive Chiloglottis (Orchidaceae). Plant Systematics and Evolution 253: 185-200. Marrs KA (1996) The functions and regulation of glutathione S- transferases in plants. Annual Review of Plant Physiology and Plant Molecular Biolology 47: 127-158. Martin AB (2005) The vocabulary of orchids: an amateur perspective. Available online at: http://gosfordorchidsociety.webs.com/My%20files/BOOKA-C.pdf. Mea ML, Serafini-Fracassini D and Duca SD (2007) Programmed cell death: similarities and differences in animals and plants. A flower paradigm. Amino acids 33: 395-404. Meyer RC, Goldsbrough PB and Woodson WR (1991) An ethylene-responsive flower senescence-related gene from carnation encodes a protein homologous to glutathione S-transferases. Plant Molecular Biology 17: 277-281. Micheneau C, Fournel J, Gauvin-Bialecki A and Pailler T (2008) Auto-pollination in a long-spurred endemic orchid (Jumellea stenophylla) on Reunion Island (Mascarene Archipelago, Indian Ocean). Plant Systematics and Evolution 272: 11-22. Micheneau C, Johnson SD and Fay MF (2009) Orchid pollination: from Darwin to the present day. Botanical Journal of the Linnean Society 161: 1-19.

Chapter 1- General introduction to orchid pollination: Ophrys fusca a sexual deceptive flower
30
Mishina TE, Lamb C and Zeier J (2007) Expression of a nitric oxide degrading enzyme induces a senescence programme in Arabidopsis. Plant, Cell and Environment 30: 39-52. Mita S, Henmi R and Ohno H (2006) Enhanced expression of genes for ACC synthase, ACC oxidase and NAC protein during high-temperature-induced necrosis of young inflorescences of Cymbidium. Physiologia Plantarum 128: 476-486. Mondragón-Palomino M and Theiβen G (2007) MADS about the evolution of orchid flowers. Trends in Plant Science 13(2): 51-59. Mondragón-Palomino M and Theiβen G (2009) Why are orchid flowers so diverse? Reduction of evolutionary constraints by paralogues of class B floral homeotic gene. Annals of Botany 104: 583-594. Müller GL, Drincovich MF, Andreo CS and Lara MV (2010) Role of photosynthesis and analysis of key enzymes involved in primary metabolism throughout the lifespan of the tobacco flower. Journal of Experimental Botany 61: 3675-3688. Myers N, Mittermeier RA, Mittermeier CG, da Fonseca GAB and Kent J (2000) Biodiversity hotspots for conservation priorities. Nature 403: 853- 858. Nadeau JA, Zhang XS, Nair H and O’Neill SD (1993) Temporal and spatial regulation of 1-aminocyclopropane-1-carboxylate oxidase in the pollination-induced senescence of orchid flowers. Plant Physiology 103: 31-39. Nadeau JA and O’Neill SD (1995) Nucleotide-sequence of a cDNA encoding 1-aminocyclopropane carboxylate oxidase from senescing orchid petals. Plant Physiology 108: 833-834. Nadeau JA, Zhang XS, Li J and O’Neill SD (1996) Ovule development: identification of stage-specific and tissue-specific cDNAs. Plant Cell 8: 213-239. Negre F, Kish CM, Boatright J, Underwood B, Shibuya K, Wagner C, Clark DG and Dudareva N (2003) Regulation of methylbenzoate emission after pollination in snapdragon and petunia flowers. The Plant Cell 15: 2992-3006. Nelson E (1962) “Gestaltwandel und Artbildung Erörtert am Beispiel der Orchidaceen Europas und der Mittelmeerländer,” Fischer, Chernex-Montreux. Nilsson LA (1988) The evolution of flowers with deep corolla tubes. Nature 334: 147-149. Nilsson LA (1992) Orchid pollination biology. Trends in Ecology and Evolution 7: 255-259. O’Neill SD, Nadeau JA, Zhang XS, Bui AQ and Halevy AH (1993) Interorgan regulation of ethylene biosynthetic genes by pollination. The Plant Cell 5: 419-432. O’Neill SO (1997) Pollination regulation of flower development. Annual Review of Plant Physiology and Plant Molecular Biology 48: 547-574. O’Neill SD and Nadeau JA (1997) Postpollination flower development. Horticultural Reviews 19: 1-58. Oliver EGH, Liltved WR and Pauw A (2008) Pterygodium vermiferum (Coryciinae), a new, autonomously self-pollinating, oil-secreting orchid from Western Cape of South Africa. South African Journal of Botany 74: 617-622.
Chapter 1- General introduction to orchid pollination: Ophrys fusca a sexual deceptive flower
31
Paling N (2007) British Native Orchids: an introduction to their biology and ecology. CI-UK Publications, Pp7. Pan G and Lou CF (2008) Isolation of an 1-aminocyclopropane-1-carboxylate oxidase gene from mulberry (Morus alba L.) and analysis of the function of this gene in plant development and stresses response. Journal of Plant Physiology 165: 1204-1213. Paulus HF and Gack C (1990) Pollination of Ophrys (Orchidaceae) in Cyprus. Plant Systematics and Evolution 169: 177-207. Paulus HF (2006) Deceived males – Pollination biology of the mediterranean orchid genus Ophrys (Orchidaceae). Journal Europäischer Orchideen 38: 303-353. Peakall R and Schiestl FP (2004) A mark-recapture study of male Colletes cunicularius bees: implications for pollination by sexual deception. Behavioral Ecology and Sociobiology 56: 579-584. Pedersen H and Faurholdt N (2007) Ophrys: The Bee Orchids of Europe. Kew Publishing, Royal Botanic Gardens. Hardcover. pp 40-91. Peter CI and Johnson SD (2006) Doing the twist: a test of Darwin’s cross-pollination hypothesis for pollinarium reconfiguration. Biology Letters 2: 65-68. Peter CI and Johnson SD (2008) Mimics and magnets: the importance of color and ecological facilitation in floral deception. Ecology 89: 1583-1595. Porat R, Borochov A, Halevy AH and O’Neill SD (1994) Pollination induced senescence of Phalaenopsis petals- the wilting process, ethylene production and sensitivity to ethylene. Plant Growth Regulation 15: 129-136. Pouyanne M (1917) La fécondation des Ophrys par les insectes. Bulletin de la Société d’Histoire Naturelle l’Afrique du Nord 8: 6-7. Price AM, Orellana DFA, Salleh FM, Stevens R, Acock R, Buchanan-Wollaston V, Stead AD and Rogers HJ (2008) A comparison of leaf and petal senescence in wallflower reveals common and distinct patterns of gene expression and physiology. Plant Physiology 147: 1898-1912. Pridgeon AM, Bateman RM, Cox AV, Hapeman JR and Chase MW (1997) Phylogenetics of subtribe Orchidinae (Orchidoideae, Orchidaceae) based on nuclear ITS sequences. 1. Intergeneric relationships and polyphyly of Orchis sensu lato. Lindleyana 12(2): 89-109. Raghavan V and Goh CJ (1994) DNA synthesis and mRNA accumulation during germination of embryos of the orchid Spathoglottis plicata. Protoplasma 183: 137-147. Raguso RA (2004) Flowers as sensory billboards: progress towards an integrated understanding of floral advertisement. Current Opinion in Plant Biology 7: 434-440. Ramirez SR, Gravendeel B, Singer RB, Marshall CR and Pierce NE (2007) Dating the origin of the Orchidaceae from a fossil orchid with its pollinator. Nature 448: 1042-1045. Renner SS (2006) Rewardless flowers in the angiosperms and the role of insect cognition in their evolution. In: Waser NM and Olerton J (eds.) Plant- Pollinator Interactions: From Specialization to Generalization, University of Chicago Press, Chicago, IL. Pp123-144.
Chapter 1- General introduction to orchid pollination: Ophrys fusca a sexual deceptive flower
32
Rieu I, Wolters-Arts M, Derksen J and Mariani C (2003) Ethylene regulates the timing of anther dehiscence in tobacco. Planta 217: 131-137. Rogers HJ (2006) Programmed cell death in floral organs: how and why do flowers die? Annals of Botany 97: 309-315. Roy BA and Widmer A (1999) Floral mimicry: a fascinating yet poorly understood phenomenon. Trends in Plant Science 4(8): 325-330. Schiestl F, Ayasse M, Paulus HF, Erdmann D and Francke W (1997) Variation on floral scent emission and postpollination changes in individual flowers of Ophrys sphegodes subsp. sphegodes. Journal of Chemical Ecology 23(12): 2881-2895. Schiestl FP, Ayasse M, Paulus HF, Löfstedt C, Hansson BS, Ibarra F and Francke W (1999) Orchid pollination by sexual swindle. Nature 399: 421-422. Schiestl FP, Ayasse M, Paulus HF, Löfstedt C, Hansson BS, Ibarra F and Francke W (2000) Sex pheromone mimicry in the early spider orchid (Ophrys sphegodes): patterns of hydrocarbons as the key mechanism for pollination by sexual deception. Journal of Comparative Physiology A 186: 567-574. Schiestl F and Ayasse M (2001) Post-pollination emission of a repellent compound in a sexually deceptive orchid: a new mechanism for maximising reproductive success? Oecologia 12: 531-534. Schiestl FP and Ayasse M (2002) Do changes in floral odour cause speciation in sexually deceptive orchids? Plant Systematics and Evolution 234: 111-119. Schiestl FP, Peakall R, Mant JG, Ibarra F, Schulz C, Franke S and Francke W (2003) The chemistry of sexual deception in an orchid–wasp pollination system. Science 302: 437-438. Schiestl FP (2004) Floral evolution and pollinator mate choice in a sexually deceptive orchid. Journal of Evolutionary Biology 17: 67-75. Schiestl FP, Peakall R and Mant J (2004) Chemical communication in the sexually deceptive orchid genus Cryptostylis. Botanical Journal of the Linnean Society 144(2): 199-205. Schiestl FP (2005) On the success of a swindle: pollination by deception in orchids Naturwissenschaften 92: 255-264. Schiestl FP and Schlüter PM (2009) Floral isolation, specialized pollination, and pollinator behavior in orchids. Annual Review of Entomology 54: 425-446. Schlüter PM and Schiestl FP (2008) Molecular mechanisms of floral mimicry in orchids. Trends in Plant Science 13(5): 228-235. Soliva M, Kocyan A and Widmer A (2001) Molecular phylogenetics of the sexually deceptive orchid genus Ophrys (Orchidaceae) based on nuclear and chloroplast DNA sequences. Molecular Phylogenetics and Evolution 20(1): 78-88.

Chapter 1- General introduction to orchid pollination: Ophrys fusca a sexual deceptive flower
33
Spaethe J, Moser WH and Paulus HF (2007) Increase of pollinator attraction by means of a visual signal in the sexually deceptive orchid, Ophrys heldreichii (Orchidaceae). Plant Systematics and Evolution 264: 31-40. Spaethe J, Streinzer M and Paulus HF (2010) Why sexually deceptive orchids have colored flowers. Communicative & Integrative Biology 3(2): 139-141. Stökl J, Paulus H, Dafni A, Schulz C, Francke W and Ayasse M (2005) Pollinator attracting odour signals in sexually deceptive orchids of the Ophrys fusca group. Plant Systematics and Evolution 254: 105-120. Stökl J, Schlüter PM, Stuessy TF, Paulus HF, Assum G and Ayasse M (2008a) Scent variation and hybridization cause the displacement of a sexually deceptive orchid species. American Journal of Botany 95: 472-481. Stökl J, Twele R, Erdmann DH, Francke W and Ayasse M (2008b) Comparison of the flower scent of the sexually deceptive orchid Ophrys iricolor and the female sex pheromone of its pollinator Andrena morio. Chemoecology 17: 231-233. Stökl J, Schlüter PM, Stuessy TF, Paulus HF, Fraberger E, Erdmann D, Schulz C, Francke W, Assum G and Ayasse M (2009) Speciation in sexually deceptive orchids: pollinator-driven selection maintains discrete odour phenotypes in hybridizing species. Botanical Journal of Linnean Society 98: 439-451. Streinzer M, Paulus HP and Spaethe J (2009) Floral colour signal increases short-range detectability of a sexually deceptive orchid to its bee pollinator. Journal of Experimental Biology 212: 1365-1370. Swarts ND and Dixon KW (2009) Terrestrial orchid conservation in the age of extinction. Annals of Botany 104: 543-556. Taiz L and Zieger E (1998) Chapter 22: Ethylene In Plant Physiology 2nd Edition, Sinauer Associates, Inc., Publishers, Sunderland Massachusetts. Pp 651-670. Tang X, Gomes AM, Bhatia A and Woodson WR (1994) Pistil specific and ethylene-regulated expression of 1-aminocyclopropane- 1-carboxylate oxidase genes in petunia flowers. The Plant Cell 6: 1227-1239. Tang X and Woodson WR (1996) Temporal and spatial expression of 1-aminocyclopropane-1-carboxylate oxidase mRNA following pollination of immature and mature petunia flowers. Plant Physiology 112: 503-511. Thomas H, Ougham HJ, Wagstaff C and Stead AD (2003) Defining senescence and death. Journal of Experimental Botany 54(385): 1127-1132. Thompson JE, Mayak S, Shinitzky M and Halevy AH (1982) Acceleration of membrane senescence in cut carnation flowers by treatment with ethylene. Plant Physiology 69: 859-863. Tripathi SK and Tuteja N (2007) Integrated signaling in flower senescence: an overview. Plant Signaling & Behavior 2(6): 437-445. Tsai W-C, Hsiao Y-Y, Pan Z-J, Kuoh C-S, Chen W-H and Chen H-H (2008) The role of ethylene in orchid ovule development. Plant Science 175: 98-105. van Doorn WG (2001) Categories of petal senescence and abscission: a re-evaluation. Annals of Botany 87: 447-456.

Chapter 1- General introduction to orchid pollination: Ophrys fusca a sexual deceptive flower
34
van Doorn WG and Woltering EJ (2008) Physiology and molecular biology of petal senescence. Journal of Experimental Botany 59: 453-480. Véla E, Tirard A, Renucci M, Suehs CM and Provost E (2007) Floral chemical signatures in the genus Ophrys L. (Orchidaceae): a preliminary test of a new tool for taxonomy and evolution. Plant Molecular Biology Reports 25: 83-97. Vereecken NJ and Schiestl FP (2008) The evolution of imperfect floral mimicry. Proceedings of the National Academy of Sciences USA 105(21): 7484-7488. Vereecken NJ, Cozzolino S and Schiestl FP (2010) Hybrid floral scent novelty drives pollinator shift in sexually deceptive orchids. BMC Evolutionary Biology 10: 103; 10.1186/1471-2148-10-103. Wagstaff C, Leverentz MK, Griffiths G, Thomas B, Chanasut U, Stead AD and Rogers HJ (2002) Cysteine protease gene expression and proteolytic activity during senescence of Alstroemeria petals. Journal of Experimental Botany 53: 233-240. Wang H and Woodson WR (1991) A flower senescence-related mRNA from carnation shares sequence similarity with fruit ripening-related mRNAs involved in ethylene biosynthesis. Plant Physiology 96: 1000-1001. Wang H, Brandt AS and Woodson WR (1993) A flower senescence related messenger-RNA from carnation encodes a novel protein related to enzymes involved in phosphonate biosynthesis. Plant Molecular Biology 22: 719-724. Wang TW, Arteca JM and Arteca RN (1994) A 1-aminocyclopropane-1-carboxylate oxidase cDNA sequence from Pelargonium. Plant Physiology 106: 797-798. Wang NN, Yang SF and Charng Y-y (2001) Differential expression of 1-aminocyclopropane-1-carboxylate synthase genes during orchid flower senescence induced by the protein phosphatase inhibitor okadaic acid. Plant Physiology 126: 253-260. WCSP (2010) World Checklist of Selected Plant Families. Retrieved 2010. Withner CL, Nelson PK and Wejksnora PJ (1974) The anatomy of orchids. Pp. 288-296. In: Whitner CL (Ed.), The orchids: scientific studies. John Wiley Co, New York. Woltering EJ and Somhorst,D (1990) Regulation of anthocyanin synthesis in Cymbidium flowers: effects of emasculation and ethylene. Journal of Plant Physiology 136: 295-299. Woltering EJ, Somhorst D and van der Veer P (1995) The role of ethylene in interorgan signalling during flower senescence. Plant Physiology 109: 1219-1225. Woodson WR, Park KY, Drory A, Larsen PB and Wang H (1992) Expression of ethylene biosynthetic pathway transcripts in senescing carnation flowers. Plant Physiology 99: 526-532. Yu H and Goh CJ (2001) Molecular genetics of reproductive biology in orchids. Plant Physiology 127: 1390-1393. Zhang XS and O'Neill SD (1993) Ovary and gametophyte development are coordinately regulated by auxin and ethylene following pollination. The Plant Cell 5: 403-418.

Chapter 2- Labellum transcriptome after pollination
35
Chapter 2
LABELLUM TRANSCRIPTOME AFTER POLLINATION
2.1. Abstract
Microarray technology applied to ecological studies is challenging and the
number of field studies with non-model species is increasing. One of the major
drawbacks rely on the large environmental variations associated to field experiments,
yet by increasing the number of biological replicates and samples to be analysed
problems can be surpassed. In orchids, pollination is a highly regulated process. Due to
their peculiar reproductive biology, floral morphology, color diversity and economical
importance, it is of major interest to unravel mechanisms that are pollination- elicited,
thereby contributing to the knowledge on orchid pollination and/or reproductive
biology. To achieve this goal, a transcriptional profiling through cDNA microarrays of
genes differentially expressed during pollination was performed to give an insight on the
labellum changes after pollination in the sexual deceptive orchid Ophrys fusca.
Labellum transcriptome of in-field growing O. fusca plants was analysed, at 2 and 4
days after pollination (2DAP and 4DAP). Three thousand three hundred eighty-four
clones were PCR amplified, isolated and printed in duplicate on glass slides. Screening
of the arrayed cDNAs was performed by hybridizing cDNAs of labella from pollinated
and unpollinated flowers (resulted from amplified RNA), test and control, respectively.
Statistical analysis revealed 277 genes differentially expressed, found to correspond to
140 unique sequences at both 2DAP and 4DAP. Transcripts down regulated by
pollination belong to secondary metabolism (phenylpropanoids, lipids, and alkaloids)
and photosynthetic related genes; whereas up regulated transcripts are involved in
RNA degradation, protein synthesis, mobilization of nutrients, stress and defence
responses associated to senescence-induced event. Results highlight the existence of
extremely regulated mechanisms underlying pollination and senescence, with
particular interest for the understanding on orchid pollination biology.
Keywords: cDNA microarrays, Ophrys fusca, orchid, pollination, senescence, real-time
PCR.

Chapter 2- Labellum transcriptome after pollination
36
2.2. Introduction
2.2.1. Microarrays: outline and cDNA technology.
A DNA microarray is a multiplex technology that consists of an arrayed series of
thousands of microscopic spots of DNA oligonucleotides, called features, each
containing a specific DNA sequence, known as probe, which can be a short section of
a gene or other DNA element (Schulze and Downward, 2001). They can be hybridized
to a complementary DNA (cDNA) or cRNA samples, called target (Schulze and
Downward, 2001). Probe-target hybridization is usually spotted and quantified by
detection of fluorophore- or chemiluminescence-labeled targets to determine relative
abundance of nucleic acid sequences in the target. Microarray technology has
become a powerful tool for high-throughput gene expression analysis, due to the huge
amount of information retrieved from a single experiment. Applications include
quantitative analysis of gene expression (Schena et al., 1995), DNA sequencing and
gene discovery (Hacia, 1999), disease diagnosis (Huang et al., 2001), drug discovery
(Marton et al., 1998), and toxicogenomic research (Liu et al., 2003), among others.
Microarray technology has evolved rapidly and has been developed for a variety of
applications, namely: proteins, antibodies, tissues-specific, microRNA (miRNA),
transfection, single nucleotide polymorphisms (SNPs), tilling, peptides and cDNA.
Presently, there are two types of cDNA arrays: those performed on glass slides
(microarrays or DNA chips) and those on nylon filters, known as high-density filter arrays
(HDFAs) (Rajeevan et al., 1999). Solid surface of a glass slide has several advantages
when compared to filter arrays, mainly due to efficient covalent attachment of the
target DNA to the coated-slide surface that provides stability of the spotted DNA
(Zammatteo et al., 2000).
There are two different formats of microarray-based technologies depending on
the target nucleic acid components, i.e. the oligonucleotide array and the cDNA
microarray (Lee et al., 2003). The first one is more applicable when working with species
which genomes have previously been sequenced. The ‘oligo’ type of array consists on
oligonucleotide targets, generally less than 25mer in length (Lipshutz et al., 1999),
generated in situ on a solid surface by light directed synthesis (Fodour et al., 1991; Hacia
et al., 1996). The cDNA type of array is more suitable when species with unsequenced
genome are concerned. Regarding cDNA microarray construction, several steps are
required: experimental design, total RNA extraction, construction of cDNA libraries,
clone amplification and purification, slide printing, labelling, hybridization and data
analysis (Fig. 2.1). Briefly, target cDNAs are cloned, and PCR amplified. Purified PCR

Chapter 2- Labellum transcriptome after pollination
37
products are printed onto glass microscope slides with a microarray robot. cDNA
targets are synthesized from total RNA or mRNA derived from test and
reference/control samples and labelled with distinct fluorescent dyes (Cy3-dUTP, usually
for control sample, and Cy5-dUTP, for test sample). Pooled probes are hybridized to the
glass slide. Hybridized fluorescent signals are detected with a dual-wavelength laser
scanner. Separately scanned images are combined and numerical data is achieved
by means of specialized computer software. Normalized ratios of Cy3/Cy5 are
calculated for individual target genes (Wu et al., 2001; Lida and Nishimura, 2002).
Figure 2.1- Overview of steps in cDNA microarray experiments.
Adapted (Lida and Nishimura, 2002)
Technical variation
Random factors contributing to technical variation include differences among
replicated spots within a slide and among slides (Kerr and Churchill 2001; Churchill 2002;
Leung and Cavalieri, 2003). Systematic sources of variation include differential dyes
incorporation (Churchill, 2002) and multiple print tips (print group effects). Dye bias
effects can be controlled by including dye swaps in the experimental design
No differential expression
Up-regulation
Down-regulation

Chapter 2- Labellum transcriptome after pollination
38
(Rosenzweig et al., 2004), whereas printing effects are controlled by data normalization
(Yang et al. 2002).
Normalization
Normalization is needed to minimize systematic variations in gene expression
levels between two mRNA or total RNA samples, so that biological differences can be
undoubtedly distinguished and comparison of expression levels across slides can be
performed (Yang et al., 2002; Lee et al., 2008). Imbalances between the red (Cy5) and
green (Cy3) dyes may arise from differences between the labelling efficiencies or
scanning properties of the two fluorochromes by using different scanner settings (Smyth
and Speed, 2003). Microarray data pre-processing contains three phases: quality
control, within-slide normalization, and between-slide normalization. Within-slide
normalization is used to correct the dye intensity errors introduced across one
microarray slide (Leung and Cavalieri, 2003; Berger et al., 2004). One scatterplot-based
normalization technique that is particularly suitable for balancing the intensities is called
locally weighted scatterplot smoothing (LOWESS) and its original application was for
smoothing scatterplots in a weighted least-squares fashion (Berger et al., 2004).
Replicate slides greatly help the between-slide variability analysis and help in
addressing formal statistical considerations when drawing biological conclusions
(Berger et al., 2004). The print-tip LOWESS balances systematic differences introduced
by the printing tips, which can be due to improper printing; and adjusts the differences
of red and green labelling, caused by variations other than biological (i.e. differential
labelling incorporation, autofluorescence) (Yang et al., 2002; Do and Choi, 2006).
Despite emergence of new methods for cDNA microarrays normalization, the
print-tip LOWESS provides a well-tested and widely used normalization method which
gives good results on a variety of arrays (Sebastiana et al., 2009; Jeong et al., 2010;
Nishitani et al., 2010).
Identification of differentially expressed genes in microarray data
One of the main objectives in microarray analysis relies on the identification of
differentially expressed genes between two experimental conditions. This task may be
difficult due to the huge number of genes, simultaneously, under analysis. A sorted list of
t-statistics will indicate highly expressed genes but an estimate of the false discovery
rate (FDR) is needed in order to address a cut-off such that significantly differentially
expressed genes can be identified (Šášik et al., 2004). The false discovery rate is
Chapter 2- Labellum transcriptome after pollination
39
assessed using q-values1, the probability of a statistically insignificant gene appears in
fact significant as the observed gene. The false discovery rate is measured using a p-
value, which represents the expected proportion of Type I errors among the rejected
hypotheses. Thus, the proportion of false discoveries can be controlled by defining a
threshold, e.g. 99 % or 95 % of confidence level. Tools are available for calculation of p-
values from expression data, including SAM (significance analysis of microarrays) (Tusher
et al., 2001) and QVALUE (Storey and Tibshirani, 2003). Further, Breitling and colleagues
(2004) developed the Rank Product (RP) test, which provides a powerful new statistics
test for defining differentially expressed genes in microarray experiments. In contrast to
previous techniques, such as SAM, RP showed to be independent of the gene-specific
measurement variance, which is particularly important when there is only a small
number of replicates, as it frequently happens in the majority of biological studies.
Because of its non-parametric nature, it requires only a few well-defined assumptions
about the data, such as: relevant expression changes affect only a minority of genes,
measurements are independent between replicate arrays, most changes are
independent of each other and measurement variance is equal for all genes (Breitling
et al., 2004). This method also allows a permutation-based estimation that provides a
very suitable way for determining a p-value (Breitling et al., 2004).
2.2.2. Microarrays: labelling technologies and overcome RNA limited amounts
In traditional microarray analysis, the target molecules are labelled with
fluorochromes during reverse transcription from mRNA or total RNA to cDNA. The
hybridized arrays are analysed by the excitation of the fluorophore on the surface with
a specific laser wavelength. The availability of several fluorochromes, such as the most
widely used Cy3 and Cy5, allows for two-colour microarray analysis between a sample
and a reference on one array. However, the cost of this technology is high which
restricts its use in many experiments. The microarrays generally exploit the advantages
of nonradioactive fluorescent detection methods, either with direct detection and
quantitation of signal or with two-colour fluorescence and competitive hybridization
between samples from different sources or different conditions (Schena et al., 1995;
Schena, 1996). Microarray technology has greatly facilitated gene expression profiling
at the mRNA level by allowing analysis of thousands of transcripts in parallel. However,
one limitation of the method is the requirement for relatively large amounts of RNA.
Major labelling technologies are based on direct or indirect labelling of the targets,
1 The q-value is defined to be the FDR analogue of the p-value.

Chapter 2- Labellum transcriptome after pollination
40
when large amounts of starting material is available, or rely on signal amplification
methods and RNA amplification, for less amounts of starting material.
2.2.2.1. Direct labelling
Briefly, the direct labelling method incorporates dUTP fluorescently labelled with
dye fluorochromes during reverse transcription of RNA (Hedge et al., 2000). Direct
labelling engages incorporation of a dNTP fluorescently labelled with bulky dye
adducts (Cy3 or Cy5) during the reverse transcription process. It has the advantage of
being a quick and easy method to perform, although there are evidences that it might
introduce sequence-specific artefacts as for background in image chip acquisition (Do
and Choi, 2007). The direct cDNA labelling method makes use of fluorescently modified
deoxynucleotides such as Cy5-labeled dCTP or Cy3-labeled dCTP, which are
incorporated during first-strand cDNA synthesis from an RNA template, using a reverse
transcriptase (Fig. 2.2). The main advantage of the direct labelling method relies on its
simplicity. Probe molecules directly labelled overcome the need for a post-labelling
reaction, which is required in the indirect labelling method. However, Cy5-labeled dCTP
is less efficiently incorporated during the labelling reaction than Cy3-labeled dCTP. This
imbalanced incorporation of Cy5 and Cy3 dyes can be improved by using the indirect
labelling method described below (Do and Choi, 2007).
Figure 2.2- Direct fluorescent-dye incorporation scheme for microarray experiments. Adapted (Do and Choi, 2007)

Chapter 2- Labellum transcriptome after pollination
41
2.2.2.2. Indirect labelling
In the indirect cDNA labelling method, an aminoallyl-modified nucleotide such
as aa-dUTP is incorporated during reverse transcription reaction (Fig. 2.3).
Figure 2.3 - Indirect fluorescent-dye incorporation scheme for microarray experiments.
Adapted (Do and Choi, 2007)
The reactive amine of the aa-dUTP can be integrated by a variety of RNA-
dependent and DNA-dependent DNA polymerases. The aa-dUTP molecule is
incorporated much more easily into DNA or mRNA than the bulky fluorescent bases,
which allows more uniform labelling to be carried out (Wang, 2005). Indirect labelling
outperforms direct labelling by maximizing the signal intensity through increases in
incorporation of the fluorochrome and by increasing the possibility of equal labelling
with both CyDyes. However, the indirect labelling method requires an additional post-
labelling step which, therefore, extends the time required to perform the procedure.
Hence, post-labelling method is less prone to producing artefacts caused by the size of
CyDye nucleotides (i.e. chain termination, proximity quenching, and sequence-specific
bias) and also produces higher yields and longer cDNAs, which is beneficial when array
targets have been derived from the 5'-ends of cDNAs.
Both direct and indirect labelling methods depend on the incorporation
efficiency of fluorescence-labelled dUTP or dCTP, which can be an important source of
systematic error in two-colour microarrays (Tseng et al., 2001; Dombkowski et al., 2004).

Chapter 2- Labellum transcriptome after pollination
42
2.2.2.3. Overcome of RNA limiting amounts
In order to obtain consistent hybridizations and adequate signals, labelling
protocols such as the direct and indirect methods generally require huge amounts of
starting material. This requirement cannot be fulfilled in many situations, e.g. clinical, cell
culture and plant studies. Two main strategies have been developed to achieve strong
signals from minute amounts of RNA: signal amplification methods and RNA
amplification (Wang et al., 2003; Do and Choi, 2007).
2.2.2.3.1. Signal amplification methods
The basic principle of signal amplification methods is that one molecule can
produce a signal equivalent to 10-100 unamplified molecules. This labelling scheme is
very important when only a small amount of total RNA (1–5 g) is available. Several
signal amplification techniques have been developed, including: rolling circle
amplification (RCA) (Lizardi et al., 1998), tyramide signal amplification (TSA) (Karsten et
al., 2002); dendrimer (3DNA) technology developed by Genisphere® (Manduchi et al.,
2002; Yu et al., 2002); and branched DNA (bDNA), a dendrimer-based strategy, among
others (reviewed in Park et al., 2006). Signal amplification seems to be suitable to
achieve a highly sensitive assay format. However, its widespread application is
substantially limited due to its associated costs (Park et al., 2006). Genisphere’s signal
amplification technology, which is based on the 3-dimensional nucleic acid (3DNA)
dendrimer, has been considered a very promising labelling approach (Stears et al.,
2000) due to its labelling efficiency when using a limited starting template (Badiee et al.,
2003). When comparing with direct and indirect labelling methods, which are
dependent on the incorporation efficiency of modified dUTPs, the dendrimer labelling
method is entirely dependent on nucleic acid hybridization kinetics (Nilsen et al., 1997),
and thus is recommended when amount of RNA available is limited. The main
disadvantage is its high cost. Alternative methods for microarray detection have been
investigated, such as chemiluminescent detection (Rajeevan et al., 1999) and gold
nanoparticles based-technology (Shipway et al., 2000; Wang et al., 2002).
2.2.2.3.2. RNA amplification
To overcome the need of large amounts of RNA for hybridization purposes,
increasingly sophisticated methods for RNA amplification from small biological samples
have been developed. There are several methods to amplify RNA, including: the

Chapter 2- Labellum transcriptome after pollination
43
arithmetic transcription methods (Gelder et al., 1990), PCR based exponential
amplification or a combination of both arithmetic and exponential amplification (Puská
et al., 2002). Most methods are established through the T7-based antisense RNA (aRNA)
amplification technique, first described by Gelder and co-workers (1990). The so-called
“Eberwine Procedure” or more recently in vitro Transcription (IVT) is based on cDNA
synthesis and template-directed in vitro transcription reaction (Fig. 2.4).
Figure 2.4- antisense RNA (aRNA) amplification based in Eberwine procedure or in vitro transcription (IVT). (Source: http://www.ambion.com/jp/figs/f00469.gif~)
The T7 RNA polymerase promoter is incorporated into the cDNA molecule by
priming cDNA synthesis with a synthetic oligonucleotide containing the T7 promoter
sequence. The single stranded cDNA (sscDNA) is converted into double stranded cDNA
(dscDNA) by the DNA polymerase. After the synthesis of dscDNA, T7 RNA polymerase is
added and antisense RNA (aRNA) is transcribed from the cDNA template. The labelling
of aRNA without the reverse transcription reaction is possible by the addition of aa-UTP
during or after in vitro transcription (Fig. 2.4). Each round of the Eberwine procedure
produces about a 100-fold amplification of the starting material, and three rounds yield
a one-million-fold amplification of the mRNA input (Baugh et al., 2001). There are
alternative RNA amplification approaches to the IVT procedure, although its
applications are restricted (Ginsberg and Che, 2002; Xiang et al., 2003). The most
common method of RNA amplification is based on in vitro Transcription (IVT), as
described previously. RNA amplification from small amounts of RNA by IVT has several
Ready for hybridization, labeling via reverse transcription, dye coupling or second round amplification

Chapter 2- Labellum transcriptome after pollination
44
drawbacks. When reducing the starting amount of RNA, reduction of the reproducibility
of data can often occur. Amplification process can increase technical biases due to
fidelity loss but, since the biases tend to be systematic, accurate expression data can
be obtained. When comparing expression changes between samples, it is imperative
that all samples have to be similarly amplified (Day et al., 2007). Taking into account the
biases introduced in aRNA amplification, the total RNA labelling method appears as the
best method when RNA sample is high enough. In the case of a low RNA sample, the
aRNA labelling is the advised and the more reliable method (Li et al., 2004).
2.2.3. cDNA microarrays: advantages and limitations
cDNA microarrays can provide genome-scale information on gene expression
patterns. In plant science, the majority of microarray studies involve the identification
and characterization of genes responding to different types of stresses (salt, drought,
cold stress, wounding, insect feeding, pathogen infection) (Aharoni and Vorst, 2001;
Endo et al., 2002; Figueiredo et al., 2008; Sebastiana et al., 2009). Data from cDNA
microarrays only provide information on the relative expression of the genes.
In a microarray experiment, spot intensity is expected to be related to the
amount of mRNA and, consequently, to the amount of protein. However mRNA levels
are not always directly related to protein levels (e.g. Bai et al., 2010). The regulation of
mRNA levels is only one aspect of biological control. Protein levels are also controlled at
several post transcriptional steps, along with post translational modifications that
regulate protein activities (Schulze and Downward, 2001; Gracey and Cossins, 2003).
Microarray studies give insights on the transcriptional regulation but, extrapolation to
protein levels should be carefully done. Another limitation of cDNA microarrays relies on
the cross-hybridization of different transcripts from genes belonging to the same gene
family, which influences expression levels (Murphy, 2002). Once statistically significant
expression ratios are established it is important to confirm data obtained, by using
alternative methods for gene expression validation. Currently, the techniques most
frequently used are quantitative real-time PCR (qPCR), northern blotting, ribonuclease
protection assay or in situ hybridization (Beně and Muckenthaler, 2003).
2.2.4. Microarrays analysis in natural populations
In ecology studies, the use of microarray technology has increased rapidly over
the past few years. Studies have been performed in model species such as thale cress
Arabidopsis thaliana (The Arabidopsis Initiative, 2000), baker’s yeast Saccharomyces
cerevisiae (Goffeau et al., 2006) and fruit fly Drosophila melanogaster (Adams et al.,

Chapter 2- Labellum transcriptome after pollination
45
2000), which are well suited to laboratory experiments and have fully sequenced
genomes (Kammenga et al., 2007). Microarrays have been applied to the
understanding of genetic mechanisms regarding species interactions, adaptations and
outcomes of evolutionary processes. However there are few drawbacks: model species
have a relatively simple life cycle and generally are opportunistic generalists, which
limits their potential for ecological research (Kammenga et al., 2007). Microarray
technology has great potential in providing a different and more efficient approach for
identifying genes related to ecological and evolutionary success in non-model
organisms (Ranz and Machado, 2006). Therefore, the number of field studies with non-
model species is increasing. Since in-field experiments are prone to high environmental
variation, in these studies, microarrays have been focused on differential gene
expression associated to large effects, as in behavioural transitions in bees (Whitfield et
al., 2003). A clear assumption of ecological microarray studies relies on the evolutionary
pressure to which expression levels are subjected to. Thus, differences in expression
levels among taxa are mostly or even certainly due to adaptation to different
environments (Kammenga et al., 2007). According to Whitehead and Crawford (2006),
variation in gene expression within and among species is largely determined by natural
selection. When working with natural populations it is important to account the
sensitivity of gene expression levels to environmental variations. However, the effect of
these variations can be overcome through the use of sufficient biological replicates
obtained from in-field material to achieve statistical significance (Whitehead and
Crawford, 2006). Besides the obvious drawbacks encountered when using biological
data from natural populations, they often offer an advantage over most common used
organisms since they are subject to natural selection, and biologically important
changes in gene expression can be identified. According to Kammenga and
colleagues (2007), this assumption is based on the postulate that variation in the
expression of a gene which has evolved by selective pressures is biologically important
since natural selection can only act on variation that causes phenotypic changes
affecting the longevity, reproductive fitness or probability of survival (Oleksiak et al.,
2001).
2.2.5. Quantitative real-time PCR (qPCR)
Real-time polymerase chain reaction (qPCR) provides quantitative data analysis
in molecular medicine, biotechnology, microbiology and molecular diagnostics and
has become the method of choice for quantifying gene expression (Mocellin et al.,
2003). Essentially, real-time PCR amplifies a specific target sequence in a sample whilst it
monitors the amplification progress using fluorescent technology (Valasek and Repa,

Chapter 2- Labellum transcriptome after pollination
46
2005). Quantitative real-time PCR amplifies the cDNA using PCR technique, detects and
quantifies amplification products in real time (Nolan et al., 2006). qPCR has become the
technique of choice in gene expression analysis, namely in the confirmation of data
obtained from microarray studies (Bustin et al., 2005). Due to lack of consensus on how
to perform and best interpret qPCR experiments, Bustin et al.(2009) proposed a set of
guidelines that describe he minimum information necessary for evaluating qPCR data,
named as MIQE (Minimum Information for Publication o Quantitative Real-Time PCR
Experiments). In these guidelines, experimental variations (e.g. amount of starting
material, RNA extraction and reverse transcription efficiencies) are evaluated when
gene expression is measured in different samples, namely to guarantee technical
reliability (Bustin et al., 2005; Silver et al., 2006; Bustin et al., 2009). Intersample variation
between biological and technical replicates can interfere with data analysis thus
normalization to one or more reference genes is crucial (VanGuilder et al., 2008).
Accuracy of qPCR relies on the normalization performed with reference genes, based
on the assumptions that their expression is: (i) similar among all samples in a given tissue
under study; (ii) resistant to experimental conditions; and (iii) undergoes all steps of the
qPCR with the same kinetics as the target gene (Silver et al., 2006; VanGuilder et al.,
2008). Reference genes such as 18S rRNA, GAPDH (glyceraldehyde-3-phosphate
dehydrogenase), cyclophilin, α and β-tubulin and β-actin are commonly used as they
are ubiquitously expressed in cells and tissues (VanGuilder et al., 2008). Although the use
of reference genes is commonly accepted as the most appropriate normalization
strategy (Huggett et al., 2005), their utility must be experimentally validated for
particular tissues or cell types and specific experimental designs (Bustin et al., 2009).
Real-time PCR reactions are carried out in a thermocycler that allows measurement of
a fluorescent detector molecule, which decreases post-processing steps and minimizes
experimental error (Nolan et al., 2006; VanGuilder et al., 2008). Frequently used
fluorescence based technologies, include: (i) probe sequences that fluoresce upon
hydrolysis (TaqMan®, Applied Biosystems) or hybridization (LightCycler®, Roche), (ii)
fluorescent hairpins or (iii) intercalating dyes (e.g. SYBR® Green).
SYBR Green I (SG), the most widely used intercalating dye in real-time PCR
applications, is included in many commercially available kits at undisclosed
concentrations (Giglio et al., 2003; Nolan et al., 2006). Major advantages in using a SYBR
Green I approach include: nonspecifity binding of SG to DNA; melt curve analysis
required for confirming the generation of a unique/specific amplicon (Bustin et al.,
2005) and relatively inexpensive when compared to other detection chemistries [e.g.
FRET, iFRET, scorpions, molecular beacons, Taqman (Giglio et al., 2003).
Real-time PCR requires the design of specific oligonucleotides for each gene to
be analysed. Therefore, a widely applied strategy is to identify potentially interesting

Chapter 2- Labellum transcriptome after pollination
47
genes with microarray experiments and confirm those candidates qPCR analysis (Klok
et al., 2002; Gachon et al., 2006; Figueiredo et al., 2008; Fortes et al., 2008; Sebastiana et
al., 2009). Indeed, the reliability of plant microarray experiments may sometimes be
questioned, since plants display a high number of multigenic families (a distinctive
feature of plant genomes as opposed to animals) and cross-hybridization between
cDNA representative members of gene families on cDNA-based chips may lead to
false interpretations (Gachon et al., 2004).
Thus, qPCR has become the method of choice for high-throughput and
accurate expression profiling of selected genes in gene expression analysis, due to its
sensitivity, reproducibility and large dynamic range (Spurgeon et al., 2008). Moreover,
real-time PCR has become a routine and robust approach for measuring the expression
of genes of interest, validating microarray experiments, and monitoring biomarkers
(Figueiredo et al., 2008; Fortes et al., 2008; Sebastiana et al., 2009; Fenart et al., 2010).

Chapter 2- Labellum transcriptome after pollination
48
2.3. Material and methods
2.3.1. Experimental design
Studies regarding pollination processes and dynamics in general and,
particularly in Ophrys, are scarce. O. sphegodes pollination dynamics was first studied
by Schiestl and co-workers (1997) and later by Schiestl and Ayasse (2001), with different
time points tested (2-4 days after pollination and 1 or 2-4 days, respectively). Time points
used for this study in O. fusca were 2 and 4 days after pollination (DAP) and were based
on chemical dynamics reported earlier for O. sphegodes (Schiestl et al., 1997; Schiestl
and Ayasse, 2001). O. fusca labellum was selected for analysis due to its role on eliciting
copulatory behaviour on male pollinators, namely by releasing compounds similar to
those emitted by the sex pheromones of virgin females of the pollinator species and by
tactile (i.e. trichomes) and visual (i.e. color, shape) cues (Schiestl et al., 2000; Ascensão
et al., 2005; Schiestl, 2005). Ophrys fusca subsp. fusca (designated as Ophrys fusca
thereafter) plants were selected at anthesis stage and sampled from a Portuguese
natural occurring population. Hundred plants were selected in the field at anthesis
stage (i.e. fully opened flowers, with pollinia and with roughly the same developmental
stage). The experiment design achieved was as follows: 25 lips (corresponding to 5
biological replicates with 5 labella from 5 different individual plants each) were
collected from unpollinated flowers with 2 days exposure and other 25 lips after 4 days
exposure; 25 lips of pollinated flowers were collected 2 days after pollination and 25 lips
4 days after pollination (Sampling scheme is illustrated in Fig. 2.5).
Figure 2.5- Experimental design scheme. inds- five different individuals
Unpollinated pollinated
2 days 4 days
Biological replicates
2 31 4 5
5 inds 5 inds5 inds 5 inds 5 inds
2 31 4 5
5 inds 5 inds5 inds 5 inds 5 inds
2 days 4 days
Biological replicates
2 31 4 5
5 inds 5 inds5 inds 5 inds 5 inds
2 31 4 5
5 inds 5 inds5 inds 5 inds 5 inds
day 0
50 50Unpollinated pollinated
2 days 4 days
Biological replicates
2 31 4 5
5 inds 5 inds5 inds 5 inds 5 inds
2 31 4 52 31 4 5
5 inds 5 inds5 inds 5 inds 5 inds
2 31 4 5
5 inds 5 inds5 inds 5 inds 5 inds
2 31 4 52 31 4 5
5 inds 5 inds5 inds 5 inds 5 inds
2 days 4 days
Biological replicates
2 31 4 5
5 inds 5 inds5 inds 5 inds 5 inds
2 31 4 52 31 4 5
5 inds 5 inds5 inds 5 inds 5 inds
2 31 4 5
5 inds 5 inds5 inds 5 inds 5 inds
2 31 4 52 31 4 5
5 inds 5 inds5 inds 5 inds 5 inds
day 0
50 50

Chapter 2- Labellum transcriptome after pollination
49
Plants were covered with a white and inert net disposable (mesh size, 2.0 mm x
2.0 mm) for preventing pollinator’s visits either in pollinated or unpollinated flowers (Fig.
2.6). Cross- pollination was performed manually with a sterile plastic stick.
Figure 2.6- Ophrys fusca plants covered by the net disposables in the field. (A) Overview of the plants in the population under study; (B) Detail of one net disposable.
2.3.1.1. Labella collection for cDNA microarray studies
Two assays were performed in the field in order to guarantee sufficient material
for transcriptomics approach. Labella were cutted at the edge of the stigmatic surface
with a sterile scalpel and placed in 15 mL sterile tubes. Lips were immediately emerged
in liquid nitrogen and maintained in dried ice (avoiding RNA degradation) until storage
at -80 ºC.
2.3.2. Total RNA extraction
Total RNA from Ophrys fusca labella was extracted following the Hot Borate
method (Wan and Wilkins, 1994) with minor modifications. This method was designed for
isolating RNA of recalcitrant plant tissues with high levels of phenols, secondary
metabolites and/or polysaccharides that influence RNA extraction. Briefly, 1 g of
grinded plant material were added to 10 mL of extraction buffer (0.2 M sodium
tetraborate, 30 mM EGTA, 1 % (w/v) SDS, 1 % (w/v) deoxycholic acid, 10 mM DTT, 1 %
(w/v) Nonidet P-40, 2 % (w/v) PVP-40), previously heated to 90 ºC. After Proteinase K (0.3
mg mL-1) (Invitrogen, Paisley, UK) addition and homogenization by vortexing, samples
were incubated for 90 mins at 42 ºC and 150 rpm (KS 4000i control, IKA®). For protein
precipitation, 160 mM KCl was added and samples were kept on ice for 1 hour. After
B A

Chapter 2- Labellum transcriptome after pollination
50
centrifugation at 9500 xg during 30 mins at 4 ºC (3K18, Sigma Laboratory Centrifuges),
supernatant was collected and precipitated overnight with 2 M LiCl. The pellet was
collected by a 30 mins centrifugation at 12000 xg (4 ºC), then washed three times with
cooled 2 M LiCl and supernatant recovered by centrifugation for 15 mins at 12000 xg
(4ºC) between each washing step. Pellet was resuspended in 10 mM Tris-HCl pH 7.5
After a 10 mins centrifugation at 12000 xg, supernatant was collected and
polysaccharides were selectively precipitated with 0.2 M KAc pH 5.5 on ice for 30 mins.
Supernatant was recovered by a 10 mins centrifugation at 12000 xg and 4 ºC. For RNA
precipitation 2.5 x volumes of 100 % ethanol were added and samples were kept -80 ºC
for 2 h. Later on, samples were then centrifuged for 30 mins at 9800 xg (4 ºC) and pellet
washed with 4 mL of cooled 70 % ethanol. Supernatant was recovered by
centrifugation at 9800 xg for 10 mins at 4 ºC and dried in the fume hood. Once dried,
pellet was resuspended in 300 L of ddH2O depc and total RNA was precipitated
overnight at -20 ºC with 0.1 x volume NaAc 3 M pH 6.0 and 2.5 x volumes of 100 % EtOH.
Following, precipitated RNA was recovered by a 30 mins centrifugation at 14000 xg (4
ºC) and then washed with 70 % ethanol. Finally, Total RNA was dried and resuspended
with depc ddH2O. All solutions used were treated with DEPC (Sigma), overnight under
agitation and then autoclaved for 30 mins (120 ºC, 1 atm). RNA quality was accessed
by gel electrophoresis 1.2 % (w/v) with ethidium bromide (10 mg mL-1, Sigma) and also
by values of A260/A280 within 1.8-2.0 (Sambrook et al., 1989) and of A260/A230
above 2 (Wilkins and Smart, 1996). RNA concentration was determined using a UV-
visible spectrophotometer (UV-1603, Shimadzu), according to the equation [total RNA]
= 40 x (A260/A320) x dilution factor/ 1000, and also by using Nanodrop® ND-1000
(Thermo Fisher Scientific, USA). Total RNA was stored at -80 ºC until further use.
2.3.3. mRNA purification
Messenger RNA (mRNA) was purified from 150 μg and 100 μg of total RNA
labella from unpollinated and pollinated flowers, respectively, using the FastTrack®
MAG mRNA Isolation Kit (Invitrogen, Paisley, UK), according to the manufacturer
instructions. Briefly, about 500 μL of preheated Binding buffer B6 at 65 ºC was added to
RNA samples and equal volume of RNase-free water. After, 100 μL of FastTrack® MAG
Beads were immediately added to samples. Through a 10 mins centrifugation at room
temperature at 16000 xg, ribosomal RNA was removed by discarding supernatant.
Messenger RNA (mRNA) was washed four times with 500 μL Wash Buffer W7. Both
mRNAs purified were resuspended in 20 μL ddH2O depc and analyzed by 1.2 % (w/v)
agarose gel electrophoresis with ethidium bromide (10 mg/mL) to access mRNA quality.

Chapter 2- Labellum transcriptome after pollination
51
2.3.4. Construction of cDNA libraries following Gateway® technology
Messenger RNA of labella from unpollinated and pollinated Ophrys fusca flowers
was used to create two cDNA libraries: one library from unpollinated flower lips
(including 2 and 4 days’ time points) and another library with lips from pollinated ones
(2 and 4 days’ time points). Complementary DNA libraries were constructed using
CloneMinerTM cDNA library Construction Kit (Invitrogen, Paisley, UK), according to
manufacturer instructions (Karnaukhova et al., 2003). This technique combines the
performance of SuperscriptTM II reverse transcriptase with the Gateway® technology,
without the use of traditional restriction enzyme cloning methods. Due to limitations in
plant material, approximately 3 μg of mRNA was used for performing unpollinated
cDNA library, while for pollinated library construction 2 μg were used.
2.3.5. Library characterization
Redundancy in each library was evaluated by randomly sequencing 24 and 23
cDNA entry clones from unpollinated and pollinated libraries, respectively, with M13
forward primer (5’-TGCAACATTTTGCTGCC-3’) of the CloneMiner TM cDNA library
Construction Kit (Invitrogen, Paisley, UK). Briefly, bacteria containing the selected clone
were grown overnight in liquid LB media supplemented with kanamycine (50 μg mL-1)
at 37 ºC and 200 rpm (KS 4000i control, IKA®). Plasmid DNA was extracted according
Birnboim and Doly (1979) and resuspended in 20 μL deionised water. Contaminant RNA
was removed through an incubation step at 37 ºC for 30 mins, with 2 μL of RNase (10
mg mL-1). Plasmid DNA quantity and quality was accessed in a 1 % (w/v) agarose gel
by using λ DNA (Fermentas) of known concentration.
Average insert size and percentage of recombinants for each library were
determined through digestion with Bsp1407I (Fermentas). Digested clones were
analyzed by 1 % (w/v) TBE agarose gel electrophoresis with ethidium bromide
(10 mg/mL) to access clone insert size and percentage of recombinant clones. After,
plasmid DNA was sequenced as described below.
2.3.6. Sequencing and sequence analysis
About 100-200 ηg of plasmid DNA were sequenced using the BigDye Terminator
v3.1 Cycle Sequencing Kit components (Applied Biosystems, Foster City, USA),
according to manufacturer instructions. Briefly, in a 10 μL reaction mixture the following
components were added: 1 μL de ABI mix (Applied Biosystems), 4 μL de 2.5 X
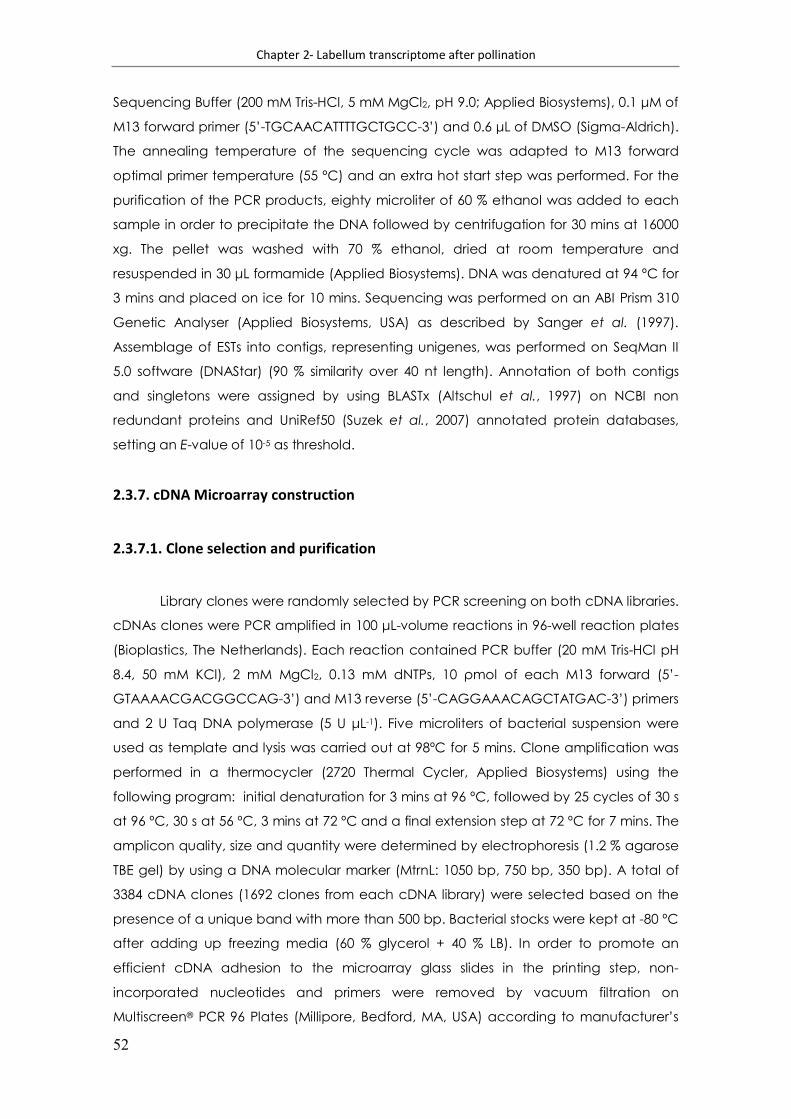
Chapter 2- Labellum transcriptome after pollination
52
Sequencing Buffer (200 mM Tris-HCl, 5 mM MgCl2, pH 9.0;; Applied Biosystems), 0.1 μM of
M13 forward primer (5’-TGCAACATTTTGCTGCC-3’) and 0.6 μL of DMSO (Sigma-Aldrich).
The annealing temperature of the sequencing cycle was adapted to M13 forward
optimal primer temperature (55 ºC) and an extra hot start step was performed. For the
purification of the PCR products, eighty microliter of 60 % ethanol was added to each
sample in order to precipitate the DNA followed by centrifugation for 30 mins at 16000
xg. The pellet was washed with 70 % ethanol, dried at room temperature and
resuspended in 30 μL formamide (Applied Biosystems). DNA was denatured at 94 ºC for
3 mins and placed on ice for 10 mins. Sequencing was performed on an ABI Prism 310
Genetic Analyser (Applied Biosystems, USA) as described by Sanger et al. (1997).
Assemblage of ESTs into contigs, representing unigenes, was performed on SeqMan II
5.0 software (DNAStar) (90 % similarity over 40 nt length). Annotation of both contigs
and singletons were assigned by using BLASTx (Altschul et al., 1997) on NCBI non
redundant proteins and UniRef50 (Suzek et al., 2007) annotated protein databases,
setting an E-value of 10-5 as threshold.
2.3.7. cDNA Microarray construction
2.3.7.1. Clone selection and purification
Library clones were randomly selected by PCR screening on both cDNA libraries.
cDNAs clones were PCR amplified in 100 μL-volume reactions in 96-well reaction plates
(Bioplastics, The Netherlands). Each reaction contained PCR buffer (20 mM Tris-HCl pH
8.4, 50 mM KCl), 2 mM MgCl2, 0.13 mM dNTPs, 10 ρmol of each M13 forward (5’-
GTAAAACGACGGCCAG-3’) and M13 reverse (5’-CAGGAAACAGCTATGAC-3’) primers
and 2 U Taq DNA polymerase (5 U μL-1). Five microliters of bacterial suspension were
used as template and lysis was carried out at 98ºC for 5 mins. Clone amplification was
performed in a thermocycler (2720 Thermal Cycler, Applied Biosystems) using the
following program: initial denaturation for 3 mins at 96 ºC, followed by 25 cycles of 30 s
at 96 ºC, 30 s at 56 ºC, 3 mins at 72 ºC and a final extension step at 72 ºC for 7 mins. The
amplicon quality, size and quantity were determined by electrophoresis (1.2 % agarose
TBE gel) by using a DNA molecular marker (MtrnL: 1050 bp, 750 bp, 350 bp). A total of
3384 cDNA clones (1692 clones from each cDNA library) were selected based on the
presence of a unique band with more than 500 bp. Bacterial stocks were kept at -80 ºC
after adding up freezing media (60 % glycerol + 40 % LB). In order to promote an
efficient cDNA adhesion to the microarray glass slides in the printing step, non-
incorporated nucleotides and primers were removed by vacuum filtration on
Multiscreen® PCR 96 Plates (Millipore, Bedford, MA, USA) according to manufacturer’s

Chapter 2- Labellum transcriptome after pollination
53
instructions. Purified PCR products were resuspended in 40 μL of deionised water,
dissolved by shaking for 30 mins at 100 rpm (Thermomixer Compact, Eppendorf), and
transferred to V bottom printing plates (Greiner- Corning, NY, USA). Plates were kept at
-20 ºC until further use.
2.3.7.2. Glass slides preparation
Two different surface coated slides were tested: homemade poly-L-lysine and
commercially available UltraGAPSTM (Corning, USA) with amino silane surface. Glass
slides (Industrial quality, Germany) were coated with poly-L-lysine. Briefly, slides were
kept on washing solution (200 g NaOH pellets, 1200 mL ethanol 100 %) overnight with
agitation. The slides were washed five times on filtered (0,45 μm filter, Millipore)
deionised water and kept on a poly-L-lysine (70 mL poly-L-lysine, 70 mL PBS in 560 mL
water solution) for 30 mins. Slides were washed again with filtered deionised water and
dried by centrifugation at 100 xg for 10 mins at room temperature (3K18, Sigma
Laboratory Centrifuges). Coated slides were kept on a dry and light-protected
environment until further use.
2.3.7.3. Printing parameters
Microarray printing was performed with a VersArray ChipWriter Compact System
(Biorad) with 12 printing pins (Telechem International, Sunnyvale, CA, USA). The
following parameters were established: number of printing plates (36), number of
clones to be printed (3384), number of replicated spots (2), distance between spots
(300 μm) and number of slides (24). The printing scheme was 12 subgrids, each one with
24 columns and 24 lines, repeated twice. Printing conditions, such as temperature and
relative humidity, were tested.
2.3.7.4. Microarray printing
The printing plates containing the cDNA clones were air dried and cDNA was
resuspended on 10 μL of printing buffer (50 % DMSO (Sigma-Aldrich) and 0.4 x SSC
(Invitrogen)) under agitation at 150 rpm for 90 min at room temperature (KS 4000i
control, IKA®). Negative controls were added to the plates, namely printing buffer and
a yeast gene, Yap12. Additionally, positive controls were added to the printing plates:
cDNAs sequenced from the two libraries (positive controls for hybridization process).
2 Yap1 is a yeast transcriptional activator required for oxidative stress tolerance.

Chapter 2- Labellum transcriptome after pollination
54
Prior to microarray printing, plates were shaken for one hour at 100 rpm at room
temperature (KS 4000i control, IKA®). After optimization of printing parameters, 24
coated slides were cleaned using a pressurised air- duster (1,1,1,2-tetrafluoroethane,
Dust-Pro, Sigma). Temperature and relative humidity inside the printing chamber varied
between 21.4 ºC and 22.0 ºC and between 48 % and 53 %, respectively. After printing,
slides were kept inside the printing chamber overnight, so that spots could be fully
dried. Binding of DNA to the coated surface of slides (cross-linking) was achieved by
keeping the slides for 5 mins at 80 ºC and 3 mins under exposure to 70 mJ of U.V. light.
Slides were set on a dry and light-protected environment, until further use.
2.3.7.5. Gel star staining
Gel star staining was used to evaluate printing quality. GelStar® nucleic acid gel
stain can be used for sensitive fluorescent detection of double-stranded (ds) and single-
stranded (ss) DNAs, oligonucleotides and RNA in gels. Slides were kept in a 1/10000 TBE
diluted Gel Star® solution (FMC, Rockland, ME) for 6 mins, under agitation (KS 4000i
control, IKA®), followed by three washes of 15 mins each on 1x TBE pH 8.0 and one
washing step by immersion in deionised water. Slides were dried by centrifugation
(3K18, Sigma Laboratory Centrifuges) at 260 xg for 5 mins, at room temperature for
UltraGAPSTM Coated Slides (Corning, USA) or 260 xg for 10 mins for Poly-L-lysine slides
(homemade slides). Image was acquired at 532 nm (Cy3 channel) using a VersArray
ChipReader® vs 3.1. Build 1.68 (BioRad, USA) scanner.
2.3.8. RNA labelling and microarray hybridization
2.3.8.1. RNA amplification
RNA amplification was achieved for all biological replicates of unpollinated and
pollinated samples, for both 2 days and 4 days’ time points, by using 1 μg of total RNA
with the MessageAmpTM II aRNA Amplification Kit (Ambion, Applied Biosystems),
following manufacturer instructions. Briefly, In vitro transcription was performed in 20 μL-
volume reactions and antisense RNA (aRNA) was synthesized through incubation at 37
ºC for 14 h. After purification, aRNA was eluted in 100 μL of depc water and kept at -80
ºC until further use. RNA concentration and quality was evaluated by using a
Nanodrop® ND-1000 (Thermo Fisher Scientific, USA), through values of A260/A280 within
1.8-2.0 (Sambrook et al., 1989) as well as values of A260/A230 above 2 (Wilkins and
Chapter 2- Labellum transcriptome after pollination
55
Smart, 1996). RNA quality was also accessed through gel electrophoresis 1.2 % (w/v)
with ethidium bromide (10 mg mL-1, Sigma).
2.3.8.2. Target labelling
Two micrograms of aRNA from each biological replicate was reverse transcribed
and labelled following RPN 5660 CyScribeTM cDNA Post Labelling Kit (Amersham, GE
Healthcare). Labelled cDNAs were purified with the CyScribeTM GFXTM purification kit
(Amersham, GE Healthcare), according to manufacturer instructions. Unpollinated
cDNA was labelled with Cy3-dUTP (control) and pollinated cDNA was labelled with
Cy5-dUTP (test). Labelled cDNAs were kept at -20 ºC until further use.
2.3.8.3. Pre-hybridization washes (slide blocking)
This step has the purpose of blocking the unused surface of the slide and
removing loosely bound probe DNA from coated slides. Slides blocking was performed
by keeping the slides in 1 % BSA (fraction V, Sigma), 5 X SSC (Invitrogen, Paisley, UK) and
0.1 % SDS solution for 30 mins at 50 ºC. The blocking solution was previously
homogenized for 30 mins at 50 ºC. After incubation in the blocking solution, slides were
washed in 0.1 % SDS for 1 min, under low agitation (KS 4000i control, IKA®). Following a
washing step with 2 X SSC for 3 mins with agitation, a 0.2 X SSC solution for 3 mins with
100 rpm agitation was carried out. All washing steps were performed at room
temperature. The slides were dried by centrifugation at 260 xg during 5 mins at room
temperature (3K18, Sigma Laboratory Centrifuge) and with a pressurised air-duster
(1,1,1,2-tetrafluoroethane, Dust-Pro, Sigma). All the solutions were prepared with filtered
(0.45 μm, Millipore) and with sterile deionised water. Washing steps was performed in
glass containers (VWR Scientific).
2.3.8.4. Hybridization conditions
Labelled cDNA (40 μL) was added to the hybridization mixture containing: 1.6 μL
of poly-A DNA (10 mg mL-1, Sigma), 1.6 μL salmon sperm DNA (5 mg mL-1, Invitrogen), 1.6
μL of 50 X Denhardt´s solution (1 % Ficoll (type 400), 1 % PVP-40, 1 % BSA), 8.45 μL of 20X
SSC and 1.69 μL of 10 % SDS. The hybridization mixture was denatured at 97 ºC for 2
mins, and cooled to 60 ºC. One microliter of 10 X DIG blocking buffer (Roche Applied
Science, Mannheim, Germany) was added and the mixture was centrifuged at room
temperature for 30 s at 16000 xg (Biofuge pico, Heraeus) to eliminate air bubbles.

Chapter 2- Labellum transcriptome after pollination
56
Application of pressurised air- duster (Dust Pro, Sigma) on the slide as well as on the
cover-slip was performed for dust particles removal. Hybridization solution was heated
at 60 ºC, applied over the array and covered with a cover-slip (60 mm x 24 mm) (Hybri-
slips, Sigma). Slides were placed in a hybridization chamber (ArrayIt Hybridization
Cassette, Telechem) and 10 μL of H2O was added in each corner of the chamber
before sealing. The hybridization chamber was kept in a water bath at 60 ºC for 17 h
inside an incubator (Memmert, Celsius).
A total of 14 hybridizations were achieved. For each time point, seven
hybridizations were carried out matching five biological replicates and two technical
replicates, i.e. repetition of two different biological replicates with the same labelling
chemistry.
2.3.8.5. Post- hybridization washes (background removal)
Following hybridization, slides were put in a 0.5 X SSC and 0.1 % SDS solution for
coverslip removal. After, slides were washed with 0.5 X SSC and 0.1 % SDS for 15 mins
with agitation at 60 rpm, at room temperature (KS 4000i control, IKA®). Second wash
step was performed with a 0.5 X SSC and 0.001 % SDS solution, and kept for 15 mins
under agitation at 60 rpm at room temperature. Two more washes in 0.06 X SSC solution
were carried out (2 mins and 1 min, respectively) at room temperature with agitation at
60 rpm. Slide washing was performed in the dark, and solutions were prepared with
filtered (0.45 μm, Millipore) and sterile deionised water. Finally, slides were dried by
centrifugation at 260 xg for 5 mins at room temperature (3K18, Sigma Laboratory
Centrifuge) and with a pressurised air- duster (1,1,1,2-tetrafluoroethane, Dust-Pro,
Sigma). The dried microarray was stored in a light-free environment and kept at room
temperature until scanning. Scanning was carried out as soon as possible since the
fluorescent dyes degrade over time.
2.3.9. Image and data collection
Microarray image was acquired with VersArray ChipReader® vs 3.1. Build 1.68
(BioRad, USA) scanner. The slides were scanned simultaneously at 535 nm (Cy3) and 635
nm (Cy5) with a 5 km resolution and 100 % laser power. Excitation light induces
fluorescence: Cy3 emits light in the green part of the visible spectrum (573- 613 nm) and
Cy5 emits light in the red part of the visible spectrum (672- 712 nm), the emitted light is
then detected by the scanner. Other parameters, like laser sensitivity, were manually
adjusted to achieve a similar intensity in both channels (evaluated by analysis of the
signal intensity histogram). The images acquired were processed with the VersArray
Chapter 2- Labellum transcriptome after pollination
57
AnalyserTM software vs 4.5.1.46 (BioRad, USA). This software creates a grid over the spots
and uses an algorithm to identify each spot and to analyse both spot and background
intensities. Both images from one microarray slide are opened with an image-analysis
software and a grid is created on both. The grid defines the spot area from which the
signal is extracted by the image-analysis software. Quality of the spots was accessed
and data extracted were flagged and excluded from further analysis if spots fail to fulfil
the required conditions: background was calculated as the trimmed mean of pixel
intensity on spots local corners; low intensity3 signal spots (trimmed mean of raw
intensity/ trimmed mean of background < 1.4); uneven background4 (trimmed mean of
raw intensity/ standard deviation of background < 2); uneven spots5 (trimmed mean of
raw intensity/ standard deviation of raw intensity < 1) and not validated spots or flags
(e.g. saturated spots, spots failed to print) were removed from analysis before
normalization. Also, spots with trimmed mean raw intensity in Cy3 and/or Cy5 channel
above 50 000 counts considered saturated (Shena, 2002), were flagged and excluded
from analysis. The output of the software is a Microsoft Excel® table with the following
parameters: spot number; grid; column; line; position (grid:line:column); trimmed mean
of the spot intensity in the Cy5 channel; trimmed mean of the background intensity in
the Cy5 channel; trimmed mean of the spot intensity in the Cy3 channel; trimmed
mean of the background intensity in the Cy3 channel; and flags. Each line of the table
corresponds to one of the spots in the microarray.
2.3.10. Statistical analysis
2.3.10.1. Data normalization and processing
Data were normalized with Gene Expression Profile Analysis Suite (GEPAS)
software version 3.1 (Herrero et al., 2003a) and Diagnosis and Normalization for
Microarray Data (DNMAD) (Vaquerizas et al., 2004) software
[http://gepas.bioinfo.cnio.es]. The print-tip LOWESS method (Yang et al. 2002) was used
for within-slide normalization considering background subtraction (Appendix II).
Normalized data, which were then processed with the Expression Data Preprocessor
(Herrero et al., 2003b) software, were selected considering: filter missing values with 70 %
of minimum percentage of existing values and background correction.
3 Spots that have signal lower than 1.4 times its local background. 4 Also known as signal-to-noise ratio. Spots that have dust particles or shifted neighbour spot that might affect signal intensity. 5 Smeared and doughnut shaped spots.

Chapter 2- Labellum transcriptome after pollination
58
2.3.10.2. Identification of differentially expressed genes
Differentially expressed genes were statistically identified with the rank product
(RP) method (Breitling et al., 2004) runned in Bioconductor using the RanKProd package
version 2.20.0 (http://www.bioconductor.org/packages/release/bioc/html/RankProd.html) with
1000 balanced permutations. Genes were considered differentially expressed when
presenting a false positive rate (FPR) of 0.05 (5 % of chance in having false positive
values) and 1.3 fold change cut off was also set as threshold.
2.3.11. Sequencing and sequence analysis
Clones considered differentially expressed were sequenced and analysed as
described previously (see section 2.3.6. Sequencing and sequence analysis). Gene
ontology (GO) classification was accomplished by accessing GO annotation files
resulting from the obtained UniRef50 accession homologies on Unref50 database. The
GO terms were selected at the parental class Biological process (first level). Since
several transcripts had no GO term retrieval, mainly due to the low number of unigenes
analysed in our study when compared to high throughput 454 sequencing programs
(Bettencourt et al., 2010; Parchman et al., 2010), transcripts were additionally grouped
into functional categories according to MIPS Functional Catalogue Database
classification (Ruepp et al., 2004). The Functional Catalogue (FunCat) is a hierarchically
structured, organism independent, flexible and scalable controlled classification system
enabling the functional description of proteins from any organism (Ruepp et al., 2004).
2.3.12. Quantitative real time PCR (qPCR)
2.3.12.1. Sample preparation
Quantification by real-time PCR was performed using the same RNA samples
used in microarray hybridizations (see section 2.3.8.1. RNA amplification). DNAse
treatment was done with the Turbo DNA- free kit (Ambion, Inc.), following
manufacturer’s instructions. Synthesis of cDNA from aRNA was performed using
RevertAid® H Minus Reverse Transcriptase (Fermentas, Ontario, Canada) according to
manufacturer’s instructions. Briefly, a mixture of 2μg of aRNA, together with 3 μL of N9
random primers (GE Healthcare) and DEPC-treated deionized water to a total volume
of 13 μL, was heated at 70 ºC for 10 mins and, after, immediately chilled on ice. Four
microliters of 5 x Reverse Transcriptase Buffer (Fermentas) were added, together with 2
μL of 10 mM dNTPs, 0.5 μL of Ribolock (Fermentas) ribonuclease inhibitor. This mixture

Chapter 2- Labellum transcriptome after pollination
59
was incubated at 25 ºC for 5 mins, after which 1 μL (200 U) of RevertAid® H Minus
Reverse Transcriptase (Fermentas) was added. Reverse transcription was allowed to
occur at 25ºC for 10 minus followed by 1 h at 42 ºC and stopped by heating the
samples at 70 ºC for 10 mins.
2.3.12.2. Oligonucleotide design
Primer sequences were designed using Primer Express version 3.0 (Applied
Biosystems, USA). Quality of the designed oligonucleotides was evaluated using the
following software’s: Primer Express version 3.0 (Applied Biosystems), PrimerSelect
(Lasergene, DNAStar Inc., USA) and DNA Calculator (Sigma-Genosys, Sigma-Aldrich
Inc.). Oligonucleotide sequences, annealing and melting temperatures, and amplicon
sizes of validated genes are presented in Table 2.1. Reference genes used to normalize
the expression of target genes encode for: 40S ribosomal protein S10-like (Acc.No.
HO849881); oligopeptidase, putative (Acc.No. HO850106) and 4-α-glucanotransferase
(Acc.No. HO849990).
Table 2.1. Oligonucleotide sequence, annealing (Ta) and melting (Tm) temperatures and amplicon size (bp) used for transcript quantification reactions in the StepOneTM Real Time PCR Systems (Applied Biosystems). F- forward; R- reverse.
Target sequence GenBank ID Primer sequence Ta /Tm (ºC)
Length (bp)
40S ribosomal protein S10-like HO849881 F: TGATGCAGAGCTTCAAGTCG 58/ 81 154 R: TTCGCGGACTTTTTCAGAGT Oligopeptidase, putative HO850106 F: GTATGCCCTCACGCCAGTTC 58/ 79 110 R:ATAGATAGACATTGGCTGTTCGGATA 4-α-glucanotransferase HO849990 F: GGAGTTGGGATTGATCGGTCTA 58/ 79 130 R: GCATGGTGGAGCAGTCATGA Pathogenesis-related protein 10c HO849917 F: AATCTCGGCCCCAAACTCCT 60/ 83 245
R: ACTTCCCTTCGGCTCCACC Class III chitinase HO850071 F: ACCCAAACCTCTCCTCTCTATCCT 61/ 82 101 R: TCCCTTCGTTCCCGTTCTG Chaperone HO849934 F: TTTCGCCGACACCAACATC 60/ 82 100 R: ACCTCTACCTTGACCTCCTCTTTCT Catalytic/ glucosylceramidase HO850028 F: GGGCGGTGTTGAATGAAGAT 56/ 77 124 R: TTCACTTCGTTCCAGGGATCA Stearoyl-acyl-carrier desaturase (SAD1)
HO849909 F: TGGAAAACTGGGCTGAAAA 56/ 81 247
R: GTCTCATCTCTAACCCCGTC Metallothionein protein type 3 HO850065 F: AGTGAATATGATGTTGAGA 54/ 81 223 R: ACCAAACAGCACAATCTCACA ACP-stearoyl desaturases (SAD2)
HO849908 F: GCACTACTTTCATCCCCATT 58/ 85 250
R: TCTCCCTCACCGCATCCCC

Chapter 2- Labellum transcriptome after pollination
60
2.3.12.3. Relative quantification through qPCR: experimental settings
Seven genes (5 % of the differentially expressed unigenes) were evaluated by
qPCR (StepOneTM Real Time PCR, Applied Biosystems), following MIQE Guidelines (Bustin
et al., 2009, 2010). qPCR reactions were set up with the components supplied in the
MaximaTM SYBR Green qPCR Master Mix (2x) kit (Fermentas, Ontario, Canada). A final
concentration of 2.5 mM MgCl2 and 0.2 μM of each primer were used on 25 μL volume
reactions, together with cDNA as template. Five biological replicates with two technical
replicate reactions were used for each condition and time point. Three reference
genes (40S ribosomal protein S10-like- HO849881; oligopeptidase, putative- HO850106-
and 4-α-glucanotransferase- HO849990) were selected based on the RP statistics results.
Thermal cycling for all genes was initiated with a denaturation step at 95°C for 10mins,
followed by 45 cycles of denaturation at 95 °C for 15 s and annealing temperatures for
30 s. Each set of reactions included template and no template controls. Relative
quantification was performed using the relative standard curve method (Applied
Biosystems, 2008). Standard curves were generated, for both targets of interest and
reference genes, from a ten-fold dilution series (100 to 10-6) starting with 1 ng
concentration of the corresponding cDNA clone. Standard curves were plotted with
Cq (quantification cycle) values generated by cDNA clone serial dilutions against the
logarithm concentration of input template cDNA (Appendix III). The specificity of the
qPCR amplicons was confirmed by melting curve analysis (Appendix IV) and gel
electrophoresis (data not shown). For each target gene, efficiency of qPCR reaction
was calculated from the slope of the standard curve (Appendix IV). Data were
recorded with StepOneTM Software ver. 2.1. (Applied Biosystems) and final
concentrations were calculated in Microsoft Excel® datasheets. First, for reference
genes, median values were calculated for the five biological replicates in each time
point (2 DAP and 4 DAP). Normalization was performed by using the median values of
the 3 references genes against the 5 biological replicates of each of the evaluated
genes. After, fold changes were calculated by dividing the median normalized
quantity of pollinated by unpollinated samples at each time point. Mean absolute
deviation (MAD) was calculated.

Chapter 2- Labellum transcriptome after pollination
61
2.4. Results and discussion
2.4.1. Characterization of cDNA libraries
Total RNA yields ranged from 2μg- 150μg, per biological replicate. The yield was
higher in unpollinated labella than in pollinated ones. Among time points, samples from
2 days after pollination gave a yield higher than samples from 4 days. Differences in
total RNA yields may indicate decay in the RNA transcripts related to the pollination-
enhanced mechanisms, i.e. petal senescence (O’Neill, 1997). For mRNA purification,
aliquots of total RNA from the 10 replicates (5 replicates from 2 DAP and 5 replicates
from 4 DAP) of unpollinated flowers were combined. The same procedure was followed
with replicates of pollinated flowers. Poly (A)+ RNA was purified from 150 μg and 100 μg
of total RNA in labella of unpollinated and pollinated flowers, respectively (Fig. 2.7).
Figure 2.7- Gel electrophoresis of mRNA from unpollinated and pollinated Ophrys fusca labella. M- RiboRulerTM RNA ladder high range (Fermentas), lane 1- total RNA from Ophrys fusca, lane 2- mRNA pool from unpollinated Ophrys fusca labella, lane 3- mRNA pool from pollinated Ophrys fusca.
cDNA libraries titer was calculated by serial dilutions (10-2, 10-3, 10-4) of sample
aliquots resulting from the transformation step. About 100 μL of each dilution was plated
in LB containing the appropriate antibiotic. Through the titer of each plate, the average
titer of the entire cDNA library was obtained. Finally, total number of cfu was calculated
by using the ultimate volume of the library (12 mL) (Table 2.2).
M 1 2 3

Chapter 2- Labellum transcriptome after pollination
62
Table 2.2. Titer determination of the two cDNA libraries constructed.
.
Serial dilution titer (cfu/mL) Average titer (cfu/mL) Total cfu
Unpollinated library 10-2- 6.6 x 10⁵ 10-3- 7.3 x 10⁵ 10-4- 9.0 x 10⁵
7.6 x 10⁵ 9.2 x 10⁶
Pollinated library 10-2- 3.3 x 10⁶ 10-3- 4.6 x 10⁶
10-4- 4.2 x 10⁶ 4.0 x 10⁶ 4.8 x 10⁷
cDNA libraries constructed have an expected total cfu as established in
CloneMiner TM cDNA library Construction Kit (Invitrogen, Paisley, UK). Differences in final
titers between constructed libraries may be related to the input of mRNA used, since
quantification is difficult and sometimes inaccurate (mainly due to the low
concentration). Qualitative characterization of the two libraries was carried out by
clone restriction analysis and redundancy determined by sequencing. Clone restriction
analysis allowed measurement of insert clone size (Table 2.3).
Table 2.3. Clone’s digestion results for both unpollinated and pollinated libraries, with insert size information (kb) and recombinant‘s percentage.
Random sequencing of the cDNA libraries was done in order to evaluate
redundancy within and between cDNA entry clones generated by the two constructed
libraries. Forty-seven cDNA clones were randomly sequenced: 24 from unpollinated
library (Table 2.4) and 23 from pollinated one (Table 2.5).
Random sequencing of the cDNA entry clones of both libraries allowed the
identification of 34 unique sequences presenting homology with databases, 17 in
unpollinated library and 17 in pollinated library. Unigenes identified can be included in
different functional categories, mainly: metabolism [Cinnamate 4-hydroxylase (Allium
sativum), 4E-19; Long-chain-fatty-acid CoA ligase, putative (Ricinus communis), 1E-5;
Gl1 protein (Zea mays), 6E-50]; energy [Oxygen-evolving enhancer protein 1,
chloroplastic (Ricinus communis), 6E-27; ATP synthase subunit D (Ricinus communis), 3E-
33]; transcription [MADS box protein DOMADS3 (Dendrobium grex Madame Thong-In),
Analysed clones
Recombinants (%)
Average Insert Size (kb)
Insert Size Range (kb)
Unpollinated library
24 93 1.020 0.4-2.5
Pollinated library 23 100 1.5 0.6-5.1

Chapter 2- Labellum transcriptome after pollination
63
2E-57]; cell fate [Aspartic proteinase 12 (Fagopyrum esculentum), 1E-25; CK2 alpha
subunit (Nicotiana tabacum), 3E-16; serine carboxypeptidase (Matricaria chamomilla),
4E-57;; γ -expansin natriuretic peptide (Alnus glutinosa), 3E-41]; cell rescue, defense and
virulence [Peptidyl-prolyl cis-trans isomerase (Vanda hybrid cultivar), 6E-72; Abscisic
acid stress ripening protein homolog (Prunus mume), 3E-13]; protein fate [polyubiquitin
(Pinus sylvestris), 2E-85]; and protein synthesis [Translation elongation factor 2 (Andalucia
godoyi), 1E-42; 40S ribosomal protein S10 (Oryza sativa subsp. japonica), 3E-47]. Nine of
the sequenced transcripts did not present any homology with databases.

Chapter 2- Labellum transcriptome after pollination
64
Table 2.4. Unigenes resulting from randomly sequenced cDNA clones from unpollinated cDNA library from Ophrys fusca labella. GenBank Acc.No., Predicted function (species) retrieved by BLASTx from Uniref50, GO term (1st level- Biological Process), E-value and Clone/Contig information are presented.
(n)- n represents the number sequences contained in the corresponding contig.
GenBank Acc.No. Predicted function (species) GO term E-value Clone/Contig
Unpollinated library cDNA clones
HO849876 Putative uncharacterized protein (Vitis vinifera) 4E-18 Ofup#1
HO849880 Non-specific lipid-transfer protein (Gymnadenia conopsea) GO:0006869 3E-27 Ofctgup#2(2)
HO849879 no homology Ofup#6
HO849880 Regulator of ribonuclease activity A (Zea mays) GO:0051252 7E-21 Ofup#11
HO849881 40S ribosomal protein S10 (Oryza sativa subsp. japonica) 3E-47 Ofup#19
HO849882 ATP synthase subunit D, putative (Ricinus communis) GO:0015991 9E-37 Ofup#20
HO849897 no homology Ofup#49
HO849898 no homology Ofup#52
HO849899 Aluminum-induced protein (Elaeis guineensis var. tenera) 2E-23 Ofup#53
HO849982 Peptidyl-prolyl cis-trans isomerase (Vanda hybrid cultivar) GO:0006457 6E-72 Ofup2353
HO849883 Protochlorophyllide reductase, chloroplastic (Cucumis sativus) GO:0015979 9E-54 Ofup#21
HO849886 Protein tipD, putative (Ricinus communis) 2E-21 Ofup#29
HO849885 Putative uncharacterized protein (Volvox carteri f. nagariensis) 1E-15 Ofup#27
HO849887 no homology Ofup#32
HO849888 Predicted protein (Populus trichocarpa) GO:0006468 6E-14 Ofup#34
HO849889 Cinnamate 4-hydroxylase (Allium sativum) GO:0055114 4E-19 Ofup#35
HO849890 Oxygen-evolving enhancer protein 3 (Hyacinthus orientalis) GO:0015979 1E-17 Ofup#36
HO849891 no homology Ofup#37
HO849896 no homology Ofup#47
HO849892 Translation elongation factor 2 (Andalucia godoyi) GO:0006414 1E-42 Ofup#39
HO849893 Oxygen-evolving enhancer protein 1, chloroplastic (Ricinus communis) GO:0015979 6E-27 Ofup#41
HO849894 Putative uncharacterized protein (Vitis vinifera) 6E-25 Ofup#44
HO849895 Oxygen-evolving enhancer protein 1, chloroplastic (Solanum tuberosum) GO:0015979 3E-41 Ofup#46

Chapter 2- Labellum transcriptome after pollination
65
Table 2.5. Unigenes resulting from randomly sequenced cDNA clones from pollinated cDNA library from Ophrys fusca labella. GenBank Acc.No., Predicted function (species) retrieved by BLASTx from Uniref50, GO term (1st level- Biological Process), E-value and Clone/Contig information are presented.
(n)- n represents the number sequences contained in the corresponding contig.
GenBank Acc.No. Predicted function (species) GO term E-value Clone/Contig
Pollinated library cDNA clones
HO849994 Sterol desaturase, putative (Ricinus communis) GO:0006633 1E-35 Ofctg459(2)
HO849995 CYP71D48v1 (Nicotiana tabacum) GO:0055114 1E-5 Ofp2624
HO849996 Cytochrome P450 protein (Vanda hybrid cultivar) GO:0055114 1E-43 Ofp#13
HO850015 no homology Ofp#5
HO850007 Abscisic acid stress ripening protein homolog (Prunus mume) GO:0006950 3E-13 Ofp#3
HO849997 Putative GDSL-like lipase/acylhydrolase (Oryza sativa subsp. japonica) GO:0006629 2E-37 Ofp1250
HO849999 Polyubiquitin (Pinus sylvestris) 2E-85 Ofctgp#9(2)
HO850000 Aspartic proteinase 12 (Fagopyrum esculentum) GO:0006508 1E-25 Ofp#12
HO850001 Long-chain-fatty-acid CoA ligase, putative (Ricinus communis) GO:0008152 1E-5 Ofp#14
HO850143 Ribulose-phosphate 3-epimerase (Glycine max) GO:0008152 6E-55 Ofp#23
HO850002 no homology Ofp#18
HO850003 MADS box protein DOMADS3 (Dendrobium grex Madame Thong-In) GO:0006355 2E-57 Ofp#19
HO850014 no homology Ofp836
HO850005 Snakin-like cysteine rich protein (Phaseolus vulgaris) 3E-24 Ofp#24
HO850006 Endoxyloglucan transferase (Arabidopsis lyrata subsp. lyrata) GO:0006073 3E-51 Ofp#25
HO850010 Gl1 protein (Zea mays) GO:0006633 6E-50 Ofp#17
HO850008 CK2 alpha subunit (Nicotiana tabacum) GO:0006468 3E-16 Ofp#4
HO850009 Beta-ketoacyl-ACP synthase II (Elaeis oleifera) GO:0008152 1E-13 Ofp#8
HO850012 Gamma-expansin natriuretic peptide (Alnus glutinosa) 7E-41 Ofctg453(2)
HO850013 Serine carboxypeptidase (Matricaria chamomilla) GO:0006508 4E-57 Ofp743
Chapter 2- Labellum transcriptome after pollination
66
M
M
M
A B
M
Redundancy in unpollinated cDNA library was 4 % whereas in pollinated library
about 13 % was encountered. No chimeric clones were detected. After clone
sequencing, no redundancy was found between unpollinated and pollinated cDNA
libraries. The results here presented, suggest that both constructed libraries are well
represented with high titer, wide insert size range and with low redundancy.
2.4.2. cDNA microarrays
2.4.2.1. Ophrys fusca chip construction and hybridizations
A total of 3384 cDNA clones (1692 clones from each cDNA library) were
selected based on the presence of a unique band higher than 500 bp. About 50 PCR
reactions of 96 samples each (Fig. 2.8) were performed for both libraries to achieve the
number of cDNA clones necessary for chip construction. Amplification efficiency was
71 % in both libraries.
Figure 2.8- Gel electrophoresis of PCR products resulted from a 96- well reaction representing clones generated in unpollinated (A) and pollinated (B) cDNA libraries. M- DNA molecular marker (MtrnL: 1050 bp, 750 bp, 350 bp).
Before printing, two different surfaces for coating glass slides were tested:
homemade poly-L-lysine slides and commercial UltraGAPSTM Coated slides (Corning,
USA). When using the same printing parameters, poly-L-lysine covered glass slides (Fig.
2.9A) presented coalescence of the spots and higher background when compared to
the commercial slides (Fig. 2.9B) tested.

Chapter 2- Labellum transcriptome after pollination
67
Figure 2.9- Gel Star® staining from a printing test performed on Poly-L-lysine (A) slides and on commercially UltraGAPSTM Coated Slides (B).
Figure 2.10 - Gel Star® staining from the final printing scheme. (A) Overview of whole array quality; (B) Detail of subgrids 1 and 2.
The final printing scheme established was 12 subgrids, each one with spots
distributed in 24 columns and 24 lines, repeated twice (replicated spot) (Fig. 2.10B).
Printing conditions were tested, namely temperature (20-23ºC) and relative humidity
A
B
Replicated spots
Subgrid 1 Subgrid 2
A
B

Chapter 2- Labellum transcriptome after pollination
68
(45-55%), using commercial slides. Gel Star® staining was performed in order to test
printing quality (Fig. 2.10A). After Gel Star® staining of the final printing scheme, spots
were uniformly distributed in the slide. No missing spots were detected.
To carry out the hybridizations, and due to limited amount of total RNA
available, amplified RNA (Fig. 2.11) of all biological replicates from unpollinated and
pollinated samples, in both 2 days and 4 days’ time points, was assembled. aRNA
technology was performed because it gives the quantity required for hybridizations and
for additional quantitative real-time PCR (qPCR) analysis, with few technical errors
introduced.
Figure 2.11- Gel electrophoresis of aRNA from biological replicates of unpollinated labella in 2DAP timepoint. M- RiboRulerTM RNA ladder high range (Fermentas), lane 1- total RNA from Ophrys fusca, lanes 2-6- aRNA from five biological replicates in unpollinated Ophrys fusca labella.
Li and co-workers (2004) compared the three major reverse transcription based
RNA labeling methods used in microarrays: total RNA (T-RNA), mRNA, antisense RNA
(aRNA). They found a ranking in terms of the number of differentially expressed genes
for the three methods, as follows: aRNA >mRNA >T-RNA, consistent with previous reports
(Puská et al., 2002), and proved that the biases introduced in the processes of aRNA
amplification and mRNA purification are sequence-dependent rather than
abundance-dependent. Regarding target labelling, in direct labelled experiments, dye
incorporation efficiency during mRNA reverse transcription may depend on the
transcript’s nucleotide sequences, and thus incorporation efficiency may be different
for the two dyes used in the experiment. On the other hand, indirect labelling
(Manduchi et al., 2002), which was used in the experiments here presented, lessens this
effect, despite differences in quantum efficiencies and stabilities of the dyes which can
produce a phenomenon similar to differential incorporation efficiency (Dobbin et al.,
2005). As a result, indirect labelling in aRNA has proven to be a reliable method when
M 1 2 3 4 5 6

Chapter 2- Labellum transcriptome after pollination
69
working with limited starting material. By increasing dyes incorporation efficiencies,
differences in hybridizations may be mainly attributed to biological variation.
Unpollinated biological replicates aRNA was labelled with Cy3 dye and used as control
whereas pollinated biological replicates aRNA was labelled with Cy5 dye (test) (Fig.
2.12).
Figure 2.12- Ophrys fusca cDNA microarray (partial image) acquired with a VersArray ChipReader® vs 3.1. Build 1.68 (BioRad, USA) scanner. The image results from the overlay detection of Cy5 and Cy3 dyes after hybridization with the spotted cDNA chip. This microarray represents four subgrids and cDNA from unpollinated replicates was labelled with Cy3 and cDNA from Pollinated replicates labelled with Cy5. Red spots represent up regulated genes; green spots represent down regulated genes; genes with no differential expression are represented in yellow; saturated genes are represented as white spots.
2.4.2.2. Differentially expressed genes during pollination
Differential gene expression profiling in O. fusca at 2DAP and 4DAP was
accessed through cDNA microarray comparison of labella from pollinated versus
unpollinated flowers. Microarray data have been deposited in the NCBI’s Gene
Expression Omnibus (GEO) database (Edgar et al., 2002) under the accession number
GSE28273 (http://www.ncbi.nlm.nih.gov/geo/query/acc.cgi?acc=GSE28273). Statistical
analysis revealed 277 differentially expressed transcripts at both 2 DAP and 4 DAP (8.2 %
of the total cDNA clones printed). Considering the two time points studied, the
proportion of differentially expressed genes increased from 106 in 2DAP to 171 at 4DAP.

Chapter 2- Labellum transcriptome after pollination
70
The majority of differentially expressed genes were up regulated (166 transcripts, 59.9 %)
and this was more pronounced at 4DAP (Table V) with 112 transcripts up regulated
(40.4 %). Fifty-four transcripts (19.5 %) were up regulated at 2DAP. Total down regulated
transcripts accounted for 111 genes (40.1 %), 52 (18.8 %) at 2DAP and 59 (21.3 %) at
4DAP. Assemblage of the 277 genes differentially expressed revealed 140 unigenes
(50.5 %) with 114 singletons and 26 contigs (Table 2.6). Twenty-four unigenes were
common to 2DAP and 4DAP, with 11 up regulated and 6 down regulated. Highest fold
changes were observed for clones with no identity retrieved: a transcript (acc.no.
HO850109) with 2.61 -fold up regulation at 2DAP and a transcript (acc.no. HO849981)
with 3.81 -fold down regulation at 4DAP.
Transcripts were grouped in functional categories according to their putative
function. Functional categories include: (1) no homology (23 %); (2) metabolism (19 %);
(3) cell rescue, defence and virulence (11 %); (4) unclassified (8.5 %); (5) cell fate (8.5
%); (6) energy (7 %); (7) protein fate (7 %); (8) non-plant, viral and plasmids proteins (5
%); (9) transcription factors and regulation of transcription (4 %); (10) biogenesis of
cellular components (3 %); (11) cellular transport, transport facilities and transport routes
(2 %); (12) cellular communication/signal transduction mechanism (1 %); (13) protein
synthesis (1 %) (Fig. 2.13). The highest number of differentially expressed genes was
recorded for the no homology category (23 %), followed by metabolism (19 %) (Fig.
2.13). Even though no virus infection symptoms were observed on O. fusca plants in the
field, transcripts coding for non-plant, viral and plasmid proteins were detected as
being up and down regulated, at both 2DAP and 4DAP, respectively. Transcripts
coding for viral proteins have been detected previously on Phalaenopsis sp. flower
buds (Chen et al., 2005; Tsai et al., 2006).

Chapter 2- Labellum transcriptome after pollination
71
Figure 2.13- Differentially expressed genes in Ophrys fusca labellum at 2DAP and 4DAP, grouped into functional categories. Percentage of unique transcripts classified in each of the functional category is indicated.
Overall, at 2DAP, transcripts involved in cell fate and cell rescue, defence and
virulence, were generally up regulated; whereas transcripts coding for metabolism and
energy (photosynthesis and respiration) were down regulated. At 4DAP, alterations in
gene expression were characterized by an up regulation of SAGs (cell fate; cell rescue,
defence and virulence; and protein fate) and a down regulation of secondary
metabolism related transcripts.
5% 2%
11%
4%
7%1%
7%19%
3%1% 8.5%
8.5%
23%
Non-plant, viral and plasmid proteins
Cellular transport/facilities and routes
Cell Fate
Cell Resc, Def and Virul
T rans. factors and regulation oft ranscript ionUnclassified
Protein Fate
Protein synthesis
Energy
Metabolism
Biog cellular components
Cellular Comm/Signal t rans
No homology

Chapter 2- Labellum transcriptome after pollination
72
Table 2.6. Differentially expressed genes identified from Ophrys fusca labellum transcriptome, after pollination, at both 2 days after pollination (DAP) and 4DAP. Negative/green and positive/red values indicate down and up regulation, respectively. GenBank Acc.No., Predicted function (species) retrieved by BLASTx from Uniref50, GO term (1st level- Biological Process), E-value, Fold Change (normalized ratio of labella pollinated flowers vs. labella unpollinated flowers) and Clone/Contig information are presented.
(n)- Represents the number sequences contained in the corresponding contig. *- Homology by BLASTx non redundant proteins from NCBI database.
GenBank Acc.No. Predicted function (species) GO term E-value Fold Change Clone/
Contig
2DAP 4DAP
Metabolism
Phenylpropanoid metabolism
HO849900 Chalcone synthase (Dendrobium nobile) GO:0009058 5E-58 -1.3 Ofup2743
HO849901 Bibenzyl synthase (Phalaenopsis sp.) GO:0009813 5E-41 -1.53 Ofup510
HO849902 Flavonoid 3’- monooxygenase (Zea mays) GO:0055114 9E-49 -1.31 -1.69 Ofup975
HO850016 4-coumarate-CoA ligase (Populus balsamifera subsp. trichocarpa)
GO:0008152 2E-19 -1.55 Ofp251
HO849951 stilbene synthase (Vitis vinifera) GO:0008152 6E-06 1.53 Ofup2706
HO850017 UDP-glucuronosyltransferase, putative (Ricinus communis)* 3E-27 -1.35 Ofp2607
HO849903 Polyphenol oxidase (Ananas comosus) GO:0055114 1E-38 1.73 Ofctg1195 (3)
HO849905 Polyphenol oxidase (Euterpe edulis) GO:0008152 1E-33 1.45 Ofup1027
HO850019 Polyphenol oxidase (Doritis pulcherrima Phalaenopsis) GO:0055114 2E-11 1.85 Ofp2027
Alkaloid metabolism
HO849906 tyrosine/DOPA decarboxylase (Argemone mexicana) GO:0006520 1E-32 -1.4 -1.42 Ofup1942
HO850020 salutaridinol 7-O-acetyltransferase, putative (Ricinus communis) GO:0047180 2E-15 -1.52 Ofp176
Metabolism of primary metabolic sugar derivatives
HO850021 Myo-inositol 1-phosphate synthase (Ricinus communis) GO:0006021 2E-32 -1.31 Ofp2108
Sugar metabolism
HO850022 Beta-amylase, putative (Ricinus communis) GO:0005975 2E-33 -1.34 Ofp963
HO850024 Beta-glucosidase 24 (Oryza sativa subsp. japonica) GO:0005975 2E-28 -1.46 Ofctg2402
(2)
Lipid metabolism
HO849907 TCER1 (Triticum aestivum) GO:0006633 5E-37 -1.81 Ofup1936
HO850025 Omega-6 fatty acid desaturase (Cucurbita pepo) GO:0006629 4E-19 -1.41 Ofp1524
HO849908 Stearoyl-ACP desaturase homologue 2 (Ophrys x arachnitiformis subsp. archipelagi)
2E-59 -1.9 Ofctg2559 (2)
HO849909 Stearoyl-acyl-carrier protein desaturase (Elaeis oleifera) GO:0006633 3E-56 -1.49 Ofup2825
HO849949 3-ketoacyl-CoA thiolase (Arachis diogoi) 2E-11 1.47 Ofup3281

Chapter 2- Labellum transcriptome after pollination
73
Table 2.6. Continued.
GenBank Acc.No. Predicted function (species) GO term E-
value Fold Change Clone/ Contig
2DAP 4DAP
Metabolism
Lipid metabolism
HO850027 Neutral ceramidase (Hordeum vulgare) 1E-38 -1.31 Ofp336
HO850028 Non-lysosomal glucosylceramidase (Oryza sativa) GO:0006665 1E-37 -1.37 -1.4 Ofp179
HO850029 7-dehydrocholesterol reductase (Zea mays) 2E-15 -1.31 Ofp1630
Nitrogen, sulfur and selenium metabolism
HO850030 NifS-like protein (Oryza ridleyi) GO:0008152 2E-18 -1.54 Ofp2220
Amino acid metabolism
HO850031 Ornithine aminotransferase (Glycine max) GO:0008152 1E-38 -1.39 Ofp3056
HO850032 Methylcrotonoyl-CoA carboxylase subunit alpha (Zea mays) GO:0008152 3E-33 -1.27 Ofp1184
Nucleotide/nucleoside/nucleobase metabolism
HO850033 Putative allantoate amidohydrolase (Phaseolus vulgaris) GO:0008152 3E-37 1.36 Ofp1119
Cell Fate
Cell aging and program cell death (PCD)
HO850034 putative Hypersenescence1 (HYS1) (Oryza sativa) 1E-11 -1.3 Ofp864
HO850035 Cysteine proteinase (Phalaenopsis sp. SM9108) GO:0006508 1E-58 1.32 1.52 Ofctg1283(4)
HO849912 Cysteine proteinases (Elaeis guineensis var. tenera) GO:0006508 1E-36 1.56 Ofctg3242
(2)
HO850038 RNase PD2 (Prunus dulcis) 2E-68 1.59 1.54 Ofctg2701 (2)
HO850042 Cysteine protease (Medicago sativa) GO:0006508 1E-05 1.43 Ofpoll#11
HO850041 Cysteine proteinase (Elaeis guineensis) GO:0006508 1E-59 1.3 Ofctg3347 (3)
HO849913 Cysteine protease (Zea mays) GO:0006508 2E-42 1.48 Ofup366
HO850043 Aspartic proteinase precursor, putative (Ricinus communis) GO:0006629 2E-10 -1.43 Ofp2286
HO849914 Triticain alpha (Triticum aestivum) GO:0006508 3E-42 1.37 1.4 Ofctg915 (4)
HO850046 putative Tropinone reductase-14 (Boechera divaricarpa) GO:0008152 1E-45 1.42 Ofctg2110
(4)
Cell enlargement
HO850052 expansin B4, ATeXPB4, putative (Ricinus communis) 5E-40 1.45 Ofctg800 (4)
HO850050 Putative blight-associated protein p12 (Oryza sativa subsp. japonica) 9E-15 1.44 Ofp1866
Cell Rescue, Defense and Virulence
HO849916 Chitinase, putative (Ricinus communis) GO:0005975 1E-18 -1.55 Ofup2803
(n)- Represents the number sequences contained in the corresponding contig.

Chapter 2- Labellum transcriptome after pollination
74
Table 2.6. Continued.
GenBank Acc.No. Predicted function (species) GO term E-value Fold Change Clone/
Contig
2DAP 4DAP
Cell Rescue, Defense and Virulence
HO850056 glutathione s-transferase gstf2 (Oryza sativa subps. indica) 2E-41 1.57 1.66 Ofctg1174 (6)
HO850058 phi class glutathione transferase GSTF3 (Populus trichocarpa) 3E-23 1.3 Ofp1943
HO850059 MtN19-like protein (Pisum sativum) 2E-30 1.35 Ofpoll#20
HO850069 metallothionein-like protein type 2 (Typha angustifolia) 5E-18 1.46 Ofctg2943 (9)
HO849988 antimicrobial peptide snakin (Capsicum annuum) 3E-22 1.4 Ofup1176
HO850078 antimicrobial peptide snakin (Capsicum annuum) 5E-11 1.42 Ofctg1262 (2)
HO849925 cytosolic cyclophilin (Lupinus luteus)* GO:0006457 3E-32 1.59 Ofup529
HO849927 class III chitinase (Bambusa oldhamii) GO:0005975 1E-51 -1.43 1.57 Ofctg1177 (3)
HO849917 Pathogenesis-related protein 10c (Elaeis guineensis var. tenera) GO:0006952 6E-38 1.59 1.74 Ofup2722
HO849938 Nonspecific lipid transfer protein (Hordeum vulgare) GO:0006869 3E-17 1.54 Ofup2151
HO849928 Abscisic stress ripening protein homolog (Prunus armeniaca) GO:0006950 8E-43 -1.39 Ofup2778
HO849952 ASR1 (Solanum cheesmanii) GO:0006950 2E-9 1.75 Ofup385
HO850060 Late embryogenesis abundant protein Lea5 (Citrus sinensis) GO:0006950 1E-10 1.46 Ofp1957
HO850063 Metallothionein-like protein type 3 (Musa acuminata) 1E-18 -1.38 1.56 Ofctg2343 (7)
Transcription factors and regulation of transcription
HO849929 flavin-binding kelch domain F box protein FKF1 (Allium cepa) GO:0007165 3E-23 -1.47 Ofup2840
HO850072 Nam-like protein 14 (Petunia hybrida) GO:0045449 1E-05 1.34 Ofp2017
HO849930 Squamosa promoter-binding protein, putative (Ricinus communis) 1E-28 -1.34 -1.54 Ofup100
HO850088 putative RNA-binding protein (Oryza sativa)* 1E-21 -1.31 Ofp1569
HO850089 Nucleic acid binding NABP (Medicago truncatula) 1E-11 -1.3 Ofp966
Protein Synthesis
HO850073 Ribosomal protein L17 (Ricinus communis) GO:0006412 5E-20 1.5 Ofpoll#7
HO849931 translation initiation factor (Oryza sativa subsp. indica) GO:0006412 2E-21 1.56 Ofup2676
Biogenesis of Cellular Components
HO850074 Actin 2 (Glycyrrhiza uralensis) 1E-36 -1.47 Ofp28
HO849932 Peroxisomal membrane protein (PMP36) (Arabidopsis thaliana) GO:0006810 1E-55 -1.36 Ofup2813
HO849933 putative Profilin (Phalaenopsis hybrid cultivar) GO:0007010 1E-46 1.45 Ofup2694
HO850075 Pectin methyltransferase (PME)/invertase inhibitor-like protein (Musa acuminata) 5E-17 1.51 Ofp706
(n)- Represents the number sequences contained in the corresponding contig. *- Homology by BLASTx non redundant proteins from NCBI database.
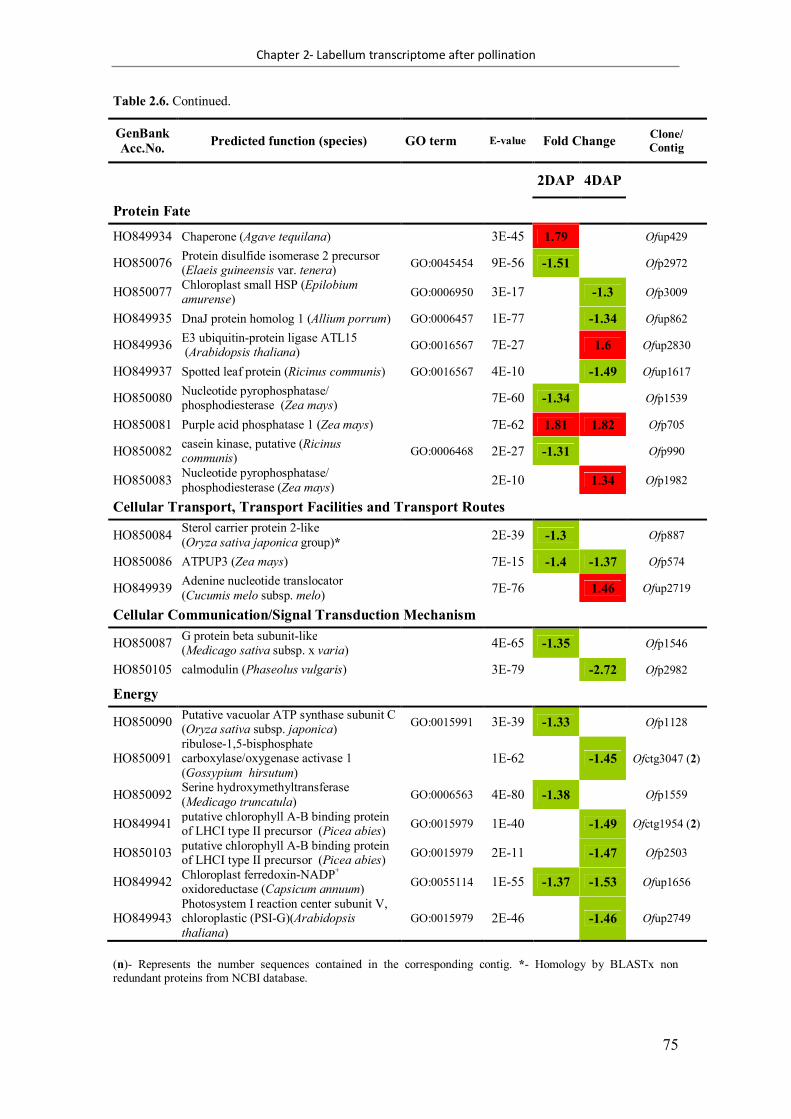
Chapter 2- Labellum transcriptome after pollination
75
Table 2.6. Continued.
(n)- Represents the number sequences contained in the corresponding contig. *- Homology by BLASTx non redundant proteins from NCBI database.
GenBank Acc.No. Predicted function (species) GO term E-value Fold Change Clone/
Contig
2DAP 4DAP
Protein Fate
HO849934 Chaperone (Agave tequilana) 3E-45 1.79 Ofup429
HO850076 Protein disulfide isomerase 2 precursor (Elaeis guineensis var. tenera) GO:0045454 9E-56 -1.51 Ofp2972
HO850077 Chloroplast small HSP (Epilobium amurense) GO:0006950 3E-17 -1.3 Ofp3009
HO849935 DnaJ protein homolog 1 (Allium porrum) GO:0006457 1E-77 -1.34 Ofup862
HO849936 E3 ubiquitin-protein ligase ATL15 (Arabidopsis thaliana) GO:0016567 7E-27 1.6 Ofup2830
HO849937 Spotted leaf protein (Ricinus communis) GO:0016567 4E-10 -1.49 Ofup1617
HO850080 Nucleotide pyrophosphatase/ phosphodiesterase (Zea mays) 7E-60 -1.34 Ofp1539
HO850081 Purple acid phosphatase 1 (Zea mays) 7E-62 1.81 1.82 Ofp705
HO850082 casein kinase, putative (Ricinus communis) GO:0006468 2E-27 -1.31 Ofp990
HO850083 Nucleotide pyrophosphatase/ phosphodiesterase (Zea mays) 2E-10 1.34 Ofp1982
Cellular Transport, Transport Facilities and Transport Routes
HO850084 Sterol carrier protein 2-like (Oryza sativa japonica group)* 2E-39 -1.3 Ofp887
HO850086 ATPUP3 (Zea mays) 7E-15 -1.4 -1.37 Ofp574
HO849939 Adenine nucleotide translocator (Cucumis melo subsp. melo) 7E-76 1.46 Ofup2719
Cellular Communication/Signal Transduction Mechanism
HO850087 G protein beta subunit-like (Medicago sativa subsp. x varia) 4E-65 -1.35 Ofp1546
HO850105 calmodulin (Phaseolus vulgaris) 3E-79 -2.72 Ofp2982
Energy
HO850090 Putative vacuolar ATP synthase subunit C (Oryza sativa subsp. japonica) GO:0015991 3E-39 -1.33 Ofp1128
HO850091 ribulose-1,5-bisphosphate carboxylase/oxygenase activase 1 (Gossypium hirsutum)
1E-62 -1.45 Ofctg3047 (2)
HO850092 Serine hydroxymethyltransferase (Medicago truncatula) GO:0006563 4E-80 -1.38 Ofp1559
HO849941 putative chlorophyll A-B binding protein of LHCI type II precursor (Picea abies) GO:0015979 1E-40 -1.49 Ofctg1954 (2)
HO850103 putative chlorophyll A-B binding protein of LHCI type II precursor (Picea abies) GO:0015979 2E-11 -1.47 Ofp2503
HO849942 Chloroplast ferredoxin-NADP+ oxidoreductase (Capsicum annuum) GO:0055114 1E-55 -1.37 -1.53 Ofup1656
HO849943 Photosystem I reaction center subunit V, chloroplastic (PSI-G)(Arabidopsis thaliana)
GO:0015979 2E-46 -1.46 Ofup2749

Chapter 2- Labellum transcriptome after pollination
76
Table 2.6. Continued.
(n)- Represents the number sequences contained in the corresponding contig. *- Homology by BLASTx non redundant proteins from NCBI database.
GenBank Acc.No. Predicted function (species) GO term E-value Fold Change Clone/
Contig
2DAP 4DAP
Energy
HO849945 phosphoglycerate dehydrogenase, putative (Ricinus communis) GO:0008152 1E-39 1.44 Ofctg1698 (3)
HO850095 chloroplast photosystem II 10 kDa protein-like protein (Wolffia arrhiza) GO:0015979 2E-54 1.5 Ofp2102
HO850096 Protoheme IX farnesyltransferase (Zea mays) GO:0048034 1E-18 -1.3 Ofp1955
Unclassified
HO850144 tropinone reductase/dehydrogenase, putative (Arabidopsis thaliana)* 1E-05 1.75 Ofp447
HO850097 Transferase, putative (Ricinus communis) 3E-11 1.39 Ofp1292
HO850098 S-adenosylmethionine-dependent methyltransferase, putative (Ricinus communis) GO:0032259 5E-52 -1.41 Ofp1516
HO849946 S-adenosylmethinonine synthetase (Camellia sinensis) GO:0006730 5E-79 1.65 Ofup1593
HO850099 Fiber protein Fb34 (Zea mays) 3E-52 -1.27 Ofp1547
HO850100 Conserved hypothetical protein (Ricinus communis) 2E-21 -1.33 Ofp1562
HO849947 cytochrome P450-1 (Musa acuminata) GO:0055114 7E-13 -1.6 Ofup2976
HO849948 Protein with unknown function (Ricinus communis) 1E-10 -1.4 Ofup1252
HO850101 unnamed protein product (Vitis vinifera) 2E-10 -1.33 Ofp1530
HO850108 Putative uncharacterized protein (Zea mays) 9E-10 -1.55 Ofp266
HO849978 Putative uncharacterized protein (Vitis vinifera) 8E-6 1.62 Ofup3257
HO849919 Whole genome shotgun sequence (Vitis vinifera) 2E-35 1.81 1.65 Ofp2044
No Homology
HO849950 1.54 Ofup2187
HO850104 1.49 Ofp428
HO850140 -2.45 Ofctg2252 (2)
HO849967 1.65 -3.02 Ofctg1542 (2)
HO850124 2.02 Ofctg99 (2)
HO850112 1.93 -2.97 Ofctg1742 (12)
HO849884 1.21 -2.29 Ofctgup#24 (7)
HO849963 1.43 Ofctg3270 (4)
HO849981 1.7 -3.81 Ofup86
HO849968 1.5 Ofup999
HO850085 -1.32 Ofp3031
HO850126 -1.45 Ofp1148
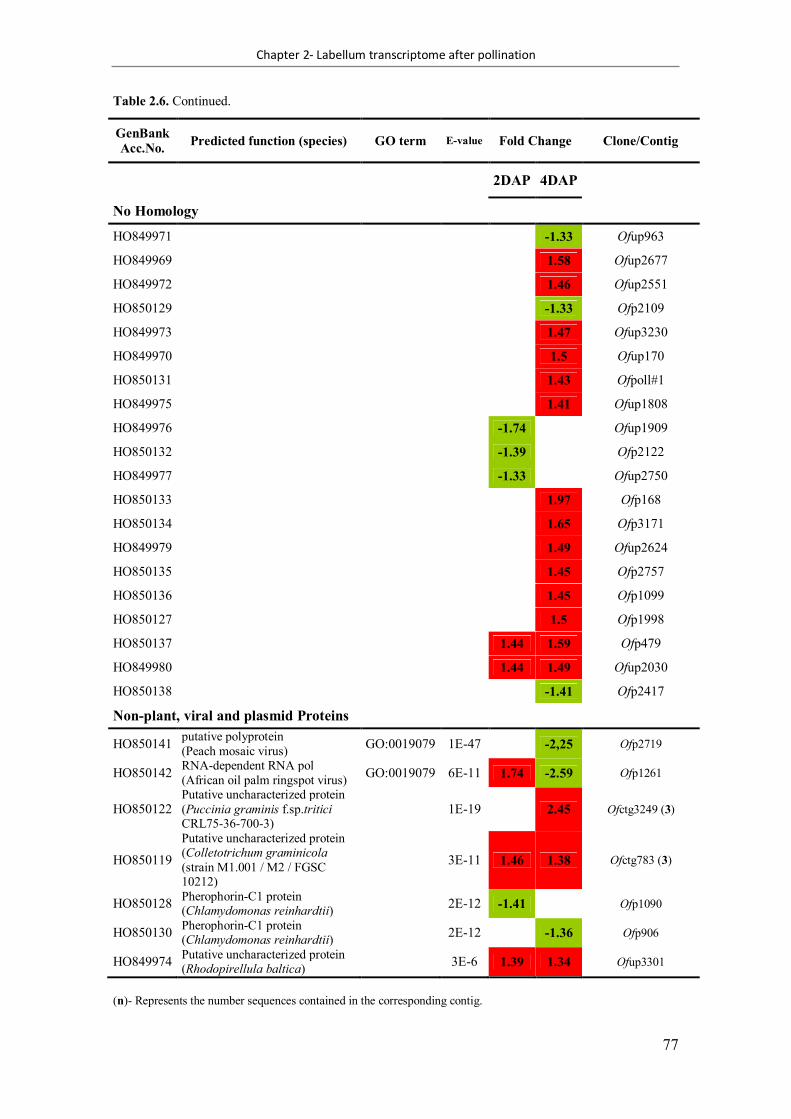
Chapter 2- Labellum transcriptome after pollination
77
Table 2.6. Continued.
(n)- Represents the number sequences contained in the corresponding contig.
GenBank Acc.No. Predicted function (species) GO term E-value Fold Change Clone/Contig
2DAP 4DAP
No Homology
HO849971 -1.33 Ofup963
HO849969 1.58 Ofup2677
HO849972 1.46 Ofup2551
HO850129 -1.33 Ofp2109
HO849973 1.47 Ofup3230
HO849970 1.5 Ofup170
HO850131 1.43 Ofpoll#1
HO849975 1.41 Ofup1808
HO849976 -1.74 Ofup1909
HO850132 -1.39 Ofp2122
HO849977 -1.33 Ofup2750
HO850133 1.97 Ofp168
HO850134 1.65 Ofp3171
HO849979 1.49 Ofup2624
HO850135 1.45 Ofp2757
HO850136 1.45 Ofp1099
HO850127 1.5 Ofp1998
HO850137 1.44 1.59 Ofp479
HO849980 1.44 1.49 Ofup2030
HO850138 -1.41 Ofp2417
Non-plant, viral and plasmid Proteins
HO850141 putative polyprotein (Peach mosaic virus) GO:0019079 1E-47 -2,25 Ofp2719
HO850142 RNA-dependent RNA pol (African oil palm ringspot virus) GO:0019079 6E-11 1.74 -2.59 Ofp1261
HO850122 Putative uncharacterized protein (Puccinia graminis f.sp.tritici CRL75-36-700-3)
1E-19 2.45 Ofctg3249 (3)
HO850119
Putative uncharacterized protein (Colletotrichum graminicola (strain M1.001 / M2 / FGSC 10212)
3E-11 1.46 1.38 Ofctg783 (3)
HO850128 Pherophorin-C1 protein (Chlamydomonas reinhardtii) 2E-12 -1.41 Ofp1090
HO850130 Pherophorin-C1 protein (Chlamydomonas reinhardtii) 2E-12 -1.36 Ofp906
HO849974 Putative uncharacterized protein (Rhodopirellula baltica) 3E-6 1.39 1.34 Ofup3301

Chapter 2- Labellum transcriptome after pollination
78
2.4.2.2.1. Metabolism
Genes involved in metabolism revealed to be affected by pollination and
account for 19 % of unique transcripts detected in the expression study performed.
Differentially expressed genes involved in metabolism are generally down regulated by
pollination, at 2DAP and 4DAP. Soon after pollination (2DAP), genes accounting for
secondary metabolism pathways are repressed suggesting that the flower no longer
needs its by-products. As a result, at 4DAP, pollination event seems to initiate a stress-
related response, which is detectable by overexpression of transcripts coding for
phytolexins and phenolic compounds biosynthetic genes. Several secondary
metabolism biosynthetic pathways are discussed below: phenylpropanoid, alkaloid,
starch catabolism, lipid metabolism, nitrogen, sulfur and selenium metabolism, amino
acid metabolism and nucleotide/nucleoside/nucleobase metabolism. Genes
encoding enzymes involved in both phenylpropanoid and lipid metabolisms are the
most prevalent. Regarding the phenylpropanoid pathway, genes are generally
repressed at 2DAP and their expression decline continues at 4DAP. Flavonoid
biosynthesis, which is essentially related to labellum colour traits, is the pathway most
influenced by pollination. Lipid metabolism appears to be mediated by pollination,
since all genes differentially expressed are down regulated.
A general overview of secondary metabolism pathways and putative function
of differentially expressed genes detected in the gene expression study performed in
Ophrys fusca pollination are discussed below.
2.4.2.2.1.1. Phenylpropanoid metabolism
Phenylpropanoids display vital developmental roles in plant structure integrity,
UV photoprotection, reproduction and internal regulation of plant cell physiology and
signalling (Lucheta et al., 2007). They also function as key chemical modulators of plant
communication with insects and microbes, playing both attractive and repellent roles,
in defensive phytoalexin responses to infection and herbivory, attraction of insect
pollinators via flower color, and induction of root nodulation by symbiotic nitrogen-fixing
rhizobial colonies (Ferrer et al., 2008). In the phenylpropanoid pathway, three enzymatic
transformations redirect the carbon flow from primary metabolism, transforming
phenylalanine into Coenzyme A (CoA)-activated hydroxycinnamoyl (phenylpropanoid)
thioester capable of entering the two major downstream pathways, monolignol and
flavonoid biosynthesis (reviewed in Ferrer et al., 2008). After deamination of L-
phenylalanine by phenylalanine ammonia-lyase (PAL), the produced cinnamic acid is

Chapter 2- Labellum transcriptome after pollination
79
further catalised by cinnamic acid 4-hydroxylase (C4H), with the introduction of a
hydroxyl group in the phenyl ring of cinnamic acid at the para position, producing p-
coumaric acid. The carboxyl group of p-coumaric acid is then activated by formation
of a thioester bond with CoA, a process catalyzed by p-coumaroyl: CoA ligase (4CL)
(Douglas, 1996; Kaneko et al., 2003; Lucheta et al., 2007). Finally, 4CL is responsible for
the production of CoA thiol esters from cinnamates and coumarate, which are used in
biosynthesis of numerous phenylpropanoid-derived compounds, such as stilbenes,
lignins, lignans, suberins, flavonoids, isoflavonoids, and various small phenolic
compounds (Kaneko et al., 2003). These compounds have diverse functions in plants,
including mechanical support and rigidity to cell walls, attractants of insect pollinators
which help pollination and fertilization, protection against biotic and abiotic stresses,
and also participate in signalling processes (Douglas, 1996; Mayer et al., 2001; Lucheta
et al., 2007). Various phenolic compounds such as stilbenes and naringenin chalcone
are formed through reactions catalysed by stilbene synthase (STS) and chalcone
synthase (CHS), respectively (Hanhineva et al., 2009). These two enzymes, STS and CHS,
belong to the type III polyketide synthase superfamily, which is a highly versatile group
of enzymes that also include 2-pyrone synthase (Eckermann et al., 1998), bibenzyl
synthase (Preizig-Müller et al., 1995), and acridone synthase (Junghanns et al., 1995).
Many phenylpropanoids, classified as phytolexins, function as antimicrobial
compounds synthesized in response to pathogen or herbivore attack (Chong et al.,
2009). Stilbenes are phenylpropanoid derivatives produced by plants and referred as
phytoalexins since they contribute to the defense response against predators and
pathogens (Treutter, 2005). The pivotal enzyme for their synthesis is stilbene synthase (STS) which catalyzes, in a single reaction, the biosynthesis of the stilbene backbone
from three malonyl-CoA and one CoA-ester of a cinnamic acid derivative (most
frequently cinnamoyl-CoA or p-coumaroyl-CoA) (Goodwin et al., 2000; Chong et al.,
2009). High contents of stilbenes are synthesized after microbial attack as part of both
constitutive and inducible defense responses (Chong et al., 2009). In addition to the
well-known function of stilbenes as phytoalexins, these compounds may also be
involved as chemical signals in response to oxidative stress generated by UV irradiation
(He et al., 2008).
The enzyme chalcone synthase (CHS) is crucial for downstream enzymatic
machinery in the flavonoid compounds biosynthesis pathway (Buer et al., 2010).
Flavonoid compounds, produced as a branch of the phenylpropanoid pathway, are
classified into different groups based primarily on the oxidation degree of the three-
carbon bridge (Taiz and Zieger, 1998). Flavonoids play roles in many plant physiology
mechanisms, including: influence in the transport of auxins (Peer and Murphy 2007),
defense (Treutter, 2005), allelopathy (Bais et al., 2006) and modulation of reactive

Chapter 2- Labellum transcriptome after pollination
80
oxygen species (ROS) levels (Bais et al., 2006). Flavonoids also provide flower coloring
important to attract pollinators (Mol et al., 1998) and in many species they are required
for pollen viability (Taylor and Jorgensen, 1992). In flowers, flavonoids can additionally
provide protection against UV radiation (Dixon and Paiva, 1995), and act as chemical
defense compounds against pathogens (Bednarek and Osbourn, 2009). Anthocyanins
(from Greek: ἀνθός (anthos) = flower + κυανός (kyanos) = blue) are water-soluble
vacuolar pigments that can appear red, purple, or blue according to pH. They belong
to the class of flavonoids and can occur in all types of higher plants tissues, including
leaves, stems, roots, flowers, and fruits (Taiz and Zieger, 1998). These pigments are
produced by the phenylpropanoid biosynthesis pathway, the key enzymes being
chalcone synthase (CHS) at the top of the pathway, dihydroflavonol 4-reductase (DFR)
and the flavonoids hydroxylases (F-3’H and F-3’5’H) that turn orange to lavender/purple
and/or to blue by a simple chemical reaction (Bednarek and Osbourn, 2009). The
resulting unstable anthocyanidins are further coupled to sugar molecules by enzymes
like UDP-3-O-glucosyltransferase to produce the final relatively stable anthocyanins
(Bednarek and Osbourn, 2009). The anthocyanidins are the basic structures of the
anthocyanins. When the anthocyanidins are found in their glycosilated form (bonded
to a sugar moiety) are known as anthocyanins (Castañeda-Ovando et al., 2009). There
is a huge variety of anthocyanins mainly due to the number of hydroxylated groups, the
nature and the number of bonded sugars to their structure, the aliphatic or aromatic
carboxylates bonded to the sugar in the molecule and the position of these bonds
(Kong et al., 2003a). Up to know, about 500 different anthocyanins and 23
anthocyanidins have been described (Castañeda- Ovando et al., 2009 and references
therein). The glycosilated derivatives of the three non-methylated anthocyanidins (Cy,
Dp and Pg) are the most common in nature, being found in 80 % of colored leaves, 69
% in fruits and 50 % in flowers (Castañeda- Ovando et al., 2009). The most frequent
anthocyanidins are pelargonidin Pg (orange red color), cyaniding Cy (purplish red),
delphinidin Dp (bluish purple), peonidin Pn (rosy red) and petunidin Pt (purple) (Clifford,
2000). Anthocyanins play important roles in flowers and fruits pigments from numerous
plants across the plant kingdom, by promoting attraction insects for pollination thereby
ensuring plant survival (Babar and Khatun, 2006; Colquhoun et al., 2010), seed
dispersion and acting as protectants against UV-B radiation (Chiou and Yeh, 2008).
Floral pigmentation provides the basis for mimicking the colours of female insect’s body
in the Ophrys pollination system (Schlüter and Schiestl, 2008). Generally, flower colour is
determined by the presence of carotenoids and anthocyanins and by their interaction
with the molecular environment and by the way light is reflected on differentially
shaped epidermal cells at the flower surface (Dyer et al., 2007). Previous studies in the
purple orchid Dendrobium, as well as in other orchids, showed that anthocyanins,

Chapter 2- Labellum transcriptome after pollination
81
mainly cyanidins, pelargonidins and delphinidins are the most predominant pigments
(Kuehnle, 1997). In the gene expression study in Ophrys fusca after pollination, flavonoid
biosynthetic genes (chalcone synthase, a flavonoid 3’ monooxygenase and UDP-
glucuronosyltransferase) were down regulated, both at 2DAP and 4DAP.
2.4.2.2.1.1.1. Coumarate-CoA ligase (4CL)
From gene expression analysis, Ofp251 transcript coding for a 4-coumarate:
coenzyme A (CoA) ligase (4CL, EC 6.2.1.12) protein homolog was down regulated at
2DAP. This enzyme catalyzes the conversion of 4-coumarate (4-hydroxycinnamate) and
other substituted cinnamates, such as caffeate (3,4-dihydroxycinnamate) and ferulate
(3-methoxy-4-hydroxycinnamate), into the corresponding CoA thiol esters (Boerjan et
al., 2003). Thus, it catalyzes the formation of CoA esters of hydrocinnamic acid, these
activated intermediates being used in the biosynthesis of diverse compounds via
specific branch pathways, such as those leading to flavonoids, stilbenes and lignin
biosynthesis (Douglas, 1996; Boudet, 2007). This multiple function might explain why 4CL
is encoded by a gene family in both angiosperm and gymnosperm species (Wagner et
al., 2009 and references therein). In Arabidopsis thaliana, 4CL is encoded by a gene
family of four members (4CL1-4) which frequently exhibit distinct substrate affinities that
could be coincident with specific metabolic functions (Hamberger and Hahlbrock,
2004). For instance, 4CL2 has higher specificity for caffeate than for coumarate, and
ferrulate is not a substrate of 4CL2 (Ehlting et al., 2001).
The down regulation of 4CL at 2DAP suggests that orchid lips altered the
regulation of genes associated with the phenylpropanoid metabolism by repressing the
production of major phenylpropanoids biosynthetic genes, which are no longer
required for secondary compounds production (e.g. lignins and flavonoids). The
immediate precursors of lignin, monolignols, are biosynthesized via the
cinnamate/monolignol pathway, and changes in 4CL expression modifies the
metabolic flow of this pathway and ultimately affects the lignin amount, which is the
final product of the pathway (Suzuki et al., 2010). In this study, down regulation of 4CL
can, as well suggest a decrease in lignin content and an accumulation of p-
hydroxycinnamic acids (p-coumaric, ferulic, and sinapic acid), as reported for tobacco
(Boerjan et al., 2003 and references therein), Arabidopsis (Boerjan et al., 2003), and
poplar (Caihong et al., 2004; Suzuki et al., 2010). The activity of 4CL is essential for the
production of the lignin precursor’s 4-coumaryl alcohol, coniferyl alcohol, and sinapyl
alcohol (Tamagnone et al., 1998). Therefore, 4CL down regulation probably decreased
the conversion of p-coumaric acid to lignin (Schneider et al., 2003). As a result, down
regulation of 4CL may suggest that most hydroxycinnamic acids were glycosylated,
Chapter 2- Labellum transcriptome after pollination
82
and the resulting hydroxycinnamic acid glucosides as previously reported may be a
result of a common detoxification mechanism employed in plants (Meyermans et al.,
2000; Suzuki et al., 2010). Yet, this assumption has to be confirmed since 4CL belongs to
a gene family with 4 isoforms (4CL1-4), with different putative function depending on its
substrate specificity (Stuible and Kombrink, 2001; Hamberger and Hahlbrock, 2004).
2.4.2.2.1.1.2. Chalcone synthase (CHS) and bibenzyl synthase (BBS)
In Ophrys fusca labellum a transcript coding for a chalcone synthase (CHS, EC
2.3.1.74) was found down regulated at 2DAP. Chalcone synthase, a key enzyme in the
flavonoid biosynthesis pathway, catalyses the condensation of 3 acetate residues, from
malonyl-coenzyme A (CoA) with 4-coumaroyl-CoA, to form naringenin chalcone
(Holton and Cornish, 1995; Ferrer et al., 2008). Because of its key function in the
anthocyanin biosynthetic pathway, cDNAs and genes encoding CHS have been used
to manipulate flower color (Han et al., 2006b). CHS is encoded by a multigene family in
the majority of higher plants, except parsley, Arabidopsis, and snapdragon which have
only one copy of chs gene in their haploid genomes (Winkel-Shirley, 2001). In Petunia
hybrida, two of the four chs genes are expressed in floral tissues and other two genes
are induced in young seedlings by UV-radiation (Koes et al., 1987). In previous studies,
Pchs1 gene was moderately transcribed in petals and lips of Phalaenopsis at
developmental stages where anthocyanins are accumulated at a fast rate (Han et al.,
2006b). In apple, CHS transcripts were highly expressed also in flowers (Dong et al.,
1998). Previous studies on expression of Phalaenopsis CHS in tobacco demonstrated
that Pchs can play a role in anthocyanin biosynthesis as well as in male fertility (Han et
al., 2005), thus it can be used to manipulate flower colours of Phalaenopsis and, most
likely, of other orchid genus. Down regulation of a CHS transcript suggest that at 2 days
after pollination labellum has decreased its expression probably related to
anthocyanins, a downstream pathway. This may indicate that after successful
pollination, flower has fulfilled its reproductive purpose and maintainance of lip
attractability is no longer required.
A transcript coding for a bibenzyl synthase (BBS) protein was found down
regulated at 2DAP. BBS belong to the type III polyketide synthase superfamily and in
Phalaenopsis cultivars revealed >98% identity with several CHS sequences (Preisig-Müller
et al., 1995). In Phalaenopsis sp., this enzyme performs a series of reactions to ultimately
render dihydrophenanthrenes (Preisig-Müller et al., 1995). Stressed or wounded orchid
tissues, especially those infected by endomycorrhizal fungi, accumulate bibenzyl
stilbenes and their tricyclic derivatives, 9,10-dihydrophenanthrenes, to presumably
function as antifungal agents (Gehlert and Kindl, 1991; Austin and Noel, 2003 and
Chapter 2- Labellum transcriptome after pollination
83
references therein). Down regulation of a BBS at 2DAP may be related to an antifungal
response thereby stimulating the production of bibenzylstilbenes, which are soon
inactivated after pollination. Yet, other putative functions may not be discarded, since
high homology to CHS gene has been described for Phalaenopsis (Preisig-Müller et al.,
1995). Also, according to Sparvoli et al. (1994) the enzymes acting early in the
phenylpropanoid and flavonoids pathways are encoded by a larger gene family due
to the diverse metabolic functions which require a diverse control of gene expression.
Gene duplication and molecular divergence may have contributed to the
establishment of functionally distinct genes, each one with its own ability to respond to
different environmental and/or functional stimuli (Sparvoli et al., 1994). As a result, BBS
could be a CHS-like protein or a bibenzyl-producing enzyme, thus until its
characterization on Ophrys fusca labellum, no specific function may be related to
pollination event.
2.4.2.2.1.1.3. Flavonoid 3’ monooxygenase/hydroxilase (F3’H) and UDP-
Glucuronosyltransferase
Microarray analysis revealed, for both 2DAP and 4DAP, downregulation of two
different transcripts coding for flavonoid 3’-hydroxylase (F3’H EC 1.14.13.21), and at
4DAP a transcript coding for an UDP-glucoronosyltransferase protein homolog. These
transcripts are involved in the biosynthetic pathway of anthocyanins, important as
flower pigments, and its transcription is indicated to be down regulated by pollination.
Flavonoids are subdivided into several classes, the three major ones: flavonols,
anthocyanins, and proanthocyanidins (PAs, condensed tannins) (reviewed in Lepiniec
et al., 2006). The biosynthesis of anthocyanins begins with the condensation of malonyl-
CoA with 4-coumaroyl-CoA, leading to the formation of naringenin chalcone, this
reaction being catalysed by chalcone synthase (CHS) (Kleindt et al., 2010). Chalcone is
converted into naringenin by chalcone flavanone isomerase (CHI). Naringenin is then
hydroxylated, at the 3’ position of the central ring, by flavanone 3-hydroxylase (F3H) to
produce dihydrokaempferol (DHK). DHK can be further hydroxylated at the 3’ position
or at both 3’ and 5’ positions of the B-ring to produce dihydroquercetin and
dihydromyricetin, respectively (Han et al., 2010). Dihydrokaempferol, dihydroquercetin
and dihydromyricetin lead to the production of the brick-red/orange pelargonidin-,
red/pink cyanidin-, and blue/violet delphinidin-based pigments, respectively
(Grotewold, 2006). The hydroxylation pattern of the B-ring plays an important role in
coloration, and is controlled by two members of cytochrome P450 family, flavonoid 3-
hydroxylase (F3’H) and flavonoid 3’,5’-hydroxylase (F3’5’H), by introducing hydroxyl
groups at the 3’ position or at 3’ and 5’ positions of the B-ring of the flavonoid molecule,

Chapter 2- Labellum transcriptome after pollination
84
respectively (Han et al., 2010). In plants, flavonoid hydroxylases highly influence flower
coloration (Han et al., 2010). Down regulation of a transcript coding for a F3’-
hydroxylase reveals that 3’ hydroxylation to dihydroquercetin may be the main
flavonoids hydroxylation process occuring in Ophrys fusca. This hydroxylation is also
widely documented in other higher plants (Han et al., 2010 and references therein).
Epicatechin and anthocyanins share a common biosynthetic pathway from
phenylalanine to anthocyanidin. Further, anthocyanins are synthesized via glycosylation
by UDP-dependent glucosyltransferases (UGTs), whereas epicatechin by anthocyanidin
reductase (Chiou and Yeh, 2008). Anthocyanidins undergo several modifications, such
as glycosylation or methylation, by UDP-glucoside: flavonoids 3-O-glucosyltransferase
(3GT) and anthocyanin methyltransferase (AMT), to yield the final relatively stable
anthocyanins (Chiou and Yeh, 2008). Glycosylation acts on a wide range of biological
processes of plants, by the action of glycosyltransferases (GTs) which can transfer single
or multiple activated sugars from nucleotide sugar donors to a wide range of small
molecular acceptors of plants (Wang and Hou, 2009). A transcript coding an UDP-
glucuronosyltransferase matching as an anthocyanidin 3-O-glucosyltransferase (3GT,
EC 2.4.1.115), was down-regulated at 4DAP. This enzyme uses preferentially cyanidin,
delphinidin and peonidin as substrates and does not catalyze glycosylation at the 5’
position of cyanidin. Anthocyanidin 3-O-glucosyltransferase catalyzes the chemical
reaction: UDP-D-glucose + an anthocyanidin → UDP + an anthocyanidin-3-O-β-D-
glucoside. Thus, the substrates of this enzyme are UDP-D-glucose and anthocyanidins
and the resulting products being UDP and anthocyanidin-3-O- β -D-glucoside. Previous
studies demonstrated that in almost European orchids, petals present cyanidin
glucosides, namely: cyaniding 3-monoglucoside (chrysanthemin), cyanidin 3-
diglucoside (mecocyanin), and cyanidin 3,5- diglucoside (cyanin) and unusual
anthocyanins of more complex chemical structure (Uphoff, 1979). They are pigments
characteristic of the subfamily Orchidoideae and contain the fundamental structure of
cyanin. Orchid characteristic pigments are named ophrysanin (3-oxalylglucoside),
orchicyanin I (oxalyl-3,5-diglucoside-kaempferol 7-glucoside) and orchicyanin II (oxalyl-
3,5-diglucoside (orchicyanin) and its concentrations is genera- or species- specific
(Uphoff, 1979). Reports regarding anthocyanin contents on Ophrys sp. labellum pointed
out for a high pigment similarity between different species mainly dominated by
ophrysanin (50-70 %) and with additional chrysanthemin (< 30%) (Strack et al., 1989).
Chemically, ophrysanin (cyanidin 3-oxalylglucoside) and chrysanthemin (cyanidin 3-
monoglucoside) are similar pigments. It is reasonable to assume that UDP-
glucoronosyltransferase may be responsible for the stability of cyanidin derivatives
responsible for flower pigmentation in Ophrys fusca. To our knowledge, this is the first
report regarding the identification of enzymes responsible for lip coloration in Ophrys

Chapter 2- Labellum transcriptome after pollination
85
and even in the subfamily Orchidoideae. Anthocyanins determine the visible and
ultraviolet light (UV) patterns of orchids (Kong et al., 2003b), and play important roles in
the attraction of pollinators, other than scent and morphology (Stintzing and Carle,
2004). Following pollination, anthocyanins may be destroyed in Ophrys as it occurs in
other orchids, such as Vanda sp. In contrary, in Cymbidium sp. they are produced
(Kong et al., 2003b). Downregulation of anthocyanin related genes (F3’H and UDP-
glucoronosyltransferase) at both timepoints suggest that transcription of pigment
biosynthesis pathways are regulated by pollination. Since pigmentation, an important
visual cue in Ophrys pollination system, is required for attracting pollinators, transcription
of the regulating enzymes is no longer active after successful pollination.
2.4.2.2.1.1.4. Stilbene synthase (STS)
Up regulation of a transcript coding for a stilbene synthase was detected at
4DAP. Stilbene synthase (STS, EC 2.3.1.95) is a member of the chalcone synthase (CHS)
superfamily of type III polyketide synthases (PKSs) (Chong et al., 2009). Chalcone
synthase is the most ubiquitous PKS in plants, catalyzing the first committed step of
flavonoid biosynthesis. In contrast, in a limited number of plants, e.g. grapevine
(Vitaceae), peanut (Cyperaceous), and pine (Pinus), stilbene synthases have been
identified and revealed to be essential for the synthesis of resveratrol used in the
stilbenoid biosynthesis (Schöppner and Kindl, 1984; Melchior and Kindl, 1990; Kodan et
al., 2002). STS genes share 75–90 % of its amino acid sequence identity with CHS (Chong
et al., 2009). The resveratrol synthesis in grape is catalyzed by stilbene synthase (STS)
enzyme which uses p-coumaryl- CoA and malonyl-CoA as substrates (Versari et al.,
2001). Resveratrol (trans- 3,5,4’-trihydroxystilbene), its cis isomeric configurations and
their glucosides (piceides) and oligomers (viniferins) are stilbene compounds classified
as phytoalexins due to their role in plant defense mechanisms against fungal
pathogens (Hain et al., 1990). Up regulation of a transcript coding for a stilbene
synthase at 4DAP, may reveal phytoalexins production enhanced by pollination. Given
that phytoalexins are antimicrobial compounds known to be involved in plant defense
response, this may be indicative of a defense reaction enhanced by pollination event.
To date, enzymes performing STS-like cyclizations (e.g. bibenzyl synthases) have been
isolated from Phalaenopsis sp. (Preisig-Müller et al., 1995). Stilbene synthases and the
related bibenzyl synthases are plant polyketide synthases, which biological functions
rely on the formation of antimicrobial phytoalexins (Preisig-Müller et al., 1997). To our
knowledge, this transcript may be the first stilbene synthase sequence found in an
orchid species, yet needs functional identification and/or confirmation. Being
resveratrol the most well studied stilbene-type compound, crucial in a wide range of

Chapter 2- Labellum transcriptome after pollination
86
biological and pharmacological properties (reviewed in Camins et al., 2009), it will be
of extreme interest to further confirm resveratrol synthesis on Ophrys labellum.
2.4.2.2.1.1.5. Polyphenol oxidase (PPO)
Three transcripts coding for polyphenol oxidase (PPO, EC 1.14.18.1) homologs
were found to be up regulated at 2DAP and 4DAP.
In higher plants, polyphenol oxidase, a nuclear-encoded copper
metalloprotein, is the major cause of tissue enzymatic browning and is involved in plant
cell walls lignification as well as in polyphenols oxidation producing reactive quinones
(Mayer, 2006). The quinone products can then polymerize and react with amino acid
groups of cellular proteins, resulting on black or brown pigment deposits (Mayer and
Harel 1979; Goldman et al., 1998). Quinones formed during PPO-oxidation reactions
may undergo redox recycling, which generate free radicals, and can damage DNA,
proteins, amino acids or lipids (Mazzafera and Robinson, 2000; Yoruk and Marshall,
2003). Plant PPO is located in the chloroplast thylakoid membranes and is activated in
the cytosol when plant tissues undergo physical damage such as bruising, cutting,
ripening, or senescence (Mayer, 2006; Thipyapong et al., 2007). Studies have indicated
that phenol-oxidizing enzymes may participate in defense reactions, inducing
resistance to abiotic and biotic stresses (Stewart et al., 2001). PPO catalyzes two
different oxidative reactions in combination with molecular oxygen: the hydroxylation
of monophenols into o-diphenols (monophenol oxidation) and the oxidation of o-
diphenols into o-quinones (diphenol oxidation) (Yoruk and Marshall, 2003). In Camellia
sinensis, the highest activity of this enzyme was reported in cross-pollinated styles rather
than in selfed ones (Neog et al., 2004). Studies on Arachnis flowers after pollination and
emasculation revealed a rise in PPO activity (Hew et al., 1989). A close relationship
between ethylene and PPO was suggested in tobacco flowers, where it was shown that
ethylene enhanced PPO activity after pollination (Sheen, 1973; Hew et al., 1989). A
tobacco flower-specific gene coding for a polyphenol oxidase was considered as
having defense functions by controlling phenolic compounds production that will act
as signalling molecules (Goldman et al., 1998). Up regulation of three transcripts coding
for PPOs at 2DAP and 4DAP may suggest an increased production of quinones, formed
by PPO-oxidation reactions, as a result of the physical damage (i.e. RNA degradation,
proteinases) promoted by senescence process in labellum enhanced by pollination.
This assumption can be supported by studies on rice that related an elevated level of
polyphenol oxidase as a consequence of leaf senescence process (Kar and Mishra,
1976). Yet, PPO cannot be considered as an indicator of senescence since its activity

Chapter 2- Labellum transcriptome after pollination
87
follows irregular patterns and fluctuations of enzyme activities are species specific
(Patra and Mishra, 1979).
2.4.2.2.1.2. Alkaloid metabolism
Alkaloids are a diverse group of low-molecular-weight, nitrogen-containing
compounds. As secondary metabolites, alkaloids are thought to play a defensive role in
protecting plants against herbivores and pathogens (Facchini and St-Pierre, 2005). Thus,
due to their potent biological activity, more than 12 000 known alkaloids have been
exploited as pharmaceuticals, stimulants, narcotics and poisons.
Down regulation of alkaloid biosynthetic genes (a transcript coding for L-
tyrosine/ L-Dopa decarboxylase (TYDC; EC 4.1.1.25) at 2DAP and 4DAP and other
coding for salutaridinol 7-O-acetyltransferase at 4DAP) was found in Ophrys fusca
labellum (Table 2.6).
2.4.2.2.1.2.1. Tyrosine/ L-Dopa decarboxylase (TYDC)
In plants, aromatic L-amino acid decarboxylases (AADCs), are involved in the
biosynthesis of several types of secondary metabolites, that are defined as compounds
that are not essential for normal growth and development, but are often involved in
key interactions between plants and their biotic and abiotic environments (Facchini et
al., 2000). L- tyrosine/ L-Dopa decarboxylase (TYDC; EC 4.1.1.25) and L- tryptophan
decarboxylase are AADCs that have attracted considerable attention due to their roles
in the biosynthesis of several important groups of pharmaceutical alkaloids (Facchini et
al., 2000). TYDC is involved in the biosynthesis of complex alkaloids, mainly
benzylisoquinoline alkaloids, which include more than 2500 known compounds that are
pharmacologically active including morphine and codeine (analgesic and antitussic
drugs) (Facchini et al., 2000; Schäfer and Wink, 2009). TYDC also participates in cell
wall-bound hydroxycinnamic acid amide biosynthesis which suggests a role in defense
response since in the cell wall deposition of hydroxycinnamic acid amides, and other
phenolics, may create a barrier against pathogens by reducing cell wall digestibility
and/or by directly inhibiting fungal hyphae growth (Liyama et al., 1994; Facchini et al.,
2000). In flowers, hydroxycinnamic acids may play functional roles as antimicrobial
defense compounds against pathogens and as cell wall reinforcement during anthesis
(Kang and Back, 2006). Down regulation of TYDC transcript at 2DAP and 4DAP may
suggest an inhibition of the alkaloid biosynthetic pathway after pollination. It is known
that herbivory can decrease pollination success by reducing resources available for
floral displays or rewards (e.g. petal attractability and scent emission), or by damaging

Chapter 2- Labellum transcriptome after pollination
88
attractive tissues (usually pollinators have preference for less damaged tissues) (Adler et
al., 2001). In Ophrys pollination system, TYDC can eventually be related to antimicrobial
defense response and may be responsible for creating a barrier for herbivory.
Ultimately, this would increase pollination events in orchids with a deceptive pollination
system, such as Ophrys fusca, characterized by low pollination rates (Ayasse et al.,
2000; Cozzolino et al., 2005).
2.4.2.2.1.2.2. Salutaridinol 7-O-acetyltransferase
At 2DAP, no differential expression of a salutaridinol 7-O-acetyltransferase (EC
2.3.1.150) was detected. Down regulation at 4DAP of a salutaridinol 7-O-
acetyltransferase (EC 2.3.1.150) protein was observed. This enzyme catalyzes the
conversion of the phenanthrene alkaloid salutaridinol to salutaridinol-7-O-acetate, the
immediate precursor of thebaine along the morphine biosynthetic pathway (Lenz and
Zenk, 1995; Grothe et al., 2001). Since morphine is a benzylisoquinoline alkaloid, its
biosynthesis is enhanced uptream by TYDC and ultimately by the salutaridinol 7-O-
acetyltransferase, the specific enzyme in morphine biosynthesis (Grothe et al., 2001).
The discovery of a transcript coding for salutaridinol 7-O-acetyltransferase in orchids is
pioneer. Previous studies performed on Epipactis helleborine flowers, a nectar
rewarding orchid species, established a correlation between narcotic compounds
production such as 3-2-3-3-(benzyloxy)propyl-3-indol, 7,8-didehydro-4,5-epoxy-3,6-D-
morphinan and oxycodone (semisynthetic morphinan) with potential pollinators
attraction (Jakubska et al., 2005). Despite the fact that Ophrys fusca pollination is
achieved by mimicking sex pheromones of the female pollinator species, it cannot be
discarded the hypothesis of alluring insects through narcotic compound synthesis, since
production of narcotic compounds would increase the chance of pollinators to visit a
larger number of flowers. Down regulation of a transcript coding for salutaridinol-7-O-
acetyltransferase at 4DAP suggest a decrease on morphine biosynthesis, thus
potentially reducing pollinator alluring and attraction soon after pollination.
Besides, a down regulation of salutaridinol 7-O-acetyltransferase transcript at
4DAP may emphasize the gene expression decrease of alkaloid biosynthetic pathway
after pollination. The creation of a barrier to herbivory/florivory before pollination is
mainly based on alkaloids biosynthesis (Adler et al., 2001). Since florivory (McCall and
Irwin, 2006) can affect pollination by damaging attractive tissues such as petals (McCall
and Irwin, 2006; Kessler and Halitschke, 2009), alkaloid synthesis would constitute a
chemical defense to reduce florivore damage, and therefore, is disengage after
successful pollination.
Chapter 2- Labellum transcriptome after pollination
89
2.4.2.2.1.3. Sugar metabolism
Starch is the major storage polysaccharide in plants. Apart from sucrose, starch
is also a photosynthesis primary product transiently deposited in the chloroplast. It is
composed of glucose polymers, namely amylose and amylopectin. Besides its structural
and nutritional function, polysaccharides are involved in plant growth and
development (Wang et al., 2008). In photosynthesis-competent cells of higher plants,
starch degradation of transitory starch results on the formation of glucose and maltose
(Fettke et al., 2009). The latter is formed by plastidial β-amylases that act either on
glucan chains located at the surface of native starch granules or hydrolyse soluble
glucans released by the action of isoamylases (Smith et al., 2005; Edner et al., 2007).
Starch degradation can be divided in two steps: initiation of degradation and digestion
(reviewed in Fettke et al., 2009). In digestion step, a key role is attributed to β-amylase
(Orzechowski, 2008).
2.4.2.2.1.3.1. β-amylase
The primary function of β-amylase (BMY) is starch breakdown. RNAi and studies
on mutants have shown that β-amylases are enzymes important for starch degradation
(Scheidig et al., 2002; Kaplan and Guy, 2005). BMY expression and activity may be
regulated by light, sugars, phytohormones, proteolytic cleavage and abiotic stresses
(e.g. osmotic, salt, cold and heat stress) (Kaplan and Guy, 2004). β-amylase is an exo-
amylase, responsible for the hydrolysis of the starch granule with the final product being
maltose. Maltose is exported to the cytosol and further metabolized to glucose and/or
sucrose and maltodextrins by the activity of cytosolic glucosyltransferases during
transitory starch degradation (Kaplan et al., 2006). In Arabidopsis thaliana, nine genes
are known to encode β-amylases mainly expressed in leaves (Orzechowski, 2008).
Starch reserves do play a role in reproductive processes. Carbohydrates accumulated
in the style support pollen tube growth and starch within the ovule is involved in the
development of both ovular structures and embryo (Rodrigo et al., 2000 and references
therein). Down regulation of a chloroplast-localized β-amylase by antisense mRNA
resulted on a starch-excess phenotype in potato leaves compared to wild type plants
(Scheidig et al., 2002). Studies on gene expression and enzyme activities performed on
Oncidium sp. pseudobulbs highlight the putative mobilization of starch development by
the action of β-amylase to fulfil energy requirement for floral development (Wang et al.,
2008). Reports in Arabidopsis thaliana (Okada and Shimura, 1994) and in Vitis vinifera
(Lebon et al., 2005; Lebon et al., 2008) suggest a close relationship among flower
development, sexual reproduction and carbohydrate degradation. Therefore, it is
Chapter 2- Labellum transcriptome after pollination
90
reasonable to suggest a possible role of BMY in Ophrys fusca flower development, since
down regulation of a transcript coding for this enzyme, at 2 days after pollination, may
be related to a deactivation of starch degradation that remains as an energy storage
reserve useful for ovule maturation and/or germinating seeds.
2.4.2.2.1.3.2. β-glucosidase
β-glucosidases belong to the glycoside hydrolases family, which catalyse the
hydrolysis of glycosidic linkages in aryl and alkyl β-glucosides and cellobiose, displaying
a broad specificity with respect of both aglycone and the glycone moieties as
substrates (Opassiri et al., 2003; Morant et al., 2008). Plant β-glucosidases (EC 3.2.1.21)
play important roles in defense, phytohormone regulation, oligosaccharide catabolism,
lignification, activation of metabolic intermediates and release of volatiles from their
glycosides (Sasanuma and Hirakawa, 2010). These enzymes help defend against
herbivores and invasive fungi by hydrolyzing relatively inert glycosides to produce toxic
compounds, such as hydrogen cyanide (HCN), saponins, coumarins, quinones,
hydroxynamic acid and rotenoids (Poulton, 1990; Opassiri et al., 2003 and references
therein). Arabidopsis thaliana genome revealed that β-glucosidases are a multigenic
family of 48 members (Xu et al., 2004), and sequence variations are likely to reflect
differences in substrate specificity (Opassiri et al., 2003). Also, β-glucosidases are
receiving increased attention due to their use in biotechnological and industrial
applications, mainly by their importance in aroma formation, e.g. in wine (Fia et al.,
2005) and strawberry (Orruño et al., 2001). Studies performed in Narcissus flowers,
correlated the high activity of β-glucosidase with the increase in scent production
(Reuveni et al., 1999). In some flowers the aromatic compounds are stored as non-
scented glycoside precursors in the vacuoles (Dudareva and Pichersky, 2000). β-
glucosidases can remove sugar moiety thereby allowing the release of the volatile
fraction (Reuveni et al., 1999). Scent plays a ubiquitous role in plant–insect interactions.
Plant volatiles display numerous functions since they can attract pollinators, provide
learning cues for foraging insects, serve as herbivore repellents or attractants, or attract
natural enemies of herbivore (Andrews et al., 2007). Flower scents are prone to
exploitation by herbivores. Studies performed on moth-pollinated flowers of Nicotiana
attenuata suggest the existence of a distinct rhythmicity in release of volatile organic
compounds, the emission being high at times of high pollinator activity and low when
floral herbivores are most active (Theis, 2006). So far, several herbivore derived elicitors
inducing plant defense have been identified, namely fatty acid-amino acid conjugates
and a β-glucosidase (Dicke et al., 2009). Also, the removal of the sugar moiety from
these compounds has shown to be assisted by the activity of the β-glucosidases in floral

Chapter 2- Labellum transcriptome after pollination
91
tissue, which in turn correlates with scent production (Reuveni et al., 1999). In O. fusca,
down regulation of a β-glucosidase at 2DAP may suggest a putative role in scent
emission, either by activating plant defense mechanism after herbivory events (Dicke et
al., 2009) and/or through its roles addressed in breakage of sugar moieties in non-
volatile forms for incrementing its volatility. Studies on Dendrobium crumenatum orchid
demonstrated a significant decrease of β-glucosidase activity during flower
senescence (Yap et al., 2008), which is in accordance with results here reported for
O.fusca. Other putative roles attributed to β-glucosidase cannot be ruled out. β-
glucosidases described in barley (Leah et al., 1995) and rice (Akiyama et al., 1998)
appears to be involved in cell wall-derived oligosaccharides recycling produced during
germination. Yet, to determine the function of the β-glucosidase of Ophrys fusca after
pollination, detailed analysis of substrate-specificity and cloning/expression analysis is
advised.
2.4.2.2.1.3.3. Myo-inositol 1-phosphate synthase
Myo-inositol-1-phosphate synthase (MIPS; EC 5.5.1.4), involved in the de novo
inositol biosynthesis pathway, catalyzes the conversion of D-glucose 6-phosphate to 1-L-
myo-inositol-1-phosphate, the rate-limiting step of myo-inositol (MI) biosynthesis (Abreu
and Aragão, 2007). MI is precursor of compounds that function in phosphorus storage,
signal transduction, stress protection, hormonal homeostasis and cell wall biosynthesis
(Abid et al., 2009). Compounds derived from myo-inositol contribute to mechanisms
such as signal transduction (phosphatidylinositols), stress response (pinitol and ononitol),
and seed storage (raffinose, phytic acid) (Chiera and Grabau, 2007). MIPS is encoded
by a multigenic family that vary among plant species (Meng et al., 2009; Eckardt, 2010).
Donahue and co-workers (2010) characterized three MIPS genes in Arabidopsis
thaliana: MIPS1 is expressed in most cell types and developmental stages, being
required for seed development and cell death suppression. MIPS2 and MIPS3 are mainly
restricted to vascular tissues and, to our knowledge; no putative function has been
assigned. MIPS3 sequences from soybean were found predominantly in flowers, but
were also found in leaves, buds and germinated cotyledons (Hegeman et al., 2001). Down regulation of a transcript coding for a MIPS gene, suggest a general decrease of
myo-inositol biosynthesis at 2DAP, which could be related to a possible role on plant
development, as shown by studies where down regulation of MIPS activity revealed to
be unfavourable for plant development (Meng et al., 2009 and references therein). A
recent report shown that MIPS1 has a significant impact on myo-inositol levels which is
critical for maintaining levels of ascorbic acid, phosphatidylinositol, and ceramides that
regulate growth, development and cell death (Donahue et al., 2010). In Arabidopsis,

Chapter 2- Labellum transcriptome after pollination
92
MIPS1 is required for cell death suppression (Donahue et al., 2010). Since ceramidases
were down regulated in Ophrys fusca labellum at 2DAP (see Lipid metabolism,
Sphingolipids section), and ceramides (sphingolipid precursors associated with cell
death) accumulation may be responsible for enhancing program cell death cascades,
this may suggest a cross-talk between myo-inositol levels and cell death program. Yet,
MIPS role needs to be further investigated for addressing specific function in
development and pollination-enhanced events.
2.4.2.2.1.4. Lipid metabolism
Several transcripts coding for proteins involved in lipids metabolism were
encountered in the Ophrys fusca pollination microarray under study. Particularly, all
transcripts involved in lipid metabolism were down regulated at both 2DAP and 4DAP.
Transcripts coding for wax biosynthesis (TCER1), fatty acids (FAD2 and SAD),
sphingolipids (ceramidase and glucosylceramidase) and sterol metabolism (7-
dehydrocholestrol reductase) are discussed regarding pollination in Ophrys fusca.
Lipids are molecules soluble in nonpolar organic solvents naturally occurring in
plants or animals. Lipids can be divided in fatty acids (saturated and unsaturated),
glycerides, non glycerydes lipids (including waxes, steroids and sphingolipids) and
complex lipids (lipoproteins). They can display a wide range of functions, namely: as
components of plant cell membranes, as second messengers in signal transduction
pathways that elicit plant growth, development and stress responses by creating a
physical barrier to environmental assaults, and in photosynthesis (Shah, 2005).
2.4.2.2.1.4.1. Wax biosynthesis
In aerial plant organs, epidermal waxes form a hydrophobic coating which is
deposited either outside of the cuticle (epicuticular wax) or within the cuticular matrix
(intracuticular wax) (Broun et al., 2004). In addition to its role in protecting plants from
water loss, epidermal wax function also in defense response against biotic stresses, such
as UV radiation (Nawrath, 2006) and in plant-insect interactions (Post-Beittenmiller,
1996). Epicuticular waxes are complex mixtures of very long chain (VLC, >C18) fatty
acids, hydrocarbons (alkanes and alkenes), alcohols, aldehydes, ketones esters,
triterpenes, sterols, and flavonoids. Very long fatty acids (VLCFAs), the precursors of
most wax components, are produced by elongation of fatty acids (C16 or C18) through
a series of four reactions (condensation, reduction, dehydration, and second
reduction) catalyzed by the fatty acid elongation (FAE) system (reviewed in Post-
Beittenmiller, 1996). Long chain products (C16, C18) are processed by enzymes as

Chapter 2- Labellum transcriptome after pollination
93
stearoyl ACP- desaturases (SAD) and plastidial acyl transferases, among others. Other
components of the wax are produced by three elongation steps: the decarbonylation
pathway, which leads predominantly to the production of alkanes from long-chain fatty
acids and aldehydes; the acyl reduction pathway leading to primary alcohols, and β-
ketoacyl elongation resulting on production of β-diketones and their derivatives (Post-
Beittenmiller, 1996; Ohlrogge and Jaworski, 1997). Secondary alcohols and ketones
result from enzymatic modification of alkanes.
2.4.2.2.1.4.1.1. Eceriferum 1 (CER1)
Until date, 11 genes have been identified as being involved in wax biosynthesis
or in wax regulation, including seven genes that are predicted to encode enzymes of
the wax secretory pathway: CER1 (Aarts et al., 1995), CUT1/CER6 (Fiebig et al., 2000),
KCS1 (Todd et al., 1999), WAX2 (Chen et al., 2003), FIDDLEHEAD (Yephremov et al.,
1999), GLOSSY1 (Sturaro et al., 2005), and GLOSSY8 (Xu et al., 1997). CER1 encodes a
fatty aldehyde dercabonylase, a protein involved in the selective secretion of alkanes
in epidermal cells (Post- Beittenmiller, 1996; Fiebig et al., 2000; Mariani and Wolters-Arts,
2000). Cheesbrough and Kolattukudy (1984) described for the first time the
decarbonylation of an aldehyde intermediate to form alkane. However, conclusive
biochemical and molecular genetic evidences are lacking to unravel alkane formation
pathways; the less understood part of wax biosynthesis. Sorting alkane pathways would
be of extreme importance since cuticular alkanes have potential interest in the fuel
sector that until now is based on fossil hydrocarbons (Jetter and Kunst, 2008).
Dowregulation of a gene coding for TCER1 at 4DAP suggests a post pollination
reduction in alkane’s compounds functioning as olfactory mimic cue, particularly
important in plant-insect interaction in Ophrys pollination systems (Schiestl and Ayasse,
2001). This result suggests that the emission of compounds triggering Ophrys pollinator
insect copulatory behaviour is transcriptionally regulated and its decrease was only
revealed at 4DAP. One hypothesis for no differential expression detected at 2DAP may
be related with: pollinated lips still produce compounds triggering pollination, most likely
for attracting pollinators to other flowers of the same inflorescence. Studies on Ophrys
sphegodes revealed that production of odour compounds that trigger pollination
(alkanes and alkenes) was not ceased after pollination (Schiestl and Ayasse, 2001),
since alkanes are part of the desiccation-preventing wax layer on the flowers.
Therefore, downregulation of TCER1 transcript suggests that production of cuticular
waxes compounds, namely alkanes, is transcriptionally decreasing at 4DAP. Cozzolino
and Schiestl (2008) revealed that these compounds (alkanes and alkenes) are
common components of cuticular waxes that can be regarded as pre-adaptations for

Chapter 2- Labellum transcriptome after pollination
94
the emission of pseudopheromones (mimicking female pheromones from pollinator
species), thus revealing an energy-saving system by exploiting of wax general functions.
Bradshaw and co-workers (2010) suggested that cuticular waxes may provide structural
support for the elongate trichomes that ornaments all Ophrys labella that, in fact, mimic
the trichomes of the insect female of pollinator species.
2.4.2.2.1.4.2. Fatty acids Metabolism
Fatty acids are long-chain hydrocarbons which have an acidic end (-COOH).
The chain can be either saturated or unsaturated, and fatty acids serve as the
hydrophobic portion of the cellular membrane. The desaturation of long-chain fatty
acids is a ubiquitous transformation which plays a critical role in the biosynthesis of lipids,
and is achieved by double bonds introduction at specific positions in a fatty acid chain
by means of different desaturases.
2.4.2.2.1.4.2.1. Desaturases: Omega-6 Fatty Acid Desaturase (FAD2) and Stearoyl ACP-
Desaturase (SAD)
The pathway catalyzed by omega 6-fatty acid desaturase, also known as Fatty
acid desaturase 2 (FAD2), is the primary route of polyunsaturated fatty acids (PUFAs)
production in plants , by performing the first extra-plastidial desaturation by converting
oleic acid (18:1, a monounsaturated fatty acid) to linoleic acid (LA) (Byfield and
Upchurch, 2007). Linoleic acid (18:2), also known as omega-6 fatty acid, is one of the
two essential fatty acids together with α-linoleic (18:3 or omega-3 fatty acid), which
cannot be synthesized by mammals and therefore must be obtained from dietary
sources (Dyer et al., 2008; Wu et al., 2009). The resulting fatty acids products may
constitute structural components of cell membranes (e.g. phospholipids of the
endoplasmatic reticulum (ER) and galactolipids of plastids), and a proportion can be
used for triacylglycerol (TAG) production (Dyer et al., 2008), which is the main
constituent of vegetable oil and animal fats (Wertz, 2000). Stearoyl ACP-desaturase
(SAD), commonly known as ∆9 desaturase or as fatty acid biosynthesis 2 (FAB2), is a key
enzyme that catalyzes the conversion of stearic (18:0) into oleic acid (18:1) by
introducing the first double bond in stearoyl ACP between carbon 9 and 10 (Liu et al.,
2009). Linoleic and oleic acids are important in determining the quality of plant oils,
since oils with high proportion of this two acids are of nutritional interest for human and
animals (Khadake et al., 2009). Δ-9 stearoyl-ACP desaturases are found in all plant cells
and are essential for the biosynthesis of unsaturated membrane lipids (Byfield and
Upchurch, 2007). SAD is exclusive to plant kingdom since all other desaturases are

Chapter 2- Labellum transcriptome after pollination
95
known to be membrane proteins (Ohlrogge and Browse, 1995; Shanklin and Cahoon,
1998). SAD plays a key role in C18 fatty acid biosynthesis and its expression and/or
enzyme activity have shown to modulate the relative oil levels of both stearic and oleic
acids (Byfield and Upchurch, 2007). Recent studies performed in breeding maize lines
(Liu et al., 2009) and in Arabidopsis thaliana (Kachroo et al., 2007) demonstrated that
high SAD mRNA expression play an important role in increasing oleic acid levels. Down
regulation at 2DAP of a transcript coding for an omega-6 fatty acid desaturases
suggests a decrease of linoleic acid production and the downregulation of two copies
coding for SADs at 4DAP suggests a decrease in oleic acid production. Since activity of
fatty acid desaturases regulates the levels of unsaturated fatty acids on membrane
lipid fluidity (Upchurch, 2008), it can be considered that a decrease on unsaturated
fatty acids occurred as a result of senescence-related changes in cell membranes.
During flower senescence, membrane properties have been shown to undergo several
changes such as increase in the saturation:unsaturation index of fatty acids and
membrane phospholipids losses (Leverentz et al., 2002). Our results suggest a decrease
in PUFAs biosynthesis transcripts may be related to membrane lipid losses, as reported
earlier (Wu et al., 2009). These fatty acids can be further converted into aldehydes by
hydroperoxide lyase, jasmonic acid and methyl jasmonate by allene oxide synthase or
into epoxides by peroxygenase, all of which can be recycled by the plant (Brash, 1999;
Koch et al., 1999).
Recent evidences point out for the possibility of different desaturases,
introducing double bonds at specific positions in fatty acids, may give rise to a vast
array of unsaturated fatty acids and, ultimately, to alkenes (Schlüter and Schiestl, 2008).
In Ophrys- pollinator crosstalk, a blend of alkanes and alkenes (e.g. saturated and
unsaturated hydrocarbons, respectively) with different carbon chain lengths are
responsible for chemical mimicry of the pollinator insect species (Schiestl, 2005). Alkane
and alkene biosynthesis are part of the wax biosynthetic pathway, until now poorly
understood. As alkane formation pathway seems to undergo decarbonylation in FAE
system, alkenes production pathway has been linked to an elongation system which
includes a desaturase (von Wettstein-Knowles, 2007). Schlüter and Schiestl (2008)
suggested that alkene biosynthetic pathway should follow alkane’s synthesis, except on
alkene formation that would need additional desaturation steps. For instance, in Ophrys
sphegodes, pollinated by Andrena nigroaenea, pseudocopulation is elicited mostly by
9-alkenes (Schiestl et al., 2000), and recently a SAD2 has been attributed for introducing
double bonds at 9- and 12-positions (Schlüter et al., 2011). Thus, a SAD from Ophrys
fusca coding for an homologue for SAD 2 (Table 2.6.) may be related to a putative
function on 9- and 12 alkenes double bonds introduction (Schlüter et al., 2011). This
assumption is corroborated by recent studies performed in barley, where the synthesis

Chapter 2- Labellum transcriptome after pollination
96
of the 9-alkene compounds depends on a desaturase acting at the 9-10 position, as it
happens with the introduction of the first double bond into the C18 products of the fatty
acid synthase in plastids (von Wettstein-Knowles, 2007). It is also supported by studies on
Cistus sp. petals, where the 9-10 double bonds in the C23-C33 alkenes depends on a
desaturases (Gülz, 1980). Therefore, it is conceivable that, as in Drosophila
melanogaster (Dallerac et al., 2000), alkenes with double bonds depend on enzymes
acting preferentially on different acyl chains (C14, C16, C18) as substrates to yield a
vast array of alkenes. Furthermore, the possibility of omega 6-desaturase to have a
putative role on alkene biosynthesis cannot be discarded, given that previous studies
revealed that alkanes and alkenes, according to their chain length and positions of
double bonds, may be derived from palmitic, stearic, oleic, linoleic or linolenic acid
(Ney and Boland, 1987). The down regulation of two transcripts coding for different
desaturases suggests that both alkane and alkene biosynthesis decreased in labella 4
days after pollination. This cessation could be related to a decrease in compounds
production, no longer needed after pollination. Previous reports on Ophrys sphegodes
pollination verified a slight decrease in odour bouquet on labella extracts (mainly
composed of alkanes and alkenes) after pollination yet with no statistical significance
(Schiestl and Ayasse, 2001). The involvement of both desaturases in Ophrys pollination
ecological relationship, through the insertion of double bonds at different positions at
fatty acid substrates of distinct carbon chain lengths, seems to be a promising
challenge that yet needs to be confirmed. Recently, expression of two SAD isoforms,
SAD1 and SAD2, in two Ophrys species revealed to be flower-specific and thus SAD2
has shown a significant association with alkene production (Schlüter et al., 2011).
2.4.2.2.1.4.2.2. 3-ketoacyl-CoA thiolase (KAT)
The breakdown of fatty acids, performed by the β-oxidation cycle, is crucial for
plant germination and sustainability (Pye et al., 2010). β-oxidation involves four
enzymatic reactions. The final step, in which a two-carbon unit is cleaved from the fatty
acid, is performed by a 3-ketoacyl-CoA thiolase (KAT) (Castillo and Leon, 2008). In our
microarray, up regulation of a KAT transcript at 4DAP suggest that fatty acids are being
degraded via β-oxidation cycle. This process can mobilize carbon stored for further use
and can eliminate deteriorative effects of free fatty acids released from lipid turnover
(Gerhardt, 1992). Fatty acid breakdown in peroxisomes have been observed in both
leaf and petal senescence (Pistelli et al., 1991; Graham and Eastmond, 2002;
Hoeberichts et al., 2007; van Doorn and Woltering, 2008).

Chapter 2- Labellum transcriptome after pollination
97
2.4.2.2.1.4.3. Sphingolipids metabolism
The basic building block of sphingolipids is an amino alcohol long chain base
(LCB). In plant cells, ceramide (which is the basic element for more complex
shingolipids) is formed by acylation of the LCB amine group with a fatty acid (FA),
generally composed of 14–26 carbon atoms (Pata et al., 2010). Plant sphingolipids can
be divided into four classes: glycosylinositolphosphoceramides (GIPCs),
glycosylceramides (GlcCer), ceramides (Cer) and free long-chain bases (LCBs) (Zäuner
et al., 2009). Uncovering possible functions for each of the sphingolipids classes is
complex and challenging, since sphingolipid metabolites are being continuously
converted into each other via de novo synthesis, through condensation of serine with
an acyl-CoA, and salvage pathway, where ceramides and free LCBs are released from
more complex sphingolipids (Zäuner et al., 2009). In the past few years, sphingolipids
from plants have been subject of interest for their putative functions as plasma
membrane and lipid rafts components, as being involved in signaling of plant response
to drought and in regulation of programmed cell death (PCD) (Shah, 2005; Markham et
al., 2006).
2.4.2.2.1.4.3.1. Glucosylceramidase and neutral ceramidase
In plants, ceramide (Cer) can be formed via two pathways: the FA-CoA
dependent and free FA-dependent pathways, being the FA-CoA dependent pathway
the major route through which ceramide is synthesized (reviewed in Pata et al., 2010).
Cer can undergo further modifications resulting on the formation of complex
sphingolipids such as GIPCs and glycosylceramides (GlcCer). Ceramide is a major
intracellular messenger that mediates cellular responses in apoptosis, senescence, cell
cycle arrest and differentiation (Hannun et al., 2001; Choi et al., 2003). Ceramidases,
known as key regulators of sphingolipid signaling metabolites, hydrolyzes ceramide into
a long chain shinganine (in animals, sphingosine) and a free FA (Kono et al., 2006).
Ceramidases are considered acid, alkaline and neutral, based on the pH at which their
activity is optimal. In Arabidopsis thaliana, three ceramidase-like genes encoding
neutral and alkaline ceramidases were described (Liu and Yu, 2009). Since neutral
ceramidases regulate the availability of the Cer and LCB polls, functions as key
modulators of cellular processes and signaling have been addressed (Pata et al., 2010).
In animals, GlcCer, the simplest member of glycosphingolipids, has been involved in
many cellular processes such as cell proliferation, oncogenic transformation,
differentiation and tumour metastasis (Bleicher and Cabot, 2002 and references
therein; Sandhoff and Kolter, 2003). In plants, GlcCer are extremely abundant in plasma
Chapter 2- Labellum transcriptome after pollination
98
and vacuolar membranes (Pata et al., 2010), and may function in chilling⁄∕ freezing
tolerance, pathogenesis, membrane permeability and stability (Sperling and Heinz,
2003). Glycosylceramidase is a lysozomal enzyme, which cleaves glucosylceramide to
glucose and ceramide. Down regulation of two sphingolipid -related genes was
detected in our study, namely of neutral ceramidase (2 DAP) and glucosylceramidase
(EC: 3.2.1.45, 2 DAP and 4 DAP) transcripts. Ceramidases can regulate the levels of
ceramide (substrate) and/or its by-products sphingosine and sphingosine 1-phosphate
(S1P) (Hannun and Obeid, 2002, 2008). Glucosylceramidases hydrolyze
glucosylceramides, complex sphingolipids, to render de novo ceramide (Pata et al.,
2010). While ceramide is a well-established inducer of apoptosis/PCD in animals
(Hannun and Obeid, 2008), the related S1P has been shown to suppress PCD in animals
(Cuvillier et al., 1996). It has been described that maintenance of sphingolipid
homeostasis is important for regulating apoptosis in plant cells (Shi et al., 2007), namely
regarding the pool balance of ceramide and its derived compound S1P. In plants, the
first evidence for the involvement of ceramide in PCD was reported by Liang and co-
workers (2003), and later studies validate the same feature (Gechev et al., 2004; Shi et
al., 2007). In our microarray, down regulation of different ceramidases suggest a
decrease of ceramide hydrolysis to render S1P (an anti-apoptotic sphingolipid) and also
a decline on glucosylceramide hydrolysis to ceramide, which may point out to an
imbalance on ceramide and S1P pools that could be related to a sphingolipid-
regulated PCD enhanced after pollination.
2.4.2.2.1.4.4. Sterol metabolism
Phytosterols (also called plant sterols) are a group of steroid alcohols,
phytochemicals naturally occurring in plants (Hartmann, 1998; Weingärtner et al., 2009).
They are synthesized via melavonate pathway of the isoprenoid metabolism (Schaller,
2004) and, in plant cells, phytosterols contribute to the regulation of the fluidity and
permeability of cell membranes and affect growth processes, such as embryogenic
growth (Shaller, 2003). Phytosterols also sustain the domain structure of cell membranes
where they are considered as membrane reinforcers, since sterols are critical for the
formation of lipid rafts (Dufourc, 2008). Certain sterols, such as campesterol in
Arabidopsis thaliana, are precursors of oxidized steroids acting as growth hormones
collectively named brassinosteroids (Schaller, 2003). The crucial importance of
brassinosteroids upon growth and development has been established through the
study of a set of dwarf mutants affected in brassinosteroids synthesis or perception
(Choe et al., 1999, 2000; Nam and Li, 2002).

Chapter 2- Labellum transcriptome after pollination
99
2.4.2.2.1.4.4.1. 7-dehydrocholestrol reductase
End products of the sterol biosynthetic pathway differ depending on species:
cholesterol is encountered in animals; ergosterol is the most common sterol in fungi;
while sitosterol, campesterol, cholesterol and stigmasterol are typical plant sterols
(Lecain et al., 1996; Weingärtner et al., 2009). In mammals, the sequential steps of
cholesterol biosynthesis, 7-dehydrocholestrol reductase (Δ7SR, EC 1.3.1.21) catalyzes
the reduction of the Δ7 double bond in sterol intermediates (Zhang et al., 2007). Plants
that have an inefficiency of this enzyme can display dwarfism resulting in severely
altered growth and development (Choe et al., 2000). Brassinosteroids (BRs) are a group
of steroid hormones that uses mainly campesterol as precursor for its biosynthesis and
are known for roles in regulation of plant growth and development, such as stem
elongation, tracheary element differentiation and regulation of gene expression
(Fujioka and Yokota, 2003; Nomura et al., 2004) and also by acting as hormone signals
(He et al., 2003). Cellular defects in BRs biosynthesis or response, often result in a
characteristic dwarf syndrome due to a defect on cell expansion (Nomura et al., 2004
and references therein). The deficiency in Δ7SR is the main cause of dwarfism
phenotype in Arabidopsis, known as dwf5 (Choe et al., 2000). Down regulation of a
transcript coding for a Δ7SR in Ophrys fusca labella at 2DAP suggests that growth and
development are compromised after pollination, not neglecting that the event may
have occurred before. Since brassinosteroids are important plant hormones that are
involved in cell expansion and elongation (working together with auxin) (Mockaitis and
Estelle, 2004), in promoting vascular differentiation, and are necessary for pollen
elongation (Hewitt et al., 1985; Ye et al., 2010), the observed down regulation of this
transcript suggests that all these developmental processes were compromised after
pollination.
2.4.2.2.1.5. Nitrogen, sulfur and selenium metabolism
Sulfur (S) is an essential macronutrient for plants, and is present at 0.1-1% of plant
dry weight, depending on the plant family and soil type (Pilon-Smits and Pilon, 2007).
Sulfur is an essential element for plant primary metabolism as a structural component of
proteins and lipids, antioxidants, regulatory molecules, metal-binding molecules and
cofactors (Pilon et al., 2006). NifS-like proteins, also known as cysteine desulfurases (EC
2.8.1.7), catalyze the conversion of the amino acid cysteine into alanine and elemental
sulfur (S) (Mihara and Esaki, 2002; van Hoewyk et al., 2007). In plants, NifS-like proteins
may play roles in Fe-S formation, biosynthesis of thiamine, biotin, molybdenum cofactor
(MoCo), also in seleno(Se)-protein and Se tRNA synthesis due to its selenocysteine lyase

Chapter 2- Labellum transcriptome after pollination
100
activity (Xu and Møller, 2006; van Hoewyk et al., 2008). Down regulation of a transcript
coding for a Nifs-like protein at 4DAP may suggest that Fe-S protein formation, which is
dependent on NifS-like proteins activity, was disrupted by the pollination event.
Consequently, as previously described, functions including protein import, chlorophyll
metabolism, nitrogen and S reduction, respiration and photosynthetic electron transport
chain are compromised (Xu and Møller, 2006). Also, it has been addressed a possible
role of a NifS-like protein in Fe–S cluster development in pollen (van Hoewyk et al.,
2008), however more studies are needed to disclose a putative function in orchid
reproductive biology.
2.4.2.2.1.6. Amino acid metabolism
2.4.2.2.1.6.1. Ornithine-δ-aminotransferase
Organic solutes such as proline, glycine betaine, sugars, and polyols,
accumulating at high concentrations in the cytoplasm in response to abiotic stress
without interfering with primary metabolism, are classified as ‘compatible’ solutes,
(Verbruggen and Hermans, 2008). High levels of compatible solutes are found not only
under stress conditions, but also in plant organs such as pollen and seeds undergoing
dehydration as part of their development (Lehmann et al., 2011). In higher plants,
proline (Pro) biosynthesis involves conversion of glutamate into pyrroline-5-carboxylate
(P5C) by P5C synthase (P5CS) and subsequent reduction of P5C to proline by P5C
reductase (P5CR) (Trovato et al. 2008; Verbruggen and Hermans, 2008). In an
alternative pathway of proline synthesis, the activity of ornithine-δ-aminotransferase
(δOAT;; EC 2.6.1.13) converts ornithine and α-ketoglutarate to P5C and glutamate by
transamination, yet this biosynthetic pathway does not contribute to stress-induced
proline accumulation (Funck et al., 2008; reviewed in Stránská et al., 2008). In
Arabidopsis mutants lacking δOAT activity, plants were unable to mobilize nitrogen from
arginine or ornithine but they showed proline accumulation, which supports the role of
δOAT mainly in arginine degradation (Funck et al., 2008). Arabidopsis uses arginine (Arg)
as a storage and transport form of nitrogen and proline (Pro) as a compatible solute in
the defense against water deprivation abiotic stresses (Funck et al., 2008). Arg
catabolism produces ornithine (Orn), which is a controversial precursor alternative to
glutamate (Glu) for Pro biosynthesis in mitochondria (Goldraij and Polacco, 2000).
Down regulation of a transcript coding for an ornithine-δ-aminotransferasewas
observed in Ophrys fusca at 2DAP. Previous studies suggest that proline plays an
important role in plants development, especially in flowers and pollen, serving as an
accessible source of energy (Kavi Kishor et al., 2005). In flowers with nectars as rewards,

Chapter 2- Labellum transcriptome after pollination
101
its content is usually proline-rich (Carter et al., 2006). Since Ophrys is a nectarless orchid
genus this possibility has to be discarded. In the absence of stress, Arabidopsis thaliana
revealed high content and active transport of Pro during flowers development (Hua et
al., 1997). High expression levels of ProT1and LeproT encoding a proline transporter
have been identified in A. thaliana (Rentsch et al., 1996) and tomato (Schwacke et al.,
1999) flowers. Recent studies revealed that proline biosynthesis and transport contribute
to proline accumulation in flower buds and flowers (Xue et al., 2009), and that higher
Pro turnover in flowers than in other organs of the plant may be responsible for
providing energy and/or carbon and nitrogen sources for flower development (Hua et
al., 1997). The role of proline in plant cells response to stress is well documented, and Pro
has been proposed to display a function in flowering and development both as a
metabolite and as a signal molecule (Mattioli et al., 2009). Proline has multiple functions,
such as scavenger of toxic substances, protector of different enzyme systems and
membranes stabilizer (Fricke and Pahlich, 1990). Down regulation in O.fusca at 2DAP of
a transcript coding for a putative ornithine-δ-aminotransferase suggests that proline is
no longer synthesized via the alternative Pro biosynthesis pathway after pollination.
Since higher accumulation of proline allows plants to maintain an osmotic balance
preventing tissue dehydration (Ali et al., 2006), after pollination labella are no longer
experiencing a developmental process and thus, hydration of flower tissues are not
required for organ maintenance. Accumulation of proline in floral organs of different
species has been described by different authors, suggesting that this amino acid may
play a role in flowering process (Hua et al., 1997; Mattioli et al., 2008, 2009; Xue et al.,
2009).
The significance of the alternative pathway and δOAT activity in proline
biosynthesis has been questioned, since proline levels were not affected in Arabidopsis
thaliana knock out mutants (Funck et al., 2008; Szabados and Savouré, 2010). Instead,
δOAT may facilitate nitrogen recycling from arginine catabolism (Funck et al., 2008;
Stránská et al., 2008). Thus, the main function of δOAT in Arabidopsis may be related to
ornithine catabolism rather than to proline synthesis (Funck et al., 2008). The first step of
Arg breakdown is the cleavage into Orn and urea by arginase and Orn catabolism
seems to depend on δOAT activity (Shargool et al., 1988; Funck et al., 2008). In
Arabidopsis, the conversion of Orn to Glu, through δOAT activity, is an essential route for
nitrogen recycling from arginine but not for stress-induced proline accumulation (Funck
et al., 2008). L-arginine is the amino acid with the highest content of N (four atoms per
molecule) and represents the major source of N for the biosynthesis of nitrogenous
compounds. Down regulation of a transcript coding for δOAT, an enzyme putatively
involved in Orn catabolism, may suggest a role of accumulating Orn in O. fusca at 2
days after pollination. Available Orn can re-enter the Arg biosynthetic pathway

Chapter 2- Labellum transcriptome after pollination
102
(Slocum, 2005) and Arg can be used as N sink, as it has been proposed for poplar
senescence in which Arg accumulation in stems may function as N storage compound
(Couturier et al., 2010).
2.4.2.2.1.6.2. Methylcrotonyl-CoA carboxylase α-subunit
Plants catabolize leucine (Leu) via two separated pathways: a peroxisomal
pathway not requiring methylcrotonyl-CoA carboxylase (MCC) and a mitochondrial
one, a MCC-requiring pathway that catabolizes Leu to acetoacetate and acetyl- CoA
(Che et al., 2002, 2003). MCC (EC 6.4.1.4) is a biotin enzyme, composed of two subunits:
biotin-containing α- subunit (MCC-A) and non-biotin-containing β-subunit (MCC-B)
(Alban et al., 2000; Nikolau et al., 2003). This enzyme has a pivotal role in both leucine
catabolism and carbon recycling from isoprenoids via the mevalonate pathway
(Anderson et al., 1998; Che et al., 2002). Leucine (Leu) catabolism revealed to be down
regulated at 2DAP, through the expression of mitochondrial methylcrotonyl-CoA
carboxylase enzyme (MCC). Leucine catabolism is known to provide an alternative
source of acetyl-CoA to sustain respiration and metabolic processes in the absence of
photosynthesis (Mentzen et al., 2008). Elevated MCC mRNA levels in flowers have been
related to increases on Leu catabolism to guarantee ATP demands essential for growth
(Mckean et al., 2000). As a result, down regulation at 2DAP of MCC transcript suggest
that Leu catabolism was inhibited after pollination, since catabolically derived ATP was
no longer required. Also, if Leu is not being catabolized after pollination, we can
speculate that this amino acid could be further used for newly protein synthesis
required for proper enhancement of senescence (see protein synthesis section below).
2.4.2.2.1.8. Nucleotide/nucleoside/nucleobase metabolism
Ureides result from nitrogen fixation via purine degradation, the majority being
associated with ammonia assimilation (Werner et al., 2010; Witte, 2011). Ureides are
produced in senescing tissues, such as seedling cotyledons, which reserves support the
developing seedlings (Todd and Polacco, 2006). The three major ureides are allantoin,
allantoic acid and citrulline. In Arabidopsis, allantoin is converted to ureidoglycolate
and ammonia by allantoinase or allantoate amydohydrolase (AAH, EC 3.5.2.5.) (Todd
and Polacco, 2006). In specific ureide-accumulating organs (e.g. roots), allantoin
and/or allantoate are translocated to other plant organs, such as shoots and leaves,
where they are completely degraded (Todd et al., 2006). In plants, allantoate
degradation is required for recycling the nitrogen purine-ring (Werner et al., 2008). Up
regulation of a transcript coding for AAH at 4DAP suggests the mobilization of nitrogen

Chapter 2- Labellum transcriptome after pollination
103
resulting from purine catabolism. This feature is especially important during flower
senescence, in which nitrogen source tissues (i.e. senescing flowers) provide nitrogen for
metabolic sinks (Witte, 2011). Increased levels of purine catabolism enzymes have been
reported in senescent leaves (Brychkova et al., 2008).
2.4.2.2.2. Cell fate
2.4.2.2.2.1. Cell aging and program cell death (PCD)
Programmed cell-death (PCD) is defined by the death of a cell or cells
mediated by an intracellular program. Senescence can be considered a type of PCD,
since it involves structural, biochemical and molecular changes similar to those of PCD
(Tripathi and Tuteja, 2007). Petals constitute an excellent model for studying
senescence since they have a finite lifespan and their death relies on a highly
coordinated developmental control. Once a flower is pollinated or is no longer
receptive for pollination, its maintenance is extremely costly in terms of respiratory and
water loss requisites (Jones et al., 2005). Petal senescence is controlled by growth
factors and hormones, like ethylene, auxin and abscissic acid (Mea et al., 2007; Bai et
al., 2010). In ethylene- sensitive flowers, like orchids, the first response to pollination
encompasses an increase of ethylene production by the stigma often followed by
increased ethylene production in ovaries and petals (Klee and Clark, 2010). The
pollination-induced ethylene in different floral organs is responsible for coordinating
pollination-associated events such as ovary growth and perianth senescence (Llop-
Tous et al., 2000). In carnation and Phalaenopsis orchid spp., genes encoding ACC
oxidase and ACC synthase are responsible for the post-pollination ethylene burst that
induces petal senescence (Porat et al., 1994; Tang et al., 1994; Nadeau and O’Neill,
1995; Woltering et al., 1995). Ethylene-inducible transcripts from petals including mRNAs
with homology to glutathione S transferase (Itzhaki et al., 1994), phosphoenolpyruvate
mutase (Wang et al., 1993) and cysteine proteinase were also identified (Jones et al.,
2005). Previous results on orchid flowers revealed low activity of ethylene biosynthetic
enzymes in labellum, with a peak at 12h after pollination (Bui and O’Neill, 1998).
Induction of cysteine proteinases during leaf (De Michele et al., 2009) and flower
(Xu and Hanson, 2000) senescence have been considered as an outcome of the PCD
event. According to their catalytic mechanisms, proteases are classified into serine
(Ser), cysteine (Cys), aspartic, and metallo proteases (van der Hoorn et al., 2004). Cys
proteases (EC 3.4.22) respond to a variety of stimuli and may be involved in protein
maturation, degradation and rebuilt. They also function as a housekeeping to remove

Chapter 2- Labellum transcriptome after pollination
104
misfolded proteins (Grudkowska and Zagdańska, 2004). Proteolysis by cysteine
proteases is a highly regulated process. Cysteine proteases include different families
such as: calpains, caspases and papain-type proteinases. The papain-type cysteine
proteases (e.g. triticain α, β and γ) are the most thoroughly investigated group among
cysteine proteases, mainly in Brassica oleracea (Eason et al., 2005) and barley (Kiyosaki
et al., 2009 and references therein). Aspartic proteases have been involved on protein
processing and/or degradation in different plant organs, in plant senescence, stress
responses, programmed cell death and sexual reproduction (Simões and Faro, 2004).
An aspartic protease functioning as anti-cell-death component was identified in
Arabiodopsis, revealing a putative involvement on enhancing PCD event (Ge et al.,
2005). Down regulation of a transcript coding for an aspartic proteinases in O. fusca
labellum at 4DAP may be related to a function as an anti-cell death component that
was inhibited after pollination, and as result, PCD and, consequently, senescence has
been enhanced. A role on O. fusca stress response cannot be discarded, since the
plants under study were originated from natural populations possibly challenged by
pathogens and other biotic and/or abiotic agents. Up regulation of a different set of
cysteine proteases in O.fusca at 2DAP, and mostly at 4DAP, reveals that pollination
triggers proteolytic activity. Since the flower is essential for sexual reproduction success,
its lifespan is closely related to pollination which ultimately triggers floral death by
proteolysis activation.
In O. fusca microarray, up regulation of a transcript coding for a tropinone
reductase-14 at 4DAP was detected. Tropinone reductase-like (TRL) enzymes may have
an array of putative functions (reviewed in Dräger, 2006). TRL enzymes, which are short-
chain dehydrogenases, act on alkaloid biosynthesis in Solanaceae. In Arabidopsis
thaliana as well as in other Brassicaceae, these enzymes may have yet unknown
functions, since tropane alkaloids have been detected neither in Arabidopsis thaliana
nor in other species studied (Sato et al., 2001; Oksman-Caldentey et al., 2007). since
TRL-14 has been shown to be a SAG13 homolog, one of the best markers of senescence
before beginning of wilting in Arabidopsis (Miller et al., 1999) and on grapevine
(Espinoza et al., 2007). As a result, TRL-14 may be associated with senescence event, as
supported earlier on leaf senescence studies (Miller et al., 1999; Espinoza et al., 2007).
Down regulation of a transcript coding for an Hypersenescence (HYS) 1 protein
was detected in O. fusca labellum at 2DAP. Studies on Arabidopsis (Aki et al., 2007)
suggest that HYS1 plays a role in sugar signalling and defense response, thereby
controlling growth and development. Also, HYS1 was recognized as playing a role in
inhibiting leaf senescence and pathogen-defense responses (Yoshida et al., 2002b).
Down regulation of this gene in O. fusca labellum at 2DAP may suggest an important

Chapter 2- Labellum transcriptome after pollination
105
role in flower senescence signalling, by acting as a putative senescence initiation
signal.
Up regulation of two transcripts coding for ribonucleases (RNases) was detected
2 and 4 days after pollination. RNases are RNA-degrading enzymes associated with
different physiological processes such as senescence and phosphate remobilization
(Ma and Oliveira, 2000 and references therein) and responses to environmental stresses
(Chen and Deutcher, 2005). Plant RNases family is divided in S-like RNases and S-RNases,
being the second specifically involved in self-incompatibility control (Bariola et al.,
1999). S-like RNase genes constitute the major family of RNA-degrading enzymes in
plants (Green, 1994). In contrast to the S-RNase genes, which expression is generally
restricted to the style, S-like RNase genes are often related to several physiological
processes including phosphate starvation, senescence, wounding, cell death pathway,
defense against pathogens and the light signalling pathway induced in other organs
(Taylor et al., 1993, Liang et al., 2002, Lers et al., 2006). The activation of two RNase PD2
transcripts at both 2DAP and 4DAP suggests that RNA degradation is occurring early
after pollination, as a consequence of the pollination enhanced-senescence. The
RNase PD2 belongs to a class of S-like RNases family (Ma and Oliveira, 2000), and RNase
activity has been shown to increase during petal senescence (Panavas et al., 2000; Xu
and Hanson, 2000). Roles have been addressed to RNase PD2 on phosphate (Pi)
mobilization (Hu et al., 2011) and removal of RNA from the dying cells (Lers et al., 1998).
2.4.2.2.2.2. Cell enlargement
Expansins are important regulators of wall extension during plant cell growth
(reviewed in Sampedro and Cosgrove, 2005) being involved in cell wall loosening and
extension with possible roles in fruit ripening (Civello et al., 1999) and in softening of the
maternal tissues for faster pollen tube penetration during pollination (Cosgrove, 1998).
Expansins have been associated to wall loosening in maternal tissues in order to assist
rapid penetration of pollen tubes, rather than stimulating pollen tube growth itself
(Sanchez et al., 2004; Yoshida et al., 2005). Expansins are pH-dependent wall-loosening
proteins frequently associated with the acid growth hypothesis, which refers to the
ability of plant cells and/or cell walls to elongate or expand quickly at acidic pH
(reviewed in Rayle and Cleland, 1992). Auxin pumps protons out of the cell decreasing
apoplastic pH, and thus activating expansins activity (Rayle and Cleland, 1992). Several
roles have been suggested for auxin in the pollination process (Sundberg and
Østergaard, 2009). Ethylene and auxin are known to play key roles in regulating the
biochemical and anatomical changes in orchid’s post pollination phenomena and
flower senescence mediation (Zang and O’Neill, 1993; Attri et al., 2008). Thus it is

Chapter 2- Labellum transcriptome after pollination
106
possible that these two hormones are active during postpollination events. Up
regulation of transcripts coding for expansins in O. fusca at 4DAP may be a
consequence of auxin action inducing a post pollination phenomenon, which is critical
for ovary maturation and growth in orchids (Ketsa et al., 2006). This hypothesis is
supported by studies performed in Dendrobium and other orchids, according which
ovule development is triggered by pollination and ovary growth starts within two days
after pollination (Ketsa et al., 2006), a timeline rather unique comparing to the majority
of flowering plants in which the ovules are mature and the egg cells are ready to be
fertilized at anthesis (Yu and Goh, 2001). Since transcripts coding for auxin- responsive
genes (Jain and Khurana, 2009) were not detected in Ophrys fusca pollination
microarray, auxin action can be suggested only based on assumptions of their role in
mediating post pollination phenomena in orchids proposed by other authors.
2.4.2.2.3. Cell rescue, defense and virulence
Microarray studies and analyses of individual genes have revealed a set of
genes up regulated during petal senescence generally assumed to be stress related
(van Doorn et al., 2003; Wagstaff et al., 2010). Those include metallothioneins, abscisic
acid (ABA)-responsive genes (Breeze et al., 2004) as well as glutathione S-transferases
genes (Meyer et al., 1991; Price et al., 2008). A significant number of up regulated
senescence genes are also pathogenesis related (Hanfrey et al., 1996; Thomas et al.,
2003). Previous authors reported that senescence of Iris petals is accompanied by the
induction of a considerable number of putative defense-related genes (van Doorn et
al., 2003). Regarding Ophrys fusca pollination, up regulation of defense-related genes
may be related with flower senescence, as proposed in leaf senescence (Bhalerao et
al., 2003; Hoeberichts et al., 2007). Pathogenesis- related (PR) proteins are usually induced by pathogens and
abiotic stresses (Xie et al., 2010). Unlike most other PR proteins with an extracellular
destination, PR10 proteins, typically intracellular and small (16-18 kDa), are slightly acidic
and resistant to proteases (Liu and Ekramoddoullah, 2006; Xie et al., 2010). Up
regulation of a transcript coding for PR10 protein was detected at 2DAP and 4DAP.
Also, previous studies found PR10 mRNA expression in senescing soybean (Crowell et al.
1992) and Betula pendula (Valjakka et al., 1999) leaves. It has been described that PR
genes are also co-expressed with cyclophilins (Godoy et al., 2000; Kong et al., 2001). In
fact, up regulation of a transcript coding for a cytosolic cyclophilin was detected in O.
fusca at 4DAP. Cyclophilins (Cyps) are ubiquitous proteins originally identified as
intracellular targets for the immunosuppressant cyclosporin A (CsA) (Kiełbowicz-Matuk
et al., 2007). Plant CyPs are supposed to play essential roles in protein

Chapter 2- Labellum transcriptome after pollination
107
maturation/trafficking and in the processing of nucleic acids (Kiełbowicz-Matuk et al.,
2007). In flowers, high levels of cytosolic cyclophilins transcripts have been reported
(Chou and Gasser, 1997). Up regulation of a cytosolic cyclophilin in O. fusca labellum at
4 DAP suggest a potential role in PCD machinery, since cyclophilins are known to
display endonuclease activity, responsible for supercoiled DNA degradation and,
ultimately, PCD (Montague et al., 1997; Kong et al., 2001).
Two different Abscicic Stress Ripening (ASR) genes were regulated by
pollination: ASR down regulated at 4DAP and ASR1 up regulated at 2DAP. ASRs are
transcription factors whose likely targets are hexose transporters and abscicic acid
(ABA) responsive genes (Frankel et al., 2006). Since ASR transcripts accumulate
following stress conditions, their expression suggests a downstream action of a common
signal transduction pathway involved in responses triggered by different abiotic stresses
(Carrari et al., 2004). The ASR gene family includes ASR1, ASR2, ASR3, and ASR4. ASR1,
ASR3, and ASR4 are induced by dehydration, ABA, and cold stresses, whereas ASR2 is
ABA-independent and is specifically induced by dehydration (Dóczi et al., 2005). As a
result, up regulation of an ASR1 at 2DAP may be related to petal dehydration. Recent
studies have shown an early senescence induction of a petunia ASR4 gene expression
at 2DAP (Bai et al., 2010), which is in accordance with our results. Putative function
attributed to PhASR4 supports a potential role in senescence signaling, whether by
petal dehydration or increased ABA levels. Regarding, down regulation at 4DAP of a
transcript coding for an ASR could be related to one of the signaling pathways of ABA
during adaptation of plants to drought (Frankel et al., 2003, 2006). Since O. fusca labella
were harvest from plants occurring in the wild, it is not surprising to found transcripts
related to stresses imposed by the natural habitat environment (i.e. drought stress).
However, measurements of ABA levels during Ophrys fusca petal senescence were not
performed.
Plant chitinases (EC 3.2.1.14) belong to a relatively large gene family divided in
classes according to specific functions (Passarinho and de Vries, 2002; Kasprzewska,
2003). The fungicide mode of action of chitinases consists on degradation of fungal cell
walls by cleaving the β-(1,4)-glycoside bonds of chitin, the major component of fungal
cell walls (Takakura et al., 2000). The specificity of some chitinase genes suggests that
they could also play a role in developmental processes such as pollination (Wagner et
al., 2007), senescence, seed germination (Santos et al., 2004) root and root nodule
development (Kim and An, 2002) and somatic embryogenesis (Passarinho and de Vries,
2002). Chitinases content increased during parsley leaf senescence (Lers et al., 1998).
Also during Brassica napus leaf senescence (Hanfrey et al., 1996), increased expression
of a PR1 protein and a chitinase was detected but it is not clear whether these proteins
have a specific function in senescence or whether they are present to protect the

Chapter 2- Labellum transcriptome after pollination
108
senescing leaf from opportunistic pathogen attack (Buchanan-Wollaston and
Ainsworth, 1997). Down regulation of a chitinase in O. fusca labellum at 4DAP may
suggest a putative role of this protein in flower development, as previously
demonstrated in tobacco (Neale et al., 1990) and rice (Takakura et al., 2000) healthy
flowers in which accumulation of chitinase was not related to pathogenesis response.
According to Neale et al. (1990), chitinase mRNA levels increase in most floral parts
along flowers maturation. Down regulation at 2DAP and up regulation at 4DAP of a
transcript coding for a class III chitinase in O. fusca may suggests that its expression was
promoted as part of a generalized defense-related response, not directely related to
pollination enhanced-mechanisms.
Up regulation at 2DAP of a transcript coding for a non specific lipid transfer
protein (LTP) was found. Roles in plant–pathogen interactions and/or pollen tube
growth regulation have been proposed for LTPs (Lan et al., 2004). Lipid transfer proteins
are responsible for shuttling phospholipids and other fatty acid groups between cell
membranes (Choi et al., 2008). Other roles proposed for plant LTPs include participation
in cutin biosynthesis, antimicrobial activity, symbiosis, embryogenesis and adaptation to
different stresses (reviewed in Kader, 1996). Up regulation in O.fusca of a transcript
coding for a LTP at 2DAP, in combination with up regulated transcripts coding for PR-
10c (see table 2.6), may be related to a defense response for protecting senescing
petal from pathogen attack. This hypothesis is supported by previous studies on
pollination/fertilization, according which up regulated genes such as LTP were related
to defense responses (Lan et al., 2004, 2005).
Such as for leaf senescence, during petal senescence free radicals/metal ions
are often released causing oxidative stress. As a result, a membrane/protein
breakdown occurs (Buchanan-Wollaston, 1994; Hanfrey et al., 1996). During metal
release, plants engage detoxification actions thereby reducing the risk of metal toxicity
to the cells of surrounding tissues (Navabpour et al., 2003; Breeze et al., 2004). These
degenerative processes often result on increased production of reactive oxygen
species (ROS) and the plant responds by enhancing senescence-non-enzymatic
antioxidants production such as ascorbate and glutathione, as well as enzymatic
antioxidants such as catalase, superoxide dismutase and ascorbate peroxidase
(Navabpour et al., 2003). ROS may function as a general signal that induces the
expression of a set of genes involved in detoxification during senescence.
Environmental pollution with heavy metals also requires mechanisms of metal
homeostasis and detoxification by the plant (Heise et al., 2007). Metals like Zn, Fe, and
Cu, which are essential in trace amounts, and nonessential metals such as Pb, Al, and
Cd, which are not required for plant cell functions, are considered toxic in low
quantities. Metallothioneins are the most important metal binding factors in plant metal

Chapter 2- Labellum transcriptome after pollination
109
homeostasis and detoxification. Metallothioneins (MTs) are metal binding proteins, low
molecular weight and cysteine-rich polypeptides encoded by a gene family (Cobbett
and Goldsbrough, 2002). Specific functions in plant development, in specific tissues
(e.g. developing seeds) and in stress response have been assigned to MTs (Zhou et al.,
2005). Expression of MT genes has been shown to be induced in senescing leaves (Guo
et al., 2003) and petals (Breeze et al., 2004), in ripening fruits (Moyle et al., 2005) and in
tapetum cells during microsporogenesis (Charbonnel-Campaa et al., 2000). Gene
expression in Ophrys fusca pollination revealed nine and seven sequences, matching to
metallothioneins type 2 and type 3, respectively. Down regulation of transcripts coding
for metallothioneins type 3 at 2DAP was detected, whereas at 4DAP up regulation of
both metallothioneins type 2 and 3 was observed. High number of metallothioneins was
also encountered in microarray studies performed in Astroemeria petal senescence
(Breeze et al., 2004). Down regulation of transcripts coding for metallothioneins type 3
at 2DAP suggests that soon after pollination metal homeostasis is not required for plant
development. On the other hand, up regulation of a diverse array of ESTs with
homology for metallothioneins (type 2 and 3) at 4DAP, may indicate a function in
sequestering metal ions to prevent increase in ROS levels during senescence (Reddy et
al., 2002; van Doorn and Woltering, 2008; Wagstaff et al., 2010).
Genes associated with floral senescence, mainly those involved in ethylene
biosynthesis and also expression of glutathione S‑transferase (GST) genes, have been
isolated (Meyer et al., 1991; Tripathi and Tuteja, 2007). GSTs display key roles in defense
or in cellular protection producing proteins as a response to pathogen attack,
wounding, senescence and lipid peroxidation resulting from these processes
(Rubinstein, 2000). Studies in carnation petals demonstrated that ethylene-regulated
GST1 and GST2 genes were expressed during senescence (Marrs, 1996). Since
senescence promotes lipoxygenase mediated membrane disruption, a putative
function of glutathione S-transferase in detoxification of lipid has been addressed
(Meyer et al., 1991; Marrs, 1996). As a result, glutathione S-transferase expression has
been attributed as a result from the detoxification of lipid resulting from the
senescence-induced oxidative processes (O’Neill, 1997; Rubinstein, 2000). Up regulation
of two transcripts coding for glutathione S- transferase at 2DAP and 4DAP is in
accordance with previous studies in petal senescence in carnation (Meyer et al., 1991)
and wallflower (Price et al., 2008). GST gene expression may have a putative role in
detoxification of lipid (co-expression of a transcript related to the breakdown of fatty
acids, see Lipid metabolism) (Itzhaki et al., 1994; Rubinstein, 2000; Chakrabarty et al.,
2009). Thus, up regulation of GST at 2DAP and 4DAP may be related to prevention of
cell integrity in the sequence of lipid peroxidation occurring during senescence. PCD is

Chapter 2- Labellum transcriptome after pollination
110
a controlled process in which cell integrity is central for nutrient remobilization, until
ultimate cell death (Mea et al., 2007).
Up regulation at 4DAP of a stress-related gene, with homology for a LEA (Late
Embryogenesis Abundant) 5 protein was found. LEA proteins were first discovered in the
cotton plant Gossypium hirsutum and originally described as being expressed during
later stages of embryo development (post abscission) in plant seeds (Galau et al.,
1986). Also, LEA proteins are known to be a large number family with different functions
addressed, yet they have been generally considered as stress-related proteins
(Tunnacliffe and Wise, 2007). Since LEA proteins are involved in desiccation resistance, a
variety of mechanisms for achieving this end have been proposed including protecting
cellular structures from the effects of water loss by retention of water, sequestration of
ions, direct protection of other proteins or membranes, or renaturation of unfolded
proteins (Wise, 2003 and references therein). Specifically, Lea5 gene was postulated as
being involved in both stress and hormone responses, and studies have shown to be
transcriptionally regulated during fruit ripening (Jeon et al., 2006; Tao et al., 2006). Up
regulation at 4DAP of a LEA5 protein may be related to a stress response triggered by
pollination induced-senescence.
A transcript coding for a MtN19 protein was detected as being up regulated at
4DAP. MtN19 was originally identified as a gene up regulated in 4-day-old nodules of
Medicago truncatula, and referred to as a nodulin gene (Gamas et al., 1996). It has
been demonstrated that MtN19 gene expression is influenced by nodulation (Gamas et
al., 1996), senescence (Breeze et al., 2004), light and drought stresses (Kimura et al.,
2003), and nitric oxide (NO) (Huang et al., 2002). However, no specific function has
been assigned to this protein. It is noteworthy that the above processes comprise a
common feature, the production of reactive oxygen species. Expression of pathogen-
related genes may be activated as a result of ROS accumulation that enhances a
defense response (Huang et al., 2002). Treatment of pea pots with the insect elicitor
Bruchin B also induces MtN19 expression, which may elicit a defense response (Doss,
2005). High light intensities increase endogenous levels of ROS due to leakage of
electrons from the overloaded photosynthetic machinery (Kimura et al., 2003). Finally,
senescence elicits lipids and proteins degradation thus contributing to oxidative stress
(Navabpour et al., 2003). In O. fusca labella, up regulation at 4DAP of a transcript
coding for MtN19 may be associated to oxidative stress, as a result of lipid and protein
degradation that generate ROS which, in turn, is an outcome of the senescence
process.
In our microarray, high number of stress- and pathogen-related genes up
regulated (i.e. gluthatione S-transferase, MtN19-like protein, cyclophilin,
metallothioneins types 2 and 3, antimicrobial snakins proteins, late embryogenesis

Chapter 2- Labellum transcriptome after pollination
111
abundant Lea5, chitinase, lipid transfer proteins (LTPs), and PR10c protein) were found.
In senescence studies, it has been hypothesized that these genes may protect tissues
(e.g. ovule, ovary, pollen tube development) from pathogen attack (Lan et al., 2004,
2005) or from the damaging effects of ROS accumulation, to allow degradation of
cellular constituents and remobilization of nutrients (Buchanan-Wollaston et al., 2005).
Transcripts related to both stress- and defense-responses identified in our microarray
analysis are in accordance with previous studies on petal senescence (Thomas et al.,
2003; van Doorn et al., 2003; Breeze et al., 2004; Hoeberichts et al., 2007; Price et al.,
2008; Wagstaff et al., 2010).
2.4.2.2.4. Transcription factors and regulation of transcription
Transcription factors (TFs) are DNA-binding proteins that regulate gene
expression at the mRNA transcription level. Many transcription factors families have
been identified. Arabidopsis genome revealed 29 transcription factor’s classes, 16 of
which appear to be unique to plants (Riechmann et al., 2000; The Arabidopsis Genome
Initiative, 2000).
Two transcripts coding for different RNA- binding proteins were down regulated
at 2DAP: RNA- binding protein and a Nucleic acid binding NABP protein. RNA binding
proteins can regulate basic cellular processes like synthesis, transport, translation and
degradation of mRNAs (Fedoroff, 2002). The regulation of gene expression during
development is achieved through transcriptional regulation and post transcriptional
control of RNAs, which in turn is ruled by RNA-binding proteins (RBPs) (Lorković, 2009).
These interactions are important in mediating mRNA maturation events such as splicing,
capping, polyadenylation and export from the nucleus. RNA-binding proteins also
contribute to post transcriptional regulatory events in the cytoplasm, such as mRNA
localization, stability and decay, as well as translation (Tam et al., 2010). One group of
RNA-binding proteins that are important regulators of cytoplasmic post transcriptional
control is the PUF protein family (Goldstrohm et al., 2006). NABP is a motif characteristic
of the Puf family of RBPs (Goldstrohm et al., 2006; Tam et al., 2010), with roles addressed
in cell growth, division, differentiation and development (Wickens et al., 2002). PUFs
bind to 3′ untranslated regions of mRNAs repress their expression and, in many cases,
promote shortening of poly(A) tails (deadenylation) (reviewed in Wickens et al., 2002;
Traven et al., 2010). Puf proteins can regulate the stability or translation of their target
mRNAs in response to environmental stimuli in a rapid and coordinated manner. In O.
fusca, down regulation of two different RBPs, RNA- binding protein and a putative Puf
(Pumilio) protein, at 2DAP suggests that regulation of the basic cellular processes in
mRNAs have been compromised by pollination. This hypothesis is coherent with the up
Chapter 2- Labellum transcriptome after pollination
112
regulation of S-like RNAses at 2DAP and 4DAP (see Cell Fate). Our data on Ophrys fusca
pollination suggest that at 2DAP, transcriptional regulation and post transcriptional
control of RNAs are soon deactivated via down regulation of RNA binding proteins, and
up regulation of S-like RNases (major family of RNA-degrading enzymes) at both 2DAP
and 4DAP, reveal that RNA degradation is activated to ensure removal of RNA from the
dying cells and to allow Pi remobilization.
Light has two pivotal roles in regulating flowering time: (1) enhancing the
circadian clock and (2) interacting with an output from the clock preventing or
inducing flowering process (Thomas, 2006). Daylength is an important regulator of
flowering time, allowing sexual reproduction to occur at an appropriate time, ensuing
cross-pollination and, consequently, fertilization. Circadian clock involves the
recognition of light and darkness cycles by means of multiple photoreceptor proteins,
phytochromes (phy) and cryptochromes (cry). The phy family absorbs in the red region
of the spectrum, whereas the cry family absorbs in the blue region (Devlin and Kay,
2000). Both photoreceptors mediate light input to the clock regulation mechanism. In
Arabidopsis, at least four of the five phytochromes (PHYA, B, D, and E) and both
cryptochromes (CRY1,2) contribute to clock regulation (Thomas, 2006 and references
therein). Phytochrome regulates a range of developmental processes in response to
red and far-red light, including seedling establishment, shade avoidance and transition
to flowering (Somers et al., 1998). In Arabidopsis, forward and reverse genetic studies
identified ZEITLUPE (ZTL), FLAVIN-BINDING KELCH REPEAT F-BOX1 (FKF1) and LOV, KELCH
PROTEIN2 (LKP2) as contributors to the period of circadian oscillation (Baudry et al., 2010
and references therein). They share a unique combination of motifs: PAS/LOV domain,
an F-box domain and six kelch repeats (Yanovsky and Kay, 2001). In Arabidopsis, ZTL
family of F-box proteins is involved in the turnover of clock and flowering time proteins
(Chae et al., 2008). This ZTL family of F-box proteins that also includes FKF1, a protein
involved in the regulation of flowering time (Nelson et al., 2000; Imaizumi et al., 2003,
2005), contains a LOV/PAS domain that mediates blue light dependent protein-protein
interactions. Although not yet demonstrated, FKF1 might act as blue-light receptor
(Mizoguchi and Coupland, 2000). Nelson and co-workers (2000) and, more recently,
Baudry and co-workers (2010) determined that the FKF1 mRNA abundance is circadian
clock regulated, namely diurnally. FLAVIN-BINDING KELCH REPEAT F-BOX1 mediates the
cyclic degradation of CYCLING DOF FACTOR1 (CDF1), a Dof transcription factor
involved in repression of the flowering-time gene CONSTANS (CO) (Imaizumi et al., 2003,
2005). Genetic models showed that the clock acts to establish the rhythm of the CO
gene expression, which is regulated by FKF1 and GIGANTEA (GI) in Arabidopsis (Sawa et
al., 2007). Down regulation in O. fusca at 4DAP of a transcript coding for FKF1 reveals for
the first time, a regulation mechanism in orchid flowering time by means of FKF1-

Chapter 2- Labellum transcriptome after pollination
113
mediated cyclic degradation of the CO repressor CDF1, as described for Arabidopsis
(Sawa et al., 2007). Although floral development and the acquisition of floral traits have
been extensively characterized in model species, they have yet to be deciphered in
orchids, which flowers are complex and differ markedly from those of the other plant
families (Park et al., 2010).
A transcription factor which contains a DNA binding domain referred as
SQUAMOSA promoter binding protein (SBP) domain was down regulated in Ophrys
fusca labella 2 and 4 days after pollination. SBP proteins are encoded by the SBP-box
genes, a feature characteristic of the Arabidopsis SQUAMOSA promoter binding
protein- like (SPL) gene family (reviewed in Cardon et al., 1999; Wang et al., 2009). SBP-
box genes have been identified in a wide variety of plants, e.g. 16 genes in Arabidopsis
(SPL1 to SPL16) (Wang et al., 2009) and 19 in rice (Yang et al., 2008). SBP-domain
proteins were first isolated from Antirrhinum majus by their capacity to interact in vitro
with a promoter sequence element of the floral meristem identity gene SQUAMOSA,
the Antirrhinum ortholog of the Arabidopsis gene APETALA1(AP1) (Klein et al., 1996;
Wang et al., 2009). The ABC model of flower development shows how the presence or
absence of different classes of transcription factors in the different parts of the flower
regulates the development of floral organs (Schwarz-Sommer et al., 1990; Coen and
Meyerowitz, 1991). One of the floral organ identity genes, APETALA1 (AP1) together with
APETALA2 (AP2), APETALA3 (AP3), PISTILLATA (PI), AGAMOUS (AG), several AGAMOUS-
LIKE (AGL) genes and SEPALLATA1, 2, 3, 4, are specific for the development of petals,
sepals, stamens and pistils (Thiruvengadam and Yang, 2009). Functions of SBP-box
genes are largely unknown, but they are predicted to act as transcriptional regulators
based on the presence of plant-specific putative DNA binding domains (Stone et al.,
2005). For instance, SPL1 and SPL2 genes from Antirrhinum interact with a promoter
sequence element of the floral meristem SQUAMOSA (SQUA) (Cardon et al., 1999).
Arabidopsis SPL family can be divided into subfamilies, based on genomic organization
and sequence similarities. SPL1, SPL7, SPL12, SPL14 and SPL16 form one subfamily
representing the largest members of the gene family (Stone et al., 2005; Zhang, 2005).
They are characterized by their constitutive expression throughout plant development,
namely during flower development (Cardon et al., 1999; Birkenbihl et al., 2005). In O.
fusca, down regulation of a transcript coding for a SBP-domain at 2DAP and 4DAP,
suggest a putative function in flower development, rather than in pollination event and
in senescence related process. However, other putative function may not be
discarded, since several SPL proteins have been related to plant development in
general (Ruokolainen et al., 2010). Further studies are advised to entangle SPL putative
function in orchid flower development, namely in Ophrys fusca labellum.

Chapter 2- Labellum transcriptome after pollination
114
Also, up regulation of a NAM-like protein in O. fusca was found. The genes NO
APICAL MERISTEM (NAM) in Petunia hybrida and CUP-SHAPED COTYLEDON (CUC) 1-3 in
Arabidopsis thaliana are highly homologous, and members of the NAC family of plant-
specific transcription factors (Souer et al., 1996; Ishida et al., 2000; Olsen et al., 2005). In
Arabidopsis, 105 NAC genes have been identified. Some of them have been shown to
play diverse roles during embryonic, floral and vegetative development (Souer et al.,
1996; Aida et al., 1997; Mao et al., 2007), involvement in auxin and abscisic acid signal
transduction (Xie et al., 2000; Aida et al., 2002) and also in plant responses to biotic and
abiotic stresses (Olsen et al., 2005; Zhong et al., 2006). Members of the NAC
transcription-factor family are required for establishing boundaries between lateral
organ primordia resulting on organ separation (Kikuchi et al., 2000; Krizek and Fletcher,
2005). Inactivation of petunia NO APICAL MERISTEM (NAM), A. thaliana CUC1 and
CUC2 and of A. majus CUPULIFORMIS (CUP) results in fusion of cotyledons, leaves
and/or floral organs (Souer et al., 1996; Aida et al., 1997). CUC2 has high homology with
petunia (Petunia hybrida) NAM gene which is required for floral organ development,
ovule development, cotyledon separation and embryonic SHOOT APICAL MERISTEM
(SAM) formation (Souer et al., 1996; Aida et al., 1997, 1999; Hibara et al., 2006). In
Arabidopsis thaliana, CUC2 mRNA was detected in bud and flower and its expression
pattern addresses involvement in organ separation in shoot and floral meristems (Ishida
et al., 2000) and also in the establishment of the SAM as well as in correct positioning of
the cotyledons in maize (Zimmermann and Werr, 2005) and Arabidopsis (Nardmann
and Werr, 2007). Previous studies in Arabidopsis, point out that CUC2, together with
CUC1, are required for ovule development (Ishida et al., 2000; Skinner et al., 2004) and
both genes have shown to be controlled posttranscriptionally by miR164 (Larue et al.,
2009). Further the requirement of NAM and CUC for ovule development has been
described (Ishida et al., 2000; Skinner et al., 2004; Vialette-Guiraud et al., 2011). Up
regulation of a NAM-like protein in O. fusca at 2 DAP may, thus, be related with a
putative role on ovule development triggered by pollination, as in most orchid species
the ovule development is accomplished only after pollination (Zhang and O'Neill, 1993;
Nadeau et al., 1996; Yu and Goh, 2001). It is of major interest to fully understand the
putative function of this transcription factor in the orchid ovule developmental
program.
2.4.2.2.5. Protein synthesis
Protein synthesis (or translation) is accomplished in the cytoplasm by ribosomes
that translate the information from mRNA to proteins. Eukaryote ribosomes are
composed of two subunits, each one consisting of ribosomal RNA (rRNA): the small

Chapter 2- Labellum transcriptome after pollination
115
subunit 40S has one molecule of 18S rRNA and 33 proteins, and the larger subunit 60S
contains three types of rRNA (5.5S, 5.8S and 28S) and 49 proteins (Preiss and Hentze,
2003; Rabl et al., 2011). The ribosomal proteins are named in accordance with the
subunit of the ribosome which they belong to - the small (S1 to S33) and the large (L1 to
L49). Usually they decorate the rRNA cores of the subunits (Preiss and Hentze, 2003). Up
regulation at 4DAP of a transcript coding for a putative ribosomal protein L17, with a
key role in protein synthesis (Gao et al., 1993; Meng et al., 2010), may indicate that
translation has been activated with pollination. The dynamic process of mRNA
translation is usually divided into three phases: initiation, elongation and termination
(Browning, 2004). In eukaryote mRNAs, translation is initiated in cytoplasm and the
translation process being accomplished with the RNA 3’ poly(A) tail. Gene expression
data on O. fusca labellum upon pollination here presented revealed a transcript
coding for a translation initiation factor, which is necessary for accurate initiator codon
recognition (Fletcher et al., 1999). Up regulation of genes related to protein synthesis at
4DAP may suggest that pollination induced protein synthesis through activation of the
translation process. Recent studies in petal senescence point out to a requirement of
de novo protein synthesis in the timely initiation and progression of a senescence
program (van Doorn and Woltering, 2008; Bai et al., 2010). Therefore, it is not surprising
the up regulation of genes involved in protein synthesis after pollination. Since PCD
programming seems to be fully recognized within 4 days after pollination, it was
expected to find genes related to enhancement of protein translation. Recent
proteomic studies on petal senescence in petunia pointed out to a 64 % increase in
abundance of differentially regulated proteins (Bai et al., 2010).
2.4.2.2.6. Biogenesis of cellular components
In Arabidopsis, about ten actin (ACT) genes are widely distributed in the
genome with different functions attributed. For example, actins ACT2, ACT8, ACT7 are
considered to be vegetative, whereas ACT11, ACT1, ACT3, ACT4, and ACT12 are
believed to be reproductive (reviewed in McKinney and Meagher, 1998).
Reorganization of the actin cytoskeleton in eukaryotic cells is regulated by a variety of
actin binding proteins that modulate the behaviour of both filamentous (F-actin) and
globular actin (G-actin) (Gibbon et al., 1998). Profilin is a G-actin binding protein (Witke,
2004). The function of these actin-binding proteins may be controlled by numerous
signals, including calcium, phosphoinositides, pH or reversible phosphorylation (Winder
and Ayscough, 2005). Actin-binding proteins display several functions, namely
regulation of filament assembly and disassembly (e.g. profilin, thymosin 4, ADF/cofilin,
gelsolin, capping protein), de novo nucleation of actin filaments (e.g. ARP2/3, WASP),

Chapter 2- Labellum transcriptome after pollination
116
regulation of actin polymerization and interactions among actin filaments (Winder and
Ayscough, 2005). In pollen, one of the most abundant actin-binding proteins, profilin, is
known to regulate microfilament formation and a significant role in regulating the
dynamics of the actin cytoskeleton has been addressed (Gibbon et al., 1998; Hussey et
al., 2002). In maize pollen, at least three profilin isoforms are expressed: ZmPRO1,
ZmPRO2, and ZmPRO3 (Staiger et al., 1993). Up regulation of a transcript coding for a
profilin at 4DAP suggests a putative function during pollen germination, namely in
rearrangement of actin cytoskeleton, revealed by downregulation of ATC2 gene at
2DAP. This hypothesis is supported by studies in Lilium longiflorum, according which
profilin increase was detected during pollen germination, its expression being
associated with actin rearrangement (Miki-Hirosige et al., 2004).
Pectin represents about 30% of polysaccharides of the cell wall in
dicotyledonous plants (Caffall and Mohnen, 2009). Monocots and dicots are
significantly different with respect to pectin composition and distribution. In monocots,
pectin and pectate represent only a small fraction of the cell wall components (1- 6 %),
the relatively small amount of pectin being tightly bound to the cell wall. In dicots,
pectin is a major cell wall component and exists primarily as a homogenous layer within
the cell wall (Carpita, 1996). Pectin methylesterase (PME) is the first enzyme acting on
pectin, a component of plant cell wall. PME hydrolyze pectin with different structural
and functional properties, having an important role on plant physiology (Giovanea et
al., 2004). PME activity is regulated by specific PME inhibitor (PMEI) protein either by
differential expression or by posttranslational control (Zhang et al., 2010). Up regulation
in O. fusca of a transcript coding for a PMEI at 4DAP suggests that pectin hydrolysis was
inhibited by pollination, probably due to cell wall changes enhanced by senescence
event. Considering that about 50 PMEs are transcribed in flowers (Bosch and Hepler,
2005) and both PMEs and PMEIs are expressed in flower tissues and pollen grains (Di
Matteo et al., 2005), one explanation is that PMEI has a broad inhibitory activity against
PMEs, thus affecting cell wall integrity. These changes reflect directly or indirectly the
biochemical and physical events of wall loosening, expansion, and retightening
(Carpita, 1996). Since cross-pollination induces actin cytoskeleton rearrangements while
self-pollination disrupts actin structure (Iwano et al., 2007), it was expected to identify
transcripts coding for actin and profilin resulting on cytoskeleton rearrangements and
for changes of cell wall integrity (PMEI).
Plant peroxisomes are organelles essential to physiological processes such as
lipid metabolism, photorespiration, hormone biosynthesis and metabolism (Reumann et
al., 2009). The peroxisomal membrane forms a permeability barrier through peroxisomal
membrane proteins (PMPs), which are critical for different functions, namely the import

Chapter 2- Labellum transcriptome after pollination
117
proteins into the organelles (Hettema and Tabak, 2000). Peroxisomes/glyoxysomes6
participate in the fatty acid β-oxidation, since fatty acid chains greater than C22 are
too long to be handled by the mitochondria (reviewed in Poirier et al., 2006). In O.
fusca, down regulation at 4DAP of a transcript coding for a PMP36, may suggest an
inactivation of the peroxisomes membrane proteins synthesis, essential for providing a
permeability barrier for protein transport, thus compromising efficient peroxisome
biogenesis.
2.4.2.2.7. Protein fate
In daylily petal senescence, an involvement of the ubiquitin pathway through
the degradation of proteins was postulated (Courtney et al., 1994). This may entail a
causal role for the ubiquitin-proteasome system (UPS) in petal senescence (Rubinstein,
2000). UPS is part of a wide diversity of functions, namely in regulating different steps of
cell cycle, embryogenesis, senescence, defense, environmental responses and
hormone signaling (Santner and Estelle, 2010). This allows plants to effectively and
efficiently alter their proteasome to ensure developmental plasticity and environmental
adaptation (Dreher and Callis, 2007; Yee and Goring, 2009). The ubiquitination
pathways function as the main proteolytic system in eukaryotes and mediate
posttranslational modifications of cellular proteins commonly targeting them for
degradation by the proteasome (Cho et al., 2008; Craig et al., 2009). Thus, target
proteins are first modified through the articulated actions of E17, E28 and E39 enzymes
and the polyubiquitylated proteins are then degraded by 26S proteasome (reviewed in
Frugis and Chua, 2002; Vierstra, 2003). E3 ubiquitin ligases are of particular interest as
they are responsible for substrate specificity, being categorized accordingly their
mechanism of action and presence of specific domains as RING, HECT, F-box, and U-
box (Yee and Goring, 2009). Plant U-Box (PUB) gene family can be divided in five
subclasses suggesting that they display diverse roles (Azevedo et al., 2001). Based on
the induction of these PUB genes in response to cold, drought and salt treatments, it has
been generalized that these E3 ligases may function as regulators in various abiotic
stress responses (Yee and Goring, 2009). Up regulation of an E3 ligase ATL15 transcript
belonging to the ATL (Arabidopsis tóxicos en levadura) gene family, a conserved group
of RING zinc-finger proteins (Salinas-Mondragon et al., 1999), and down regulation of a
spotted leaf protein with U-BOX domain (PUB), a characteristic domain from E3 ligases
6 Glyoxysomes are specialized peroxisomes found in plants, particularly in the fat storage tissues of germinating seeds. 7 Ubiquitin- activating enzyme. 8 Ubiquitin- conjugating enzyme. 9 Ubiquitin- protein ligase.
Chapter 2- Labellum transcriptome after pollination
118
(Smalle and Viestra, 2004), point out to a role of the ubiquitin–proteasome system (UPS)
in senescence modulation through selective protein degradation. Indeed, ubiquitin
conjugation occurs through enzymatic cascades by the action of E3 ubiquitin ligases
(Yee and Goring, 2009). A role on selective protein degradation by the UPS has been
reported before on petal senescence (Rubinstein, 2000; Hunter et al., 2002; Breeze et
al., 2004; Buchanan-Wollaston et al., 2005; Yamada et al., 2007; Xu et al., 2007a,b;
Hoeberichts et al., 2007; van Doorn and Woltering, 2008; Bai et al., 2010). Detection in
O. fusca pollination of differentially expressed transcripts coding for two distinct E3
ligases (U-BOX and RING-type) suggests that ubiquitin-proteasome system action is
depended of E3-substrate specificity to modulate specific responses. Studies in leaf
senescence demonstrated the importance of the selective protein removal route
mediated by the ubiquitin mediated- proteolysis pathway via 26S proteasome (Yoshida
et al., 2002a).
In addition to UPS mediated process, proteins can also be modulated through
the action of heat shock proteins acting in a myriad of biological process. Plant small
heat shock proteins (sHsps) range in size from 15 to 42 kDa and constitute the most
abundant and diverse group of proteins synthesized as a response to heat stress (Neta-
Sharir et al., 2005). These proteins can be induced by different environmental stresses
such as drought (Maqbool et al., 2005), cold, salinity and in development processes
such as embryogenesis, germination and fruit development (Wang et al., 2004). Heat-
shock proteins (Hsp) are commonly denominated as molecular chaperones and
display important roles in protein–protein interactions (Wang et al., 2004). sHSPs bind to
partially folded or denatured proteins and prevent their aggregation thereby
facilitating folding by other chaperone. Two different transcripts coding for Hsps were
encountered: chaperone up regulated in O. fusca at 2DAP and a small Hsp down
regulated at 4DAP. In Ophrys fusca pollination, down regulation of a sHSP transcript can
be related to stress response as a mean of adaptation and modulation of proteins in
natural habitats (Mahmood et al., 2010). In O.fusca, up regulation of a chaperone at
2DAP suggests a response to a stress either triggered by pollination event or by the
environment itself, as plants were collected from natural populations that face
continuous requirement towards adaptation on their hostile habitat. Among the diverse
group of molecular chaperones, the highly conserved 70 kDa heat shock proteins
(Hsp70s) and their partner J-proteins are the most specialized group of heat shock
protein machinery expressed under abiotic stress conditions (Rajan and D’Silva, 2009).
Most of the functional diversity of the Hsp70s is driven by a diverse class of cofactors, J
proteins, required as accessory factors (Kampinga and Craig, 2010). Hsp70:J-protein
complex is involved in a variety of essential cellular processes including: de novo
protein folding, translocation of polypeptides across cellular membranes and

Chapter 2- Labellum transcriptome after pollination
119
degradation of misfolded proteins (Walsh et al., 2004). Refolding of damaged proteins
after exposure of cells to stress is ensured by this machinery by controlling the activity of
many regulatory proteins. Down regulation in O. fusca of a transcript coding for DNA J
protein at 4DAP suggests that cell homeostasis is not being maintained after pollination.
Whenever successful pollination is achieved, the flower as a reproductive organ has
fulfilled its role in plant survival by ensuing offspring and the processes required for
maintenance of such an energy-consuming organ are nonessential.
Down regulation in O .fusca of a transcript coding for a protein disulfide
isomerase (PDI; EC 5.3.4.1) at 2DAP was detected. PDI has the ability to modulate redox
responses and chaperone proteins (Ondzighi et al., 2008). PDI is an essential protein for
formation, reduction or isomerization of protein disulfide bonds in the endoplasmic
reticulum (ER) lumen (Huang et al., 2005). Besides, it catalyzes the formation and
breakage of disulfide bonds between cysteine residues in proteins as they fold (Noiva
et al., 1993). Since protein folding is an error prone process, PDI provides a mechanism
to correct errors in disulfide pairing when they occur (Gilbert, 1997). Disruption of protein
folding causes ER stress and activates signaling cascades, and the unfolded protein
response (UPR) restores folding capacity (Lu and Christopher, 2008). Misfolded proteins
are removed by conjugation to ubiquitin for proteasomal degradation, through the
UPS. Down regulation in Ophrys fusca of a transcript coding for a PDI at 2DAP suggests
that restoration of protein folding capacity is disengaged soon after pollination.
Several transcripts coding for protein phosphatases and a kinase were
differentially regulated in Ophrys fusca pollination. Down regulation was determined for
a casein kinase transcript at 2 DAP and up regulation of several transcripts encoding
protein phosphatases (nucleotide pyrophosphatase/ phosphodiesterase and a purple
acid phosphatase (PAP)) at both 2 DAP and 4 DAP (Table 2.6). Protein phosphorylation,
a posttranslational modification of proteins, is one of the most common ways of protein
function regulation. Phosphorylation is achieved by a protein kinase (PK) that adds a
phosphate group to a substrate, this process being reverse by protein phosphatases
(PPs) that removes the phosphate group (Chevalier and Walker, 2005). Addition or
removal of a phosphate group to or from an enzyme either activates or deactivates
the enzyme (Singh et al., 2010). In most cases, change of the protein form between
phosphorylated and unphosphorylated, represents an active or inactive protein.
Protein kinases can be classified according to their primary sequences and to the
residue being subjected to phosphorylation activity: serine/threonine (ser/thr), histidine
(his) or tyrosine (tyr). Down regulation in O. fusca of a transcript coding for a casein
kinase (CK) at 2DAP was detected. Casein kinases (I or II) are involved in various
biological processes: it phosphorylates different proteins, including transcription factors;
can modulate DNA-binding ability, intracellular localization and protein stability (Ogiso

Chapter 2- Labellum transcriptome after pollination
120
et al., 2010). Recent studies revealed that CK2 has a conserved function as a circadian
clock component in Arabidopsis thaliana (Ogiso et al., 2010). PPs can also be classified
into serine/threonine and tyrosine phosphatases, based on the amino acid residue they
preferentially dephosphorylate. In O. fusca, a transcript coding for a purple acid
phosphatase (PAP) was up regulated at 4DAP (Table 2.6). PAPs are binuclear
metalloenzymes that catalyse the hydrolysis of a wide range of phosphate esters and
anhydrides (Schenk et al., 2000), but functional roles have not been fully addressed.
Phosphatases are responsible for the phosphate (Pi)-hydrolysis from organic
compounds thereby favoring Pi mobilization and translocation from senescent tissues
(Duff et al., 1994; Fang et al., 2009). According to Chapin and Jones (2009), being
phosphorus (P) a growth-limiting nutrient, Pi remobilization from unneeded tissues, like
corolla, will allow the plant to use nucleic acids as P storage molecules. Inhibition of
phosphorylation by kinase (at 2 DAP) and activation of dephosphorylation (2 DAP and
4 DAP) by phosphatases after pollination can be likely related to Pi remobilization from
the labellum to younger and/or actively growing tissues (e.g. ovule, ovary, other flowers
from the same inflorescence), thus allowing Pi recovery by the plant (Chapin and
Jones, 2009).
2.4.2.2.8. Cellular transport, transport facilities and transport routes
During senescence, up regulation of transcripts involved in catabolism for
nutrient remobilization should be expected.
Down regulation, at 2 DAP and 4 DAP, of a transcript coding for purine
permease 3 (ATPUP3) may be associated with cytokinin -mediated delay senescence.
Cytokinins biosynthesis pathway is partially shared with purine metabolism (Hirose et al.,
2008) and translocation of cytokinins is apparently mediated by nucleoside transporters
and purine permeases (PUPs) (Gillissen et al., 2000; Kudo et al., 2010). Up regulation of
cytokinins was shown to delay senescence in both leaf (Gan and Amasino, 1995) and
petal (Chang et al., 2003), while its down regulation was suggested to increase
ethylene sensitivity in unpollinated ethylene-sensitive species during petal senescence
(Lara et al., 2004; Price et al., 2008; van Doorn and Woltering, 2008). In O. fusca PUP3
abundance decreased soon after pollination, thus, the senescence delay mediated by
cytokinins could have been dismantled.
Up regulation at 4DAP of a transcript coding for Adenine nucleotide
translocator (ANT) was found (Table 2.6). This transcript is involved on ADP/ATP
exchange during oxidative phosphorylation and is located at the inner membrane of
the mitochondria (Picault et al., 2004; reviewed in Dahout-Gonzalez et al., 2006). In
animals, apoptotic factors released from the mitochondria are a result of the

Chapter 2- Labellum transcriptome after pollination
121
permeability transition pore (PTP) opening (Kroemer et al., 2007). Activity of the PTP,
usually formed following cellular stress (e.g. changes ATP levels, ROS production), results
on losses of the mitochondrial inner membrane (MIM) potential (∆ψm), activity of pro-
apoptotic proteins, and disruption of the outer membrane, in a process designed as
mitochondrial membrane permeability transition (MPT) (Kroemer et al., 1998; Crompton,
1999; Le Bras et al., 2005; Masuda, 2011). In apoptosis, evidence of MPT as the
committed step is well documented; and similar task has been considered in plants
(Jones, 2000; Tiwari et al., 2002; Reape and McCabe, 2010). PTP is a multicomponent
protein complex which include an adenine nucleotide translocator (ANT) MIM-located,
cyclophilin D (CyP-D) and the voltage-dependent anion channel (VDAC) in the outer
membrane (Le Bras et al., 2005). ANT plays an important role in oxidative
phosphorylation, via the import of ADP and the export of ATP (Laloi, 1999). Recently,
two ANTs proteins have been identified in rice (Taylor et al., 2010), yet no functions have
been addressed. In animals, overexpression of ANT has been shown to be cytotoxic
(Zamora et al., 2004; Jang et al., 2008; Baines and Molketin, 20009) and studies using
ANT inhibitors have pointed out to a putative function of ANT as a link between MPT
and apoptosis (Green and Reed, 1998; Kroemer et al., 1998). Up regulation of this
transcript at 4DAP may be related to an increase in ADP/ATP exchange during
oxidative phosphorylation, which ultimately increase ROS production, a major
consequence of senescence event. A recent study on animals indicated that ANT
mediates cell death, not through the MPT pore, but rather via ROS production (Baines
and Molkentin, 2009). Also, it cannot be discarded an involvement on PTP-forming
protein complex, thereby suggesting a possible role of MTP on petal senescence.
2.4.2.2.9. Cellular communication/signal transduction mechanisms
Signal transduction is a mechanism that converts a mechanical/chemical
stimulus into a specific cellular response. Signal transduction is elicited by a signal at a
receptor, which, in turn, mediates a change in cell function. Cells communicate and
adapt to changes to the physical environment using various signals. The ability of
receptors to transfer signals to the cytosol is achieved by a series of conformation
changes in the receptor itself and the activation of the heterotrimeric G-protein (Neves
et al., 2002). Down regulation in O. fusca of a transcript coding for G- protein β-subunit
at 2DAP was detected. G proteins (guanidine nucleotide-binding proteins) are a family
of proteins involved in chemical signals transmission from the outer cell, through G
protein-coupled receptors which pass through the cell membrane for signal
amplification (Jones and Assmann, 2004). G proteins belong to a large family of
proteins, the GTPases. Roles in regulating ions channels, enzymes transport, as well as

Chapter 2- Labellum transcriptome after pollination
122
transcription control, secretion, contractility and motility have been addressed to G
proteins (Guo et al., 2009). These cellular processes regulate functions such as control of
seed germination, light responses, cell division and elongation, as well as response to
phytohormones (Neves et al., 2002). In plants, 4 heterotrimeric G-protein subunits have
been identified in Arabidopsis thaliana: one α-, one β- and two γ-subunits (Jones, 2002).
G-proteins are involved in numerous processes including phytochrome (Romero and
Lan, 1993) and gibberellins signalling (Jones et al., 1998), and regulation of stomatal
movement (Li and Assmann, 1993; Chen et al., 2004). Several studies point out to an
involvement of G protein β-subunit on normal leaf, flower and fruit development (Ma et
al., 1999; Lease et al., 2001; Peškan-Berghöfer et al., 2005). Since an AGB1, encoding a
β subunit of G protein in Arabidopsis, has been recently described as a regulatory gene
of the reproductive trait plasticity (Nilson and Assmann, 2010), down regulation of a G
protein β may illustrate a decrease on G-protein-mediated signalling regarding
phenotype plasticity related to environmental adaptation.
Down regulation of a transcript coding for a putative Calmodulin (CAM) protein
was found at 4DAP. In plants, calmodulin (CAM) is one of the major classes of calcium
(Ca2+) sensors characterized so far (reviewed in Yang and Poovaiah, 2003). CAMs are
the most conserved proteins serving as a universal calcium sensor in eukaryotes,
mediating calcium action by regulating the function of many targets in diverse cellular
pathways (Zielinski, 1998; Bey et al., 2004). No enzymatic activity has been attributed to
CAMs. After Ca2+ sensing, they can regulate the activity of target protein in numerous
processes (Bouché et al., 2005). In A. thaliana, 7 CAM genes and 50 CAM- like genes,
with multiple roles have been described (McCormack et al., 2005). Increasing evidence
supports a role for CAM proteins in plant development and in responses to biotic and
abiotic stimuli (Ranty et al., 2006). In A. thaliana floral buds, a highly expressed CAM2
gene showed to be essential in male and female gametophytes function (Landoni et
al., 2010). In O. fusca down regulation of a transcript coding for a CAM2 at 4DAP may
be related to cell signalling processes required for petal differentiation, as reported for
Antirrhinum majus (Bey et al., 2004). This CAM transcript may be associated to protein
target regulation in petal development, yet other processes may not be discarded.
Pollination appears to inactivate/disengage signal transduction mechanisms, by
chemical signal perception of G-proteins and CAM -mediated pathways.
2.4.2.2.10. Energy
Photosynthesis and carbon fixation are two of the most important cellular
processes (Fig. 2.14). Oxygenic photosynthesis (i.e. the conversion of sunlight into
chemical energy by plants) uses two multi-subunit photosystems (I and II) located in

Chapter 2- Labellum transcriptome after pollination
123
plants chloroplasts thylakoid (Nelson and Ben-Shem, 2004). Photosystem I (PSI) has a
P10700 reaction centre containing chlorophyll that takes the electron and associated
hydrogen donated from PSII to reduce NADP+ to NADPH (Nelson and Yocum, 2006).
Photosystem II (PSII) has a P680 reaction centre containing chlorophyll that uses light
energy to carry out the oxidation (splitting) of water molecules, and to produce ATP via
a proton pump (Nelson and Yocum, 2006; Diller et al., 2007). Both ATP and NADPH are
subsequently used in the light-independent reactions to convert carbon dioxide to
glucose using the hydrogen atom extracted from water by PSII, releasing oxygen as a
by-product (reviewed in Szabó et al., 2005). Many Arabidopsis genes participating in
the light-harvesting reactions of photosynthesis are under clock control. Among them
are the light- harvesting complex I (LHCI) and II (LHCII) gene families which encode
chlorophyll a⁄∕b binding polypeptides for photosystems I and II, respectively (Yakir et al.,
2007). Genes involved in the biosynthesis of chlorophyll and RuBisCO small subunit
(RBCS) and RuBisCO activase (RCA) that participate in carbon fixation are also clock-
controlled (Yakir et al., 2007). The most prominent event in leaf senescence is the
disassembly of the photosynthetic apparatus with consequent decrease of
photosynthetic capacity (Weng et al., 2005), which may be associated with reduced
photochemical activities of photosystems (Lu et al., 2002; Zhang et al., 2006). Plants
absorb light but this event also damages the photosynthetic machinery, primarily PSII,
by causing PSII photoinactivation that is referred as photoinhibition (Takahashi et al.,
2007).
Figure 2.14- Photosynthetic electron-flow machinery. Photosynthetic activity results from the balance between light absorption and its use. Regulation of light absorption relies on the thermal dissipation in the photosystem II (PSII) outer antenna light harvesting complex II (LHCII). This dynamic regulation of photosynthesis also involves electron transport. Modulation of the efficiency of linear (blue) and cyclic (red) electron flow, and thus ATP synthesis, through the generation of a H+ gradient is performed. Fd, ferredoxin; FNR, Fd: NADP+ reductase; PQ, plastoquinone. Adapted from (Finazzi et al., 2003)
10 P- Pigment.
Chapter 2- Labellum transcriptome after pollination
124
Photorespiration is an important mechanism for protecting PSII from
photoinhibition (reviewed in Foyer et al., 2009). In photosynthesis, the fixation of CO2 is
catalyzed by RuBisCO (ribulose-bisphophate carboxylase oxygenase), that catalyzes
the carboxylation of its substrate (ribulose-1,5-bisphosphate (RuBP)) to initiate the Calvin
cycle; and, RuBisCO also catalyzes the oxygenation of RuBP in the photorespiratory
pathway (reviewed in Bauwe et al., 2010). Briefly, oxygenation of RuBP yields two by-
products, 2-phosphoglycolate and 3- phosphoglycerate. After, the photorespiratory
phosphoglycolate is recycled through a complex series of reactions occurring in
chloroplasts, peroxisomes and mitochondria (McClung et al., 2000).
Photosynthesis-related transcripts were significantly down regulated in O. fusca
labellum (Table 2.6). Ferredoxin NADP oxireductase (FNR, EC. 1.18.1.2) is involved on
electron movement on the electron transport chain (ETC) while regenerating NADPH
from NADP+, and its lower transcription at 2 DAP may have consisted of an early signal
for a possible decrease on electron flux along ETC. In Arabidopsis thaliana, the
chloroplast-targeted enzyme ferredoxin-NADP+-oxidoreductase (FNR) is present as two
isoforms, AtLFNR1 and AtLFNR2. Leaf form FNR (AtLFNR1) has been associated to cyclic
electron transfer around photosystem I (PSI), which generates a proton gradient across
the thylakoid membrane with ATP production. When FNR1 is inactive, the content of the
light-harvesting complexes (LHCI and LHCII) are significantly decreased, as well as
chlorophyll content, PSI and PSII proteins contents (Lintala et al., 2007). As a result, FNR is
essential for maintaining photosynthesis homeostasis, which is not more needed soon
after pollination, a high energy-consuming process. Indeed, several other transcripts
were also found to have their abundance decreased at 4 DAP, namely FNR, a
chlorophyll a/b binding protein of the light harvesting complex (LHC) I, the photosystem
I (PSI) subunit G (PSI-G) and RuBisCO activase (Table 2.6). In petal senescence, a lower
expression of genes linked to photosynthesis has been reported as related to N and C
mobilization for other developing parts of the plant (van Doorn, 2004; Mishina et al.,
2007; Müller et al., 2010). According to Espinoza and co-workers (2007), in leaf
senescence, chlorophyll degradation and decrease in photosynthetic activity occur
along with decreases in total RNA and protein amounts. Since rapid respiration by
young flower tissue is needed to fulfill energy demands for growth and development
(Setyadjit et al., 2004; Azad et al., 2008), it was expected to encounter down regulation
of respiratory and photosynthetic genes after pollination. Down regulation of RuBisCO
activase reflects inactivation of RuBisCO, thus photorespiration is reduced (Lilley et al.,
1990). During photosynthesis, light energy is captured by pigments in the light-harvesting
complex (LHC) and transferred to the reaction centers (Photosystems I or II) of the
thylakoid membrane in green plants. LHC functions as a light receptor that captures
and delivers excitation energy to photosystems I and II (Ganeteg et al., 2001 and

Chapter 2- Labellum transcriptome after pollination
125
references therein). Down regulation in O.fusca of a photosystem I subunit G (PSI-G)
transcript suggests that photosystem I stability is compromised at 4 days after
pollination, since this subunit reflects the abundance of most PSI core proteins. PSI-G
plays also an important role in electron transport between plastocyanin and PSI, thus
stabilizing the PSI core (Varotto et al., 2002). Up regulation at 4DAP of a transcript
coding for a PSII 10kDa (PsbR) protein, one of the 4 nuclear encoded subunits of the
oxygen-evolving complex in PSII, was detected in O. fusca pollination. Photosystem II is
a supramolecular pigment-protein complex embedded in the thylakoid membrane
that catalyzes light-induced electron transfer from water to plastoquinone, with
concomitant progress of oxygen occurring on the luminal side of PSII (Ferreira et al.,
2004; Renger, 2010). The oxygen-evolving complex (OEC) of eukaryotic PSII is
composed of three extrinsic nuclear-encoded subunits, PsbO (33 kDa), PsbP (23 kDa),
and PsbQ (17 kDa) (Ferreira et al., 2004) and higher plant PSII contains the nuclear-
encoded low molecular mass subunits PsbW and PsbR (Suorsa et al., 2006). Roles
addressed to PsbR include water oxidation and stabilization of PSII complex, by
affecting the properties of both the acceptor and donor side electron transfer
reactions (Collet et al., 2003; Suorsa et al., 2006; Allahverdiyeva et al., 2007). Recent
studies pointed out for a putative function of PsbR as a docking protein (Suja and
Parida, 2008). According to Suorsa and co-workers (2006), PsbR absence decreases the
oxygen outcome from thylakoid membranes, suggesting that PsbR is essential for
optimization of photosynthetic water splitting and electron transfer in PSII. A drastic
decline in activities of PSII, PSI and whole chain electron transport has been reported for
several senescing systems, suggesting that the photochemical activity inhibits
photosynthesis during senescence (Liu et al., 2006; Zhang et al., 2006; Falqueto et al.,
2010). PSII may act also as a sensor for stress (van Rensen and Curwiel, 2000).
Accumulation of PsbR transcript at 4DAP may reveal a putative function of PsbR in
stabilizing the binding of PsbP and PsbO proteins in the PSII complex crucial for water
oxidation.
Down regulation of the mitochondrial enzyme serine hydroxymethyltransferase
(SHMT), involved in the photorespiratory pathway of serine (Ser) biosynthesis (Ho and
Saito, 2001) was detected at 2 DAP. Being photorespiration a wasteful metabolism
releasing CO2, NH3 and ATP, important for energy dissipation to prevent photoinhibition
(Zhu et al., 2005); this process was expected to be disengaged soon after pollination. A
defective mitochondrial SHMT gene have been related to a lethal photorespiratory
phenotype (Vool et al., 2006).Yet, 7 different SHMT genes have been described in
Arabidopsis (Bauwe and Kolukisaoglu, 2003) and functions on photorespiration remains
to be fully addressed. Though photorespiratory pathway of Ser synthesis seems to be
reduced early after pollination, Ser synthesis is activated by the phosphorylated

Chapter 2- Labellum transcriptome after pollination
126
pathway at 4 DAP, which is revealed by the up regulation of a phosphoglycerate
dehydrogenase protein (PHGDH; EC 1.1.1.95). This enzyme catalyzes the transition of 3-
phosphoglycerate into 3-phosphohydroxypyruvate, which is the first and rate-limiting
step in the phosphorylated pathway of serine biosynthesis using NAD+/NADH as a
cofactor (reviewed in Ho et al., 1999). This pathway has been proposed to be an
important Ser supply to non-photosynthetic organs (Muñoz-Bertomeu et al., 2010) and
when the photorespiratory rate is low (Ho et al., 1999; Ho and Saito, 2001). Taking the
above considerations together, a photorespiration disturbance after pollination is
suggested by our data, thus, the non-photorespiratory pathway would guarantee Ser
supply to assist the newly protein synthesis 4 days after pollination (4 DAP). Up regulation
of a transcript coding for a 3-phosphoglycerate dehydrogenase at 4DAP suggest that
when photorespiration rate is low, which is expected when senescence is ongoing, Ser
biosynthesis is routed through phosphorylated pathway probably rendering serine as a
precursor for several amino acids biosynthesis.
Down regulation of the heme biosynthetic protein protoheme IX
farnesyltransferase, similar to the human cytochrome c oxidase 10 (COX10), was
detected at 2 DAP. In plants, heme is a tetrapyrrole molecule and its synthesis is
essential for providing heme groups to cytochromes (Cyts), crucial in the electron
transport chain (ETC) as electron carriers located on mitochondrial inner membrane
(MIM) (Oborník and Green, 2005; Tanaka and Tanaka, 2007). On the other hand,
COX10 is required for COX biogenesis (reviewed in Diaz et al., 2006), being COX the
terminal complex of the mitochondrial respiratory chain, complex IV (Kranz et al., 1998;
Comelli and Gonzalez, 2009). The COX10 knockout on mammalian cells displayed a
respiratory deficiency (Diaz et al., 2006), thus, it is possible that a lowered expression of a
heme biosynthetic transcript related to COX10 protein at 2 DAP in the present study is
related to a negative impact of pollination on mitochondrial ETC.
Our results suggest that energy processes (i.e. photosynthesis, photorespiration,
electron transport chain) in Ophrys fusca labellum are early affected by pollination
event. Since the flower has fulfilled its biological role, ensuing fertilization, maintenance
of such an energy-consuming organ is compromised, and, the outcome of energy
depletion may either modulate or be a side-effect of labellum senescence. This
hypothesis is in agreement with data on tobacco flower, where gene expression of
several proteins involved in respiration is inactivated along with senescence (Müller et
al., 2010).

Chapter 2- Labellum transcriptome after pollination
127
2.4.2.3. cDNA microarray validation through qPCR
cDNA microarrays have the ability to provide an unprecedent capacity for a
broad gene expression profiling (Gachon et al., 2004). Since microarray experiments
can analyze thousands of genes in one step, quantitative real-time PCR (qPCR)
emerged as the most reliable and fast technique for validation of gene expression
datasets (Morey et al., 2006). As plants display a high number of multigenic families,
cross-hybridization between DNA representatives of gene families on cDNA-based
chips may lead to false interpretations (Gachon et al., 2004). Therefore, cDNA
microarrays validation through qPCR is crucial. In qPCR, several factors have to be
considered (reviewed in Udvardi et al., 2008), being one of the most important the
requirement of reference genes validation for each tissue and/or condition studied
(Dheda et al., 2005). If reference genes are not validated, normalization may be
compromised with influence on the accuracy and incongruency between both
techniques (Brunner et al., 2004). In this study, three reference genes were selected
from microarray studies based on their stable differential, retrived by RankProduct test,
gene expression in both time points assigned (2DAP and 4DAP). Overall, 7 genes (5 % of
the differentially expressed genes) were selected according to their expression profiles
and functional categories. Expression of these genes was performed by using the same
RNA samples that were used for the microarray hybridization experiments. qPCR data
showed expression patterns similar to those obtained for microarrays (Fig. 2.15), with
exception for class III chitinase transcript, where gene expression obtained from
microarray was conflicting with the expression measured by qPCR (Fig. 2.15). This is not
unexpected, since one of the limitations of cDNA microarrays relies on the possible
cross-hybridization of different transcripts belonging to the same gene family,
influencing expression levels (Murphy, 2002).

Chapter 2- Labellum transcriptome after pollination
128
Figure 2.15- Relative expressions comparision of 7 transcripts from cDNA microarray and qPCR results. Transcripts chosen for validation encode for: Pathogenesis- related protein 10c (PR10), GlucosylCer (Glucosylceramidase), Chaperone (Chaper), Stearoyl ACP-desaturase (SAD2), Metallothionein type 3 (Metallo III), Class III chitinase and Stearoyl ACP-desaturase (Ofup2825-SAD1). Median and Mean Absolute Deviation (MAD) of 5 biological replicates, for both qPCR and microarrays, are presented. Thus, two technical replicates were performed in all qPCR measurements. 40S ribosomal protein, 4-α-glucanotransferase and an oligopeptidase were used as reference genes. DAP: Days after pollination; Fold Change, relative expression of test (labella from pollinated flowers) versus control (labella from unpollinated flowers).
2.5. Conclusions
Flower function relies essentially on attracting pollinators to achieve successful
pollination. Upon pollination, metabolic resources of the flower are rapidly mobilized to
the developing ovary and flower senescence is undergoing. By removing organs and
tissues that are no longer functional, plant preserves its energy resources and eliminates
possible sites for pathogens entrance. Another important basis for floral death relies on
pollinated flowers removal from the plant or inflorescence so that it does not compete
for pollinators with the remaining flowers of the same inflorescence. After pollination,
sepals and petals may senesce and either abscise or remain in situ. Genes called SAGs
appear up regulated during senescence, while photosynthetic genes are actively
down regulated during this process (Mishina et al., 2007; Irish, 2009).
The potential complexity of transcriptional and post transcriptional control of
senescence can be perceived from the Ophrys fusca labellum transcriptome after
pollination performed. Ophrys fusca labellum transcriptome modulation demonstrates
-6-4-202468
101214161820 qPCR Microarray
PR10 GlucosylCer Chaper SAD2 Metallo III Class III chitinase
FoldC
hange
2 D
AP
4 D
AP
2 D
AP
4 D
AP
2 D
AP
4 D
AP
2 D
AP
4 D
AP
4 D
AP
2 D
AP
4 D
AP
SAD1
-6-4-202468
101214161820 qPCR Microarray
PR10 GlucosylCer Chaper SAD2 Metallo III Class III chitinase
FoldC
hange
2 D
AP
4 D
AP
2 D
AP
4 D
AP
2 D
AP
4 D
AP
2 D
AP
4 D
AP
4 D
AP
2 D
AP
4 D
AP
SAD1

Chapter 2- Labellum transcriptome after pollination
129
that pollination triggers events leading to labellum senescence. Expression of stress- and
defense-related transcripts at 2DAP (e.g. Lea5 protein, pathogenesis related protein 10,
gluthatione S- transferase- GST, chaperone, snakins proteins and cyclophilin) suggest a
general stress response in the labellum after pollination. The majority of differentially
expressed transcripts at 4DAP encode for proteins related to proteolysis, energy and
secondary metabolism. Post pollination changes in the labellum suggest an activation
of macromolecules breakdown, proteolysis, remobilization of nutrients to other
developing tissues and deactivation of the major metabolic pathways (secondary
metabolism) and energy-consuming processes (i.e. photosynthesis, photorespiration).
Pollination activates macromolecules breakdown, deactivates major metabolic
pathways (secondary metabolism) and remobilizes nutrients to other developing tissues,
probably to other flowers from the same inflorescence and/or developing ovule. At the
onset of senescence, the majority of down regulated genes include secondary
metabolism, transcription and photosynthesis related genes; while another subset of
genes, termed senescence associated genes (SAGs), are up regulated. SAGs obtained
in O.fusca labellum transcriptome analysis, include genes encoding phosphatases,
proteases and RNases, which reveal that labellum PCD is triggered by successful
pollination, through highly regulated machinery. Ophrys fusca pollination gene
expression analysis here presented allowed to gather a clear overview of the labellum
response upon pollination. Overall, secondary metabolism is unequivocally down
regulated following pollination. Soon after pollination (2DAP), genes involved in
secondary metabolism pathways are down regulated suggesting that the flower no
longer needs its by-products, e.g. regarding floral pigmentation (flavonoid biosynthetic
genes). At 4DAP, pollination continues to induce gene repression and a stress- related
response may be depicted by the hallmark expression of pathogen and stress-related
genes (e.g. PR10c, chitinase, Lea5, cyclophilins). Down regulation of alkaloid
biosynthetic genes occurred in Ophrys fusca pollination study, and of particular interest
is the transcript coding for salutaridino 7-O acetyltransferase, involved in morphine
biosynthesis. Despite the fact that Ophrys fusca pollination is achieved through sexual
deception, it cannot be discarded the possibility of alluring insects through narcotic
compound synthesis which, in turn, could increase the chance of flowers to be
pollinated, thereby avoiding pollinator learning cues. This is especially important in
Ophrys pollination system which is characterized by a low visitation rate. In what
concerns lipid metabolism, all related transcripts were down regulated at both 2DAP
and 4DAP. The following have to be highlighted: transcripts coding for wax biosynthesis
(TCER1), fatty acids (FAD2 and SAD), sphingolipids (ceramidase and
glucosylceramidase) and sterol metabolism (7- dehydrocholestrol reductase). Down
regulation of a gene coding for TCER1, a putative aldehyde decarbonylase, involved in

Chapter 2- Labellum transcriptome after pollination
130
synthesis of wax long-chain lipids (Fiebig et al., 2000), at 4DAP suggest a post pollination
reduction of alkane synthesis, which are important compounds as olfactory mimic cues
in Ophrys pollination system. Also, cell membranes properties undergo marked changes
in membrane phospholipids with loss and increase in the saturation: unsaturation index
of fatty acids, namely of PUFAs, which is revealed by the down regulation of FAD2 and
SAD transcripts in fatty acids metabolism. The possibility that these desaturases can give
rise to a vast array of unsaturated fatty acids, namely alkenes, which are compounds
triggering pseudocopulation attempts in the sexual deception Ophrys pollination
mechanism, cannot be excluded. Thus, the involvement of both desaturases (FAD2 and
SAD) in Ophrys-pollinator ecological relationship, through the insertion of double bonds
at different positions in fatty acid substrates of distinct carbon chain lengths, seems to
be a promising challenge that needs to be confirmed. Another class of lipids influenced
by pollination is sphingolipids, which are bioactive lipids that regulate plant growth and
PCD (Liang et al., 2003). Lipid-derived messengers also interplay with ROS to modulate
PCD. In O.fusca down regulation of ceramidases at 2DAP and 4DAP (neutral and
glucosylceramidase), results on accumulation of free sphingolipid bases and depletion
of complex ceramides, followed by H2O2 accumulation and subsequent cell death. As
a result, it can be considered that massive lipid biosynthesis deactivation, revealed by
down regulation of lipid metabolism genes accompanies labellum senescence. The
expression of stress-related genes (GST, Lea5, metallothioneins types 2 and 3, chitinases
and PR proteins) disclose the PCD event in labellum that is fully recognized 4 days after
pollination. Several cysteine proteases, known to be important factors in the attainment
of ROS-driven PCD, were up regulated at 4DAP. It is well documented that ethylene
and ROS are positive regulators of leaf (Lim et al., 2007) and petal senescence following
pollination, namely in the ethylene-sensitive flowers carnation, petunia, tobacco, and
orchids (O’Neill, 1997). Thus, ethylene stimulates the expression of SAGs encoding
proteins such as cysteine proteases and RNases (Della Mea et al., 2007). Transcripts
coding for cysteine proteases, S-like RNases and TRL-14/SAG13 (generally expressed
shortly before visible senescence begins) were probably stimulated by post pollination
events towards the labellum cell death. Up regulation at 4DAP of transcripts involved in
protein synthesis (ribossomal L17 and translation intiation factor) illustrates the
requirement of de novo protein synthesis in the timely initiation and progression of petal
senescence (van Doorn and Woltering, 2008; Bai et al., 2010).
Many of the newly identified orchid genes are presumably involved in
modulating the initial signalling events illustrated by stress and pathogen-related genes
(e.g. PR10c, cyclophilins, metallothioneins, and chaperone). These include genes that
modulate the intensity of the cell death stimulus, participate in the interaction with
other signaling molecules, or perceive the cell death signal (down regulation of

Chapter 2- Labellum transcriptome after pollination
131
ceramidases, HYS1 gene). Other genes relay and amplify the cell death signal (e.g. S-
like RNases, cysteine proteases, protein synthesis related transcripts), ultimately to
govern global transcriptional reprogramming observed during cell death. As a result of
this reprogrammation, sets of genes including proteases and nucleases orchestrate the
orderly executed cell suicide and remobilization of resources.
Several transcripts coding for transcription factors involved in floral regulation
(SQUAMOSA-binding protein and Flavin-binding Kelch Repeat F-Box1) and on ovule
developmental programme (Nam-like protein), may give a small, but yet important,
contribute towards the understanding of orchid reproductive biology. Differentially
expressed genes coding for expansins up regulated at 4DAP may be a consequence
of auxin action, an induced post pollination phenomenon, which is critical for ovary
maturation and growth in orchids. Actin cytoskeleton rearrangement induced by cross-
pollination is illustrated by expression of transcripts coding for actin and profilin, being
also putatively involved in pollen germination.
From the transcriptional study performed on Ophrys fusca labellum after
pollination, it was verified that an irreversible senescence program on petal senescence
is largely independent of environmental factors, unlike leaf senescence which is more
closely linked with external stimuli. As a result, once a flower is pollinated or is no longer
receptive for pollination purposes, maintenance of this organ is costly in energy
requisites. Thus it was not surprising to encounter photosynthetic and secondary
metabolism genes down regulated following pollination, both at 2DAP and 4DAP.
Senescence, triggered by successful pollination, seems to be regulated by protein
degradation and, after, by the newly protein synthesis. After pollination, gene
expression seems to drive the labellum to PCD, mainly characterized by a gradual
decrease in photosynthetic activity, activation of proteases for large scale proteolysis,
pigment depletion (flavonoids/anthocyanins metabolism), modification of the cell wall
(expansins, PMEI) and de novo protein synthesis required for senescence onset.
This study on Ophrys fusca pollination is promising, namely for the understanding
of the high regulated process of labellum senescence in orchid pollination biology in
general. Future studies on orchids should focus on monitoring the mRNA transcripts of
certain genes in order to find specific markers that govern pollination regulatory
mechanisms (e.g. scent emission, senescence, pigmentation depletion). Labellum
transcriptome analysis here presented accounts for an alternative overview on Ophrys
fusca peculiar pollination mechanism. Pollination is usually species-specific (Paulus and
Gack 1990) providing a mean for reproductive isolation between the intercrossable
Ophrys species (Schiestl and Ayasse, 2002). Transcripts putatively involved in the
biosynthesis of key compounds that trigger pseudocopulation events, such as FAD2
and SAD, may be promising in the evolution of the peculiar pollination mechanism

Chapter 2- Labellum transcriptome after pollination
132
within Ophrys. This approach could provide insights on transcriptional control of
biological active compounds involved in Ophrys species-specific pollination.
References
Aarts MGM, Keijzer CJ, Stiekema WJ and Pereira A (1995) Molecular characterization of the CER1 gene of Arabidopsis involved in epicuticular wax biosynthesis and pollen fertility. The Plant Cell 7: 2115-2127. Abid G, Silue S, Muhovskil Y, Jacquemin J-M, Toussaint A and Baudoin J-P (2009) Role of myo-inositol phosphate synthase and sucrose synthase genes in plant seed development. Gene 439(1-2): 1-10. Abreu EFM and Aragão FJL (2007) Isolation and characterization of a myo-inositol-1-phosphate synthase gene from yellow passion fruit (Passiflora edulis f. flavicarpa) expressed during seed development and environmental stress. Annals of Botany 99: 285-292. Adams MD, Celniker SE, Holt RA, Evans CA, Gocayne JD, Amanatides PG, Scherer SE, Li PW, Hoskins RA, Galle RF et al. (2000) The genome sequence of Drosophila melanogaster. Science 287: 2185-2195. Adler LS, Karban R and Strauss SY (2001) Direct and indirect effects of alkaloids on plant fitness via herbivory and pollination. Ecology 82(7): 2032-2044. Aharoni A and Vorst O (2001) DNA microarrays for functional plant genomics. Plant Molecular Biology 48: 99-118. Aida M, Ishida T, Fukaki H, Fujisawa H and Tasaka M (1997) Genes involved in organ separation in Arabidopsis: an analysis of the cup-shaped cotyledon mutant. The Plant Cell 9: 841-857. Aida M, Ishida T and Tasaka M (1999) Shoot apical meristem and cotyledon formation during Arabidopsis embryogenesis: interaction among the CUP-SHAPED COTYLEDON and and SHOOT MERISTEMLESS genes. Development 126: 1563-1570. Aida M, Vernoux T, Furutani M, Traas J and Tasaka M (2002) Roles of PIN-FORMED1 and MONOPTEROS in pattern formation of the apical region of the Arabidopsis embryo. Development 129: 3965-3974. Aki T, Konishi M, Kikuchi T, Fujimori T, Yoneyama T and Yanagisawa S (2007) Distinct modulations of the hexokinase1-mediated glucose response and hexokinase1-independent processes by HYS1/CPR5 in Arabidopsis. Journal of Experimental Botany 58(12): 3239-3248. Akiyama T, Kaku H and Shibuya N (1998) A cell wall-bound β-glucosidase from germinated rice: purification and properties. Phytochemistry 48: 49-54. Alban C, Job D and Douce R (2000) Biotin metabolism in plants. Annual Review of Plant Physiology and Plant Molecular Biology 51:17-47.

Chapter 2- Labellum transcriptome after pollination
133
Ali MB, Khatun S, Hahn EJ and Paek KY (2006) Enhancement of phenylpropanoid enzymes and lignin in Phalaenopsis orchid and their influence on plant acclimatisation at different levels of photosynthetic photon flux. Plant Growth Regulation 49: 137-146. Allahverdiyeva Y, Mamedov F, Suorsa M, Styring S, Vass I and Aro E-M (2007) Insights into the function of PsbR protein in Arabidopsis thaliana. Biochimica et Biophysica Acta 1767: 677-685. Altschul SF, Gish W, Miller W, Myers EW and Lipman DJ (1990) Basic local alignment search tool. Journal of Molecular Biology 215: 403-410. Anderson MD, Che P, Song J, Nikolau BJ and Wurtele ES (1998) 3-methylcrotonyl-Coenzyme A carboxylase is a component of the mitochondrial leucine catabolic pathway in plants. Plant Physiology 118: 1127-1138. Andrews ES, Theis N and Adler LS (2007) Pollinator and herbivore attraction to Cucurbita floral volatiles. Journal of chemical Ecology 33: 1682-1691. Applied Biosystems (2008) Guide to performing relative quantitation of gene expression using real-time quantitative PCR. Available at: http://www3.appliedbiosystems.com/cms/groups/mcb_support/documents/generaldocuments/cms_042380.pdf. Ascensão L, Francisco A, Cotrim, H and Pais S (2005) Comparative structure of the labellum in Ophrys fusca and O. lutea (Orchidaceae). American Journal of Botany 92: 1059-1067. Attri LK, Nayyar H, Bhanwra RK and Pehwal A (2008) Pollination-induced oxidative stress in floral organs of Cymbidium pendulum (Roxb.) Sw. and Cymbidium aloifolium (L.) Sw. (Orchidaceae): A biochemical investigation. Scientia Horticultarae 116: 311-317. Austin M and Noel JP (2003) The chalcone synthase superfamily of type III polyketide synthases. Natural Product Reports 20: 79-110. Ayasse M, Schiestl FP, Paulus HF, Löfstedt C, Hansson B, Ibarra F and Francke W (2000) Evolution of reproductive strategies in the sexually deceptive orchid Ophrys sphegodes: how does flower-specific variation of odour signals influence reproductive success? Evolution 54(6): 1995-2006. Azad AK, Ishikawa T, Ishikawa T, Sawa Y and Shibata H (2008) Intracellular energy depletion triggers programd cell death during petal senescence in tulip. Journal of Experimental Botany 59(8): 2085-2095. Azevedo C, Santos-Rosa MJ and Shirasu K (2001) The U-box protein family in plants. Trends in Plant Science 6(8): 354-358. Babar M and Khatun AS (2006) Enhancement of phenylpropanoid enzymes and lignin in Phalaenopsis orchid and their influence on plant acclimatisation at different levels of photosynthetic photon flux. Plant Growth Regulation 49:137-146. Badiee A, Eiken HG, Steen VM and Løvlie R (2003) Evaluation of five different cDNA labelling methods for microarrays using spike controls. BMC Biotechnology 3: 23, 10.1186/1472-6750-3-23. Bai S, Willard B, Chapin LJ, Kinter MJ, Francis DM, Stead AD and Jones ML (2010) Proteomic analysis of pollination-induced corolla senescence in petunia. Journal of Experimental Botany 61(4): 1089-1109.

Chapter 2- Labellum transcriptome after pollination
134
Baines CP and Molkentin JD (2009) Adenine nucleotide etranslocase-1 induces cardiomyocyte death through upregulation of the pro-apoptotic bax. Journal of Molecular and Cell Cardiology 46: 969-977. Bais HP, Weir TL, Perry LG, Gilroy S and Vivanco JM (2006) The role of root exudates in rhizosphere interactions with plants and other organisms. Annual Review in Plant Biology 57: 233-266. Bariola PA, Macintosh GC and Green PJ (1999) Regulation of S-like ribonuclease levels in Arabidopsis. Antisense inhibition of RNS1 or RNS2 elevates anthocyanin accumulation. Plant Physiology 119: 331-342. Baudry A, Ito S, Song YH, Strait AA, Kiba T, Lu S, Henriques R, Pruneda-Paz JL, Chua NH, Tobin EM, Kay SA and Imaizumi T (2010) F-Box Proteins FKF1 and LKP2 act in concert with ZEITLUPE to control Arabidopsis clock progression. The Plant Cell 22: 606-622. Baugh LR, Hill AA, Brown EL and Hunter CP (2001) Quantitative analysis of mRNA amplification by in vitro transcription. Nucleic Acids Research 29: e29. Bauwe H and Kolukisaoglu U (2003) Genetic manipulation of glycine decarboxylation. Journal of Experimental Botany 387: 1523-1535. Bauwe H, Hagemann M and Fernie AR (2010) Photorespiration: players, partners and origin. Trends in Plant Science 15(6): 330-336. Bednarek P and Osbourn A (2009) Plant-microbe interactions: chemical diversity in plant defense. Science 324(5928): 746-748. Beně V and Muckenthaler M (2003) Standardization of protocols in cDNA microarray analysis. Trends in Biochemical Sciences 28(5): 244-249. Berger JA, Hautaniemi S, Järvinen AK, Edgren H, Mitra SK and Astola J (2004) Optimized LOWESS normalization parameter selection for DNA microarray data. BMC Bioinformatics 5: 194, 10.1186/1471-2105-5-194. Bey M, Stüber K, Fellenberg K, Schwarz-Sommer Z, Sommer H, Saedler H and Zachgo S (2004) Characterization of Antirrhinum petal development and identification of target genes of the class B MADS box gene DEFICIENS. The Plant Cell 16: 3197-3215. Bhalerao R, Keskitalo J, Sterky F, Erlandsson R, Björkbacka H, Birve SJ, Karlsson J, Gardeström P, Gustafsson P, Lundeberg J and Jansson S (2003) Gene expression in autumn leaves. Plant Physiology 131: 430-442. Birkenbihl RP, Jach G, Saedler H and Huijser P (2005) Functional dissection of the plant-specific SBP-domain: overlap of the DNA-binding and nuclear localization domains. Journal of Molecular Biology 352: 585-596. Birnboim HC and Doly J (1979) A rapid alkaline extraction procedure for screening recombinant plasmid DNA. Nucleic Acids Research 7(6): 1513-1523. Bleicher RJ and Cabot MC (2002) Glucosylceramide synthase and apoptosis. Biochimica et Biophysica Acta 1585: 172-178. Boerjan W, Ralph J and Baucher M (2003) Lignin Biosynthesis. Annual Review of Plant Biology 54: 519-546.

Chapter 2- Labellum transcriptome after pollination
135
Bosch M and Hepler PK (2005) Pectin methyltransferases and pectin dynamics in pollen tubes. The Plant Cell 17: 3219-3226. Bouché N, Yellin A, Snedden WA and Fromm H (2005) Plant-specific calmodulin-binding proteins. Annual Review of Plant Biology 56: 435-466. Boudet AM (2007) Evolution and current status of research in phenolic compounds. Phytochemistry 68: 2722-2735. Bradshaw E, Rudall PJ, Devey DS, Thomas MM, Glover BJ and Bateman RM (2010) Comparative labellum micromorphology of the sexually deceptive temperate orchid genus Ophrys: diverse epidermal cell types and multiple origins of structural colour. Botanical Journal of the Linnean Society 162: 504-540. Brash AR (1999) Lipoxygenase: occurrence, functions, catalysis and acquisition of substrate. Journal of Biological Chemistry 274: 23679-23682. Breeze E, Wagstaff C, Harrison E, Bramke I, Rogers HJ, Stead AD, Thomas B and Buchanan-Wollaston V (2004) Gene expression patterns to define stages of post harvest senescence in Alstroemeria petals. Plant Biotechnology Journal 2: 155-168. Breitling R, Armengaud P, Amtmann A and Herzyk P (2004) Rank products: a simple, yet powerful, new method to detect differentially regulated genes in replicated microarrays experiments. FEBS Letters 573(1-3): 83-92. Broun P, Poindexter P, Osborne E, Jiang CZ and Riechmann JL (2004) WIN1, a transcriptional activator of epidermal wax accumulation in Arabidopsis. Proceedings of the National Academy of Sciences 101(13): 4706-4711. Browning KS (2004) Plant translation initiation factors: it is not easy to be green. Biochemical Society Transactions 32(4): 589-591. Brunner AM, Yakovlev IA and Strauss SH (2004) Validating internal controls for quantitative plant gene expression studies. BMC Plant Biology 4:14, 10.1186/1471-2229-4-14. Brychkova G, Alikulov Z, Fluhr R and Sagi M (2008) A critical role for ureides in dark and senescence-induced purine remobilization is unmasked in the Atxdh1 Arabidopsis mutant. The Plant Journal 54: 496-509. Buchanan-Wollaston V (1994) Isolation of cDNA clones for genes that are expressed during leaf senescence. Plant Physiology 105: 839-846. Buchanan-Wollaston V and Ainsworth C (1997) Leaf senescence in Brassica napus: cloning of senescence related genes by subtractive hybridisation. Plant Molecular Biology 33: 821-834. Buchanan-Wollaston V, Page T, Harrison E, Breeze E, Lim PO, Nam HG, Lin J-F, Wu S-H, Swidzinski J, Ishizaki K and Leave CJ (2005) Comparative transcriptome analysis reveals significant differences in gene expression and signalling pathways between developmental and dark/starvation-induced senescence in Arabidopsis. The Plant Journal 42: 567-585. Buer CS, Imin N and Djordjevic MA (2010) Flavonoids: new roles for old molecules. Journal of Integrative Plant Biology 52(1): 98-111.

Chapter 2- Labellum transcriptome after pollination
136
Bui AQ and O’Neill SD (1998) Three 1-aminocyclopropane-1-carboxylate synthase genes regulated by primary and secondary pollination signals in orchid flowers. Plant Physiology 116: 419-428. Bustin SA, Benes V, Garson JA, Hellemans J, Huggett J, Kubista M, Mueller R, Nolan T, Pfaffl MW, Shipley GL, Vandesompele J and Wittwer CT (2009) The MIQE Guidelines: Minimum Information for Publication of Quantitative Real-Time PCR Experiments. Clinical Chemistry 55: 611-622. Bustin SA, Beaulieu J-F, Huggett J, Jaggi R, Kibenge FSB, Olsvik PA, Penning LC and Toegel S (2010) MIQE précis: Practical implementation of minimum standard guidelines for fluorescence based quantitative real-time PCR experiments. BMC Molecular Biology 11: 74, 10.1186/1471-2199-11-74. Bustin SA, Benes V, Nolan T and Pfaffl MW (2005) Quantitative real-time RT-PCR- a perspective. Journal of Molecular Endocrinology 34: 597-601. Byfield GE and Upchurch RG (2007) Effect of temperature on delta-9 stearoyl-ACP and microsomal omega-6 desaturase gene expression and fatty acid content in developing soybean seeds. Crop Science 47: 1698-1704. Caffall KH and Mohnen D (2009) The structure, function, and biosynthesis of plant cell wall pectic polysaccharides. Carbohydrate Research 344: 1879-1900. Caihong J, Huayan Z, Hongzhi W, Zhifeng X, Kejiu D, Yanru S and Jianhua W (2004) Obtaining the transgenic poplars with low lignin content through down-regulation of 4CL. Chinese Science Bulletin 49(9): 905-909. Cameron KM, Chase MW, Whitten WM, Kores PJ, Jarrel DC, Albert VA, Yukama T, Hills HG and Goldman DH (1999). A phylogenetic analysis of the Orchidaceae: evidence from rbcl nucleotide sequences. American Journal of Botany 86(2): 208-224. Camins A, Junyent F, Verdaguer E, Beas-Zarate C, Rojas-Mayorquín AE, Ortuño-Sahagún D and Pallàs M (2009) Resveratrol: an antiaging drug with potential therapeutic applications in treating diseases. Pharmaceuticals 2: 194-205. Cardon G, Höhmann S, Klein J, Nettesheim K, Saedler H and Huijser P (1999) Molecular characterisation of the Arabidopsis SBP-box genes. Gene 237: 91-104. Carpita NC (1996) Structure and biogenesis of the cell walls of grasses. Annual Review of Plant Physiology and Plant Molecular Biology 47: 445-476. Carrari F, Fernie AR and Iusem ND (2004) Heard it through the grapevine? ABA and sugar cross-talk: the ASR story. Trends in Plamt Science 9(2): 57-59. Carter C, Shafir S, Yehonatan L, Palmer RG and Thornburg R (2006) A novel role for proline in plant floral nectars. Naturwissenschaften 93: 72-79. Castañeda-Ovando A, Pacheco-Hernández ML, Páez-Hernández ME, Rodríguez JÁ and Galán-Vidal CA (2009) Chemical studies of anthocyanins: A review. Food Chemistry 113: 859-871. Castillo MC and Leon J (2008) Expression of the β-oxidation gene 3-ketoacyl-CoA thiolase 2 (KAT2) is required for the timely onset of natural and dark-induced leaf senescence in Arabidopsis. Journal of Experimental Botany 59: 2171-2179.

Chapter 2- Labellum transcriptome after pollination
137
Chae E, Tan QKG, Hill TA and Irish VF (2008) An Arabidopsis F-box protein acts as a transcriptional co-factor to regulate floral development. Development 135: 1235-1245. Chakrabarty D, Verma AK and Datta SK (2009) Oxidative stress and antioxidant activity as the basis of senescence in Hemerocallis (day lily) flowers. Journal of Horticulture and Forestry 1(6): 113-119. Chang HS, Jones ML, Banowetz GM and Clark DG (2003) Overproduction of cytokinins in petunia flowers transformed with P-SAG12-IPT delays corolla senescence and decreases sensitivity to ethylene. Plant Physiology 132: 2174-2183. Chapin L and Jones ML (2009) Ethylene regulates phosphorus remobilization and expression of a phosphate transporter (PhPT1) during petunia corolla senescence. Journal of Experimental Botany 60: 2179-2190. Charbonnel-Campaa L, Lauga B and Combes D (2000) Isolation of a type 2 metallothionein-like gene preferentially expressed in the tapetum in Zea mays. Gene 254(1-2): 199-208. Che P, Wurtele ES and Nikolau BJ (2002) Metabolic and environmental regulation of 3-methylcrotonyl-Coenzyme A carboxylase expression in Arabidopsis. Plant Physiology 129: 625-637. Che P, Weaver LM, Wurtele LS and Nikolau BJ (2003) The role of biotin in regulating 3-methylcrotonyl-Coenzyme A carboxylase expression in Arabidopsis. Plant Physiology 131: 1479-1486. Cheesbrough TM and Kolattukudy PE (1984) Alkane biosynthesis by decarbonylation of aldehydes catalyzed by a particulate preparation from Pisum sativum. Proceedings of the National Academy of Sciences USA 81: 6613-6617. Chen C and Deutcher MP (2005) Elevation of RNase R in response to multiple stress conditions. The Journal of Biological Chemistry 280(41): 34393-34396. Chen X, Goodwin SM, Boroff VL, Liu X and Jenks MA (2003) Cloning and characterization of the WAX2 gene of Arabidopsis involved in cuticle membrane and wax production. The Plant Cell 15: 1170-1185. Chen Y-L, Huang R, Xiao Y-M, Lü P, Chen J and Wang X-C (2004) Extracellular calmodulin-induced stomatal closure is mediated by heterotrimeric G protein and H2O2.
Plant Physiology 136: 4096-4103. Chevalier D and Walker JC (2005) Functional genomics of protein kinases in plants. Briefings in Functional Genomics and Proteomics 3(4): 362-371. Chiera JM and Grabau EA (2007) Localization of myo-inositol phosphate synthase (GmMIPS-1) during the early stages of soybean seed development. Journal of Experimental Botany 58 (8): 2261-2268. Chiou CY and Yeh KW (2008) Differential expression of MYB gene (OgMYB1) determines color patterning in floral tissue of Oncidium Gower Ramsey. Plant Molecular Biology 66: 379-388. Cho SK, Ryu MY, Song C, Kwak JM and Kima WT (2008) Arabidopsis PUB22 and PUB23 are homologous U-Box E3 ubiquitin ligases that play combinatory roles in response to drought stress. The Plant Cell 20: 1899-1914.

Chapter 2- Labellum transcriptome after pollination
138
Choe S, Noguchi T, Fujioka S, Takatsuto S, Tissier CP, Gregory BD, Ross AS, Tanaka A, Yoshida S, Tax FE and Feldmann KA (1999) Arabidopsis dwf7/ste is defective in the D7 sterol C-5 desaturation step leading to brassinosteroids biosynthesis. Plant Cell 11: 207-221. Choe S, Tanaka A, Noguchi T, Fujioka S, Takatsuto S, Ross AS, Tax FE, Yoshida S and Feldmann KA (2000) Lesions in the sterol Δ7 reductase gene of Arabidopsis cause dwarfism due to a block in brassinosteroids biosynthesis. The Plant Journal 21(5): 431-443. Choi MS, Anderson MA, Zhang Z, Zimonjic DB, Popescu N, Mukherjee AB (2003) Neutral ceramidase gene: role in regulating ceramide-induced apoptosis. Gene 315: 113-122. Choi AM, Lee SB, Cho SH, Hwang I, Hur S-G and Suh MC (2008) Isolation and characterization of multiple abundant lipid transfer protein isoforms in developing sesame (Sesamum indicum L.) seeds. Plant Physiology and Biochemistry 46: 127-139. Chong J, Poutaraud A and Hugueney P (2009) Metabolism and roles of stilbenes in plants. Plant Science 177: 143-155. Chou IT and Gasser CS (1997) Characterization of the cyclophilin gene family of Arabidopsis thaliana and phylogenetic analysis of known cyclophilin proteins. Plant Molecular Biology 35: 873-892. Churchill GA (2002) Fundamentals of experimental design for cDNA microarrays. Nature Genetics 32: 490-495. Civello PM, Powell ALT, Sabehat A and Bennett AB (1999) An expansin gene Expressed in ripening strawberry fruit. Plant Physiology 121: 1273-1279. Clifford MN (2000) Anthocyanins – nature, occurrence and dietary burden. Journal of the Science of Food and Agriculture 80(7): 1063-1072. Cobbett CS and Goldsborough PB (2002) Phytochelatins and metallothioneins: roles in heavy metal detoxification and homeostasis. Annual Review of Plant Biology 53: 159-182. Coen HS and Meyerowitz EM (1991) The war of the whorls: genetic interactions controlling flower development. Nature 353: 31-37. Collet H, Butowt R, Smith J, Farrant J and Illing N (2003) Photosynthetic genes are differentially transcribed during the dehyfration-rehydration cycle in the resurrection plant, Xerophyta humulis. Journal of Experimental Botany 54(392): 2593-2595. Colquhoun TA, Verdonk JC, Schimmel BCJ, Tieman DM, Underwood BA and Clark DG (2010) Petunia floral volatile benzenoid/phenylpropanoid genes are regulated in a similar manner. Phytochemistry 71: 158-167. Comelli RN and Gonzalez DH (2009) Divergent regulatory mechanisms in the response of respiratory chain component genes to carbohydrates suggests a model for gene evolution after duplication. Plant Signaling & Behavior 4: 1179-1181. Cosgrove DJ (1998) Cell wall loosening by expansins. Plant Physiology 118: 333-339. Courtney SE, Rider CC, Stead AD (1994) Changes in protein ubiquitination and the expression of ubiquitin-encoding transcripts in daylily petals during floral development and senescence. Physiology Plantarum 91: 196-204.

Chapter 2- Labellum transcriptome after pollination
139
Couturier J, Doidy J, Guinet F, Wipf D, Blaudez D and Chalot M (2010) Glutamine, arginine and the amino acid transporter Pt-CAT11 play important roles during senescence in poplar. Annals of Botany 105(7): 1159-1169. Cozzolino S, Schiestl FP, Müller A, De Castro O, Nardella AM and Widmer A (2005) Evidence for pollinator sharing in Mediterranean nectar-mimic orchids: absence of premating barriers? Proceedings of the Royal Society B: Biological Sciences 272(1569): 1271-1278. Cozzolino S and Schiestl FP (2008) Evolution of sexual mimicry in the orchid tribe orchidinae: the role of preadaptations in the attraction of male bees as pollinators. BMC Evolutionary Biology 8: 27, 10.1186/1471-2148-8-27. Craig S, Ewan R, Mesmar J, Gudipati V and Sadanandom A (2009) E3 ubiquitin ligases and plant innate immunity. Journal of Experimental Botany, 10.1093/jxb/erp059. Crompton M (1999) The mitochondrial permeability transition pore and its role in cell death. Biochemical Journal 341: 233-249. Crowell DN, John ME, Russell D and Amasino RM (1992) Characterization of a stress-induced, developmentally regulated gene family from soybean. Plant Molecular Biology 18: 459-466. Cuvillier O, Pirianov G, Kleuser B, Vanek PG, Coso OA, Gutkind JS and Spiegel S (1996) Suppression of ceramide-mediated programmed cell death by sphingosine-1-phosphate. Nature 381: 800-803. Dahout-Gonzalez C, Nury H, Trézéguet V, Lauquin GJ-M, Pebay-Peyroula E and Brandolin G (2006) Molecular, functional and pathological aspects of the mitochondrial ADP/ATP carrier. Physiology 21: 242-249. Dallerac R, Labeur C, Jallon JM, Knipple DC, Roelofs WL and Claude Wicker-Thomas C (2000) A Δ9 desaturase gene with a different substrate specificity is responsible for the cuticular diene hydrocarbon polymorphism in Drosophila melanogaster. Proceedings of the National Academy of Sciences USA 97(17): 9449-9454. Day RC, McNoe L and Macknight RC (2007) Evaluation of global RNA amplification and its use for high-throughout transcript analysis of laser-microdissected endosperm. International Journal of Plant Genomics, 10.1155/2007/61028. De Michele R, Formentin E, Todesco M, Toppo S, Carimi F, Zottini M, Barizza E, Ferrarini A, Delledonne M, Fontana P and Lo Schiavo F (2009) Transcriptome analysis of Medicago truncatula leaf senescence: similarities and differences in metabolic and transcriptional regulations as compared with Arabidopsis, nodule senescence and nitric oxide signalling. New Phytologist 181: 563-575. Della Mea M, De Filippis F Genovesi V Fracassini DS and Del Duca S (2007) The acropetal wave of developmental cell death of tobacco corolla is preceded by activation of transglutaminase in different cell compartments. Plant Physiology 144: 1211-1222. Devlin PF and Kay SA (2000) Cryptochromes are required for phytochrome signaling to the circadian clock but not for rhythmicity. The Plant Cell 12: 2499-2509. Dheda K, Hugget JF, Chang JS, Kim LU, Bustin SA, Johnson MA, Rook GAW and ZumLa A (2005) Implications of using an inappropriate reference gene for real-time reverse transcription PCR data normalization. Analytical Biochemistry 344: 141-143.

Chapter 2- Labellum transcriptome after pollination
140
Di Matteo A, Giovane A, Raiola A,, Camardella L, Bonivento D, De Lorenzo G, Cervone F, Bellincampi D and Tsernoglou D (2005) Structural basis for the interaction between pectin methylesterase and a specific inhibitor protein. The Plant Cell 17: 849-858. Diaz F, Fukui H, Garcia S and Moraes ST (2006) Cytochrome c oxidase is required for the assembly/stability of respiratory complex I in mouse fibroblasts. Molecular and Cellular Biology 26: 4872-4881. Dicke M, van Loon JJA and Soler R (2009) Chemical complexity of volatiles from plants induced by multiple attacks. Nature Chemical Biology 5(5): 317-324. Diller A, Roy E, Gast P, van Gorkom AJ, de Groot HJM, Glaubitz C, Jeschke G, Matysik J and Alia A (2007)15N photochemically induced dynamic nuclear polarization magic-angle spinning NMR analysis of the electron donor of photosystem II. Proceedings of the National academy of Sciences USA 104(31): 12767-12771. Dixon RA and Paiva NL (1995) Stress-Induced phenylpropanoids metabolism. The Plant Cell 7: 1085-1097. Do JW and Choi DK (2006) Normalization of microarray data: single-labeled and dual-labeled arrays. Molecules and Cells 22(3): 254-261. Do JH and Choi DK (2007) cDNA labelling strategies for microarrays using fluorescent dyes. Engineering Life Science 7(1): 26-34. Dobbin KK, Kawasaki ES, Petersen DW and Simon RM (2005) Characterizing dye bias in microarray experiments. Bioinformatics 21(10): 2430-2437. Dóczi R, Kondrák M, Kovács G, Beczner F and Bánfalvi Z (2005) Conservation of the drought-inducible DS2 genes and divergences from their ASR paralogues in solanaceous species. Plnat Physiology and Biochemistry 43: 269-276. Dombkowski AA, Thibodeau BJ, Starcevic SL and Novak RF (2004) Gene-specific dye bias in microarray reference designs. FEBS Letters 560: 120-124. Donahue JL, Alford SR, Torabinejad J, Kerwin RE, Nourbakhsh A, Ray WK, Hernick M, Huang X, Lyons BM, Hein PP and Gillaspy GE (2010) The Arabidopsis thaliana myo-inositol 1-phosphate synthase gene is required for myo-inositol synthesis and suppression of cell death. Plant Cell 22: 888-903. Dong YH, Kvarnheden A, Yao JL, Sutherland PW, Atkinson RG, Morris BA and Gardner RC (1998) Identification of pollination-induced genes from the ovary of apple (Malus domestica). Sexual Plant Reproduction 11: 277-283. Doss RP (2005) Treatment of pea pods with Bruchin B results in up-regulation of a gene similar to MtN19. Plant Phyology and Biochemistry 43(3): 225-231. Douglas CJ (1996) Phenylpropanoids metabolism and lignin biosynthesis: from weeds to trees. Trends in Plant Science 1(6): 171-178. Dräger B (2006) Tropinone reductases, enzymes at the branch point of tropane alkaloid metabolism. Phytochemistry 67: 327-337. Dreher K and Callis J (2007) Ubiquitin, hormones and biotic stress in plants. Annals of Botany 99: 787-822.

Chapter 2- Labellum transcriptome after pollination
141
Dudareva N and Pichersky E (2000) Biochemical and molecular genetic aspects of floral scents. Plant Physiology 122: 627-633. Duff SMG, Sarath G and Plaxton WC (1994) The role of acid phosphatase in plant phosphorus metabolism. Physiologia Plantarum 90: 791-800. Dufourc EJ (2008) The role of phytosterols in plant adaptation to temperature. Plant Signaling & Behavior 3(2): 133-134. Durbin ML, McCaig B and Clegg MT (2000) Molecular evolution of the chalcone synthase multigene family in the morning glory genome. Plant Molecular Biology 42: 79-92. Dyer AG, Whitney HM, Arnold SEJ, Glover BJ and Chittka L (2007) Mutations perturbing petal cell shape and anthocyanin synthesis influence bumblebee perception of Antirrhinum majus flower colour. Arthropod-Plant Interactions 1: 45-55. Dyer JM, Stymne S, Green AG and Carlsson AS (2008) High-value oils from plants. The Plant Journal 54: 640-655. Eason JR, Ryan DJ, Watson LM, Hedderley D, Christey MC, Braun RH and Coupe SA (2005) Suppression of the cysteine protease, aleurain, delays floret senescence in Brassica oleracea. Plant Molecular Biology 57: 645-657. Eckardt NA (2010) Myo-inositol biosynthesis genes in Arabidopsis: differential patterns of gene expression and role in cell death. The Plant Cell 22: 537. Eckermann S, Schröder G, Schmidt J, Strack D, Edrada RA, Helariutta Y, Elomaa P, Kotilainen M, Kilpeläinen I, Proksch P, Teeri TH and Schröder J (1998) New pathway to polyketides in plants. Nature 396: 387-390. Edner C, Li J, Albrecht T, Mahlow S, Hejazi M, Hussain H, Kaplan F, Guy C, Smith SM, Steup M and Ritte G (2007) Glucan, water dikinase activity stimulates breakdown of starch granules by plastidial b-amylases. Plant Physiology 145: 17-28. Ehlting J, Shin JJK and Douglas CJ (2001) Identification of 4-coumarate:coenzyme A ligase (4CL) substrate recognition domains. The Plant Journal 27(5): 455-465. Endo M, Matsubara H, Kokubun T, Masuko H, Takahata Y, Tsuchiya T, Fukuda H, Demura T and Watanabe M (2002) The advantages of cDNA microarray as an effective tool for identification of reproductive organ-specific genes in a model legume, Lotus japonicus. FEBS Letters 514: 229-237. Espinoza C, Medina C, Somerville S and Arce-Johnson P (2007) Senescence-associated genes induced during compatible viral interactions with grapevine and Arabidopsis. The Journal of Experimental Botany 58: 3197-3212. Facchini PJ, Huber-Allanach KL and Tari LW (2000) Plant aromatic L-amino acid decarboxylases: evolution, biochemistry, regulation, and metabolic engineering applications. Phytochemistry 54: 121-138. Facchini PJ and St-Pierre B (2005) Synthesis and trafficking of alkaloid biosynthetic enzymes. Current Opinion in Plant Biology 8: 657-666. Falqueto AR, Silva FSP, Cassol D, Júnior AMM, Oliveira AC and Bacarin MA (2010) Chlorophyll fluorescence in rice: probing of senescence driven changes of PSII activity

Chapter 2- Labellum transcriptome after pollination
142
on rice varieties differing in grain yield capacity. Brazilian Journal of Plant Physiology 22(1): 35-41. Fang Z, Shao C, Meng Y, Wu P and Chen M (2009) Phosphate signaling in Arabidopsis and Oryza sativa. Plant Science 176: 170-180. Fedoroff NV (2002) RNA-binding proteins in plants: the tip of an iceberg? Current Opinion in Plant Biology 5: 452-459. Fenart S , Ndong Y-PA, Duarte J, Rivière N, Wilmer J, van Wuytswinkel O, Lucau A, Cariou E, Neutelings G, Gutierrez L, Chabbert B, Guillot X, Tavernier R, Hawkins S and Thomasset B (2010) Development and validation of a flax (Linum usitatissimum L.) gene expression oligo microarray. BMC Genomics 11: 592, 10.1186/1471-2164-11-592. Ferreira KN, Iverson TM, Maghlaoui K, Barber J and Iwata S (2004) Architecture of the photosynthetic oxygen-evolving center. Science 303(5665): 1831-1838. Ferrer J-L, Austin MB, Stewart Jr. C and Noel JP (2008) Structure and function of enzymes involved in the biosynthesis of phenylpropanoids. Plant Physiology and Biochemistry 46(3): 356-370. Fettke J, Hejazi M, Smirnova J, Höchel E, Stage M and Steup M (2009) Eukaryotic starch degradation: integration of plastidial and cytosolic pathways. Journal of Experimental Botany 60(109): 2907-2922. Fia G, Giovani G and Rosi I (2005) Study of beta-glucosidase production by wine related yeasts during alcoholic fermentation. A new rapid fluorimetric method to determine enzymatic activity. Journal of Applied Microbiology 99: 509-517. Fiebig A, Mayfield JA, Miley NL, Chau S, Fischer RL and Preuss D (2000) Alterations in CER6, a gene identical to CUT1, differentially affect long-chain lipid content on the surface of pollen and stems. The Plant Cell 12: 2001-2008. Figueiredo A, Fortes AM, Ferreira S, Sebastiana M, Choi YH, Sousa L, Acioli-Santos B, Pessoa F, Verpoorte R and Pais MS (2008) Transcriptional and metabolic profiling of grape (Vitis vinifera L.) leaves unravel possible innate resistance against pathogenic fungi. Journal of Experimental Botany 59: 3371-3381. Finazzi G, Rappaport F and Goldschmidt-Clermont M (2003) From light to life: an interdisciplinary journey into photosynthetic activity: workshop on molecular genetics and biophysical aspects of photosynthesis. EMBO Reports 4(8): 752-756. Fletcher CM , Pestova TV, Hellen CUT and Wagner G (1999) Structure and interactions of the translation initiation factor eIF1. The EMBO Journal 18(9): 2631-2637. Fodour SP, Read JL, Pirrung MC, Stryer L, Lu AT and Solas D (1991) Light directed, spatially addressable parallel chemical synthesis. Science 251: 767-773. Fortes AM, Santos F, Choi YH, Silva MS, Figueiredo A, Sousa L, Pessoa F, Acioli-Santos B, Sebastiana M, Palme K, Malhó R, Verpoorte R and Pais MS (2008) Organogenic nodule development in hop (Humulus lupulus L.): transcript and metabolic responses. BMC Genomics 9: 445, 10.1186/1471-2164-9-445. Foyer CH, Bloom AJ, Queval G and Noctor G (2009) Photorespiratory metabolism: genes, mutants, energetics and redox signaling. Annual Review of Plant Biology 60: 455-484.

Chapter 2- Labellum transcriptome after pollination
143
Frankel N, Hasson E, Iusem ND and Rossi MS (2003) Adaptive evolution of the water stress-induced gene ASR2 in Lycopersicon species dwelling in arid habitats. Molecular Biology and Evolution 20(12): 1955-1962. Frankel N, Carrari F, Hasson E and Iusem ND (2006) Evolutionary history of the ASR gene family. Gene 378: 74-83. Fricke W and Pajlich E (1990) The effect of water stress on the vacuole-extravacuole compartimentation of proline in potato cell suspension cultures. Physiologia Plantarum 78(3): 374-378. Frugis G and Chua NH (2002) Ubiquitin-mediated proteolysis in plant hormone signal transduction. Trends in Cell Biology 12(7): 308-311. Fujioka S and Yokota T (2003) Biosynthesis and metabolism of brassinosteroids. Annual Review of Plant Biology 54: 137-164. Funck D, Stadelhofer B and Koch B (2008) Ornithine-δ-aminotransferase is essential for arginine catabolism but not for proline biosynthesis. BMC Plant Biology 8:40, 10.1186/1471-2229-8-40. Gachon C, Mingam A and Charrier B (2004) Real-time PCR: what relevance to plant studies? Journal of Experimental Botany 55(402):1445-1454. Galau GA, Hughes DW and Dure L III (1986) Abscisic acid induction of cloned cotton late embryogenesis-abundant (Lea) mRNAs. Plant Molecular Biology 7:155-170. Gamas P, de Carvalho Niebel F, Lescure N and Cullimore JV (1996) Use of a subtractive hybridization approach to identify new Medicago truncatula genes induced during root nodule development. Molecular Plant-Microbe Interactions 9: 233-242. Gan SS and Amasino RM (1995) Inhibition of leaf senescence by autoregulated production of cytokinin. Science 270: 1986-1988. Ganeteg U, Strand A, Gustafsson P and Jansson (2001) The properties of the chlorophyll a/b-binding proteins Lhca2 and Lhca3 studied in vivo using antisense inhibition. Plant Physiology 127: 150-158. Gao J, Kim S-R, Lee JM and Gynheung A (1993) Nucleotide and protein sequences of 60S ribosomal protein L17 from tobacco (Nicotiana tabacum L.). Plant Physiology 103: 1027-1028. Ge X, Dietrich C, Matsuno M, Li G, Berg H and Xia Y (2005) An Arabidopsis aspartic protease functions as an anti-cell-death component in reproduction and embryogenesis. EMBO Reports 6(3): 282-288. Gechev TS, Gadjev IZ and Hille J (2004) An extensive microarray analysis of AAL-toxin-induced cell death in Arabidopsis thaliana brings new insights into the complexity of programmed cell death in plants. Cellular and Molecular Life Sciences 61: 1185-1190. Gelder RNV, von Zastrow ME, Yool A, Dement WC, Barchas JD and Eberwine JH (1990) Amplified RNA synthesized from limited quantities of heterogeneous cDNA. Proceedings of the National Academy of Sciences USA 87: 1663-1667. Gerhardt B (1992) Fatty acid degradation in plants. Progress in Lipid Research 31: 417-446.

Chapter 2- Labellum transcriptome after pollination
144
Gibbon BC, Zonia LE, Kovar DR, Hussey PJ and Staiger CJ (1998) Pollen profilin function depends on interaction with proline-rich motifs. The Plant Cell 10: 981-993. Giglio S, Monis PT and Saint CP (2003) Demonstration of preferential binding of SYBR Green I to specific DNA fragments in real-time multiplex PCR. Nucleic Acids Research 31(22): 10.1093/nar/gng135. Gilbert HF (1997) Protein disulfide isomerase and assisted protein folding. The Journal of Biological Chemistry 272(47): 29399-29402. Gillissen B, Bürkle L, André B, Kühn C, Rentsch D, Brandl B and Frommer WB (2000) A new family of high-affinity transporters for adenine, cytosine, and purine derivatives in Arabidopsis. The Plant Cell 12: 291-300. Ginsberg SD and Che S (2002) RNA amplification in brain tissues, Neurochemical Research 27: 981-992. Giovanea A, Servillo L, Balestrieri C, Raiola A, D’Avino R, Tamburrini M, Ciardiello MA, Camardell L (2004) Pectin methylesterase inhibitor. Biochimica et Biophysica Acta 1696: 245-252. Godoy AV, Lazzaro AS, Casalongué CA and Segundo BS (2000) Expression of a Solanum tuberosum cyclophilin gene is regulated by fungal infection and abiotic stress conditions. Plant Science 152: 123-134. Goffeau A, Barrell BG, Bussey H, Davis RW, Dujon B, Feldmann H, Galibert F, Hoheisel JD, Jacq C, Johnston M, Louis EJ, Mewes HW, Murakami Y, Philippsen P, Tettelin H and Oliver SG (1996) Life with 6000 genes. Science 274: 546-567. Goldman MHS, Seurinck J, Marins M, Goldman GH and Mariani C (1998) A tobacco flower-specific gene encodes a polyphenol oxidase. Plant Molecular Biology 36: 479-485. Goldraij A and Polacco JC (2000) Arginine degradation by arginase in mitochondria of soybean seedling cotyledons. Planta 210(4): 652-658. Goldstrohm AC, Hook BA, Seay DJ and Wickens M (2006) PUF proteins bind Pop2p to regulate messenger RNAs. Nature Structural and Molecular Biology 13: 533-539. Goodwin PH, Hsiang T and Erickson L (2000) A comparison of stilbene and chalcone synthases including a new stilbene synthase gene from Vitis riparia cv. Gloire de Montpellier. Plant Science 151: 1-8. Górniak M, Paun O and Chase MW (2010) Phylogenetic relationships within Orchidaceae based on a low-copy nuclear coding gene, Xdh: congruence with organellar and nuclear ribosomal DNA results. Molecular Phylogenetics and Evolution 56(2): 784-795. Gracey AY and Cossins AR (2003) Application of microarray technology in environmental and comparative physiology. Annual Review of Physiology 65: 231-259. Graham IA and Eastmond PJ (2002) Pathways of straight and branched chain fatty acid catabolism in higher plants. Progress in Lipid Research 41: 156-181. Green PJ (1994) The ribonucleases of higher plants. Annual Review of Plant Physiology and Plant Molecular Biology 45: 421-445.

Chapter 2- Labellum transcriptome after pollination
145
Green DR and Reed JC (1998) Mitochondria and Apoptosis. Science 281: 1309-1312. Grotewold E (2006) The genetics and biochemistry of floral pigments. Annual Review of Plant Biology 57: 761-780. Grothe T, Lenz R and Kutchan TM (2001) Molecular characterization of the salutaridinol 7-O-acetyltransferase involved in morphine biosynthesis in opium poppy Papaver somniferum. The Journal of Biological Chemistry 276(33): 30717-30723. Grudkowska M and Zagdańska B (2004) Multifunctional role of plant cysteine proteinases. Acta Biochimica Polonica 51(3): 609-624. Gülz PG (1980) Alkanes & alkenes in the epicuticular waxes from Cistus plants. In: Biogenesis & Function of Plant Lipids― Mazliak P, Benveniste P, Costes C, Douce R, eds. (1980) Elsevier, Amsterdam. 275-279pp. Guo WJ, Bundithya W and Goldsbrough PB (2003) Characterization of the Arabidopsis metallothionein gene family: tissue-specific expression and induction during senescence and in response to copper. New Phytologist 159: 369-381. Guo J, Wang S, Wang J, Huang W-D, Liang J and Chen J-G (2009) Dissection of the relationship between RACK1 and heterotrimeric G-proteins in Arabidopsis. Plant and Cell Physiology 50(9): 1681-1694. Hacia JG, Brody LC, Chee M, Fodour SPA and Collins FS (1996) Detection of heterozygous mutations in BRCA1 using high density oligonucleotide arrays and two-colour fluorescence analysis. Nature Genetics 14: 441-447. Hacia JG (1999) Resequencing and mutational analysis using oligonucleotide microarrays. Nature Genetics 21 (Suppl. 1): 42–47. Hain R, Bieseler B, Kindl H, Schörder G and Stöcker R (1990) Expression of a stilbene synthase gene in Nicotiana tabacum results in synthesis of the phytoalexin resveratrol. Plant Molecular Biology 15: 325-335. Hamberger B and Hahlbrock K (2004) The 4-coumarate:CoA ligase gene family in Arabidopsis thaliana comprises one rare, sinapate activating and three commonly occurring isoenzymes. Proceedings of the National Academy of Sciences USA 101(7): 2209-2214. Han YY, Ming F, Wang JW, Ye MM and Shen DL (2005) A novel chalcone synthase gene from Phalaenopsis orchid that alters floral morphology in transgenic tobacco plants. Plant Molecular Biology Reporter 23: 193a-193m. Han YY, Ming F, Wang W, Wang JW, Ye MM and Shen DL (2006a) Molecular evolution and functional specialization of chalcone synthase superfamily from Phalaenopsis Orchid. Genetica 128: 429-438. Han YY, Ming F, Wang JW, Wen JG, Ye MM and Shen DL (2006b) Cloning and characterization of a novel chalcone synthase gene from Phalaenopsis hybrida orchid flowers. Russian Journal of Plant Physiology 53(2): 223– 230. Han Y, Vimolmangkang S, Soria-Guerra RE, Rosales-Mendoza S, Zheng D, Lygin AV and Korban SS (2010) Ectopic expression of apple F3’H genes contributes to anthocyanin accumulation in the Arabidopsis tt7 mutant grown under nitrogen stress. Plant Physiology 153: 806-820.

Chapter 2- Labellum transcriptome after pollination
146
Hanfrey C, Fife M and Buchanan-Wollaston V (1996) Leaf senescence in Brassica napus: expression of genes encoding pathogenesis-related proteins. Plant Molecular Biology 30: 597-609. Hanhineva K, Kokko H, Siljanen H, Rogachev I, Aharoni A and Kärenlampi SO (2009) Stilbene synthase gene transfer caused alterations in the phenylpropanoid metabolism of transgenic strawberry (Fragaria x ananassa). Journal of Experimental Botany 60(7): 2093-2106. Hannun A, Luberto C and Argraves KM (2001) Enzymes of sphingolipid metabolism: from modular to integrative signalling. Biochemistry 40(16): 4893-4903. Hannun YA and Obeid LM (2002) The Ceramide-centric universe of lipid-mediated cell regulation: stress encounters of the lipid kind. Journal of Biological Chemistry 277: 25847- 25850. Hannun YA and Obeid LM (2008) Principles of bioactive lipid signalling: lessons from sphingolipids. Nature Reviews Molecular Cell Biology 9: 139-150. Hartmann M-A (1998) Plant sterols and the membrane environment. Trends in Plant Science 3(5): 170-175. He JX, Fujioka S, Li TC, Kang SG, Seto H, Takatsuto S, Yoshida S and Jang JC (2003) Sterols regulate development and gene expression in Arabidopsis. Plant Physiology 131: 1258-1269. He S, Wu B, Pan Y and Jiang L (2008) Stilbene oligomers from Parthenocissus laetevirens: isolation, biomimetic synthesis, absolute configuration, and implication of antioxidative defense system in the plant. The Journal of Organic Chemistry 73: 5233-5241. Hegde P, Qi R, Abernathy K, Gay C, Dharap S and Gaspard R (2000) In: A concise guide to cDNA microarray analysis eds. Hegde P, Qi R, Abernathy K, Gay C, Dharap S and Gaspard R et al. (2000) Biotechniques 29(3): pp. 548-550, 552-544. Hegeman CE, Good LL and Grabau EA (2001) Expression of D-myo-inositol-3-phosphate synthase in soybean. Implications for phytic acid biosynthesis. Plant Physiology 125: 1941-1948. Heise J, Krejci S, Miersch J, Krauss GJ and Humbeck K (2007) Gene expression of metallothioneins in barley during senescence and heavy metal treatment. Crop Science 47: 1111-1118. Herrero J, Al-Shahrour F, Díaz-Uriarte R, Mateos A, Vaquerizas JM, Santoyo J and Dopazo, J (2003a) GEPAS, a web-based resource for microarray gene expression data analysis. Nucleic Acids Research 31(13): 3461-3467. Herrero J, Díaz-Uriarte R and Dopazo, J (2003b) Gene Expression Data Preprocessing. Bioinformatics 19 (5): 655-656. Hettema EH and Tabak HF (2000) Transport of fatty acids and metabolites across the peroxisomal membrane. Biochimica et Biophysica Acta 1486: 18-27. Hew CS, Tan SC, Chin TY and Ong TK (1989) Influence of ethylene on enzyme activities and mobilization of materials in pollinated Arachnis orchid flowers. Journal of Plant Growth Regulation 8: 121-130.

Chapter 2- Labellum transcriptome after pollination
147
Hewitt F, Hough T, O’Neill P, sasse JM, Williams EG and Rowan KS (1985) Effect of brassinolide and other growth regulators on the germination and growth of pollen tubes of Prunus avium using a multiple hanging drop assay. Australian Journal of Plant Physiology 1: 201-211. Hibara K, Karim MR, Takada S, Taoka K-i, Furutani M, Aida M and Tasaka M (2006) Arabidopsis CUP-SHAPED COTYLEDON3 regulates postembryonic shoot meristem and organ boundary formation. The Plant Cell 18: 2946-2957. Ho KK (1999) Characterization of polyphenol oxidase from aerial roots of an orchid, Aranda ‘Christine 130’. Plant Physiology and Biochemistry 37(11): 841-848. Ho C-H, Noji M, Saito M and Saito K (1999) Regulation of serine biosynthesis in Arabidopsis. Crucial role of plastid 3- Phosphoglycerate dehydrogenase in non- photosynthetic tissues. The Journal of Biological Chemistry 274(1): 397-402. Hoeberichts FA, van Doorn WG, Vorst O, Hall RD and van Wordragen MF (2007) Sucrose prevents up-regulation of senescence-associated genes in carnation petals. Journal of Experimental Botany 58(11): 2873-2885. Holton TA and Cornish EC (1995) Genetics and biochemistry of anthocyanin biosynthesis. The Plant Cell 7: 1071-1083. Hu B, Zhu C, Li F, Tang J, Wang Y, Lin A, Liu L, Che R and Chu C (2011) LEAF TIP NECROSIS 1 plays a pivotal role in the regulation of multiple phosphate starvation responses in rice. Plant Physiology, 10.1104/pp.110.170209. Hua X, van de Cotte B, Montagu MV and Verbruggen N (1997) Developmental regulation of pyrroline-5-carboxylate reductase gene expression in Arabidopsis. Plant Physiology 114: 1215-1224. Huang Y, Prasad M, Lemon WJ, Hampel H, Wright FA, Kornacker K, LiVolsi V, Frankel W, Kloos RT, Eng C, Pellegata NS and de la Chapelle A (2001) Gene expression in papillary thyroid carcinoma reveals highly consistent profiles. Proceedings of the National Academy Sciences USA 98: 15044–15049. Huang X, von Rad U and Dorner J (2002) Nitric oxide induces transcriptional activation of the nitric oxide-resistant alternative oxidase in Arabidopsissuspension cells. Planta 215: 914-923. Huang D-J, Chen H-J and Lin Y-H (2005) Isolation and expression of protein disulfide isomerase cDNA from sweet potato (Ipomoea batatas [L.] Lam ‘Tainong 57’) storage roots. Plant Science 169: 776-784. Huggett J, Dheda K, Bustin S and Zumla A (2005) Real-time RT-PCR normalisation; strategies and considerations. Genes and Immunity 6: 279-284. Hunter DA, Steele BC and Reid MS (2002) Identification of genes associated with perianth senescence in daffodil (Narcissus pseudonarcissus L. ‘Dutch Master’). Plant Science 163: 13-21. Hussey PJ, Allwood EG and Smertenko AP (2002) Actin-binding proteins in the Arabidopsis genome database: properties of functionally distinct plant actin-depolymerizing factors/cofilins. Philosophical Transactions of the Royal Society of London B 357: 791-798.

Chapter 2- Labellum transcriptome after pollination
148
Imaizumi T, Tran HG, Swartz TE, Briggs WR and Kay SA (2003) FKF1 is essential for photoperiodic-specific light signalling in Arabidopsis. Nature 426: 302-306. Imaizumi T, Schultz TF, Harmon FG, Ho LA and Kay SA (2005) FKF1 F-box protein mediates cyclic degradation of a repressor of CONSTANS in Arabidopsis. Science 309: 293-297. Irish VF (2009) Evolution of petal identity. Journal of Experimental Botany 60(9): 2517-2527. Ishida T, Aida M, Takada S and Tasaka M (2000) Involvement of CUP-SHAPED COTYLEDON genes in gynoecium and ovule development in Arabidopsis thaliana. Plant Cell Physiology 41(1): 60-67. Itzhaki H, Maxson JM and Woodson WR (1994) An ethylene responsive enhancer element is involved in the senescence related expression of the carnation glutathione S-transferase (GST1) gene. Proceedings of the National Academy of Sciences USA 91: 8925-8929. Iwano M, Shiba H, Matoba K, Miwa T, Funato M, Entani T, Nakayama P, Shimosato H, Takaoka A, Isogai A and Takayama S (2007) Actin dynamics in papilla cells of Brassica rapa during self- and cross-pollination. Plant Physiology 144: 72-81. Jain M and Khurana JP (2009) Transcript profiling reveals diverse roles of auxin-responsive genes during reproductive development and abiotic stress in rice. FEBSS Journal 276: 3148-3162. Jakubska A, Przado D, Steininger M, Anioł-Kwiatkowska J and Kadej M (2005) Why do pollinators become “sluggish”? Nectar chemical constituents from Epipactis helleborine L. Crantz (Orchidaceae). Applied Ecology and Environmental Research 3(2): 29-38. Jang JY, Choi Y, Jeon YK, Aung KC and Kim CW (2008) Over-expression of adenine nucleotide translocase 1 (ANT1) induces apoptosis and tumor regression in vivo. BMC Cancer 8:160, 10.1186/1471-2407-8-160. Jeon O-S, Kim C-S, Lee S-P, Kang SK, Kim C-M, Kang B-G, Hur Y and kim I-J (2006) Fruit ripening-related expression of a gene encoding group 5 late embryogenesis abundant protein in Citrus. Journal of Plant Biology 49(5): 403-408. Jeong SW, Rahman MM, Hwang JW, Kim JM, Arizono K and Seo YR (2010) DNA microarray analysis of gene expression profiles in Caenorhabditis elegans exposed to cadmium. BioChip Journal 4(1): 35-41. Jetter R and Kunst L (2008) Plant surface lipid biosynthetic pathways and their utility for metabolic engineering of waxes and hydrocarbon biofuels. The Plant Journal 54: 670-683. Jones HD, Smith SJ, Desikan R, Plakidou-Dymock S, Lovegrove A and Hooley R (1998) Heterotrimeric G-proteins are implicated in gibberellin induction of α-amylase gene expression in wild oat aleurone. Plant Cell 10: 245-253. Jones A (2000) Does the plant mitochondrion integrate cellular stress and regulate programmed cell death. Trends in Plant Science 5: 225-230. Jones AM (2002) G-protein-coupled signaling in Arabidopsis. Current Opinion on Plant Biology 5: 402-407. Jones AM and Assmann SM (2004) Plants: the latest model system for G-protein research. EMBO Reports 5(6): 572-578.
Chapter 2- Labellum transcriptome after pollination
149
Jones ML, Chaffin GS, Eason JR and Clark DG (2005) Ethylene sensitivity regulates proteolytic activity and cysteine protease gene expression in petunia corollas. Journal of Experimental Botany 56: 2733-2744. Junghanns KT, Kneusel RE, Baumert A, Maier W, Gröger D and Marten U (1995) Molecular cloning and heterologous expression of acridone synthase from elicited Ruta graveolens L. cell suspension cultures. Plant Molecular Biology 27: 681-692. Kachroo A, Shanklin J, Whittle E, Lapchyk L, Hildebrand D and Kachroo P (2007) The Arabidopsis stearoyl-acyl carrier protein-desaturase family and the contribution of leaf isoforms to oleic acid synthesis. Plant Molecular Biology 63: 257-271. Kader J-C (1996) Lipid transfer proteins in plants. Annual Review of Plant Physiology and Plant Molecular Biology 47: 627-654. Kammenga JE, Herman MA, Ouborg NJ, Johnson L and Breitling R (2007) Microarray challenges in ecology. Trends in Ecology and Evolution 22(5): 273-279. Kampinga HH and Craig EA (2010) The HSP70 chaperone machinery: J proteins as drivers of functional specificity. Nature Reviews Molecular Cell Biology 11: 579-592. Kaneko M, Ohnishi Y and Horinouchi S (2003) Cinnamate:Coenzyme A ligase from the filamentous bacterium Streptomyces coelicolor A3(2). Journal of Bacteriology 185(1): 20-27. Kang S and Back K (2006) Enriched production of N-hydroxycinnamic acid amides and biogenic amines in pepper (Capsicum annuum) flowers. Scientia Horticulturae 108: 337-341. Kaplan F and Guy CL (2004) β-Amylase induction and the protective role of maltose during temperature shock. Plant Physiology 135: 1674-1684. Kaplan F and Guy CL (2005) RNA interference of Arabidopsis β-amylase 8 prevents maltose accumulation upon cold shock and increases sensitivity of PSII photochemical efficiency to freezing stress. Plant Journal 44: 730-743. Kaplan F, Sung DY and Guy CL (2006) Roles of ß-amylase and starch breakdown during temperatures stress. Physiologia Plantarum 126: 120-128. Kar M and Mishra D (1976) Catalase, peroxidase and polyphenoloxidase activities during rice leaf senescence. Plant Physiology 57: 315-319. Karsten SL, Van Deerlin VN, Sabatti C, Gill LH and Geschwind DH (2002) An evaluation of tyramide signal amplification and archived fixed and frozen tissue in microarray gene expression analysis. Nucleic Acids Research 30(2): E4. Kasprzewska A (2003) Plant chitinases–regulation and function. Cellular and Molecular Biology Letters 8: 809-824. Kavi Kishor PB, Sangam S, Amrutha RN, Sri Laxmi P, Naidu KR, Rao KRSS, Rao S, Reddy KJ, Theriappan P and Sreenivasulu N (2005) Regulation of proline biosynthesis, degradation, uptake and transport in higher plants: Its implications in plant growth and abiotic stress tolerance. Current Science 88(3): 424-438. Kerr MK and Churchill GA (2001) Experimental design for gene expression microarrays. Biostatistics 2(2): 183-201.

Chapter 2- Labellum transcriptome after pollination
150
Kessler A and Halitschke R (2009) Testing the potential for conflicting selection on floral chemical traits by pollinators and herbivores: predictions and case study. Functional Ecology 23: 901-912. Ketsa S, Wisutiamonkul A and van Doorn WG (2006) Auxin is required for pollination-induced ovary growth in Dendrobium orchids. Functional Plant Biology, 10.1071/FP06034. Khadake RM, Ranjekar PK and Harsulkar AM (2009) Cloning of a Novel Omega-6 Desaturase from Flax (Linum usitatissimum L.) and Its Functional Analysis in Saccharomyces cerevisiae. Molecular Biotechnology 42:168-174. Kiełbowicz-Matuk A, Rey P and Rorat T (2007) The abundance of a single domain cyclophilin in Solanaceae is regulated as a function of organ type and high temperature and not by other environmental constraints. Physiologia Plantarum 131: 387-398. Kikuchi K, Ueguchi-Tanaka M,Yoshida KT, Nagato Y, Matsusoka M and Hirano H-Y ( 2000) Molecular analysis of the NAC gene family in rice. Molecular and General Genetics 262: 1047-1051. Kim HI and An CS (2002) Differential expression patterns of an acidic chitinase and a basic chitinase in the root nodule of Elaeagnus umbellata. Plant-Microbe Interactions 15: 209-215. Kimura M, Yamamoto YY, Seki M, Sakurai T, Sato M, Abe Y, Yoshida S, Manabe K, Shinozaki K and Matsui M (2003) Identification of Arabidopsis genes regulated by high light-stress using cDNA microarray. Photochemistry and Photobiology 77(2): 226-233. Kiyosaki T, Asakura T, Matsumoto I, Tamura T, Terauchi K, Funaki J, Kuroda M, Misaka T and Abe K (2009) Wheat cysteine proteases triticain α, β and γ exhibit mutually distin ct responses to gibberellin in germinating seeds. Journal of Plant Physiology 166: 101-106. Klee HJ and Clark DG (2010) Ethylene signal transduction in fruits and flowers. In: Davies PJ. Plant Hormones edited by Springer Netherlands. pp. 377-398. Klein J, Saedler H and Huijser P (1996) A new family of DNA binding proteins includes putative transcriptional regulators of the Antirrhinum majus floral meristem identity gene SQUAMOSA. Molecular General and Genetics 250: 7-16. Kleindt CK, Stracke R, Mehrtens F and Weisshaar B (2010) Expression analysis of flavonoid biosynthesis genes during Arabidopsis thaliana silique and seed development with a primary focus on the proanthocyanidin biosynthetic pathway. BMC Research Notes 3: 255, 10.1186/1756-0500-3-255. Klok EJ, Wilson IW, Wilson D, Chapman SC, Ewing RM, Somerville SC, Peacock WJ, Dolferus R, Dennis ES (2002) Expression profile analysis of the low-oxygen response in Arabidopsis root cultures. The Plant Cell 14: 2481-2494. Koch T, Krumm T, Jung V, Engelberth J and Boland W (1999) Differential induction of plant volatile biosynthesis in the lima bean by early and late intermediates of the octadecanoid signaling pathway. Plant Physiology 121: 153-162. Kodan A, Kuroda H and Sakai F (2002) A stilbene synthase from Japanese red pine (Pinus densiflora): implications for phytoalexin accumulation and down-regulation of flavonoid biosynthesis. Proceedings of the National Academy of Sciences USA 99(5): 3335-3339.

Chapter 2- Labellum transcriptome after pollination
151
Koes RE, Spelt CE, Mol JNM and Gerats AGM (1987) The Chalcone synthase multigene family of Petunia hybrida (V30): sequence homology, chromosomal localization and evolutionary aspects. Plant Molecular Biology 10: 159-169. Kong HY, Lee SC and Hwang BK (2001) Expression of pepper cyclophilin gene is differentially regulated during the pathogen infection and abiotic stress conditions. Physiological and Molecular Plant Pathology 59: 189-199. Kong JM, Chia LS, Goh NK, Chia TF and Brouillard R (2003a) Analysis and biological activities of anthocyanins. Phytochemistry 64(5): 923-933. Kong JM, Goh NK, Chia LS and Chia TF (2003b) Recent advances in traditional plant drugs and orchids. Acta Pharmacologica Sinica 24(1): 7-21. Kono M, Dreier JL, Ellis JM, Allende ML, Kalkofen DN, Sanders KM, Bielawski J, Bielawska A, Hannun YA and Proia RL (2006) Neutral ceramidases encoded by the Asah2 gene is essential for the intestinal degradation of shingolipids. The Journal of Biological Chemistry 281(11): 7324-7331. Kranz R, Lill R, Goldman B, Bonnard G and Merchant S (1998) Molecular mechanisms of cytochrome c biogenesis: three distinct systems. Molecular Microbiology 29: 383-396. Krizek BA and Fletcher JC (2005) Molecular mechanisms of flower development: an armchair guide. Nature Reviews Genetics 6: 688-698. Kroemer G, Dallaporta B and Resche-Rigo M (1998) The mitochondrial death/life regulator in apoptosis and necrosis. Annual Review of Physiology 60: 619-642. Kroemer G, Galluzzi L and Brenner C (2007) Mitochondrial membrane permeabilization in cell death. Physiological Reviews 87: 99-163. Kudo T, Kiba T and Sakakibara H (2010) Metabolism and long-distance translocation of cytokinins. Journal of Integrative Plant Biology 52: 53-60. Kuehnle AR (1997) Molecular biology of orchids. In: Arditti J and Pridgeon AM. Orchid Biology: Reviews and Perspectives, VII, eds Kluwer Academic, London, pp 75-115. Laloi M (1999) Plant mitochondrial carriers: an overview. Cellular and Molecular Life Sciences 56: 918-944. Lan L, Chen W, Lai Y, Suo J, Kong Z, Li C, Lu Y, Zhang Y, Zhao X, Zhang X, Zhang Y, Han B, Cheng J and Xue J (2004) Monitoring of gene expression profiles and isolation of candidate genes involved in pollination and fertilization in rice (Oryza sativa L.) with a 10K cDNA microarray. Plant Molecular Biology 54: 471-487. Lan L, Li M, Lai Y, Xu W, Kong Z, Ying K, Han B and Xue Y (2005) Microarray analysis reveals similarities and variations in genetic programs controlling pollination/fertilization and stress responses in rice (Oryza sativa L.). Plant Molecular Biology 59: 151-164. Landoni M, De Francesco A, Galbiati M and Tonelli C (2010) A loss-of-function mutation in Calmodulin2 gene affects pollen germination in Arabidopsis thaliana. Plant Molecular Biology 74: 235-247. Lara MEB, Garcia MCG, Fatima T, Ehness R, Lee TK, Proels R, Tanner W and Roitsch T (2004) Extracellular invertase is an essential component of cytokinin-mediated delay of senescence. The Plant Cell 16: 1276-1287.
Chapter 2- Labellum transcriptome after pollination
152
Larue CT, Wen J and Walker JC (2009) A microRNA–transcription factor module regulates lateral organ size and patterning in Arabidopsis. The Plant Journal 58: 450-463. Le Bras M, Clément M-V, Pervaiz S and Brenne C (2005) Reactive oxygen species and the mitochondrial signaling pathway of cell death. Histology and Histopathology 20: 205-219. Leah R, Kigel J, Svedsen I and Mundy J (1995) Biochemical and molecular characterization of a barley seed β-glucosidase. Journal of Biological Chemistry 270: 15789-15797. Lease KL, Wen J, Li J, Doke JT, Liscum E and Walker JC (2001) A mutant Arabidopsis heterotrimeric G-protein β subunit affects leaf, flower, and fruit development. The Plant Cell 13: 2631-2641. Lebon G, Duchêne E, Brun O and Clément C (2005) Phenology of flowering and starch accumulation in grape (Vitis vinifera L.) cuttings and vines. Annals of Botany 95: 943-948. Lebon G, Wojnarowiez G, Holzapfel B, Fontaine F, Vaillant-Gaveau N and Clément C (2008) Sugar and flowering in the grapevine (Vitis vinifera L.). Journal of experimental Botany 59(10): 2565-2578. Lecain E, Chenivesse X, Spagnolii R and Pompon D (1996) Cloning by metabolic interference in yeast and enzymatic characterization of Arabidopsis thaliana sterol Δ7-reductase. The Journal of Biological Chemistry 271(18): 10866-10873. Lee JK, Bussey KJ, Gwadry FG, Reinhold W, Riddick G, Pelletier SL, Nishizuka S, Szakacs G, Annereau J-P, Shankavaram U, Lababidi S, Smith LH, Gottesman MM and Weinstein JN (2003) Comparing cDNA and oligonucleotide array data: concordance of gene expression across platforms for the NCI-60 cancer cells. Genome Biology 4: R82, 10.1186/gb-2003-4-12-r82. Lee MRF, Winters AL, Scollan ND, Dewhurst RJ, Theodourou MK and Minchin FR (1999) Plant-mediated lipolysis and proteolysis in red clover with different polyphenol oxidase activities. Journal of the Science of Food and Agriculture 84: 1639-1645. Lee JW, Jhun M, Kim JY and Lee J (2008) An optimal choice of window width for LOWESS normalization of microarray data. OR Spectrum 30: 235-248. Lehmann S, Gumy C, Blatter E, Boeffel S, Fricke W and Rentsch D (2011) In planta function of compatible solute transporters of the AtProT family. Journal of Experimental Botany 62(2): 787-796. Lenz R and Zenk MH (1995) Acetyl coenzyme A:salutaridinol-7-O-acetyltransferase from Papaver somniferum plant cell cultures. The enzyme catalyzing the formation of thebaine in morphine biosynthesis. The Journal of Biological Chemistry 270(52): 31091-31096. Lepiniec L, Debeaujon I, Routaboul JM, Baudry A, Pourcel L, Nesi N and Caboche M (2006) Genetics and biochemistry of seed flavonoids. Annual Review of Plant Biology 57: 405-430. Lers A, Khalchitski A, Lomaniec E, Burd S and Green PJ (1998) Senescence-induced RNases in tomato. Plant Molecular Biology 36: 439-449.

Chapter 2- Labellum transcriptome after pollination
153
Lers A, Sonego L, Green PJ and Burd S (2006) Suppression of LX ribonuclease in tomato results in a delay of leaf senescence and abscission. Plant Physiology 142: 710-721. Leung YF and Cavalieri D (2003) Fundamentals of cDNA microarray data analysis. Trends in Genetics 19(11): 649-659. Leverentz MK, Wagstaff C, Rogers HJ, Stead AD, Chanasut U, Silkowski H, Thomas B, Weichert H, Feussner I and Griffiths G (2002) Characterization of a novel lipoxygenase-independent senescence mechanism in Alstroemeria peruviana floral tissue. Plant Physiology 130: 273-283. Li W and Assmann S (1993) Characterization of a G protein-regulated outward K+ current in mesophyll cells of Vicia faba L. Proceedings of the National Academy Sciences USA 90: 262-266. Li Y, Li T, Liu S, Qiu M, Han Z, Jiang Z, Li R, Ying K, Xie Y and Mao Y (2004) Systematic comparison of the fidelity of aRNA, mRNA and T-RNA on gene expression profiling using cDNA microarray. Journal of Biotechnology 107: 19-28. Liang L, Lai Z, Ma W, Zhang Y and Xue Y (2002) AhSL28, a senescence and phosphate starvation-induced S-like RNase gene in Antirrhinum. Biochimica et Biophysica Acta 1579: 64-71. Liang H, Yao N, Song JT, Luo S, Lu H and Greenberg JT (2003) Ceramides modulate programd cell death in plants. Genes & Development 17: 2636-2641. Lida K and Nishimura I (2002) Gene expression profiling by DNA microarray technology. Critical Reviews in Oral Biology and Medicine 13(1): 35-50. Lilley RM and Portis Jr. AR (1990) Activation of ribulose-1,5-bisphosphate carboxylase/oxygenase (Rubisco) by rubisco activase. Effects of some sugar phosphates. Plant Physiology 94: 245-250. Lim PO, Kim HJ and Nam HG (2007) Leaf senescence. Annual Review of Plant Biology 58: 115-136. Lintala M, Allahverdiyeva Y, Kidron H, Piippo M, Battchikova N, Suorsa M, Rintamäki E, Salminen TA, Aro E-M and Mulo P (2007) Structural and functional characterization of ferredoxin-NADP+-oxidoreductase using knock-out mutants of Arabidopsis. The Plant Journal 49: 1041-1052. Lipshutz RJ, Fodour SP, Gingeras TR and Lockhart D (1999) High density synthetic oligonucleotide arrays. Nature Genetics 21: 20-24. Liu J, Xie Y, Ward JM, Diwan BA and Waalkes MP (2003) Toxicogenomic analysis of aberrant gene expression in liver tumors and non-tumorous livers of adult mice exposed in utero to inorganic arsenic. Toxicology Science 77: 249-257. Liu JJ and Ekramoddoullah AK (2006) The family 10 of plant pathogenesis-related proteins: their structure, regulation, and function in response to biotic and abiotic stresses. Physiological and Molecular Plant Pathology 68: 3-13. Liu Q, Zhu Y, Tao H, Wang N and Wang Y (2006) Damage of PSII during senescence of Spirodela polyrrhiza explants under log-day conditions and its prevention by 6- benzyladenine. Journal of Sexual Reproduction 119: 145-152.

Chapter 2- Labellum transcriptome after pollination
154
Liu D and Yu D (2009) MicroRNA (miR396) negatively regulates expression of ceramidase-like genes in Arabidopsis. Progress in Natural Science 19: 781-785. Liu ZJ, Yang XH and Fu Y (2009) SAD, a stearoyl-acyl carrier protein desaturase highly expressed in high-oil maize inbred lines. Russian Journal of Plant Physiology 56(5): 709-715. Liyama K, Lam TBT and Stone BA (1994) Covalent cross-links in the cell wall. Plant Physiology 104: 315-320. Lizardi P, Huang X, Zhu Z, Bray-Ward P, Thomas D and Ward D (1998) Mutation detection and single-molecules counting using isothermal rolling-circle amplification. Nature Genetics 19: 225-232. Llop-Tous I, Barry CS and Grierson D (2000) Regulation of ethylene biosynthesis in response to pollination in tomato flowers. Plant Physiology 123: 971-978. Lorković ZJ (2009) Role of plant RNA-binding proteins in development, stress response and genome organization. Trends in Plant Science 14(4): 229-236. Lu Q, Lu C, Zhang J and Kuang T (2002) Photosynthesis and chlorophyll a fluorescence during flag leaf senescence of field-grown wheat plants. Journal of Plant Physiology 159: 1173-1178. Lu D-P and Christopher DA (2008) Endoplasmic reticulum stress activates the expression of a sub-group of protein disulfide isomerase genes and AtbZIP60 modulates the response in Arabidopsis thaliana. Molecular Genetics and Genomics 280:199-210. Lucheta AR, Silva-Pinhati ACO, Basílio-Palmieri AC, Berger IJ, Freitas-Astúa J and Cristofani M (2007) An in silico analysis of the key genes involved in flavonoid biosynthesis in Citrus sinensis. Genetics and Molecular Biology 30(suppl.3): 819-831. Ma LG, Xu XD, Cui SJ and Sun DY (1999) The presence of a heterotrimeric G protein and its role in signal transduction of extracellular calmodulin in pollen germination and tube growth. Plant Cell 11: 1351-1363. Ma R-C and Oliveira MM (2000) The RNase PD2 gene of almond (Prunus dulcis) represents an evolutionary distinct class of S-like RNase genes. Molecular and General Genetics 263(6): 925-933. McCall AC and Irwin RE (2006) Florivory: the intersection of pollination and herbivory. Ecology Letters 9: 1351-1365. Mahmood T, Safdar W, BH Abbasi and SMS Naqvi (2010) An overview on the small heat shock proteins. African Journal of Biotechnology 9(7): 927-949. Manduchi E, Scearce LM, Brestelli JE, Grant GR, Kaestner, KH and Stoeckert Jr. J (2002) Comparision of different labelling methods for two-channel high-density microarray experiments. Physiology Genomics 10: 169-179. Mao C, Ding W, Wu Y, Yu J, He X, Shou H and Wu P (2007) Overexpression of a NAC-domain protein promotes shoot branching in rice. New Phytologist 176: 288-298. Maqbool A, Abbas W, Rao AQ, Irfan M, Zahur M, Bakhsh A, Riazuddin S and Husnain T (2010) Gossypium arboreum GHSP26 enhances drought tolerance in Gossypium Hirsutum. Biotechnology Progress 26(1): 21-25.
Chapter 2- Labellum transcriptome after pollination
155
Mariani C and Wolters-Arts M (2000) Complex waxes. Plant Cell 12: 1795-1798. Markham JE, Li J, Cahoon EB and Jaworski JG (2006) Separation and identification of major plant sphingolipid classes from leaves. The Journal of Biological Chemistry 281(32): 22684-22694. Marrs KA (1996) The functions and regulation of glutathione S- transferases in plants. Annual Review of Plant Physiology and Plant Molecular Biolology 47: 127-158. Marton MJ, DeRisi JL, Bennett HA, Iyer VR, Meyer MR, Roberts CJ, Stoughton R, Burchard J, Slade D, Dai H, Bassett Jr. DE, Hartwell LH, Brown PO and Friend SH (1998) Drug target validation and identification of secondary drug target effects using DNA microarrays. Nature Medicine 4: 1293-1301. Masuda Y (2011) The role of mitochondrial chaperone tumor necrosis factor- associated protein 1 (TRAP1) in the regulation of apoptosis. Journal of Health Science 57: 1-9. Mattioli R, Marchese D, D’Angeli S, Altamura MM, Costantino P and Trovato M (2008) Modulation of intracellular proline levels affects flowering time and inflorescence architecture in Arabidopsis. Plant Molecular Biology 66: 277-288. Mattioli R, Costantino P and Trovato M (2009) Proline accumulation in plants. Not only stress. Plant Signaling & Behavior 4(11): 1016-1018. Mayer AM and Harel E (1979) Review: polyphenol oxidases in plants. Phytochemistry 18: 193-215. Mayer AM (2006) Polyphenol oxidases in plants and fungi: going places? A review. Phytochemistry 67: 2318-2331. Mayer MJ, Narbad A, Parr AJ, Parker ML, Walton NJ, Mellon FA and Michael AJ (2001) Rerouting the plant phenylpropanoid pathway by expression of a novel bacterial enoyl-CoA hydratase/lyase enzyme function. The Plant Cell 13: 1669-1682. Mazzafera P and Robinson SP (2000) Characterization of polyphenol oxidase in coffee. Phytochemistry 55: 285-296. McClung CR, Hsu M, Painter JE, Gagne JM, Karlsberg SD and Salome PA (2000) Integrated temporal regulation of the photorespiratory pathway. Circadian regulation of two Arabidopsis genes encoding serine hydroxymethyltransferase. Plant Physiology 123: 381-391. McCormack E, Tsai YC and Braam J (2005) Handling calcium signaling: Arabidopsis CaMs and CMLs. Trends in Plant Science 10: 383-389. McKean AL, Ke J, Song J, Che P, Achenbach S, Nikolau BJ and Wurtele ES (2000) Molecular characterization of the non-biotin-containing subunit of 3-methylcrotonyl-CoA carboxylase. The Journal of Biological Chemistry 275(8): 5582-5590. McKinney EC and Meagher RB (1998) Members of the Arabidopsis actin gene family are widely dispersed in the genome. Genetics 149: 663-675. Mea ML, Serafini-Fracassini D and Duca SD (2007) Programd cell death: similarities and differences in animals and plants. A flower paradigm. Amino acids 33: 395-404.

Chapter 2- Labellum transcriptome after pollination
156
Meier I and Gruissem W (1994) Novel conserved sequence motifs in plant G-box binding proteins and implications for interactive domains. Nucleic Acids Research 22(3): 470-478. Melchior F and Kind H (1990) Grapevine stilbene synthase cDNA only slightly differing from chalcone synthase cDNA is expressed in Escherichia coli into a catalytically active enzyme. FEBS Letters 268(1): 17-20. Meng PH, Raynaud C, Tcherkez G, Blanchet S, Massoud K, Domenichini S, Henry Y, Soubigou- Taconnat L, Lelarge- Trouverie C, Saindrenan P, Renou JP and Begounioux C (2009) Crosstalks between myo-Inositol metabolism, programmed cell death and basal immunity in Arabidopsis. PLoS ONE 4(10): e7364, 10.1371/journal.pone.0007364. Meng F, Zhang L, Kang, M, Guo, X and Xu B (2010) Molecular characterization, immunohistochemical localization and expression of a ribosomal protein L17 gene from Apis cerana cerana. Archives of Insect Biochemistry and Physiology 75: 121-138. Mentzen WI, Peng J, Ransom N, Nikolau BJ and Wurtele ES (2008) Articulation of three core metabolic processes in Arabidopsis: fatty acid biosynthesis, leucine catabolism and starch metabolism. BMC Plant Biology 8: 76, 10.1186/1471-2229-8-76. Meyer RC, Goldsbrough PB and Woodson WR (1991) An ethylene-responsive flower senescence-related gene from carnation encodes a protein homologous to glutathione S-transferase. Plant Molecular Biology 17: 227-281. Meyermans H, Morreel K, Lapierre C, Pollet B, De Bruyn A, Busson R, Herdewijn P, Devrees B, Van Beeumen J, Marita JM, Ralph J, Chen C, Burggraeve B, Van Montagu M, Messens E and Boerjan W (2000) Modifications in lignin and accumulation of phenolic glucosides in Poplar xylem upon down-regulation of caffeoyl-Coenzyme A O-methyltransferase, an enzyme involved in lignin biosynthesis. The Journal of Biological Chemistry 275(47): 36899-36909. Mihara H and Esaki N (2002) Bacterial cysteine desulfurases: their function and mechanisms. Applied Microbiology and Biotechnology 60:12-23. Miki-Hirosige H, Yamanaka Y, Nakamura S, Kurata S and Hirano H (2004) Changes of protein profiles during pollen development in Lilium longiflorum. Sexual Plant Reproduction 16: 209-214. Miller JD, Arteca RN, and Pell EJ (1999) Senescence-associated gene expression during ozone-induced leaf senescence in Arabidopsis. Plant Physiology 120: 1015-1023. Mishina TE, Lamb C and Zeier J (2007) Expression of a nitric oxide degrading enzyme induces a senescence program in Arabidopsis. Plant, Cell and Environment 30: 39-52. Mizoguchi T and Coupland G (2000) ZEITLUPE and FKF1: novel connections between flowering time and circadian clock control. Trends in Plant Science 5(10): 409-411. Mocellin S, Rossi CR, Pilati P, Nitti D and Marincola FM (2003) Quantitative real-time PCR: a powerful ally in cancer research. Trends in Molecular Medicine 9(5): 189-195. Mockaitis K and Estelle M (2004) Integrating transcriptional controls for plant cell expansion. Genome Biology 5: 245, 10.1186/gb-2004-5-11-245. Mol J, Grotewold E and Koes R (1998) How genes paint flowers and seeds. Trends in Plant Science 3: 212-217.

Chapter 2- Labellum transcriptome after pollination
157
Montague JW, Hughes FM Jr. and Cidlowski A (1997) Native recombinant cyclophilin A, B, and C degrade DNA independently of peptidyl cis-trans-isomerase activity. The Journal of Biological Chemistry 272: 6677-6684. Morant AV, Jørgensen K, Jørgensen C, Paquette SM, Sánchez-Pérez R, Møller BL and Bak S (2008) β-Glucosidases as detonators of plant chemical defense. Phytochemistry 69: 1795-1813. Morey JS, Ryan JC and Van Dolah FM (2006) Microarray validation: factors influencing correlation between oligonucleotide microarrays and real-time PCR. Biological Procedures Online 8(1): 175-193. Moyle R, Fairbairn DJ, Ripi J, Crowe M and Botella JR (2005) Developing pineapple fruit has a small transcriptome dominated by metallothionein. Journal of Experimental Botany 56: 101-112. Müller GL, Drincovich MF, Andreo CS and Lara MV (2010) Role of photosynthesis and analysis of key enzymes involved in primary metabolism throughout the lifespan of the tobacco flower. Journal of Experimental Botany 61(13): 3675-3688. Muñoz-Bertomeu J, Cascales-Miñana B, Alaiz M, Segura J and Ros R (2010) A critical role of plastidial glycolytic glyceraldehyde-3-phosphate dehydrogenase in the control of plant metabolism and development. Plant Signaling & Behavior 5: 67-69. Murphy D (2002) Gene expression studies using microarrays: principles, problems and prospects. Advances in Physiology Education 26: 256-270. Nadeau JA and O’Neill SD (1995) Nucleotide-sequence of a cDNA encoding 1-aminocyclopropane carboxylate oxidase from senescing orchid petals. Plant Physiology 108: 833-834. Nadeau JA, Zhang XS, Li J and O’Neill SD (1996) Ovule development: identification of stage-specific and tissue-specific cDNAs. The Plant Cell 8: 213-239. Nam KH and Li J (2002) BRI1/BAK1, a receptor kinase pair mediating brassinosteroid signaling. Cell 110: 203-212. Nardmann J and Werr W (2007) The evolution of plant regulatory networks: what Arabidopsis cannot say for itself. Current Opinion in Plant Biology 10: 653-659. Navabpour S, Morris K, Allen R, Harrison E, A-H-Mackerness S and Buchanan-Wollaston V (2003) Expression of senescence-enhanced genes in response to oxidative stress. Journal of experimental Botany 54: 2285-2292. Nawrath C (2006) Unraveling the complex network of cuticular structure and function. Current Opinion in Plant Biology 9: 281-287. Neale AD, Wahleithner JA, Lund M, Bonnett HT, Kelly A, Meeks-Wagner DR, Peacock WL and Dennis ES (1990) Chitinase, β-1,3- glucanase, osmotin, and extensin are expressed in tobacco ex-plants during flower formation. Plant Cell 2: 673-684. Nelson DC, Lasswell J, Rogg LE, Cohen MA and Bartel B (2000) FKF1, a clock-controlled gene that regulates the transition to flowering in Arabidopsis. Cell 101: 331-340. Nelson N and Ben-Shem A (2004) The complex architecture of oxygenic photosynthesis. Nature Reviews Molecular Cell Biology 5: 1-12.

Chapter 2- Labellum transcriptome after pollination
158
Nelson N and Yocum CF (2006) Structure and function of photosystems I and II. Annual Review of Plant Biology 57: 521-565. Neog B, Yadav RNS and Singh ID (2004) Peroxidase, polyphenol oxidase and acid phosphatise activities in the stigma-style tissue of Camellia sinensis (L) O. Kuntze following compatible and incompatible pollination. Journal of the Indian Institute of Science 84: 47-52. Neta-Sharir I, Isaacson T, Lurie S and Weiss D (2005) Dual role for tomato heat shock protein 21: protecting photosystem II from oxidative stress and promoting color changes during fruit maturation. The Plant Cell 17: 1829-1838. Neves SR, Ram PT and Iyengar R (2002) G protein pathways. Science 296(5573): 1636-1639. Ney P and Boland W (1987) Biosynthesis of 1-alkenes in higher plants: a model study with the composite Curthumus tinctovius L. European Journal of Biochemistry 162: 203-211. Nikolau BJ, Ohlrogge JB and Wurtele ES (2003) Plant biotin-containing carboxylases. Archives of Biochemistry and Biophysics 414: 211-222. Nilsen TW, Grayzel J, and Prensky W (1997) Dendritic nucleic acid structures. Journal of Theoretical Biology 187: 273-284. Nilson SE and Assmann SM (2010) Heterotrimeric G proteins regulate reproductive trait plasticity in response to water availability. New Phytologist 185: 734-746. Nishitani C, Shimizu T, Fujii H, Hosaka F, Terakami S, Nakamura Y, Itai A, Yamaguchi-Nakamura A and Yamamoto T (2010) Oligoarray analysis of gene expression in ripening Japanese pear fruit. Scientia Horticulturae 124: 195-203. Noiva R, Freedman RB and Lennarz WJ (1993) Peptide binding to protein disulfide isomerase occurs at a site distinct from the active sites. The Journal of Biological Chemistry 268(26): 19210-13217. Nolan T, Hands RE and Bustin SA (2006). Quantification of mRNA using real-time RT-PCR. Nature Protocols 1(3): 1559-1582. Nomura T, Jager CE, Kitasaka Y, Takeuchi K, Fukami M, Yoneyama K, Matsushita Y, Nyunoya H, Takatsuto S, Fujioka S, Smith JJ, Kerckhoffs LHJ, Reid JB and Yokota T (2004) Brassinosteroid deficiency due to truncated steroid 5α-reductase causes dwarfism in the lk mutant of pea. Plant Physiology 135: 2220-2229. O’Neill SO (1997) Pollination regulation of flower development. Annual Review of Plant Physiology and Plant Molecular Biology 48: 547-574. Oborník M and Green BR (2005) Mosaic origin of the heme biosynthesis pathway in photosynthetic eukaryotes. Molecular Biology and Evolution 22: 2343-2353. Ogiso E, Takahashi Y, Sasaki T, Yano M and Izawa T (2010) The role of casein kinase II in flowering time regulation has diversified during evolution. Plant Physiology 152: 808-812. Ohlrogge J and Browse J (1995) Lipid biosynthesis. The Plant Cell 7: 957-970. Ohlrogge JB and Jaworski JG (1997) Regulation of fatty acid synthesis. Annual Review of Plant Physiology: Plant Molecular Biology 48: 109-136.

Chapter 2- Labellum transcriptome after pollination
159
Okada K and Shimura Y (1994) Genetic analyses of signalling in flower development using Arabidopsis. Plant Molecular Biology 26: 1357-1377. Oksman-Caldentey KM, Häkkinen SV and Rischer H (2007) Chapter 4: Metabolic engineering of the alkaloids biosynthesis in plants: functional genomics approaches. In: Verpoorte R, Alferman AW and Johnson TS. Applications of Plant Metabolic Engineering, eds. Springer, pp.109-127. Oleksiak MF, Kolell KJ and Douglas L (2001) Utility of natural populations for microarray analyses: isolation of genes necessary for functional genomic studies. Crawford Marine Biotechnology 3: S203-S211. Olsen AN, Ernst HA, Leggio LL and Skriver K (2005) NAC transcription factors: structurally distinct, functionally diverse. Trends in Plant Science 10(2): 79-87. Ondzighi CA, Christopher DA, Cho EJ, Chang SC and Staehelin LA (2008) Arabidopsis protein disulfide isomerase-5 inhibits cysteine proteases during trafficking to vacuoles before programd cell death of the endothelium in developing seeds. The Plant Cell 20: 2205-2220. Opassiri R, Cairns JRK, Akiyama T, Wara- Aswapati O, Svasti J and Esen A (2003) Characterization of a rice β-glucosidase highly expressed in flower and germinating shoot. Plant Science 165: 627-638. Orruño E, Apenten RW and Zabetakis I (2001) The role of β-glucosidase in the biosynthesis of 2,5-dimethyl-4-hydroxy-3(2H)-furanone in strawberry (Fragaria ananassa cv. Elsianta). Flavour and Fragrance Journal 16: 81-84. Orzechowski S (2008) Starch metabolism in leaves. Acta Biochimica Polonica 55(3): 435-445. Panavas T, LeVangie R, Mistler J, Reid PD and Rubinstein B (2000) Activities of nucleases in senescing daylily petals. Plant Physiology and Biochemistry 38: 837-843. Park HG, Song JY, Park KH and Kim MH (2006) Fluorescence-based assay formats and signal amplification strategies for DNA microarray analysis. Chemical Engineering Science 61: 954-965. Park JM, Whang SS, So S, Lim PO, Lee HY and Koo JC (2010) Identification of differentially expressed genes in flower buds of Calanthe discolor and C. sieboldii. Journal of Plant Biology 53: 24-31. Passarinho PA and de Vries SC (2002) Arabidopsis chitinases: a genomic survey. The Arabidopsis Book 1: e0023, 10.1199/tab.0023. Pata MO, Hannun YA and Ng CKY (2010) Plant sphingolipids: decoding the enigma of the Sphinx. New Phytologist 185: 611-630. Patra HK and Mishra D (1979) Pyrophosphatases, peroxidise and polyphenoloxidase during leaf development and senescence. Plant Physiology 63: 318-323. Paulus HF and Gack C (1990) Pollination of Ophrys (Orchidaceae) in Cyprus. Plant Systematics and Evolution 169: 177-207. Peer WA and Murphy AS (2007) Flavonoids and auxin transport: modulators or regulators? Trends in Plant Science 12: 556-563.

Chapter 2- Labellum transcriptome after pollination
160
Peškan-Berghöfer T, Neuwirth J, Kusnetsov V and Oelmüller R (2005) Suppression of heterotrimeric G-protein β- subunit affects anther shape, pollen development and inflorescence architecture in tobacco. Planta 220: 737-746. Picault N, Hodges M, Palmieri L and Palmieri F (2004) The growing family of mitochondrial carriers in Arabidopsis. Trends in Plant Science 9(3): 138-146. Pilon M, Abdel-Ghany SE, Van Hoewyk D, Ye H and Pilon-Smits EA (2006) Biogenesis of iron-sulfur cluster proteins in plastids. Genetic Engineering (NY) 27: 101-117. Pilon-Smits EAH and Pilon M (2007) Chapter 19: Sulfur metabolism in plastids In: Wise RR and Hoober JK. The Structure and Function of Plastids, Springer eds. pp. 387-402. Pistelli L, De Bellis L and Alpi A (1991) Peroxisomal enzyme activities in attached senescing leaves. Planta 184: 151-153. Poirier Y, Antonenkov VD, Glumoff T and Hiltunen JK (2006) Peroxisomal β-oxidation- A metabolic pathway with multiple functions. Biochimica et Biophysica Acta 1763: 1413-1426. Porat R, Borochov A, Halevy AH and O’Neill SD (1994) Pollination induced senescence of Phalaenopsis petals- the wilting process, ethylene production and sensitivity to ethylene. Plant Growth Regulation 15: 129-136. Porat R, Reiss N, Atzorn R, Halevy AH and Borochov A (1995) Examination of the possible involvement of lipoxygenase and jasmonates in pollination-induced senescence of Phalaenopsis and Dendrobium orchid flowers. Physiologia Plantarum 94(2): 205-210. Post-Beittenmiller D (1996) Biochemistry and molecular biology of wax production in plants. Annual Review of Plant Physiology: Plant Molecular Biology 47: 405-430. Poulton JE (1990) Cyanogenesis in plants. Plant Physiology 94: 401-405. Preisig-Müller R, Gnau P and Kindl H (1995) The inducible 9, 10-dihydrophenanthrene pathway: characterization and expression of bibenzyl synthase and S-adenosylhomocysteine hydrolase. Archives of Biochemistry and Biophysics 317: 201-207. Preisig-Müller R, Gehlert R, Melchior F, Stietz U and Kindl H (1997) Plant polyketide synthases leading to stilbenoids have a domain catalyzing malonyl-CoA:CO2 exchange, malonyl-CoA decarboxylation, and covalent enzyme modification and a site for chain lengthening. Biochemistry 36(27): 8349-8358. Preiss T and Hentze MW (2003) Starting the protein synthesis machine: eukaryotic translation initiation. BioEssays 25: 1201-1211. Price AM, Orellana DFA, Salleh FM, Stevens R, Acock R, Buchanan-Wollaston V, Stead AD and Rogers HJ (2008) A comparison of leaf and petal senescence in wallflower reveals common and distinct patterns of gene expression and physiology. Plant Physiology 147: 1898-1912. Puská LG, Zvara A, Hackler LJr, Micsik T and van Hummelen P (2002) RNA amplification results in reproducible microarray data with slight ratio bias. BioTechniques, 32(6): 1330-1340. Pye VE, Christensen CE, Dyer JH, Arent S and Henriksen A (2010) Peroxisomal plant 3-ketoacyl-CoA thiolase structure and activity are regulated by a sensitive redox switch. The Journal of Biological Chemistry 285: 24078-24088.

Chapter 2- Labellum transcriptome after pollination
161
Rabl J, Leibundgut M, Ataide SF, Haag A and ban N (2011) Crystal structure of the eukaryotic 40S ribosomal subunit in complex with initiation factor 1. Science 331(331): 10.1126/science.119830. Rajan VBV and D’Silva P (2009) Arabidopsis thaliana J-class heat shock proteins: cellular stress sensors. Functional & Integrative Genomics 9: 433-446. Rajeevan MS, Dimulescu IM, Unger ER and Vernon SD (1999) Chemiluminescent analysis of gene expression on high-density filter arrays. The Journal of Histochemistry and Cytochemistry 47(3): 337-342. Ranty B, Aldon D and Galaud JP (2006) Plant calmodulins and calmodulin-related proteins. Plant Signaling & Behavior 1: 96-104. Ranz JM and Machado CA (2006) Uncovering evolutionary patterns of gene expression using microarrays. Trends in Ecology and Evolution 21(1): 29-37. Rayle DL and Cleland RE (1992) The acid growth theory of auxin-induced cell elongation is alive and well. Plant Physiology 99: 1271-1274. Reape TJ and McCabe PF (2010) Apoptotic-like regulation of programmed cell death in plants. Apoptosis 15: 249-256. Reddy AR, Ramakrishna W, Sekhar CA, Nagabhushana I, Babu PR, Bonaldo MF, Soares MB and Bennetzen JL (2002) Novel genes are enriched in normalized cDNA libraries from drought stressed seedlings of rice (Oryza sativa L. subsp. Indica cv. Nagina 22). Genome 45: 204-211. Renger G (2010) The light reactions of photosynthesis. Current Science 98(10): 1305-1319. Rentsch D, Hirner B, Schmelzer E and Frommer WB (1996) Salt stress-induced proline transporters and salt stress-repressed broad-specificity amino-acid permeases identified by suppression of a yeast amino-acid permease- targeting mutant. The Plant Cell 8: 1437-1446. Reumann S, Quan S, Aung K, Yang P, Manandhar-Shrestha K, Holbrook D, Linka N, Switzenberg R, Wilkerson CG, Weber APM, Olsen LJ and Hu J (2009) In-depth proteome analysis of Arabidopsis leaf peroxisomes combined with in vivo subcellular targeting verification indicates novel metabolic and regulatory functions of peroxisomes. Plant Physiology 150: 125-143. Reuveni M, Sagi Z, Evnor D and Hetzroni A (1999) β-Glucosidase activity is involved in scent production in Narcissus flowers. Plant Science 147: 19-24. Reuveni M, Evenor D, Artzi B, Perl A and Erner Y (2001) Decrease in vacuolar pH during petunia flower opening is reflected in the activity of tonoplast H+-ATPase. Journal of Plant Physiology 158: 991-998. Riechmann JL, Heard J, Martin G, Reuber L, Jiang C, Keddie J, Adam L, Pineda O, Ratcliffe OJ, Samaha RR, Creelman R, Pilgrim M, Broun P, Zhang JZ, Ghandehari D, Sherman BK and Yu G (2000) Arabidopsis transcription factors: genome-wide comparative analysis among eukaryotes. Science 290: 2105-2110. Rodrigo J, Hormaza JI and Herrero M (2000) Ovary starch reserves and flower development in apricot (Prunus armeniaca). Physiologia Plantarum 108: 35-41.

Chapter 2- Labellum transcriptome after pollination
162
Romero L and Lam E (1993) Guanine nucleotide binding protein involvement in early steps of phytochrome-regulated gene expression. Proceedings of the National Academy of Sciences USA 90:1465-1469. Rosenzweig BA, Pine PS, Domon OE, Morris SM, Chen JJ and Sistare FD (2004) Dye-Bias correction in dual-labeled cDNA microarrays expression measurements. Environmental Health Perspectives 112: 480-487. Rubinstein B (2000) Regulation of cell death in flower petals. Plant Molecular Biology 44: 303-318. Ruepp A, Zollner A, Maier D, Albermann K, Hani J, Mokrejs M, Tetko I, Güldener U, Mannhaupt G, Münsterkötter M and Mewes HW (2004) The FunCat, a functional annotation scheme for systematic classification of proteins from whole genomes. Nucleic Acids Research 32(18): 5539-5545. Ruokolainen S, Ng YP, Broholm SK, Albert VA, Elomaa P and Teeri TH (2010) Characterization of SQUAMOSA-like genes in Gerbera hybrida, including one involved in reproductive transition. BMC Plant Biology 10: 128, 10.1186/1471-2229-10-128. Sablowski RWM, Moyano E, Culianez-Macia FA, Schuch W, Martin C and Bevan M (1994) A flower-specific Myb protein activates transcription of phenylpropanoid biosynthetic genes. The EMBO Journal 13(1): 128-137. Salinas-Mondragon RE, Garciduenas-Pina C and Guzman P (1999) Early elicitor induction in members of a novel multigene family coding for highly related RING-H2 proteins in Arabidopsis thaliana. Plant Molecular Biology 40: 579-590. Sambrook J, Fritsch EF and Maniatis T (1989) Molecular cloning: a laboratory manual. Cold Spring Harbor Laboratory Press. Cold Spring Harbor, New York. Sampedro J and Cosgrove DJ (2005) The expansin superfamily. Genome Biology 6: 242, 10.1186/gb-2005-6-12-242. Sanchez AM, Bosch M, Bots M, Nieuwland J, Feron R and Mariani C (2004) Pistil factors controlling pollination. The Plant Cell 16: S98-S106. Sandhoff K and Kolter T (2003) Biosynthesis and degradation of mammalian glycosphingolipids. Philosophical Transactions of the Royal Society B: Biological Sciences 358: 847-861. Sanger F, Nicklen S and Coulson AR (1977) DNA sequencing with chain-terminating inhibitors. Proceedings of the National Academy of Sciences USA 74(12): 5463-5467. Santner A and Estelle M (2010) The ubiquitin- proteasome system regulates plant hormone signaling. The Plant Journal 61: 1029-1040. Santos S, Machado OLT, Da Cunha M and Gomes VM (2004) A chitinase from Adenanthera pavonina L. seeds: purification, characterization and immunolocalization. Plant Science 167: 1203-1210. Sasanuma I and Hirakawa G (2010) Purification and characterization of a β-glucosidase from the root parasitic plant Orobanche minor SM. Bioscience, Biotechnology and Biochemistry 74(3): 646-648. Šášik R, Woelk CH and Corbeil J (2004) Microarray truths and consequences. Journal of Molecular Endocrinology 33: 1-9.
Chapter 2- Labellum transcriptome after pollination
163
Sato F, Hashimoto T, Hachiya A, Tamura KI, Choi KB, Morishige T, Fujimoto H and Yamada Y (2001) Metabolic engineering of plant alkaloid biosynthesis. Proceedings of the National Academy of Sciences USA 98(1): 367-372. Sawa M, Nusinow DA, Kay SA and Imaizumi T (2007) FKF1 and GIGANTEA complex formation is required for day-length measurement in Arabidopsis. Science 318: 261-265. Schäfer H and Wink M (2009) Medicinally important secondary metabolites in recombinant microorganisms or plants: progress in alkaloid biosynthesis. Biotechnology Journal 4: 1684-1703. Schaller H (2003) The role of sterols in plant growth and development. Progress in Lipid Research 42: 163-175. Schaller H (2004) New aspects of sterol biosynthesis in growth and development of higher plants. Plant Physiology and Biochemistry 42: 465-476. Scheidig A, Fröhlich A, Schulze S, Lloyd JR and Kossmann J (2002) Down regulation of a chloroplast-targeted β-amylase leads to a starch-excess phenotype in leaves. Plant Journal 30: 581-591. Schena M, Shalon D, Davis RW and Brown PO (1995) Quantitative monitoring of gene expression patterns with a complementary DNA microarray. Science 270: 467-470. Schena M (1996) Genome analysis with gene expression microarrays. Bioessays 18: 427-431. Schenk G, Korsinczky MLJ, Hume DA, Hamilton S and DeJersey J (2000) Purple acid phosphatases from bacteria: similarities to mammalian and plant enzymes. Gene 255: 419-424. Schiestl FP, Ayasse M, Paulus HF, Erdmann D and Francke W (1997) Variation of floral scent emission and postpollination changes in individual flowers of Ophrys sphegodes subsp. sphegodes. Journal of Chemical Ecology 23(12): 2881-2895. Schiestl FP, Ayasse M, Paulus HF, Löfstedt C, Hansson BS, Ibarra F and Francke W (2000) Sex pheromone mimicry in the early spider orchid (Ophrys sphegodes): patterns of hydrocarbons as the key mechanism for pollination by sexual deception. Journal of Comparative Physiology A 186: 567-574. Schiestl FP and Ayasse M (2001) Post-pollination emission of a repellent compound in a sexually deceptive orchid: a new mechanism for maximising reproductive success? Oecologia 126: 531-534. Schiestl FP and Ayasse M (2002) Do changes in floral odour cause speciation in sexually deceptive orchids? Plant Systematics and Evolution 234: 111-119. Schiestl FP (2005) On the success of a swindle: pollination by deception in orchids Naturwissenschaften 92: 255-264. Schlüter PM and Schiestl FP (2008) Molecular mechanisms of floral mimicry in orchids. Trends in Plant Science 13(5): 228-235. Schlüter PM, Xu S, Gagliardini V, Whittle E, Shanklin J, Grossniklaus U and Schiestl FP (2011) Stearoyl-acyl carrier protein desaturases are associated with floral isolation in sexually deceptive orchids. Proceedings of the National Academy of Sciences USA, 10.1073/pnas.1013313108.

Chapter 2- Labellum transcriptome after pollination
164
Schneider K, Hövel K, Witzel K, Hamberger B, Schomburg D, Kombrink E and Stuible H-P (2003) The substrate specificity-determining amino acid code of 4-coumarate:CoA ligase. Proceedings of the National Academy of Sciences USA 100(14): 8601-8606. Schöppner A and Kindl H (1984) Purification and properties of a stilbene synthase from induced cell suspension cultures of peanut. The Journal of Biological Chemistry 259(11): 6806-6811. Schulze A and Downward J (2001) Navigating gene expression using microarrays — a technology review. Nature Cell Biology 3: E190-E195. Schwacke R, Grallath S, Breitkreuz KE, Stransky E, Stransky H, Frommer WB and Rentsch D (1999) LeProT1, a transporter for proline, glycine betaine, and γ-amino butyric acid in tomato pollen. The Plant Cell 11: 377-391. Schwarz-Sommer Z, Huijser P, Nacken W, Sadler H and Sommer H (1990) Genetic control of flower development by homeotic genes in Antirrhinum majus. Science 250(4983): 931-936. Sebastiana M, Figueiredo A, Acioli B, Sousa L, Pessoa F, Balde A and Pais MS (2009) Identification of genes involved on the initial contact between ectomycorrhizal symbionts (Castanea sativa- European chestnut and Pisolithus tinctorius). European Journal of Soil Biology 45: 275-282. Setyadjit, Joyce DC, Irving DE and Simons DH (2004) Development and senescence of Grevillea ‘Sylvia’ inflorescences, flowers and flower parts. Plant Growth Regulation 44: 133-146. Shah J (2005) Lipids, lipases and lipid- modifying enzymes in plant disease resistance. Annual Review of Phytopathology 43: 229-260. Shanklin J and Cahoon EB (1998) Desaturation and related modifications of fatty acids. Annual Review of Plant Physiology: Plant Molecular Biology 49: 611-641. Shargool D, Jain JC and McKay G (1988) Ornithine biosynthesis, and arginine biosynthesis and degradation in plant cells. Phytochemistry 27(6): 1571-1574. Sheen SJ (1973) Changes in amount of polyphenols and activity of related enzymes during growth of tobacco flower and capsule. Plant Physiology 51: 839-844. Shi L, Bielawski J, Mu J, Dong H, Teng C, Zhang J, Yang X, Tomishige N, Hanada K, Hannun YA and Zuo J (2007) Involvement of sphingoid bases in mediating reactive oxygen intermediate production and programmed cell death in Arabidopsis. Cell Research 17: 1030-1040. Shipway AN, Katz E and Willner I (2000) Nanoparticle arrays on surfaces for electronic, optical, and sensor applications. Chemphyschemistry 1: 18-52. Silver N, Best S, Jiang J and Thein SL (2006) Selection of housekeeping genes for gene expression studies in human reticulocytes using real-time PCR. BMC Molecular Biology 7: 33, 10.1186/1471-2199-7-33. Simões I and Faro C (2004) Structure and function of plant aspartic proteinases. European Journal of Biochemistry 271: 2067-2075. Singh A, Giri J, Kapoor S, Tyagi AK and Pandey GK (2010) Protein phosphatase complement in rice: genome-wide identification and transcriptional analysis under

Chapter 2- Labellum transcriptome after pollination
165
abiotic stress conditions and reproductive development. BMC Genomics 11: 435, 10.1186/1471-2164-11-435. Skinner DJ, Hill TA and Gasser CS (2004) Regulation of ovule development. The Plant Cell 16: S32-S45; 10.1105/tpc.015933. Slocum RD (2005) Genes, enzymes and regulation of arginine biosynthesis in plants. Plant Physiology and Biochemistry 43: 729-745. Smalle J and Viestra RD (2004) The ubiquitin 26S proteasome proteolytic pathway. Annual Review of Plant Biology 55: 555-590. Smith AM, Zeeman SC and Smith SM (2005) Starch degradation. Annual Review of Plant Biology 56: 73-98. Smyth GK and Speed TP (2003) Normalization of cDNA microarray data. Methods 31: 265-273. Somers DE, Devlin PF and Kay SA (1998) Phytochromes and cryptochromes in the entrainment of the Arabidopsis circadian clock. Science 282: 1488-1490. Souer E, van Houwelingen A, Kloos D, Mol J and Koes R (1996) The No Apical Meristem gene of Petunia Is required for pattern Formation in embryos and flowers and is expressed at meristem and primordia boundaries. Cell 85: 159-170. Sparvoli F, Martin C, Scienza A, Gavazzi G and Tonelli C (1994) Cloning and molecular analysis of structural genes involved in flavonoid and stilbene biosynthesis in grape (Vitis vinifera L.). Plant Molecular Biology 24: 743-755. Sperling P and Heinz E (2003) Plant sphingolipids: structural diversity, biosynthesis, first genes and functions. Biochimica et Biophysica Acta 1632: 1-15. Spurgeon SL, Jones RC and Ramakrishnan R (2008) High throughput gene expression measurement with real time PCR in a microfluidic dynamic array. PLoS ONE 3(2): e1662, 10.1371/journal.pone.0001662. Staiger CJ, Goodbody KC, Hussey PJ, Valenta R, Drobak BJ and Lloyd CW (1993) The profilin multigene family of maize: differential expression of three isoforms. The Plant Journal 4: 631-641. Stears RL, Getts RC, and Gullans SR (2000) A novel, sensitive detection system for high-density microarrays using dendrimer technology. Physiology Genomics 3: 93-99. Stewart RJ, Sawyeer BJB, Bucheli CS and Robinson SP (2001) Polyphenol oxidase is induced by chilling and wounding in pineapple. Australian Journal of Plant Physiology 28(3): 181-191. Stintzing FC and Carle R (2004) Functional properties of anthocyanins and betalains in plants, food, and in human nutrition. Trends in Food Science and Technology 15: 19-38. Stone JM, Liang X, Nekl ER and Stiers JJ (2005) Arabidopsis AtSPL14, a plant-specific SBP-domain transcription factor, participates in plant development and sensitivity to fumonisin B1. The Plant Journal 41: 744-754. Storey JD and Tibshirani R (2003) Statistical significance for genomewide studies. Proceeding of the National Academy of Sciences USA 100: 9440-9445.

Chapter 2- Labellum transcriptome after pollination
166
Strack D, Busch E and Klein E (1989) Anthocyanin patterns in European orchids and their taxonomic and phylogenetic relevance. Phytochemistry 28: 2127–2139. Stránská J, Kopečný D, Tylichowá M, Snégaroff J and Šebela M (2008) Ornithine δ-aminotransferase: an enzyme implicated in salt tolerance in higher plants. Plant Signaling & Behavior 3: 929-935. Stuible H-P and Kombrink E (2001) Identification of the substrate specificity-conferring amino acid residues of 4-coumarate:Coenzyme A ligase allows the rational design of mutant enzymes with new catalytic properties. The Journal of Biological Chemistry 276(29): 26893-26897. Sturaro M, Hartings H, Schmelzer E, Velasco R, Salamini F and Motto M (2005) Cloning and characterization of GLOSSY1, a maize gene involved in cuticle membrane and wax production. Plant Physiology 138: 478-489. Suja G and Parida A (2008) Isolation and characterization of photosystem 2 PsbR gene and its promoter from drought-tolerant plant Prosopis juliflora. Photosynthetica 46(4): 525-530. Sundberg E and Østergaard L (2009) Distinct and dynamic auxin activities during reproductive development. Cold Spring Harbor Perspectives in Biology 1: a001628, 10.1101/cshperspect.a001628. Suorsa M, Sirpiö S, Allahverdiyeva Y, Paakkarinen V, Mamedov F, Styring S and Aro E-M (2006) PsbR, a missing link in the assembly of the oxygen-evolving complex of plant Photosystem II. The Journal of Biological Chemistry 281(1): 145-150. Suzek BE, Huang H, McGarvey P, Mazumder R and Wu CH (2007) UniRef: comprehensive and non-redundant UniProt reference clusters. Bioinformatics 23: 1282-1288. Suzuki S, Sakakibara N, Li L, Umezawa T and Chiang VL (2010) Profiling of phenylpropanoid monomers in developing xylem tissue of transgenic aspen (Populus tremuloides). Journal of Wood Science 56: 71-76. Swarbreck D, Wilks C, Lamesch P, Berardini TZ, Garcia-Hernandez M, Foerster H, Li D, Meyer T, Muller R, Ploetz L, Radenbaugh A, Singh S, Swing V, Tissier C, Zhang P and Huala E (2008) The Arabidopsis Information Resource (TAIR): gene structure and function annotation. Nucleic Acids Research 36: D1009-D1014. Szabados L and Savouré A (2010) Proline: a multifunctional amino acid. Trends in Plant Science 15(2): 89-97. Szabó I, Bergantino E and Giacometti GM (2005) Light and oxygenic photosynthesis: energy dissipation as a protection mechanism against photo-oxidation. EMBO Reports 6(7): 629-634. Taiz L and Zieger E (1998) Plant defences: surface protectants and secondary metabolites. In: Plant Physiology 2nd Ed. Sinauer Associates, Inc., Sunderland, pp 347-376. Takahashi S, Bauwe H and Badger M (2007) Photoinhibition of photosystem II by suppression of repair but not acceleration of damage processes in Arabidopsis. Plant Physiology 144: 487-494. Takakura Y, Ito T, Saito H, Inoue T, Komari T and Kuwata S (2000) Flower-predominant expression of a gene encoding a novel class I chitinase in rice (Oryza sativa L.). Plant Molecular Biology 42(6): 883-897.
Chapter 2- Labellum transcriptome after pollination
167
Tam PPC, Barrette-Ng IH, Simon DM, Tam MWC, Ang AL and Muench DG (2010) The Puf family of RNA-binding proteins in plants: phylogeny, structural modeling, activity and subcellular localization. BMC Plant Biology 10:44; 10.1186/1471-2229-10-44. Tamagnone L, Merida A, Parr A, Mackay S, Culianez-Macia FA, Roberts K and Martina C (1998) The AmMYB308 and AmMYB330 transcription factors from Antirrhinum regulate phenylpropanoid and lignin biosynthesis in transgenic tobacco. The Plant Cell 10: 135-154. Tanaka R and Tanaka A (2007) Tetrapyrrole biosynthesis in higher plants. Annual Review of Plant Biology 58: 321-346. Tang X, Gomes AM, Bhatia A and Woodson WR (1994) Pistil specific and ethylene-regulated expression of 1-aminocyclopropane- 1-carboxylate oxidase genes in petunia flowers. Plant Cell 6: 1227-1239. Tao N-g, Ye J-l and deng X-x (2006) Cloning and characterization of a novel cDNA encoding Late Embryogenesis-Abundant protein 5 like (LEA-5) gene from Cara Cara navel orange fruit (Citrus sinensis Osbeck). Agriculture Sciences in China 5(4): 272-276. Taylor CB, Bariola PA, Del Cardayre SB, Raines RT and Green PJ (1993) RNS2: a senescence-associated RNase of Arabidopsis that diverged from the S-RNase before speciation. Proceedings of the National Academy of Sciences USA 90: 5118-5122. Taylor LP and Jorgensen R (1992) Conditional male-fertility in chalcone synthase-deficient petunia. Journal of Heredity 83: 11-17. Taylor NL, Howell KA, Heazlewood JL, Tan TYW, Narsai R, Huang S, Whelan J and Millar AH (2010) Analysis of the rice mitochondrial carrier family reveals anaerobic accumulation of a basic amino acid carrier involved in arginine metabolism during seed germination. Plant Physiology 154: 691-704. The Arabidopsis Initiative (2000) Analysis of the genome sequence of the flowering plant Arabidopsis thaliana. Nature 408: 796-815. Theis N (2006) Fragrance of canada thistle (Cirsium arvense) attracts both floral herbivores and pollinators. Journal of Chemical Ecology. 32: 917-927. Thipyapong P, Stout MJ and Attajarusit J (2007) Functional analysis of polyphenol oxidases by antisense/sense technology. Molecules 12: 1569-1595. Thiruvengadam M and Yang CH (2009) Ectopic expression of two MADS box genes from orchid (Oncidium Gower Ramsey) and lily (Lilium longiflorum) alters flower transition and formation in Eustoma grandiflorum. Plant Cell Reports 28: 1463-1473. Thomas H, Ougham HJ, Wagstaff C and Stead AD (2003) Defining senescence and death. Journal of Experimental Botany 54(385): 1127-1132. Thomas B (2006) Light signals and flowering. Journal of Experimental Botany 57(13): 3387-3393. Tiwari BS, Belenghi B and Levine A (2002) Oxidative stress increased respiration and generation of reactive oxygen species, resulting in ATP depletion, opening of mitochondrial permeability transition, and programmed cell death, Plant Physiology 128: 1271-1281.

Chapter 2- Labellum transcriptome after pollination
168
Todd J, Post-Beittenmiller D and Jaworski JG (1999) KCS1 encodes a fatty acid elongase 3-ketoacyl-CoA synthase affecting wax biosynthesis in Arabidopsis thaliana. The Plant Journal 17(2): 119-130. Todd CD and Polacco JC (2006) AtAAH encodes a protein with allantoate amidohydrolase activity from Arabidopsis thaliana. Planta 223: 1108-1113. Todd CD, Tipton PA, Blevins DG, Piedras P, Pineda M and Polacco JC (2006) Update on ureide degradation in legumes. Journal of Experimental Botany 57(1): 5-12. Traven A, Lo TL, Lithgow T and Heierhorst J (2010) The yeast PUF protein Puf5 has Pop2-independent roles in response to DNA replication stress. PLoS ONE 5(5): e10651, 10.1371/journal.pone.0010651. Treutter D (2005) Significance of flavonoids in plant resistance: a review. Plant Biology 7: 581-591. Tripathi SK and Tuteja N (2007) Integrated signaling in flower senescence: an overview. Plant Signaling & Behavior 2(6): 437-445. Trovato M, Mattioli R and Costantino P (2008) Multiple roles of proline in plant stress tolerance and development. Rendiconti Lincei 19: 325-346. Tsai W-C, Hsiao Y-Y, Lee S-H, Tung C-W, Wang D-P, Wang H-C, Chen W-H and Chen H-H (2006) Expression analysis of the ESTs derived from the flower buds of Phalaenopsis equestris. Plant Science 170: 426-432. Tseng GC, Oh MK, Rohlin L, Liao JC and Wong WH (2001) Issues in cDNA microarray: quality filtering, channel normalization, models of variations and assessment of gene effects. Nucleic Acids Research 29: 2549-2557. Tunnacliffe A and Wise MJ (2007) The continuing conundrum of LEA proteins. Naturwissenschaften 94: 791-812. Tusher VG, Tibshirani R and Chu G (2001) Significance analysis of microarrays applied to the ionizing radiation response. Proceedings of National Academy of Science USA 98: 5116-5121. Udvardi MK, Czechowski T and Scheible W (2008) Eleven golden rules of quantitative RT-PCR. The Plant Cell 20: 1736-1737. Upchurch RG (2008) Fatty acid unsaturation, mobilization, and regulation in the response of plants to stress. Biotechnology Letters 30: 967-977. Uphoff W (1979) Anthocyanins in the flowers of European orchids. Experientia 35: 1013-1014. Valasek MA and Repa JJ (2005) the power of real-time PCR. Advances in Physiology Education 29: 151-159. Valjakka M, Luomala E-M, Kangasjärvi J and Vapaavuori E (1999) Expression of photosynthesis- and senescence-related genes during leaf development and senescence in silver birch (Betula pendula) seedlings. Physiologia Plantarum106: 302-310.

Chapter 2- Labellum transcriptome after pollination
169
van der Hoorn RAL, Leeuwenburgh MA, Bogyo M, Joosten MHAJ and Peck SC (2004) Activity profiling of papain-like cysteine proteases in plants. Plant Physiology 135: 1170-1178. van der Meer IM, Spelt CE, Mol JN and Stuitje AR (1990) Promoter analysis of the chalcone synthase (chsA) gene of Petunia hybrida: a 67 bp promoter region directs flower-specific expression. Plant Molecular Biology 15(1): 95-109. van Doorn WG, Balk PA, van Houwelingen AM, Hoeberichts FA, Hall RD, Vorst O, van der Schoot C and van Wordragen MF (2003) Gene expression during anthesis and senescence in Iris flowers. Plant Molecular Biology 53: 845-863. van Doorn WG (2004) Is petal senescence due to sugar starvation? Plant Physiology 134: 35-42. van Doorn WG and Wolterin EJ (2008) Physiology and molecular biology of petal senescence. Journal of Experimental Botany 59(3): 453-480. van Hoewyk D, Abdel-Ghany SE, Cohu CM, Herbert SK, Kugrens P, Pilon M and Pilon-Smits EAH (2007) Chloroplast iron-sulfur cluster protein maturation requires the essential cysteine desulfurase CpNifS. Proceedings of National Academy of Science USA 104(13): 10.1073/pnas.0700774104. van Hoewyk D, Pilon M and Pilon-Smits EAH (2008) The functions of NifS-like proteins in plant sulfur and selenium metabolism. Plant Science 174: 117-123. van Rensen JJ and Curwiel VB (2000) Multiple functions of photosystem III. Indian Journal of Biochemistry & Biophysics 37(6): 377-382. VanGuilder HD, Vrana KE and Freeman WM (2008) Twenty-five years of quantitative PCR for gene expression analysis. Biotechniques 44(5): 619-626. Vaquerizas JM, Dopazo J and Díaz-Uriarte R (2004) DNMAD: web-based Diagnosis and Normalization for MicroArray Data. Bioinformatics 20(18): 3656-3658. Varotto C, Pesaresi P, Jahns P, Le nick A, Tizzano M, Schiavon F, Salamini F and Leister D (2002) Single and double knockouts of the genes for photosystem I subunits G, K, and H of Arabidopsis. Effects on photosystem I composition, photosynthetic electron flow, and state transitions. Plant Physiology 129: 616-624. Verbruggen N and Hermans C (2008) Proline accumulation in plants: a review. Amino Acids 35: 753-759. Versari A, Parpinello GP, Tornielli GB, Ferrarini R and Giulivo C (2001) Stilbene compounds and stilbene synthase expression during ripening, wilting, and UV rreatment in grape cv. Corvina. Journal of Agricultural and Food Chemistry 49: 5531-5536. Vialette-Guiraud ACM, Adam H, Finet C, Jasinski S, Jouannic S and Scut CP (2011) Insights from ANA-grade angiosperms into the early evolution of CUP-SHAPED COTYLEDON genes. Annals of Botany, 10.1093/aob/mcr024. Vierstra RD (2003) The ubiquitin/26S proteasome pathway, the complex last chapter in the life of many plant proteins. Trends in Plant Science 8(3): 135-142. Voll LM, Jamai A, Renné P, Voll H, McClung CR and Weber APM (2006) The photorespiratory Arabidopsis shm1 mutant is deficient in SHM1. Plant Physiology 140: 59-66.

Chapter 2- Labellum transcriptome after pollination
170
von Wettstein-Knowles P (2007) Analyses of barley spike mutant waxes identify alkenes, cyclopropanes and internally branched alkanes with dominating isomers at carbon 9. The Plant Journal 49: 250-264. Wagner RE, Mugnaini S, Sniezko R, Hardie D, Poulis B, Nepi M, Pacini E and von Aderkas P (2007) Proteomic evaluation of gymnosperm pollination drop proteins indicates highly conserved and complex biological functions. Sexual Plant Reproduction 20: 181-189. Wagner A, Donaldson L, Kim H, Phillips L, Flint H, Steward D, Torr K, Koch G, Schmitt U and Ralph J (2009) Suppression of 4-coumarate-CoA ligase in the coniferous gymnosperm Pinus radiate. Plant Physiology 149: 370-383. Wagstaff C, Bramke I, Breeze E, Thornber S, Harrison E, Thomas B, Buchanan-Wollaston V, Stead T and Rogers H (2010) A specific group of genes respond to cold dehydration stress in cut Alstroemeria flowers whereas ambient dehydration stress accelerates developmental senescence expression patterns. The Journal of Experimental Botany 61(11): 2905-2921. Walsh P, Bursać D, Law YC, Cyr D and Lithgow T (2004) The J-protein family: modulating protein assembly, disassembly and translocation. EMBO Reports 5(6): 567-571. Wan CY and Wilkins TA (1994) A modified hot borate method significantly enhances the yield of high-quality RNA from cotton (Gossypium hirsutum L.). Analytical Biochemistry 223(1): 7-12. Wang H, Brandt AS and Woodson WR (1993) A flower senescence related messenger-RNA from carnation encodes a novel protein related to enzymes involved in phosphonate biosynthesis. Plant Molecular Biology 22: 719-724. Wang J, Song FY and Zhou FM (2002) Silver-enhanced imaging of DNA hybridization at DNA microarrays with scanning electrochemical microscopy. Langmuir 18: 6653-6658. Wang J, Hu L, Hamilton SR, Coombes KR and Zhang W (2003) RNA amplification strategies for cDNA microarray experiments. BioTechniques 34(2): 394-400. Wang W, Vinocur B, Shoseyov O and Altman A (2004) Role of plant heat-shock proteins and molecular chaperones in the abiotic stress response. Trends in Plant Science 9(5): 1360-1385. Wang E (2005) RNA amplification for successful gene profiling analysis, Journal of Translational Medicine 3: 28-38. Wang CY, Chiou CY, Wang HL, Krishnamurthy R, Venkatagiri S, Tan J and Yeh KW (2008) Carbohydrate mobilization and gene regulatory profile in the pseudobulb of Oncidium orchid during the flowering process. Planta 227:1063-1077. Wang J and Hou B (2009) Glycosyltransferases: key players involved in the modification of plant secondary metabolites. Frontiers of Biology in China 4(1): 39-46. Wang W, Hu Z, Yang Y, Chen X and Chen G (2009) Function annotation of an SBP-box gene in Arabidopsis based on analysis of co-expression networks and promoters. International Journal of Molecular Sciences 10: 116-132. Weingärtner O, Böhm M and Laufs U (2009) Controversial role of plant sterol esters in the management of hypercholesterolaemia. European Heart Journal 30: 404-409.

Chapter 2- Labellum transcriptome after pollination
171
Weng X-Y, Xu H-X and Jiang D-A (2005) Characteristics of gas exchange, chlorophyll fluorescence and expression of key enzymes in photosynthesis during leaf senescence in rice plants. Journal of Integrative Plant Biology 47: 560-566. Werner AK, Sparkes IA, Romeis T and Witte C-P (2008) Identification, biochemical characterization and subcellular localization of allantoate amidohydrolases from Arabidopsis and soybean. Plant Physiology 146: 418-430. Werner AK, Romeis T and Witte C-P (2010) Ureide catabolism in Arabidopsis thaliana and Escherichia coli. Nature Chemical Ecology 6: 19-21. Wertz PW (2000) Lipids and barrier function of the skin. Acta Dermo Venereologica Supp. 208: 7-11. Whitehead A and Crawford DL (2006) Neutral and adaptive variation in gene expression. Proceedings of the National Academy of Sciences USA 103: 5425-5430. Whitfield CW, Cziko A-M and Robinson GE (2003) Gene expression the brain predict behaviour in individual honey bees. Science 302(5643): 296-299. Wickens M, Bernstein DS, Kimble J and Parker R (2002) A PUF family portrait: 3′UTR regulation as a way of life. Trends in Genetics 18(3): 150-157. Wilkins TA and Smart LB (1996) Isolation of RNA from plant tissues. In: Krieg PA. A laboratory guide to RNA: Isolation, Analysis and Synthesis. (ed.). Wiley-Liss. Inc. Winder SJ and Ayscough KR (2005) Actin- binding proteins. Journal of Cell Science118: 651-654. Winkel-Shirley B (2001) Flavonoid biosynthesis. A colorful model for genetics, biochemistry, cell biology, and biotechnology. Plant Physiology 126: 485-493. Wise MJ (2003) LEAping to conclusions: A computational reanalysis of late embryogenesis abundant proteins and their possible role. BMC Bioinformatics 4: 52, 10.1186/1471-2105-4-52. Witte C-P (2011) Urea metabolism in plants. Plant Science 180: 431-438. Woltering EJ, Somhorst D and van der Veer P (1995) The role of ethylene in interorgan signalling during flower senescence. Plant Physiology 109: 1219-1225. Wu SH, Ramonell K, Gollub J and Somerville S (2001) Plant gene expression profiling with DNA microarrays. Plant Physiology and Biochemistry 39: 917-926. Wu Q, Liu T, Liu H and Zheng G (2009) Unsaturated fatty acid: metabolism, synthesis and gene regulation. African Journal of Biotechnology 8(9): 1782-1785. Xiang CC, Chen M, Kozhich OA, Phan QN, Inman JM, Chen Y and Brownstein MJ (2003) Probe generation directly from small numbers of cells for DNA microarray studies. BioTechniques 34(2): 386-393. Xie Q, Frugis G, Colgan D and Chua NH (2000) Arabidopsis NAC1 transduces auxin signal downstream of TIR1 to promote lateral root development. Genes and Development 14: 3024-3036.

Chapter 2- Labellum transcriptome after pollination
172
Xie Y-R, Chen Z-Y, Brown RL and Bhatnagar D (2010) Expression and functional characterization of two pathogenesis-related protein 10 genes from Zea mays. Journal of Plant Physiology 167: 121-130. Xu X, Dietrich CR, Delledonne M, Xia Y, Wen TJ, Robertson DS, Nikolau BJ and Schnable PS (1997) Sequence analysis of the cloned glossy8 gene of maize suggests that it may code for a β-ketoacyl reductase required for the biosynthesis of cuticular waxes. Plant Physiology 115: 501-510. Xu Y and Hanson MR (2000) Programmed cell death during pollination-induced petal senescence in petunia. Plant Physiology 122: 1323-1333. Xu Z, Escamilla-Treviño LL, Zeng L, Lalgondar M, Bevan DR, Winkel BSJ, Mohamed A, Cheng CL, Shih MC, Poulton JE and Esen A (2004) Functional genomic analysis of Arabidopsis thaliana glycoside hydrolase family 1. Plant Molecular Biology 55: 343-367. Xu XM and Møller SG (2006) AtSufE is an essential activator of plastidic and mitochondrial desulfurases in Arabidopsis. The EMBO Journal 25: 900-909. Xu XJ, Jiang CZ, Donnelly L and Reid MS (2007a) Functional analysis of a RING domain ankyrin repeat protein that is highly expressed during flower senescence. Journal of Experimental Botany 58: 3623-3630. Xu XJ, Gookin T, Jiang CZ and Reid MS (2007b) Genes associated with opening and senescence of Mirabilis jalapa flowers. Journal of Experimental Botany 58: 2193-2201. Xue X, Liu A and Hua X (2009) Proline accumulation and transcriptional regulation of proline biosynthesis and degradation in Brassica napus. BMB Reports 42(1): 28-34. Yakir E, Hilman D, Harir Y and Green RM (2007) Regulation of output from the plant circadian clock. FEBS Journal 274: 335-345. Yamada T, Ichimura K, Kanekatsu M and van Doorn WG (2007) Gene expression in opening and senescing petals of morning glory (Ipomoea nil). Planta 224: 1279-1290. Yang YH, Dudoit S, Luu P, Lin DM, Peng V, Ngai J and Speed TP (2002) Normalization for cDNA microarray data: a robust composite method addressing single and multiple slide systematic variation. Nucleic Acids Research 30(4): e15. Yang T and Poovaiah BW (2003) Calcium/calmodulin-mediated signal network in plants. Trends in Plant Science 8(10): 505-512. Yang Z, Wang X, Gu S, Hu Z, Xu H and Xu C (2008) Comparative study of SBP-box gene family in Arabidopsis and rice. Gene 407: 1-11. Yanovsky MJ and Kay SA (2001) Signaling networks in the plant circadian system. Current Opinion in Plant Biology 4: 429-435. Yap YM, Loh CS and Ong BL (2008) Regulation of flower development in Dendrobium crumenatum by changes in carbohydrate contents, water status and cell wall metabolism. Scientia Horticulturae 119: 59-66. Ye Q, Zhu W, Li L, Zhang S, Yin Y, Ma H and Wang X (2010) Brassinosteroids control male fertility by regulating the expression of key genes involved in Arabidopsis anther and pollen development. Proceedings of the National Academy of Sciences USA 107(13): 6100-6105.

Chapter 2- Labellum transcriptome after pollination
173
Yee D and Goring DR (2009) The diversity of plant U-box E3 ubiquitin ligases: from upstream activators to downstream target substrates. Journal of Experimental Botany 60(4): 1109-1121. Yephremov A, Wisman E, Huijser P, Huijser C, Wellesen K and Saedler H (1999) Characterization of the FIDDLEHEAD gene of Arabidopsis reveals a link between adhesion response and cell differentiation in the epidermis. The Plant Cell 11: 2187-2201. Yoruk R and Marshall MR (2003) Physiological properties and function of plant polyphenol oxidase: a review. Journal of Food Biochemistry 27: 361-422. Yoshida S, Ito M, Callis J, Nishida I and Watanabe A (2002a) A delayed leaf senescence mutant is defective in arginyl-tRNA:protein arginyltransferase, a component of the N-end rule pathway in Arabidopsis. The Plant Journal 32: 129-137. Yoshida S, Ito M, Nishida I and Watanabe A (2002b) Identification of a novel gene HYS1/CPR5 that has a repressive role in the induction of leaf senescence and pathogen-defence responses in Arabidopsis thaliana. The Plant Journal 29(4): 427-437. Yoshida KT, Endo M, Nakazono M, Fukuda H, Demura T, Tsuchiya T and Watanabe M (2005) cDNA microarray analysis of gene expression changes during pollination, pollen-tube elongation, fertilization, and early embryogenesis in rice pistils. Sexual Plant Reproduction 17: 269-275. Yu H and Goh CJ (2001) Molecular genetics of reproductive biology in orchids. Plant Physiology 127: 1390-1393. Yu J, Othman MI, Farjo R, Zareparsi S, MacNee SP and Yoshida S and Swaroop A. (2002) Evaluation and optimization of procedures for target labeling and hybridization of cDNA microarrays. Molecular Vision 8: 130-137. Zammatteo N, Jeanmart L, Hamels S, Courtois S, Louette P, Hevesi L, Remacle J (2000) Comparison between different strategies of covalent attachment of DNA to glass surfaces to build DNA microarrays. Analytical Biochemistry 280: 143-150. Zamora M, Granell M, Mampel T and Viñas O (2004) Adenine nucleotide translocase 3 (ANT3) overexpression induces apoptosis in cultured cells. FEBS Letters 563: 155-160. Zäuner S, Ternes P and Warnecke D (2009) Biosynthesis of sphingolipids in plants (and some of their functions). In: Chalfant C and Poeta MD. Sphingolipids as signaling and regulatory molecules. Ed. Landes Bioscience and Springer Science and Business Media. Zhang CJ, Chen GX, Gao XX and Chu CJ (2006) Photosynthetic decline in flag leaves of two field-grown spring wheat cultivars with different senescence properties. South African Journal of Science 72: 15-23. Zhang XS and O’Neill SD (1993) Ovary and gametophyte development are coordinately regulated by auxin and ethylene following pollination. The Plant Cell 5: 403-418. Zhang Y (2005) The SBP-Box gene SPL8 affects reproductive development and gibberellin response in Arabidopsis. Inaugural-Dissertation zur Erlangung des Doktorgrades der Mathematisch-Naturwissenschaftlichen Fakultät, Universität zu Köln. Zhang S, Sakuradani E and Shimizu S (2007) Identification of a sterol Δ7 reductase gene involved in desmosterol biosynthesis in Mortierella alpine 1S-4. Applied and Environmental Microbiology. 73(6): 1736-1741.

Chapter 2- Labellum transcriptome after pollination
174
Zhang GY, Feng J, Wu J and Wang XW (2010) BoPMEI1, a pollen-specific pectin methylesterase inhibitor, has an essential role in pollen tube growth. Planta 231: 1323-1334. Zhong R, Demura T and Yea ZH (2006) SND1, a NAC domain transcription factor, is a key regulator of secondary wall synthesis in fibers of Arabidopsis. The Plant Cell 18: 3158-3170. Zhou GK, Xu YF and Liu JY (2005) Characterization of a rice class II metallothionein gene: tissue expression patterns and induction in response to abiotic factors. Journal of Plant Physiology 162: 686-696. Zhu Y- R, Lü X- Y, Wang S-F, Wang N-N and Wang Y (2005) The relationship between photorespiration and senescence of Spirodela polyrrhiza. Plant Science 168: 1625-1632. Zielinski RE (1998) Calmodulin and calmodulin-binding proteins in plants. Annual Review of Plant Physiology and Plant Molecular Biology 49: 697-725. Zimmermann R and Werr W (2005) Pattern formation in the monocot embryo as revealed by NAM and CUC3 orthologues from Zea mays L. Plant Molecular Biology 58: 669-685.

Chapter 3- Metabolic profiling of Ophrys fusca labellum after pollination
175
Chapter 3
METABOLIC PROFILING OF OPHRYS FUSCA LABELLUM
AFTER POLLINATION
3.1. Abstract
Ophrys has evolved a highly specific pollination system known as sexual
deception. Sexually deceptive orchids, like O. fusca, attract their pollinators by
mimicking the female hymenopteran sex pheromones, thereby deceiving males into
attempted mating with the orchid labellum. In order to detect chemical changes after
pollination event, a metabolic profiling of in-field Ophrys fusca plants was performed
using a Gas chromatography- mass spectrometry (GC-MS) analysis. Labella from
unpollinated and pollinated flowers were collected 2 (2 DAP) and 4 (4 DAP) days after
pollination. Rather than identifying all compounds present in labella extracts, analysis
was focused on cuticular hydrocarbons, namely straight chain saturated hydrocarbons
(n-alkanes) and unsaturated (n-alkenes) hydrocarbons with chain lengths 21–29 and
with double bond positions 7, 9, 11 or 12. These compounds have previously shown to
be responsible for pollinator attraction in Ophrys species. A total of 22 compounds were
identified including 13 (59 %) different n-alkenes. Statistical analysis revealed differences
between unpollinated and pollinated labella, both at 2 DAP and 4 DAP. At 2 DAP,
alkanes and alkenes are differentially accumulated; whereas at 4 DAP only alkenes
displayed differential accumulation. Total amounts of labella extracts do not displayed
differences with statistical significance, revealing that compounds production is not
immediatelly ceased after pollination. Results presented highlight that post pollination
mechanism is not reflected by a significant decrease in compounds production, as
opposite to other post pollination systems. This may be related to functions attributed to
these cuticular compounds on the flower, namely by preventing water loss. As a
consequence, the abrupt cessation of such compounds could cause physiological
limitations on the plant (Schiestl and Ayasse, 2001).
Keywords: pollination, sexual deception, GC-MS, Ophrys fusca, n- alkanes, n- alkenes.

Chapter 3- Metabolic profiling of Ophrys fusca labellum after pollination
176
3.2. Introduction
3.2.1. Floral scent as a powerful communication channel
Floral scent constitutes an important communication channel between
flowering plants, their pollinators and enemies (Raguso, 2008). Plants often attract
pollinators with floral displays composed of visual, olfactory, tactile and gustatory stimuli
(Raguso, 2008; Leonard et al., 2011a), thus flowers are considered multisensory displays
by influencing pollinators behaviour (Leonard et al., 2011b). In flowering plants, scent
prime function relies in attracting and guiding pollinators to accomplish pollination, thus
ensuring reproductive success (Dudareva and Pichersky, 2000). Further functions have
been ascribed to flowers volatile organic compounds (VOCs), namely in defense and
protection against abiotic stresses (Pichersky and Gershenzon, 2002; Unsicker et al.,
2009). Plants usually emit compounds to defend themselves againts
herbivores/florivores and pathogens to ensure survival; and to attract animal pollinators
for sexual reproduction (Dudareva and Negre, 2005; Schiestl, 2010). Upon herbivore
damage, herbivore-induced volatiles are released as a defensive strategy for
attracting carnivorous arthropods (Heil and Bueno, 2007; Bandeili and Müller, 2010).
Plants face, thus, a dynamic tension regarding the emission of compounds as an
effective defense response to granivores and herbivores/florivores and as attractants to
pollinators (van der Meijden, 1996; Knudsen et al., 2006; Raguso, 2009). Floral scents
consist of complex blends of compounds, which often belong to distinct chemical
classes and are produced following different biosynthetic pathways (Knudsen et al.,
2006). Given the complexity of floral scent in terms of number, identity and relative
amounts of volatile compounds, a variation at both inter- and intra-specific level may
occur (Dudareva and Pichersky, 2000). Thus, such bouquet variations may be at the
qualitative level or at proportions of the same compounds (Mant et al., 2005; Schiestl et
al., 2010 and references therein). Flower emission of a single compound has been
reported namely on modulation of pollinator behaviour (Schiestl et al., 2003; Wiemer et
al. 2008; Chen et al., 2009).
Pollinators mediate reproductive success and reproductive isolation among
plants, namely in Orchidaceae. In orchid pollination, pollinator sharing is generally low
thus suggesting strong floral isolation (Schiestl and Schlüter, 2009). Floral isolation is
mediated by flower morphology (morphological isolation) and pollinator behaviour
(ethological isolation) (reviewed in Schiestl and Schlüter, 2009). Studies in floral color
(Aragon and Ackerman 2004; Streinzer et al., 2010) and morphology (Sletvold et al.,
2010) have shown that floral traits may be under pollinator-mediated selection. Floral

Chapter 3- Metabolic profiling of Ophrys fusca labellum after pollination
177
scent studies have been performed in less extend mainly due to demands on sampling
and analysis (Schiestl et al., 2010 and references therein).
3.2.2. Sexual deception in Ophrys
3.2.2.1. Flower cues and pollinator’s behaviour
Sexually deceptive orchids of the genus Ophrys are a prime example of
pollination by mimicry in plants (Schiestl, 2005; Schaefer and Ruxton, 2009). Several
studies in Ophrys floral signals led to the recognition of odour as the major driving cue
on pollinator specificity and, consequently, on reproductive isolation within the genus
(Paulus and Gack, 1990; Borg-Karlson et al., 1993; Schiestl et al., 1999; Schiestl, 2005;
Cozzolino and Scopece, 2008). In 1990, Borg-Karlson provided a comprehensive review
of the relationships between orchids of the genus Ophrys and their insect pollinators. In
this review, the author describes the detailed chemical analyses and field studies
conducted on communication between Ophrys plants and pollinators. Sexual
deception mechanism was first elucidated by Schiestl and co-workers (1999), who
showed that specific patterns of cuticular hydrocarbons on the orchid flower are similar
to those found in the receptive hymenopteran female of the specific pollinator species.
Ophrys pollinators are mainly solitary bees (Andrenidae, Anthophoridae, Colletidae,
Megachilidae, and Apidae), solitary wasps (Sphecidae and Scoliidae) and
occasionally beetles (Scarabaeidae) (Kullenberg, 1961; Borg-Karlson, 1990; Paulus and
Gack, 1990).
Compounds involved on sexual deception consist mainly on long-chain fatty
acids and their derivates, namely alkanes and alkenes (Borg-Karlson, 1990; Schiestl et
al., 1999, 2000). Given that pollinators play a key role in the origin and maintenance of
floral variation in natural populations (Rymer et al., 2010), reproductive isolation in
sexually deceptive orchids is predicted to be achieved by differences on floral scent
(Schiestl et al., 2004; Cozzolino and Scopece, 2008; Peakall et al., 2010).
A sequencial behaviour response of a male hymenopteran attracted by an
orchid flower is illustrated (Fig. 3.1). First, the male insect is drawn to the flower by long-
range attractants (Fig. 3.1- Stages 1-2) and afterwards, the searching-flight becomes
more disconcerted (Fig. 3.1- Stage 3) and when approaching the flower, visual cues
work as secondary stimuli (e.g. labellum colour and shape) (Borg-Karlson, 1990). Once
the insect lands on the labellum, tactile cues (e.g. trichomes orientation) may direct the
male insect to adopt an adequate position for accomplishing pseudocopulation, i.e.
abdominal or cephalic (Fig. 3.1- Stage 4, Bergström, 1993). After a failed mating
attempt, male pollinator departs from the orchid flower with pollinia attached to its

Chapter 3- Metabolic profiling of Ophrys fusca labellum after pollination
178
body and, when visiting another flower the repeated process allows pollinia transfer
and, consequently, pollen release.
Figure 3.1- Behavioural stages of a male hymenopteran attracted by an Ophrys flower. Stages 1-2: Olfactory signals emitted by the orchid labellum draws male attention; Stage 3: As the insect approaches the flower, the insect searching-flight turns to be more disconcerted, and visual cues may provide a secondary stimulus; Stage 4: Pseudocopulation takes place; Stage 5: The pollinator insect departs form the Ophrys after an unsuccessful mating attempt (Bregström, 1993).
In sexually deceptive orchids, cross-pollination is achieved by mimicking the
mating signals of female insects, especially sex pheromones (Schiestl, 2005; Vereecken
and Schiestl, 2008) usually of one or few pollinator taxa (Kullenberg, 1961; Nilsson, 1992).
These orchids blossom with relative accuracy during the period when young and
inexperienced male bees and wasps emerge and make their first exploratory visits
(Nilsson, 1992). These orchids exploit, for the imitated insect species, the innate biases of
males responding to receptive females, by producing the behaviourally active
components of virgin female’s sex pheromone (Streinzer et al., 2009). Specificity in
pollinator attraction is an hallmark in these orchids as only males of the target species
are attracted by the odour bouquet, while unspecific pollinators are not (Streinzer et al.,
2009). Although flower odour is determinant for pollinator’s attraction, flower
morphology does also play an important role. After landing on a flower, morphological
cues guide the males into the correct position to take off and/or deposit pollinia.
Flowers do not display conspicuous colour signals thereby avoiding accidental
attraction (Streinzer et al., 2009; Spaethe et al., 2010), instead, labellum patterns (e.g.
colour, shape, pilosity) mimic female insect body parts. Nonetheless, due to the highly
Stage 1 Stage 2 Stage 3 Stage 4

Chapter 3- Metabolic profiling of Ophrys fusca labellum after pollination
179
specific olfactory attraction in sexual deception, visual signals are assumed to play a
secondary role (Streinzer et al., 2010 and references therein). In fact, it was determined
that visual cues displayed by labellum colour in Ophrys species were not responsible for
increasing pollinator’s visiting rates (Vereecken and Schiestl, 2009). A recent study
revealed that Ophrys hedreichii labellum pattern is involved on the repellent learning
during post copulatory behaviour and further used by the orchid as a strategy to
increase outcrossing rather than increasing pollinator attraction potential during the
flower approach flight (Streinzer et al., 2010).
3.2.2.2. Sexual deception mechanism: a chemical perspective
About one-third of the Orchidaceae species are thought to be deceit
pollinated (Cozzolino and Widmer, 2005; Jersáková et al., 2006). The observation that
orchid flowers somehow orient flights of male pollinators led to the suggestion that long-
range semiochemicals (i.e. chemical compounds which affect insect behaviour-
Gullan and Cranston, 2000) are explored by these plants (Cane and Tengö, 1981;
Dettner and Liepert, 1994). Ophrys genus was the first to be described as being
pollinated by sexual deception mechanism (Pouyanne, 1917). From then onwards,
several studies have been performed in Ophrys in order to unravel flower chemical
composition associated to sexual deceit (Kullenberg, 1961; Borg-Karlson, 1990; Schiestl
et al., 1999; Schiestl, 2005). Chemical analysis revealed that Ophrys flowers produce
complex species-specific mixtures of more than 100 compounds, mainly saturated and
unsaturated hydrocarbons, aldehydes, alcohols, esters, ketones, and terpenoids, the
aromatic compounds being present in minor amounts (Borg-Karlson and Tengö, 1986;
Borg-Karlson, 1990). Only a small proportion of those compounds revealed to be
actively involved in insect attraction (Ayasse et al., 2000; Schiestl et al., 2000).
According to Schiestl and co-workers (1999), in O. sphegodes sexual deceptive
mechanism flowers have the same compounds and specific patterns of long straight-
chain unsaturated (n- alkenes) and saturated (n- alkanes) hydrocarbons, in relative
proportions similar to those found in the sex pheromone of its pollinator species, the
solitary bee Andrena nigroaenea Kirby. The use of gas chromatography-
electroantennographic detection (GC-EAD) allowed the identification of compounds
that influence the pollinator behaviour and further GC-MS analysis allowed its chemical
structure’s elucidation (Ayasse et al., 2003). GC-EAD11 has been used in compound
identification from the complex flower scent perceived by the antennae (e.g. Ophrys
11 Analytical technique in which an insect antenna is used as a parallel detector for compounds separated on a GC column to identify subsets of complex odour blends that show biological activity (Arn et al., 1975).

Chapter 3- Metabolic profiling of Ophrys fusca labellum after pollination
180
species- Schiestl et al., 2000; Ayasse et al., 2003; other orchids- Huber et al., 2005;
Brodmann et al., 2009). Confirmation of the biological activity using synthetic
compounds in field bioassays was the final essential step for confirming the ability on
insect behaviour modulation. Schiestl and co-workers (2000) verified that n-alkenes
emitted by labellum are responsible for the attraction of male pollinators while alkanes
exhibited a synergistic effect by increasing the intensity of male responses. Cuticular
hydrocarbons (alkanes and alkenes) are part of the plant epicuticular wax preventing
water loss (Hadley, 1981; Jetter and Kunst, 2008). Their function on attracting pollinators
appears to be an economical floral trait favoured by the natural selection event
(Schiestl et al., 1999, 2000). These studies have also shown a higher proportion of the
volatile unsaturated hydrocarbons in flowers rather than in leaves (Schiestl et al., 2000),
which led to the assumption that scent cuticular compounds in flowers was assigned to
a role on pollination, while leaves cuticle may play almost exclusively a function on
water loss prevention (Schiestl et al., 2000; Steiger et al., 2010).
Resemblance of the labellum chemical profile of the behaviourally active
compounds regarding its model insect is largely responsible for eliciting mating
behaviour on male pollinators (Schiestl et al., 1999; Ayasse et al., 2000; Schiestl, 2005;
Mant et al., 2005; Vereecken et al., 2010). Such pollinator specificity, guaranteed by a
species-specific chemical profile, constitutes an efficient reproductive isolation
mechanism among the interfertile Ophrys species (Paulus and Gack 1990). Interestingly,
Ayasse and co-workers (2003) exposed a special case on Ophrys sexual deception
mechanism, illustrated by O. speculum Link and its pollinator species, the wasp
Campsoscolia ciliata Fabricius. Despite the fact that O. speculum flower odour
bouquet consists of identical blends of cuticular hydrocarbons (Erdmann, 1996) as seen
in other Ophrys species, none of those elicited C. ciliata mating behaviour (Ayasse et
al., 2003). Instead, in O. speculum-C. ciliata interaction, pollinator attraction is achieved
more or less by a single orchid-released compound, 9-hydroxydecanoic acid, an
oxygenated carboxylic acid. Divergency on this interaction regarding other Ophrys
species was attributed mainly to the pollinator species. In Andrena-pollinated Ophrys
species, species-specific blends of the same hydrocarbons are used to avoid unspecific
pollination (Schiestl and Ayasse, 2002). This specific bouquet is crucial since many
Andrena species live sympatrically with closely related species and heterospecific
mating could occur (Westrich, 1989). Instead, a different blend was explored by the O.
speculum flower, as C. cilliata doesn’t overlap either temporally nor spatially with other
scoliid wasps (Ayasse et al., 2003).

Chapter 3- Metabolic profiling of Ophrys fusca labellum after pollination
181
3.2.2.3. Floral odour in reproductive isolation
Since Ophrys species are pollinated by one or a few pollinator species,
reproductive isolation is achieved by means of chemical mimicry of the sex
pheromones of the corresponding pollinator species (Paulus and Gack, 1990; Nilsson,
1992; Ayasse et al., 2011). Ophrys species pollinated by the same bee species,
independently of their phylogenetic relationship, use similiar odour bouquets for
pollinator attraction (Stökl et al., 2005). In sympatric species pollinated by different
insect species, e.g. O. fusca by Andrena nigroaenea and O. bilunulata by A. flavipes, a
similar set of cuticular hydrocarbons is present, although their relative amounts differed
significantly (see Schiestl and Ayasse, 2002). In sympatric species pollinated by the
same insect species, reproductive isolation is not ensured by the odour bouquet but
rather mechanically through the deposition of pollinia in different parts of the insect’s
body (Borg-Karlson, 1990). For example, Ophrys fusca and O. sphegodes are both
pollinated by males of Andrena nigroaenea (Paulus and Gack, 1990), but different
pseudocopulation positions prevent hybridization between the two species (abdominal
pseudocopulation- O. fusca, cephalic pseudocpulation- O. sphegodes, for more detail
see Chapter 1) (Kullenberg, 1961; Paulus and Gack, 1990). In sexually deceptive
orchids, pollinator-driven speciation is directly linked to differences of floral odour
bouquets. Orchids with high pollinator specificity mostly rely on pre mating reproductive
barriers and have minute post mating isolation mechanisms (Cozzolino and Scopece,
2008). Exceptions have been reported, namely in two pairs of sympatric Ophrys species,
(Ophrys chestermanii and O. normanii) displaying similar scents and sharing the
pollinator species, in which post pollination isolation factors were attributed in
mediating reproductive isolation (Gögler et al., 2009). Another example on the
possibility of post pollination factors to work as reproductive barriers was documented
by Cortis and co-workers (2009) in a natural hybrid zone on the sympatric species
Ophrys iricolor and O. incubacea.
A shift to a novel pollinator achieved through an odour bouquet modification
may represent the main isolation mechanism responsible for Ophrys speciation
(Cozzolino and Scopece, 2008). According to Vereecken and Schiestl (2010) Ophrys
hybrids, resulting from two sympatric species (O. lupercalis and O. exaltata), displayed
a novel floral scent and more attractive, than either of the two parents, to a pollinator
species not initially involved in the pollination of any of the parent Ophrys species. As
suggested by Peakall and co-workers (2010) for the sexually deceptive genus
Chiloglottis, pollinatior-driven speciation may also occur in Ophrys system.
Ophrys species are able of attracting alternative pollinators species, leading to
the occurrence of natural hybrids (Vereecken and McNeil, 2010). These results reveal

Chapter 3- Metabolic profiling of Ophrys fusca labellum after pollination
182
the flexibility of the mimicry system by “overcoming seasonal or annual fluctuations in
the local pollinators populations” to guarantee reproductive success (Vereecken and
McNeil, 2010). The occurrence of floral odour variation within Ophrys species is also an
important strategy for preventing insect learning behaviour of the deceptive orchid
floral odours (Ayasse et al., 2000). This assumption is based on results by Ayasse and co-
workers (2000), according which variation in relative proportions of compounds in
flowers at different stems position minimize the learning capacity by insects of the flower
bouquet, thus incrementing the possibility of a pollinator to visit different plants in a
population. Vereecken and Schiestl (2008) demonstrated that Ophrys exaltata presents
an imperfect mimick by emitting a different relative proportion of key odour
compounds from the sex female pheromones. Instead of reducing flower
attractiveness, the orchid flower bouquet was able to attract patrolling males with
more success than sexual pheromones emitted by local virgin females of the pollinator
species (Colletes cunicularius) (Vereecken and Schiestl, 2008).
3.2.3. Metabolomics: a diverse functional tool
Metabolomics aims at identifying the complete set of metabolites or the
metabolome of the cell (Joyce and Palsson, 2006; Colquhoun, 2007). The metabolome
is composed of hundreds of metabolites. Simultaneous measurement of all components
of the metabolome by a single high-throughput method, analogous to those available
in transcriptomics (microarrays) and proteomics (2D-PAGE), is not yet available (Bino et
al., 2004; Joyce and Palsson, 2006). This is mainly due to metabolites chemical and
physical properties and to the high range of concentrations (pM to mM) at which they
occur (Hall, 2006; Colquhoun, 2007). The conventional classification of metabolomics
proposed by Fiehn (2002) has been accepted worldwide. It encompasses metabolite
target analysis, metabolic fingerprinting, metabolic profiling and metabonomics
(reviewed in Fiehn, 2002). A comprehensive coverage can only be achieved by using
multiparallel complementary extraction and detection technologies with careful
experimental design (Saito and Matsuda, 2010). There are several detection strategies
that can be used, such as nuclear magnetic resonance (NMR), Fourier transformation
infrared spectroscopy (FT-IR), and mass spectrometry (MS) coupled to separation
techniques such as high performance liquid chromatography (HPLC), gas
chromatography (GC), or capillary electrophoresis (CE) (reviewed in Saito and
Matsuda, 2010).

Chapter 3- Metabolic profiling of Ophrys fusca labellum after pollination
183
3.2.3.1. Metabolic profiling
Metabolic profiling involves the pre-selection of a set of metabolites or of a
specific class of compounds that might participate in a target pathway (Fiehn, 2002;
Barderas et al., 2011). These pre-defined metabolites may belong to a class of
compounds such as polar lipids, isoprenoids, or carbohydrates, or be selected
upstream of members from particular/targeted pathways (Baxter and Borevitz, 2006).
With the improved performance of chromatography methods in the late 1960s and
early 1970s (improvements on reliability, robustness, selectivity and resolution), peak
identification in complex matrices was made possible based purely on retention times.
These separation techniques were then coupled to highly sensitive detectors such as
flame ionization coupled to gas chromatography (GC-FID) or fluorescence and UV
detectors coupled to liquid chromatography (LC) (Fiehn, 2002). The flame ionization
detector (FID) is a widely used detector, which is primarily sensitive to hydrocarbons
(McWilliam and Dewar, 1958). Generally, GC coupled with a mass spectrometer (MS)
detector is the most commonly used strategy for metabolites quantification and
identification.
3.2.3.2. Gas Chromatography- Mass Spectrometry (GC-MS)
Gas chromatography (GC), mainly when interfaced with mass spectrometry
(MS), is one of the most widely used and powerful method in metabolites identification
and quantification. It offers very high chromatographic resolution, yet requires chemical
derivatization for many biomolecules, with only volatile chemicals being analysed
without derivatization step. Some large and polar metabolites cannot be analysed by
GC. Mass spectrometry is used to identify and to quantify metabolites after separation
by GC, HPLC (i.e. high-performance liquid chromatography) or CE (i.e. capillary
electrophoresis). MS was improved to become as universal as flame ionization, by
offering a completely independent method for compound identification and
classification when coupled to GC (de Jongh et al., 1969; Roessner, 2007). The
analytical procedure can be focused on a smaller number of pre-defined metabolites
and sample preparation as well as data acquisition can be focused on the chemical
properties of these compounds (Fiehn, 2001). By including compounds with known
retention times, shifts in absolute retention times could be checked. In mass
spectrometers of most standard GC-MS instruments, compounds exiting the GC column
are ionized by electron impact (EI) and the resulting positively charged molecules and
molecule fragments are selected according to their mass-to-charge (m/z) ratio by
entering a mass filter (Fig. 3.2). Total ion chromatograms obtained provide information

Chapter 3- Metabolic profiling of Ophrys fusca labellum after pollination
184
on the retention time of each compound and its mass spectrum, consisting on a
characteristic ion fragmentation pattern. Detection limits of highly sensitive mass
spectrometers are in the picogram range for the full scan mode (scanning ions over a
wide molecular range) and may be as low as in the femtogram range (in quadrupole
mass filters) in the selected ion monitoring (SIM) mode scanning (Tholl et al., 2006). For
automated metabolite identification, reliable information on both retention time and
mass spectra is required (Fiehn, 2001). Compounds can be identified through spectral
comparisons with authentic compounds from reference spectral libraries such as the
NIST (http://www.nist.gov/; National Institute of Standards and Technology, Gaithersburg,
USA) or Wiley (http://eu.wiley.com/WileyCDA/WileyTitle/productCd-0470047852,miniSiteCd-
STMDB2.html). Although these libraries contain 350 000 entries, most of them include non-
biological compounds and lack information on chromatographic behaviour which is
essential, in particular, for isomers identification (Wagner et al., 2003). A reference library
containing both retention time of these compounds (as determined under the same
conditions) and the corresponding mass spectrum can be created (Wagner et al.,
2003). Identification by retention time is confirmed by co-chromatography of each
standard substance with substances obtained in the plant extract.
Figure 3.2- Gas chromatography- Mass spectrometry system. (A) GC Agilent 6890N system equipped with a mass spectrometer Agilent 5975 Inert XL. Picture by FMonteiro at the Florian Schiestl Laboratory (University of Zurich); (B) Schematic diagram of a typical GC-MS system. Gas supply (1) is regulated to the correct pressure/flow by the pneumatic controls (2). In the injector (3), the sample is volatilized and the resulting gas enters the GC column (5), which in turn is temperature controlled in the oven (4). After separation in the GC system, analytes are transported to MS by an interface (6) and, after, products are ionized in the ion source (7) prior to analysis. Further, analytes are separated on the basis of their mass-to-charge ratio (mass analyser- 8) and then ion beam is detected and converted into a usable signal (detector- 9). The final output is an ion signal of the corresponding mass-to-charge ratio of all analytes. Adapted (http://www.chromacademy.com/index.asp)
A B

Chapter 3- Metabolic profiling of Ophrys fusca labellum after pollination
185
3.3. Material and methods
3.3.1. Sample collection
Scent collection was made in Ophrys fusca plants from a natural population
growing in-field as previously reported (Chapter 2- section 2.3.1. Experimental design is
presented in 2.3 Material and Methods section). Samples for scent analysis were
collected as follows: O. fusca labella were cut with a sterile scalpel and immediately
sealed in 2 mL PTFE Liner amber glass vials (Agilent Technologies Inc.) containing 1 mL of
pentane (Sigma Aldrich) as solvent. Amber PTFE liner vials avoid volatile evaporation
and degradation. After 1 h immersion in the solvent, lips were removed and solvent
extracts were stored at -20 ºC.
3.3.2. Chemical analysis
Metabolic profiles of 100 Ophrys fusca labella extracts were performed using
GC-MS facilities at the Florian Schiestl Laboratory, Institute for Systematics Botany,
University of Zurich (Switzerland).
3.3.2.1. Quantitative analysis
For quantitative analysis, labella extracts were analysed by gas
chromatography with flame ionization detection (GC-FID; Agilent 6890N). Before
analysis, 100 μg of n-octadecane (purity 99.8%, Fluka, Buchs, Switzerland) was added to
samples as internal standard. Briefly, for each sample one vial (Agilent Technologies
Inc.) was prepared with 50 μl of n-hexane (Merck) to avoid evaporation. After, a
microvolume glass insert with bottom spring and polymer feet (Supelco) was added for
loading 1 μl of the sample and sealed through a cap with a 8 mm silicone/PTFE septum
(BGB Analytik AG). One microliter of each odour sample was injected splitless at 50 ºC
(1 min) into the GC, equipped with an AutoSampler 7683 series (Agilent Technologies
Inc.), followed by opening the split valve and setting temperature to raise to 300 ºC at a
rate of 10 °C min-1. After, the oven was maintained at 300 °C for an additional 15 mins.
The GC was equipped with a HP5 column (5% Phenyl Methyl Siloxane, 30 m, 0.32 mm
diameter, 0.25 m film thickness, Agilent Technologies Inc.) with 5 m × 0.53 mm
diameter and deactivated retention gap was used. Helium served as carrier gas (6.2
mL. min-1, constant flow mode) and nitrogen was used as make-up gas (4.98 psi). The
injector temperature was kept at 300 °C. Chromatogram outputs were recorded and

Chapter 3- Metabolic profiling of Ophrys fusca labellum after pollination
186
then analysed by the MSD ChemStation Data Analysis Application E.02.00.493 (Agilent
Technologies Inc.) for quantitative and qualitative analysis.
3.3.2.2. Qualitative scent analysis
For compound identification, samples were analysed by gas chromatography
with mass selective detection (GC-MS), by using GC parameters as described
previously. Briefly, 1 μl of each sample was injected into a GC (Agilent 6890N) coupled
with a Mass Spectrometer (Agilent 5975 Inert XL), equipped with the same column used
for quantitative analysis. Helium served as the carrier gas (2 ml/min, constant flow
mode). The oven was kept at 50 °C (1 min) and then heated to 300 °C at a rate of 10
°C min-1. The transfer line to the MS was heated to 150 °C. The MS ion source was
heated to 250 °C and run set to full scan mode. A solvent delay was performed for 3
min and after scan parameters were set for detection within 10- 400 mZ until 8 mins,
following which, scan settings were changed to acquire mass at 33- 550 mZ.
3.3.3. Compound identification
GC-FID and GC-MS analysis were done with the same column (HP5), thereby
allowing comparison of retention times of the analytes. On a HP-5 column, alkenes
elute prior to the corresponding alkanes. Alkenes with the same chain length but
different double bond positions display different retention times, so that (Z)-12 elutes first
while (Z)-5 elutes last. Rather than identifying all compounds present in extracts, analysis
was focused on straight chain saturated hydrocarbons (n-alkanes) and unsaturated (n-
alkenes) hydrocarbons with double bond positions 5, 7, 9, 11 or 12 and of chain lengths
21–29 carbons. These compounds have been shown to be responsible for pollinator
attraction in Ophrys species (Schiestl, 2005). The isomeric configuration of the alkenes
was not determined in this study. The volatiles were analyzed by GC-MS and
identification was based on reference compounds injection and comparison of their
retention indices, as well as by computerized matching of the acquired mass spectra
with those stored in the Wiley and NIST 5.0 mass spectral libraries of the GC-MS data
system. Reference compounds were analysed by GC-MS with same parameters used in
labellum extracts analysis. A custom-made library was used for compound
identification, where compounds involved in Ophrys-insect interaction have been
deposited and previously identified. Absolute amounts of odour compounds were
calculated using the internal standard method (Schomburg, 1990). Further, sampling
volumes were used to calculate the absolute amount in micrograms per labellum.

Chapter 3- Metabolic profiling of Ophrys fusca labellum after pollination
187
Amounts of individual compounds were divided by the sum of all compounds to
calculate relative amounts.
3.3.4. Statistical analysis
Means and standard error (SEM) of absolute (μg per labellum) and relative (%)
amounts of all identified compounds were calculated for all solvent extracts. A
multivariate analysis of labella extracts with all compounds identified [relative amounts
(%)] was performed via a principal component analysis (PCA) (correlation matrix) for all
conditions tested (unpollinated and pollinated 2DAP and 4DAP). In order to detect
compound differences, a One-Way ANOVA followed by a Fisher's Least Significant
Difference (LSD) test as post-hoc (p< 0.05) was performed when the dataset fitted the
conditions of normality. For pairwise comparisons of total absolute amounts, a non-
parametric Mann-Whitney U-test was performed at p= 0.025. Calculations, statistical
tests and graphics were carried out using IBM® SPSS® Statistics version 19.0 (SPSS Inc.,
USA).

Chapter 3- Metabolic profiling of Ophrys fusca labellum after pollination
188
3.4. Results and discussion
3.4.1. Descriptive statistics on chemical analysis
Despite the fact that Ophrys flowers can produce a bouquet consisting of more
than 100 chemical compounds (Borg-Karlson, 1990), metabolic profiling of Ophrys fusca
labellum was focused on cuticular hydrocarbons (n-alkanes and n-alkenes) known to
trigger behavioural response in male pollinators (Schiestl et al., 1999). To determine
changes related to pollination events, labellum extracts were analysed at 2 and 4 days
after pollination (DAP). A set of 98 labella extracts were used for further analysis, since
two samples were removed from analysis due to contamination with water. From the 22
compounds identified in labella extracts, 9 were n-alkanes (41 %) and 13 n-alkenes (59
%). The volatile bouquet consisted of straight chain n-alkanes with carbon lenghts of 21-
31 and straight alkenes with double bonds at positions 7, 9, 11, 12 or 13 (Fig. 3.4- next
page). These compounds were identified in both unpollinated and pollinated Ophrys
fusca labella extracts at 2 DAP and 4 DAP, and their relative and absolute amounts are
presented (Tables 3.1 and 3.2- relative amounts, Appendix VI- absolute amounts).
Relative amounts of alkanes and alkenes of all conditions tested are shown in Tables 3.1
and 3.2, respectively. An error bar of mean relative amounts for the identified
compounds was performed in order to get an overview of compound’s variation in the
conditions tested (Fig. 3.3).
Figure 3.3- Error bar of mean (±SE) relative amounts for all variables (compounds) in unpollinated and pollinated Ophrys fusca labellum extracts, 2 and 4 days after pollination.
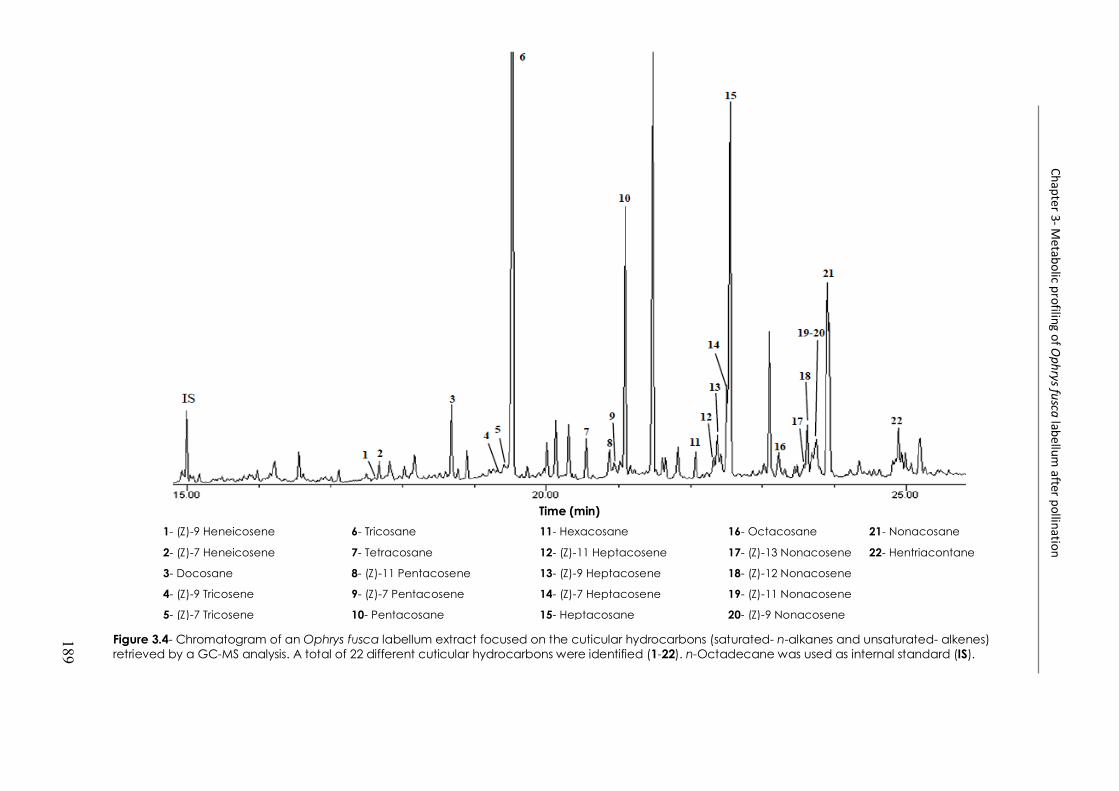
Chapter 3- Metabolic profiling of Ophrys fusca labellum after pollination
189
Figure 3.4- Chromatogram of an Ophrys fusca labellum extract focused on the cuticular hydrocarbons (saturated- n-alkanes and unsaturated- alkenes) retrieved by a GC-MS analysis. A total of 22 different cuticular hydrocarbons were identified (1-22). n-Octadecane was used as internal standard (IS).
1- (Z)-9 Heneicosene 6- Tricosane 11- Hexacosane 16- Octacosane 21- Nonacosane
2- (Z)-7 Heneicosene 7- Tetracosane 12- (Z)-11 Heptacosene 17- (Z)-13 Nonacosene 22- Hentriacontane
3- Docosane 8- (Z)-11 Pentacosene 13- (Z)-9 Heptacosene 18- (Z)-12 Nonacosene
4- (Z)-9 Tricosene 9- (Z)-7 Pentacosene 14- (Z)-7 Heptacosene 19- (Z)-11 Nonacosene
5- (Z)-7 Tricosene 10- Pentacosane 15- Heptacosane 20- (Z)-9 Nonacosene
Time (min)
Chapter 3- Metabolic profiling of O
phrys fusca labellum after pollination
189

Chapter 3- Metabolic profiling of Ophrys fusca labellum after pollination
190
Table 3.1. Mean relative amount with standard error [SEM= standard deviation/ √(n)] of n-alkanes (straight chain saturated hydrocarbons) in unpollinated and pollinated Ophrys fusca labella, 2 and 4 days time point. Compounds are ordered by retention times. Alkane’s total amount ( g) is given as mean (±SEM) of total labella sampled.
2 Days 4 Days
Alkanes Unpollinated (N=25) Pollinated (N=25) Unpollinated (N=24) Pollinated (N=24)
Mean ± SEM Mean ± SEM Mean ± SEM Mean ± SEM
Docosane (C22) 0.49 ± 0.07 0.63 ± 0.09 0.75 ± 0.15 0.75 ± 0.11
Tricosane (C23) 21.84 ± 1.32 22.26 ± 1.19 18.53 ± 0.88 20.62 ± 1.47
Tetracosane(C24) 2.03 ± 0.19 1.96 ± 0.17 2.21 ± 0.33 2.42 ± 0.54
Pentacosane (C25) 9.39 ± 0.46 9.16 ± 0.40 8.42 ± 0.32 7.80 ± 1.34
Hexacosane(C26) 1.55 ± 0.09 1.74 ± 0.11 1.62 ± 0.11 1.73 ± 0.15
Heptacosane (C27) 18.51 ± 0.92 22.73 ± 1.13 18.40 ± 0.55 17.80 ± 1.36
Octacosane (C28) 1.07 ± 0.08 1.47 ± 0.12 1.11 ± 0.09 1.39 ± 0.15
Nonacosane (C29) 10.45 ± 0.59 10.89 ± 0.63 9.06 ± 0.35 10.33 ± 1.35
Hentriacontane (C31) 6.24 ± 0.67 3.80 ± 0.49 7.72 ± 0.69 6.18 ± 0.85
SUM (%) 71 74 67 69
Mean total amount ( g/labellum) 4.32 ± 0.27 4.02 ± 0.28 3.94 ± 0.24 4.76 ± 0.67
190
Chapter 3- Metabolic profiling of O
phrys fusca labellum after pollination

191
Table 3.2. Mean relative amount with standard error [SEM= standard deviation/ √(n)] of n-alkenes (unsaturated hydrocarbons) in unpollinated and pollinated Ophrys fusca labella, 2 and 4 days time point. Compounds are ordered by retention times. Alkene’s total amount ( g) is given as mean (±SEM) of total labella sampled.
2 Days 4 Days
Alkenes
Unpollinated (N=25) Pollinated (N=25) Unpollinated (N=24) Pollinated (N=24)
Mean ± SEM Mean ± SEM Mean ± SEM Mean ± SEM
(Z)-9-Heneicosene 0.04 ± 0.01 0.02 ± 0.008 0.08 ± 0.01 0.05 ± 0.02
(Z)-7-Heneicosene 0.45 ± 0.05 0.74 ± 0.11 0.33 ± 0.06 0.87 ± 0.14
(Z)-9-Tricosene 0.30 ± 0.04 0.44 ± 0.08 0.37 ± 0.03 0.40 ± 0.11
(Z)-7-Tricosene 0.09 ± 0.03 0.30 ± 0.05 0.007 ± 0.001 0.01 ± 0.001
(Z)-11-Pentacosene 1.22 ± 0.11 1.57 ± 0.18 1.59 ± 0.14 1.69 ± 0.24
(Z)-7-Pentacosene 0.24 ± 0.06 0.37 ± 0.07 0.41 ± 0.05 0.48 ± 0.07
(Z)-11-Heptacosene 2.89 ± 0.23 2.35 ± 0.31 2.56 ± 0.16 2.36 ± 0.34
(Z)-9-Heptacosene 4.98 ± 0.51 4.27 ± 0.39 6.27 ± 0.52 7.04 ± 0.36
(Z)-7-Heptacosene 0.04 ± 0.01 0.53 ± 0.04 0.20 ± 0.002 0.29 ± 0.005
(Z)-13-Nonacosene 1.51 ± 0.25 1.03 ± 0.14 1.19 ± 0.22 1.52 ± 0.09
(Z)-12-Nonacosene 5.18 ± 0.50 3.06 ± 0.29 5.71 ± 0.32 4.13 ± 0.49
(Z)-11-Nonacosene 12.02 ± 0.68 9.67 ± 0.68 13.31 ± 0.63 9.40 ± 0.72
(Z)-9-Nonacosene 0.08 ± 0.04 0.12 ± 0.05 0.03 ± 0.002 0.23 ± 0.009
SUM (%) 29 26 33 31
Mean total amount ( g/labellum) 1.74 ± 0.13 1.41 ± 0.18 1.90 ± 0.15 2.13 ± 0.43
191
Chapter 3- Metabolic profiling of O
phrys fusca labellum after pollination

Chapter 3- Metabolic profiling of Ophrys fusca labellum after pollination
192
PC1 (24.25 %)
PC2
(15.
15 %
)
Overall, alkanes are present in high relative proportions accounting for 67-74 %
of labellum extracts (Table 3.1) and alkene’s proportions ranged from 26 to 33 % (Table
3.2). Alkanes highest relative proportion in labella extracts has been reported in other
Ophrys species (Ayasse et al., 2000; Schiestl et al., 2000; Mant et al., 2005). A synergistic
effect of alkanes, by increasing the intensity of male responses thus incrementing
reproductive success, was previously suggested in Ophrys sphegodes (Schiestl et al.,
2000). The same study pointed out that a blend of synthetic alkanes per se was not
significantly able at attracting male pollinators.
3.4.2. Chemical changes in Ophrys fusca labellum after pollination
3.4.2.1. Discriminating conditions under study
GC-MS data from Ophrys fusca labella of unpollinated and pollinated flowers (2
DAP and 4 DAP) were initially analysed using multivariate statistical methods, namely
by means of a Principal Component Analysis (PCA). PCA is an unsupervised clustering
method that requires no knowledge of the dataset and acts on reducing the
dimensionality of multivariate data while preserving most of the variance within it
(Goodacre et al., 2000). The principal components (PCs) can be displayed graphically
as a score scatter plot, which is useful for observing any grouping in the dataset.
Relative proportions of the 22 compounds identified by GC-MS were used for a PCA-
based analysis considering 2 and 4 days after pollination (DAP), separately. Graphical
representation of two principal components (PCs) is shown in Fig. 3.5 for 2 DAP, and in
Fig. 3.6 for 4 DAP dataset.
Figure 3.5- Scatter plot of Ophrys fusca labella extracts of unpollinated (UP2DAP) and pollinated (P2DAP) flowers at 2DAP by means of a principal component analysis (PCA). PC1- principal component 1; PC2- principal component 2.

Chapter 3- Metabolic profiling of Ophrys fusca labellum after pollination
193
From the PCA analysis at 2 DAP, six principal components with an eigenvalue
above one, explained 70.8 % of the total matrix variation (data not shown). The first two
PCs explained 39.5 % of the total variation (Fig. 3.5), yet no clear differentiation
between unpollinated and pollinated data at 2 DAP was observed. At 4 DAP, PCA
analysis retrieved nine PCs explaining 82.1 % of total variation (data not shown). The first
two principal components only explained a total of 30.8 %, 17.4 % for PC1 and 13.4 %
PC2 (Fig. 3.6). Thus, PCA analysis was not able to discriminate any of the conditions
tested. Previous studies on Ophrys sphegodes labella headspace samples revealed
that the same compounds were present in both unpollinated and pollinated flowers.
Moreover, variation on quantitative, rather than qualitative, compositions were
observed after pollination event (Schiestl and Ayasse, 2001).
Figure 3.6- Scatter plot of Ophrys fusca labella extracts of unpollinated (UP4DAP) and pollinated (P4DAP) flowers at 4DAP by means of a principal component analysis (PCA). PC1- principal component 1; PC2- principal component 2.
3.4.2.2. Odour and pollination event
In most post pollination systems, change and/or cessation of odour production
display important functions, namely in saving resources (flower maintenance and odour
production are energy-consuming) and in incrementing reproductive success, by
reducing attractiveness of pollinated flowers to direct pollinators to unpollinated flowers
PC1 (17.4 %)
PC2
(13.
4 %
)

Chapter 3- Metabolic profiling of Ophrys fusca labellum after pollination
194
of the same inflorescence (Gori, 1983). In order to determine if odour bouquet
decreased with pollination event, total absolute amounts of labella extracts in both
unpollinated and pollinated flowers at 2 DAP and 4 DAP were calculated (Fig. 3.7).
Figure 3.7- Mean total absolute amounts (±SEM) of Ophrys fusca labella extracts of unpollinated (UP) and pollinated (P) flowers at 2DAP and 4DAP. N- Sample size.
At 2 DAP, total odour amounts decreased from 6.05± 0.35 g (unpollinated) to
5.43± 0.42 g (pollinated), this difference having no statistical significance (Mann-
Whitney U-test, P>0.025- Appendix VII). At 4 DAP, increase on total odour amounts from
5.84± 0.37 g (unpollinated) to 6.89± 1.0 g (pollinated) also revealed no statistical
significance (Mann-Whitney U-test, P>0.025- Appendix VII). These results are in
accordance with previous studies on Ophrys sphegodes flower extracts, according
which a slight decreased on total amounts were observed, though not being
statistically significant (Schiestl and Ayasse, 2001). Maintenance of odour production
after pollination has also been reported before (for more detail see Schiestl and Ayasse,
2001). Being pseudocopulation- eliciting odour compounds, part of the plant
epicuticular wax important for water loss prevention (Hadlye, 1981; Jetter and Kunst,
2008), change/cessation of these compounds production might not be immediate
(Schiestl and Ayasse, 2001).
3.4.2.3. Cuticular hydrocarbons and pollination
Since the elucidation of the chemical basis of the sexual deception mechanism
carried out by Schiestl and co-workers (1999), studies on the chemical basis relying
Ophrys pollination has been focused mainly on n-alkanes and n-alkenes, which are
responsible for displaying copulatory behaviour by male pollinators onto the orchid
Tota
l am
oun
t [ g
/la
be
llum
]
N= 25 25 24 24 UP2DAP P2DAP UP4DAP P4DAP
6.06
6.89
5.845.43
4.0
4.5
5.0
5.5
6.0
6.5
7.0
7.5
8.0

Chapter 3- Metabolic profiling of Ophrys fusca labellum after pollination
195
labellum (Schiestl et al., 1999; Ayasse et al., 2003; Mant et al., 2005; Stökl et al., 2005). In
Ophrys fusca labella, an overall study on dynamics of both alkanes and alkenes relative
proportion and its correlation with pollination, was conducted. To evaluate if
environmental conditions influenced compounds compositions on control labella
extracts, variation between unpollinated samples at 2 DAP and 4 DAP was examined
(LSD post-hoc test- Appendix VIII). No significant variation in odour composition of
unpollinated flowers labella extracts was found in the time-course analysed (Appendix
IX).
a) Alkanes
In Ophrys fusca labella extracts, alkanes composition is dominated by tricosane
and heptacosane, and in lower extent by pentacosane and nonacosane (Table 3.1).
These compounds were identified previously as being prevalent in Ophrys fusca labella
extracts (Schiestl and Ayasse, 2002; Stölk et al., 2005). Exception was seen on
nonacosane since, to our knowledge, no reports have been published on Ophrys fusca
labella extracts related to its presence/quantity (Schiestl and Ayasse, 2002; Stölk et al.,
2005). At 2 days after pollination, relative proportions of three n-alkanes revealed to be
statistically significant: heptacosane and octacosane increased and hentriacontane
decreased after pollination (Fig. 3.8). Four days after pollination, no differences in
alkane relative amounts were observed between unpollinated and pollinated flowers
(LSD post- hoc test- Appendix VIII and Appendix iX).
Figure 3.8- Mean relative amounts (±SEM) of n-alkanes in Ophrys fusca labellum extracts in unpollinated (UP) and pollinated (P) flowers 2 days after pollination (DAP). * P<0.05, LSD post hoc test.
0
5
10
15
20
25
do
co
san
e
tric
osa
ne
tetr
ac
osa
ne
pe
nta
co
san
e
he
xac
osa
ne
he
pta
co
san
e
oc
tac
osa
ne
no
na
co
san
e
he
ntr
iac
on
tan
e
Me
an
(+SE
M)
%
UP 2DAP P 2DAP
*
*
*
_

Chapter 3- Metabolic profiling of Ophrys fusca labellum after pollination
196
b) Alkenes
Alkenes (unsaturated hydrocarbons), although generally less common, were
also widespread among the conditions analysed. In O. fusca labella extracts the (Z)-
12+(Z)-11 alkenes with different chain-lenghts (C21, C23, C25, C27) (Table 3.2)
represented 65- 77 % of the total identified alkenes.
At 2 DAP, relative proportions of four alkenes revealed to be statistically
significant: (Z)-12+(Z)-11-C29 decreased while (Z)-7 alkenes (C21, C27) increased after
pollination (Fig. 3.9; LSD post-hoc test- Appendix VIII). At 4 days after pollination, a
statistically significant decrease on (Z)-12+(Z)-11-C29 alkenes and increase on (Z)-9-C29
was observed on labella of pollinated flowers (Fig. 3.10; LSD post-hoc test- Appendix VIII
and Appendix iX).
Figure 3.9- Mean relative amounts (±SEM) of n-alkenes in Ophrys fusca labella extracts in unpollinated (UP) and pollinated (P) flowers 2 days after pollination (DAP).* P<0.05, LSD post hoc test.
0
2
4
6
8
10
12
(Z)-
9- h
enei
cose
ne
(Z)-
7- h
enei
cose
ne
(Z)-
9- tr
icos
ene
(Z)-
7- tr
icos
ene
(Z)-
11-
pent
acos
ene
(Z)-
7- p
enta
cose
ne
(Z)-
11-
hept
acos
ene
(Z)-
9- h
epta
cose
ne
(Z)-
7- h
epta
cose
ne
(Z)-
13-n
onac
osen
e
(Z)-
12-n
onac
osen
e
(Z)-
11-n
onac
osen
e
(Z)-
9-no
naco
sene
Me
an
(+SE
M)
%
UP 2DAP P 2DAP
* *
*
*
_
-

Chapter 3- Metabolic profiling of Ophrys fusca labellum after pollination
197
Figure 3.10- Mean relative amounts (±SEM) of n-alkenes in Ophrys fusca labella extracts in unpollinated (UP) and pollinated (P) flowers 4 days after pollination (DAP). * P<0.05, LSD post hoc test.
c) Post pollination mechanism in Ophrys fusca
Specific ratios of alkanes and alkenes have been found to be divergent among
Ophrys species that attract different pollinator species but are identical in species
pollinated by the same bee species (Stökl et al., 2005; Cortis et al., 2009). According to
Schiestl and co-workers (1999) specific patterns of alkenes play a key role in male
pollinators attraction. In a pioneer study on Ophrys sphegodes, Schiestl and Ayasse
(2001) proposed that the increase on farnesyl hexanoate production in pollinated
flowers was responsible for guiding pollinators to unpollinated flowers of the
inflorescence, thus having a role as a “flower repulsive compound”. Ophrys sphegodes
and O. fusca are both pollinated by males of Andrena nigroaenea Kirby (Paulus and
Gack, 1990), yet differences on the pseudocopulatory behaviour of the insect prevents
hybridization thus maintaining reproductive isolation (Kullenberg, 1961; Paulus and
Gack, 1990). No data is available on pollinators of O. fusca Portuguese populations. In
our study, farnesyl hexanoate was not identified in labella extracts of pollinated flowers.
Compounds such as farnesol or farnesyl octanoate identified in O. lutea and O.
insectifera were proposed as displaying a function similar to farnesyl hexanoate (Borg-
0
2
4
6
8
10
12
14
(Z)-
9- h
enei
cose
ne
(Z)-
7- h
enei
cose
ne
(Z)-
9- tr
icos
ene
(Z)-
7- tr
icos
ene
(Z)-
11- p
enta
cose
ne
(Z)-
7- p
enta
cose
ne
(Z)-
11- h
epta
cose
ne
(Z)-
9- h
epta
cose
ne
(Z)-
7- h
epta
cose
ne
(Z)-
13-n
onac
osen
e
(Z)-
12-n
onac
osen
e
(Z)-
11-n
onac
osen
e
(Z)-
9-no
naco
sene
Me
an
(+SE
M)
%
UP 4DAP P 4DAP
*
*
*
_

Chapter 3- Metabolic profiling of Ophrys fusca labellum after pollination
198
Karlson, 1990; Schiestl and Ayasse, 2001). However, in Ophrys fusca none of these
compounds were found in the samples of pollinated plants.
Probably, the differences in alkene’s relative proportions here reported may not
reflect a loss of labellum attractiveness after pollination. As suggested by Schiestl and
Ayasse (2001), inflorescence attractiveness may be maintaned even after successful
pollination of single flowers, thereby increasing reproductive success of the whole
inflorescence. Since no farnesyl hexanoate or similar compound was identified after
pollination, it remains to be addressed the reasons for the pollinator to select
unpollinated flowers rather than pollinated ones in the same inflorescence. Other
compounds displaying functions similar to those attributed for farnesyl hexanoate in O.
sphegodes post pollination mechanism cannot be discarded.
3.4.3. Considerations on Ophrys fusca pollinator species
The so-called Ophrys fusca -group includes approximately 10 closely related
species often hardly distinguishable by morphological traits (Paulus and Gack 1981;
Delforge, 1995). In Portugal, a huge variation between O. fusca populations is easily
observed. Males of the bee Andrena nigroaenea have been described as being O.
fusca pollinator species (Paulus and Gack, 1990), but reports on Ophrys fusca in
southern Spain pointed out for Colletes cunicularius as also a pollinator species (Paulus
and Gack, 1981). Andrena nigroaenea also pollinates O. sphegodes, but cephalic
pseudopulation prevents hybridization with O. fusca (Kullenberg, 1961; Paulus and
Gack, 1990). To our knowledge, O. fusca pollinator species is not well characterized in
Portugal. Labella extracts of unpollinated flowers represent the species-specific odour
profile, since no significant differences were seen on both 2 DAP and 4 DAP (LSD post-
hoc test- Appendix VIII). Analysis was focused on alkenes with double bonds at positions
7, 9 and 12 (i.e. representing (Z)-11+ (Z)-12 alkenes together) which are known to elicit
copulatory behaviour of both A. nigroaenea (Schiestl et al., 1999) and C. cunicularius
(Mant et al., 2005) males.
Specificity of an odour signal may reflect the presence of different compounds
and/or differences in the relative amounts of a given set of compounds. Analysis of
odour bouquet of the sympatric species O. bilunulata and O. fusca, which are
pollinated respectively by Andrena flavipes Panzer and by A. nigroaenea Kirby,
revealed that differences on alkene’s patterns were responsible for pollinator specificity
(Schiestl and Ayasse, 2002). The (Z)-7-C27 was only found in O. bilunulata and (Z)-7-C29
occurred almost exclusively, whereas (Z)-7-C25 was predominantly found in O. fusca
(for more detail see Schiestl and Ayasse, 2002). Labella extracts composition here
reported are in accordance with earlier reports (Schiestl and Ayasse, 2002). Despite the

Chapter 3- Metabolic profiling of Ophrys fusca labellum after pollination
199
fact that (Z)-7-C27 was detected only in O. bilunulata by Schiestl and Ayasse (2002),
these compound was identified in the present study in O. fusca, which is in accordance
with previous reports (Erdmann, 1996). In O. fusca and O. bilunulata, different relative
proportions of the same odour compounds mediate the pollinator specificity (Schiestl
and Ayasse, 2002). Colletes cunicularius, a widespread ground nesting solitary bee in
Europe, pollinates four different Ophrys species, including O. fusca in southern Spain
(Paulus and Gack, 1990). A study performed by Mant and co-workers (2005) on O.
exaltata and Colletes cunicularius, revealed that (Z)-7 alkenes with different chain
lengths are key components of the female sex pheromone of pollinator species. In O.
fusca under analysis, all three compounds were identified in relative low amounts when
compared to (Z)-12+ (Z)-11 alkenes (Appendix IX). In a wider and comprehensive study
by Schlüter and co-workers (2011), the alkene’s composition of labella for two
sympatric species O. sphegodes (Fig. 3.11A), pollinated by A. nigroaenea, and O.
exaltata, pollinated by Colletes cunicularius (Fig. 3.11B), were exposed. These species
differ mainly in relative proportions of the double bond positions of their major alkenes:
O. sphegodes produce high levels of 9-alkenes and 12-alkenes (i.e. corresponding to
(Z)-11+ (Z)-12 alkenes together), while O. exaltata display high levels of 7-alkenes.
In O. fusca labella extracts of present study, the most predominant alkenes are
those with double bonds at positions 12 followed by the 9-alkenes (Fig. 3.11C).
Figure 3.11- Relative proportions of alkenes with double bonds at positions 7, 9 and 12 present in labella extracts:(A) Ophrys sphegodes, pollinated by A. nigroaenea (B) O. exaltata, pollinated by C. cunicullarius. Adapted from (Schlüter et al., 2011); (C) O. fusca population under study.
Interestingly, the profile of O. fusca alkenes does not seem to match any of
those exhibited by the other two Ophrys species (Fig. 3.11A- O. sphegodes and B- O.
exaltata). Since the pollinator was not identified during the time-course of this study, the
identity of the O. fusca pollinator species can only be speculated. O. fusca has been
described as being pollinated by A. nigroaenea, but alkenes proportions does not
seem to match to those reported for O. sphegodes (Fig. 3.11A), also pollinated by the
same bee species. Further studies are recommended to unravel differences between
O. sphegodes O. exaltata
∆12
∆9
∆7
O. fusca
A B C

Chapter 3- Metabolic profiling of Ophrys fusca labellum after pollination
200
these two species that are pollinated by the same Andrena species, but with different
pseudocopulation behaviour exhibited by male pollinators (i.e. cephalic- O. sphegodes
and abdominal- O. fusca). In Andrena-pollinated Ophrys species, males are attracted
by species-specific blends of straight chain hydrocarbons, mostly alkenes (Schiestl et al.,
1999; Schiestl and Ayasse, 2002; Stökl et al., 2005). Many species of the O. fusca-group
are pollinated by Andrena sp. males (Stökl et al., 2005). Since the composition of O.
fusca labella extracts (Fig. 3.11C) was different from the one reported for O. sphegodes
(Fig. 3.11A), which is Andrena nigroaenea pollinated, it cannot be ruled out that a
different Andrena species may pollinate O. fusca population under study. Throughout
the time-course of our study, an Andrena sp. individual was found trapped on the net
disposables covering O. fusca plants, and later identified as being a male of the
species Andrena livens Perez (Schiestl FP, Personal Communication). Being an Andrena
sp. male, it is possible that this species may be, in fact, a pollinator of O. fusca. Up to
now, no reports on Andrena livens were release as an Ophrys-pollinator species and, to
confirm this hypothesis, pseudocopulation event should be registered and further GC-
EAD analysis performed to determine the behaviourally-active compounds.
3.5. Conclusions
Chemical changes after pollination event were evaluated by a metabolic
profiling of in-field Ophrys fusca plants by means of a GC-MS analysis. Labella from
unpollinated and pollinated flowers were collected 2 (2 DAP) and 4 (4 DAP) days after
pollination. Analysis was focused on straight chain saturated hydrocarbons (n-alkanes)
and unsaturated (n-alkenes) hydrocarbons with chain lengths 21–29 and with double
bond positions 7, 9, 11 or 12, since they have been shown to be responsible for
pollinator attraction in other Ophrys species. Variations were depicted in quantitative
compositions (e.g. altered proportions of the same compound) rather than in
qualitative (i.e. occurrence of a different compound in one of the investigated
conditions). The relative proportions of alkenes were the most variable at 2DAP and
4DAP, since various compounds increase or decrease after pollination. Alkanes only
varied significantly at 2DAP. No significant decrease in total odour bouquet amounts
was verified after pollination, which is in agreement with previous studies (Schiestl and
Ayasse, 2001). Our results demonstrate that post pollination mechanism does not rely on
an abrupt decrease of odour bouquet, as reported earlier (Schiestl and Ayasse, 2001).
This fact may be related to functions attributed to these compounds as part of the
desiccation-preventing wax layers on the flowers (Schiestl et al., 1999). The post
pollination mechanism by means of an increase emission of flower repelent compound
observed in O. sphegodes could not be observed in O. fusca pollinated samples.

Chapter 3- Metabolic profiling of Ophrys fusca labellum after pollination
201
References Aharoni A, Bocobza S, Borochov R, Eitan A, Itkin M, Kooperman N, Malitsky S, Mandel T, Nashilevitz S, Panikashvili D, Rogachev I and Venger I (2006) The plant metabolome in action. Life Science Open Day, Weizmann Institute of Science. Aragon S, Ackerman JD (2004) Does flower color variation matter in deception pollinated Psychilis monensis (Orchidaceae)? Oecologia 138: 405-413. Arn H, Städler E, Rauscher S (1975) The electroantennographic detector- a selective and sensitive tool in the gas chromatographic analysis of insect pheromones. Zeitschrift für Naturforschung 30: 722-725. Ayasse M, Schiestl FP, Paulus HF, Löfstedt C, Hansson B, Ibarra F and Francke W (2000) Evolution of reproductive strategies in the sexually deceptive orchid Ophrys sphegodes: how does flower-specific variation of odour signals influence reproductive success? Evolution 54(6): 1995-2006. Ayasse M, Schiestl FP, Paulus HF, Ibarra F, Francke W (2003) Pollinator attraction in a sexually deceptive orchid by means of unconventional chemicals. Proceedings of the Royal Society of London Series B 270: 517-522. Ayasse M, Stökl J and Francke W (2011) Chemical ecology and pollinator- driven speciation in sexually deceptive orchids. Phytochemistry, 10.1016/j.phytochem.2011.03.02. Bandeili B and Müller C (2010) Folivory versus florivory—adaptiveness of flower feeding. Naturwissenshaften 97: 79-88. Barderas MG, Laborde CM, Posada M, de la Cuesta F, Zubiri I, Vivanco F and Alvarez-Llamas G (2011) Metabolomic profiling for identification of novel potential biomarkers in cardiovascular diseases. Journal of Biomedicine and Biotechnology, 10.1155/2011/790132. Baxter IR and Borevitz JO (2006) Mapping a plant’s chemical vocabulary. Nature Genetics 38(7): 737-738. Bergström G (1993) Flowering perfumes as attractants; excitants for insect pollinators. Vanilles et Orchidées, pp 50-52. Musée international de la parfumerie (Grasse), Edisud, Congrès/Expositions temporaires. Bino RJ, Hall RD, Fiehn O, Kopka J, Saito K, Draper J, Nikolau BJ, Mendes P, Roessner-Tunali U, Beale MH, Trethewey RN, Lange BM, Wurtele ES and Sumner LW (2004) Potential of metabolomics as a functional genomics tool. Trends in Plant Science 9(9): 418-425. Borg-Karlson A-K and Tengö J (1986) Odour mimetism? Key substances in Ophrys lutea-Andrena pollination relationship (Orchidaceae:Andenidae). Journal of Chemical Ecology 12: 1927-1941. Borg-Karlson AK (1990) Chemical and ethological studies of pollination in the genus Ophrys (Orchidaceae). Phytochemistry 29: 1359-1387. Borg-Karlson A-Kn, Groth I, Ägren L and Kullenberg B (1993) Form-specific fragances from Ophrys insectifera L. (Orehidaceae) attract species of different pollinator genera. Evidence of sympatric speciation? Chemoecotogy 4(1): 39-45.

Chapter 3- Metabolic profiling of Ophrys fusca labellum after pollination
202
Brodmann J, Twele R, Francke W, Yi-bo L, Xi-qiang L and Ayasse M (2009) Orchid mimics honey bee alarm pheromone in order to attract hornets for pollination. Current Biology 19: 1368-1372. Cane JH and Tengö J (1981) Pheromonal cues direct mate seeking behaviour of male Colletes cunicularius (Hymenoptera, Colletidae). Journal of Chemical Ecology 7: 427-436. Chen C, Song Q, Proffit M, Bessière J-M, Li Z and Hossaert-McKey M (2009) Private channel: a single unusual compound assures specific pollinator attraction in Ficus semicordata. Functional Ecology 23(5): 941-950. Colquhoun IJ (2007) Use of NMR for metabolic profiling in plant systems. Journal of Pesticide Science 32(3): 200-212. Cortis P, Vereecken NJ, Schiestl FP, Lumaga MRB, Scrugli A and Cozzolino S (2009) Pollinator convergence and the nature of species’ boundaries in sympatric Sardinian Ophrys (Orchidaceae). Annals of Botany 104: 497-506. Cozzolino S and Widmer A (2005) Orchid diversity: an evolutionary consequence of deception? Trends in Ecology and Evolution 20(9): 487-494. Cozzolino C, Scopece G (2008) Specificity in pollination and consequences for postmating reproductive isolation in deceptive Mediterranean orchids. Philosophical Transactions of the Royal Society B 363: 3037-3046. de Jongh DC, Radford T, Hribar JD, Hanessian S, Bieber M, Dawson G and Sweeley CC (1969) Analysis of trimethylsilyl derivatives of carbohydrates by gas chromatography and mass spectrometry. Journal of American Chemical Society 91: 1728-1740. Delforge P (1995) Orchids of Britain and Europe. Harpercollins London. Detter K and Liepert C (1994) Chemical mimicry and camouflage. Annual Review of Entomology 39: 129-154. Dudareva N and Pichersky E (2000) Biochemical and molecular genetics aspects of floral scents. Plant Physiology 122: 627-633. Dudareva N and Negre F (2005) Practical applications of research into the regulation of plant volatile emission. Current Opinion in Plant Biology 8(1): 113-118. Erdmann DH (1996) Identifizierung und Synthese flüchtiger Signalstoffe aus Insekten und ihren Wirtspflanzen. Dissertation Universität Hamburg. Fiehn O (2001) Combining genomics, metabolome analysis, and biochemical modelling to understand metabolic networks. Comparative and Functional Genomics 2: 155-168. Fiehn O (2002) Metabolomics- the link between genotypes and phenotypes. Plant Molecular Biology 48: 155-171. Gögler J, Stök J, Sramkova A, Twele R, Francke W, Cozzolino S, Cortis P, Scrugli A and Ayasse M (2009). Ménage à trois - two endemic species of deceptive orchid and one pollinator species. Evolution 63: 2222-2234.

Chapter 3- Metabolic profiling of Ophrys fusca labellum after pollination
203
Goodacre R, Shann B, Gilbert RJ, Timmins EM, McGovern AC, Kell DB and Logan NA (2000) Detection of dipicolinic acid biomarker in bacillus spores using Currie-point pyrolysis mass spectrometry and Fourier transformation infrared spectroscopy. Analytical Chemistry 72: 119-127. Gori DF (1983) Post-pollination phenomena and adaptive floral changes In: Jones CE and Little RJ (eds) Handbook of experimental pollination biology. Van Nostrand Reinhold, New York, pp 31–49. Gullan PJ and Cranston PS (2000) Chapter 4: Sensory systems and behaviour In: Gullan PJ and Cranston PS, The insects. An outline of enthomology, 2nd Edition Blackwell Science USA, pp 83-110. Hadley NF (1981) Cuticular lipids of terrestrial plants and arthropods: A comparison of their structure and function. Biology Reviews 56: 23-37. Hall RD (2006) Plant metabolomics: from holistic hope, to hype, to hot topic. New Phytologist 169: 453-468. Heil M and Bueno JCS (2007) Herbivore-induced volatiles as rapid signals in systemic plant responses. Plant Signaling & Behavior 2: 191-197. Huber FK, Kaiser R, Sauter W and Schiestl FP (2005) Floral scent emission and pollinator attraction in two species of Gymnadenia (Orchidaceae). Oecologia 142: 564-575. Jersáková J, Johnson SD and Kindlmann P (2006) Mechanisms and evolution of deceptive pollination in orchids. Biological Reviews 81(2): 219-235. Jetter R and Kunst L (2008) Plant surface lipid biosynthetic pathways and their utility for metabolic engineering of waxes and hydrocarbon biofuels. The Plant Journal 54: 670- 683. Joyce AR and Palsson BØ (2006) The model organism as a system: integrating ‘omics’ data sets. Nature Molecular Cell Biology 7: 198-210. Knudsen JT, Eriksson R, Gershenzon J and Stahl B (2006) Diversity and distribution of floral scent. Botanical Review 72: 1-120. Kullenberg B (1961) Studies on Ophrys pollination. Zoologiska Bidrag frarz Uppsala 34: 1-340. Leonard AS, Dornhaus A, Papaj DR (2011a) Flowers help bees cope with uncertainty: signal detection and the function of floral complexity. Journal of Experimental Biology 214: 113-121. Leonard AS, Dornhaus A, Papaj DR (2011b) Forget-me-not: complex floral displays, inter-signal interactions, and pollinator cognition. Current Zoology early online: http://eebweb.arizona.edu/papaj/Pdfs/Leonard%20et%20al.%20CurrZool%20online%20proof%20version.PDF. Mant J, Peakall R and Schiestl FP (2005) Does selection on floral odour promote differentiation among populations and species of the sexually deceptive orchid genus Ophrys? Evolution 59: 1449-1463. McWilliam IG and Dewar RA (1958) Flame ionization detector for gas chromatography. Nature 181: 760, 10.1038/181760a0.

Chapter 3- Metabolic profiling of Ophrys fusca labellum after pollination
204
Nilsson LA (1992) Orchid pollination biology. Trends in Ecology and Evolution 7: 255-259. Paulus HF and Gack C (1981) Neue Beobachtungen zur Bestäubung von Ophrys (Orchidaceae) in Südspanien, mit besonderer Berücksichtigung des Formenkreises Ophrys fusca agg. In vol. 137, pp 241-258. Paulus HF and Gack C (1990) Pollination of Ophrys (Orchidaceae) in Cyprus. Plant Systematics and Evolution 169: 177-207. Peakall R and Schiestl FP (2004) A mark-recapture study of male Colletes cunicularius bees: implications for pollination by sexual deception. Behavioral Ecology and Sociobiology 56: 579-584. Peakall R, Ebert D, Poldy J, Barrow RA, Francke W, Bower CC, Schiestl FP (2010) Pollinator specificity, floral odour chemistry and the phylogeny of Australian sexually deceptive Chiloglottis orchids: implications for pollinator-driven speciation. New Phytologist 188(2): 437-450. Pichersky E and Gershenzon J (2002) The formation and function of plant volatiles: perfumes for pollinator attraction and defense. Current Opinion in Plant Biology 5: 237-243. Raguso RA (2008) Wake up and smell the roses: the ecology and evolution of floral scent. Annual Review of Ecology, Evolution and Systematics 39: 549-569. Raguso RA (2009) Floral scent in a whole-plant context: moving beyond pollinator attraction. Functional Ecology 29: 837-840. Roessner U (2007) Chapter 5: Uncovering the plant metabolome: current and future challenges. In: Nikolau BJ and Wurtele S Eds. Concepts in Plant Metabolomics, Springer : Pp 71-85. Rymer PD, Johnson SD, Savolainen V (2010) Pollinator behaviour and plant speciation: can assortative mating and disruptive selection maintain distinct floral morphs in sympatry. New Phytologist 188(2): 426-436. Saito K and Matsuda F (2010) Metabolomics for functional genomics, systems biology, and biotechnology. Annual Review of Plant Biology 61: 463-489. Schaefer HM and Ruxton GD (2009) Deception in plants: mimicry or perceptual exploitation? Trends in Ecology and Evolution 24: 676-685. Schiestl F, Ayasse M, Paulus HF, Erdmann D and Francke W (1997) Variation on floral scent emission and postpollination changes in individual flowers of Ophrys sphegodes subsp. sphegodes. Journal of Chemical Ecology 23(12): 2881-2895. Schiestl FP, Ayasse M, Paulus HF, Löfstedt C, Hansson BS, Ibarra F, Francke W (1999) Orchid pollination by sexual swindle. Nature 399: 421-422. Schiestl FP, Ayasse M, Paulus HF, Löfstedt C, Hansson BS, Ibarra F and Francke W (2000) Sex pheromone mimicry in the early spider orchid (Ophrys sphegodes): patterns of hydrocarbons as the key mechanism for pollination by sexual deception. Journal of Comparative Physiology A 186: 567-574.

Chapter 3- Metabolic profiling of Ophrys fusca labellum after pollination
205
Schiestl F and Ayasse M (2001) Post-pollination emission of a repellent compound in a sexually deceptive orchid: a new mechanism for maximising reproductive success? Oecologia 12: 531-534. Schiestl FP and Ayasse M (2002) Do changes in floral odour cause speciation in sexually deceptive orchids? Plant Systematics and Evolution 234: 111-119. Schiestl FP, Peakall R, Mant JG, Ibarra F, Schulz C, Franke S and Francke W (2003) The chemistry of sexual deception in an orchid-wasp pollination system. Science 302(5644): 437-438. Schiestl FP, Peakall R and Mant J (2004) Chemical communication in the sexually deceptive orchid genus Cryptostylis. Botanical Journal of the Linnean Society 144(2): 199-205. Schiestl FP (2005) On the success of a swindle: pollination by deception in orchids Naturwissenschaften 92: 255-264. Schiestl FP and Schlüter PM (2009) Floral isolation, specialized pollination, and pollinator behavior in orchids. Annual Review of Entomology 54: 425-446. Schiestl FP (2010) The evolution of floral scent and insect chemical communication. Ecology Letters 13: 643-656. Schiestl FP, Huber FK, Gomez JM (2010) Phenotypic selection on floral scent: trade-off between attraction and deterrence? Evolutionary Ecology, 10.1007/s10682-010-9409-y. Schlüter PM, Xu S, Gagliardini V, Whittle E, Shanklin J, Grossniklaus U and Schiestl FP (2011) Stearoyl-acyl carrier protein desaturases are associated with floral isolation in sexually deceptive orchids. Proceedings of the National Academy of Sciences USA, 10.1073/pnas.1013313108. Schomburg G (1990) Gas chromatography. A practical course. Weinheim: VCH. Sletvold N, Grindeland JM, Ågren J (2010) Pollinator-mediated selection on floral display, spur length and phenology in the deceptive orchid Dactylorhiza lapponica. New Phytologist 188(2): 385-392. Spaethe J, Streinzer M, Paulus HF (2010) Why sexually deceptive orchids have colored flowers. Communicative & Integrative Biology 3(2): 139-141. Steiger S, Schmitt T and Schaefer HM (2010) The origin and dynamic evolution of chemical information transfer. Proceedings of the Royal Society B: Biological Sciences, 10.1098/rspb.2010.2285. Stökl J, Paulus H, Dafni A, Schulz C, Francke W and Ayasse M (2005) Pollinator attracting odour signals in sexually deceptive orchids of the Ophrys fusca group. Plant Systematics and Evolution 254: 105-120. Streinzer M, Paulus HF, Spaethe J (2009) Floral colour increases short-range detectability of a sexually deceptive orchid to its bee pollinator. The Journal of Experimental Biology 212: 1365- 1370.

Chapter 3- Metabolic profiling of Ophrys fusca labellum after pollination
206
Streinzer M, Ellis T, Paulus HF, Spaethe J (2010) Visual discrimination between two sexually deceptive Ophrys species by a bee pollinator. Arthropod-Plant Interactions 4: 141-148. Tholl D, Boland W, Hansel A, Loreto F, Röse U and Schnitzler JP (2006) Practical approaches to plant volatile analysis. The Plant Journal 45: 540-560. Unsicker SB, Kunert G and Gershenzo J (2009) Protective perfumes: the role of vegetative volatiles in plant defense against herbivores. Current Opinion in Plant Biology 12: 479-485. van der Meijden E (1996) Plant defence, an evolutionary dilemma. Contrasting effects of (specialist and generalist) herbivores and natural enemies. Entomologia Experimentalis et Applicata 80: 307-310. Vereecken NJ and Schiestl FP (2008) The evolution of imperfect floral mimicry. Proceedings of the National Academy of Sciences USA 105(21): 7484-7488. Vereecken NJ and Schiestl FP (2009) On the roles of colour and scent in a specialized floral mimicry system. Annals of Botany 104: 1077-1084. Vereecken NJ and McNeil JN (2010) Cheaters and liars: chemical mimicry at its finest. Canadian Journal of Zoology 88: 725-752. Vereecken NJ, Cozzolino S, Schiestl FP (2010) Hybrid floral scent novelty drives pollinator shift in sexually deceptive orchids. BMC Evolutionary Biology 10:103, 10.1186/1471-2148-10-103. Wagner C, Sefkowb M and Kopka J (2003) Construction and application of a mass spectral and retention time index database generated from plant GC/EI-TOF-MS metabolite profiles. Phytochemistry 62: 887-900. Westrich P (1989) Die Bienen Baden-Württembergs, vol. 1, Stuttgart, Germany: Ulmer. Wiemer AP, More M, Benitez-Vieyra S, Cocucci AA, Raguso RA and Sersic AN (2008) A simple floral fragrance and unusual osmophore structure in Cyclopogon elatus (Orchidaceae). Plant Biology 11: 506-514.

Chapter 4- Final Remarks
207
Chapter 4
FINAL REMARKS
Pollination biology in Orchidaceae has long been intriguing evolutionary
biologists and interest dates back to Darwin (Darwin, 1885; Fay and Chase, 2009). The
most fascinating aspect of orchid’s biology is pollination by deception which is quite
common in Orchidaceae (Nilsson, 1992). Food (38 genera) and sexual (18 genera)
deception are the most common types of pollination by mimicry, occurring in
approximately one-third of the species (Jersáková et al., 2006; Renner, 2006). Sexual
deception mechanism was first described in the European Ophrys genus (Pouyanne,
1917). In this mechanism, Ophrys mimic their pollinators’ mating signals and are
pollinated by male insects during mating attempts (Schiestl et al., 1999). Labellum or lip
is a highly differentiated petal, which provides a landing platform to pollinators
(Cozzolino and Widmer, 2005). Flower morphological features such as labellum shape,
colour and pilosity which mimic the pollinator female body parts, are also important for
drawing male’s attention (Schiestl, 2005). Recent studies on orchid pollination focused
on mechanisms underlying pollination attraction. In Ophrys, these studies have shown
that the labellum is the main flower structure triggering copulatory behaviour on male
insects (Schiestl et al., 2000; Spaethe et al., 2007; Vereecken and Schiestl, 2008; Stökl et
al., 2008a, b, 2009; Vereecken et al., 2010). A general approach on the events following
pollination is still lacking. The study here presented intends to contribute for the
knowledge on post pollination-regulated mechanisms in the sexual deceptive orchid
Ophrys fusca Link. To accomplish such goal, two different approaches were assigned:
a transcriptional analysis and a metabolic profiling. Transcriptomics and metabolomics
were both used to gather insights on the post pollination changes occurring in Ophrys
fusca labellum. To access pollination-enhanced events, two time points were
considered for analysis: 2 and 4 days after pollination (DAP).
Labellum transcriptional analysis allowed probing gene expression modulation
of post pollination changes. The first response to pollination appears to be a stress
response (2 DAP) and later at 4 DAP, nutrient mobilization occurs and de novo protein
synthesis is induced for senescence progression. Pollination sets off proteolysis,
remobilization of nutrients such as phosphate, carbon and nitrogen from labellum to
other developing organs (e.g. flowers from the same inflorescence, ovule and/or ovary)
and deactivates energy-consuming processes and major metabolic pathways related
to labellum upholding. Soon after pollination (2 DAP), the majority of down regulated

Chapter 4- Final Remarks
208
genes in O. fusca labellum are involved in secondary metabolism and energy,
suggesting that these processes are mainly for ensuring petal vitality and resources until
successful pollination. At 4 DAP, de novo protein synthesis occurs to guarantee
senescence progression to ultimately drive the labellum for irreversible cell death. In O.
fusca, at 4 DAP, expression of several stress- and pathogen-related transcripts (GST,
antimicrobial snakin proteins, Lea5 protein, metallothioneins types 2 and 3, chitinases,
PR protein, Cys proteases, RNases), recognized as SAGs in senescence studies, may
reveal that until the newly protein synthesis is achieved for senescence progression,
labellum transcriptional regulation is mediated by non-specific stress-related pathways.
Transcripts identified by microarray analysis reveal pivotal processes associated with
secondary metabolism responsible for labellum traits (e.g. pigmentation, compounds
emission involved in pollination), proteolysis, stress and defence, and remobilization of
nutrients associated with pollination induced-senescence process.
Metabolic profiling in labella extracts was focused on cuticular compounds
(alkanes and alkenes), known to trigger the pseudocopulatory behaviour on male
pollinators. Results show that post pollination machinery does not rely on an abrupt
decrease of odour production, which is in agreement with previous reports (Schiestl and
Ayasse, 2001). This fact may be related to functions attributed to compounds involved
in Ophrys-pollinator interactions, since they are part of the desiccation-preventing wax
layers on the flowers and their immediate cessation could cause physiological
constraints on the plant (Schiestl et al., 1999). The post pollination mechanism by means
of an increased emission of a repellent compound (farnesyl hexanoate) in pollinated
flowers described in O. sphegodes, was not observed in O. fusca labella of pollinated
plants. Related compounds were suggested to display similar functions in other Ophrys
species (Schiestl and Ayasse, 2001) and detection in O. fusca remains to be addressed.
Through labellum gene expression analysis, transcripts related to biosynthetic
pathways of cuticular compounds, involved in Ophrys pollinator attraction, were
identified: stearoyl ACP desaturases (SAD). Compounds involved in Ophrys-pollinator
crosstalk are mainly alkanes and alkenes with chain lenghts 21-29 and double bond at
positions 7,9,12 or 13, which are part of the desiccation-preventing wax layer in flowers
(Schiestl et al., 1999). Alkane and alkene biosynthesis are part of the wax biosynthetic
pathway: the first results from decarbonylation in fatty acid elongation system, whereas
alkenes formation has been linked to an elongation system including a desaturase (von
Wettstein-Knowles, 2007). Expression of two stearoyl ACP- desaturase (SAD) isoforms,
SAD1 and SAD2, in two Ophrys species (O. sphegodes and O. exaltata) has been
considered flower-specific (Schlüter et al., 2011). Furthermore, SAD1 revealed to be a
non functional desaturase while SAD2 showed a significant association with alkene
production with double bonds at 9- and 12-positions (Schlüter et al., 2011). A transcript
Chapter 4- Final Remarks
209
coding for a SAD protein in Ophrys fusca displayed homology for SAD2 (Chapter 2-
Table 2.6). It is tempting to hypothesize that this SAD2 may be responsible for production
of 9- and 12- alkenes, the most prevalent in Ophrys fusca labellum extracts (see
Chapter 3- Fig. 3.11C). At four days after pollination, SAD2 down regulation may
suggest a reduction of alkene production, possibly of those with double bonds at
positions 9 and 12. In fact, labella extracts of pollinated flowers at 4 DAP revealed a
significant decrease on (Z)-12-+(Z)-11-nonacosene, but not on 9-alkenes (see Chapter
3- Fig. 3.9). Modulation of the gene expression may be related to a decrease in odour
compounds after pollination, which, in turn, could be responsible for the significant
decrease of (Z)-12-+(Z)-11-nonacosenes at 4 DAP.
By combining both transcriptional and metabolic profiling analysis to study post
pollination events in a sexually deceptive orchid, the work here presented gives an
important contribution for the understanding of this peculiar pollination system.
Modulation of gene expression after pollination provides insights on the post pollination
changes in the labellum revealing a highly regulated mechanism that will lead to
irreversible cell death. The custom-made cDNA chip may be useful for performing cross-
species hybridization to track differences on transcripts modulation and to disclose the
genetic basis underlying sexual deception. Other orchids with distinct pollination
strategies (e.g. food deception) can be used as well for prospecting differences on
different deceptive mechanisms. Future studies should focus on a post transcriptional
approach during post pollination events in this orchid species, thereby allowing the
possibility to integrate datasets from different O’mics to unravel the complexity of
pollination-enhanced events. Differences in gene expression do not directly correspond
to differences at protein expression levels, as they may be governed by post
transcriptional and/or translational mechanisms. By performing a proteomic approach,
proteins as well as post translational modifications involved in events following
pollination could be assigned. A labellum post pollination proteomics analysis would
allow tracking enzymes responsible for alkenes’ production, thereby giving a more
comprehensive walkthrough of their regulation on pollination event. Such observations
could adjoin some awareness on the genetic basis of pollinator attraction.
Given the huge amount of information retrieved by transcriptional high
throughput studies, a metabolome analysis should be included in future prospects for a
global O’mics integration. The integrated output could be used towards the
elucidation of the sexual deception mechanism in Ophrys.

Chapter 4- Final Remarks
210
References
Cozzolino S and Widmer A (2005) Orchid diversity: an evolutionary consequence of deception? Trends in Ecology and Evolution 20(9): 487-494. Darwin C (1885) On the various contrivances by which orchids are fertilised by insects, John Murray. Fay MF and Chase MW (2009) Orchid biology: from Linnaeus via Darwin to 21st century. Annals of Botany 104: 359-364. Jersáková J, Johnson SD and Kindlmann P (2006) Mechanisms and evolution of deceptive pollination in orchids. Biological Reviews 81(2): 219-235. Nilsson LA (1992) Orchid pollination biology. Trends in Ecology and Evolution 7: 255-259. Renner SS (2006) Rewardless flowers in the angiosperms and the role of insect cognition in their evolution. In: Waser NM and Olerton J (eds.) Plant- Pollinator Interactions: From Specialization to Generalization, University of Chicago Press, Chicago, IL. Pp123-144. Schiestl FP, Ayasse M, Paulus HF, Löfstedt C, Hansson BS, Ibarra F and Francke W (1999) Orchid pollination by sexual swindle. Nature 399: 421-422. Schiestl FP, Ayasse M, Paulus HF, Löfstedt C, Hansson BS, Ibarra F and Francke W (2000) Sex pheromone mimicry in the early spider orchid (Ophrys sphegodes): patterns of hydrocarbons as the key mechanism for pollination by sexual deception. Journal of Comparative Physiology A 186: 567-574. Schiestl F and Ayasse M (2001) Post-pollination emission of a repellent compound in a sexually deceptive orchid: a new mechanism for maximising reproductive success? Oecologia 12: 531-534. Schiestl FP (2005) On the success of a swindle: pollination by deception in orchids Naturwissenschaften 92: 255-264. Schlüter PM and Schiestl FP (2008) Molecular mechanisms of floral mimicry in orchids. Trends in Plant Science 13(5): 228-235. Schlüter PM, Xu S, Gagliardini V, Whittle E, Shanklin J, Grossniklaus U and Schiestl FP (2011) Stearoyl-acyl carrier protein desaturases are associated with floral isolation in sexually deceptive orchids. Proceedings of the National Academy of Sciences USA, 10.1073/pnas.1013313108. Spaethe J, Moser WH and Paulus HF (2007) Increase of pollinator attraction by means of a visual signal in the sexually deceptive orchid, Ophrys heldreichii (Orchidaceae). Plant Systematics and Evolution 264: 31-40. Stökl J, Paulus H, Dafni A, Schulz C, Francke W and Ayasse M (2005) Pollinator attracting odour signals in sexually deceptive orchids of the Ophrys fusca group. Plant Systematics and Evolution 254: 105-120. Stökl J, Schlüter PM, Stuessy TF, Paulus HF, Assum G and Ayasse M (2008a) Scent variation and hybridization cause the displacement of a sexually deceptive orchid species. American Journal of Botany 95: 472-481.
Chapter 4- Final Remarks
211
Stökl J, Twele R, Erdmann DH, Francke W and Ayasse M (2008b) Comparison of the flower scent of the sexually deceptive orchid Ophrys iricolor and the female sex pheromone of its pollinator Andrena morio. Chemoecology 17: 231-233. Stökl J, Schlüter PM, Stuessy TF, Paulus HF, Fraberger E, Erdmann D, Schulz C, Francke W, Assum G and Ayasse M (2009) Speciation in sexually deceptive orchids: pollinator-driven selection maintains discrete odour phenotypes in hybridizing species. Botanical Journal of Linnean Society 98: 439-451. Vereecken NJ and Schiestl FP (2008) The evolution of imperfect floral mimicry. Proceedings of the National Academy of Sciences USA 105(21): 7484-7488. Vereecken NJ, Cozzolino S and Schiestl FP (2010) Hybrid floral scent novelty drives pollinator shift in sexually deceptive orchids. BMC Evolutionary Biology 10: 103; 10.1186/1471-2148-10-103. von Wettstein-Knowles P (2007) Analyses of barley spike mutant waxes identify alkenes, cyclopropanes and internally branched alkanes with dominating isomers at carbon 9. The Plant Journal 49: 250-264.

212
APPENDIX I
6210- Semi-natural dry grasslands and scrubland facies on calcareous substrates (Festuco-Brometalia) (* important orchid sites) The grasslands of the 6210 habitat are among the most species-rich plant
communities in Europe in terms of the number of species they support per unit area. The
6210 habitat type includes a wide range of grasslands communities which are generally
assigned to the phytosociological class Festuco-Brometea. This habitat includes dry to
semi-dry grasslands and scrubland occurring from the lowland to the mountain level
and occurring on calcareous to neutral substrates. The habitat is considered a priority
type (6210*) only if it is an important orchid site.
Characteristic species: Anthyllis vulneraria, Arabis hirsuta, Brachypodium pinnatum,
Bromus inermis, Campanula glomerata, Carex caryophyllea, Carlina vulgaris,
Centaurea scabiosa, Dianthus carthusianorum, Eryngium campestre, Koeleria
pyramidata, Leontodon hispidus, Medicago sativa ssp. falcata, Ophrys apifera, O.
insectifera, Orchis mascula, O. militaris, O. morio, O. purpurea, O. ustulata, O. mascula,
Polygala comosa, Primula veris, Sanguisorba minor, Scabiosa columbaria, Veronica
prostrata, V. teucrium.
In Portugal, 6210 habitat is indicated by the predominance of Brachypodium
phoenicoides (Class Festuco-Brometea) and presence of the following orchid species:
Ophrys dyris, O. fusca, O. lutea, O. scolopax, O. tenthredinifera, O. vernixia, Orchis
collina, O. italica, O. mascula, O. morio, O. papilionacea, among other orchid species.
62 - Semi-natural dry grasslands and scrubland facies
EUNIS Classification: E1.2 Perennial calcareous grassland and basic steppes

213
APPENDIX II Box-plots of the log (base 2) ratio M values (log2-transformed intensity ratio between
unpollinated and pollinated samples) before (A) and after (B) print-tip loess
normalization are presented for both 2DAP (1) and 4DAP (2) time points used in gene
expression studies. This allows assessing the need for slide scale normalization, a
normalization that will ensure the same scale for all arrays. It also permits to assess if the
scale of different print-tip groups is comparable.
1. Box-plots in all arrays for 2 DAP hybridizations.
2. Box-plots in all arrays for 4 DAP hybridizations.
A B
A B

214
APPENDIX III qPCR primer efficiency plots. Median quantification cycle (Cq) values of each set of ten-fold serial dilution plotted against the logarithm of
cDNA clone (template) concentration. Reaction efficiency is given by [10(1/-S)-1] × 100%, where S represents the slope of the linear
regression line.
214
40 S ribosomal protein S10 -lik e y = -3.4431x + 11.272R 2 = 0.9942
0
5
10 15 20 25 30 35
-6 -5 -4 -3 -2 -1 0 Log10 cDNA clone
Cq
Chap erone y = -3.4793x + 10.362R 2 = 0.9902
0
5
10 15 20 25 30 35
-6 -5 -4 -3 -2 -1 0 Log1 0 cDNA clone
Cq
4 - α- glucanotran sferase y = -3.7544x + 6.8058R2 = 0.9936
0 5
10 15 20 25 30 35
-6 -5 -4 -3 -2 -1 0Log1 0 cDNA clone
Class III Chitinase y = -3.6963x + 8.6105R 2 = 0.9977
0
5
10 15 20 25 30 35
-6 -5 -4 -3 -2 -1 0
PR1 0c y = -3.8528x + 11.45 8R 2 = 0.9952
0 5
10
15
20
25
30
35
-6 -5 -4 -3 -2 -1 0 Log10 cDNA clone
Oligopept idase y = -3.6979x + 8.2 473R 2 = 0.9885
0
5
10 15 20 25 30 35
-6 -5 -4 -3 -2 -1 0Log10 cDNA clone
Cq C
q
Cq Cq
Log10 cDNA clone

215
APPENDIX III (CONTINUED) qPCR primer efficiency plots. Median quantification cycle (Cq) values of each set of ten-fold serial dilution plotted against the logarithm of
cDNA clone (template) concentration. Reaction efficiency is given by [10(1/-S)-1] × 100%, where S represents the slope of the linear
regression line.
ACP-stearoyl desaturases (SAD2) y = -3.4485x + 11.338R2 = 0.9977
0
5
10 15 20 25 30 35
-6 -5 -4 -3 -2 -1 0 Log10 cDNA clone
Cq
M etallothionein type 3 y = -3.5022x + 7.5863R 2 = 0.9972
0
5
10 15 20 25 30 35
-6 -5 -4 -3 -2 -1 0Log10 cDNA clone
Cq
Stearoyl-acyl-carrier protein desaturase (SAD1)
y = -3.4435x + 9.8143 R2 = 0.9979
0 5
10 15 20 25 30 35
-6 -5 -4 -3 -2 -1 0Log10 cDNA clone
Cq
Glucosylceramidase y = -3.4524x + 9.8478 R2 = 0.997
0 5
10 15 20 25 30 35
-6 -5 -4 -3 -2 -1 0 Log10 cDNA clone
Cq
215

216
APPENDIX IV
Melting curves depicted from standard curves obtained in the qPCR experiments. Melting curve images were collected using StepOneTM
software ver. 2.1 (Applied Biosystems). Black arrow indicates negative control melting curve.
Oligopeptidase 4-α-glucanotransferase 40S ribosomal protein S10-like PR10c
216

217
APPENDIX IV (CONTINUED)
Melting curves depicted from standard curves obtained in the qPCR experiments. Melting curve images were collected using StepOneTM
software ver. 2.1 (Applied Biosystems). Black arrow indicates negative control melting curve.
Glucosylceramidase Stearoyl-acyl-carrier protein desaturase (SAD1) ACP-stearoyl desaturase (SAD2) Metallothionein type 3
217

218
APPENDIX IV (CONTINUED)
Melting curves depicted from standard curves obtained in the qPCR experiments. Melting curve images were collected using StepOneTM
software ver. 2.1 (Applied Biosystems). Black arrow indicates negative control melting curve.
Class III Chitinase Chaperone
218
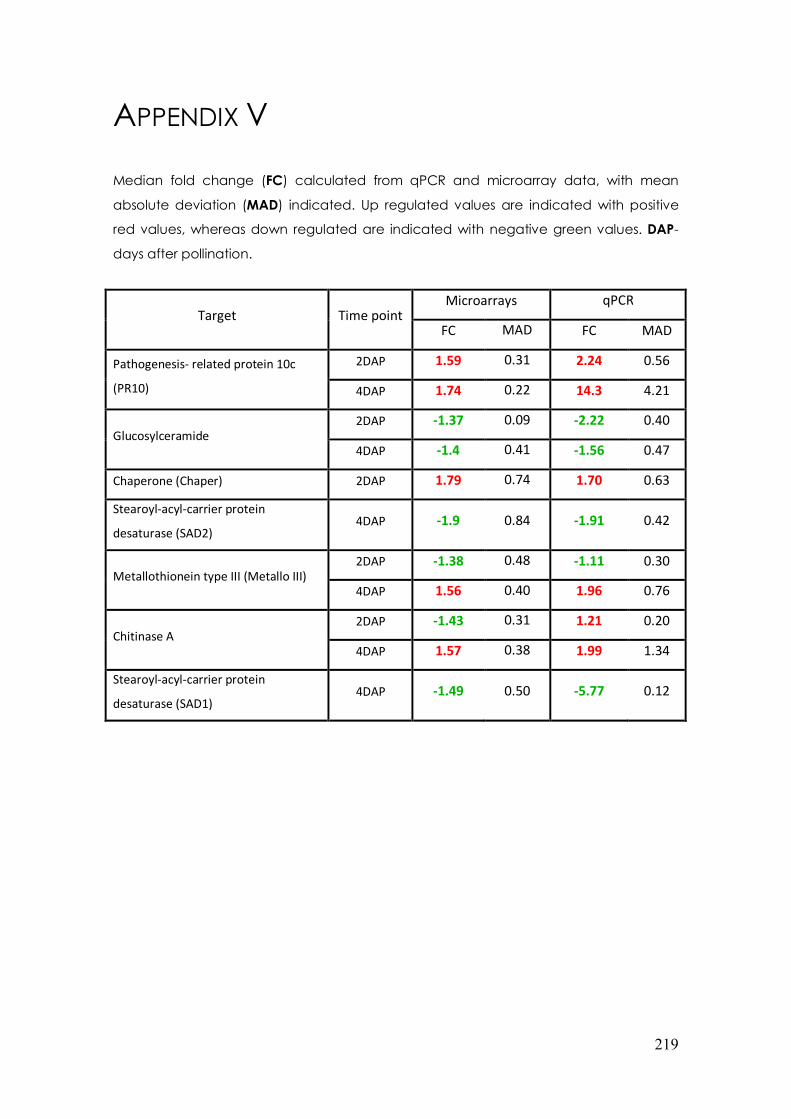
219
APPENDIX V Median fold change (FC) calculated from qPCR and microarray data, with mean
absolute deviation (MAD) indicated. Up regulated values are indicated with positive
red values, whereas down regulated are indicated with negative green values. DAP-
days after pollination.
Target Time point Microarrays qPCR
FC MAD FC MAD
Pathogenesis- related protein 10c
(PR10)
2DAP 1.59 0.31 2.24 0.56
4DAP 1.74 0.22 14.3 4.21
Glucosylceramide 2DAP -1.37 0.09 -2.22 0.40
4DAP -1.4 0.41 -1.56 0.47
Chaperone (Chaper) 2DAP 1.79 0.74 1.70 0.63
Stearoyl-acyl-carrier protein
desaturase (SAD2) 4DAP -1.9 0.84 -1.91 0.42
Metallothionein type III (Metallo III) 2DAP -1.38 0.48 -1.11 0.30
4DAP 1.56 0.40 1.96 0.76
Chitinase A 2DAP -1.43 0.31 1.21 0.20
4DAP 1.57 0.38 1.99 1.34
Stearoyl-acyl-carrier protein
desaturase (SAD1) 4DAP -1.49 0.50 -5.77 0.12

220
APPENDIX VI
Table I: Mean absolute amounts ( g) with standard error [SEM= standard deviation/√(n)]of n-alkanes (straight chain saturated
hydrocarbons), in unpollinated and pollinated Ophrys fusca labella at 2 and 4 days after pollination (DAP). Compounds are ordered in
retention times. Alkanes total amount ( g) is given as mean (± SEM) of labella sampled.
2 DAP 4 DAP
Alkanes Unpollinated (N=25) Pollinated (N=25) Unpollinated (N=24) Pollinated (N=24)
Mean ± SEM Mean ± SEM Mean ± SEM Mean ± SEM
Docosane (C22) 0.029 ± 0.004 0.035 ± 0.06 0.040 ±0.007 0.042 ± 0.007
Tricosane (C23) 1.268 ± 0.077 1.201 ± 0.11 1.080 ± 0.08 1.476 ± 0.282
Tetracosane(C24) 0.124 ± 0.013 0.182 ± 0.09 0.126 ± 0.018 0.149 ± 0.031
Pentacosane (C25) 0.55 ± 0.032 0.482 ± 0.036 0.492 ± 0.036 0.610 ± 0.226
Hexacosane(C26) 0.092 ± 0.006 0.089 ± 0.006 0.092 ± 0.008 0.115 ± 0.022
Heptacosane (C27) 1.11 ± 0.078 1.177 ± 0.072 1.079 ± 0.076 1.086 ± 0.162
Octacosane (C28) 0.064 ± 0.005 0.076 ± 0.008 0.061 ± 0.005 0.100 ± 0.027
Nonacosane (C29) 0.70 ± 0.17 0.563 ± 0.039 0.524 ± 0.034 0.718 ± 0.186
Hentriacontane (C31) 0.38 ± 0.047 0.209 ± 0.028 0.442 ± 0.044 0.461 ± 0.110
SUM (%) 71 74 67 69
Mean total amount ( g/labellum) 4.32 ± 0.27 4.02 ± 0.28 3.94 ± 0.24 4.76 ± 0.67
220

221
APPENDIX VI (CONTINUED)
Table II: Mean absolute amounts with standard error [SEM= standard deviation/√(n)]of alkenes (unsaturated hydrocarbons), in
unpollinated and pollinated Ophrys fusca labella at 2 and 4 days after pollination (DAP). Compounds are ordered in retention times.
Alkenes total amount ( g) is given as mean (± SEM) of total labella sampled.
2 DAP 4 DAP
Alkenes Unpollinated (N=25) Pollinated (N=25) Unpollinated (N=24) Pollinated (N=24)
Mean ± SEM Mean ± SEM Mean ± SEM Mean ± SEM (Z)-9-Heneicosene 0.002 ± 0.001 0.001 ± 0.0006 0.005 ± 0.001 0.003 ± 0.001
(Z)-7-Heneicosene 0.027 ± 0.003 0.042 ± 0.008 0.020 ± 0.004 0.032 ± 0.006
(Z)-9-Tricosene 0.017 ± 0.004 0.021 ± 0.004 0.023 ± 0.005 0.024 ± 0.007
(Z)-7-Tricosene 0.005 ± 0.002 0.018 ± 0.009 0.0006 ± 0.0002 0.006 ± 0.003
(Z)-11-Pentacosene 0.078 ± 0.010 0.090 ± 0.015 0.097 ± 0.012 0.109 ± 0.023
(Z)-7-Pentacosene 0.015 ± 0.003 0.021 ± 0.005 0.022 ± 0.004 0.049 ± 0.021
(Z)-11-Heptacosene 0.180 ± 0.020 0.136 ± 0.029 0.153 ± 0.023 0.170 ± 0.039
(Z)-9-Heptacosene 0.300 ±0.034 0.239 ± 0.031 0.358 ± 0.038 0.541 ± 0.149
(Z)-7-Heptacosene 0.001 ± 0.0004 0.038 ± 0.02 0.009 ± 0.004 0.019 ± 0.009
(Z)-13-Nonacosene 0.065 ± 0.018 0.057 ± 0.012 0.068 ± 0.016 0.145 ± 0.076
(Z)-12-Nonacosene 0.312 ± 0.035 0.170 ± 0.021 0.334 ± 0.30 0.317 ± 0.093
(Z)-11-Nonacosene 0.726 ± 0.055 0.563 ± 0.083 0.802 ± 0.077 0.687 ± 0.136
(Z)-9-Nonacosene 0.003 ± 0.002 0.006 ± 0.002 0.001 ± 0.0003 0.019 ± 0.011
SUM (%) 29 26 33 31
Mean total amount ( g/labellum) 1.74 ± 0.13 1.41 ± 0.18 1.90 ± 0.15 2.13 ± 0.43 221

222
APPENDIX VII
Results of Mann-Whitney U test for total amounts in Ophrys fusca labella extracts in
unpollinated and pollinated flowers time points (2DAP and 4DAP)
Unpoll vs Poll 2DAP Unpoll vs Poll 4DAP
Sum Sum
Mann-Whitney U 239.000 Mann-Whitney U 260.000
Wilcoxon W 564.000 Wilcoxon W 536.000
Z -1.426 Z -.341
Asymp. Sig. (2-tailed) 0.154 Asymp. Sig. (2-tailed) 0.733

223
APPENDIX VIII
Statiscally significant compounds resulting from LSD post-hoc test (p<0.05) in Ophrys
fusca labella extracts of unpollinated and pollinated flowers (2DAP and 4DAP)
Timepoint Compounds
unpollinated/pollinated 2DAP
Alkenes: (Z)-7-heneicosene, (Z)-7-heptacosene, (Z)-12+ (Z)-11-nonacosene
Alkanes: heptacosane, octacosane, hentriacontane
4DAP Alkenes: (Z)-12+ (Z)-11+ (Z)-9- nonacosene
unpollinated 2DAP vs. 4DAP no variation
pollinated 2DAP vs. 4DAP Alkene: (Z)-9-heptacosene
Alkanes: heptacosane, hentriacontane

224
APPENDIX IX Mean relative amounts (±SEM) of alkanes (A) and alkenes (B) in Ophrys fusca labella
extracts in unpollinated (UP) flowers 2 days and 4 days after pollination (DAP).
0
5
10
15
20
25
do
co
san
e
tric
osa
ne
tetr
ac
osa
ne
pe
nta
co
san
e
he
xac
osa
ne
he
pta
co
san
e
oc
tac
osa
ne
no
na
co
san
e
he
ntr
iac
on
tan
e
Me
an
(+SE
M)
%
UP 2DAP UP 4DAPA
_
0
2
4
6
8
10
12
14
(Z)-
9- h
enei
cose
ne
(Z)-
7- h
enei
cose
ne
(Z)-
9- tr
icos
ene
(Z)-
7- tr
icos
ene
(Z)-
11- p
enta
cose
ne
(Z)-
7- p
enta
cose
ne
(Z)-
11- h
epta
cose
ne
(Z)-
9- h
epta
cose
ne
(Z)-
7- h
epta
cose
ne
(Z)-
13-n
onac
osen
e
(Z)-
12-n
onac
osen
e
(Z)-
11-n
onac
osen
e
Me
an
(+
SEM
) %
UP 2DAP UP 4DAPB
_
Copyright © 2022 FDOKUMEN