Positional Cloning Of Genes Associated With Human Disease
333
Positionul Cloning of Genes Associuted wíth Humun Díseuse Scott Anthony Whitmore B.Sc Thesis submitted for the Degree of Doctor of Philosophy Department of Cytogenetics and Molecular Genetics, 'Women's and Children's Hospital, North Adelaide, South Australia. Faculty of Medicine, Department of Paediatrics, University of Adelaide, South Australia. January, 1999.
-
Upload
khangminh22 -
Category
Documents
-
view
2 -
download
0
Transcript of Positional Cloning Of Genes Associated With Human Disease
Positionul Cloning of Genes
Associuted wíth Humun Díseuse
Scott Anthony Whitmore B.Sc
Thesis submitted for the Degree of Doctor of Philosophy
Department of Cytogenetics and Molecular Genetics,
'Women's and Children's Hospital, North Adelaide, South Australia.
Faculty of Medicine, Department of Paediatrics,
University of Adelaide, South Australia.
January, 1999.

Table of Contents
Summary
Declaration
List ofPublications
Abbreviations
Acknowledgements
Chapter 1: Literature Review
Chapter 2z Matenals and Methods
Chapter 3: Physical Mapping of Chromosome 16q24.3
Chapter 4: Identification of Transcribed Sequences at 16q24.3
Chapter 5: Characterisation of the GASI I and CI6orf3 Genes
Chapter 6z Characterisation of Transcription Unit 6 (T6)
Chapter 7: Cloning of the Gene for Cystinosis
Chapter 8: General Discussion and Future Directions
References
Appendix: Publications
Page
58
120
156
196
227
255
I
IV
V
VI
VIII
I
92
248
Summary
Genetic linkage analysis has been successful in mapping the gene responsible for Fanconi
anaemia type A (FAA) to chromosome 16q24.3. In addition, loss of heterozygosity (LOH)
studies have localised a tumour suppressor gene involved in the development of sporadic
breast cancer to the same chromosomal region. The main aim of the thesis was to isolate the
gene(s) responsible for these disorders using a positional cloning strategy. At the start of the
project there was a lack of cloned DNA and candidate genes located at 16q24.3, therefore a
detailed physical map of this region was constructed based on overlapping cosmid, BAC, and
PAC clones. The resulting map extends approximately 1.1 Mb from the telomere of
chromosome 16q and consists of a minimum overlapping set of 35 cosmids, 2 PACs, and 1
BAC clone. This physical map encompasses the genetic markers that define the region most
likely to contain fhe FAA gene and a breast cancer tumour suppressor gene.
Refined LOH and linkage analysis by collaborating laboratories was successful in narrowing
down the candidate region of both diseases to approximately 750 kb between Dl6S303 and
D16S3026. Selected cosmids spanning the region between these markers were used as
templates for exon trapping experiments to enable identification of candidate genes. Additional
transcript data was obtained from the analysis of ESTs mapped to 76q24 3 as part of the
Human Gene Map construction at NCBI, and dbEST database screening of partial cosmid
sequence (generated from collaborating laboratories). A total of 71 unique exons were trapped
from 26 cosmid templates. Each one was successfully mapped back to its cosmid of origin
allowing an integration of the physical and transcript map. Twenty eight exons showed
significant homology to ESTs, while 7 corresponded to genes previously mapped to
chromosome 16q24.3. A group of five exons could be linked based on their EST homology
I
and physical map proximity. The corresponding gene (FAA) was later shown by collaborators
to be deleted for 2 of these 5 trapped exons in an Italian patient with Fanconi anaemia. Further
screening of individuals affected with the disorder have shown a multitude of mutations
associated with this gene. However, comparison of normal and breast tumour DNA failed to
identify mutations in FAA restricted to tumour DNA. Therefore it was concluded that FAA
was unlikely to have a role in breast tumourigenesis.
The region between D16S303 and D16S3026, containing at least 20 transcripts, was then
screened for the presence of a breast cancer tumour suppressor gene. Two candidate
transcripts were examined in detail. This involved the isolation of the complete sequence of the
corresponding gene, followed by the identification of its genomic structure. Single stranded
conformation polymorphism (SSCP) analysis was used to screen for mutations restricted to
breast tumours. One of these transcripts, subsequently referred to as the growth arrest-specific
11 (GASII) gene, was a likely candidate since the mouse homologue was expressed
specifically during cell growth arrest. GASII was found to consist of 1l exons, one of which
was identified by exon trapping, which span approximately 25 kb of genomic DNA. SSCP
analysis of breast tumour DNA failed to identify nucleotide sequence alterations when
compared to corresponding normal DNA from the same individuals. In addition, Southern
analysis of breast cancer cell line DNA failed to identify homozygous deletions encompassing
GASII and RT-PCR eliminated exon skipping as a disease causing mechanism in these cell
lines as well as in affected individuals. These results suggest this gene is not involved in breast
carcinogenesis. Another gene, Cl6orf3 (chromosome 16 open reading frame 3), was found to
lie within intron 2 of GASI1. This gene is expressed at a low level as a 1.2 kb mRN.\ is
intronless, and codes for a 125 amino acid protein which exists in two isoforms based on the
presence or absence of two copies of an imperfect tetrapeptide repeat. SSCP mutation analysis
II
also indicated this gene was not mutated in breast tumours
Analysis of a second transcript, T6, showed that this gene consisted of l8 exons (5 were
identified from exon trapping) which code for a protein of 669 amino acids that does not show
homology to any previously characterised proteins. SSCP mutation analysis of T6 again failed
to identify SSCP changes specific for breast tumour DNA alone, suggesting this gene is also
not involved in breast carcinogenesis.
The approach of exon trapping was also applied to a separate collaborative project, the
positional cloning of a gene responsible for nephropathic cystinosis. The collaborators
successfully constructed a cosmid contig across the -500 kb candidate region on chromosome
17p73 and selected clones were subsequently used for exon trapping to identify candidate
genes. A total of eight overlapping cosmids were used to identify 29 exons, 10 of which
corresponded to characterised genes previously mapped to this chromosomal region. Of the 15
exons that did not display homology to database sequences, 6 were subsequently shown by
collaborators to belong to a gene (CZll,9) which was located within a region of homozygous
deletion seen in a cystinosis family. SSCP analysis of individuals affected with cystinosis has
subsequently identified 1l different disease-causing mutations within this gene.
The technique of exon trapping has therefore enabled the cloning of two disease genes, FAA,
and CTNS, from a positional cloning approach. It has also allowed the identification of many
other novel transcripts that are candidates for a tumour suppressor gene mapping to I6q24.3
and which have not yet been further characterised. The eventual identification of all genes
(including tumour suppressor genes associated with LOH) involved in the oncogenic pathway
in breast cancer will improve our understanding of tumour progression in this disease.
, m

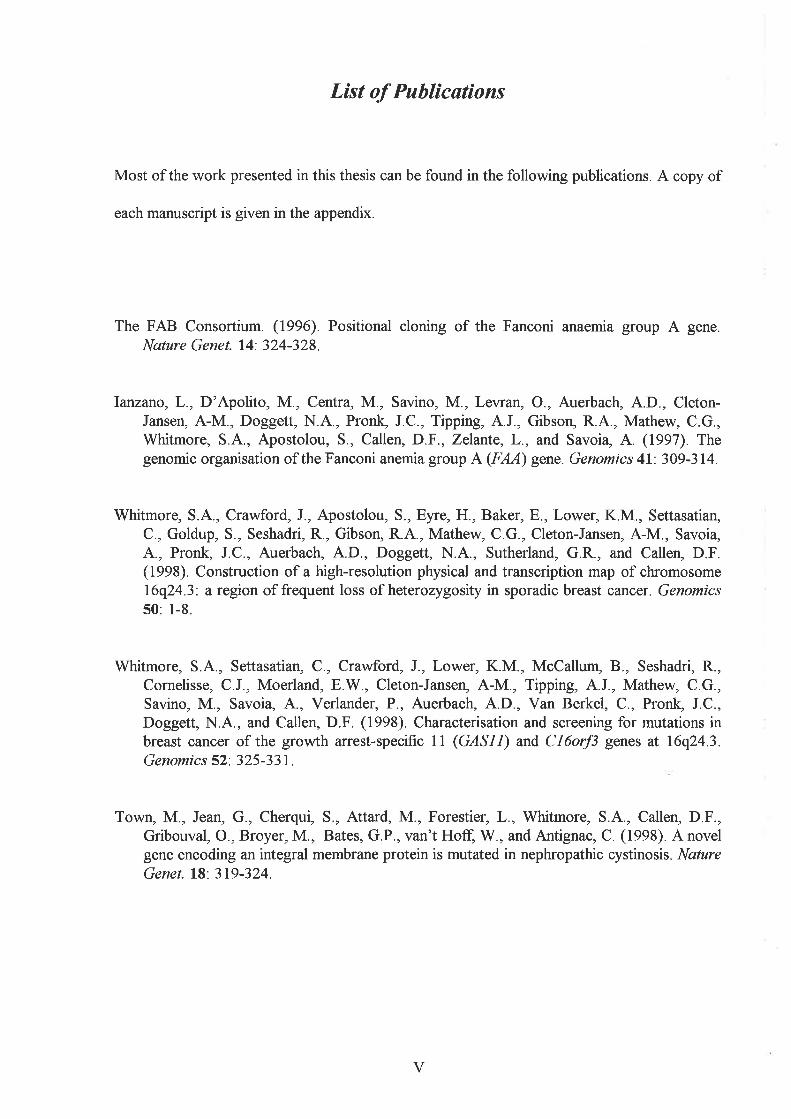
List of Publicøtions
Most of the work presented in this thesis can be found in the following publications. A copy of
each manuscript is given in the appendix.
The FAB Consortium. (1996). Positional cloning of the Fanconi anaemia group A gene.
Nctture Genet. 14: 324-328.
Ianzano, L., D'Apolito, M., Cen|ra, M., Savino, M., Levran, O., Auerbach, 4.D., Cleton-Jansen, A-M., Doggett, N.4., Pronk, J.C., Tipping, 4.J., Gbson, R.4., Mathew, C.G.,Whitmore, S.4., Apostolou, S., Callen, D.F., Zelantê,L., and Savoia, A. (1997) Thegenomic organisation of the Fanconi anemia group A(FAA) gene. Genomics 4l:309-314.
'Whitmore, S.4., Crawford, L, Apostolou, S., Eyre, H., Baker, E., Lower, K.M., Settasatian,C., Goldup, S., Seshadri, R., Gibson, R.4., Mathew, C.G., Cleton-Jansen, A-M., Savoia,4., Pronk, J.C., Auerbach, 4.D., Doggett, N.4., Sutherland, G.R., and Callen, D.F.(1998). Construction of a high-resolution physical and transcription map of chromosome16q24 3 a region of frequent loss of heterozygosity in sporadic breast cancer. Genomics50: 1-8
Whitmore, S.4., Settasatian, C., Crawford, J., Lower, K.M., McCallum, B., Seshadri, R.,Cornelisse, C.J., Moerland, E.W., Cleton-Jansen, A-M., Tipping, 4.J., Mathew, C.G.,Savino, M., Savoia, 4., Verlander, P., Auerbach, 4.D., Van Berkel, C., Pronk, J.C.,Doggett, N.4., and Callen, D.F. (1998) Characterisation and screening for mutations inbreast cancer of the growth arest-specific 11 (GASII) and Cl6orf3 genes at 16q243.Genomics 52.325-337.
Town, M., Jean, G., Cherqui, S., Attard, M., Forestier, L., Whitmore, S.4., Callen, D.F.,Gribouval, O., Broyer, M., Bates, G.P., van't Hofl W., and Antignac, C. (1998). A novelgene encoding an integral membrane protein is mutated in nephropathic cystinosis. NatureGenet. 18.319-324.
V
bp
BAC:
BLAST
C16orf:
oDNA:
dbEST:
dNTP:
DCIS
EST
FA:
FAA:
FAB
FISH:
GAS
hnRNA.
LCIS
LOH:
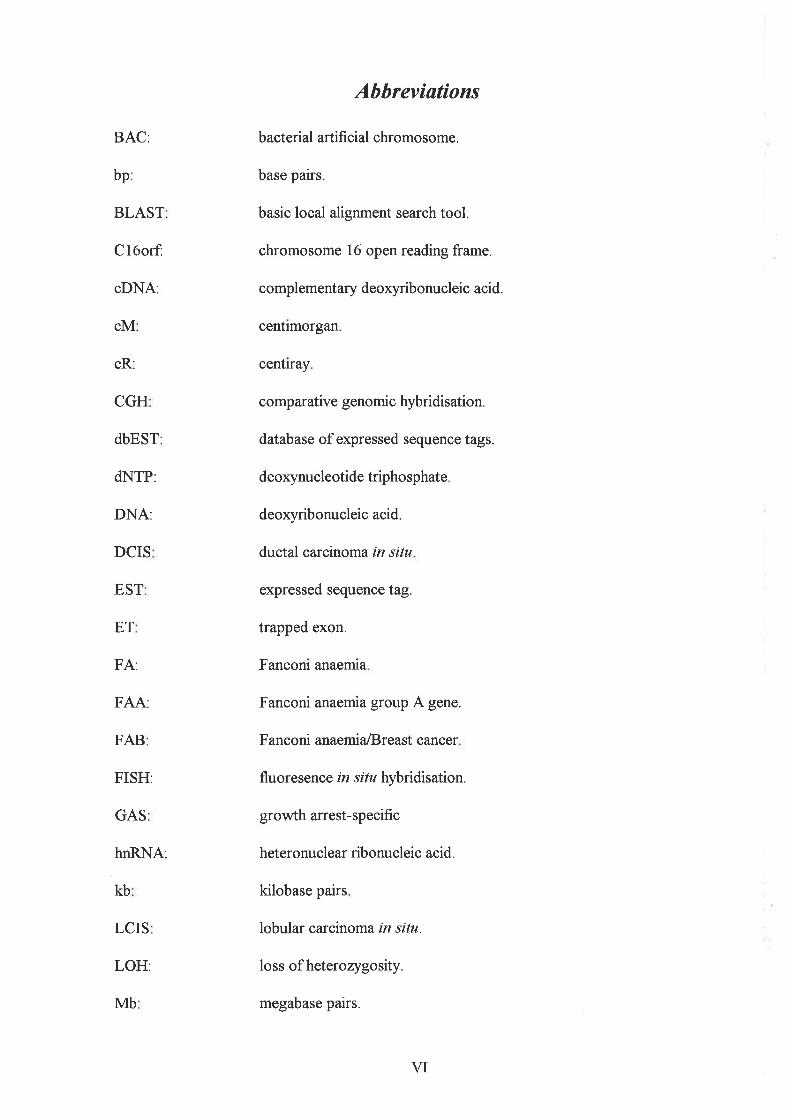
Abbreviations
bacterial artificial chromosome.
base pairs
basic local alignment search tool.
chromosome 16 open reading frame.
complementary deoxyribonucleic acid.
centimorgan
centray
comparative genomic hybridisation.
database of expressed sequence tags.
deoxynucleotide triphosphate
deoxyribonucleic acid
ductal carcinoma in situ
expressed sequence tag.
trapped exon.
Fanconi anaemia
Fanconi anaemia group A gene.
Fanconi anaemia/Breast cancer
fluoresence in situ hybridisation.
growth arrest-specific
heteronuclear ribonucleic acid.
kilobase pairs
lobular carcinoma in situ.
loss of heterozygosity
CGH
cM
cR:
DNA:
ET
kb
Mb megabase pairs.
VI
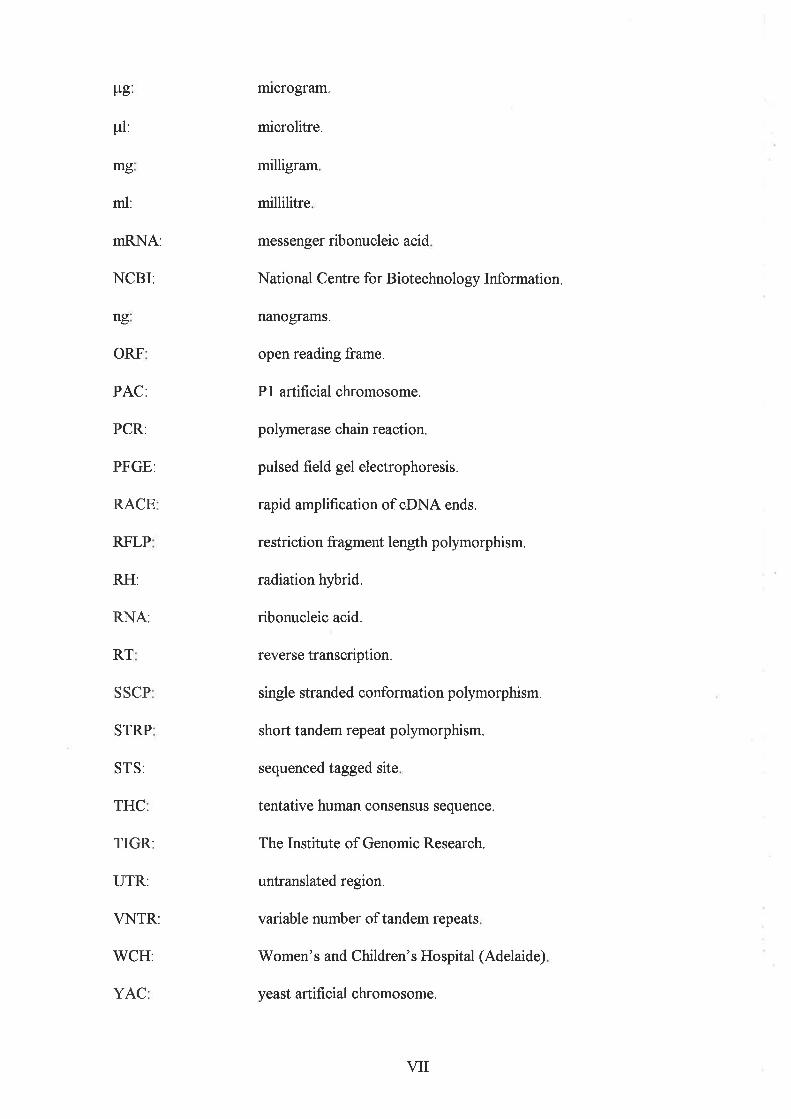
mrcrogram.l"rg:
prl:
mg
ml:
NCBI: National Centre for Biotechnolo gy Information.
microlitre.
milligram
millilitre
messenger ribonucleic acidmRNA:
ng
ORF
nanograms.
open reading frame.
Pl artificial chromosome.
polymerase chain reaction.
pulsed field gel electrophoresis.
rapid amplification of oDNA ends.
restriction fragment lengfh polymorphism.
radiation hybrid.
ribonucleic acid.
reverse transcription.
single stranded conformation polymorphism.
short tandem repeat polymorphism.
sequenced tagged site
tentative human consensus sequence.
The Institute of Genomic Research.
untranslated region.
variable number of tandem repeats
Women's and Children's Hospital (Adelaide)
yeast artificial chromosome.
PAC:
PCR:
PFGE:
RACE
RFLP
RH:
RNA:
RT
SSCP
STRP
STS:
THC
TIGR:
UTR:
VNTR:
WCH:
YAC
VII
Acknowledgments
This study was performed in the Department of Cytogenetics and Molecular Genetics at the
Women's and Children's Hospital in Adelaide. I am therefore extremely grateful to the
Department for providing me with the opportunity and resources to conduct this research
project. In particular, I would like to express my sincere thanks to my principal supervisors,
Professor Grant Sutherland and Associate Professor David Callen, who have provided me with
tremendous encouragement and support not only throughout this study, but since the first day
I began in the Department. I also wish to thank them for advice and critical review of this
thesis. Thankyou also to the Department of Paediatrics at the University of Adelaide who
coordinated all aspects of the PhD program.
I would also like to thank all members of the Department who helped create a wonderful
working environment. In particular, Kavita Bhalla, Rebecca Bilton, Joanna Crawford, Marina
Kochetkova, Gabriel Kremmidiotis, Ingrid Lensink, Karen Lower, Jason Powell, and Chatri
Settasatian, who made the lab an enjoyable place to be in. I would also like to thank Dr. Jozef
Gecz for sharing his much appreciated technical knowledge and expert advice throughout the
course of this study, andLiz Baker, Erica Woollatt, and Helen Eyre for all FISH work.
Thanks to all consortium members, in particular Dr. Anne-Marie Cleton-Jansen in Leiden for
all LOH data and especially for providing the precious breast tumour DNA samples, Joanna
Crawford and Dr. Sinoula Apostolou for their contributions to this thesis, as indicated in the
text; Dr. Ram Seshadri, Sandra Goldup, and Brett McCallum from the Flinders Medical Centre
in Adelaide for additional LOH data; Dr. Norman Doggett and Dr. Judy Tesmer for the
relentless requests for cosmid clones; and all other international consortium members and
VIII

collaborators too numerous to mention.
Finally I would like to thank my family who have shown genuine interest and provided
enorrnous support to me during this project. In particular, thanþou to my wife Helen, who has
had to endure this thesis as much as I have. Your patience and love has helped keep me going
which I appreciate so much.
IX

Literature
Review

Chqpter I Literature Review
Tøble of Contents
1.1 Introduction
1.2 Mapping Human Chromosomes
1.2.1 Genetic Linkage Mapping
1. 2. I. I Protein Polymorphisms
1. 2. I. 2 Re striction Fragment Length P olymorphisms (RFLP s)
1. 2. I. 3 Microsatellite Mqrkers
L2.1.4 Return of the Single Nucleotide Polymorphism (SNP)
l.2.2Physical Mapping
I. 2. 2. I Cytogenetic Maps
1.2.2.2 Somatic Cell HybridMaps
1.2.2.3 Radiation Hybrid (RH) Maps
1.2.2.4 Wole-Genome Based STS Maps
I. 2. 2. 5 Clone-Based Møps
1.2.2.5.1 Restriction Enzyme Based Maps
I . 2. 2. 5. 2 Repetitive Sequence Fingerprinted Maps
1.2.2.5.3 YAC-Based STS Content Maps
1.2.2.5.4 Bacterial Clone Maps
1 .2.3 Tr anscription Maps
I. 2. 3. I Classical Approaches
1.2.3.2 Chromosome Specific cDNA Libraries
I. 2. 3. 3 Hybridisation-Based Approaches
I. 2. 3.4 Direct Selection/cDNA Selection
L 2. 3. 5 Exon Trapping/Exon Amplification
I . 2. 3. 6 C omplementary DNA Se quencing and Mapping
1.2.3.7 ldentification of Genes by Sequence Homology
1.3 Mapping of Genes Associated With Disease
1.3.1 Positional Cloning ofDisease Genes
1.3.2 Positional Candidate Cloning
1.4 Complex Disorders: Identification of Genes Involved in Cancer
1.4.1 Recessive Mutations in Cancer: The Retinoblastoma Paradigm
1.4.2 Loss of Heterozygosity and Other Tumour Types
Page
5
6
6
6
8
10
10
11
t2t3
74
74
t5
t6
16
18
l819
20
2t22
24
26
29
1
30
30
30
31
55
34

Chapter I Literature Review
1.5 Breast Cancer
1.5.1 Cytogenetic Studies ofBreast Cancer
1.5.2 Familial Breast Cancer
1.5.3 Other Genes Involved in Breast Cancer: Prognostic Implications
1.5.4 Sporadic Breast Cancer and Loss of Heterozygosity
1.5.5 Loss of Heterozygosity and Chromosome 16q
1.5.6 Candidate Genes for l6q Loss of Heterorygosþ
1.6 Project Aims
J5
36
37
40
43
45
52
56
1.1 Introduction
In the past, the molecular analysis of human inherited disorders has occurred primarily through
the identification and characterisation of specific proteins and their corresponding genes. For
the majority of diseases where such information exists, the gene responsible has now been
successfully cloned. However, for many inherited diseases with interesting phenotypes the
biochemical basis for the disorder is unknown. Positional cloning provides an approach to
characterise such disease genes. This approach does not rely on information regarding a
chemical effect, but rather is initiated by mapping the disorder to a particular chromosomal
region and subsequently cloning the gene responsible based on this localisation (Ruddle, 1984;
Orkin, 1986 Collins, 1992). The increasing availability and resolution of integrated
cytogenetic, genetic, physical and transcript maps provides the necessary reagents and
information needed for disease gene localisation, and the subsequent cloning of the gene
involved.
The Human Genome Project has in essence provided these resources for the positional cloning
of genes associated with inherited disease. One of the major justifications and the premise
behind the Human Genome Project is that the knowledge of our complete DNA structure will
further our basic understandings of the role that various genes play in health and disease, both
directly and through interactions with the environment. At the onset of this project, it was
proposed that the ultimate goal would be to obtain the complete DNA sequence of each human
chromosome, an aim that was atlhat time theoretically possible, but unacceptable in terms of
cost in both time and money. This led to the establishment of a series of short-term goals,
which apart from being fundamental for the concerted sequencing efforts that are beginning to
dominate the later years of the project, have provided valuable tools towards the identification
1
Chapter I Literature Review
and mapping of all human genes, particularþ those associated with disease. Some of the
specific objectives related to the human genome for the 5-year plan released in 1993 are listed
below (Collins and Gallas, 1993; Dizikes, 1995). Each goal has been successfully completed or
in fact exceeded at the end of this 5-year period (Collins et a1.,1998).
o
a
a
a
a
Genetic mapping: Complete a human genetic map with markers spaced on average,2to 5
cM apart, with each marker being identified by a sequence-tagged site (STS).
Physical mapping: Create detailed STS maps of all human chromosomes with markers
spaced at 100 kb intervals. Generate overlapping sets of cloned DNA with continuity over
2 Mb for large parts of the human genome.
DNA sequencing: Develop more efficient approaches to allow sequencing of large
stretches of DNA and increase the sequencing capacity by increasing the number of groups
actively involved in large-scale sequence production.
Gene identification: Develop efficient methods for the identification of genes and for the
placement of known genes on physical maps.
Informatics: Develop effective software and database designs to support large-scale
mapping and sequencing projects. Create database tools that provide easy access to up-to-
date physical, genetic and chromosome mapping and sequencing information.
Positional cloning is a multi-step process beginning with the localisation of the disease gene
using linkage analysis on pedigrees in which the responsible gene is segregating. In some cases,
the disease gene may also be localised by the identification of specific associated chromosome
abnormalities such as fragile sites, deletions, duplications or translocations. For cancer related
2

Chapter I Literature Review
genes more complex methods such as comparative genomic hybridisation or loss of
heterozygosity (LOH) studies can be used. Once the disease gene is localised to a candidate
region, physically mapped DNA clones located within these sites then serve as substrates to
identify genes lying within them using a variety of methods. A major impact in positional
cloning has been the advent of single-pass end sequencing of random oDNA clones (Adams el
al., 1991,1995; Hillier et al., 1996; Touchman et al., 1997). From this sequence expressed
sequence tags (ESTs) were developed and mapped to chromosomal regions (Polymeropolous
et a1.,1992,1993; Berry et a1.,1995; Schuler et al.,1996). This rapidly increasing resource has
led to the positional candidate approach to disease gene isolation (Ballabio, 1993). In this
approach, the information obtained from a gene sequence regarding its possible function, in
combination with its localisation, is used to select candidate genes for a disease that has been
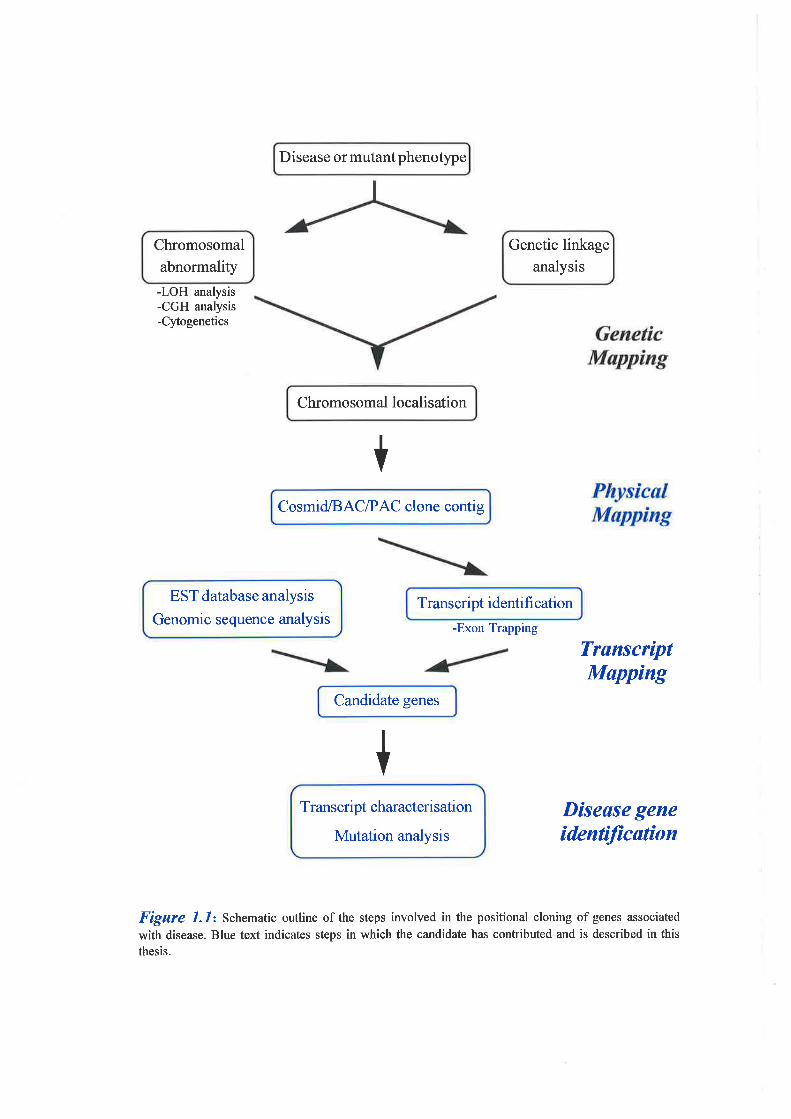
mapped to the same chromosomal location. The steps involved in the positional cloning of
disease genes is summarised in Figure 1.1.
Genetic linkage studies, which utilise polymorphic genetic markers, have been successful in
mapping the gene responsible for Fanconi anaemia Type A (FAA) to chromosome 16q24.3.In
addition, a tumour suppressor gene involved in the development of sporadic breast cancer has
been mapped to the same region based on the results of detailed LOH studies. However,
detailed physical and expressed sequence maps covering the critical region within this
cytogenetic interval were not sufficiently developed to allow immediate identification of
candidate genes. Therefore, the general aim of this study was to identify the gene(s)
responsible for these disorders by a positional cloning approach. This involves the development
of a high-density physical map of the 16q24.3 region, followed by the use of exon trapping to
identify new transcripts which are potential candidates for both these disorders. In addition, the
J
-LOH analysis-CGH analysis-Cytogenetics
Disease or mutant phenotype
Chromosomal localisation
CosmidiBAC/PAC clone contig
Genetic linkage
analysis
t
Transcript identifi cation
-Exon Trapping
TrunscríptMapping
Candidate genes
Disease geneidenffication
Figure 1.1: Schematic outline of the steps involved in the positional cloning of genes associated
with disease. Blue text indicates steps in which the candidate has contributed and is described in this
thesis.
+
Chromosomal
abnormality
EST database analysis
Genomic sequence analysis
Transcript characterisation
Mutation analysis
Chapter I Literature Review
gene responsible for the disease cystinosis has been mapped to chromosome 17p13 by genetic
linkage analysis. The exon amplification technique will therefore be used towards the cloning
of this gene also. Figure 1.1 summarises the contribution of the candidate in the overall
positional cloning approach.
This literature review will initially discuss developments in the mapping of human
chromosomes that has allowed the cloning of genes associated with disease. The latter part of
this review will discuss the identification of genes involved in tumourigenesis, in particular
those involved in the development of sporadic breast cancer. Finally, the specific aims of the
thesis will be presented.
1.2 Mapping Human Chromosomes
In order to understand the biological basis of human disease and the role genes play in the
determination of biological structure and function, knowledge is required of how the
nucleotide sequence of all human chromosomes is organised. The construction and integration
of maps at all levels of resolution is a vital first step in the determination of this DNA sequence.
However, it is anticipated that the sequence of the entire gênome will not become available
until the year 2003 (Collins et a1.,1998). Therefore methods of gene identification which make
use of the presentþ available integrated high-resolution maps are paramount for isolation of
disease genes using positional cloning. The genome can be mapped by either genetic or
physical methods to both order and determine the relative distance between markers. However,
until the modern era of molecular biology, the only physical markers available were whole
chromosomes and chromosomal bands. As a consequence particular phenotypic traits were
mapped relative to one another by genetic linkage analysis'
5
Chapter I Literature Review
1.2.1 Genetic Linkage MapPing
By determining the frequency of meiotic recombination between two genes, their proximity can
be estimated. In principal, the further two genes are physically apart, the higher the frequency
of genetic recombination between them. On the linkage map, distance between markers is
estimated as a recombination frequency (0), which can be transformed into a genetic distance
measured in centimorgans (cM). In general, one cM on a genome average is approximately
equivalent to one megabase of DNA sequence. However, a human genetic map was never
going to be based solely on genes, but rather would have to be based on polymorphic markers
that were not necessarily related to genes.
1. 2. 1. 1 Protein Polymorphisms
The first polymorphic markers to be used for genetic mapping in humans were protein
polymorphisms from blood group antigens and serum proteins (Renwick and Schulze, 1965).
However, relatively few of these were available, their informativeness was low, and
recombination occurred between only a few pairs of markers which were often not assigned to
a chromosome. It was not until individual-to-individual variations in DNA sequence were
identified, that it became practical to construct complete genetic linkage maps of humans
(Botstein et al., 1980).
1. 2. 1. 2 Restriction Frøgment Length Polymorphisms (RFL Ps)
Single nucleotide polymorphisms occurring in the genome have the potential to create or
destroy restriction etrzyme sites. The variation in DNA sequence between individuals can
therefore be observed as an alteration in the mobility of restriction fragments on agarose gels
as detected by Southern analysis with single-copy DNA probes contained within these
fragments. RFLPs were first used for genetic analysis in the study of temperature-sensitive
6
Chapter I Literature Review
mutations of adenovirusin 1974 by Grodzicker et ol.Inhumans, early studies identified RFLPs
that were recognised by their relationship to the DNA sequence of particular genes, notably the
y-globin (Maniatis et al., 1978) and þ-globin (Kan andDozy,1978) genes.
In 1980, Botstein et al. suggested that for the more general purpose of mapping genetic loci,
RFLPs did not have to encocle the gene of interest, but only be located sufüciently nearby to
display genetic linkage. They proposed that if sufficient numbers of polymorphic regions could
be identified, then all genes could be linked to a region containing an RFLP and therefore be
mapped. Subsequently, through the study of inheritance of randomly selected RFLPs in human
families, linkages to a number of diseases were detected, including Duchenne muscular
dystrophy (Davies et al., 1983), Huntington's disease (Gusella et al., 1983), retinoblastoma
(Sparkes et o1.,1983), and adult polycystic kidney disease (Reeders et a|.,1985).
The realisation that the availability of a linkage map of the human genome would greatly assist
the power of this approach to disease gene mapping, led to the construction of the first whole-
genome genetic linkage map (Donis-Keller et al., 1987). This study involved following the
pattern of inheritance of 403 polymorphic loci, including 393 RFLPs, in a panel of DNAs from
27 tltree-generation families. Their studies established genetic maps for each of the 22
autosomes and the X chromosome, with aî average spacing of 10 to 20 cM between markers.
The limitation of this initial map was the relatively large distance between some adjacent
markers, and the facthhatRFlPs are not very informative and are difücult to type.
While most RFLP variants are the consequence of base-pair changes that create or destroy a
restriction site, some are due to changes internal to the restriction fragment due to the presence
of a variable number of short, tandemly repeated, DNA sequences (VNTRs). These
7
Chapter l Literature Review
hypervariable minisatellite markers were first reported in 1980 by Wyman and White and in
1985, Jeffreys et al. developed probes from these markers that were able to detect many
unique hypervariable loci. Although they were highly polymorphic they tended to cluster near
the ends of chromosomes (Royle et al., 1988) and were therefore not ideal markers for the
generation of comprehensive genetic linkage maps.
1. 2. I. 3 Mícrosstellite Mørkers
By 1991, around 3,000 human polymorphic markers had been identified but only 10% of these
had a heterozygosity of greater ihan 50Yo (Weissenbach, 1993). This, coupled with the fact
that these markers were relatively unevenly spaced throughout the genome, meant that the
current human linkage map was far from ideal. The identification of short tandem repeat
polymorphisms (STRPs), or microsatellites, in 1989, and the ability for these markers to be
assayed by the polymerase chain reaction (Litt and Luty, 1989, Weber and May, 1989), was a
significant step towards the production of the comprehensive linkage maps that would
supersede these first generation RFLP maps. The polymorphic nature of these STRPs, or
sequence tagged site (STS) markers, is the result of a variation in the number of tandemly
repeated units from one allele to another. Different classes of STRP loci have been reported,
including di-, tri-, and tetra-nucleotides (Litt and Luty, 1989, Weber and May, 1989; Edwards
et al., 1991). \üith the exception of A,:T^ multimers, (CA)":(TG). repeats are the most
frequent STRPs found in the human genome and have been the most common microsatellite
used for the construction of genetic linkage maps. Both tri- and tetra-nucleotide repeats are
easier to type than the CA di-nucleotide repeats, however they occur less frequently in the
human genome and therefore have not been as widely used. For genetic mapping, these
microsatellite markers, compared with RFLP and VNTR markers, were advantageous since
8

Chapter I Literature Review
they were often highly polymorphic, were ubiquitous and abundant in the genome, and could
be typed using significantly less DNA than with the hybridisation-based RFLP and VNTR
probes. A further advantage was that information regarding each microsatellite marker could
be distributed and implemented by knowledge of their DNA sequence and did not require the
distribution of DNA clones as was necessary with RFLP based markers. Consequently,
increasingly dense genome-wide human linkage maps were developed G\IH/CEPH
collaborative mapping group, 1992; Weissenbach et a1.,1992; Buetow et al., 1994; Cryapay et
al, 1994;Matise et al., 1994).
Due to the fact that different research groups often used different genetic markers to construct
genetic maps of the same chromosome, it was vital that these studies utilised the same set of
reference families. This enabled linkage data from individual laboratories to be pooled to
generate maps of increasingly higher resolution. The most widely used set of reference families
are those distributed through the Centre d'Etude du Polymorphisme Humain (CEPH), which
now consist of sixty, three generation families. Consequently, in l994,Munay et al. were able
to compile an integrated human linkage map based on the efforts of three large groups and 110
CEPH collaborators. This map consisted of 5,840 loci, of which, 970 were uniqueþ ordered
and spaced at an average density of 0.7 cM. Subsequent to this report, Dlb et ol. (1996)
produced a comprehensive genetic map based on 5,264 CA di-nucleotide polymorphisms, of
which 2,032 could be ordered with an odds ratio of 1,000:1 against alternative orders. The
average interval size produced was 1.6 cM with only lo/o of the genome containing intervals
greater than l0 cM. These maps now provide significant resources and a framework to map
simple Mendelian diseases to within small chromosomal intervals and also allow a first search
for genetic causes of the more complex polygenic disorders.
9
Chapter I Literature Review
1.2.1.4 Return of the Single Nucleotide Polymorphism (SNP)
The search for genetic linkage to a disease gene requires the typing of a large number of
individuals with a large number of markers, a task that is time consumi.tg, costly and not
possible for many laboratories. With this in mind, recent attention has focussed on returning to
SNPs as a source of genetic markers. Although, as with RFLPs, they have low
heterozygosities, technology today has allowed identification of SNPs in sufficient numbers
such that advantages over microsatellites now exist. They are highly abundant and have been
predicted to occur on average every one kb (Cooper et ø1.,1985). The fact that these markers
can be genotyped by a simple plus or minus assay, suggests this process could be done in an
automated fashion and some non-gel-based assays have already been proposed (Nickerson et
al., 1990; Livak et al., 1995). It has been suggested that a map of 700-900 moderately
polymorphic biallelic markers is equivalent to the current 300-400 microsatellite marker sets
@eed et al., 1994; Dubovsky et al., 1995) with 1,500-3,000 markers being superior
(Kruglyak, 1997). Anatysis of 23 Mb of human genomic sequence by both gel-based systems
and DNA arrays has identified a total of 3,241 candidate SNPs with 2,227 being used to
construct a genetic map (Wang et a1.,1998). This study also simultaneously typed 500 SNPs
using a genotyping "chip" indicating the feasibility of future genetic linkage studies being
automated and done en masse. The availability of dense SNP maps and the stabilisation of SNP
genotyping technologies will ultimately assist in mapping genes responsible for genetically
complex phenotypes through disease association studies (Kruglyak, 1997).
1.2.2 Physical Mapping
While the development of high-resolution genetic maps has assisted in the identification of
disease loci by the use of linkage analysis, physical maps based on contiguous overlapping sets
of DNA clones provide the basis for the subsequent cloning of the disease gene(s) involved.
10
Chapter I Literature Review
High-density physical maps based on cloned DNA afford immediate access to any DNA
segment of the genome that can be defined genetically. Therefore, integration of these maps is
vital for the investigation of genetic disease and studying the large scale organisation of the
genome.
1. 2, 2. I Cytogenetic Møps
In essence, the first physical map of the human genome came from the identification of the
correct diploid number of chromosomes (Tijo and Levan, 1956). F,arly cytogenetic maps
grouped chromosomes according to their size and relative position of their centromere.
However, not until the development of chromosomal banding techniques was it possible to
uniquely distinguish all the chromosome pairs and define regions within chromosome arrns
(Caspersson et al., l97O). Methods to hybridise cloned DNA fragments to metaphase
chromosomes in situ were soon developed which allowed the mapping of unique probes to
particular chromosomes. Initially, in situ hybridisation utilised tritium labelled DNA which was
later followed by the development of fluorescentþ labelled probes and the fluorescence in situ
hybridisation (FISH) technique (Landegent et al., 1985). Development of prometaphase
chromosome preparations allowed highJevel banding resolution, and therefore localisation by
FISH in the order of 2 to 3 Mb. More recent techniques using FISH on interphase or extended
pronuclear chromatin have increased the mapping resolution to -50 kb (Engh et al., 1992;
Heng et a1.,1992) while the use of FISH on extended DNA fibres (Fibre-FISH) has increased
this resolution even further (Florijn et a1.,1995). Together, these techniques have enabled the
mapping of individual DNA fragments to chromosomal regions, the ordering of DNA clones
with respect to each other, and the ability to recognise chromsomal abnormalities associated
with diseasÇ, suÇh as fragile sites, chromosomal rearrangements, deletions, and amplifications.
ll
Chapter I Literature Review
1.2.2.2 Somøtic Cell Hybrid Møps
Physical maps based on somatic cell hybrid panels derived from naturally occurring
translocation or interstitial deletion chromosomes also enabled the physical mapping of cloned
DNA fragments. Hybrid panels for a number of chromosomes were constructed by the fusion
of human cells containing the chromosomal abnormality with either mouse or hamster cells
deficient for a selectable gene marker such as APRT or HPRT. Somatic hybrid cell clones were
then identified with tissue culture selection for this marker (Callen, 1986; Callen et al.,I990b;
Wagner et al., 1997; Washington et al., 1993). This allowed cloned DNA probes to be
physically located to a defined chromosomal interval by Southern blot hybridisations to DNA
isolated from the somatic cell hybrids and produced an ordering of the breaþoints and the
probes (Callen et a1.,1988,1989) This task was a laborious approach but the advent of PCR
and the development of STSs as genomic landmarks (Olson et a1.,1989), allowed this mapping
to proceed rapidly and with the utilisation of fewer resources (Richards et al., 1991- Callen et
a1.,1995). The resolution of mapping by this approach was dependant on the size of the panel
however an average mapping resolution of I Mb was achieved for the entire chromosome 16
(Callen et al.,lggs),while localised panels in some regions, for example Xq28, provided even
higher resolution (Suthers et al., 1990). Unfortunately, further high-resolution mapping was
restricted by the identification and availability of additional translocation and deletion events,
and a limitation in the selection systems that could be used.
The National Institute of General Medical Science (NIGMS) produced, and made available, a
somatic cell hybrid mapplng panel consisting of human and either mouse or hamster hybrids in
which each hybrid had only one or two human chromosomes. As a general resource for the
mapping of unique probes to individual chromosomes this panel has been quite useful either by
Southern hybridisations (Fukushima et a1.,1994) or simple PCR based assays (Kremmidiotis et
12
Chapter I Literature Review
a1.,7998)
1.2.2.3 Rødíøtion Hybrid (RH) Møps
An alternative approach for physical mapping was the construction and use of radiation hybrids
(RH) which were originally developed in 1975 by Goss and Harris. These hybrids were
generatecl by breaking the DNA of donor human cells into fragments whose size depended on
the dose of irradiation applied. The radiated cell was then rescued by fusion to rodent recipient
cells. The original approach was later modified by using, as the donor cell, a somatic cell
hybrid containing a single human chromosome instead of a whole diploid human cell (Cox e/
at., 1990). Following irradiation, the human and hamster chromosomal fragments rapidly
rejoin, resulting in the formation of complex chromosomal rearrangements. The observation
that these random fragments of human material could be stably retained in RHs provided the
basis for RH mapping. In principal, the closer two markers were to each other on a
chromosome, the greater the chance they would be present in the same RH. By screening a
panel of such RHs, the distance between markers could be estimated in centiRays (cR) An
advantage these maps had over somatic cell hybrids was that manipulating the dose of
irradiation administered could create panels of varying resolution. To date a number of STS-
based RH maps of individual chromosomes have been constructed (Cox et a1.,1990; Iames et
a1.,1994; Shaw et a1.,1995 Dear et a1.,7998)
The development and availability of 'khole-genome" panels represented by -100 RHs has
greatly facilitated the construction of a high-resolution framework with which to locate and
order additional fragments of DNA (Walter et al., 1994). At present, three different hamster-
human RH panels of the entire genome have been constructed using different doses of
irradiation resulting in avariafion in the resolution of each map. These include the Genebridge
13
Chapter I Literature Review
4 panel (Gyapy et al., 1996) as well as the G3 and TNG panels, which were developed at the
Stanford Human Genome Centre.
1.2.2.4 Whole-Genome Based STS Maps
One advantage of somatic cell hybrid and RH mapping compared with genetic linkage mapping
is that the STS markers used were not required to be polymorphic. This enables mapping of
both genetic polymorphic markers and non-polymorphic STSs to specific chromosomal
intervals allowing the integration of genetic and physical maps (Kozman et al1993; Mulley and
Sutherland, 1993;Ferrero et al., 1995).In 1995, Hudson et al. reported on the construction of
a physical map of the entire genome based on 15,086 STSs (landmarks used to anchor the
map) to give an average spacing between markers of 199 kb. This study involved the
generation of a RH map of STSs generated from sequencing of random human genomic
clones, the frequently used genetic linkage markers of Weissenbach and others, and STSs
developed from ESTs (see 1.2.3.6). Another study developed an STS-based RH map of the
human genome based on 10,478 markers (Stewart et al.,1997). Of these, 5,994 were mapped
such that odds of an alternate order were 1,000:1 giving rise to a framework map consisting of
l,776 "bins" with an average spacing of 500 kb between lhe 5,994 marker set. Both of these
studies contribute greatly to the goal of the Human Genome Project of 30,000 STS spaced at
anaverage of 100 kb apart (see 1.1).
1. 2. 2. 5 Clone-Based. Maps
The construction of the ultimate physical map, the complete nucleotide sequence of the
genome, requires a series of cloned DNA fragments to be assembled which collectively provide
full representation of the DNA to be sequenced. A number of approaches have been taken to
construct genomic physical maps based on cloned DNA fragments with all of these techniques
t4
Chapter l Literature Review
defining overlaps between clones allowing the reconstitution of the original genomic order
I. 2. 2. 5. I Restriction Enzyme Based Maps
The identification of site specific restriction endonucleases allowed the construction of the first
genetic linkage maps in man, and in addition they have been instrumental in the development of
the first clone-based physical maps involving E. col.i (Kohara et al., 7987), yeast (Olson et al.,
1986) a¡d C. elegans (Coulson et al., 1986). These maps were based on overlapping cosmid
or lambda phage clones aligned by analysis of their fragment sizes produced when cleaved
using a number of frequently cutting restriction enzymes. This technique was ideal for genomes
of small to medium complexity and had also been applied to small regions of the human
genome (Steinmetz et aL.,1986; Rommens et a1.,1989; Fearon et a|.,1990). With the use of
pulsed field gradient gel electrophoresis (PFGE) and restriction enzymes that cut less
frequently in DNA" the analysis of much larger stretches of DNA was made possible (Schwartz
and Cantor, 1984). This technique, when used in combination with chromosome jumping or
linking libraries (Collins and Weissman, 1984; Poustka et al., 7987), allowed the construction
of restriction maps based on such rare cutting enzymes as Notl (Ichikawa et al., 1993;
Allikmets et al., 1994).
ANotllinking clone is defined as a short genomic clone, containing a singleì/oll restriction
site, that identifies two adjacent genomic NotI fragments when used as a hybridisation probe.
Therefore, two clones that hybridise to the same NotI fragment are derived from neighbouring
ly'oll sites, the size of which can be determined by PFGE. This approach allowed the analysis of
much larger regions of the genome, and provided an advantage in that actual physical distances
between restriction sites could be determined.
l5
Chapter I Literature Review
I . 2. 2. 5. 2 Repetitive Se quence Fingerprinted Maps
The human genome is interspersed with numerous repetitive DNA elements such as Alu,
LINE-I and (CA).. It was suggested these could aid in the assembly of overlapping DNA
fragments into contigs by providing "signatures" for restriction fragments and so allowing
recognition of shared fragments betweeh clones (Moyzis et a|.,1989). Although an attempt to
utilise this approach to construct contigs of cosmids originating from an entire chromosome l6
proved to be successful (Stallings et al., 1990), most contigs produced were small and had
large overlaps. Therefore this technique was not suitable for producing physical maps of the
whole genome and was finally abandoned when mapping technologies evolved further.
1.2.2.5.3 YAC-Bqsed STS Content Maps
Unfortunately, a limitation of physical maps based on lambda or cosmid clones, was the
restricted size of the inserts, which were usually a maximum of 40 kb. Entire human genome
physical maps were made practical with the construction of a new type of cloning vector, the
yeast artificial chromosome (YAC), which was capable of holding up to I to 2 \[b of DNA
(Burke et al., 1987), a significant improvement on previous vectors. The detailed STS maps
that were being produced from the integration of genetic linkage and physical map
construction therefore provided an excellent framework with which to isolate YAC clones and
construct comprehensive clone contigs (Smith and Cantor, 1989).
Single copy landmark screening was first used to construct a physical map of the human Y
chromosome and the long arm of chromosome 21 (Chumakov et a1.,1992; Foote et aL.,1992).
In both these studies the physical map produced was based entirely on YAC clones identified
by STS markers previousþ mapped to these two chromosomes. The resulting order of STSs
was consistent with the previously established cytogenetic and mapping data and therefore it
t6
Chapter I Literature Review
was suggested that such an approach could be applied to the whole human genome.
Subsequently in 1992, Bellanne-Chantelot et al. published a report toward a whole-genome
YAC map and in 7993 a fìrst-generation physical map of the entire human genome based on
YAC clones was established (Cohen et al., 1993).In this study, a 33,000 clone (10 genome
equivalents) CEPH YAC library was screened with 2,100 polymorphic STS markers
comprising the most recent genetic linkage map (Weissenbach et al., 1992; Weissenbach,
1993). As well as using STSs to identifi YAC clones, they isolated additional clones by
generating specific sequences from the YACs already identified by PCR amplification between
the ubiquit ous AIu repeats contained within these YACs (Nelson et al., 1989; Chumakov et al.,
1992; Doggett et al., 1995). The integrity of the overlaps was confirmed with repetitive
sequence fingerprinting, and FISH on metaphase chromosomes was used to locate individual
contigs to specific chromosomal regions. In 1995, an update of this massive study indicated
that they had successfully developed a reliable YAC contig map covering about 75Yo of the
human genome consisting of 225 contigs having an average size of about l0 Mb (Chumakov e/
al., 1995). To date, comprehensive YAC based physical maps covering a large number of
individual human chromosomes have been subsequently established (Fan et al., 1994; Collins el
a\.,7995b;Doggett et al., 1995; Gemmill et ol., 1995; Krauter et al., 1995; Quackenbush øl
al., 7995;Bouffard et al., 1997).
One disadv antage of YAC cloning is a large percentage (up to 60%) of clones are chimaeric
and therefore contain non-contiguous segments of the human genome. When chimaeric clones
linked segments from different chromosomes they could be readily identified by FISH analysis,
however syntenic chimaeric clones were more difficult to detect. A further problem was the
instability of YAC clones containing certain areas of the genome, a reflection of the base
composition at these regions (Foote et al., 1992). This was particularly evident at the G-C rich
T7
Chapter I Literature Review
(gene rich) regions of the genome where few YAC clones were identified (Doggett et al.,
1995; De Sario et al., 1996). This may be attributed to the yeast genome having a G-C base
composition of only -38yo, suggesting the yeast replication machinery may have difficulty in
replicating higher G-C content regions. Indeed, analysis of the whole genome YAC contig map
produced by Chumakov et al. (1995), demonstrated that the large majority of gene dense
bands were poorly represented (Saccone et al., 1996). This problem has now been overcome
by the emerging use of large-insert bacterial clones.
1.2.2.5.4 Bacterial Clone Maps
Although YAC maps have greatly contributed to the progress of detailed physical maps of the
human genome, YACs were not a reliable source of representative genomic DNA and did not
provide manageable substrates for sequencing purposes. As an alternative, large-insert cloning
approaches using bacteriophage Pl-based vectors (PACÐ and bacterial artiftcial chromosomes
(BACs) were established (Ioannou et al., 1994; Shizuya et al., 1992). The advantages of using
libraries of the human genome generated with these vectors was the ease of DNA isolation and
the ability to directly sequence from them. In addition, the clones were found to be highly
stable, chimaerism was minimal, and inserts up to 300 kb could be achieved. As a result, YAC
based maps of human chromosomes are being rapidly transformed into maps based on BACs
(Kim et at., 7996) and maps of genomic regions based solely on BACs are being constructed
(Schmitt et a1.,1996; Marra et a1.,1997) in preparation for the large scale sequencing projects
that are underway.
1.2.3 Transcription Maps
Methods which allow the rapid identification of the protein coding sequences contained within
genomic DNA are essential for the construction of transcript maps covering large genomic
18

Chapter I Litereture Review
regions. Since the availability of the sequence of the whole genome is not estimated to be
available until the year 2003 (Collins et al., 1998), the development of transcript maps
produced in the absence of this information is vital for the identification of disease causing
genes.
1. 2. 3. 1 Classìcal Approaches
Initially, one of the main approaches towards the isolation of protein coding regions in cloned
genomic DNA was the isolation of single-copy DNA fragments within the region of interest.
These fragments could first be used as hybridisation probes on Southern blot filters containing
DNA isolated from a number of different species to test for evolutionary conservation of a
particular DNA segment. These fragments could also be tested to determine if they originated
from transcripts by hybridisation to Northern blots of RNA isolated from human tissues. If the
DNA segment was part of a gene then it could be used as a probe to identify corresponding
clones from a oDNA library generated from the relevant tissue(s). The use of cross-species
hybridisation or "zoo blots" was important for the cloning of many disease genes, including
identification of candidate oDNA clones for Duchenne muscular dystrophy (Monaco et al.,
1986), cloning of the DCC gene altered in colorectal cancers (Fearon et al., 1990), and the
cystic fibrosis gene (Rommens e/ a1.,1989).
Short regions of genomic DNA containing many sites for the restriction enzyme HpaII, frst
referred to as HpaII Tiny Fragment (HTF) islands, were shown to be extremely G-C rich (60
ro 70%) compared with the average for the human genome (40%). These CpG islands remain
unmethylated, are found in short regions of 1 to 2kb, and account for -2o/o of the genome.
CpG islands have been shown to co-localise with the 5' end of genes (Bird, 1987; Antequera
and Bird, 7993), and in most cases contain the promoter and one or more exons of the gene. In
t9
Chapter I Literature Review
humans, CpG islands have been found to be associated with all house keeping genes and about
40Yo of tissue-restricted genes (Larsen et a1.,1992; Antequera and Bird, 1993). The isolation
of CpG island DNA was therefore utilised as a way in which genes could be identified. As the
majority of CpG residues in genomic DNA are metþlated, the use of restriction enzymes that
target G-C rich DNA will therefore predominantly digest CpG island regions which remain
unmetþlatecl. The construction of linking libraries from a number of regions of the genome
(see 1.2.2.5.1) has allowed identification and cloning of CpG islands, and has aided in the
identification of many ne\ry genes (Rommens et a|.,1989; Tribioli et a1.,1994).
1.2.3.2 Chromosome Specffic cDNA Líb
Another method for the identification of transcribed sequences from a defined region of the
genome is the construction of chromosome specific or region specific cDNA libraries. The
availability of somatic cell hybrids that contain the human genomic region of interest as its only
human DNA content have typically been used. The cDNA libraries are made from unprocessed
(heteronuclear) messenger RNA (hnRNA) by using primers that bind to 5' intron consensus
splice site sequences to initiate cDNA synthesis (Liu et a1.,1989; Whitmore et a1.,1994). The
principal behind this procedure was that hnRNA still contains introns and exons, enabling the
initiation of oDNA synthesis from intron/exon boundaries. The presence of human specifrc Alu
repeats contained within the introns, and therefore within some oDNA clones, provided a
means to screen for human specific cDNAs within the background of mouse clones. In a
similar approach, oDNA synthesis was primed from hnRNA by oligonucleotides derived from
conserved regions of human Alurepeats (Corbo et a1.,1990). Howeverusing this method, a
high proportion of rodent clones were found in the oDNA libraries produced due to non-
specific priming events. The specificity of Alu oligonucleotide binding was subsequently
improved by the double-purification of hnRNA through oligo-dT cellulose columns (Lagoda et
20
Chapter I Literature Review
al., 1994). Unfortunately, these approaches require extensive screening and subsequent
verification of the human specific cDNA clones. In addition, the libraries produced only
represent the human genes expressed in the originating somatic cell hybrid and therefore have
limited use in the construction of whole-genome or even whole-chromosome transcription
maps.
1. 2. 3. 3 Hybridísation-Bøsed Approsches
The human genes expressed in somatic cell hybrids have also been specifically cloned by
subtractive hybridisation. The approach is based on the fact that oDNA fragments produced
from non-coding segments of mature human RNA will not form stable heteroduplexes with
their rodent homologues under high-stringency hybridisation conditions due to the low
sequence homologies between the species in the 3' untranslated regions of their transcripts.
Jones et al. (1992) used a somatic cell hybrid retaining a small region of human chromosome
17 to produce oligo-dT primed cDNA fragments. These were subsequently hybridised in
solution with an excess of RNA from a similar somatic cell hybrid derived from this
chromosome, such that the only difference between the two hybrids was the -4 Mb human
region under analysis. Under high stringency hybridisation conditions, the oDNA mixture, now
enriched for human sequences expressed in one hybrid but not the other, could be used as a
probe to screen conventional cDNA libraries and human cDNAs encoded within the non-
overlap region could be obtained. This procedure was successful in the identification of nine
expressed genes from within the non-overlap region and was suggested could be an approach
applied to larger regions of non-overlap. However, as a general procedure for the isolation of
transcribed sequences, its greatest utilisation would be for smaller defined regions of the
genome.
2l
Chapter I Literature Review
A number of groups have used whole YAC inserts to screen oDNA libraries directly (F,lvin et
al., l99O; Geraghty et al., 1993). This involved labelling the YAC insert DNA to a high
specific activity, blocking out high level repeat sequences, and then screening cDNA libraries
to identify regions within the YAC that contain homology to expressed sequences. This
approach, while successful in the identification of some new genes (Geraghty et al., 1993;
Kahloun et al., 1993), had disadvantages because of the lack of suppression of low level
repetitive sequences within the YAC clones. The hybridisation technique is close to the limits
of sensitivity, resulting in small insert cDNA clones unlikely to be detected and YACs with
large inserts being less efficient in detecting cDNAs. In one study (Elvin et a1.,1990), a 180 kb
YAC containing the human aldolase reductase gene was used to directly screen a oDNA library
in which the target oDNA was moderately abundant (1 in 10,000 clones). However, the screen
succeeded in detecting only -lOYo of cDNAs that were previously identified using an aldolase
reductase oDNA probe.
Despite these problems, a modification of this approach was developed such that oDNA clones
within libraries were first enriched before being screened by hybridisation with large genomic
regions such as YACs, an approach termed direct selection (Lovett et al., 1991) or oDNA
selection (Parimoo et al.,l99l).
1. 2. 3. 4 Direct Selection/cDNA Selection
The first development of direct selection was based on the initial amplification of inserts from a
oDNA library of interest using vector specific primers. Products from this amplification are
then labelled with t'P, quenched for repetitive elements, and used as a probe to YAC or
cosmid inserts that have been immobilised on nylon membranes. The oDNA inserts that
specifically hybridise to the cloned genomic DNA are then eluted from the membranes, re-
22
Chapter I Literature Review
amplifïed with vector specific primers, and the process repeated two or three times. The
resulting gDNA sublibraries, enriched for expressed sequences from the genomic region, are
then cloned and analysed further. Using this strategy, a rate cDNA species encoded by a gene
on a YAC from the HLA region, was enriched up to 7,000 fold with two rounds of selection
(Parimoo et al., Iggl), and 1,000 to 2,000 fold enrichment for the EPO and GNB2 oDNA
clones respectively, were obtained from a human chromosome 7 YAC (Lovett et al., 1991).
Although the successful enrichment of certain cDNA clones cannot be disputed, these clones
only contribute to a fraction of the resulting selected oDNA library due to simultaneous
selection of cDNAs containing repeat sequences and other non-specific hybridisation events.
An alternative approach was to select the cDNAs in solution rather than by using filter-bound
templates (Korn et al., 1992). The method was based on the hybridisation in solution of
amplified cDNA inserts to biotinylated cosmid DNA. Selected oDNA clones were then
captured by binding to streptavidin coated magnetic beads, which could be isolated by passing
over a magnet, while non-selected cDNA clones were washed from the hybridisation. After
subsequent rounds of capture, the eluted cDNAs can be re-amplified by PCR" cloned, and
analysed further. This method has been successful in the identification of many new genes
(Rommens et al., 1993; Peterson et al., 1994; Baens et a1.,1995) including those responsible
for a number of diseases (Gecz et aL.,7993; Onyango et aL.,1998)'
This technique had several disadvantages. Abundant oDNA clones (due to highly expressed
genes) present in a given library may be preferentially amplified, resulting in a further under-
representation of rarer transcripts. Also, the presence of repetitive sequences in oDNA clones,
particularly those of low abundance that are not sufficiently suppressed with human cot-l pre-
annealing, can give rise to false positive clones. A further disadvantage is that the origin of
23
Chapter I Literature Review
cDNA clones is limited to those expressed in the tissue from which the library was constructed.
Genes expressed at limited developmental stages or in restricted tissues therefore will not be
identified by this technique.
1. 2. 3. 5 Exon Trapping/Exon Ampffication
A method of identifring potential protein coding regions of the genome that does not have
these limitations is exon trapping or exon amplification. This method is based on the selection
of functional spilce sites flanking exon coding sequences present within genomic DNA. Cloned
genomic DNA is ligated into a vector that contains splicing sequences that can act in
conjunction with splice site sequences that may be present in the cloned DNA fragment.
Expression in mammalian cells in culture results in splicing of intronic DNA within the
genomic fragment into a mature mRNA which can be subsequently isolated. An early version
of this system (Duyk et a1.,1990) used a retroviral shuttle vector that contained a splice donor
site, while the genomic fragment had to provide the splice acceptor site. This method relied on
the presence ofjust one splice site within the genomic DNA fragment, resulting in the potential
for the trapping of false positive exons due to cryptic splice acceptor sites present within the
insert
Another approach again made use of the presence of splice acceptor sites alone, within the
cloned genomic fragment, to isolate 3' terminal exons from DNA cloned into a mammalian
expression vector (Krizman and Berget, 1993). The advantage of this procedure was that
terminal exons contain a polyadenylation signal in addition to a splice acceptor site and both
were needed to allow correct splicing of the mRNA. The production of clones as a result of
cryptic splicing events would therefore be eliminated, as they would not be likeþ to have
polyadenylation signals located downstream of them.
24
Chapter l Literature Review
An alternative exon trapping vector constructed by Buckler et al. (7991) required the presence
of both a splice donor and splice acceptor site within the cloned genomic fragment for exons to
be incorporated into the resulting mRNA. This vector, called pSPL1, contained a cloning site
within an intron derived from the HIV-I tat gene, whose flanking exons and splice sites were
substituted for an exon of the rabbit B-globin gene (see Figure 4.1). Transcription was initiated
from an SV40 earþ promoter with the polyadenylation signal also provided by SV40. tlpon
transfection of this vector (containing fragments of genomic DNA) into mammalian cells
(COS-7), RNA transcripts were generated and the tat intron sequences spliced to produce a
polyadenylated cytoplasmic RNA. 'When a fragment containing an intact exon is cloned into
pSPLI in the sense orientation, the exon should be retained (or trapped) in the mature poly(A).
RNA produced. The trapped products are then reverse transcribed and amplified using PCR
(exon amplification). This vector has been used very successfully in the identification of a
number of disease related genes including the gene for Huntington's disease (The Huntington's
Disease Collaborative Research Group, 7993), the gene for Menkes disease (Vulpe et al.,
lgg3),the neurofibromatosis 2 tumour suppressor gene (Trofatter et a1.,1993), and the Batten
disease gene (International Batten Disease Consortium, 199 5).
Although this vector was quite effective, improvements were needed for its application for
analyses of larger genomic regions. The first problem was the abundance of trapped products
containing only pSPLI sequences due to genomic fragments lacking intact exons, resulting in
competition among PCR templates for this small and most abundant template. Another
problem was the generation of false positives due to the presence of a cryptic splice site in the
IilY-tat intron. These limitations were addressed leading to the construction of improved
vectors (Church et al., 1994;Burn et at., 7995) that had the cryptic splice site removed, had
additional restriction enzyme sites in the cloning region, and contained Esr)([ half sites adjacent
25
Chapter I Literature Review
to the splice sites of the vector. Clones derived from genomic DNA lacking exons would result
in the formation of an intact BstXI site that could be eliminated from fuither analysis by
digestion with this enzyme. Additional modifìcations have allowed a more efiìcient approach to
the isolation of exons from BAC DNA clones (Burn et al.,1995;Hu et al.,1997).
As well as being a useful technique for the identification of transcribed sequences in small
genomic regions where disease genes have been mapped, exon trapping has also been applied
to the identification of genes from whole chromosomal arms (Chen et al., 1996a). In this
study, 559 individual potential exons were trapped from 7,194 cosmid DNA clones derived
from chromosome 2l.They were ableto trap exons from 13 of the 30 mapped chromosome
2l genes and estimated that they had identified portions of up to -40Yo of all genes on this
chromosome.
A distinct advantage of this procedure over cDNA selection is the avoidance of tissue or
developmental specificity of gene expression. However, the isolation of exons depends on the
distribution of restriction enzyme sites within particular genes, and competition between exons
both in vivo and during PCR amplification may reduce the number of different exons trapped.
In addition, the products generated are often too small in size for Northern analysis and
therefore have to be confirmed as being pafis of genes by linking with adjacent exons using
RT-PCR or through database homologies to sequenced oDNA clones.
1.2.3.6 Complementøry DNA Sequencíng and Mappíng
The large-scale sequencing of random oDNA clones to generate expressed sequence tags
(ESTs) was seen as an important step towards the identification of a catalogue of human genes
(Brenner, 1990). Just as STSs serve as physical mapping landmarks, PCR assays developed for
26
Chapter I Literature Review
short stretches of cDNA sequence, provided an additional feature of developing an STS which
points directly to an expressed gene (Adams et a|.,7997; Wilcox et a1.,1991). The sequencing
of the 3' untranslated region (UTR) of mRNAs was chosen as they are generally free of introns
(Hawkins, 1988) allowing PCR amplification from genomic DNA. Since the 3' UTR shows
significant sequence divergence between human and rodent homologues, such ESTs avoid
cross-species homology and so allow physical mapping using racliation hybrid and somatic cell
hybrid panels. High-throughput cDNA sequencing began in 1991 (Adams et al., 1991), with
the mapping of a limited number of ESTs soon following (Khan et aL.,1992; Polymeropoulos
et a1.,1992), and in 7992, a database called dbEST was established at the National Centre for
Biotechnology Information (NCBI), to serve as a collection point for the large amount of
cDNA sequence data being generated (Boguski et a|.,1993).
In 1995, Venter and colleagues at the Institute for Genomic Research (TIGR), generated
174,472 partial oDNA sequences from both the 3' and 5' ends of oDNA clones, which totalled
more than 52 million nucleotides of sequence (Adams et al., 1995). These data were generated
from the use of 300 human oDNA libraries that collectively represented all major organs,
several developmental stages and disease states, and many cell types. A project of similar scale
funded by the Merck Company and carried out at the rüashington University Genome
Sequencing Centre, generated 379,311 sequence reads from the 3' and 5' ends of 194,031
human oDNA clones obtained from 17 different tissues representing 3 developmental states
(Hillier et ø1.,1996). Other large projects have also contributed to the human oDNA sequence
data avulable in dbEST (Houlgatte et al., 1995; Touchman et al., 1997) and as of August 28,
1998, 1,086,919 human EST entries had been deposited in dbEST, with the majority of these
being generated from individual cDNA clones. Many of these cDNA clones have been made
available by the Integrated Molecular Analysis of Genomes and Their Expression (IMAGE)
27

Chqpter l Literature Review
consortium, who have been arraying and distributing the sequenced cDNA clones (Lennon e/
a1.,1996).
The integrity of the EST data generated depends to a large extent on the oDNA libraries that
are used. In general, the frequency of occurrence of a oDNA clone in a library is equivalent to
that of its corresponding mRNA which results in a bias against genes of low expression. To
overcome this problem, normalised oDNA libraries were constructed and used for sequencing
purposes such that the frequency of all clones were within a narrow range (Soares et a|.,1994;
Bonaldo et al., 1996). Unfortunately, redundant identification of genes that are expressed in
multiple tissues cannot be avoided from normalisation alone. As a result, subtractive oDNA
libraries enriched for genes expressed at low levels are being developed (Bonaldo et a1.,1996).
Initial results have shown a significant reduction in the representation of -5,000 IMAGE
consortium clones from a fetal liver/spleen subtracted cDNA library. With further work, the
generation of complete subtracted and normalised oDNA libraries enriched for novel sequences
should become possible, facilitating the isolation of many more human cDNAs not yet
identified.
In order to map the large number of sequenced oDNA clones, individual ESTs were assembled
into overlapping contigs based on sequence, with each contig likely to represent a unique gene.
One approach has been the construction of the Genexpress Index (Houlgatte et al., 1995),
where 18,698 oDNA sequences from human skeletal muscle and brain libraries were clustered
into 5,750 distinct gene transcripts according to their homology. Similarly, at TIGR" all
sequencing reads available from dbEST and those produced inhouse were merged to form
62.808 tentative human consensus sequences (THCs), with full length transcript sequences
being established in some cases (Adams et a1.,1995) Another approach has been used in the
28

Chapter I Literqture Review
construction of UniGene (Boguski and Schuler, 1995; Schuler et al., 1996). In this case, ESTs
and full-length mRNAs from characterised genes were organised into clusters most likely to
represent distinct genes. The remaining ESTs were then screened against each other to
determine those most likely to be derived from the same gene. Currently there are 62,421
UniGene clusters, that most likely represent up to two thirds of all human genes.
Until recently, only a limited number of ESTs had been mapped to specific chromosomal
regions (Polymeropoulos et a1.,L993;Murakawa et a1.,1994; Berry et a1.,7995;Houlgaile et
a1.,1995; Evans et ø1., 1996). Following the generation of UniGene clusters, an international
consortium was established to begin mapping each cluster using radiation hybrid panels and
YAC maps, culminating in the mapping of 16,354 distinct clusters in 1996 (Schuler et al.,
1996) and more than 30,000 clusters in the latest release (Deloukas et aL.,1998). The complete
mapping of all UniGene clusters will enable the construction of a transcript map that represents
the majority of human genes.
1.2.3.7 ldentiJícatíon of Genes by Sequence Homology
Sequence comparison methods such as BLAST (Altschul et al., 1990;1997) can be used to
scan dbEST and the non-redundant databases at NCBI to identify oDNA clones or gene
families displaying homology to stretches of genomic sequence that are now becoming
available. A direct comparison between a stretch of genomic DNA and a homologous oDNA
will immediately yield the intron/exon structure of the gene and aid in the identification of
alternatively spliced forms of some genes. The sequences of genes from other species can also
be used to identify homologous oDNA clones in dbEST based on the conservation of
functionally significant regions of the genome during evolution and this has been applied to the
identification of the human gene homologues of Drosophila, C. elegans, S. cerevisiae, and
29
Chapter I Lilerature Review
bacterial genes (Banfi et al., 1996; Bassett et al., 1997; Mushegian et al., 1997;1998)
1.3 Mapping of Genes Associated With Disease
l.3.L Positional Cloning of Disease Genes
Historically, the cloning and molecular analysis of disease genes was based on information
regarding the protein product, such as its amino acid sequence, availability of antibodies, or its
function. Unfortunately, for the vast majority of disease genes, sufficient functional information
is simply not available. With the generation of genetic maps of increasing resolution, it was
now possible to map inherited monogenic and some multigenic disorders to specific
chromosomal regions as a first step towards the cloning of the gene, aterm initially referred to
as'?everse genetics" or positional cloning (Orkin, 1986). Linkage analysis of genetic markers
in families segregating the disorder can assign an initial map position for the responsible
gene(s). Physically mapped cloned DNA contigs established between the flanking genetic
markers could then subsequently be used to identify transcribed sequences that lie within this
region. This approach has so far been successful in the identification of a large number of genes
associated with many monogenic disorders (reviewed by Collins, 1995a)
1.3.2 Positional Candidate Cloning
The detailed maps of transcribed sequences being developed also provide an important tool for
disease gene identification. When a new disease gene is mapped to a particular chromosomal
region, it is now possible to access a list of all oDNA clones and genes assigned to that region.
These transcripts are then considered candidates for that particular disease, with a direct
comparison between the functions of these candidates (if known) to the features of the disease
being made, leading to the identification of the affected gene. This process combines the
30
Literature Review
positional and functional cloning approaches into one, and has been referred to as positional
candidate cloning (Ballabio, 1993)
L.4 Complex Disorders:Identification of Genes Involved in Cancer
While classical genetic linkage analysis is useful for the mapping of inherited single-gene
disorders, it often fails to provide mapping information for more complex diseases such as
epilepsy, heart disease, and cancer, where many genes can play a role in the phenotype, and
environmental factors usually contribute to the disease. In these cases, alternative approaches
need to be taken to determine the location of the genes that play a role in the aetiology of these
disorders. The identification of genes associated with tumourigenesis relies on information that
can be obtained not only through the mapping of familial cancer syndromes but through the
cytogenetic analysis of tumour cells, and the finding of associated non-random cytogenetic
alterations.
Heritable tendencies to cancer have been demonstrated in only about lYo of a[ cancer cases
(Lasko et al., l99l) and for most of these, predisposition is inherited as an autosomal
dominant trait with detection dependant on the occurrence of a rare tumour, or in the case of a
common cancer, a shifted age distribution. Cytogenetic techniques applied to leukaemias,
lymphomas, and some solid tumours have led to the identification of specific chromosomal
abnormalities unique to particular tumours (Mitelman et al.,1997). Some of the changes seen
in solid tumours include numerical aberrations, translocations, gene amplifications and
interstitial and terminal deletions. These cytogenetic aberrations often give an indication as to
the location of the genes involved, and in the case of retinoblastoma, deletions and non-random
translocations in affected individuals have assisted in the identification and subsequent cloning
I
3t
Chapter l Literature Review
of the gene (Yunis and Ramsay,1978; Strong et a|.,1981; Balaban et aL.,1982)
For a normal somatic cell to evolve into a metastatic tumour it requires changes at the cellular
level, such as immortalisation, loss of contact inhibition and invasive growth capacity, and
changes at the tissue level, such as evasion of host immune responses and growth restraints
imposed by surrounding cells, and the formation of a bloocl supply for the growing tumour.
While these processes require the coordinated induction and control of a large number of
genes, only that cell which has been able to obtain all the necessary functions will eventually
form a malignant foci.
Molecular genetic studies of colorectal carcinoma have provided substantial evidence that the
generation of malignancy requires the sequential accumulation of a number of genetic changes
within the same epithelial stem cell of the colon (Fearon and Vogelstein, 1990), with gene
alterations encompassing both inactivating and activating mechanisms. Three broad classes of
genes have been defined:
a
a
Tumour suppressor genes - these genes inhibit cell proliferation and both alleles must be
inactivated to have an effect on the cell.
Oncogenes - these genes positively promote cell proliferation. Normal non-mutant
versions are termed proto-oncogenes with the mutant versions excessively or
inappropriately active.
Mutator genes - these genes maintain the integrity ofthe genome. Loss of both alleles can
result in an instability of the genome increasing the overall mutation rate.
For a normal colonic epithelial cell to become a benign adenoma, progress to intermediate and
32

Chapter I Literature Review
late adenomas, and finally become a malignant cell, mutations in genes belonging to these three
groups are required (Fearon and Vogelstein, 1990). Constitutional loss of the APC tumour
suppressor gene at 5q2l is sufücient to initiate the formation of benign polyps. The
development of intermediate and late adenomas has been linked to the activation of the KRAS
oncogene and about 5OYo of late adenomas show a mutation in the DCC tumour suppressor
gene on 18q. Also colorectal cancers, but not adenomas, have a high frequency of mutations in
the TP53 gene. Finally, mutations in the mutator genes, MSH2 artdMLHI, have been identified
which most likely increase the overall mutation rate making each individual transition more
likely.
1.4.1 Recessive Mutations in Cancer: The Retinoblastoma Paradigm
Tumour suppressor genes were first identified in the childhood cancer retinoblastoma. Both
inherited and sporadic forms of this cancer exist, with the genetic form inherited as a highly
penetrant autosomal dominant trait, which was mapped to chromosome 13q14 by genetic
linkage anaþsis (Sparkes et al., 1983). Cytogenetic analysis also showed deletions of this
chromosomal region in patients (Yunis and Ramsay, 1978) and in tumours from patients
without constitutional deletions (Balaban et a1.,1982)
Due to these cytogenetic findings, it was possible that the inherited retinoblastoma mutation
was a recessive allele with inactivation of the normal allele required for its expression in
tumourigenesis. Coupled with the observation that bilateral retinoblastoma v/as characteristic
of the inherited disease and occurred at an early age, whereas unilateral retinoblastoma was
characteristic of the sporadic form and occurred at a laler age, led to the hypothesis by
Knudson in 1971, that the tumour arises from two mutational steps. With this proposition,
familial cancers would result from an inherited germline mutation of a gene suppressing the
55
Chapter l Literature Review
growth of cells (tumour suppressor gene), such that all cells would carry this mutation. A
second mutation or "hit" in any cell therefore resulted in the manifestation of the recessive
mutation leading to cancer. The fact that only one more "hit" produces a cancerous cell meant
that individuals with an inherited pre-disposition to the disease had an earlier age of onset and
often bilateral tumours. In contrast, sporadic cases tended to be in one eye and later in onset
because t\ryo "hits" were nee<lecl to the genes in the same cell.
This hypothesis was confirmed in 1983, when Cavenee and colleagues used RFLPs at I3q14Io
type DNA isolated from blood and tumour samples taken from the same affected individuals.
They noted that in several cases the constitutional DNA from lymphocytes was heterozygous
for some markers but the tumour cells appeared homozygous for the same markers. The
apparent reduction to homozygosity (or loss of heterozygosity, LOH) through the loss of one
allele of these markers rÀ/as suggested to be the second "hit" which was removing the
remaining functional copy of the retinoblastoma gene in these individuals. The analysis of
tumours in familial cases showed that the chromosome from the unaffected parent was in each
instance the one eliminated from the tumour. A number of mechanisms were proposed
including mitotic recombination, mitotic non-disjunction with loss of the wild-type allele or
reduplication of the mutant allele, and gene conversion, deletion or mutation.
The cloning of the retinoblastoma (rRB) gene (Friend et a1.,1986) and subsequent studies have
established that it is a tumour suppressor gene acting through the inhibition of the Gr/S
progression in the cell cycle (reviewed by Weinberg,1995).
1.4.2 Loss of Heterozygosity and Other Tumour Types
Loss of heterozygosity analysis is basically a refined version of cytogenetic studies with this
34

Chapter I Literature Review
method able to detect much smaller genetic alterations in tumour cells as compared to
cytogenetically visible rearrangements. The use of a latge number of genetic markers, as
provided by the comprehensive genetic linkage maps available for all chromosomes, to analyse
paired samples of DNA from normal and tumour tissue, has identified regions of the genome
displaying LOH which are often specific to tumour types (reviewed in Lasko et al., 1991).
Reproducible LOH is therefore likely to inclicate the presence of tumour suppressor genes
important in tumour pathogenesis.
In addition to retinoblastoma, studies of other cancers have supported the model that LOH is a
specific event in the pathogenesis of cancer. In Von Hippel-Lindau (VHL) syndrome both
sporadic and inherited cases of the syndrome show LOH for the short arm of chromosome 3
(Bergerheim et a1.,1989; Ilng et al., 1986). Somatic translocations involving 3p in sporadic
tumours, and genetic linkage to the same region in affected families has also been observed
(Cohen et a|.,1979; Seizinger et al.,19SS). Similarly, in colorectal carcinoma, inherited forms
of the disease have been mapped to the long arm of chromosome 5 (Bodmer et al., 1987;
Leppert et ø1., 1987) while LOH at 5q has been reported in both the familial and sporadic
versions of the disease (Sasaki et al., 1989) and the APC gene, mapping to this region, has
been shown to be involved (Groden et al., l99l). Other examples include the TP53 and NF2
genes (reviewed in Lanfrancoîe et al., 1994) which firmly establishes the fact that a general
mechanism in human cancer is the inactivation of tumour suppressor genes by LOH.
L.5 Breast Cancer
Breast cancer is the most common malignancy seen in women affecting approximately l0% of
females in the Western world. The route to breast cancer is not as well mapped as that of colon
35

Chapter I Literature Review
cancer due to the histological stages of breast cancer development being largely unknown. It is
known however, that breast cancer is derived from the epithelial lining of terminal maÍlmary
ducts or lobuli (Russo and Russo, l99l). The most common histological type of invasive
carcinoma is the infiltrating ductal carcinoma which constitutes approximately 90Yo of all
tumours, while the two most important non-invasive tumours are ductal carcinoma in situ
(DCIS) and lobular carcinoma in situ (LCIS). Hormonal influences, such as those exerted by
oestrogen, are believed to be important because of the marked increase in breast cancer
incidence in post-menopausal women, but the initial steps in breast cancer development
probably occur before the onset of menopause (Devilee and Cornelisse, 1994). As with colon
carcinoma, it is believed that a number of genes need to become involved in a stepwise
progression during breast tumourigenesis.
1.5.1 Cytogenetic Studies of Breast Cancer
Although breast carcinomas are among the most frequent malignant tumours, there is difficulty
in discerning any characteristic cytogenetic abnormality due to clonal heterogeneity and the
difficulty in obtaining high quality metaphases from these tumours. Therefore, less than 300
breast tumours have been karyotyped to date @evilee and Cornelisse, 1994) with no
characteristic cytogenetic alteration observed (Dutrillaux et al., 7990). Overall, the most
frequent changes seem to be in chromosome number, including trisomies of 7 and 18 and
monosomies of 6, 8, I l, 13, 76, 17, 22, and X (reviewed by Devilee and Cornelisse, 1994). In
addition, breaþoints of structural abnormalities have been shown to cluster to several regions
and have included lp22-q17, 3pl!, 6p11-13, Tpll-qll, 8p11-qll, 16q, and 19q13
(Thompson et ø1.,7993). Also, various rearrangements involving either 1q or 16q or both have
been observed as the sole cytogenetic abnormality (Dutrillaux et al., 7990) and interestingly,
alterations in chromosome 1 and 16 have also been seen in several cases of in situ carcinoma
36
Chapter I Literature Review
(Pandis et aL.,7992;Nielsen et a|.,1989)
1.5.2 Familial Breast Cancer
Certain \À/omen appear to be at an increased risk of developing breast cancer. The existence of
genes responsible for an inherited pre-disposition to breast cancer was suggested before the
turn of the century by Paul Broca, with segregation analysis many years later showing that 5 to
l\Yo of all breast cancers were due to at least two autosomal dominant susceptibility genes.
Generally, women carrying a mutation in a susceptibility gene develop breast cancer at a
younger age compared to the general population, often have bilateral breast tumours, and are
at an increased risk of developing cancers in other organs, particularly carcinoma of the ovary.
Genetic linkage analysis on families where the onset of breast cancer occurred before the age
of 46 was successful in mapping the first susceptibility gene> BRCAI, to chromosome 17q21
(Hall et al., l99O). However, of the 23 families studied, or:ily 7 (40%) showed linkage to the
Dl7S74'{NTR marker, indicating that further susceptibility genes were involved in the
remaining families. Additional studies in214 families established that mutations in BRCAI are
responsible for predisposition in nearly all families with both breast and ovarian cancers, but
only responsible for approximately 45Yo of those with breast cancer alone (Easton et al.,
1993). In a study involving families predisposed to breast cancer with at least one case of male
breast cancer, linkage to BRCAI was not found (Stratton et al., 1994) again indicating the
existence of additional susceptibility loci. In 1994,linkage analysis was successful in mapping
the BRCA2 gene to chromosome l3ql2-ql3 (V/ooster et al.,1994) with this gene conferring a
higher incidence of male breast cancer and a lower incidence of ovarian cancer when compared
to BRCAI. In the analysis of approximately 200 families with at least 4 affected members,
around 50% of families had convincing linkage to BRCAI, around 30Y"had linkage to BRCA2
)t
Chapter I Literature Review
and the remaining 2OYo were not linked to either of these loci (Szabo and King, 1995). The
eústence of a third locus has therefore been suggested (Serova et al., 1997), with evidence of
a gene on chromosome 8p proposed (Kerangueven et al., 1995), however this requires further
confirmation.
Analysis of breast cancers from both BRCAI and BRCA2 families has shown that LOH of 17q
and 13p markers respectively, is common (Smith et al., 1992; Collins et al., 1995c).
Furthermore, the allele lost is always the one that carries the wild type gene with the mutant
allele being retained in the tumours. This suggests in both cases tumour predisposition is due to
loss of a normal BRCA gene, and provides evidence that both BRCAI and BRCA2 are tumour
suppressor genes.
In 1994, the BRCAI gene was positionally cloned and shown to encode a protein consisting of
1,863 amino acids (Mki et al., 1994). Nearly 100 different mutations in this gene have been
identified without evidence of mutation clustering, with the most common mutations leading to
truncationoftheproteinproduct(Castilla etal., l994;Friedman etal., 1994; Simard etal.,
1994; Shattuck-Eidens e/ al., 1995; Struewing et al., 1995) Although most of the coding
region shows no sequence similarity to previously identified genes, the presence of a RING
zinc finger domain at the amino terminus of the protein suggests it may be involved in
mediating protein-protein interactions (Saurin et al., 1996). The finding that the BRCAI
protein colocalises, co-immunoprecipitates, and forms a complex with the HsRadSI protein
(Scully et al., 1997), suggests that it may participate in Rad5I functions. These functions
primarily concern the double-strand-break repair pathway (Shinohara et al., 1992;Baumann et
al., 1996), with the Saccharomyces cerevisiae homologue, ScRadïI, shown to be essential for
mitotic and meiotic recombination (Rockmill et a1.,1995).
38
Chapter I Literature Review
The BRCA2 gene was cloned in 1995 and encodes a protein consisting of 3,418 amino acids
and shows no significant homology to any known protein (Wooster et al., 1995). Although
fewer mutations in this gene have been reported to date than with BRCAI, again most appear
to give rise to a truncated protein product (Couch et al., 1996a; Neuhausen et al., 1996;
Phelan et al., 1996; Tavtigian et al., 1996). Although these two genes are not significantly
related in sequence, both appear to be coordinately regulated during proliferation and
differentiation in mammary epithelial cells (Rajan et al., 1996). Also, they have both been
shown to be highly expressed in rapidly proliferating cells, with the expression peaking at the
Gr/S boundary of the cell cycle, before DNA synthesis (Rajan et al., 1996). This expression
profile, together with the coÍìmon breast cancer phenotype, suggests that these genes may be
acting in the same biological pathway.
Recent studies of the BRCA2 gene have shown that it too binds to the Rad5I gene (Sharan el
at., 1997). Brca2 knockout mice have also shown early embryonic lethality similar to that seen
in Rad5l and BrcaL knockout mice. Also, hypersensitivity to irradiation has been observed in
Brca2 mutated cancer cells (Sharan et al., 1997; Abbott et al., 1998) suggesting, as with
BRCAI, this gene may be involved in the repair of DNA breaks, thereby controlling cell cycle
progression.
Additional inherited breast cancer syndromes exist, however they are rare. Inherited mutations
in the TP53 gene have been identified in individuals with Li-Fraumeni syndrome (Malkin et ø1.,
1990), a familial cancer resulting in epithelial neoplasms occurring at multiple sites including
the breast. Similarly, germline mutations in the MMACI/PTEN gene involved in Cowden's
disease (Steck et al., 7997;Liaw et al., 1997) and the ataxia telangiectasia (AI) gene (Easton,
l9g4) have been shown to confer an increased risk of developing breast cancer, among other
39

Chapter I Literature Review
clinical manifestations, but together account for only a small percentage of families with an
inherited predisposition to breast cancer
Somatic mutations in the TP53 gene have been shown to occur in a high percentage of
individuals with sporadic breast cancer (see 1.5.3). However, although LOH has been observed
at the BRCA t and BRCA2loci at a frequency of 30 to 40%o in sporadic cases (Cleton-Jansen el
al., 1995;Saito et ø1.,7993), there is virtually no sign of somatic mutations in the retained
allele of these two genes in sporadic cancers (Futreal et al., 1994;lv[tk't et al., 1996). Possible
explanations for this have been proposed (Kinzler and Vogelstein, 1997), which take into
account the possible role of these genes in the regulation of cell growth. For example, the
TP53 gene may be a "gatekeeper" which directly regulates growth of cells, whereas the BRCA
genes may be "caretakers", with inactivation of these two genes leading to an instability of the
genome, rather than promoting tumour initiation directly. For normal individuals to develop
breast cancer they would therefore have to acquire at least four somatic mutations in the same
breast epithelial cell, two mutations in a caretaker gene, followed by mutations in both alleles
of a gatekeeper gene, which may account for the low number of sporadic cases showing
complete loss of either the BRCAI or BRCA2 gene.
1.5.3 Other Genes Involved in Breast Cancer: Prognostic Implications
Although numerous oncogenes involved in cancer have been identified, only a small number
appear to play a part in the development of breast cancer. ERBB 2 at 77 q12, a gene encoding a
tyrosine kinase growth factor receptor, has been shown to be amplified in about 20 1o 25o/o of
breast tumours (Slamon et al., 1989). However, examination of tumours that have
metastasised to the lymph nodes (node positive tumours), shows this number increases to 35Yo,
and amplification was correlated with a poorer prognosis and relapse (Gullick et al., 1991).
40
Chapter I Literature Review
However, a number of subsequent studies have been unable to confirm this result (reviewed in
van de Vijver, 1993).
Amplification of the proto-oncogene MYC,located on chromosome 8q24, has been shown to
occur in about 2O to 3OYo of primary breast tumours. Further, in 80% of tumours this gene is
overexpressed without amplification (reviewed by El-Ashry and Lippman, 1994). MYC has
been shown to positively and negatively regulate the expression of a number of genes in
apoptosis and cell cycle progression (Ryan and Bernie, 1996). Amplification of MYC has also
been associated with a poor patient prognosis (Varley et a|.,1987; Tsuda et a|.,1989).
The chromosome region llql3 is amplified in 15 to 20%o of breast tumours (Lammie and
Peters, l99l). Amplification of this region has been associated with a poor prognosis, lymph
node involvement, and oestrogen and progesterone receptor positivity (Devilee and Cornelisse,
1994). Many genes are found to be co-amplified in this region, however the cyclin D1
(CCNDI) gene appears to be the target of amplification (reviewed in Brenner and Aldaz,
1997). This gene is a direct regulator of the cell cycle and is overexpressed in 45Yo ofbreast
carcinomas (Bartkova et ø1., 1994).
The technique of comparative genome hybridisation (CGH) has identified another region
commonly amplified in breast carcinomas, the long arm of chromosome 20 (Kallioniemi et al.,
1,994). CGH is a technique aimed at detecting amplified andlor deleted regions of DNA in
tumours (Kallioniemi et al., 1992). Tumour and normal DNA are labelled with different
fluorochromes, mixed in equal proportion, and hybridised to normal metaphase chromosomes.
The hybridisation pattern of tumour and normal DNA along each chromosome is then analysed
by examination of the ratio of the fluorochrome labels. Studies using CGH have found gains
41

Chapter I Literature Review
and amplifications of the 20q73 region in l2-78Yo of primary breast tumours and 4OYo of cell
lines (Kallioniemi et al., 1994; Muleris et ø1., 1994).In addition,20qI3 amplifications by CGH
correlated with poor prognosis in breast cancers with associated lymph node metastasis (Isola
et al., 7995), and was the most amplified region in breast tumours that did not involve a
previously known oncogene. This region of amplification has since been reduced to a 1.5 Mb
segment at20q13.2 (Tanner et a1.,1994). So far a number of genes mapping to this location
have been excluded as the putative breast cancer oncogene (Tanner et al., 1994) and further
work is needed to identify more candidate genes.
Although the RB gene is primarily responsible for retinoblastoma, LOH for this gene has also
been found in approximately 360/o of breast tumours, with mutations that inactivate the
remaining copy being identified (Horowitz et al., 1989). In contrast to ERBB2, MYC, and
CCNDI, which are oncogenes, RB gene is a tumour suppressor gene which acts as a negative
regulator of the cell cycle through the interaction with a variety of cellular proteins, most
notably the E2F family of transcription factors.
The TP53 gene is the single most commonly mutated tumour suppressor gene in cancer and
maps to 17p13.1, a chromosomal site that shows frequent LOH in breast tumours (see Figure
1.2). Furthermore, it has been shown to be inactivated in alarge percentage of sporadic breast
cancers (Coles et al., 1992). The gene is induced in response to DNA damage and functions to
prevent the continued proliferation of genetically impaired cells through the induction of cell
cycle arrest or apoptosis (reviewed in Hansen and Oren, 1997). The wild-type p53 protein is a
sequence specific transcription factor that is able to activate genes possessing p53 consensus
sites. The domain responsible for specific DNA binding was located to the central "core" of the
protein which encompasses the majority of residues mutated in human cancer (Pavletich et al.,
42
Chapter l I.iterature Review
tee3)
1.5.4 Sporadic Breast Cancer and Loss of Heterozygosity
The use of both RFLP and STRP markers has identified numerous regions of allelic imbalance
in breast cancer suggesting the presence of tumour suppressor genes in these regions. Figure
l.2indicates that data compiled from more than 30 studies reveals the loss of DNA from at
least 11 chromosome arTns at a frequency of more than 25Yo, with regions such as l6q and 17p
affected in more lhan 50Yo of tumours (Deville and Cornelisse, 1994; Brenner and Ndaz,
1995). Furthermore, some of these regions are known to harbour tumour suppressor genes
shown to be mutated in individuals with both sporadic (TP53 and RB genes) and familial
(TP53,RB,BRCAI, andBRCA2 genes) forms ofbreast cancer.
Although the consistent loss of certain regions of the genome has been identified, it is difficult
to determine the relevance of these losses to the tumourigenic process. In most of the studies,
tumours analysed were at a relatively advanced stage of progression, suggesting that some
losses may be due to the general genomic instability characteristic of tumour cells. To address
this problem, and to determine which tumour suppressor loci are involved in the initiation
stages of breast carcinogenesis, LOH studies have been undertaken on pre-invasive ductal
carcinomas (DCIS). One study examined 6l samples of DCIS with 56 polymorphic markers
covering 39 autosomal arms (Radford et a|.,1995). They identified significant LOH for loci on
8p (15.7%),13q(l8Yo), 16q (28.6%),17p (37.5%) and l7q(15.9%). These regions also show
high rates of LOH in invasive cancer. In another study, allelotype profiles of 23 DCIS samples
were compared with that of 29 invasive ductal breast tumours (Ndaz et al., 1995). A total of
20 loci were analysed, and loss of genetic material from chromosome arms lp, 3p,3q, 6p, l6p,
l8p, 18q, 22q, and possibly 6q and llp, appeared to be late events in breast cancer
43
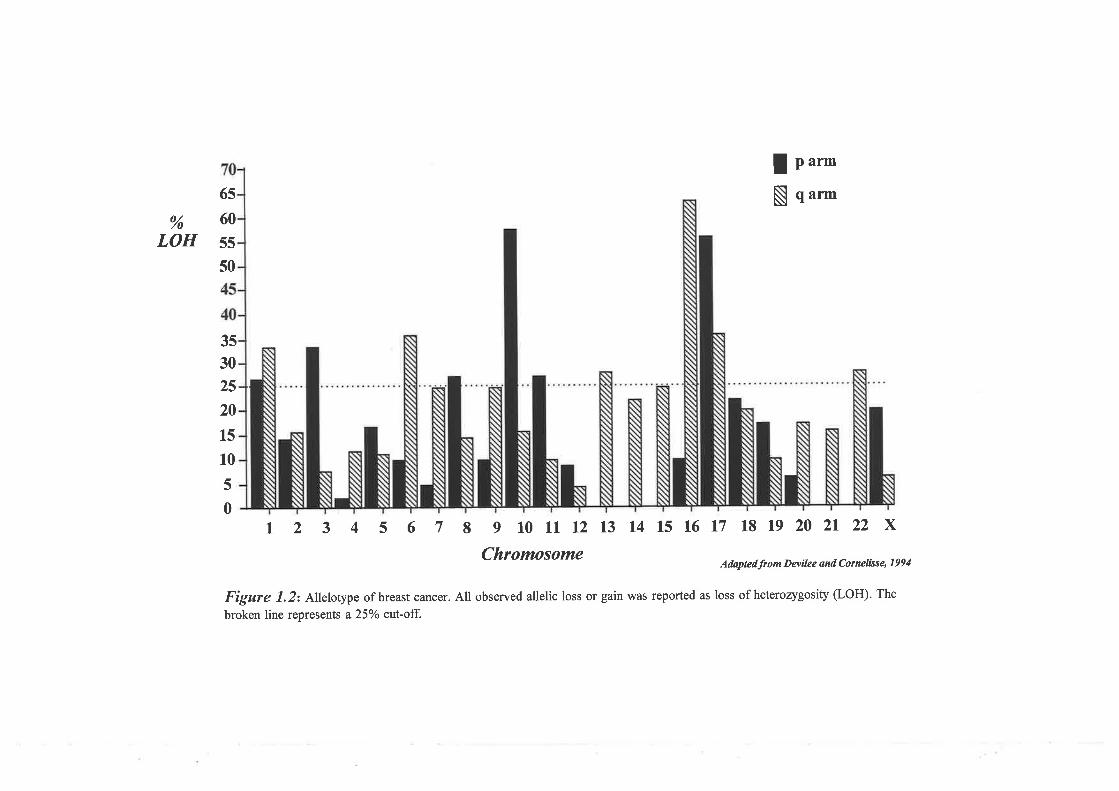
I Put*
N q"t^
LOH
o5
60
55
50
%
3s
30
25
20
L5
10
5
0
I 2 3 4 5 6 7 8 9 101112 1314 151617 1819202122 X
chromosome Adaptetlfrom Dqilee and co¡nelhse, 1994
Fìgure 1.2: Allelotype of breast cancer. All observed allelic loss or gain was reported as loss of heterozygosity (LOH). The
broken line represents a25%o cut-off.
Chapter I Literature Review
progression due to a low percentage of allele loss in the DCIS samples. In contrast, allele
losses affecting chromosome arms 7p,l6q,l7p, and 17q, appeared to be early abnormalities as
they were observed in 25-3OYo of DCIS lesions. The common occurrence of allelic losses
affecting the chromosome 16q arm in both invasive and non-invasive breast cancer, coupled
with the occurrence of cytogenetic structural abnormalities between l6q and chromosome I
observed in direct chromosome analysis of sporadic breast cancer tumours @andis et al.,
1992), suggests the presence of a tumour suppressor gene(s) on this chromosomal arm which
is critically involved in the earþ development of alarge proportion of breast cancers
1.5.5 Loss of Heterozygosity and Chromosome 16q
Evidence for LOH on l6q has also been identified with comparable frequencies for other
carcinomas. These include prostate cancer (Carter et al., 1990), hepatocellular carcinoma
(Zhang et al., 1990; Sakai et al., 1992), central nervous system primitive neuroectodermal
tumours (Thomas and Raffel, l99l), Wilms' tumour (Maw et al., 1992), and ovarian cancer
(Sato e/ al.,l991b).
To localise the position of the breast cancer tumour suppressor gene(s) on the long arm of
chromosome 16, many groups have performed detailed LOH studies using markers that
saturate this chromosome arm. Initial studies made use of RFLP markers, which at the time
were quite limited in number and represented a low-resolution genetic linkage map. One study
examined 219 sporadic primary breast tumours, of which 193 were invasive ductal carcinomas,
with 7 RFLP markers on the long arm of chromosome 16 (Sato et al.,l99la). Their findings
indicated that 5lYo (781153) of tumours displayed LOH for at least one marker on this
chromosomal arm, with a coÍrmon region of deletion detected in the chromosomal segment
distal to the HP gene locus, and proximal to D16S157 (Figure 1.3). It was also noted that in
45
Chapter I Literature Review
the group of tumours ì¡iith a highly malignant phenotype (ie lymph node metastasis, large
tumour size), LOH involving markers on other chromosomes also occurred. This would
indicate that accumulation of genetic alterations might contribute to tumour development
andlor progression in primary breast cancer.
In another study by Tsuda et al., LOH analysis of 234 breasl tumours, using 6 RFLP markers
from 16q, established that 55o/o (1271230) of tumours had LOH on this chromosomal arm
(Tsuda et al., 1994). This high incidence of LOH \ryas seen not only in large well-advanced
tumours, but also in lower grade cancers, suggesting the presence of a tumour suppressor gene
playing a role in the earþ development of breast cancer. A more detailed deletion map of 78 of
these tumours (38/78 displayed 16q LOH), using an additional 12 RFLP markers, indicated
that while 23 tumours were suggested to have partial allele loss, 15 tumours appeared to have
lost the whole l6q arm. From the deletion map established, LOH was most frequent in the
16q24.2-qfer region between D16S43 or D16S155, and qter (Figure 1.3). Eight cases
comprised a group that showed LOH between l6cen-q22.1 but not at 16q24.2-qter (Figure
1.3). This group consisted of mainly advanced tumours displaying aggressive phenotypes,
suggesting that an additional gene to the one proposed at 16q24.2-qter may be present on l6q,
and this gene is involved in the formation of biologically aggressive phenotypes of breast
cancer
With the identification of microsatellite repeats and their use in the construction of detailed
linkage maps of the human genome, many new markers became available for LOH analysis of
breast tumours. In 1994, a study combining both traditional RFLP markers and new STRP
markers mapping to l6q, were used in LOH analysis of 79 sporadic cases of breast cancer
(Cleton-Jansenet at.,7994). Atotal of twenty, 16q markers were chosen, with63o/o (50/79) of
46
Chapter l Literature Review
tumours showing LOH for at least one marker. As with previous studies, a number of tumours
(20%) appeared to have lost the entire long arm of chromosome 16 rather than defined regions
of the chromosome, further reducing the sample size for narrowing down targets of LOH.
However, two common regions of deletion were noted in the remaining tumours. The first
region at 16q24.3, was defined by 7 of these tumours which displayed loss for one or more of
the last 3 telomeric markers only (restricted loss), with one tumour inclicating this loss to be
between APRT and D165303 (Figure I 3). The second region of restricted loss was identified
by 7 tumours that showed interstitial loss of l6q markers, with one tumour defining this region
to be at 16q22.1, between D16S398 and Dl6S30l. These two regions correlate well with
those identified by Tsuda et al. (1994), suggesting the presence of two tumour suppressor
genes. However, the results of Sato et al. (1991ø) indicate that a third region at 76q22.2-q24.2
may exist.
Another study examined 150 sporadic primary breast tumours with four 16q markers and
established that 101 (67%) showed allelic imbalance for at least I marker (Skirnisdottir et al.,
1995). Results from anaþsis of a further five 16q markers on these 101 tumours, indicated that
48 (47%) showed LOH for all informative markers, with the remaining 53 tumours displaying
partial or interstitial deletions. When the LOH pattern of tumours displaying restricted loss
only is analysed, two common regions of allele loss are identified, with both regions
overlapping those previously reported (Tsuda et al., 7994; Cleton-Janseî et al., 7994). The
first region lies distal to Dl6S4l3, located at 16q24.3, and the second region lies between
Dl6S260 and D16S265, encompassing the l6q22.l region (Figure 1.3).
Dorion-Bo¡tnet et al. (1995) conducted an allelic imbalance study of nine 16q markers in 46
primary breast carcinomas, again indicating a high incidence (65%) of LOH for this
47
Chøpter I Literature Review
chromosomal arm in breast cancer. While most of these tumours appeared to have lost the
majority of the long arm, the three regions previously identified displaying restricted LOH
overlapped with regions lost in the remaining tumours examined in this present study (Figure
1.3). A later study by this group (Driouch et al., 1997) examined LOH of 16q in 24 breast
cancer metastasis. Results again indicated the same three regions previously identified to be
involved (Figure 1.3).
A large study of 210 sporadic cases of breast cancer by Iida et al. (1997) using 14
microsatellite markers on 16q, again showed LOH for the long arm of chromosome 16 is a
common and significant occurrence in breast cancer, with 67Yo of tumours showing loss for at
least I marker. Two target regions were identified, one region located at 16q23.2-24.1
between D165512 and D1655l5 was defined by 7 tumours showing restricted LOH, while the
second region located at 16q24.3 between Dl6S413 and D16S303 was defined by 3 tumours
(Figure 1.3). The first region overlaps that previously described by Driouch et al. (1997) and
Sato et al. (l99la), with the second region agreeing with that detected by all previous studies
mentioned.
Detailed LOH studies of ductal carcinoma in situ (DCIS) of the breast have also been done.
Chen et al. (1996b), examined 35 tumour samples with 20 chromosome 16q microsatellite
markers, and identifïed that 3l (89%) had LOH of l6q. This higher incidence of allele loss than
previously observed was likely due to the use of very precise tissue microdisection of tumour
material from stromal contaminants, and the use of highly informative markers. Most tumours
appeared to display random loss (complex loss) of chromosome 16q markers, however results
indicated thal again, three regions on this chromosomal arm might be involved in breast
tumourigenesis (Figure 1.3).
48
Chapter I Literature Review
Preliminary LOH analysis of chromosome l6q in prostate cancer has also been done. One
study examined 48 cases of primary or metastatic prostate cancers with 17 markers from
chromosome l6q and established that 42Yo showed LOH for at least one marker (Suzuki et ø1.,
1996). Their results indicated that three commonly deleted regions were identified, each
overlapping with those seen in breast carcinoma (Figure 1 3). Another study (Latil et ø1.,
1997), was able to again identify 3 regions of restricted loss, however only two of these
corresponded to those observed in breast cancer (Figure 1.3) Finally, a study by Godfrey et al.
(1997) also indicated that the regions at 16q243 and 16q22 were coÍrmonly deleted in
prostate carcinomas.
A consistent finding in all LOH studies in breast cancer is that allelic imbalance on
chromosome 16q occurs irrespectively of differences in clinico-pathological parameters. No
correlation could be observed with indicators such as lymph node status, differences in clinical
stage, tumour size, histology, age at diagnosis, ploidy, or family history of breast cancer.
However, a weak but statistically significant correlation between allelic imbalance on 16q and a
positive oestrogen receptor content was identified by Cleton-Jansen et al. (1994), although this
was not observed in other studies. Also Skirnisdottir et al. (7995) were able to establish a
correlation with a high progesterone receptor content and low S-phase fraction, with patients
showing a low S-phase fraction having about a lgYo higher survival rate than patients with high
S-phase fractions. This again was not seen in other studies. However, in prostate cancer, it has
been established that LOH at the 16q24.1 region is significantly associated with a clinically
aggressive behaviour of the disease, metastatic disease and a higher grade of tumour (Elo et
a1.,7997).
Figure 1.3 provides a summary of all LOH studies involving markers on the long arm of
49
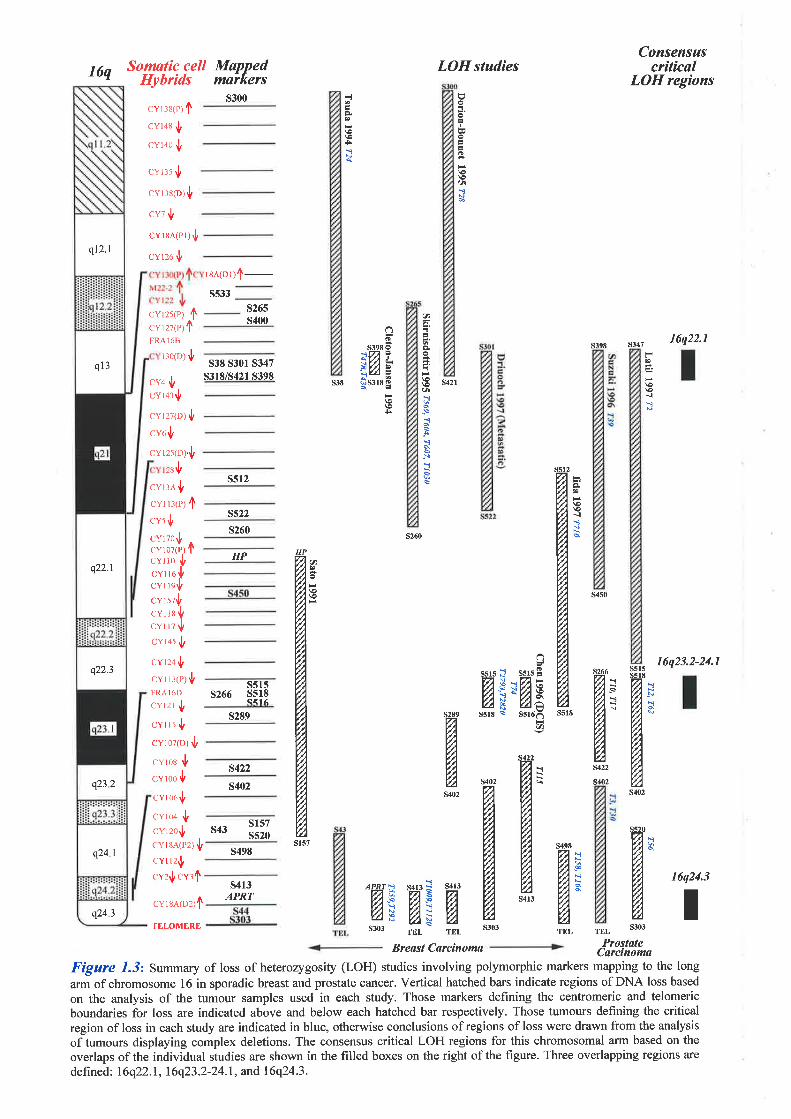
q12.t
ql3
q22.1
q22.3
1
q23 2
q24.1
q24.3
Somatic cellHybrids16q Mapped
mnrkersLOH sludíes
Consensuscritical
LOH regions
16q22.1
16q23.2-24.1
16q24.3
cvr:s1c¡ '|\
cvr+e rl,
cvr+o r!
CVr:S rl,
cvr:sp¡rf,
CVU rf,
cv r selr'r; {¡
cvrze $r selo r ¡{t-s533
cYr25(P)
,ts265s400
cY r 27(P)
FRA168
l¡otol ,1,s38 S30l 5347
s3l8/s421 5398CV+ ,1,
cvr+:,|l
cvrZZlo¡,1,
CVOrl,
cvrzslo¡'l¡
2sù
CVf :A tl,
cvr ng¡ {\
s512
s522
s300
s38
Ê
Þ
\o\oåì
I
tÉ
o
€\o(¡I
I
ffis
w
-tWa
ffi
ssts sì
HË-s518 s
ffi
ffiÌ: s413 =ì s¿t¡
ËHÈ ffi^W
as398 0
sØliEä Ë
$ssrtfi
ch
Þ
f.T
u
q'
ì.\I
H=
øæWw
*'Wffir
ï;
ffi s4es
H" ffiÊ
s347
\oà
FÞ
\o€{\s421
CVS rf,
cvro,!cY l 07(P)
cvr ro r[cvr re {cv r rorl,
Cv rsrrl,
cvr rt IcYll7 V
s260s260
t HP
ffir
H
cvr+s rf¡
cv t:+ $cvr r:1r,¡ rl,
FRA I 6D
cvrur ,1,
cvrrs r!
cv r oz1o.¡ {
s515s266 s518
s5t Á
s289
s422
s402
s43s157ss20
s498
s413APRT
cvros {c" r oo rl,
cvroorl,
CVrO+ r!cvrzoIcvteelrz¡
'l¡cvr rz$
cvz,f, cv:f
cvrreloz¡'f
.TELOMEREs30f,
Breast Carcínoma cPÌr\ì'#i*Figare ,f.3: Summary of loss of heterozagosity (LOH) studies involving polymorphic markers mapping to the long
arm of chromosome 16 in sporadic breast and prostate cancer. Vertical hatched bars indicate regions of DNA loss based
on the analysis of the tumour samples used in each study. Those markers defining the centromeric and telomeric
boundaries for loss are indicated above and below each hatched bar respectively. Those tumours dehning the criticalregion of loss in each study are indicated in blue, otherwise conclusions of regions of loss were drawn from the analysis
of tumours displaying complex deletions. The consensus critical LOH regions for this chromosomal arm based on the
overlaps ofthe individual studies are shown in the filled boxes on the right ofthe figure. Three overlapping regions are
defined: 16q22.1, 16q23.2-24.1, and 16q24.3.
Chapter I Literature Review
chromosome l6 in both breast and prostate cancer. The markers used in the LOH analysis have
been physically mapped to the chromosome using a somatic cell hybrid panel (Callen et al.,
lgg5), which allows integration of genetic and physical distances between markers. A striking
consistency is observed in the majority of these studies. The appearance of three regions of
consistent restricted LO}J (16q22.1, 16q23.2-24.1, and 76q2a3) provides evidence that
possibly three independent tumour suppressor genes may reside adjacent to the markers used
for the LOH analysis in these regions playing a role in the genesis of these two carcinomas.
When interpreting results from LOH studies, care is needed. A number of problems can
confuse the comparison of the genotypes in normal and tumour DNA from an affected
individual. In the majority of tumour biopsies, a significant amount on non-malignant cells can
also be found which may obscure any LOH that may be present in the tumour cells. It has been
shown that tumour samples with >50% malignant cells give reliable results in an LOH
screening (Devilee and Cornelisse, 1994; Dorion-Bonnet et al., 1995).In the majority of LOH
studies discussed above, the level of normal cell contamination for each tumour was
determined histologically, such that only those samples containing at least 5QYo of malignant
cells were used for the subsequent LOH analysis. Another approach to avoid normal cell
contamination has been the use of very precise tissue microdissection, which improved the
separation of tumour material from normal stromal cells (Chen et al., 1996b). In this study,
89Yo of DCIS tumours were shown to have allele losses in one or more informative loci
examined from the long arm of chromosome 16. This is the highest incidence of LOH that has
been reported and may reflect the purity of the samples analysed. Another problem inherent to
LOH analysis is that in most studies, the tumours analysed were of the invasive type and/or
advanced stages of progression. It is therefore possible that not all allele losses are causative
factors of tumourigenesis but may be the result of the general genomic instability characteristic
51
Chøpter I LiÍerature Review
of tumours in advanced stages. This problem has been overcome by Aldaz et al. (1995) from
the comparative allelotyping of both pre-invasive ductal carcinomas (DCIS) and invasive
tumours. A third problem often arises due to the lack of informativeness of many of the
polymorphic markers used in the LOH studies, particularly the RFLPs. This often leads to
regions of the genome for which data are not available and prevents definition of a region of
LOH. Despite these difficulties, LOH has been shown to be the mechanism responsible for the
inactivation of known tumour suppressor genes (Smith et aL.,7992; Collins et a|.,1995c, Berx
et al., 1995, 1996). Since consistent LOH of defined regions on the long arm of chromosome
16 have been identified in breast and other carcinomas, it is concluded that tumour suppressor
genes residing at these sites may also be the targets for LOH in these carcinomas.
1.5.6 Candidate Genes for 16q Loss of Heterozygosity
The epithelial cadherin gene (CDHI) maps within the region of LOH at 16q22.1 (Mansouri el
al., 7988). This gene is important for the maintenance of cell-cell adhesion in epithelial tissues.
Evidence suggests that a loss of function in CDHI andlor one or more collaborating proteins
contributes to increased proliferation, invasion, and metastasis in breast cancer and other solid
tumours (Ilyas and Tomlinson, 1997). In addition, mutations in CDHI have been detected in
breast cancer cell lines @ierceall et a1.,1995; Hiraguri et a|.,1998), and in 27 of 48 infiltrating
lobular breast tumours studied (Berx et al., 1995, 1996), with the majority of mutations
occurring in combination with LOH of the wild-type locus. However, no mutations in this gene
have been identified in the most common sub-type of breast cancer, ductal carcinoma
(Kashiwaba et al., 7995), which have been the majority of samples analysed in reported LOH
studies. Therefore other genes present in this region of q22.1 may be candidate tumour
suppressor genes.
52
Chapter I Literature Revie.w
The evolutionary conserved DNA binding protein CTCF, which also maps to l6q22.l
(Filippova et a1.,1998), maybe atumour suppressorgene dueto its role as one of the major
factors regulating vertebrate MYC expression (Klenova et al., 1993; Filippova et al., 1996).
Given dysregulated MYC expression is a common occurrence in the development of breast
carcinomas (1.5.3), mutations affecting any regulator of MYC expression, including CTCF,
may play a role in breast tumourigenesis. Recently, two breast cancer cell lines have been
shown to harbour genomic CTCF rearrangements, and one of four fresh breast tumour samples
of unknown histological type also exhibited a tumour specific genomic rearrangement of CTCF
exons (Filippova et a1.,1993). Additional evidence that this gene plays a major role in breast
tumourigenesis needs to be obtained.
A candidate gene mapping to the I6q23.2-24.1 LOH region is the breast cancer anti-oestrogen
resistance (BCARI) gene (Driouchet a1.,7997).It has been shown that defective retroviruses
may be responsible for the loss of oestrogen receptor expression in human cells in vitro via
insertional mutagenesis into the BCARI gene (Dorssers el al., 1993). Given that oestrogen
receptor negativity has been associated with a poor prognosis in breast cancer, this gene may
well be atarget for LOH at this chromosomal site. However, this has yet to be confirmed.
At the onset of this project, the LOH analysis of additional markers mapping Io 16q24.3 and
additional tumour samples to those reported by Cleton-Jansen et al. (1994) had been achieved.
Figure 1.4 summarises the results of these studies indicating those tumours that appear to
display restricted loss of markers mapping to this region. The results suggest that the smallest
region of LOH is between D16S3026 and D16S303, occurring in tumours 8T559 and BT410
(Cleton-Jansen, personal communication). Genes located in this interval at the start of the
project included BBC l, CMAR, DPEP I, and MC IR.
53
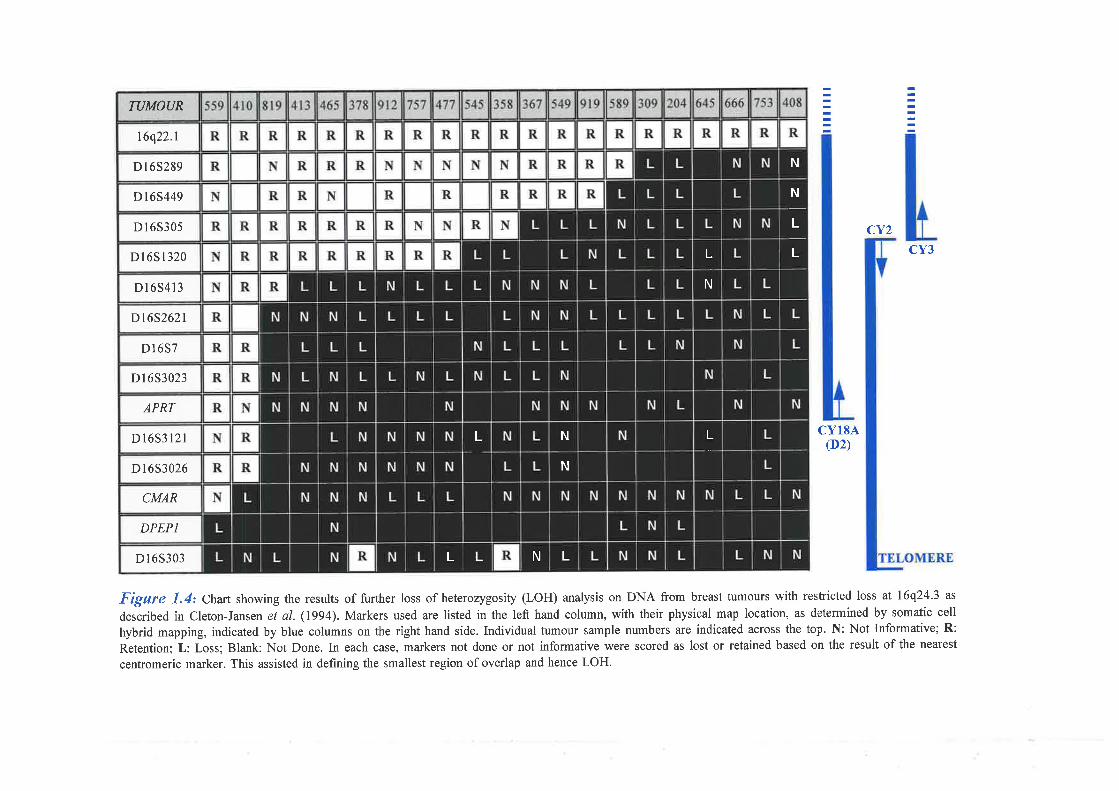
D I 63303
Dt6S262t
DI657
D I 653023
APRT
Dl65312l
D1653026
CMAR
DPEPI
TUMOUR
l6q22.t
D I 6S289
D I 65449
D I 6S305
Dl6Sl320
Dl654l3
LNLL
L N
N
L
L
N
N
N
L
L CY3
CY2
CY18A
Figure 1.4t Chart showing the results of further loss of heterozygosity (LOH) analysis on DNA from breast tumours with restricted loss at 16q24.3 as
described in Cleton-Jansen et al. (lgg4). Markers used are listed in the left hand column, with their physical map location, as determined by somatic cell
hybrid mapping, indicated by blue columns on the right hand side. Individual tumour sample numbers are indicated across the top. N: Not Informative; R:
Retention; L: Loss; Blank: Not Done. In each case, markers not done or not informative were scored as lost or retained based on the result of the nearest
centromeric marker. This assisted in defining the smallest region of overlap and hence LOH.
.D2)

Chspter l Literqture Review
The breast basic conserved (BBCI) gene displays decreased mRNA expression in malignant
breast tumours compared to benign tumours (Adams et al., 1992) and shows homology to the
human ribosomal protein L13. However, the L13 protein has been shown to contain a DNA
binding motif characteristic of transcription factors (Tsurugi and Mitsui, 1991), suggesting
BBCI is not a candidate tumour suppressor gene. Mutation analysis of this gene was recently
performed in samples of breast tumour DNA clisplaying restrictecl T,OH for 16q24 3, but no
mutations were identified in this gene in these samples (Moerland et a1.,1997).
The cellular matrix adhesion regulator (CMAR), was originally isolated from a colorectal cell
line library, and shown to enhance binding to the extracellular matrix component, collagen type
1 (Pullman and Bodmer, 1992). Loss of CMAR activity, and hence cell attachment, could
therefore possibly be an early step towards tumour invasion and metastasis. However, the
recent cloning of the spastic paraplegia gene, SPGT (Casan et al., 1998), has shown that
CMAR is the 3' untranslated part of this gene and is therefore unlikely to play a role in breast
carcinogenesis.
The renal dipeptidase (DPEPI) gene was originally isolated from a kidney oDNA library by
subtractive hybridisation with Wilms' tumour mRNA (Austruy et al., 1993). Although
suggested to be a potential tumour suppressor gene, its role in tumourigenesis is yet to be
determined. Finally, the melanocyte stimulating hormone receptor (MCIR) gene has been
shown to be involved in the regulation of pigmentation phenotype (Valverde et a1.,1995) and
is therefore not a likely candidate gene.
55

Chapter I Literature Review
1.6 Project Aims
The refined 16q LOH studies in breast cancers performed by a collaborating group in Leiden,
has defined a critical region at 16q24.3. This interval is bounded proximally by Dl653026 and
distally by D16S303. These loci are both located within the region defìned by the somatic cell
hybrid breakpoint CYISA(D2) and the telomere of the long arm (Callen et al., 1995). The
close physical proximity of these two markers suggests fhat a positional cloning strategy to the
identification of the proposed tumour suppressor gene is a realistic approach.
Due to the lack of cloned DNA located in this interval, the first aim of the project is to
construct a detailed physical map between D16S303 and Dl6S312l. This map will be based on
overlapping cosmids identified from the screening of a human flow-sorted chromosome 16
specific library with markers located in the critical region, which will assist in the subsequent
identification of novel coding sequences. Selected cosmids spanning this region will be used as
templates for exon trapping experiments to isolate transcribed sequences. Additional transcript
data will be obtained from the analysis of ESTs mapping to 16q24.3 as part of the Human
Gene Map construction at NCBI, and dbEST database screening of partial cosmid sequence.
Trapped exons and oDNA clones will be assembled into transcription units that will be
characterised fuither This will involve the isolation of the full-length sequence of the
corresponding gene and establishing an expression pattern for the gene. Sequence homology
searches of characterised genes may then provide a possible function for the associated protein.
Finally, candidates will be screened by mutation analysis of DNA from tumours defining the
critical region of LOH at 16q24.3 (see Figure 1.4) to determine if any of these genes is a
tumour suppressor altered in breast carcinomas.
56
Chapter I Literature Review
Finally, the use of exon trapping to construct a transcription map of a segment of chromosome
17p73 will be explored. This region has been shown to contain a gene responsible for
cystinosis by genetic linkage analysis, and a collaboration has been established to positionally
clone the gene responsible. The collaborating laboratory has established a physical map within
the critical region based on cosmid clones. This thesis describes the use of exon trapping
experiments with these cosmids to identify the oystinosis gene.
Since portions of the research described in this thesis are collaborative projects, the work
contributed by other individuals will be acknowledged where appropriate in the text.
57
Muteriuls
and
Methods
Chapter 2 Materials and Methods
Table of Contents
2.1Materials
2. l. I Fine Chemicals and Compounds and Their Suppliers
2.l.2F;rzymes
2.1.3 Elecirophoresis
2.1.4 Aîtlbiotics
2.1 .5 Bacterial Strains
2.7.6}ifledia
2.L6.1 LiquidMedia
2.1.6.2 SolidMedia
2.1.7 DNA Vectors
2.1.8 DNA Size Markers
2.1.9 Radio-Chemicals
2.1.70 Miscellaneous Materials and Kits
2.l.ll Buffers and Solutions
2.2 Methods
2.2.1 DNA Isolation
2.2.1.1 CosmidDNA
2.2.1.2 Isolation of PAC and BAC DNA
2.2.1.3 Plasmid DNA
2.2.L4 Genomic DNA
2 .2.2 P r ep aration of B acterial Glycerol Stocks
2.2.3 Preparation of Sheared Human Placental DNA and Salmon Sperm DNA
2.2.4Isolation of Total RNA
2.2.4.1 RNA Isolationfrom Fresh Tissue
2.2.4.2 RNA Isolationfrom Cell Lines
2.2.5 Oligonucleotide Primer Design
2.2.6 Quantitation of DNAr RN,\ and Oligonucleotide Primers
2.2.7 Restnction Digests
2.2.7.1 Digestion of Genomic DNA
2.2.7.2 Digestion of Cosmid, BAC, ønd PAC DNA
2.2.7.3 Digestion of Plasmid DNA
2.2.8 Agarose Gel Electrophoresis
2.2.9 DNA Size Markers
Page
58
58
60
6t
6t
6l
62
62
63
63
63
63
64
64
66
67
67
68
68
69
70
70
70
70
72
72
72
73
73
IJ
73
74
74
Chqpter 2 Materials and Methods
2.2.10 Southern Blotting
2.2.10.1 Transfer in I0X SSC
2.2.10.2 Transfer in 0.4 M NaOH
2.2.11 Northern Blotting
2.2.I I.I RNA Electrophoresis
2.2.1 1.2 Transfer of RNA to Membranes
2.2.12 "P Radio-Isotype Labelling of DNA
2.2.12.1 Labelling DNA Fragments in Solution
2.2.12.2 Labelling DNA Fragments in Agarose
2. 2. I 2. 3 Pre-Reassociation of Labelled Probe s
2.2.13 Hybridisation of Membranes
2. 2. I 3. I Southern Hybridisations
2. 2. I 3. 2 Northern Hybridisations
2.2.13.3 \4/ashing of Membranes
2.2.13.4 Strtpping of Membranesfor Re-Use
2.2.74 Polymerase Chain Reaction (PCR)
2.2.14.I Standnrd PCR Reqctions
2.2.14.2 Colony PCR Reactions
2.2.15 Reverse Transcriptase PCR (RT-PCR)
2. 2. I 5. I Reverse Transcription
2.2.15.2 PCR of Reverse Trønsuibed RNA
2.2.16 Purification of DNA Fragments
2.2.16.1 QlAquick Purificøtion of PCR Fragments qnd Radio-Labelled Probes
2.2.16.2 Prep-A-Gene Purification of DNA Fragments in Agarose
2.2.17 Sub-Cloning of DNA Fragments
2.2.17.1 DNA Ligations
2.2.17.2 Ligating PCR Products into the pGEM-T Vector
2.2.17.3 Preparation of Competent Bacterial Cells
2.2.17.4 Transformation of Competent Bqcterial Cells
2.2.17.5 Preparation of Colony Master Plates and Colony Lfting
2.2.18 DNA Sequencing
2. 2. I 8. I DyeTerminator Cycle Sequencing
2. 2. I 8. 2 DyePrimer Cycle Sequencing
2.2.19 Fluorescence in situ Hybridisation (FISH)
2.2.20 5' Rapid Amplification of oDNA Ends (5' RACE)
2.2.21PCR Formatting of the Fetal Brain oDNA Library
2.2.21.1 Lambdo Phage Plating
2.2.21.2 Lombdn Phage Scraping
2.2.2L3 Pooling of Phage Scrapes
74
74
75
75
75
76
76
76
77
77
78
78
78
79
79
80
80
80
8l
8l82
82
82
83
84
84
84
84
85
85
86
86
87
88
88
89
89
90
90
Chapter 2 Materials and Methods
2.I Materials
2.1.L Fine Chemicals and Compounds and Their Suppliers
Ammonium sulphate
Bactoagar
Bactotryptone
Boric acid
BSA (bovine serum albumin-pentax fraction V)
Chloroform
DAPI (diamidino phenylindole dihydrochloride)
DEP C (diethylpyro carbonate)
Deoxy-nucleotide triphosphates (dNTPs)
Dextran sulphate
Nfl-dimethyl formamide
DMEM (Dulbecco's modified Eagles medium)
DMS O (dimethylsulphoxide)
DTT (dithiothreitol)
EDTA (ethylenediaminetetracetic acid; NazEDTA .2H2O)
Ethanol (99.5% vlv)
FCS (fetal calf serum)
Ficoll (Type 400)
Formamide (deionised before use)
Glucose
Glutamine
Glycerol
Sigma
Aj ax Chemicals, Australia
Sigma Chemical Co., USA
Difco Laboratories, USA
Ajax
Sigma
BDH Lab Supplies
Sigma
BDH
Pharmacia Biotech
Pharmacia or Promega
Trace Biosciences
Sigma
Sigma
Ajax
BDH
Trace Biosciences
Sigma
Fluka Chemika
Ajax
Trace Biosciences
58
Ajax

Chapter 2 Materials and Methods
Human placental DNA
IPTG (isopropylthio-B-D-galactosidase)
Isoamyl alcohol (IAA)
Isopropanol
NJauroylsarcosine (Sarkosyl) ,
LipofectACE
Magnesium chloride (MgClr.6HrO)
Magnesium sulphate (MgSOa. THrO)
Maltose
BMe (B-mercaptoethanol)
Mixed bed resin (20-50 mesh)
MOPS (3 -[N-morpholino]propane sulphonic acid)
Opti MEM-I (powder sachet)
Paraffin oil
PEG (polyethylene glycol) 3350
Phenol
Polyvinylpyrolidone (PVP-40)
Potassium dihydrogen orthophosphate (KH2POa)
Propidium iodide
Salmon sperm DNA
Sodium acetate
Sodium bicarbonate (NaFICO:)
Sodium chloride
tri-Sodium citrate
Sodium dihydrogen orthophosphate (NaFI2P O ¿.2HzO)
Ajax
Ajax
BDH
BDH
Sigma
Progen
Ajax
Ajax
Sigma
Gibco-BRL
Sigma
Gibco-BRL
Ajax
Sigma
Wako Ind., Japan
Sigma
Ajax
Sigma
Calbiochem
Ajax
Astra Pharm., Australia
Ajax
BioRad, USA
Ajax
59
Ajax
Chapter 2 Materials and Methods
SDS (sodium dodecyl sulphate)
di- S odium hydrogen orthopho sphate (NazFIP 04. 7I{rO)
Sodium hydroxide
Sucrose
Tris-base
Tris-HCl
Triton X-100
Yeast extract
BDH
Ajax
Ajax
Ajax
Boehringer Mannheim
Boehringer Mannherm
Gibco-BRL
Ajax
2.1.2 Enzymes
All restriction enzymes were purchased from either New England Biolabs (Beverly,
Massachusetts, USA) or Progen (Brisbane, Queensland, Australia). Each enzyme was supplied
with the appropriate digestion buffer and bovine serum albumin (BSA) if required. All other
enzymes not part of kits are listed below along with their suppliers.
CIAP (Calf intestinal alkaline phosphatase) Boehringer Mannherm
E.coli DNA polymerase I (Klenow fragment) New England Biolabs
Proteinase K Merck
RNaseH Promega
RNAsin Promega
Superscriptru RNase Ff reverse transcriptase Gibco-BRL
T4 DNA ligase Progen
T4 Polynucleotide kinase Pharmacia
Zøq DNA polymerase Gibco-BRL
X-gal (5-Bromo-4-chloro-3-indoyl-B-D galactosidase)
60
Progen
Chapter 2 Materials and Methods
2.1.3 Electrophoresis
Acrylamide (40%) BioRad
Agarose: NA grade Progen or Pharmacia
APS (Ammonium persulphate) BioRad
Bis (2% Bis solution) BioRad
Bromophenol blue BDH
Ethidium bromide Sigma
Formaldehyde (37%)
MDE QXgel solution) FMC bioproducts, USA
TEMED (N,N, N', N'-tetramethylethylenediamine) BioRad
Xylene cyanol BDH
2.1.4 Antibiotics
Ampicillin Sigma
Benzyl penicillin CSL
Chloramphenicol Sigma
Kanamycin Progen
Tetracycline
2.1.5 Bacterial Strains
All strains were streaked for single colonies on L-Agar plates containing an appropriate
antibiotic (see below) from stocks kept at -TO,C in L-Broth + 15Yo glycerol.
E.coli XLl-Blue MRF': L(mcrA)183 A(mcrCB-hsdSMR-mrr)173 endA[ supE44 thi-I relA(
lac lF' proAB lqcfZ\Iull5 TnI| (TeÐ1". This strain was a host for recombinant plasmids and
Ajax
Sigma
6l

Chqpter 2 Mqterials and Methods
Ì\ias purchased from Stratagene. XLI-Blue cells \iere streaked for single colonies on L-
Tetracycline plates then propagated overnight at 37"C in L-Broth supplemented with
tetracycline (l 5 pglntl).
E.coli Y1090r-: L(lac)U(69 L(lon)? AraDI3g strA supF mcrA trpC22::Tnl0 (TeÐ [pMC9
Amp' Te{l muB frsdR.(Note: pMCg is pBR322 with lacf inserted). This strain was a host for
recombinant Ìugfll bacteriophage and was supplied with the Clontech 5' Stretch fetal brain
cDNA library. These cells were streaked for single colonies on L-Tetracycline plates and
subsequently propagated overnight at37"C in L-Broth supplemented with 10 mM MgSOa and
0 2% (vlv) maltose.
2.1.6 Media
All liquid media was prepared with double distilled water and was sterilised by autoclaving. In
the cases where liquid media was prepared for the pouring of solid media plates, antibiotics
were added once the autoclaved media had cooled to a temperature of approximately 50"C.
2.1.6.1 Liquíd media
L-Broth (Luria-Bertaini Broth). lYo (wlv) Bactotryptone;0.5Yo (w/v) yeast extract; 1% (wlv)NaCl; pH to 7.5 with NaOH.
OMI (pH7.1): 1 sachet of Opti MEM-I, 2S t:rilNaHCO:, 80 rnl FCS, 55 nM BMe, I ml benzyl
penicillin, per litre.
Supplemented DMEM (pH7.0): 13 g DMEM, 44 nrl NaHCO¡, 4 mM glutamine, 1 ml benzyl
penicillin, 100 rnl FCS,perlitre.
TSS: L-Broth; lOo/o (w/v) PEG 3350;5% (vlv) DMSO; 50 mM MgCl2.
62

Chapter 2 Mqterials and Methods
2.1.6.2 Solid Media
L- Agar. L-Broth; 1 .5% (wlv) Bactoagar
L-Ampicillin: L-Broth ; l . 5Yo (*/Ð Bactoagar ; 1 00 pglrnl ampicillin.
L-Chloramphenicol: L-Broth; 1.5Y, (wlv)Bactoagar;34 pglml chloramphenicol.
L-Kanamycin: L-Broth; I . 5o/o (w/v) B actoagar ; 5 0 pglml kanamycin.
L-Tetracycline: L-Bro th; 1 . 5Y, (w/v) Bactoagar ; l 5 pglml tetracycline.
Top Agar: L-Broth; O.TYoBactoagar
2.1.7 DNA Vectors
pSPL3B-CAM was used for exon trapping from cosmid DNA. This vector was kindly
provided by Dr. Tim Connors and Dr. Greg Landes (USA)
Puclg was used for the subcloning of cosmid DNA fragments and was purchased from New
England Biolabs
2.1.8 DNA Size Markers
SPPI (EcoRI restricted)
Pucl 9 (HpaII restricted)
Drigest III (1.cI857 Sam 7 HindIIU +X-174 HaeIII restricted)
2.1.9 Radio-Chemicals
¡cr-"l1dctP (3,ooo cilmmol)
¡y-"r1dltP (5,ooo cilmmol)
Progen or Bresatec
Bresatec
Pharmacia
Amersham
63
Amersham
Chapter 2 Materials and Methods
2.l.l0 Miscellaneous Materials and trfits
ABI Prismru DyePrimer Cycle sequencing kit
ABI Prismru DyeTerminator Cycle sequencing kit
BigDye Terminator Cycle sequencing kit
Breast cancer cell lines
CloneAMP pAMP1O kit
ExpressHYB solution
Genescreen Plus Nylon membranes
halfTERM DyeTerminator sequencing reagent
Labelling mix-dCTP
Multiple tissue Northern blot (Catalogue # 7760-l)
Oligo-dT12-1s
pGEM-T cloning kit
Prep-A-Gene purification kit
Qiagen Plasmid mini kit
QlAquick purification kit
5' RACE Kit
Random hexamers
RTth reverse transcriptase RNA PCR kit
Trizol
3MM Whatman paper
Perkin Elmer
Perkin Elmer
Perkin Elmer
ATCC, USA
Gibco-BRL
Clontech
Dupont
GenPack
Pharmacia
Clontech
Gibco-BRL
Promega
BioRad
Qiagen
Qiagen
Gibco-BRL
Pharmacia or Perkin Elmer
Perkin Elmer
Gibco-BRL
Lab Supply
2.l.ll Buffers and Solutions
All solutions were prepared with sterile double distilled water followed by autoclaving at
l2O"C for 15 to 30 minutes. Solutions provided with kits are not mentioned. Buffers and
64
Chapter 2 Materials and Methods
solutions routinely used in this study were as follows:
lOX Agarose loading buffer: 100 mM Tris-HCl (pH8.0); 200 mM EDTA (pH8.0); 2.0% (wlv)sarkosyl, 15Y, (wlv) ficoll400; O.TYobromophenol blue; 0.1% xylene cyanol.
lX pAMPlO annealing buffer. 20 mM Tris-HCl (pH8.a); 50 mM KCI; 1.5 mM }l.f:gCl2
Cell lysis bufler: 0.32 M sucrose; 10 mM Tris-HCl; 5 mM ll4gCl2; 1% (vlv) Triton X-100(pH7.s)
Colony denaturing solution: 1.5 mMNaCl; 0.5 MNaOH.
Colony neutralising solution: 3 M NaCl; 0.5 M Tris-HCl.
De-ionised formamide: 2 g of mixed bed resir/S0 ml formamide. Mix for -1 hour then filter.
100X Denhaft's solution: 2o/o (wlv) ficoll 400; 2% (wlv) polyvinylpirolidone; 2% (wþ BSA.
10X dNTP labelling solution: 1 mM labelling mix-dCTP
Filter denaturing solution: 0.5 M NaOH.
Filter neutralising solution: 0.2 M Tris-HCl;2X SSC.
5X First strand buffer (supplied with Superscript reverse transcriptase): 250 mM Tris-HCl(pH8.3), 375 tnMKCl; 15 mMMgCl2.
Formamide loading buffer: 51yo (v/Ð glycerol; I mM EDTA (pH8.0); 0 25% (w/Ðbromophenol blue, 0.25 Yo (w/v) xylene cyanol.
Gel denaturing solution: 2.5 M NaCl; 0.5 M NaOH.
Gel neutralising solution: 1.5 MNaCI;0.5 M Tris-HCl (pH7.5)
10X Labelling buffer: 0.5 M Tris-HCl (pH7.5); 0.1 M ll4gCl2; l0 mM DTT; 0.5 mglrnl BSA;
0.05 A.2oolpl random hexamers (Pharmacia).
10X MOPS buffer: O.?l|ifMOPS; 50 mM NaAc; 1 mM EDTA.
Phenol: buffered with Tris-HCl (pH7.a).
PBS (Phosphate buffered saline): 138 mM NaCl; 2.7 fnlÙl4 KCI; 8.1 mM NazHPO¿.7HzO;1.2mM KH2PO a (pH7 .9.
10X PCR buffer (supplied with Taq DNA polymerase). 200 mM Tris-HCl (pH8.0); 500 mMKCI
2X PCR mix: 33 mM (NII4)zSO¿, 133 mM Tris-HCl (pH8.8); 20 mM BME (added fresh each
65
Chapter 2 Materials and Methods
time); 0.013 mM EDTA;0.34 mg/rnl BSA; 20% (vlv) DMSO; 0.4 mM dNTPs.
3X Proteinase K buffer: 10 mM NaCl; 10 mM Tris-HCl, 10 mM EDTA (pH8.0).
RNA hydrolising solution: 50 mM HaOH; 1.5 MNaCl.
10X RNA loading dye. 50o/o glycerol; I mM EDTA (pH8.0); 025% bromophenol blue; 025%xylene cyanol.
RNA neutralising solution. 0.5 M Tris (pH7.4); 1.5 mM NaCl.
SM buffer: 50 mM Tris-HCl; 100 mM NaCl; 8 mM MgSOa; 0.01o/o (v/v) gelatin (pH7.5).
3 M Sodium acetate p}J5.2 (NaAc): 24.6 g sodium acetate/I00m1; pH 5.2with acetic acid.
Southern hybridisation solution: 50% (vlv) de-ionised formamide; 5X SSPE;2% SDS; lXDenhart's, IO% (wlv) dextran sulphate; 100 ¡.rglml denatured salmon sperm DNA.
20X SSC: 3 M NaCl; 0.3 M tri-sodium citrate (pH7.0)
20X SSPE: 3.6 MNaCI;0.2 MNaHzPO¿.2HzO;0.02 MEDTA.
lX TBE: 90 mM Tris-base; 90 mM boric acid; 2.5 mM EDTA (pH8.0).
TE: 10 mM Tris-HCl (pH7.5); 0.1 mM EDTA
TKM: 10 mM Tris-base; 10 mM KCI; I mM MgCl2.
X-gal.50 mM (2%wlv) solution, using N,N,dimethyl-formamide as diluent.
2.2 Methods
Most of the methods described below are those routinely used in the Department of
Cytogenetics and Molecular Genetics at the Women's and Children's Hospital (WCH),
Adelaide. Most procedures are based on those presented in Molecular Cloning: A Laboratory
Manual (Sambrook et al., 1989) unless otherwise specified. Only methods used in common
throughout the project are presented here. Those procedures specific for individual chapters
are mentioned in detail in their corresponding methods section.
66

Chapter 2 Materials and Methods
2.2.1 DNA Isolation
All DNA preparations except for genomic DNA isolation were based on the alkaline lysis
procedure adapted from Sambrooket al. (1989). DNA was subsequently purified using Qiagen
columns with slight modifications, in some cases (specified below), to manufacturers
conditions (Qiagen Plasmid Mini Handbook, 1995). All buffers and columns were supplied
with each Qiagen kit.
2.2.1.1 Cosmíd DNA
All cosmids were received as bacterial stabs and were streaked for single colonies on L-
Kanamycin plates. A single colony was grown overnight at 37"C in 200 ml of L-Broth and
cultures were spun down for 15 minutes at 4,000 rpm the next day. DNA was isolated using a
Qiagen Tip-20 column following minor changes of the manufacturers methods. This involved
resuspending the bacterial pellet in a total of 2 nl of buffer Pl, followed by the addition of 2 d,
of buffer P2. After careful mixing, the resuspended pellet was left at room temperature for 5
minutes. Two ml of P3 was then added, followed by further gentle mixing and a 10 minute
incubation on ice. This mixture was spun at 13,000 rpm, the supernatant transferred to a fresh
tube, and spun for a further 10 minutes. During the second spin a Qiagen Tip-20 column was
equilibrated with 1 ml of QBT butrer. The supernatant was applied to the equilibrated column
and allowed to drain completely through. The column was subsequently washed with 4 ml of
buffer QC, the DNA eluted into a 1.5 rnl eppendorf tube with 0.8 rnl of buffer QF, and
precipitated with 0.56 rnl isopropanol. After mixing, the solution was spun at 13,000 rpm for
30 minutes. The resultant DNA pellet was washed with I nl of 70Yo ethanol, spun for a further
5 minutes, and allowed to air-dry for 20 minutes. The DNA was resuspended in 15 pl of sterile
water and quantitated by spectrophotometry Q.2.6).
67
Chqpter 2 Materials and Methods
2.2.1.2 Isolution of PAC ünd BAC DNA
PAC and BAC clones received as bacterial stabs were streaked for single colonies on L-
Kanamycin or L-Chloramphenicol plates respectively. PAC clones were initially grown
overnight at37oC in l0 ml of L-Broth plus kanamycin (50 ]Lg/n:il).The next day,2Q0 ml of L-
Broth plus kanamycin (50 þgln:il) was seeded with6.7 ml of this culture and grown for 1.5
hours at 37"C. After addition of IPTG to a final concentration of 0.5 mM, the cells were
grown a further 5 hours and then spun down at 4,000 rpm. Supernatants were removed and
cell pellets were left overnight at -20"C. BAC clones were grown overnight at 37oC in 200 ml
of L-Broth plus chloramphenicol Qa þgln:ú). Cells were pelleted the next day at 4,000 rpm and
the supernatant discarded. Both PAC and BAC DNA was isolated using Qiagen Tip-100
columns using the same procedure as cosmid DNA isolation with adjustments to volumes
being made. These included the use of 4 ml of Pl, P2 and P3 buffers per DNA isolation; the
Tip-100 columns were equilibrated with 4 rnl QBT buffer, and washed with 10 ml buffer QC;
DNA was eluted into a l0 rnl sterile tube with 5 ml of QF buffer, then aliquoted into 6
eppendorf tubes. DNA was precipitated with 0.7 volumes of isopropanol, and pellets were
washed, as per cosmid DNA preparation Individual dried DNA pellets were resuspended in 5
pl of sterile water, then pooled into one tube and quantified by spectrophotometry Q.2.6).
Care was taken to resuspend the DNA pellets with wide bore pipette tips to prevent shearing
of the DNA.
2.2.1.3 Plasmíd DNA
Single colonies were grown overnight at 37"C in 20 ml L-Broth plus ampicillin (100 Vg/ml).
Plasmid DNA isolations were performed using Qiagen Tip-20 columns with no modifications
being made to manufacturers conditions (Qiagen Plasmid Mini Handbook, 1995). DNA pellets
68
Chapter 2 Materials and Methods
were resuspended in 15 pl of sterile water and quantitated by spectrophotometry Q.2.6)
2.2.1.4 Genomic DNA
DNA was isolated from peripheral blood lymphocytes, mouse/human somatic cell hybrids, and
breast cancer cell lines by procedures adapted from Wyman and White (1980). All DNA
preparations were kindly performed by either Shirley Richardson or Jean Spence (Department
of Cytogenetics and Molecular Genetics, WCH) All cell lines were maintained by Sharon Lane
and Cathy Derwas (Department of Cytogenetics, WCH).
Cell lysis buffer was added to either a blood sample or to a pellet of cells obtained from a cell
line culture to a volume of 30 rnl. The tube was left on ice for 30 minutes, then spun at 3,500
rpm for 15 minutes at 4"C. With aspiration,20 nl of the supernatant was removed, followed
by the addition of a further 20 ml of cell lysis buffer, and a repeat centrifugation. The
supernatant was discarded, and 3.25 nl of 3X Proteinase K buffer, 500 ¡rl of ßYo (wþ SDS
and 200 ¡rl of Proteinase K (at 10 mg/ml) was added and mixed with the pellet. After an
overnight incubation at 37"C with mixing, 5 ml of phenol was added to the solution, followed
by a 15 minute incubation at room temperature on a rotating wheel. The solution was spun at
3,000 rpm for 10 minutes, the aqueous layer removed to a clean tube, and phenol added to a
volume of 10 ml. After a l0 minute incubation at room temperature, the mix was centrifuged
for 10 minutes, and the aqueous layer removed to a clean tube. Chloroform was added to a
volume of 10 ml, and the sample mixed and re-centrifuged. DNA was precipitated by miúng
with 300 ¡rl of 3 M NaAc (pH5.2) and l0 ml of 100% ethanol. DNA pellets were washed with
70Yo ethanol, air-dried, resuspended in 100 ¡rl of TE, and quantitated by spectrophotometry
(2.2.6).
69
Chqpter 2 Materials qnd Melhods
2.2.2 Preparation of Bacterial Glycerol Stocks
All bacterial clones were maintained as glycerol stocks that were prepared from a l0 rnl aliquot
of an overnight culture, which was being used for DNA isolation purposes. The 10 ml culture
aliquot was spun at 3,000 rpm and the pellet resuspended in 1 ml of L-Broth containing 75o/o
glycerol. These stocks were kept at -70"C until more DNA was required, whereby a 5 ¡rl
aliquot was used to streak for single colonies.
2.2.3Preparation of Sheared Human Placental DNA and Salmon Sperm DNA
Desiccated human placental DNA and salmon sperm DNA was purchased commercially and
reconstituted in sterile TE to a concentration of 5 mg/nl and 20 mg/ní respectively. Aliquots
of I nrl were transferred to 1.5 ml eppendorf tubes and incubated at 100'C for between 6 to 20
hours. Periodically, I pl aliquots were taken and analysed on 7.5o/o agarose gels until the
average sized fragments were below 700 bp. The concentration of the samples were then
analysed by spectrophotometry and adjusted to their starting values (2.2.6).
2.2.4lsolation of Total RNA
The isolation of RNA from tissues and breast cancer cell lines was done under RNAse-free
conditions. This consisted of using solutions that had been incubated at room temperature in
0.2% (vlv) DEPC, then autoclaved, using Gilson pipettors that had been cleaned with
RNAseZAP (Ambion), wearing gloves at all times, and using filtered Gilson pipette tips. RNA
was isolated using a procedure based on that of Chomczynski and Sacchi (1987) using the
Trizol reagent. Isolated RNA was kept at -70"C whilst not in use.
2.2.4.1 RNA Isolationfrom Fresh Tissue
RNA was isolated from a number of tissues from a 20 week old male human fetus. Access to
70
Chapter 2 Materiqls and Methods
these samples was kindly granted by Dr. Roger Byard (Department of Histopathology, WCH).
Selected tissues were frozen in liquid nitrogen and stored at -70"C until RNA was required.
For every 100 mg of frozen tissue, I rnl of Trizol reagent was used. An appropriate amount of
tissue (usually 100 to 500 mg) was removed from the frozen stock and placed in a sterile,
mortar dish containing a small amount of liquid nitrogen to keep the sample frozen. The tissue
was groundto a fine powder with a sterile pestle. Liquid nitrogen was periodically added to
the tissue to prevent thawing. The mortar and pestle had previously been washed thoroughly
with ethanol, rinsed with DEPC-treated water, then heat treated for 4 hours at 160-180oC to
inactivate any RNases. The ground tissue was then transferred to a l0 ml tube containing the
appropriate amount of Trizol. The powder was resuspended by gentle mixing and transferred
to a sterile 5 ml glass homogeniser (Lab Supply). The solution was homogenised until lumps of
powder were no longer visible, transferred to a 1.5 rnl eppendorf tube, and left at room
temperature for 5 minutes. One-tenth the volume of chlorofonn was added and the tube was
shaken for 25 seconds and placed on ice for a further 5 minutes. The sample was then spun at
12,000 rpm at 4oC for 15 minutes, and the supernatant was transferred to a new tube. To this,
an equal volume of isopropanol was added, and the tube incubated at 4"C for 15 minutes.
Following centrifugation at 4oC for 15 minutes, the RNA pellet was washed in 800 ¡tl of 75%o
ethanol and the pellet allowed to air-dry for 15 minutes. The RNA was resuspended in 50 ¡rl of
DEPC-treated water, and pooled into one tube if the original tissue homogenate was
transferred into more than one eppendorf A second precipitation step involving the addition of
one-twentieth the volume of 4 M NaCl and 2 volumes of 100% ethanol to the resuspended
RNA was performed. This was incubated at -20"C for I hour then spun for 15 minutes at 4"C.
The RNA pellet was again washed with 800 pl of 75Yo eihanol, air-dried for 20 minutes,
resuspended in DEPC-treated water, and quantitated by spectrophotometry Q.2.6).
71
Chapter 2 Materials and Methods
2.2.4.2 RNA Isolstíon from Cell Lines
RNA isolation from breast cancer cell lines followed the same procedure as that for RNA
isolation from tissue sources. Typically, 1X10⁷ ce[s obtained from cell culture were washed in
PBS and spun down at 7,200 rpm for 10 minutes. The cells were then resuspended in I ml of
Trizol and procedures identical to those described in2.2.4.1 were subsequently followed. In all
RNA isolations, the integrity of the RNA preparation was tested by running a small aliquot on
a0.8%o agarose gel.
2.2.5 Oligonucleotide Primer Design
Where possible, oligonucleotide primers for PCR and sequencing were designed to contain
approximately 50%o G-C content, and an annealing temperature of 60oC, calculated by
2x(A+T)+4x(GtC) (Suggs et a1.,1981). Ideally, primers were not to possess runs of identical
bases and not to contain four contiguous base pairs of inter-strand or intra-strand
complementarity. In addition, primers were designed such that G-C, C-C, G-G, or C-G bases
*ê." pr.r"nt at their terminal 3' ends wherever possible. All oligonucleotides were purchased
commercially from either Gibco-BRL or Bresatec (Adelaide, Australia)
2.2.6 Quantitation of DNA, RNA and Oligonucleotide Primers
Samples were diluted in water and their absorbance was measured with a deuterium lamp at
26}nm. The absorbance was multiplied by the dilution factor and a conversion factor particular
to the type of DNA being quantitated. Relevant conversion factors were 50 for double
stranded DNA, 40 for RNA and 33 for oligonucleotides, which gave a concentration in pglml.
Spectrophotometers used were a Pharmacia Biotech llltrospec 3000 or a CECIL CE-2020.
72
Chapter 2 Materiols and Methods
2.2.7 Restriction Digests
All digests were perfbrmed overnight at 37oC unless otherwise specified by the manufacturer
BSA at a final concentration of 100 pglml was included in the digest if recommended
2.2.7.1 Digestíon of Genomic DNA
Ten micrograms of genomio DNA from normal individuals, somatic cell hybrids or breast
cancer cell lines was digested with 20 units of the appropriate restriction enzyme in a 50 ¡rl
volume. The next day, a 5 ¡rl aliquot was run on a 0.8olo agarose gel (2.2.8) in order to confirm
complete digestion. The remaining45 ¡rl was run overnight Q.2.8)
2.2.7.2 Digestion of Cosmid, BAC, ønd PAC DNA
For a standard digest, 250 ng of cosmid DNA and 500 ng BAC or PAC DNA was digested in
a 15 ¡rl volume with 5 units of each restriction enzyme. This amount was sufficient for one lane
on an agarose gel. Digestion reactions were scaled up based on how many lanes were required
and whether the digest was for the purpose of the isolation of specific restriction fragments
(see3.2.4.7,3.2.4.4, and3.2.5.1). For double digests, a restriction enzyme buffer was used
which was compatible for both enzymes (NEB catalogue, 1995).
2.2.7.3 Digestion of Pløsmid DNA
Plasmid DNA was digested mainly for the purposes of insert isolation from oDNA clones
purchased from Genome Systems. Five micrograms of plasmid DNA was digested in a 50 ¡rl
volume and 20 units of the appropriate restriction enzyme. Inserts were subsequently purified
from the agarose gel using the Prep-A-Gene purification system Q.2.16.2).
73

Chapter 2 Materials and Methods
2.2.8 Ãgarose Gel Electrophoresis
Electrophoresis of genomic and cell line DNA was usually performed in 0.8Yo (w/v) agarose
gels and run at l8 mA per gel, overnight. The analysis of cosmid, plasmid, BAC or PAC DNA
digests were usually performed in 0.8% (wþ agarose gels, and run at 100 volts. The analysis
of PCR products was performed in 1.5 to 2.5 % (*/Ð agarose gels depending on the size of
the expected proclucts to be analysed, and run at 120 volts. All electrophoresis was carried out
in lX TBE buffer. Agarose loading buffer was added to each DNA sample (lX final
concentration) prior to loading. DNA was visualised under IfV üght after staining gels in
0.02o/o ethidium bromide solution for 30 minutes.
2.2.9 DNA Size Markers
Depending on the size of the DNA fragments to be analysed and the relative concentration of
the agarose gel used, dictated what molecular weight markers were run. Generally EcoRI
digested SPP-I phage markers (size range 0.5 to 8.5 kb), Puc19 DNA digested with HpaII
(size range 60 to 500 bp), or Drigestlll markers (size range 72bp to 23 kb) were used.
2.2.10 Southern Blotting
2.2.10.1 Transfer in 10X SSC
This method was adapted from that originally described by Southern (1975) and was reserved
for the transfer of genomic DNA, including breast cancer cell line DNA and somatic cell hybrid
DNA. The agarose gel was soaked in 500 rnl of gel denaturing solution for 60 minutes,
followed by 500 ml of gel neutralising solution for a further 60 minutes. Prior to the
completion of the gel neutralisation step, a piece of GeneScreen Plus nylon membrane was cut
to size and soaked in water for 10 minutes followed by a 15 minute soak in lOX SSC. The gel
was placed face down on a blotting tray containing 10X SSC, and overlayed with the pre-
74
Chapter 2 Materiqls and Methods
treated membrane. Air bubbles were carefully removed and 2 pieces of 3MM Whatman paper
soaked in lOX SSC were placed on the membrane, followed by three dry sheets. A wad of
paper towels was placed over this and left to transfer overnight. The next day, the position of
the wells was marked on the membrane, which was then soaked for I minute in filter
denaturing solution followed by a 2 minute soak in fìlter neutralising solution. The membrane
was then left to dry overnight or baked in the microwave oven for 5 minutes at half power.
2.2.10.2 Transfer in 0.4 M NaOH
This method was adapted from the method of Reed and Mann (1985) and was used for the
transfer of digested cosmid, plasmid, BAC or PAC DNA. The gel to be blotted was stained in
ethidium bromide, photographed, and the DNA size markers were stabbed into the gel with a
needle and ink Genescreen Plus membranes cut to size were soaked in water for 5 minutes,
followed by 0.4 M NaOH for another 5 minutes. The gel was blotted in 0.4 M NaOH
overnight without any pre-treatment as described above except that the blotting tray contained
0.4 M NaOH. The next day, the position of the wells and DNA size markers was marked and
the membrane was treated in filter neutralisation solution for 2 minutes. Membranes were then
air-dried or dried in the microwave as above.
2.2.11 Northern Blotting
All procedures were carried out according to procedures adapted from Sambrook et al. (1989)
using RNAse free conditions as described in2.2.4.
2. 2. 1 1. 1 RNA Electrophoresis
A solution containing 1% (wlv) agarose (146 rnl) in lX TBE was prepared. After dissolving
the agarose by boiling, 20 ml of 10X MOPS buffer and 34 ml of formaldehyde were added,
75

Chøpter 2 Mqterials and Methods
and the gel was poured. This step was perfbrmed in a fume hood. Each sample was prepared
for electrophoresis by the addition of 20 ¡tg of total RNA to 2 ¡tl of 10X MOPS buffer, 3.5 ¡rl
of formaldehyde, 10 ¡rl of de-ionised formamide, and 2 ¡rl of lOX RNA loading dye in a 20 ¡t"l
final volume. Samples were incubated at 65'C for 15 minutes, loaded, and run at 75 volts in
1X MOPS buffer. Some samples were loaded twice so that following gel electrophoresis, this
portion of the gel could be cut away from the main gel and stained with ethidium bromide. Tlús
would allow visualisation of the 28S and 18S ribosomal bands for size markers and to check
the integrity of the RNA samples following electrophoresis
2.2.11.2 Trønsfer of RNA to Membranes
The gel to be blotted was rinsed in DEPC-treated water for 20 minutes, followed by a 30
minute incubation in RNA hydrolising solution, a 2O mirnfie incubation in RNA neutralising
solution, and a final incubation for 40 minutes in 2OX SSC. During this last step, the pre-cut
Genescreen membrane was incubated in DEPC-treated water for 10 minutes followed by a 15
minute incubation in20X SSC. The gel was then blottedin20X SSC overnight as described in
2.2.70.1. The following day, the membrane was rinsed in 20X SSC for 1 minute, and allowed
to dry at room temperature.
2.2.12 t'P Radio-Isotype Labelling of DNA
Double-stranded DNA fragments were labelled with ¡ø-t'lldCtP using a modified procedure
to that described by Feinberg and Vogelstein (1983). Reactions were scaled up or down
accordingly from that shown below.
2.2.12.1 Labellíng DNA Fragments ín Solution
In a standard labelling reaction, 50 ng of double stranded DNA was made up to 34 ¡rl with
76
Chapter 2 Materials and Methods
sterile water, mixed, and incubated at l00oC for 5 minutes. After spinning down the contents,
5 ¡rl of 10X dNTP labelling solution, 5 pl of 10X labelling buffer, 5 pl of ¡cr-t2f1dctP (50
pCi), and 5 units of E.coli DNA polymerase I were added. This was incubated at 37oC for 30
minutes. The reaction was stopped with the addition of I pl of 0.5 M EDTA, and if required,
un-incorporated 32P was removed using QlAquick columns (2.2.76.1). DNA probes that
required blocking of lepetitive sequences were then pre-reassociated (2.2.12.3). Probes not
requiring pre-blocking were heat denatured at 100'C for 5 minutes before addition to pre-
hybridised filters Q.213 .l).
2.2.12.2 Løbelling DNA Fragments in Agarose
The DNA fragment contained in agarose was heated at 100'C for 2 minutes. An aliquot of
approximately 50 ng was then removed and transferred to a tube with sterile water such that
the volume was 34 ¡rl This solution was heated at 100"C for 5 minutes and the same steps as
in 2.2.12.7 were subsequently followed.
2. 2. 1 2. 3 Pre- Reussociation of Labelled Probes
Probes suspected to contain human repetitive elements or probes to be used for Northern
hybridisations had their repetitive elements blocked, before hybridisation with the membrane,
with sheared denatured human placental DNA (2.2.3). The procedure used was based on that
of Sealy et al. (7985). To the labelled probe (50 ¡rl reaction), 100 ¡rl of human placental DNA
(5 mglml), and 50 pl of 20X SSC were added. This was incubated at 100"C for 10 minutes, ice
for 1 minute, followed by an incubation at 65oC for at least t hour. The probe could then be
added directly to the pre-hybridised membranes (2.2.13.1).
77
Materials and Methods
2.2.13 Hybridisation of Membranes
All hybridisations, including Northern blot and high-density grid hybridisations were performed
in a HYBAID orbital midi oven. High-density grid hybridisation procedures are described in
detail in chapter 3.
2. 2. I 3. 1 Southern Hybrídisatíons
Southern filters were hybridised based on a modification of Brown (1993). Membranes were
placed in glass bottles and pre-wet in 5X SSC for 1 minute. This solution was replaced with
either 10 ml of Southern hybridisation solution (for small bottles) or 15 ml (for large bottles)
and filters were pre-hybridised at 42"C for at least 2 hours. Once the DNA probe had been
labelled and either denatured Q.2.12.1) or pre-reassociated (2.2.12.3), it was added directly to
the pre-hybridised filters.
2. 2. 1 3. 2 Northern Hybridisations
Northern membranes, both commercially purchased and produced in the lab, were hybridised
according to protocols supplied with the Clontech multiple tissue blots (User manual, PT1200-
l). Membranes were pre-soaked in 5X SSC for I minute, then pre-hybridised at 65"C for at
least2 hours in l0 rd of ExpressHyb solution containing denatured salmon sperm DNA (100
pglrnl). After the DNA probe had been labelled Q.2.12), cleaned Q.2.16.1), and pre-
reassociated (22.12.3), the pre-hybridisation solution was removed from the membrane, and
replaced with a fresh 10 ml of ExpressHyb solution containing the probe and salmon sperm
DNA (100 prglml). Hybridisation proceeded overnight at 65"C. Commercial Northern blots
were hybridised with the control p-Actin probe supplied with the membrane to test for the
integrity and loading ofthe RNA samples.
2
78
Chapter 2 Materials and Methods
2.2.13.3 Washing of Membrønes
Southern membranes \¡/ere washed based on procedures presented in Sambrook et al. (1989).
Filters were treated sequentially at 42"C for 10 minutes in solutions containing 2X SSC and
1% SDS. If high background was still evident, the filters were washed for another 20 minutes
at 42"C in2X SSC and l% SDS (heated to 65'C first), followed by another 20 minute wash in
0.1X SSC and le/o SDS at 65oC if needed.
Northern membranes were washed according to manufacturers specifications (User manual,
PT1200-1). Filters were first rinsed in 200 ml of a solution containing 2X SSC and 0.05% SDS
at room temperature for 1 minute at a time. Counts were monitored after each rinse. Following
this, four l0 minute washes at room temperature in the same solution were performed with
constant monitoring after each wash. If the counts were still high (>50 cpm), the membranes
were washed in a solution containing 0.1X SSC and 0.1% SDS for 5 minutes at a time at
65'C. All washed membranes were exposed for the appropriate time to X-OmatK XK-l
Kodak diagnostic film either at room temperature or -70oC.
2.2.13.4 Strípping of Membranesfor Re-Use
Southern membranes were stripped of radioJabelled probe by incubating the washed filters at
45'C for 30 minutes in a solution containing 0.4 M NaOH. The filters were then transferred to
a solution containing 0.1% SDS, 0 1X SSC; 0.2 M Tris-HCl (pH7.5), and incubated a further
15 minutes. Northern membranes were stripped of radio-labelled probe by the addition of a
solution of Q.5Yo (wþ SDS that had been heated to 100"C, followed by an incubation at room
temperature until cool.
79

Chapter 2 Materials and Methods
2.2.14 Polymerase Chain Reaction (PCR)
All PCR reactions were perfbrmed using Zaq DNA polymerase in one of two buffer systems;
2X PCR mix (modification of Kogan et ol. 1987) or 10X PCR buffer (supplied by Gibco-
BRL). In each case 1.5 mM MgClz wâs used unless high background or no PCR products
were obtained with a control template. If this occurred, the PCR conditions were optimised by
varying the concentration of MgClzused in the reaction. All PCR reactions were set up on ice,
and were performed in 0.5 rnl PCR tubes using a thermal cycler 480 (Perkin Elmer Cetus) or a
PCR express thermal cycler (Hybaid). All colony PCRs were performed in 0.2 ml PCR tubes
using an FTS-960 thermal sequencer (Corbett Research).
2.2.14.1 Standard PCR Reøctíons
Routine PCR reactions were performed in l0 pl volumes using I pl of lOX PCR buffer, A.2 ¡tl
of 10 mM dNTPs, 0.3 pl of 50 mM IÙl4gCl2, 75 ng of each primer, 0.25 units of Taq DNA
polymerase, and template DNA. Template DNA amounts were 100 ng for genomic and cell
line DNA" 10 ng for BAC and PAC DN,\ and I ng for plasmid DNA All reactions were
overlayed with a drop of paraffìn oil and incubated at 94"C for 2 minutes, followed by 35
cycles of 94'C for 30 seconds; 60oC for I minute; 72"C for 2 minutes, followed by a final
elongation step of 72"C for 7 minutes. Each reaction was then run on an agarose gel of the
appropriate percentage (2.2.8). When the cloning of PCR products was anticipated, the
original reaction was scaled up to 20 ¡tl. Half was then examined on an agarose gel while the
remainder was kept for sub-cloning into the pGEM-T vector (2.2.17.2).
2.2.14.2 Colony PCR Reactions
A single colony was picked with a sterile disposable pipette tip, streaked onto a grid position
80
Chapter 2 Materials and Methods
on a fresh L-Agar plate containing the appropriate antibiotic (master plate), and the tip placed
into a PCR tube containing a drop of paraffin oil. The tubes were left for 10 minutes at room
temperature during which the PCR reaction mix was prepared. This mix consisted of 5 ¡rl of
2X PCR mix, 0.3 ¡.rl of 50 mM MgClt, 0.2 ¡rl of each primer (30 ng of eacÐ, 3.6 ¡tl of sterile
water, and 0.2 ¡tl of Taq DNA polymerase (0.25 units) The pipette tips were removed from
the PCR tubes and the tubes were incubated at 99"C for l0 minutes. The samples were then
held at 80oC, and l0 ¡rl of the prepared PCR reaction mix was added to each tube below the
level of the oil. The tubes were incubated at 95"C for 2 minutes followed by 35 cycles of 95"C
for 15 seconds; 60"C for 30 seconds;72"C for 2 minutes, and a final extension step of 7
minutes at 72"C.In general, 5 pl of each reaction was examined on a2.5o/o agarose gel
2.2.15 Reverse Transcriptase PCR (RT-PCR)
2. 2. 1 5. 1 Reverse Transcríptìon
Al1 procedures were adapted from those supplied with the Superscript enzyme. All reactions
were carried out on ice at all times. Three micrograms of total RNA or 100 ng of polyA.
mRNA was added to either 50 pmoles of random hexamers (Perkin Elmer) or 100 pmoles of
oligo dTrz-1s. The volume was made up to 11.5 pl with the addition of DEPC-treated water,
mixed, and incubated at 65"C for 5 minutes. Following a I minute incubation on ice, the
contents of the tube were spun down briefly, and 4 ¡rl of 5X lst strand buffer, 2 ¡tl of 0.1 M
DTT, I ¡rl of 10 mM dNTPs, and 0.5 ¡tl (20 units) of RNAsin were added. This was incubated
at 42"C for 2 minutes, followed by the addition of I ¡rl (200 units) of Superscript reverse
transcriptase, and a further incubation at 42"C for 30 minutes. The reaction \ryas terminated by
incubating at 7O"C for 10 minutes and samples 'u/ere kept at -zOoC until needed. A control
reaction was included for each individual experiment where the reverse transcriptase enzyme
81
Chapter 2 Materials and Methods
was omitted. This was to test for genomic contamination present within the RNA template that
may be seen following the PCR step (2.2.15.2). All polyA. mRNA samples were kindly
provided by Dr. Iozef Gecz (Department of Cytogenetics and Molecular Genetics, WCH).
2.2.15.2 PCR of Reverse Trønscribed RNA
Two microliters of the reverse transcription reaction was combined with 2 ¡tl of lOX PCR
buffer, 0.4 ¡rl of l0 mM dNTPs, 0.6 pl of 50 mM Itl{gCl2,l ¡rl of each primer (150 ng of each),
and the volume made up to 19 pl with sterile water. After the addition of I pl of Taq DNA
polymerase (0.5 units) to all tubes, including those tubes without reverse transcriptase, one
drop of paraffin oil was added, and the tubes were incubated at 94"C for 2 minutes. The
samples were then incubated at 94"C for 30 seconds; 60oC for I minute; 72"C for 2 minutes
for 35 cycles, followed by a final elongation step at 72"C for 7 minutes. Ten microlitre aliquots
of all RT-PCR products were analysed on2.5Yo (*/Ð agarose gels while the remaining aliquot
for many reactions was kept for subcloning into the pGEM-T vector Q.2.17.2) or for direct
purification using QlAquick columns (2.2.16.1) for sequencing purposes. A positive control
PCR to test the success of the oDNA synthesis was done for each reverse transcription
reaction with primers to the esterase D (ESTD) housekeeping gene (GenBank Accession
number M13450). These primers give rise to a 452 bp amplicon from oDNA template only.
Primer sequences are listed inTable 2.1.
2.2.16 Purification of DNA Fragments
2.2.16.1 QlAquick Purifìcation of PCR Frøgments and Radio-Løbelled Probes
PCR products were cleaned according to manufacturers protocols using QlAquick columns
(Qiagen) and buffers which were supplied with the kit. Briefly, the remaining PCR reaction
82
Chapter 2 Materials and Methods
was removed from the paraffin oil and transferred to a clean tube. Each sample was mixed with
a 5X volume of buffer PB. This mixture was added to a purification column, and spun for I
minute at 13,000 rpm. The collection tube was drained and 750 ¡rl of buffer PE was then
added, followed by a I minute spin at 13,000 rpm. The collection tube was again drained, and
the column spun again. The DNA was eluted by the addition of 50 ¡rl of sterile water to the
column, followed by centrifugation at 13,000 rpm for I minute with a clean collection tube.
The purified DNA was quantitated by spectrophotometry Q.2.6).
RadioJabelled probes were purified from un-incorporated nucleotides using the same
procedure as described above. However, only 700 pl of buffer PE was used to reduce the
chance of contaminating the centrifuge from overfilling of the spin column.
2.2.16.2 Prep-A-Gene Purtftcøtion of DNA Frøgments in Agørose
Restriction fragments excised from agarose gels were purified from the agarose using the Prep-
A-Gene purification system (Bio-Rad) according to manufacturers conditions. Where possible,
fragments to be isolated were run in 0 8% (w/v) gels, and trimmed of excess agarose once cut
from the gel. Five microlitres of Prep-A-Gene matrix was used per microgram of DNA
excised. Three gel slice volumes of binding buffer were added to the excised band, followed by
a 10 minute incubation at 50oC to dissolve the agarose. After addition of the required amount
of matrix, the tube was vortexed briefly, and incubated at room temperature for 10 minutes on
a rctating wheel. The tube was then spun for 30 seconds, and the supernatant removed. The
pellet was rinsed and resuspended in binding buffer equivalent to 25X the amount of added
matrix, and spun a further 30 seconds. The pellet was then washed twice with a 25X matnx
volume of wash buffer. The pellet was then air-dried for 10 minutes at room temperature,
resuspended in at least I pellet volume of sterile water, and incubated at 42"C for 5 minutes.
83

Chapter 2 Materials and Methods
The tube was then spun for 30 seconds and the supernatant transferred to a fresh tube. The
above step was repeated and the supernatants pooled. The concentration of the DNA eluted
was then determined by spectrophotometry Q.2.6).
2.2.17 Sub-Cloning of DNA Fragments
2.2.17.1 DNA Ligations
A1l ligations were performed in a volume of 10 ¡rl at 15'C for 3 to 16 hours. Typical ligations
involved l:1 molar ratios of the vector and the insert to be subcloned based on methods
described in Sambrook et al. (1989). In most reactions 50 ng of vector DNA was used.
Ligations included 5 units of T4 DNA ligase (N/ßI) using the buffer supplied with the eîzyme
2.2.17.2 Ligating PCR Products ínto the pGEM-T Vector
The pGEM-T vector system (Promega) was employed to clone DNA fragments amplified by
PCR (except for the PCR products generated during exon trapping). This system takes
advantage of the addition of a single adenosine residue by thermostable polymerases to the 3'
end of all duplex molecules. The A overhangs are ligated to single thymidine overhangs present
in the pGEM-T vector. In most cases, I ¡rl of the completed PCR reaction was added to I ¡rl
of the pGEM-T vector, 1 ¡rl of 10X ligation buffer, and lprl of T4 DNA ligase in a 10 prl
volume. Ligations were performed overnight at 15'C.
2.2.17.3 Preparation of Competent Bøcteríal Cells
Bacterial cells were made competent based on a modification of Chung et al. (1989). )(L-l
Blue cells were streaked for single colonies on an L-Tetracycline plate from a 5 ¡rl aliquot of a
glycerol stock. A single colony was grown overnight in 10 rnl of L-Broth plus tetracycline (15
84
Chapter 2 Materials qnd Methods
pglml) at37"C. The next day, 50 ml of L-Broth plus tetracycline (15 pglrnl) was seeded with 1
ml of the overnight culture and grown until an Aøoo of 0.3 was reached (approximately 1.5 to 2
hours). The cells were then transferred to a 50 ml tube and spun at 2,200 rpm for l0 minutes.
The supernatant was removed and the cells were carefully resuspended in 5 ml of ice cold TSS
media. The cells were left on ice for 10 minutes before being transformed (2.2.17.4). Any left
over cells were transferred to ice-cold eppendorf tubes, and frozen in liquid nitrogen. Frozen
cells were then stored at -70"C until required.
2.2.17.4 Trønsformation of Competent Bacterial Cells
For this procedure, a modified version of the technique described in Chung et al. (1989) was
used. For each reaction, 100 ¡rl of competent XL-l Blue cells were thawed on ice and 5 pl of
the ligation reaction was added. Following gentle mixing, the cells were placed at 4"C for 30
minutes. During this step, 880 prl of L-Broth was placed in a 10 ml tube and glucose was added
to a concentration of 2O mM. The cells and DNA mix were then added, and the tube was
incubated at37"C for I hour. For vectors with blue/white colour selection, an aliquot of 200 pl
of transformed cells, 40 ¡.'rl of X-Gal (20 mglml) and 20 ¡.rl of 200 mM IPTG were then spread
on an L-Ampicillin plate, and incubated overnight at 37"C. Otherwise, 200 ¡tl of transformed
cells alone was spread onto an L-Ampicillin plate.
2.2.17.5 Prepørøtion of Colony Master Plates and Colony Lífting
Colonies representing potential recombinant molecules were picked and streaked onto a
gridded master plate. Following an overnight incubation at 37"C, inserts of gridded clones
were subsequently amplified by colony PCF. (2.2.14.2) or transferred to nylon membranes for
screening purposes. The procedure to transfer bacterial clones to membranes \ryas based on a
85
Chapter 2 Materials and Methods
modified version to that described by Grunstein and Hogness (1975). Master plates containing
colonies for transfer were first placed at 4"C until chilled. Agar plates containing individually
gridded bacterial colonies were overlayed with a membrane and markers used to orient the
filters were stabbed into the edge of the membrane using a needle and ink. This was left for 5
minutes. The membrane was removed and placed colony side up on a sheet of Whatman 3MM
paper soaked in colony denaturing solution and left for 7 minutes. The membrane was then
transferred to a sheet of Whatman 3MM paper soaked in colony neutralisation solution and left
for 5 minutes. This step was repeated on a separate sheet of Whatman paper, and the
membranes were then soaked in 500 ml of 2X SSC for 5 minutes, air-dried for l0 minutes, and
baked at 65"C for t hour in an oven. In some instances duplicate colony lifts were done in
which a second membrane was placed onto the agar plate once the first one had been removed.
All steps subsequent to this were as stated above.
2.2.18 DNA Sequencing
The sequencing of both double stranded plasmid DNA and PCR product DNA was achieved
with cycle sequencing using reagents supplied with the ABI Prism DyeTerminator or
DyePrimer (-21M13 forward and M13RPI) Cycle Sequencing Kit. All samples were
electrophoresed on an Applied Biosystems Model 373ADNA sequencer by Dr. Iozef Gecz or
Dr. Julie Nancarrow (Department of Cytogenetics and Molecular Genetics, WCH), or on the
same machine when it was relocated to the Australian Genome Research Facility in Brisbane.
2. 2. 1 8. 1 DyeTerminator Cycle Sequencing
For each sequencing reaction, either 180 ng of purified PCR product DNA or 500 ng of
plasmid DNA was mixed with 20 ng of the desired primeq 4 pl of the DyeTerminator mix, 4 ¡rl
of halfTERM Dye Terminator Sequencing Reagent, and made up to a volume of 20 pl with
86
Chapter 2 Materials and Methods
sterile water. After the addition of a drop of paraffin oil, the tubes were incubated for 25 cycles
at 96"C for 30 seconds; 50'C for 15 seconds; 60"C for 4 minutes. The sample was then
purified using procedures provided with the kit (Revision A, 1995). This involved removal of
the sample from the oil and transfer to an eppendorf tube containing 2 ¡l of 3 M NaAc (pH5 2)
and 50 p,l of 95%o ethanol. Following a 10 minute incubation on ice, the tubes were spun at
13,000 rpm for 30 minutes, and the supernatant was discarded. The pellet was then washed
with 250 ¡tl of 70Yo ethanol, spun for a further 5 minutes and the ethanol removed. The pellet
was allowed to dry for 10 minutes at room temperature, and then kept at 4"C in the dark until
flln on a sequencing gel.
2. 2. 1 S. 2 DyePrimer Cycle Sequencing
For the sequencing of each template, four separate sequencing reactions were needed. To the
first two tubes, one containing 4 ¡tI of dd-ATP mix and the other containing 4 prl of dd-CTP
mix, I ¡rl (200 ng) of DNA template was added. To the remaining two tubes, one containing 8
¡rl of dd-GTP mix and the other containing 8 ¡rl of dd-TTP mix, 2 pl (a00 ng) of DNA
template was added. After the addition of a drop of parafün oil, the tubes were incubated for
15 cycles of 95"C for 30 seconds; 55"C for 30 seconds; 70"C for I minute, followed by a
further 15 cycles of 95oC for 30 seconds; 70'C for 1 minute, Samples were then purified using
procedures provided with the kit (Revision B, 1995). All four samples from each template
were removed from the oil and combined in a tube containing 80 ¡tl of 95% ethanol. Following
a l0 minute incubation on ice, the tubes were spun at 13,000 rpm for 30 minutes then the
supernatant was removed. The pellet was washed with 250 ¡l of 70o/o ethanol, spun for 5
minutes, and air-dried for l0 minutes after removal of the supernatant. Samples were
subsequently kept at 4"C in the dark until run on a sequencing gel.
87

Chapter 2 Materials and Methods
2.2.19 Fluorescen ce in sítu Hybridisation (FISH)
All FISH analysis was kindly perfbrmed by F,lizabeth Baker, Erica Woollatt, or Helen Eyre
(Department of Cytogenetics, WCH). Briefly, whole cosmid or plasmid DNA was nick
translated with biotin-l4-dATP and hybridised in situ at a final concentration of 2O nglpl to
metaphases from 2 normal males. The FISH method had been modified from that previously
described (Callen et al., 1990a). Chromosomes were stained before analysis with both
propidium iodide (as counter-stain) and DAPI (for chromosome identification) Images of
metaphase preparations were captured by a cooled CCD camera using the CytoVision [Jltra
image collection and enhancement system (Applied Imaging Int. Ltd.). FISH signals and the
DAPI banding pattern were merged for figure preparation.
2.2.20 5' Rapid Amplification of cDNA Ends (S'RACE)
The cloning ofthe 5' ends of transcripts was aided by the use ofthe 5'RACE kit (Gibco-BRL).
All components were supplied with the kit except the gene specific primers (GSP) which are
listed in the relevant chapters that used this technique. Briefly, I pg of total RNA or 100 ng of
polyA. mRNA was reverse transcribed with 2.5 pmoles of GSP1 at 42"C for 50 minutes,
followed by a 15 minute incubation at 70"C. After the addition of I ¡rl of RNAse mix, the
tubes were left for a further 30 minutes at 37"C. The first strand cDNA was purified using
Glass Max spin columns supplied with the kit. The oDNA was eluted from the columns with
50 pl of sterile water preheated to 65"C. Ten microlitres of the purified sample was then added
to 65 ¡rl of DEPC-treated water, 5 ¡rl of 5X tailing buffer, and 2.5 p"l of 2 mM dCTP and
incubated for 3 minutes at 94"C followed by a I minute incubation on ice. After the addition of
1 ¡rl of the TdT mix, the tubes were incubated at37"C for 10 minutes. The TdT was then heat
inactivated for 10 minutes at 65"C. The tailed cDNA was subjected to PCR using a GSP2
88

Chøpter 2 Materials and Methods
primer and the deoxyinosine containing anchor primer (AAP) specific for the dC tail. This was
followed by a nested PCR using a GSP3 primer and a primer homologous to the AAP primer
(AUAP). Negative control reactions excluding reverse transcriptase were included for each
reaction. Ten microlitres of the PCR products were analysed on l.5o/o (wþ agarose gels, and
the remaining sample was cloned into the pGEM-T vector (2.2.17.2) and subsequently
sequenced (2.2.18.2) using vector specific primers. AAP and AUAP primer sequences are
listed in Table2.l.
2.2.21PCRFormatting of the Fetal Brain cDNA Library
A random-primed and polyA-primed human fetal brain 5'-Stretch Plus oDNA phage library
(Clontech) was formatted for rapid screening using PCR. This involved plating a 1.5 fold
representation of all clones in the library on one hundred 15 cm L-Agar plates (15,000 phage
per plate), transferring the amplified clones from each plate to a 10 ml tube, and taking an
aliquot from each tube to produce 40 pools. These pools were subsequently used for templates
in PCR reactions with gene specific primers or a combination of vector and gene specific
primers.
2.2.21.1 Lømbda Phage Plating
Y1090 E. coli cells were first grown in 10 ml of L-broth, 100 ¡.rl of 1 M MgSOa, and 100 ¡rl of
2QYo maltose, overnight at 37oC. The following day, 100 eppendorf tubes were set up, such
that each contained 500 ¡rl of cells combined with 15,000 plaque forming units of phage (pfu)
from a dilution of the oDNA library (diluted in SM buffer). These tubes were incubated at
37"C lor 30 minutes. During this period, I ml of Top Agar was aliquoted into 100, 10 ml tubes
and left at 50"C. For each of the 100 tubes, the mixture of cells and phage were then added to
the Top Agar, mixed by inversion, then poured onto a pre-warmed 15 cm L-Agar plate. After
89
Chapter 2 Materials and Methods
the Top Agar had set, the plates were incubated overnight at 37"C.
2.2.21.2 Lambds Phage Suaping
To each of the 100 plates, l0 ml of L-Broth was added, and the Top Agar (containing the
amplified phage) was scraped away with a sterile scalpel blade, along with the L-Broth, into a
10 ml tube. These tubes were spun to remove the agar and the supernatant transferred to fresh
10 ml tubes. These tubes were kept at 4'C.
2.2.21.3 Pooling of Phage Scrapes
The 100 tubes were reduced to 40 pools that could be used for subsequent PCR reactions. The
100 tubes were split into 4 groups (l-25,26-50, 5l-75,76-100) and for the first group 200 1tl
from tubes I to 5 were combined in a 1.5 ml eppendorf and called pool Al, tubes 6-10
combined to form pool 42, etc up to 45. Then 200 ¡rl from tubes 7, 6, 77, 16, and 2l were
combined to form pool 46, tubes 2, 7, 12, 77, and 22 combined to form pool 47, etc up to
410. This was duplicated for tubes 26-50 (pools B1-Bl0), 51-75 (pools C1-C10), and 76-100
(pools D1-D10). This produced 40 pools, which were subsequently used as templates in PCR
reactions (5.2.2). The results presented in this thesis used these pools specifically for the
isolation of5' end sequences from transcripts being characterised (chapter 5). Subsequent PCR
products were subcloned into pGEM-T as described in this chapter. This pooled library has
also been used to isolate cDNA clones corresponding to trapped exons identified in chapter 4,
however these results are not discussed in this thesis.
90
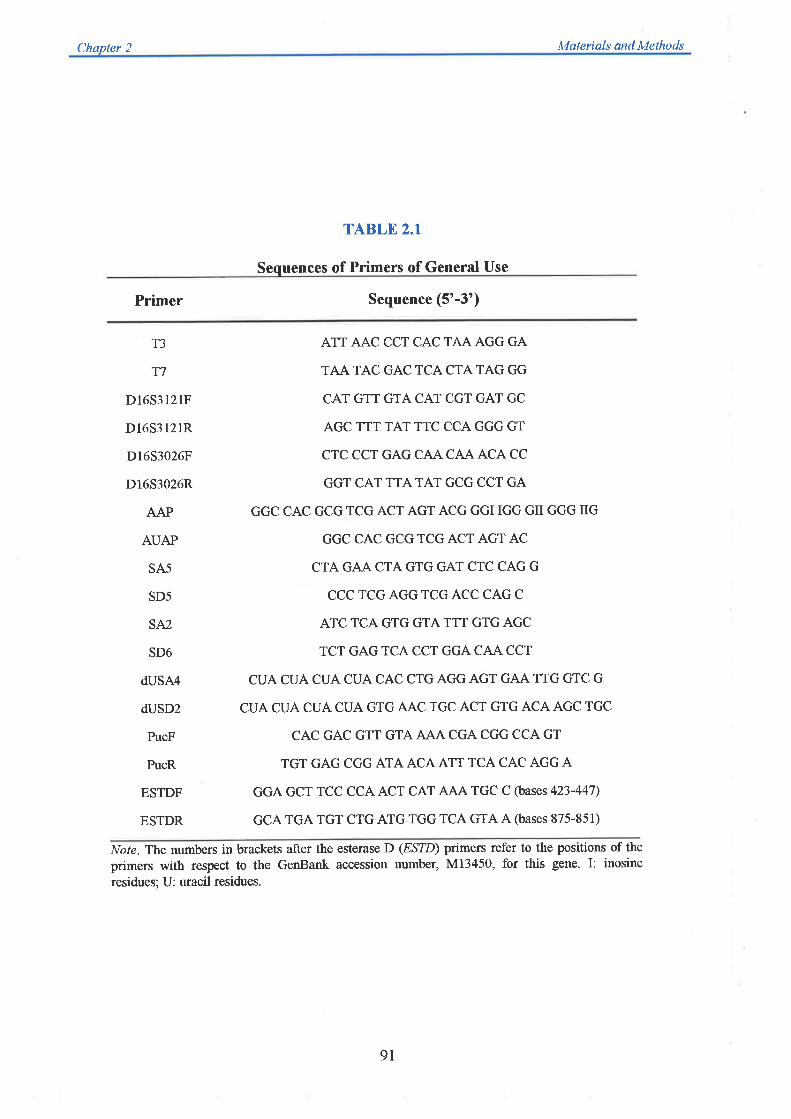
Chapter 2 Materials and Methods
TABLE 2.1
Sequences of Primers of General Use
Primer Sequence (5'-3')
T3
T7
D165312lF
D165312lR
D16S3026F
Dr653026R
AAP
AUAP
SA5
SD5
SA2
SD6
dUSA4
dUSD2
PucF
PucR
ESTDF
ESTDR
ATT AAC CCT CAC TAA AGG GA
TAA TAC GAC TCA CTA TAG GG
CAT GTT GTA CAT CGT GAT GC
AGC TTT TAT TTC CCA GGG GT
CTC CCT GAG CAA CAA ACA CC
GGT CAT TTATAT GCG CCT GA
GGC CAC GCG TCG ACT AGT ACG GGI IGG GII GGG IIG
GGC CAC GCG TCG ACT AGT AC
CTA GAA CTA GTG GAT CTC CAG G
CCC TCG AGG TCG ACC CAG C
ATC TCA GTG GTA TTT GTG AGC
TCT GAG TCA CCT GGA CAA CCT
CUA CUA CUA CUA CAC CTG AGG AGT GAA TTG GTC G
CUA CUA CUA CUA GTG AAC TGC ACT GTG ACA AGC TGC
CAC GAC GTT GTA ArqA CGA CGG CCA GT
TGT GAG CGG ATA ACA ATT TCA CAC AGG A
GGA GCT TCC CCA ACT CAT A'rL\ TGC C (bases 423-447)
GCA TGA TGT CTG ATG TGG TCA GTA A (bases 875-851)
Note. The numbers in brackets after the esterase D (ESTD) primers refer to the positions of the
primers with respect to the GenBank accession number, M13450, for this gene. I: inosine
residues; U: uracil residues.
9l
Physicul Mapping
of Chrornosorne
16q24.3

Table of ContentsPage
3.1 Introduction
3.1.1 Chromosome 16q243 and Fanconi Anaemia
3.2 Methods
3.21 Chromosome 16 High-Density Cosmid Library Screening
3.2.2Probes used for Initial Cosmid Identification
3.2.3 Human Specific PAC and BAC Library Hybridisations
3.2.4Isolation of Cosmid Ends
3.2.4.1 Digestion of Cosmid DNA
3.2.4.2 Labelling of T3 and T7 Oligonucleotides
3.2.4.3 Hybridisation and Washing
3.2.4.4 Cosmid End Puri/ication
3 2.5 Isolation of BAC and PAC Ends
3.2.5.1 DNA Digestion
3. 2. 5. 2 Dige st Re-Ligation and Transformation
3.2.6Mapping of Microsatellites Dl653127 and D1653026
3.2.6.1 PCRMapping
3. 2. 6. 2 Southern Mapping
3.3 Results
3.3.1 Initial ldentification of Cosmids from 16q24.3
3.3.2 Restriction Enzyme Analysis and Cosmid V/alking
3.3.3 BAC and PAC High-Density Grid Screening
3 .3 .4 Establishment of Contig Orientation
3 3 5 Physical Map Coverage
3.4 Discussion
3.4 I Physical Map Integrity
3.4.2Integration ofPhysical and Genetic Maps
92
93
95
95
96
96
97
97
97
98
98
98
98
99
99
99
100
100
100
103
109
ll0l12
113
tt7
118
Chapter 3 Phvsical ofChromosome I6024.3
3.1 Introduction
To identify new candidate breast cancer tumour suppressor genes mapping to the critical LOH
interval at 16q24.3, a clone based physical map contig covering this region was needed At the
start of this project the most commonly used and readily accessible cloned genomic DNA
fragments were contained in either lambda, cosmid or YAC vectors. During the construction
of a whole-chromosome 16 physical map, clones from a number of YAC libraries were
incorporated into the map (Doggett et al., 1995). These included clones from a flow-sorted
chromosome 16-specific YAC library (McCormick et al., 1993), from the CEPH Mark I and
MegaYAC libraries (Albersten et al., 1990; Bellanne-Chantelot et al., 1992) and from ahalf-
telomere YAC library (Riethman et al., 1989). Detailed STS and Southern analysis of YAC
clones mapping at 16q24.3 established that very few were localised between the somatic cell
hybrid breaþoint CYl8A(D2) and the long arm telomere (unpublished data). However, those
that were located in this region gave inconsistent mapping results and were suspected to be
rearranged or deleted. Coupled with the faú that YAC clones make poo. ,åquencing
substrates, the difüculty in isolating the cloned human DN,\ and an independent aim of our
group to sequence this telomeric region, a physical map based on cosmid clones was the
preferred option.
A flow-sorted chromsome 16 specific cosmid library had previously been constructed
(Longmire et al., 1993), with individual cosmid clones gridded in high-density arays onto
nylon membranes. These filters collectively contained -15,000 clones representing an
approximately 5.5 fold coverage of chromosome 16 Individual cosmids mapping to the critical
region were identified by the subsequent hybridisation of these membranes with 9 markers
identified by this and previous studies to map to the region (3.2.2).
92
Chapter 3 Phvsical Mappins of Chromosome 16q24.3
The strategy to align overlapping cosmid clones was based on their STS content and restriction
endonuclease digestion pattern. Those clones extending furthest within each initial contig
would then be used to walk along the chromosome by the hybridisation of the ends of these
cosmids back to the high-density cosmid grids. This process would continue until all initial
contigs were linked and therefore the region defining the location of the breast cancer tumour
suppressor gene would be contained within the map. Individual cosmid clones representing a
minimum tiling path in the contig will then be used for the identification of transcribed
sequences by exon trapping (chapter 4), and for the sequencing efforts to follow in the future.
3.1.1 Chromosome 16q24.3 and Fanconi Anaemia
During the early stages of the project, the gene responsible for Fanconi anemia
complementation group A(FAA) had been mapped to chromosome 16q24.3 on the basis of
classical linkage analysis and allelic association in a South African founder population (Pronk
et a1.,1995). This study indicated that the FAA gene was located distal to the 16q24.3 marker
D16S498, a region overlapping with the critical LOH region observed in breast cancer.
In 1928, Fanconi described anemia in three brothers who had a range of clinical manifestations,
including microencephaly, genital hypoplasia and hyperreflexia. It is now known that the
associated disease has the principal characteristic of progressive bone marrow failure afflicting
children at an early age. Affected individuals are also predisposed to cancer, possibly explained
by the fact that Fanconi anemia (FA) cells show increased chromosome breakage and
hypersensitivity to DNA crossJinking agents. The disease has therefore been included among
the group of DNA repair disorders.
Fanconi anemia is inherited as an autosomal recessive disorder and is rare, affecting
93
Chapter 3 Physical Mqpping of Chromosome 16q24.3
approximately 1/350,000 individuals, with a carrier frequency of l/300 (Digweed, 1993). The
clinical heterogeneity in FA is supported by an observed genetic heterogeneity, implying the
role of a number of genes in this disorder. Previously, patients were placed into groups based
on the complementation of the sensitivity of lymphoblastoid cells to crosslinking agents by
utilising somatic cell fusion studies between different patient cell lines. These studies identified
8 complementation groups (FA-A through FA-H) each thought to correspond to a specific
gene defect (Joenje et al., 1997). As there was no phenotypic differences between patients in
all complementation groups, it was suggested that the FA proteins may function as a large
multi-protein complex, or may belong to the same metabolic pathway.
The FAA and FAC genes account for 75-80o/o of patients with FAA the most common
(Buchwald, 1995). The FAC gene has been cloned (Strathdee et al., 1992), maps to
chromosome 9q22.3, and encodes a highly hydrophobic protein of 558 amino acids that shows
no homology to known genes. A location for the FAD gene has been identified at 3p27-26
(Whitney et a1.,1995), but the gene has not yet been cloned. The FAG gene has been mapped
to 9pl3 (Saar et a1.,1998), and subsequent complementation studies have been successful in
isolating the gene responsible (de Winter et al., 1998). FAG is identical to the previously
isolated XRCC? gene (Liu et al., 1997), which shows no homology fo FAC or to any other
known genes.
The original linkage mapping data for FAA has been refined through the analysis of more
families with additional microsatellite markers at 16q24.3. Significant linkage disequilibrium
was observed with the three most telomeric markers (D16S3121, D16S3026, and D16S303),
with a recombinant in one family indicating a location distal to D16S3121 (The FAB
consortium, 1996-Appendix Al) This region precisely overlaps with that seen in LOH studies
94
Chapter 3 Physical of Chromosome 16q24.3
of breast cancer, and prompted the formation of a collaboration between the group at the
Women's and Children's Hospital (WCH) in Adelaide and those groups focussed on the
cloning of the FAA gene This collaborative group has termed itself the FAB (Fanconi
anemia/Breast cancer) consortium, with the construction of a physical and transcription map
aiming not only towards the cloning of a breast cancer tumour suppressor gene, but also to the
cloning of the gene responsible for FAA
3.2 Methods
3.2.1 Chromosome 16 High-Density Cosmid Library Screening
Cosmids were identified from a flow-sorted chromosome 16 genomic cosmid library.
Chromosome 16 was sorted from the mouse/human somatic cell hybrid CY18, which contains
this chromosome as the only human DNA (Callen, 1986), and Sau3A pafüally digested CY18
DNA was ligated into the BamÍtr cloning site of the cosmid sCOS-l vector (Longmire et al.,
lgg3). This cloning site is flanked on either side by RNA promoters (T3 and T7) which enable
identification of insert ends(3.2.4). The library consists of a set of 10 membranes containing
high density gridded e15,000) clones representing approximately 5.5X coverage of
chromosome 16. All grids were hybridised and washed using methods described in Longmire et
al. (7993). Briefly, the l0 filters were pre-hybridised in2large bottles for at least2 hours in 20
ml of a solution containing 6X SSC; l0 mM EDTA (pH8.0); 10X Denhardt's; 7o/o SDS and
100 pgÁnl denatured fragmented salmon speffn DNA at 65"C. Overnight hybridisations with
"P labelled probes Q.2.12) were performed in 20 nl of fresh hybridisation solution at 65"C.
Filters were washed sequentially in solutions of 2X SSC; 0.1% SDS (rinse at room
temperature),2X SSC, 0.1% SDS (room temperature for 15 minutes), 0.lX SSC, 0.1% SDS
(room temperature for l5 minutes), and 0.lX SSC; 0.1% SDS (twice for 30 minutes at 50oC if
95
Chapter 3 Phvsical Mappins of Chromosome 16q24.3
needed). Membranes were exposed at -TO'C for between I to 7 days
3.2.2Probes used for Initial Cosmid fdentification
Initial markers used for cosmid grid screening were those known to be located between the
somatic cell hybrid breaþoints CYl8A(D2) and the long arm telomere (Callen et al., 1995).
These are indicated in Table 3.1 and included three genes, CMAR, DPEPI, and MCIR; the
microsatellite marker Dl6S303; an end fragment from the cosmid 31785, which contains the
BBCI gene, and four oDNA clones, yc8leO9, yh09a04, D16S532E, and SoDNA-C113. The
IMAGE consortium oDNA clone, yc81e09, was obtained through screening an arrayed
normalised infant brain oligo-dT primed cDNA library (Soares et al., 7994), with the insert
from cDNA clone SoDNA-455 (performed by Dr. Greg Lennon at the Lawrence Livermore
National Laboratory, USA). Both the ScDNA-A55 and ScDNA-C113 clones were originally
isolated from a hexamer primed heteronuclear oDNA library constructed from the
mouse/human somatic cell hybrid CY18 (Whitmore et al., 1994). The IMAGE cDNA clone
yh09a04 was identified from direct oDNA selection of the cosmid 3782 which was previously
shown to map between the CYl8A(D2) breaþoint and the l6q telomere (Apostolou, 1997).
The EST, D16S532E, was also mapped to the same region. Subsequent to these initial
screenings, restriction fragments representing the ends of cosmids were used to identify
additional overlapping clones (see Table 3.2).
3.2.3 Human Specific PAC and BAC Library Hybridisations
Four sets of either BAC or PAC library filters were used for screening purposes. One set of
PAC library filters and the Human Release II BAC library filters were obtained from Genome
Systems (St. Louis, Missouri, USA) while the RPCI-4 PAC and RPCI-I1 (Segment 3) BAC
library filter sets were obtained from BACPAC resources (Rosewell Park Cancer Institute,
96
Chapter 3 Physical Mapping of Chromosome 16q24.3
New York, USA)
All library filters were hybridised and washed according to manufacturers recommendations.
Initially, membranes were individually pre-hybridised in large glass bottles for at least 2 hours
in20 ml of 6X SSC; 0.5% SDS, 5X Denhardt's; 100 pglrnl denatured salmon sperm DNA at
65oC. Overnight hybridisations with ttP labelled probes were performed at 65oC in 20 til of a
solution containing 6X SSC; 0.5% SDS; 100 Vg/nfl denatured salmon sperm DNA. Filters
were washed sequentially in solutions of 2X SSC; 0.5% SDS (room temperature 5 minutes),
2X SSC; 0.1% SDS (room temperature 15 minutes) and 0.lX SSC, 0.5% SDS (37"C I hour if
needed).
3.2.4Isolation of Cosmid Ends
3.2.4.1 Digestion of Cosmíd DNA
Cosmid DNA was isolated for digestion as described in 2.2.7.2. DNA (500ng) was double
digested with,Àtrorl in combination with a range of other erzymes, including HindIII, Bamln,
XbaI, HincII, BglII, MIuI, and.EcoRI. Digests were divided in half, run in 0.8% (wþ agarose
gels in tandem, such that after transferring to nylon membranes Q.2.10.2) 2 flters would be
generated, one of which to screen with the T3 oligo, the other to be probed with T7 (primer
sequences shown in T able 2.1).
3.2.4.2 Labelling of T3 ønd T7 Olígonucleotides
The T3 andTT oligos were 5' end labelled with 5 ul of ¡y-'2f1de.tP (50 ¡rCi) using 2 ¡tl of T4
polynucleotide kinase (20 units) as described by Chaconas and van de Sande (1980). Reactions
were performed in a 50 pl volume using 300 ng of either the T3 or T7 oligo (Promega), and
97
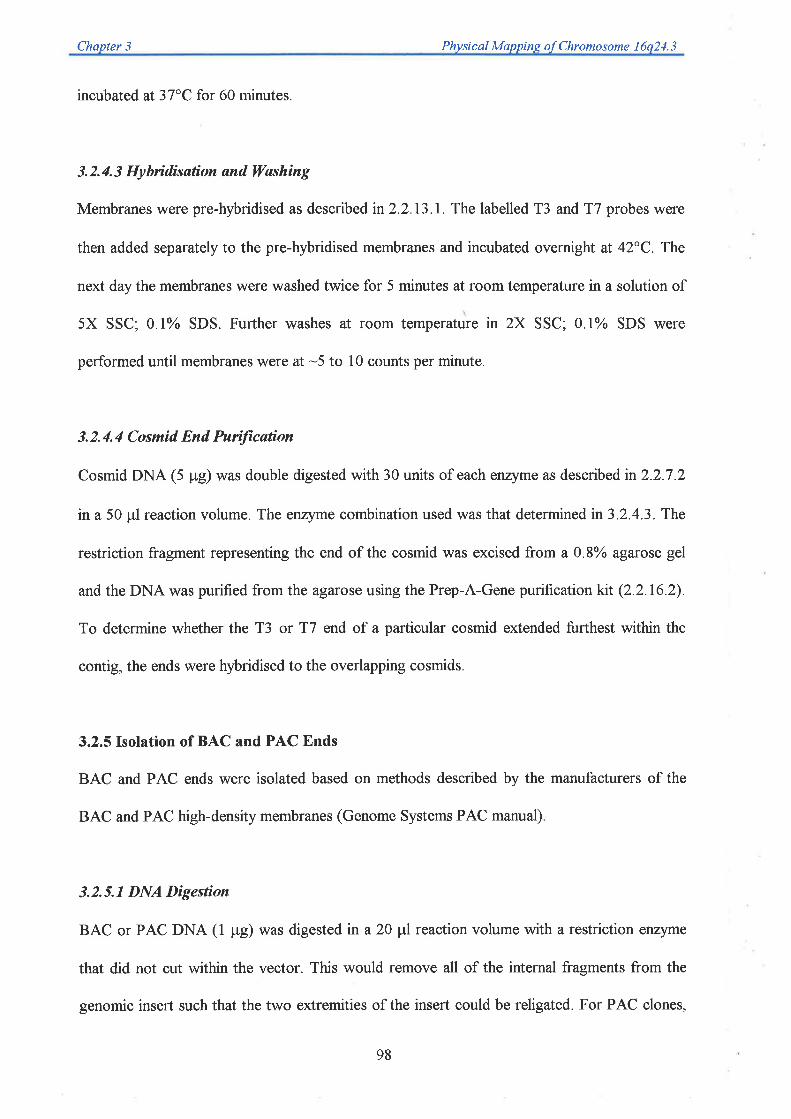
Chapter 3 Physical Mapping of Chrontosome 16q24.3
incubated at 37oC for 60 minutes.
3.2.4.3 Hybrídisatíon and Wøshing
Membranes were pre-hybridised as described in2.2.13.1. The labelled T3 and T7 probes were
then added separately to the pre-hybridised membranes and incubated overnight at 42"C. The
next day the membranes were washed twice for 5 minutes at room temperature in a solution of
5X SSC, 0 1% SDS. Further washes at room temperature in 2X SSC; 0.1% SDS were
performed until membranes \ryere at -5 to l0 counts per minute.
3.2.4.4 Cosmid. End Purification
Cosmid DNA (5 pg) was double digested with 30 units of each enzyme as describedin2.2.7.2
in a 50 ¡rl reaction volume. The enzyme combination used was that determined in 3.2.4 3 The
restriction fragment representing the end of the cosmid was excised from a 0.8o/o agarose gel
and the DNA was purified from the agarose using the Prep-A-Gene purification kit Q.2.16.2).
To determine whether the T3 or T7 end of a particular cosmid extended furthest within the
contig, the ends were hybridised to the overlapping cosmids.
3.2.5Isolation of BAC and PAC Ends
BAC and PAC ends were isolated based on methods described by the manufacturers of the
BAC and PAC high-density membranes (Genome Systems PAC manual)
3.2.5.1 DNA Digestion
BAC or PAC DNA (l pg) was digested in a 20 ¡tl reaction volume with a restriction enzyme
that did not cut within the vector. This would remove all of the internal fragments from the
genomic insert such that the two extremities of the insert could be religated. For PAC clones,
98
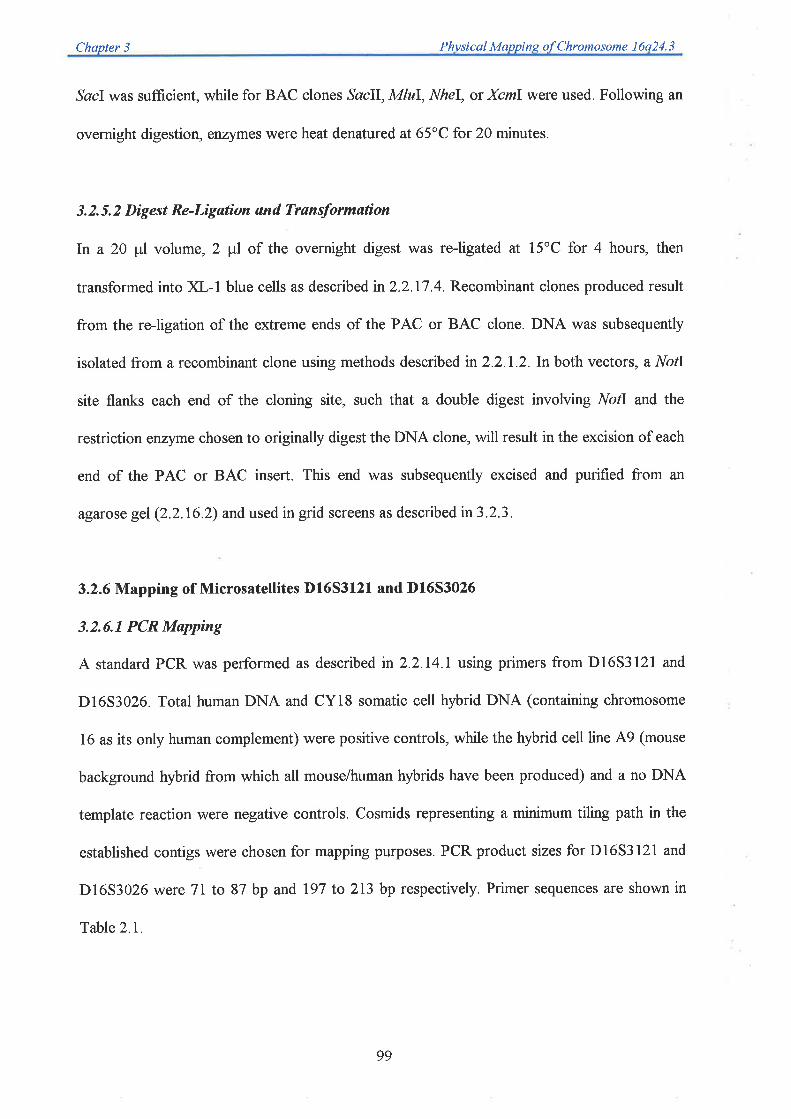
Chapter 3 Phvsical Mappins of Chromosome 16q24.i
,SacI was sufücient, while for BAC clones SacII, MIvI, NheI, or XcmI were used. Following an
overnight digestion, enzymes were heat denatured at 65"C for 2O minutes.
3. 2. 5. 2 Díg est Re-Ligation and Transformatíon
In a 20 prl volume, 2 pl of the overnight digest was reJigated at 15'C for 4 hours, then
transformed into XL-l blue cells as described in2.2.17.4. Recombinant clones produced result
from the reJigation of the extreme ends of the PAC or BAC clone. DNA was subsequently
isolated from a recombinant clone using methods described in 2.2.1.2. In both vectors, a NotI
site flanks each end of the cloning site, such that a double digest involving NotI and the
restriction enzyme chosen to originally digest the DNA clone, will result in the excision of each
end of the PAC or BAC insert. This end was subsequently excised and purified from an
agarose gel(2.2.16.2) andused in grid screens as describedin3.2.3.
3.2.6 Mapping of Microsatellites D16S3121 and D16S3026
3.2.6.1 PCR Møpping
A standard PCR was performed as described in 2.2.14.1 using primers from D16S3127 and
D16S3026. Total human DNA and CY18 somatic cell hybrid DNA (containing chromosome
16 as its only human complement) were positive controls, while the hybrid cell line A9 (mouse
background hybrid from which all mouse/human hybrids have been produced) and a no DNA
template reaction were negative controls. Cosmids representing a minimum tiling path in the
established contigs were chosen for mapping purposes. PCR product sizes for Dl6S3l2l and
D16S3026 were 71 to 87 bp and 797 to 213 bp respectively. Primer sequences are shown in
Table2.7.
99
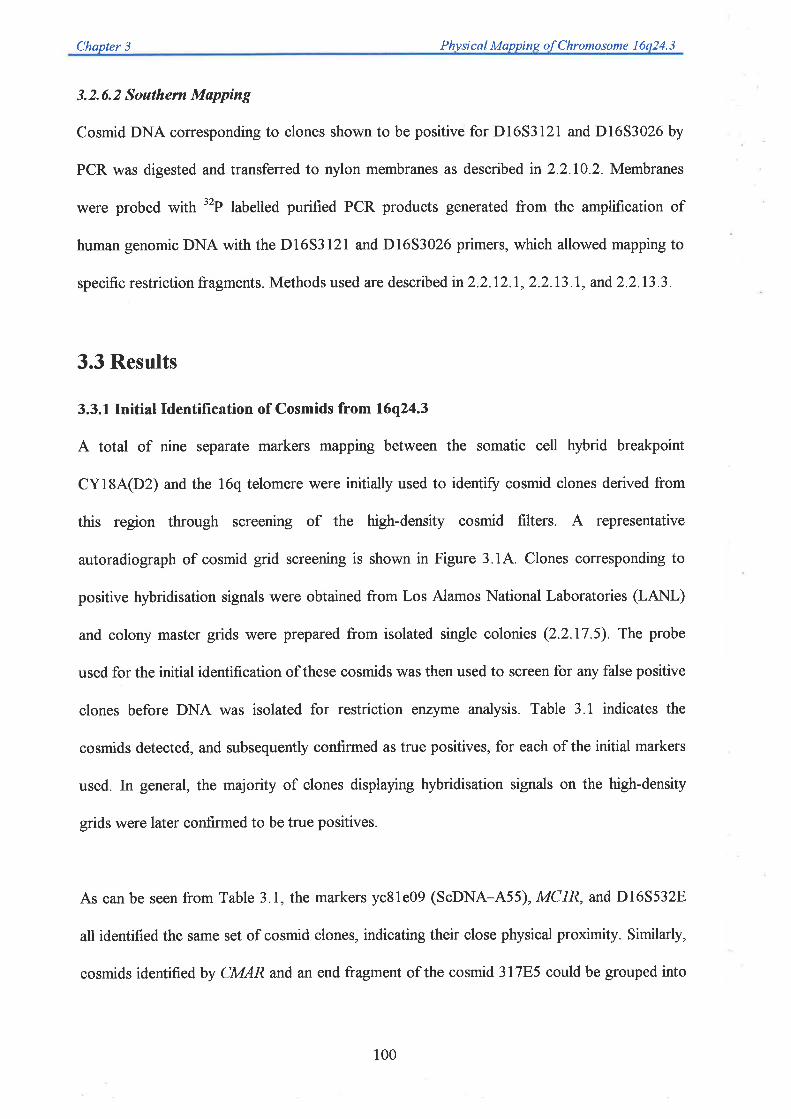
Chapter 3 Phvsicøl Mapping of Chromosome 16q24,3
3. 2. 6. 2 Southern Mapping
Cosmid DNA corresponding to clones shown to be positive for Dl6S3l2l and D16S3026 by
PCR was digested and transferred to nylon membranes as described in 2.2.10.2. Membranes
were probed with "P labelled purified PCR products generated from the amplification of
human genomic DNA with the D16S3121 and D16S3026 primers, which allowed mapping to
specific restriction fragments. Methods used are described in 2.2 .72.7 , 2.2.1 3 . 1 , and 2.2.13 .3 .
3.3 Results
3.3.1 Initial Identification of Cosmids from 16q24.3
A total of nine separate markers mapping between the somatic cell hybrid breaþoint
CY18A(D2) and the 16q telomere were initially used to identify cosmid clones derived from
this region through screening of the high-density cosmid filters. A representative
autoradiograph of cosmid grid screening is shown in Figure 3.14. Clones corresponding to
positive hybridisation signals were obtained from Los Alamos National Laboratories (LANL)
and colony master grids were prepared from isolated single colonies (2.2.17.5). The probe
used for the initial identification of these cosmids was then used to screen for any false positive
clones before DNA was isolated for restriction enzyme anaþsis. Table 3 1 indicates the
cosmids detected, and subsequently confirmed as true positives, for each of the initial markers
used. In general, the majority of clones displaying hybridisation signals on the high-density
grids were later confirmed to be true positives.
As can be seen from Table 3.1, the markers yc8le09 (SoDNA-455), MCIR, and D16S532E
all identified the same set of cosmid clones, indicating their close physical proximity Similarþ,
cosmids identified by CMAR and an end fragment of the cosmid 317F5 could be grouped into
100
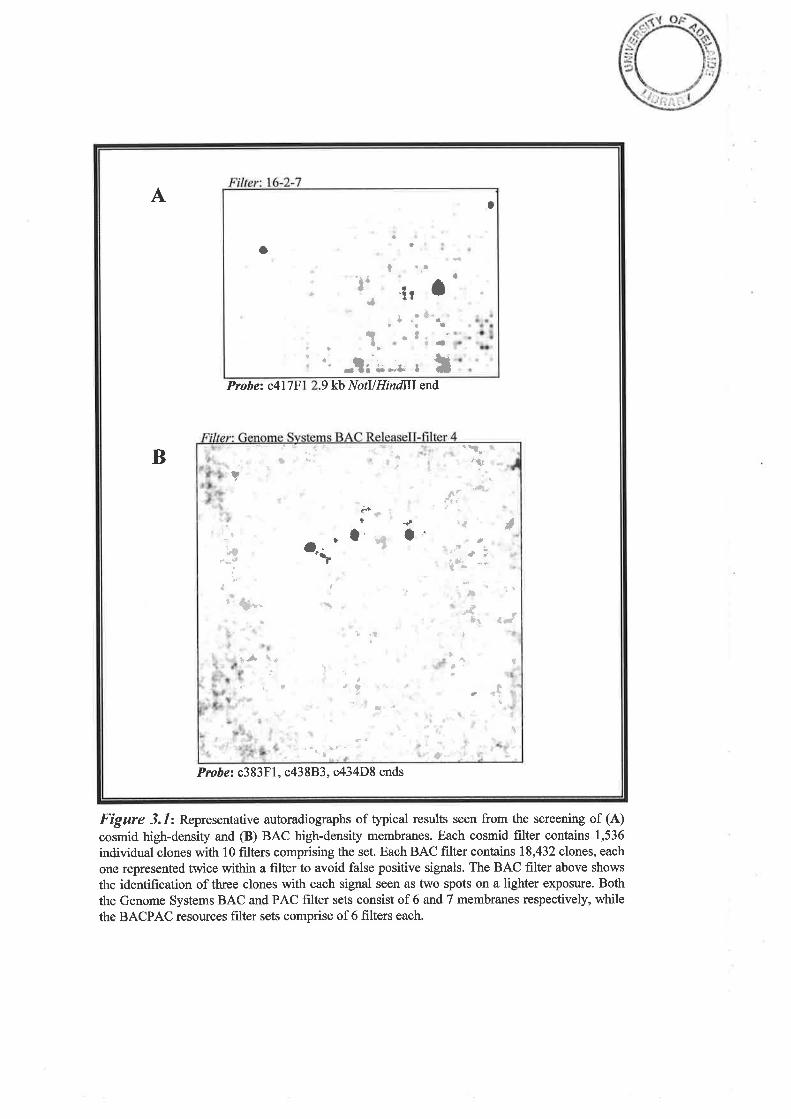
A
Probet c4l7F 9kb NotUHindIIIend
B
Probe= c383Fl, c43883, c434D8 ends
o
ta
tt
a
a
Ò
to
'{1"
ï¡ 'îr 'I ü
r-rt¡ a
taa.
Iat
t
"rti
<J,lt
a
'Er.--
o -{ {t
J++
t
t
I
ij
ç
nfa"t
Ð
a
t':,.- J:1r
.¡r
\s.--"ËFÌt
"1
' -a- I
¿tI
tlç
, l.
*7.
a¿
".tttr
4:
tç
\3
Figure 3.1: Representative autoradiographs of typical results seen from the screening of (A)cosmid high-density and (B) BAC high-density membranes. Each cosmid filter contains 1,536
individual clones with 10 filters comprising the set. Each BAC filter contains 18,432 clones, each
one represented twice within a filter to avoid false positive signals. The BAC filter above shows
the identification of three clones with each signal seen as two spots on a lighter exposure. Boththe Genome Systems BAC and PAC frlter sets consist of 6 and 7 membranes respectively, whilethe BACPAC resources filter sets comprise of 6 filters each.
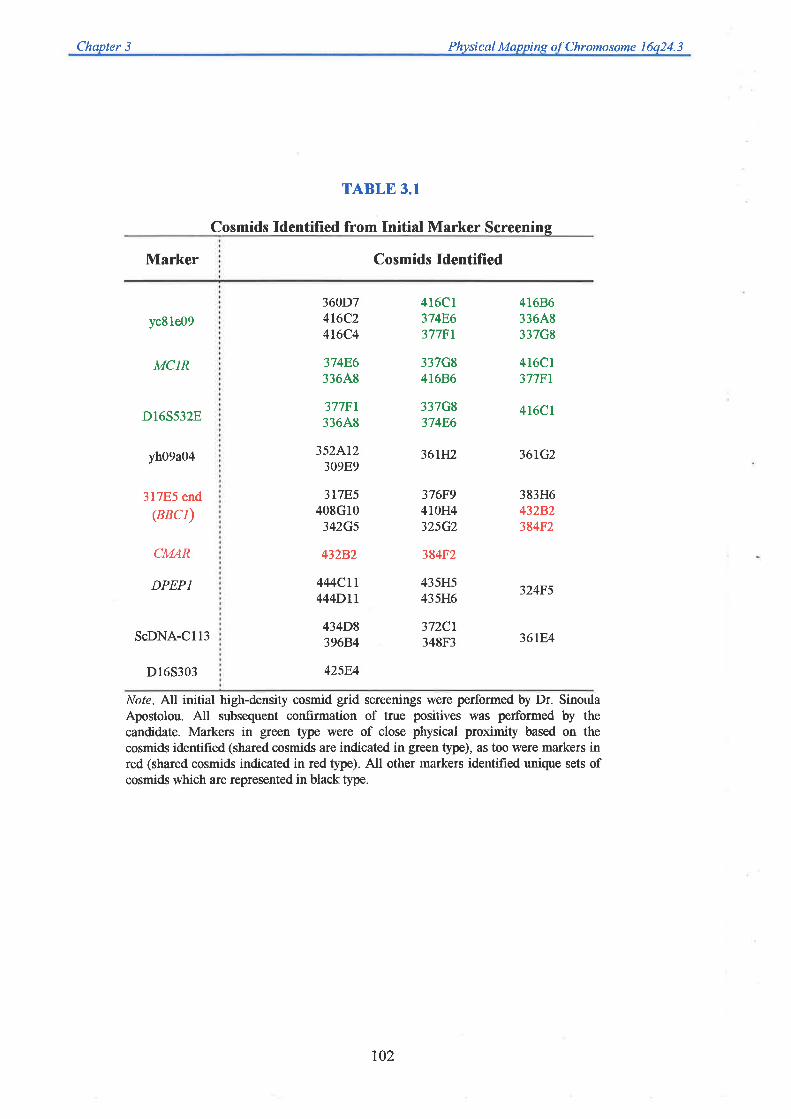
Chaoter 3 Physical Mapping of Chromosome 16q24.3
TABLE 3.1
Cosmids Identified from Initial Marker Screening
Marker Cosmids ldentified
yc81e09
MClR
Dl65532E
yhO9a04
317E5 end(BBCl)
CMAR
DPEP]
ScDNA-C113
360D74t6C24T6C4
374F,633648
37TFI33648
3s2é^t2309E9
3ITE5408G10
342Gs
432B.2
444Ctl444DTT
434D839684
4l6Cl374E:637TFI
337G84T6B6
376F94toH432sG2
384F2
435H5435I{6
37zcr348F3
416B,6
33648337G8
4t60l37TFI
383H643282384F2
324F5
36tF.4
337G837486
4I6CI
361}t2 36tG2
D165303 425F4
Note. All initial high-density cosmid grid screenings were performed by Dr. SinoulaApostolou. All subsequent confirmation of true positives was performed þ thecandidate. Markers in green type were of close physical proximity based on thecosmids identified (shared cosmids are indicated in green type), as too were markers inred (shared cosmids indicated in red type). All other markers identified unique sets ofcosmids which are represented in black type.
702
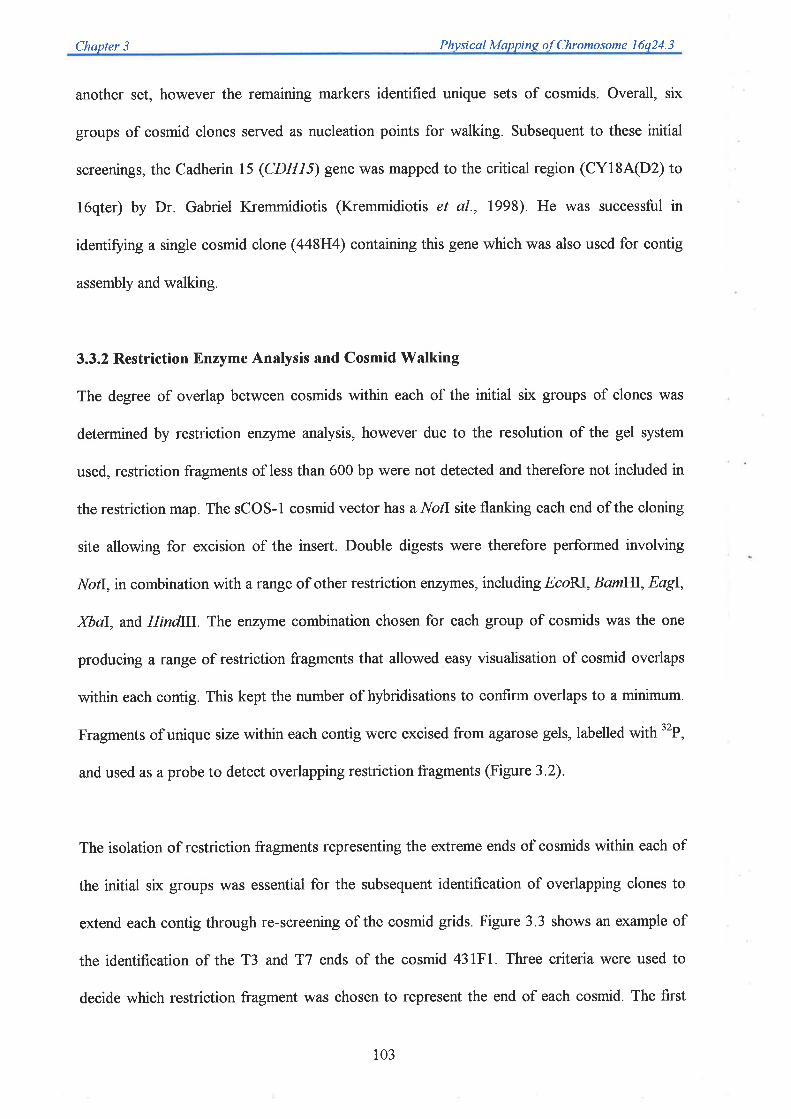
Chapter 3 Phvsical Mappi ng of Chromosome I 6q24. 3
another set, however the remaining markers identified unique sets of cosmids. Overall, six
groups of cosmid clones served as nucleation points for walking. Subsequent to these initial
screenings, the Cadherin 15 (CDH15) gene was mapped to the critical region (CYl8A(D2) to
l6qter) by Dr. Gabriel Kremmidiotis (Kremmidiotis et al., 1998) He was successful in
identifying a single cosmid clone (448H4) containing this gene which was also used for contig
assembly and walking.
3.3.2 Restriction Enzyme Analysis and Cosmid Walking
The degree of overlap between cosmids within each of the initial six groups of clones was
determined by restriction enzyme analysis, however due to the resolution of the gel system
used, restriction fragments of less than 600 bp were not detected and therefore not included in
the restriction map. The sCOS-1 cosmid vector has a NotI site flanking each end of the cloning
site allowing for excision of the insert. Double digests were therefore performed involving
NotI,in combination with arange of other restriction enzymes, including EcoRI, BamF[, EagI,
XbaI, and HindIII. The enzyme combination chosen for each group of cosmids was the one
producing a range of restriction fragments that allowed easy visualisation of cosmid overlaps
within each contig. This kept the number of hybridisations to confirm overlaps to a minimum.
Fragments of unique size within each contig were excised from agarose gels, labelled with 32P,
and used as a probe to detect overlapping restriction fragments (Figure 3.2).
The isolation of restriction fragments representing the extreme ends of cosmids within each of
the initial six groups was essential for the subsequent identification of overlapping clones to
extend each contig through re-screening of the cosmid grids. Figure3.3 shows an example of
the identifïcation of the T3 and T7 ends of the cosmid 43lFl. Three criteria were used to
decide which restriction fragment was chosen to represent the end of each cosmid. The first
103
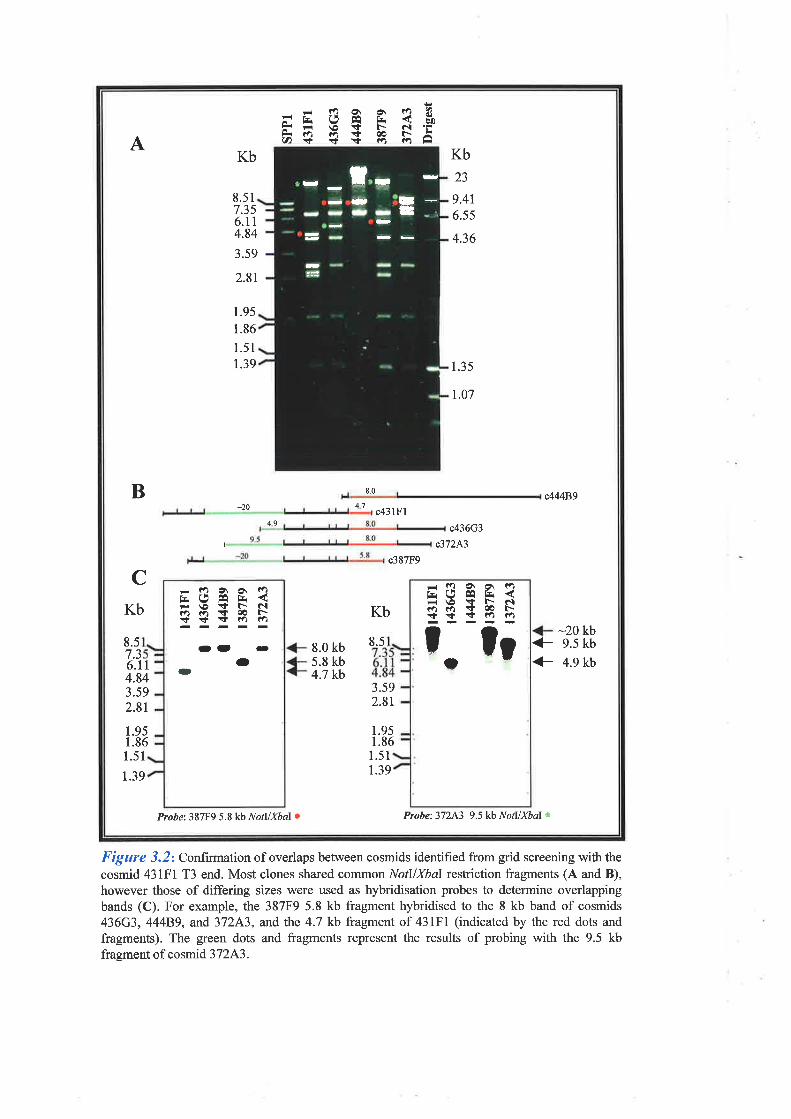
---
IË
-
l,-,.-
-
A-ri9?OO\tt)zFr¡.9Éh<ã$€$È$¿i
Kb Kb23
9.41
6.55
4.36
8.517.356.114.84
3.59
2.8r
1.95
1.86
1.51
1.39 1.3s
1.07
B 8.0c44489
-20 47c43 lF I
49c436G3
t c37243
c387F9
C
Kb Kb-20 kb
8.57.3
8.0 kb5.8 kb4.7 kb
8.5 + 9.s kb
+ 4.9 kb6.114.843.s92.81
3.592.8t
1.951.86
1.951.86
1.51
t.39
1.51r.39
Probe: 38TF9 5 .8 kb NotllXbal o P¡obe:37243 9.5 kb NoilXbaI*
: (r) O\ Or tQr¡(JÉt¡<Fi\Ot+F Cl(v)aos€r\çsË?a?a
o, r-O
O
: tr) or or (.¡Ê9Êr¡<i \o ì+ F.. r\¡lç)É)!+æ¡-ççr+?f¡É)i: i;
Figure 3.22 Confirmation of overlaps between cosmids identified from grid screening with the
cosmid 431F1 T3 end. Most clones shared conìmon NotIlXbaI restriction fragments (A and B),however those of differing sizes were used as hybridisation probes to determine overlappingbands (C). For example, the 387F9 5.8 kb fragment hybridised to the 8 kb band of cosmids
436G3,44489,aîd372A3, andthe 4.7kb fragmentof 431F1 (indicatedbythereddotsandfragments). The green dots and fragments represent the results of probing with the 9.5 kbfragment of cosmid 372A3.

ÈÈ(h 123456
Kb
8.51
7.36.114.84
3.59
2.81
1.95
1.861.51
t.39
1. l60.98
Cosmid:437F1
Kb Kb
8.s 1
7.356.114.84
8.517.356.114.84
3.59
2.813.592.81 1.95
1.86
1.51
t.391.160.98
1.95
r.86
r23456
oaD
P¡obezT3 o
at
-
-
r-ra
123456r!
O
O
a
O
ProbezTT â
of
Figure -1.3: Identification of the T3 and T7 ends of the cosmid 431F1. The clone was digested
with 1. NotUHindIII,2. NotIlBqmHI,3. NotIlBglIl,4. NotIlMluI,5. NotIlHincII, or 6. NotUEcoRI.Southern membranes were probed with either T3 (red dots) or T7 (green dots) S'-end labelledprobes. The restriction fragment subsequently chosen was ideally I to 2 kb in size and ranindependently of other fragments from the same digest. The digest eventually chosen to allow the
isolation of the T3 end was NotIlHincII, while for the T7 end, a NoillBamHI digest was used.
Both end fragments are illustrated by the blue dots on the corresponding autoradiographs.

Chapter 3 Physical Mapping of Chromosome 16q24.3
was the size of the end fragment, which ideally was I to 2 kb in size to prevent high
background on subsequent grid screenings. Secondly, the fragment should not migrate with
similar sized bands on an agarose gel. This would make it difücult to cut out the correct band
without contamination from similar sized fragments. The third criteria was the presence of
specific binding of the T3 or T7 probes such that a single restriction fragment per digest was
detected by each probe. If the probe bound to more than one restriction fragment, that
particular digest was ignored. This is clearly seen in the binding of the T3 oligo probe to the
NotIlBgllI digest of cosmid 431F1 in Figure 3.3. Similarly, the NotUBamÍn T3 end of this
cosmid was also ignored because the 2.6 kb fragment was seen to co-migrate with a 2.5 kb
fragment. In some instances, the restriction mapping of certain clones was sufficient to identi$r
a suitably sized fragment representing the extreme end of the contig without the need to screen
with T3 andTT.
Figure 3.4 shows the identification of the T3 or T7 ends of cosmid 43lFl, demonstrating
which extends the furthest in the contig and would be suitable for subsequent re-screening of
the grids for walking. As can be seen, the 1 kb NoúBamIil T7 end detected not only the
43lFl cosmid, but also hybridised to cosmids 352A12 and 309E9, suggesting this end does
not extend the furthest within this contig. However, the 3.2 kb NotUHincII T3 end only
hybridised to 431F1, demonstrating that this end was the correct one to use for further grid-
screening.
Table 3.2 shows the cosmids identified from all end probe screenings. From the results of
cosmid grid screens, clones were only ordered when the probe used to screen the grids also
detected the cosmid from which it was derived. All six initial contigs were successfully
extended and linked except for the contig represented by the ScDNA-Cll3 probe and the
106
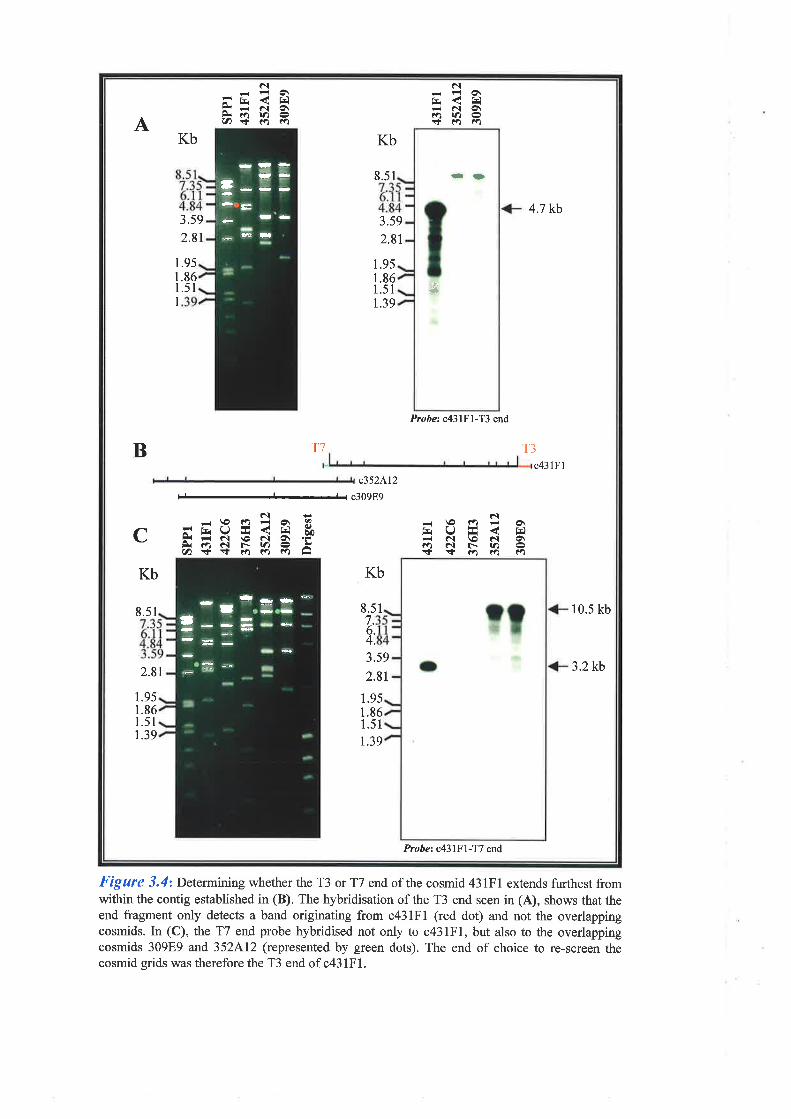
-rI'- lt-!---
--ËI
A
NÉFlo\Fk<r¡ìEã S 3(2+ ó É¡
Nfri < fCF{ N O\É)|.¿eçÉ)(f)
Kb Kb
8.51
4.7 kb3.59
2.8t3.59
2.8t
1
1
1
1
.95
.86
.51
t.9s1.861.5 1
1.39
Probe: c43lFl-T3 end
B 'I'7 T3c43lFl
c352Al2
+ca09E9
CNe¡rOri-o\.?Ft',üË<Éi Ëàai Ê è-l \ê òl O\ .-'
ÊiÉô¡Érñê!Ø++öô?"tÕÊ-\or.¡So\tu9E<r-r ôl \ô ô¡ O\rad¡-.tñcççra?a?n
Kb Kb
8.51 8.51 10.5 kb7.6.4.
2.8t3.s9
2.813.2kb
1.951.86I .511.39
r.951.861.5 1
r.39
Probe: c437Fl-T7 end
Ê,Õ
--
l-¡*
J - t
Figure 3.4: Deterrnining whether the T3 or T7 end of the cosmid 43lFl extends frrthest fromwithin the contig established in (B). The hybridisation of the T3 end seen in (A), shows that theend fragment only detects a band originating from c431F1 (red dot) and not the overlappingcosmids. In (C), the T7 end probe hybridised not only to c431F1, but also to the overlappingcosmids 30989 and 352A12 (represented by green dots). The end of choice to re-screen thecosmid grids was therefore the T3 end of c43lFl.
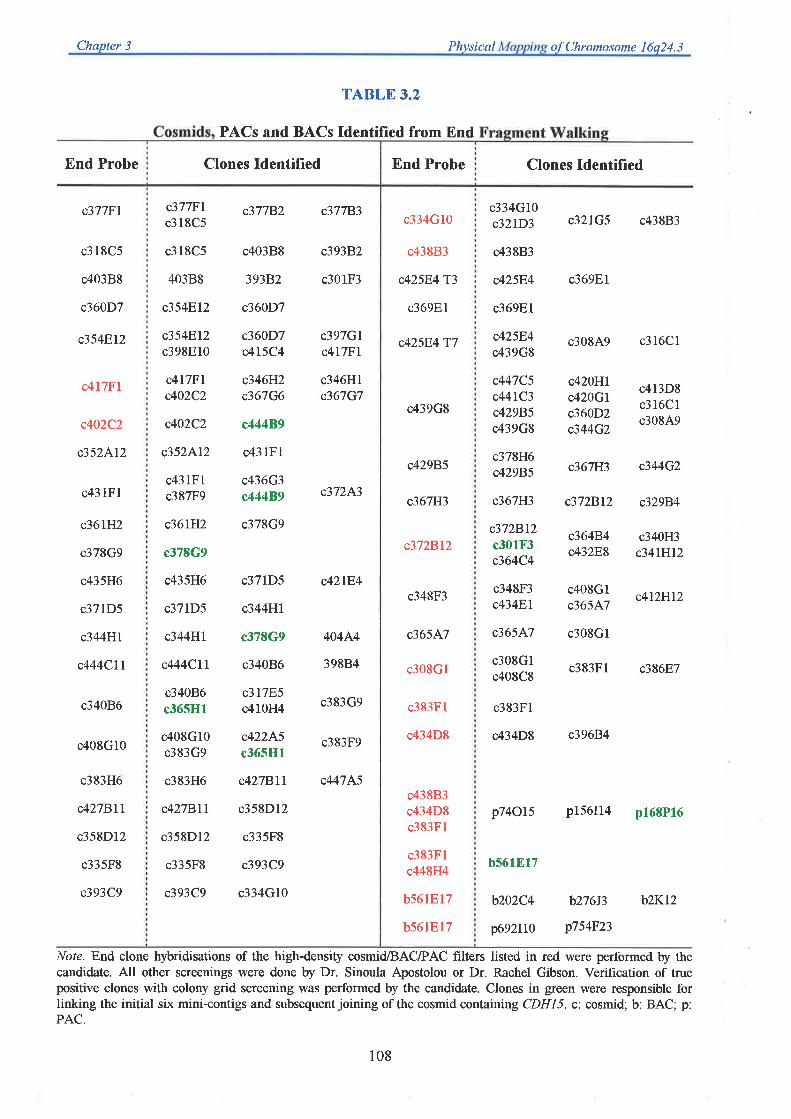
Chapter 3 Physical of Chromosome 16q24.3
End Probe
c37TFI
c3 18C5
c403B8
c360D7
c354EI2
c4lTFl
c4O2C2
c352Al2
c43lFl
c36IÍ12
c378G9
c435H6
c37lD5
c344Hl
c444Cll
c34086
c408G10
c383H6
c427BlI
c358D12
c335F8
c393C9
c37TFlc318C5
c318C5
403B8
c354El2
c354EI2c398E10
g4ITFIc402C2
c4O2C2
c352Al2
c43lFlc387F9
c36lH2
c378G9
c435H6
c371D5
c344HI
c444CII
c34086c365Hl
c408G10c383G9
c383H6
c42TBll
c358Dl2
c335F8
c393C9
c403B8
39382
c360D7
c360D7c415C4
c346H2c367G6
c444B9
c43lFl
c436G3c44489
c378G9
c37lD5
c344Hl
c378G9
c34086
c3lTE5c410H4
c4221^5c365II1
c42TBll
c358D12
c335F8
c393C9
c334Gl0
c39382
c301F3
c397GIc4lTFl
c42lE4
404¡.4
39884
c383G9
c383F9
c44745
c348F3
c365l.7
c308Gl
c383F1
c434D8
c43883c434D8c383Fl
c383Flc448H4
TABLE 3.2
PACs and BACs Identified from End
Clones Identified End Probe
c37TB2 c37TB3c334G10
c43883
c42584T3
c369El
c42584 T7
c346H1c367G7
c439G8
c42985
c372ê^3c36TH3
c372Bl2
b56rEt7
b56lEl7
Note. F;nd clone hybridisations of the high-density cosmid/BAC/PAC filters listed in red were performed by thecandidate. All other screenings were done by Dr. Sinoula Apostolou or Dr. Rachel Gibson. Verification of truepositive clones with colony grid screening was performed by the candidate. Clones in green were responsible forlinking the initial six mini-contigs and subsequent joining of the cosmid containing CDH I 5 . c: cosmid; b: BAC, p:PAC.
108
Clones tdentified
c438B3
c42584 c369EI
c369El
c425F.4c439G8
c32IG5 c43883
c30849 c3l6Cl
c334G10c32ID3
c447C5c44IC3c42985c439G8
c372BI2c301f'3c364C4
c348F3c434El
bs61E17
b202c4
ñ92110
c420HIc420Glc360D2c344G2
c36484ú32F,8
c4l3D8c3l6Clc30849
c340H3c34lHl2
c378H6c42985 c367H3 c344G2
c367H3 c372Bl2 c32984
c4l2Hl2
c36547 c308G1
c308G1c408C8
c383F1 c386E7
c383F1
c434D8 c39684
p74OI5 P156I14 p168P16
c408Glc3651^7
b276J3 b2Kr2
p754F23

cql Chromosome I
448H4 cosmid identitied by the CDHI5 gene.
3.3.3 BAC and PAC High-Density Grid Screening
Repeated screening of the high-density cosmid filters failed to identify overlapping clones that
would extend from either end of the 448H4 cosmid, the ScDNA-Cll3 contig, or the
established main contig. The availability of both human BAC and PAC high-density filters later
in the project allowed the screening of an alternatively cloned source of genomic material to
aid in closing these gaps. Screening of the PAC filters with the end fragments of the cosmids
43883, 434D8, and 383F1 identified a single clone positive for the 434D8 and 43883 probes,
thus enabling the linkage of the Cl13 contig to the main contig. Screening of the BAC filters
with end fragments to the 448H4 cosmid and the 383F1 end was successful in identi$ing one
clone positive for all three probes, resulting in the linking of all contigs. Extension of the
resultant contig was subsequently achieved through the further screening of either the PAC or
BAC grids with clone ends, allowing for quicker walks due to the larger insert sizes as
compared to cosmids. Figure 3.lB shows a representative autoradiograph from a PAC filter
hybridisation and Table 3.2 shows the clones identified from such BAC and PAC filter
screenings.
In some instances cosmid end probes did not hybridise to the expected clones on the cosmid
grids which hindered the linking of contigs. This is highlighted with the end of c444C11, whioh
only identified itself and c34086, when it should have identified c365Hl also. In contrast, a
walk proceeding towards this region from the opposite side, with the end of c408G10,
identified a number of clones including c365Hl, but not the expected c34086. Both the
c34086 and c365Hl clones were later found to be almost identical, yet additional walks were
carried out before contig linkage was identified. This may have been due to human error in the
3
109
Chapter 3 Physical Mapping of Chromosotne 16q24.3
interpretation of the grid screen results, or over-use of the membranes. Another possibility is
that during high-density grid production, a variable amount of DNA from different cosmid
clones may have been bound to each membrane. In addition, variations between filter sets may
also have existed
Only a single cosmid (ca38Aa) did not show a restriction enzyme digestion pattern consistent
with overlapping clones and was therefore omitted from further analysis and not incorporated
into the physical map. Through hybridisation of individual EcoRI fragments, the extent of the
deletion in c438A4 was shown to be -7 kb.
3.3.4 Establishment of Contig Orientation
As the microsatellite D16S303 was known to be the most telomeric marker in the 16q24.3
region (Callen et al., 1995), fluorescence in situ hybridisation (FISH) to normal metaphase
chromosomes using whole cosmids mapping in the vicinity of this marker, was used to define
the telomeric limit for the contig. The cosmid 36981 showed clear fluorescent signals at the
telomere of the long arm of chromosome 16. However, this probe also gave clear signal at the
telomeres of chromosomal arms 3q, 7p,9q, llp, and l7p (Figure 3.54). Conversely, the
cosmid 439G8, which mapped proximal to D16S303, gave fluorescent signals only at 16qter
with no consistent signal detected at other telomeres (Figure 3.58). Further work by Ms.
Karen Lower (Department of Cytogenetics and Molecular Genetics, WCH) showed an
identical result when the 439G8 and 36981 cosmid ends immediately adjacent to the D165303
marker were used as FISH probes to metaphase chromosomes. These results enabled us to
establish the microsatellite marker Dl6S303 as the boundary of the transition from
euchromatin to the subtelomeric repeats, providing a telomeric limit to the contig.
110
Figure 3.5
FISH analysis of metaphase chromosomes using cosmid probes. (A) Cosmid
probe 369El,located distal to DI65303, reveals hybridisation signals at the
telomere of the long arm of chromosome 16 and at the telomeres of
chromosomal arms 3q,7p,9q, l7p, and l7p. This indicates the presence of
subtelomeric repeats within c369Bl providing an orientation and telomeric limit
for the clone contig. (B) Cosmid probe 439c8,located immediately proximal to
D16S303, gives fluorescent signals at 76q24.3 only, suggesting this marker
forms the boundary between the subtelomeric repeats and euchromatin of
chromosome l6q
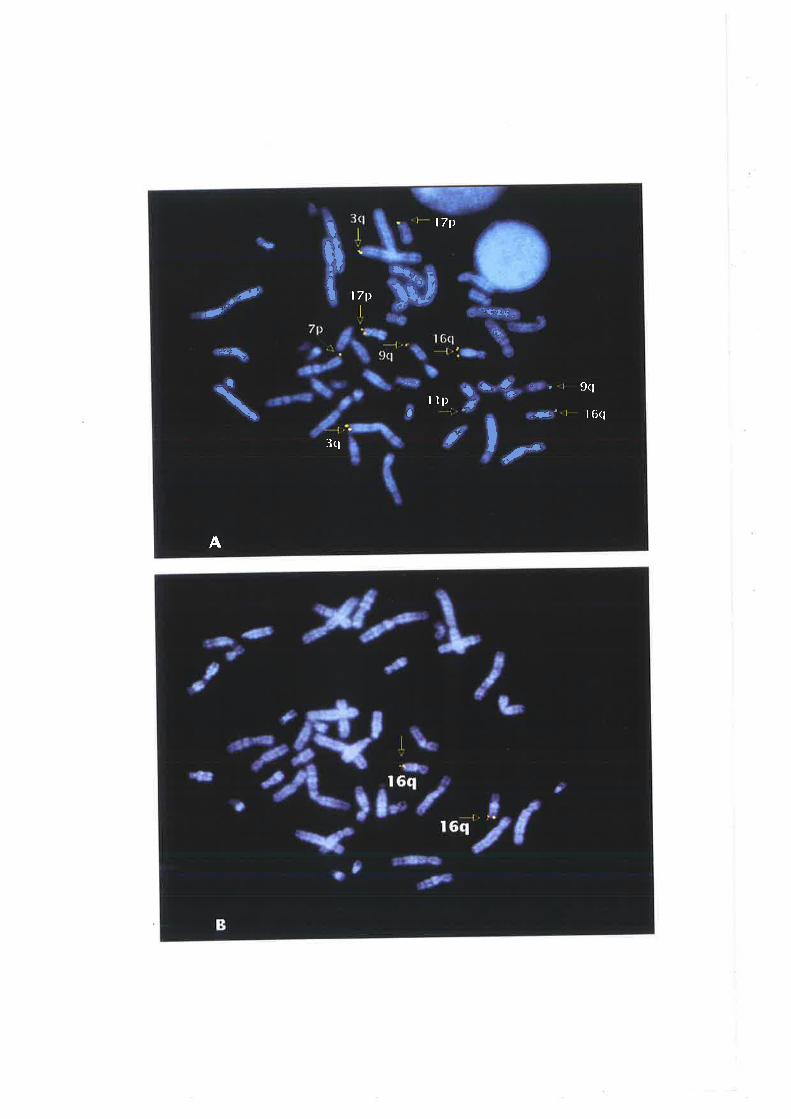
-.:. r
!
w'.rl
\
I f
A
tJ.
J 17ll.
I
llt>
Í,r
IIIt
' , r-9(l
,+' l-- l6q
lùâ*i
3<¡
_ ;tf¡¿ç*
r¡
17p
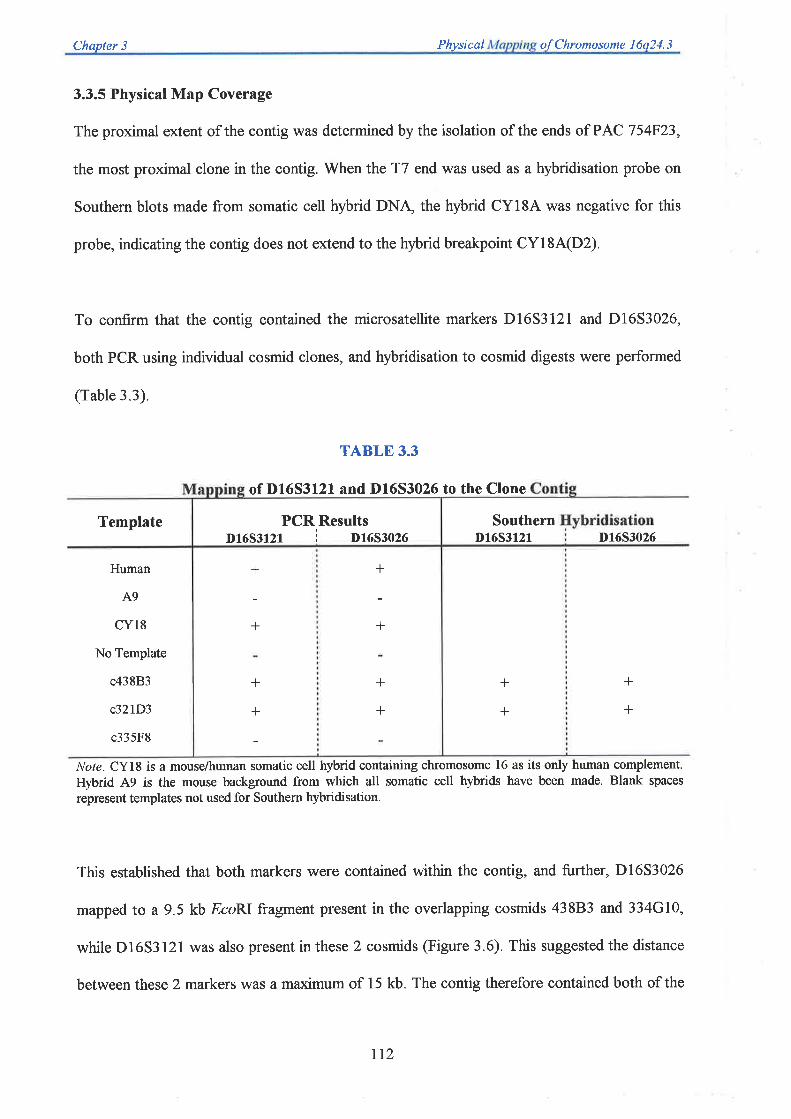
Chapter j Physical of Chromosome 16q24.3
3.3.5 Physical Map Coverage
The proximal extent of the contig was determined by the isolation of the ends of PAC 754F23,
the most proximal clone in the contig. When the T7 end was used as a hybridisation probe on
Southern blots made from somatic cell hybrid DN,\ the hybrid CY18A was negative for this
probe, indicating the contig does not extend to the hybrid breakpoint CY18A(D2).
To confirm that the contig contained the microsatellite markers Dl6S372l and D16S3026,
both PCR using individual cosmid clones, and hybridisation to cosmid digests were performed
(Table 3.3).
TABLE 3.3
of D16S3121 and D16S3026 to the Clone
Template SouthernD16S3121 D16S3026
Human
A9
cY18
No Template
c43883
c32ID3
c335F8
+
+
+
+
Note. CYLS is a mouse/human somatic cell hybrid containing chromosome 16 as its only human complement.
Hybrid A9 is the mouse background from which all somatic cell hybrids have been made. Blank spaces
represent templates not used for Southern hybridisation.
This established that both markers were contained within the contig, and further, D16S3026
mapped to a 9.5 kb ,EcoRI fragment present in the overlapping cosmids 43883 and 334GlO,
while D16S3121 was also present in these 2 cosmids (Figure 3.6). This suggested the distance
between these 2 markers was a maximum of 15 kb. The contig therefore contained both of the
PCR ResultsD16S3121 i nrOS¡OZe
+
+
+
+
+
+
+
+
tt2
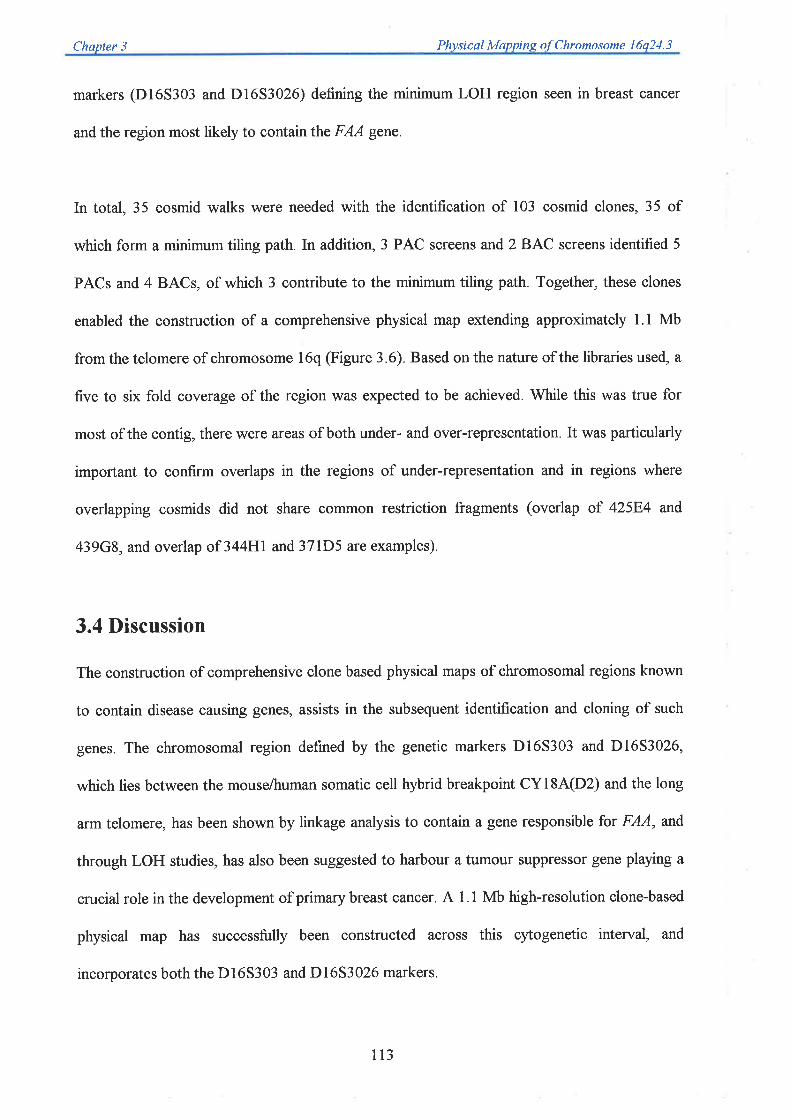
Chapter 3 Physicsl Mapping of Chromosome 16q24.3
markers (D16S303 and D16S3026) defining the minimum LOH region seen in breast cancer
and the region most likely to contain the FAA gene.
In total, 35 cosmid walks were needed with the identification of 103 cosmid clones, 35 of
which form a minimum tiling path. In addition, 3 PAC screens aîdz BAC screens identified 5
PACs and 4 BACs, of which 3 contribute to the minimum tiling path. Together, these clones
enabled the construction of a comprehensive physical map extending approximately 1.1 Mb
from the telomere of chromosome l6q (Figure 3.6). Based on the nature of the libraries used, a
five to six fold coverage of the region was expected to be achieved. While this was true for
most of the contig, there were areas of both under- and over-representation. It was particularly
important to confirm overlaps in the regions of under-representation and in regions where
overlapping cosmids did not share common restriction fragments (overlap of 42584 and
439G8, and overlap of 344H1and 371D5 are examples).
3.4 Discussion
The construction of comprehensive clone based physical maps of chromosomal regions known
to contain disease causing genes, assists in the subsequent identification and cloning of such
genes. The chromosomal region defined by the genetic markers D16S303 and D16S3026,
which lies between the mouse/human somatic cell hybrid breaþoint CYl8A(D2) and the long
arm telomere, has been shown by linkage analysis to contain a gene responsible for FAA, and
through LOH studies, has also been suggested to harbour a tumour suppressor gene playing a
crucial role in the development of primary breast cancer. A 1.1 Mb high-resolution clone-based
physical map has successfully been constructed across this cytogenetic interval, and
incorporates both the Dl65303 and D1653026 markers.
113

Figure3.6
Physical map ofthe restricted region of loss of heterozygosity (LOH) at 16q24.3
seen in breast cancer. The map for the -1.1 Mb contig is divided into 8 segments
spanning 3 pages and extends from A (telomeric end) to I (centomeric end). At
the top of each segment is a scale bar indicating distance in kilobases, while the
bottom line with vertical bars indicates restriction enzyme sites. Ea: EagI;8.
EcoRl;X: XbaI; N: l/o/I; H. HindIII;B. BamÍtr. NotI sites are indicated below
this line. Within each restriction fragment a size in kilobases is indicated, while
the sizes of cosmid end fragments are indicated above each clone. Restriction
fragment sizes with an asterisk indicate the order of this fragment is not known
with respect to the adjacent telomeric fragment. Clones representing a minimum
tiling path in the contig are indicated by thicker black horizontal lines, as
compared to other clones. Overlapping cosmids are represented by blue
horizontal lines and overlapping BACs and PACs by red lines. Green cosmids
represent those clones characterised by Ms. Joanna Crawford, Dr. Gabriel
Kremmidiotis, orDr. Ram Seshadri. Red closed circles representthe locations of
the markers used to initially identifr cosmid clones mapping to the 76q24.3
region. The closed black circles indicate the location of the D16S3721 and
D16S3026 microsatellite markers which define the centromeric limit for the
minimum region ofLOH. Black diamonds indicate the ends of clones used to re-
screen the cosmid, BAC, and PAC high-density filters for contig extension. The
CYI SA(D2) breakpoint is indicated by the vertical hashed bar in segment 8. The
distance ofthis breakpoint to the end ofPACT 54F23 is not known.
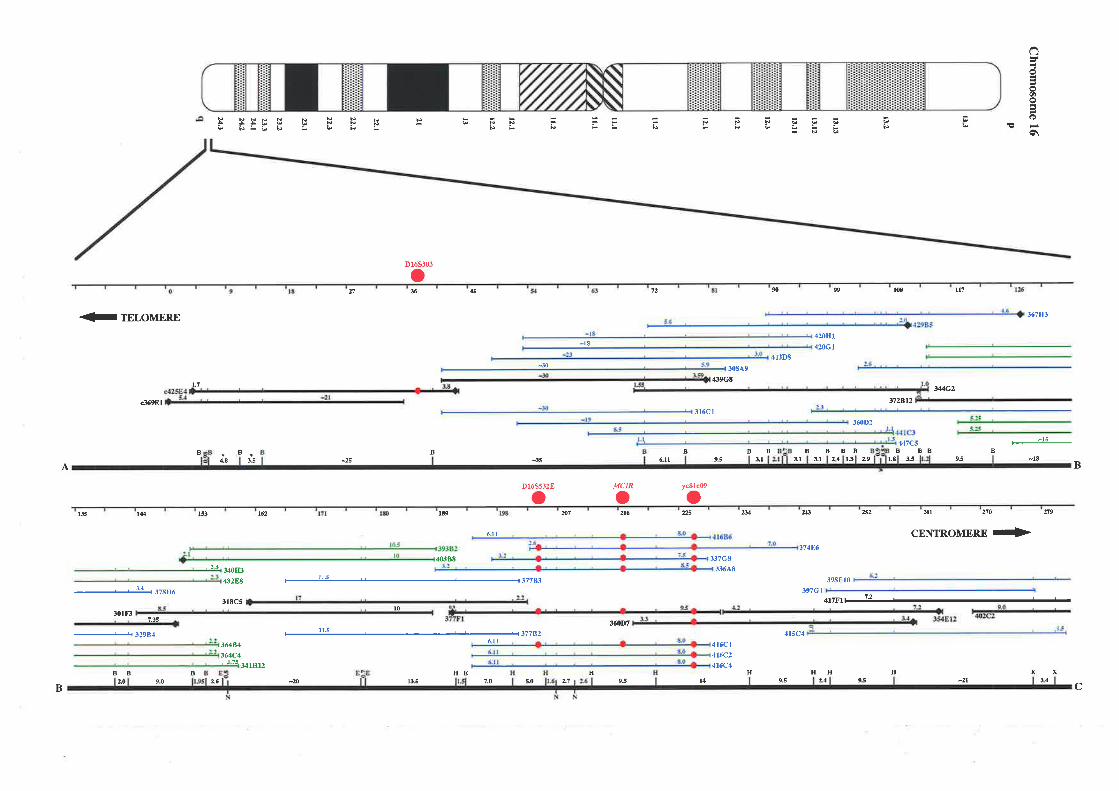
(ì
oØoG
€\¡ÉTFFS
þLLa¡þÞÉFÞ
12
-18
oÞ¡P
oD165303
36 rl1lü
372812
99s
413D8
4527
367H3<T TELOMERE
s:l69El
,r20Ht
420C1
-s 308À9
439Gtl-7
344G2
316C1
J6ÛD2
BBBBBB B BB447c.5
B BBF------:!!-
B
4E -183.5 ¿s -s
D16S532E
últ 9.5
B
vc81€09
al ]t 3.1 24 l3 2,9 1.8 3.5 9JA B
oIUIClR
ools t4t
--L-L-¿! J7sH6
301F37-35
+32984
153
, 2t:.1
,,f0H34328E
31EC5
36484
162 1æ
óll
,10388
37783
lo
377S:
N ß
37486
337G8
336 A8
397Gr
360D7
tlsc4
x2 xl Ìto n9
CENTROMERD
->
.1988 t 0
4flîr 12
-
2t6m7
' ñ2C2
6ll
B2,O 90 26
364C4, J7s- x41Á12
¿o ra5HE
7,O s0 L7H
9.5 t4
,{ t6c I
416<:2
4164:4H
9.S 24 95H
-21x
3{x
cBB B HH
]'h09ã{Xo52vs
-+0
306 315
367G6
367C7
346Hr3¡6H2
436G3
37243
352412
314
36tÃ2
309 E9
333 w ffi s9 Æ 1t4 &3
.-TELOMERE
:.0
¿314ML4
,ßrF1378G9
387F9 36lC2
xxx
C45
I)PEPI
ot 50{
tst¡
34481 444ctt43sH6
43-i H-C
-17
r19
54
39884
# 558 'w 96
3;6F9 |-32SC2
34086
,13
ts-28
365H1
32.1FS
I39
444Dr I
12ZAS
408G l03&tG9
383F919
4108,1
3r785 :.8
It
!n
342C5EEx x x x x
4 as -15 ll-30 -lt 42
D E
BI'CI CMAR
Oo7m621g 03 m 639 ffi 651 675 6g ß 1M66
P.ÀC r68Pr6
7tl
CENTROMERE +
32rC-q F!!-
€:Bl
t.l6
, ,t.1u
383H6
427Btt
384F:
33sFt
358D12
,t474S 32rD3
EIz4l.E
E EI
EI
EI
EI
EI
EI
E EI
DI
E-t1
E E60 67
E60
E&0
E5Ett LA
E36 &0 4.E tl 4-1 7-t Át1 7.3 lrsl -1t 54 49 LA 26
E EEI aó lr.E I s.E
F
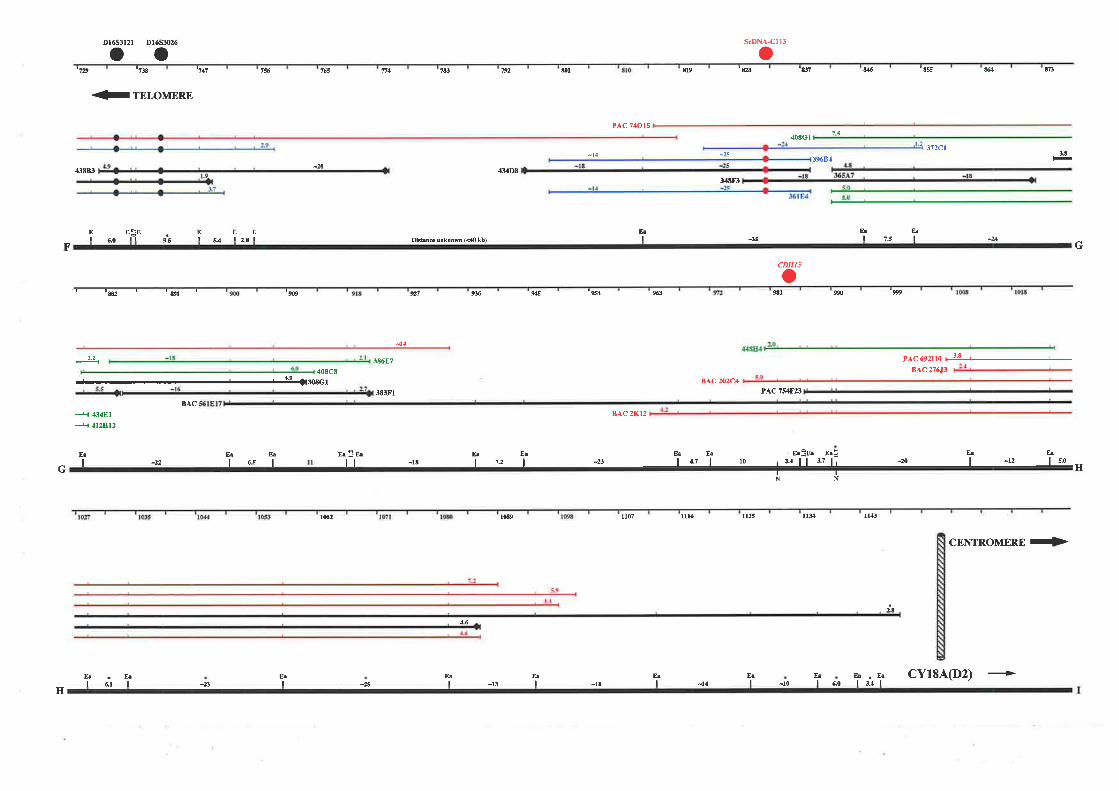
Dl6s3l2l D16S3026
'z¡e '14i
+ TELOMERE
E:Ett
+,l3,lEl-4 412812
SGDNA-C113
oo o'læ
43883
1# 765 T'4
3EóE7
rl9 'g '&t
40aG I
w '85tß
hc rúrom (40 kb)
91 9X
M
,134D8
sl ú1 fl3
4
PAC 740ls
312C1-14 AE-25
3968.f-20
hI
EI2A
EI
EI9.3
EI s4
34tF3
BAC 202C4
45&E¡I 1s I
F6.0
G
CDHl5
os 'g ß s1 90 'w
pAc692lto F!L--BAC 276J3
PAC 79F23
-14
.L2
408C8
30sc1
BAC
E¡&I 6s I
E¡I -22
383F1
8.1.C 2Kf!
h S E E¡ E¡ Es Eå E¡:E¡ E¡: E¡ E¡
ll -r8 I 1.2 | -23 | 4.7 | ro r3.4ll 3.71' -2o | -r2 lr0G H
NIN
r(b2 lo89 ll07 lt16 ltß IB lldl
CENTROMERE +
È*hla4 I
ÞI
EsI
hI
hI
&I
E¡I
Er'E¡l6.rl
H-a -13 -lt -14 -10 úo
cYl8A(D2) +
Chapter j romosome 16q24,j
3.4.1 Physical Map Integrity
The flow-sorted chromosome 16 cosmid library used in the map construction proved to be an
extremely reliable source of cloned material and has been shown to be effective in other
mapping studies (Giles et al., 7997; Sood er al., 1997). Only three gaps were encountered
which could not be closed through successive cosmid grid screenings, however each of these
gaps was covered through the identification of either BAC or PAC clones. Similar gaps in
contig construction have also been reported by Sood et al. (7997) In this instance, gaps were
also successfully covered by the isolation of a BAC clone, which suggests that low copy
number may be important in propagating some genomic regions using bacterial systems.
Cosmids have been shown to be relatively stable cloning vehicles, afact supported by this map
which established that only one clone (c438Aa) showed an altered restriction enzyme digestion
pattern relative to other overlapping cosmids. This region, containing both the D16S3121 and
D16S3026 markers, had several stable cosmids including c32IG5, c32lD3, c438B3 and
c334G10, as well as one PAC clone (PAC 168P16). The 43844 clone was later shown to
contain a -7 kb deletion within an EcoRI restriction fragment and was therefore omitted from
the physical map
In most regions of the map, the expected density of cosmid clones was achieved. However
regions of under-representation were seen, particularþ proximal walks from the initial 31785
contig. In this instance, a PAC clone (PAC 168P16) was identified that spanned this region of
low cosmid representation, and was shown to contain EcoRI fragments identical to those seen
in the overlapping cosmid clones. Also, an individual cosmid clone (c427Bll) from this region
was used as a FISH probe to metaphase chromosomes and as a hybridisation probe on
Southern membranes containing somatic cell hybrid DN,\ to confirm it mapped to the correct
\17
Chapter 3 Physical Mapping of Chromosome 16q24.3
region. Although the under-representation of cosmid clones in particular regions may reflect
the nature of the DNA content of that region, other factors such as the probe used for the
cosmid walking need to be considered. Probes that are high in repetitive elements, such as AIU
sequences, may have very little unique sequence left to bind once the repeats have been
quenched through pre-reassociation. Another factor was that cosmid high-density grids that
had been used frequently showed reduced signals increasing the likelihood that positive clones
were not detected. In addition, the distribution of Sau3A sites within regions of low cosmid
representation may be a contributing factor. A lack of these sites may lead to restriction
fragments too large to clone such that this region will not be represented as a cosmid clone.
3. .2lntegration of Physical and Genetic Maps
The microsatellite markers Dl653l2l and D1653026 were mapped to the same cosmid clone
by PCR and Southern hybridisation and are a maximium of 15 kb apart A comparison with the
genetic linkage data of Dlb et øl (1996) however, indicated that the likely order of genetic
markers was determined to be 5413-53026-53023-53121-TEL, with a sex-averaged distance
of -2.3 cM between D16S3026 and D16S3023, and 0.1 cM between D16S3023 and
D16S3l2l. Previous physical mapping studies (Callen et al., 1995) had determined that
D16S3023 and D16S4l3 map to the cytogenetic interval proximal to the D16S3l2l and
D16S3026 markers, thus highlighting an effor in the genetic linkage data. Based on the
established contig, along with previous physical mapping data,fhe most likely order of markers
is S413-S3 023-53026-53l2l-TEL. A reversal of the order of 53026 and 53023 on the linkage
map of Dib et al. (7996) would therefore indicate a sex-averaged distance of 0.1 cM between
D16S3026 and D16S3121, consistent with the results established from the contig construction.
A comparison between the genetic and physical distances between Dl65303 and Dl653l2l
118
Chapter 3 Physical Mapping of Chromosome 16q24.3
could not be made as D16S303 is not a Genethon marker and has therefore not been included
in the comprehensive linkage maps established by these groups. It does appear however, that
D16S303 is the most telomeric marker on the long arm of chromosome 16 (Kozman et al.,
1993). FISH to metaphase chromosomes using a cosmid mapping immediately telomeric to
this AC repeat, identified DNA homology with the telomeres of a number of other
chromosomes, indicating the presence of subtelomeric repeats within this cosmid. In contrast,
FISH with a cosmid immediately telomeric to D165303 showed unique signal at T6q24 3 only.
This suggests the marker lies at the boundary between the subtelomeric repeats of the long arm
of chromosome 16 and the start of the euchromatin. Analysis of the short arm of chromosome
16 has also indicated that an AC repeat may border the divergence of the telomeric region to
the euchromatic region (Wilkie and Higgs, 1992). The presence of genes at a lngh density
starting just a few kilobases proximal to the subtelomeric repeats has been identified at this and
other sites (van Deutekom et a|.,1996;Flint et al.,1997).
The depth of coverage across the majority of the established contig now provides an essential
resource for the sequencing of this chromosomal region and for the identification of additional
microsatellite markers hhat may assist in the further refinement of the minimum LOH region
seen in breast cancer. Given the few genes and ESTs mapped to the contig, the clones also
provide templates for the identification of new transcripts that lie within this region, which will
be candidates for the FAA gene and a tumour suppressor gene involved in breast cancer.
Chapter 4 describes the use of exon trapping specifically for this purpose, together with the
analysis of partial cosmid sequence and cDNA database screening.
119
Identificution of
Trunscribed
Sequences
ut 16q24.3
Chapter 4 Identi.lication of Transcribed Sequences øt 16q24.3
Table of Contents
4.1 Introduction
4.2 Methods
4.2 TDigestion of Cosmid DNA
4.2.2 PhenoVChloroform Extraction of Digested DNA
4.2.3Preparation ofthe Exon Trapping Vector
4.2.4 Subcloning of Cosmids into the pSPL3B-CAM Vector
4.2.4.1 Ligations
4. 2. 4. 2 Transþrmations
4.2.4.3 Cell Suaping and DNA Isolcttion
4.2.5 Preparation of COS-7 Cells
4.2.6Transfection of COS-7 Cells
4.2.7 Isolation of Cytoplasmic RNA from COS-7 Cells
4.2. 8 Reverse Transcription
4.2.9 Primary PCR Amplification
4.2.10 Secondary PCR Amplification
4.2.11Uracil DNA Glycosylase Cloning of Secondary PCR Products
4.2. 12 Exon Confirmation
4.2.12.1 Colony PCR
4.2.12.2 DNA Isolotion and Sequence Analysis
4. 2 . I 2. 3 Physical Møpping of Trapped Products
4. 2. I 2. 4 Database Homologt Searches
4.2.13 Analysis of the Human Gene Map
4.2.74 Single-Pass Cosmid Sequencing
4.3 Results
4.3.1 Exon Trapping
4.3.2 Analyses of Trapped Exon Sequences
4.3.3 Cloning ofthe FAA gene
4.3.3.1 Identification of cDNA Clones Homologous to Trapped Exons
4.3.3.2 Identification of Full-Length cDNA Sequence
4. 3. 3. 3 Mutation Anølysis
4.3.4 Analysis of the Human Gene Map
4.3.5 Analysis of Single-Pass Cosmid Sequencing
4.4 Discussion
4.4.7 Exon Trapping
4.4.2 Comparison of Transcript Identification Methods
4.4.3 Candidate Breast Cancer Tumour Suppressor Genes
Page
120
123
123
123
124
t24724
724
t25
t2s
125
126
t27
127
728
128
t29
129
129
130
130
130
131
131
131
136
741
t4t142
143
144
746
147
147
153
154
Chapter 4 Identili cation of Transcri bed Seauences at 16q24.3
4.1 Introduction
At the start of this phase of the project international efforts in the physical mapping of cDNA
clones (ESTÐ were not yet underway. This necessitated the identification of transcribed
sequences by other means. At this time, the two most commonly used procedures for the
identification of transcribed sequences within relatively large genomic intervals were direct
oDNA selection and exon amplification (discussed in detail in1.2.3.4 and 1.2.3.5). The latter
procedure was chosen because it is not limited by the tissue or developmental expression of
genes. Instead, the expression of cloned genomic DNAs is driven by a promoter in tissue
culture cells, which allows for coding sequences to be identified without prior knowledge of
their expression profìle. This therefore circumvents the need to analyse multiple oDNA libraries
as with cDNA selection. Exon trapping using the pSPL3B vector relies on the presence of a
functional splice acceptor and donor site flanking an exon. As a result, the terminal 5' and 3'
exons of a gene are not selected, and similarly, transcripts that contain less than three exons
will not be identified. However, as a general procedure for identi$ing coding sequences within
large genomic regions, this technique has been shown to be very effective (Burn et al., 1996;
Chenet a1.,7996a; Couch et al.,1996b; Church et a1.,1997).
The construction of a detailed physical map of chromosome 16q24.3, between the markers
D1653026 and D165303, encompasses the region most likely to contain the FAA gene and a
breast cancer tumour suppressor gene. The majority of this map is comprised of cosmids,
clones forming a minimum tiling path in the contig were therefore used as substrates in exon
trapping experiments to help identify new transcripts mapping to the critical region. The
outline of the exon trapping procedure is shown in Figure 4.7 and described in detail in the
methods section. However a modified version of the previously reported pSPL3B vector was
t20
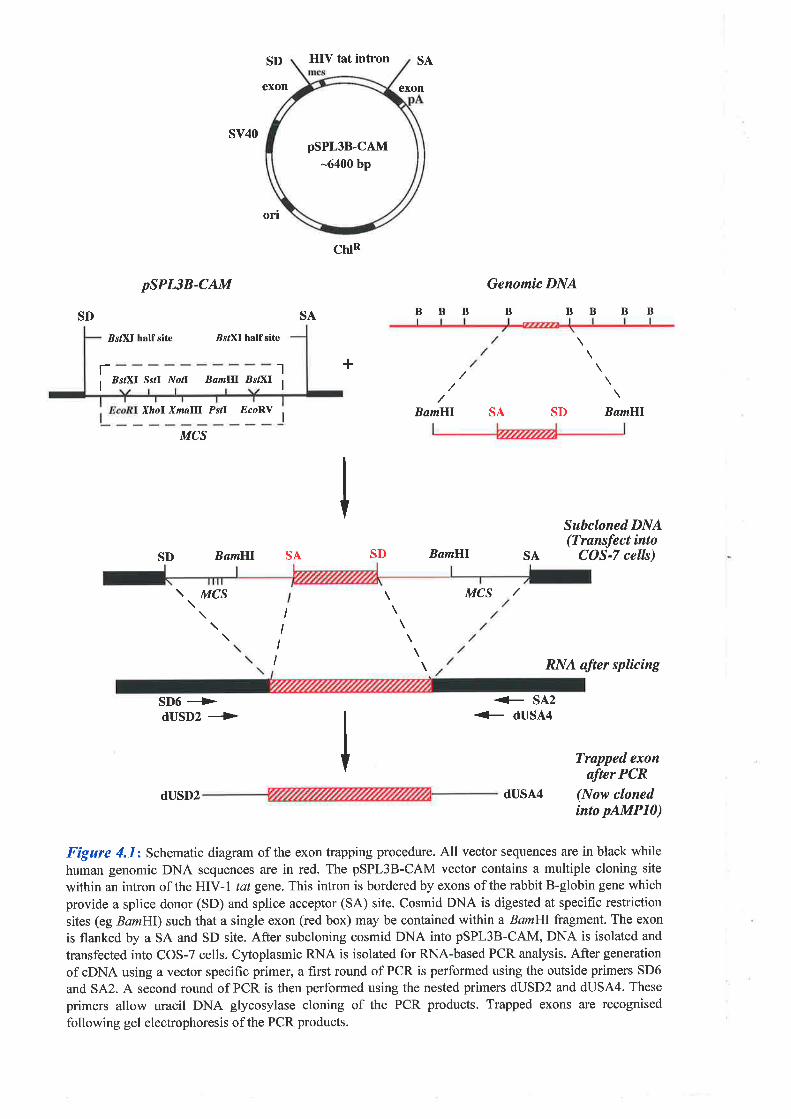
SD
sv40
psPL3B-CAM
BslXI half site BsfXI half sitc
BsIXI SsrI NofI BamlEI BstXI
Xhol Xmøll| Psll .EcoRV
SD HIV tåt intron SA
exon exon
orl
CNR
SA
'lI
+
Genomic DNA
BBBBBBBB
BamHl
SD BamHl
SA SD BamHl
rI
I
MCS
SD BamlII SA SA
Subcloned DNA(Trønsfect into
COS-7 cells)
pSPL38-CAM
-6400 bp
\ MCS
\
SD6 +dUSD2 +
MCS /
+ SA2+ dUSA4
RNA after splicíng
II
II \
dUSD2 dUSA4
Trøpped exonafter PCR
(Now clonedinto pAMPl0)
Figure y'.,f : Schematic diagram of the exon trapping procedure. All vector sequences are in black whilehuman genomic DNA sequences are in red. The pSPL3B-CAM vector contains a multiple cloning site
within an intron of the HIV-I tat geîe. This intron is bordered by exons of the rabbit B-globin gene which
provide a splice donor (SD) and splice acceptor (SA) site. Cosmid DNA is digested at specific restriction
sites (eg BamHI) such that a single exon (red box) may be contained within a BamHl fragment. The exon
is flanked by a SA and SD site. After subcloning cosmid DNA into pSPL3B-CAM, DNA is isolated and
transfected into COS-7 cells. Cytoplasmic RNA is isolated for RNA-based PCR analysis. After generation
of cDNA using a vector specific primer, a first round of PCR is performed using the outside primers SD6
and SA2. A second round of PCR is then performed using the nested primers dUSD2 and dUSA4. These
primers allow uracil DNA glycosylase cloning of the PCR products. Trapped exons are recognised
following gel electrophoresis of the PCR products.
Chapter 4 I de nti lì cat i on of Tran s cri b e d Se quen ce s at 16q24.3
used (Burn et al., 1995). This new vector, pSPL3B-CAM, has had the ampicillin resistance
gene replaced with a gene conferring chloramphenicol resistance. This assists in the initial step
of sub-cloning cosmid DNA restriction enzyme fragments into the trapping vector by allowing
selection against contaminatingre-ligated ampicillin resistant cosmid vector clones. It has also
been noted that increasing the complexity of the DNA used for each trapping experiment
dramatically decreases the exon recovery (Yaspo et a1.,1995) For this reason, the maximum
number of cosmids used in any one trapping experiment was three, with the majority of traps
involving a single cosmid.
To determine the authenticity of the products trapped, a comparison of the sequences of these
products can be made to nucleotide sequences present in the database of ESTs (dbEST)
Significant homology to an EST is often sufficient initial evidence for mapping the
corresponding oDNA clone to the region from where the exon was trapped. Otherwióe,
expression of the exons needs to be confirmed, by for example, linking to adjacent exons by
RT-PC& or screening oDNA libraries. Some of these procedures will be discussed in detail in
chapters 5 and 6.
The publication of the UniGene collection and the development of the Human Gene Map
(Schuler et al.,7996), coupled with single-pass sequencing of selected cosmids from within the
physical map contig (performed by Los Alamos National Laboratories) during the course of
the exon trapping experiments, provided alternative ways to identify cDNA clones mapping to
the cosmid contig. The main objective of all these methods was to allow the construction of a
transcription map of the 16q24.3 region which would provide a source of candidate genes that
may play a role i¡ FAA and breast cancer.
722
Chapter 4 I den ti lì cati on of Tr qn scri b e d Se que nce s at I 6 s 2 4. 3
4.2 Methods
A number of procedures were only performed in this chapter and chapter 7 , and are therefore
mentioned in detail in these chapters. More general techniques are described in detail in chapter
2, however slight modifications are referred to when appropriate. Exon trapping procedures
were adapted from those used by Church et al. (1994).
4.2.lDigestion of Cosmid DNA
Five micrograms of cosmid DNA was double digested in a volume of 50 ¡rl with BamIn and
Bglll, or with PstI alone, in the presence of BSA at a concentration of 100 þglnl.Digestion
was at 37oC overnightusing 15 units of BamHIandPstI enzymes and 30 units of EglII (the
double digest was performed in the restriction buffer specific for BamIn which was not
optimal for BgIII, therefore double the amount of BgIII enzyme was used).
4.2.2 PhenoVChloroform Extraction of Di gested DNA
An aliquot of 250 ng from the overnight digest was kept aside for later analysis. A further 150
¡rl of sterile water was added to the remaining digest and mixed. An equal volume of phenol
was then added to each digest and mixed. After centrifugation at 13,000 rpm for 7 minutes, the
aqueous layer was transferred to a fresh eppendorf tube. An equal volume of chloroform:IAA
(2a:\ was added, the solution mixed, and again the samples were spun at 13,000 rpm for 7
minutes, with the aqueous layer transferred to a clean eppendorf. The DNA was precipitated
by the addition of one-tenth the volume of 3 M NaAc (pH 5.2) and 2 volumes of 100%
ethanol. After incubatingat -80'C for I hour, the samples were spun at 13,000 rpm for 30
minutes. DNA pellets were washed with I ml of 70Yo ethanol, air-dried for 15 minutes, and
resuspended in 10 pl of sterile water. An aliquot of 2 ¡i was run on a 0.8olo agarose gel with
123

Chapter 4 Ide nti /ì c ati on of Tr qn sc ri b e d Se qu ence s at I 6q 2 4. 3
the original digest aliquot being run alongside to determine the efüciency of the purification
pfocedure
4.2.3Preparation of the Exon Trapping Vector
A total of l0 pg of the exon trapping vector pSPL3B-CAM was digested in a 50 ¡rl volume
overnight at 37"C with 15 units of either PslI or BamIn. The following day, 50 pl of water
was added to the digests and they were cleaned with QlAquick columns according to
manufacturers instructions (2.2.16.1). The cleaned vector digests were then treated with2.5
units of calf intestinal alkaline phosphatase (CIAP) in a volume of 100 pl using the buffer
supplied. The dephosphorylation reactions were carried out at 37"C for I hour. Following this,
the samples were again cleaned by QlAquick columns and the DNA quantitated by
spectrophotometry Q.2.6)
4.2.4 Subcloning of Cosmids into the pSPL3B-CAM Vector
4.2.4.1 Lígøtions
Digested and dephosphorylated pSPL3B-CAM DNA was ligated to digested cosmid DNA
essentially as describedin2.2.17 1. Reactions involved the use of 50 ng of vector DNA in
combination with 100 ng of cosmid DNA. An important control was the ligation of 50 ng of
vector with no cosmid DNA present.
4. 2. 4. 2 Transformøtions
The method was the same as that described in2.2.17.4. However, instead of plating out 200 pl
of the transformed cells, the cells were spun down and the pellet resuspended in 100 ¡rl of L-
Broth. The entire 100 ¡rl was then plated onto an L-Chloramphenicol plate and incubated at
124

Chapter 4 I de nti /ì c ati on of Transcr i b e d Se que n ce s at I 6(t 2 4. 3
37oC overnight. No X-Gal or IPTG were spread with the cells. Subcloning of the cosmids into
the trapping vector was deemed successful if the number of colonies on the experimentalplate
exceeded the number of colonies on the vector-only ligation control plate by 10 fold
4.2.4.3 Cell Scraping and DNA Isolation
Three millilitres of L-Broth plus chloramphenicol (34 pglÍÐ was aliquoted onto each
successful ligation plate, and the cells were scraped off into the solution with a sterile glass
spreader. The solution was then transferred to a sterile 10 ml tube and DNA was isolated using
a Qiagen Tip-20 Q.2.1.3)
4.2.5Preparation of COS-7 Cells
The COS-7 cells were grown in supplemented DMEM media. The cells were passaged one day
prior to transfection by placing 8X10⁵ to 16X105 cells into 10 ml of supplemented DMEM in
7 5 crr? tissue culture flasks. This resulted in 40 to 600/o confluence the next day.
4.2.6Transfection of COS-7 Cells
Flasks were inspected for correct confluence and pSPL3B-CAM subcloned cosmid DNA was
transfected into the cells using the LIPOFECTACE reagent. DNA from I to 3 subcloned
cosmids was added to any one flask of cells per transfection. Briefly, in a sterile 10 ml tube,
500 pl of Opti-MEM 1 (OMI) medium was added to 1 ¡rg of each subcloned cosmid to be
transfected. In a 1.5 rnl eppendorf tube, 500 pl of OMI was added to 30 pl of LipofectACE
and left at room temperature for 5 minutes. This was then added to the 10 rnl tube above and
incubated for a further 10 minutes at room temperature. The supplemented DMEM media was
removed from the COS-7 cells and 10 ml of OMI was added to each flask. The cells were then
incubated for 5 minutes at 37"C in a 5o/o COz incubator. Four millilitres of OMI was then
125
added to each l0 ml tube containing the DNA/LipofectACE/OMI mix. The 10 ml of OMI
media from each flask of cells was removed, and the combined media above was then added to
the appropriate flask of cells. The cells were then incubated overnight at 37"C in a 5Yo COz
incubator. The next day, the lipid-DNA complexes were poured offfrom the COS-7 cells, and
10 rnl of supplemented DMEM was added. The cells were incubated for a further 48 hours at
37"C in a 5o/o COz incubator
4.2.7 Isolation of Cytoplasmic RNA from COS-7 Cells
All RNA isolation procedures were done using RNAse free conditions as described in 2.2.4.
The supplemented DMEM was removed from each flask and 10 ml of ice-cold PBS was added
and the flask was left on ice. The PBS was then removed and the wash step was repeated 2
more times. Ten millilitres of PBS was then added to the washed cells and they were removed
from the culture flask using a sterile plastic scraper (Costar). The cells were then transferred
into a sterile 10 ml tube, which was placed on ice. The cells were spun at 7,200 rpm for 5
minutes and the pellet was resuspended in 400 ¡rl of TKM and 1 ¡rl of RNAsin by gently
tapping the tube. After a 5 minute incubation on ice, 20 ¡tl of 10o/o Triton X-100 was then
added, followed by a further 5 minute incubation on ice. The mix was then spun at 1,200 rpm
for 5 minutes and the supernatant transferred to a 1.5 ml eppendorf tube on ice. Thirty
microlitres of 5Yo SDS was then added. This mix was phenoUchloroform extracted twice as
described in 4.2.2. Following this, the RNA was precipitated by the addition of 15 ¡rl of 5 M
NaCl and 900 pl of ethanol. This was held at -70"C for 30 minutes. The precipitated RNA was
spun at 13,000 rpm for 20 minutes and the pellet was washed in 1 ml of 75Yo ethanol. The
pellet was air-dried for 10 to 20 minutes and resuspended in 50 pl of DEPC-treated water. The
RNA was quantitated by spectrophotometry and a sample run on a 0.8o/o agarose gel to check
126
Chapter 4 I denti lì cati o n of Tran scr i b e d S e qu ence s qt I 6 ct 2 4. 3
the integrity of the RNA isolated
4.2.8 Reverse Transcription
Reverse transcription of RNA isolated from COS-7 cells Ìvas as described in 2.2.15.1.
However, the primer used for reverse transcription was the pSPL3B-CAM specific primer,
SA2. ThesequenceofthisprimerisshowninTable2.l. Onemicrolitre of a20 pMstockof
this primer was used. After a 30 minute incubation at 42"C with the Superscript enzyme, the
samples were heated to 55'C for l0 minutes. One microlitre (2 units) of RNAseH was then
added and the tubes were incubated for a further l0 minutes at 55"C. Products were stored at -
20'C whilst not in use.
4.2.9 P rimary PCR Ampliflrcation
Eight microlitres of the reverse transcription reaction were incubated with 4 prl of 10X PCR
buffer, 0.8 ¡rl of l0 mM dNTPs, 1.2 ¡rl of 50 mM MgCl2, 2 p"l each of a 20 pM stock of
oligonucleotides SA2 and SD6 (primer sequences are shown in Table 2.1), and made up to a
volume of 39.5 pl with sterile water. The components were mixed and a drop of paraffin oil
was added. After heating the tubes at 94"C for 5 minutes, the tubes were held at 80'C while
0.5 pl (2.5 units) of Tøq DNA polymerase was added. The tubes were then incubated aI94'C
for 1 minute, 60oC for I minute, T2oC for 5 minutes for 6 cycles, followed by a 10 minute
incubation at 72"C. To prevent the amplification of false-positive (vector-only) products in
subsequent PCR reactions, 2.5 ¡tl (25 units) of Bsl)([ was added to the PCR reaction and
incubated overnight at 55oC. The following day, a further 0.5 pl (5 units) of ,BslXI was added
to each tube and incubated for a further 2 hours at 55"C.
127
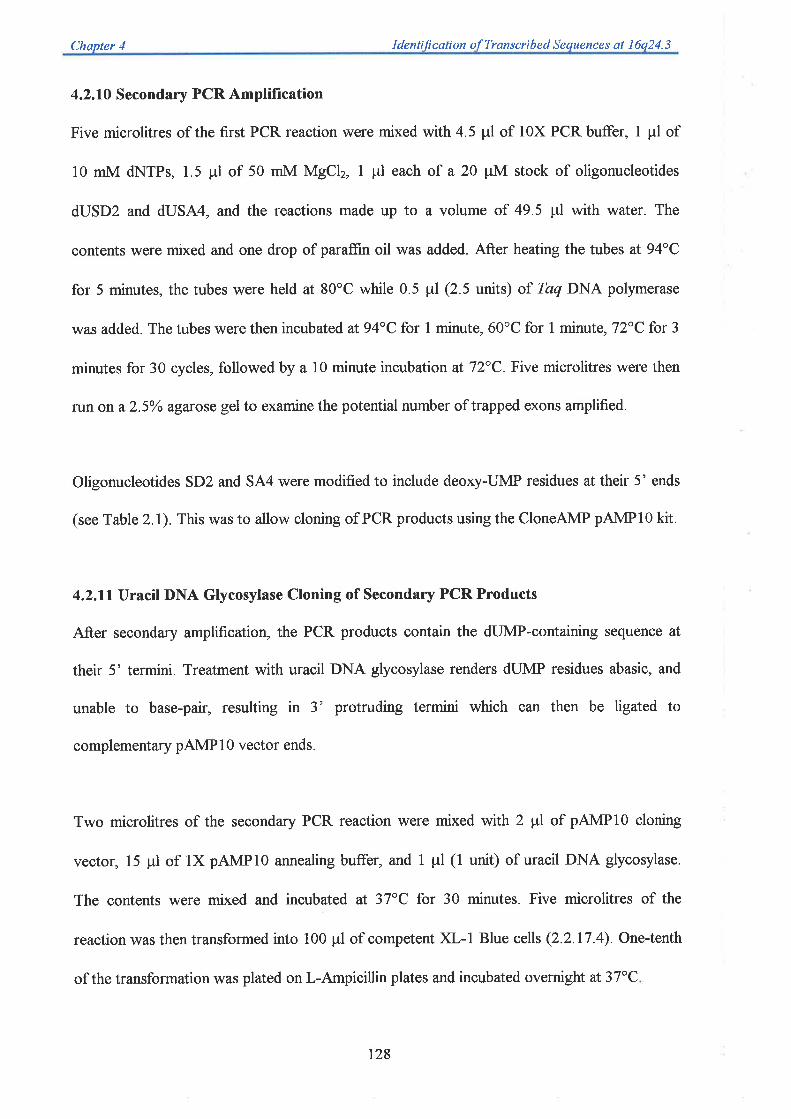
Chapter 4 Identilì cation of Transcribed Sequences at I 6s 2 4. 3
4.2.10 Secondary PCR Amplification
Five microlitres of the first PCR reaction were mixed with 4.5 ¡rl of 10X PCR buffer, I ¡rl of
10 mM dNTPs, 1.5 pl of 50 mM MgClr, I þl each of a 2O ¡tl[i{ stock of oligonucleotides
dUSD2 and dUSA4, arrd the reactions made up to a volume of 49.5 pl with water. The
contents were mixed and one drop of paraffin oil was added. After heating the tubes at 94'C
for 5 minutes, the tubes were held at 80'C while 0.5 ¡rl (2.5 units) of Taq DNA polymerase
was added. The tubes were then incubated at 94"C for I minute, 60oC for I minute,72"C lor 3
minutes for 30 cycles, followed by a 10 minute incubation at 72"C. Five microlitres were then
run on a2.5Yo agarose gel to examine the potential number of trapped exons amplified.
Oligonucleotides SD2 and SA4 were modified to include deoxy-UMP residues at their 5' ends
(see Table 2.1). This was to allow cloning of PCR products using the CloneAMP pAMP10 kit.
4.2.11Uracil DNA Glycosylase Cloning of Secondary PCR Products
After secondary amplification, the PCR products contain the dUMP-containing sequence at
their 5' termini. Treatment with uracil DNA glycosylase renders dUMP residues abasic, and
unable to base-pair, resulting in 3' protruding termini which can then be ligated to
complementary pAMP1O vector ends.
Two microlitres of the secondary PCR reaction were mixed with 2 ¡tl of pAMPlO cloning
vector, 15 pl of lX pAMPlO annealing buffer, and I ¡rl (1 unit) of uracil DNA glycosylase.
The contents were mixed and incubated at 37oC for 30 minutes. Five microlitres of the
reaction was then transformed into 100 pl of competent XL-l Blue cells Q.2.17.4). One-tenth
of the transformation was plated on L-Ampicillin plates and incubated overnight at37"C
t28

Chapter 4 Identification ofTranscribed Sequences at 16q24.3
4.2.12 Exon Confirmation
Colony PCR using pAMP1O specific primers was used to determine the size of the products
trapped. Clones were grouped according to size and a representative clone from each group
was chosen for further analysis. All clones with an insert size of 409 bp (determined by colony
PCR) were omitted from further analysis as they represented products generated from vector-
only clones containing no insert.
4.2.12.1 Colony PCR
Recombinant colonies were picked with a sterile pipette tip, streaked on a master plate for later
use, and the tip placed in a PCR tube containing a drop of oil. The colony PCR procedure was
identical to that described ir 2.2.74.2,Lhe only variation was the number of colonies analysed
and the primers used in the PCR. For an exon trap involving 1 cosmid, 24 colonies were
analysed, for a 2 cosmid trap, up to 90 colonies were analysed, and for a 3 cosmid trap, up to
135 colonies were analysed. The primers used for the colony PCR were PucF and PucR with
their sequence shown in Table 2.1.
4.2.12.2 DNA Isolstion and Sequence Analysis
Clones selected for further analysis were grown in 20 ml of L-Broth plus ampicillin (100
pglnrl) and DNA was isolated using Qiagen Tip-20 columns (2.2.I3). The trapped products
were sequenced using DyePrimer F and R sequencing kits (2.2.18.2). As the amplified trapped
products were cloned non-directionally into pAMP10, the DNA sequence obtained was aligned
in the sense orientation, and the vector sequences were removed. This left sequence
corresponding to the trapped product alone.
t29

Chapter 4 ences at l6q24.j
4.2.12.3 Physicøl Mapping of Trøpped Products
The inserts of trapped products were removed from their vector with a NotUSalI double
digest. The digests were run on a 2.5o/o agarose gel and inserts were cut directly out of the
agarose, labelled with 32P, and used as probes on Southern blots containing cosmid DNA from
which the product was originally trapped.
4. 2. 1 2. 4 Database Homology Searches
The BLASTN program (Altschul et al., 1997) was used to search for nucleotide sequence
homology between the trapped products and sequences in the GenBank non-redundant and
EST databases (http://www.ncbi.nlm.nih.gov/index.html). In the majority of cases, the critical
P value indicating significant homology was taken to be <10r (1.0e-5). To reveal any open
reading frames within the sequences of the trapped products, the Applied Biosystems SeqEd
(version 1.0.3) software was used.
4.2.13 Analysis of the Human Gene Map
The Human Gene Map published in October 1996 was analysed with the microsatellite marker
D16S520 and the telomere of the long arm of chromosome 16 defining the genetic interval to
be searched (http://www.ncbi.nlm.nih.gov/index.htrnl) The D165520 marker has been
physically mapped (Callen et al., 1995), and lies 2 cytogenetic intervals proximal to the FAA
and critical LOH region (see Figure 1.3). Identified oDNA clones not homologous to exons
already trapped or to cDNA clones identified through cosmid sequencing, were mapped by
Southern hybridisation to DNA from cosmids within the contig or to somatic cell hybrid DNA
Q.2.13.1). In some cases, PCR amplification from somatic cell hybrid DNA using primers
corresponding to the oDNA clone was done (2.2.14.1). The availability of the GeneMap'98
(http://www.ncbi.nlm.nih.gov/genemapl) towards the end of this study provided additional
130
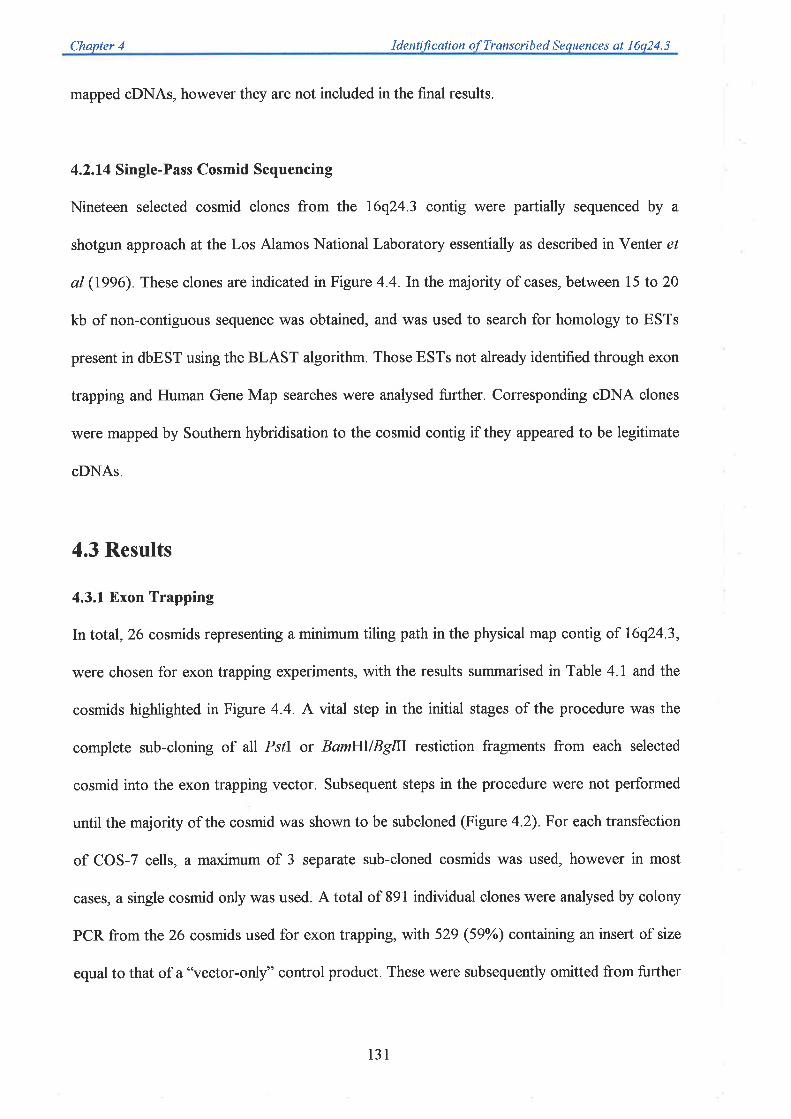
Chapter 4 I d enti /i c ati on of Tran scri b e d Se q ue nce s at I 6 q 2 4. 3
mapped cDNAs, however they are not included in the final results.
4.2.14 Single-Pass Cosmid Sequencing
Nineteen selected cosmid clones from the 16q24.3 contig were partially sequenced by a
shotgun approach at the Los Alamos National Laboratory essentially as described in Venter e/
al (1996). These clones are indicated in Figure 4.4. ln the majority of cases, between 15 to 20
kb of non-contiguous sequence was obtained, and was used to search for homology to ESTs
present in dbEST using the BLAST algorithm. Those ESTs not already identified through exon
trapping and Human Gene Map searches were analysed further. Corresponding cDNA clones
were mapped by Southern hybridisation to the cosmid contig if they appeared to be legitimate
cDNAs.
4.3 Results
4.3.1 Exon Trapping
In total, 26 cosmids representing a minimum tiling path in the physical map contig of 16q24.3,
were chosen for exon trapping experiments, with the results summarised in Table 4.1 and the
cosmids highlighted inFigure 4.4. A vital step in the initial stages of the procedure was the
complete sub-cloning of all PslI or BamfIIlBglII restiction fragments from each selected
cosmid into the exon trapping vector. Subsequent steps in the procedure were not performed
until the majority of the cosmid was shown to be subcloned (Figure 4.2). For each transfection
of COS-7 cells, a maximum of 3 separate sub-cloned cosmids was used, however in most
cases, a single cosmid only was used. A total of 891 individual clones were analysed by colony
PCR from the 26 cosmids used for exon trapping, with 529 (59%) containing an insert of size
equal to that of a'Tector-only'' control product. These were subsequently omitted from further
131
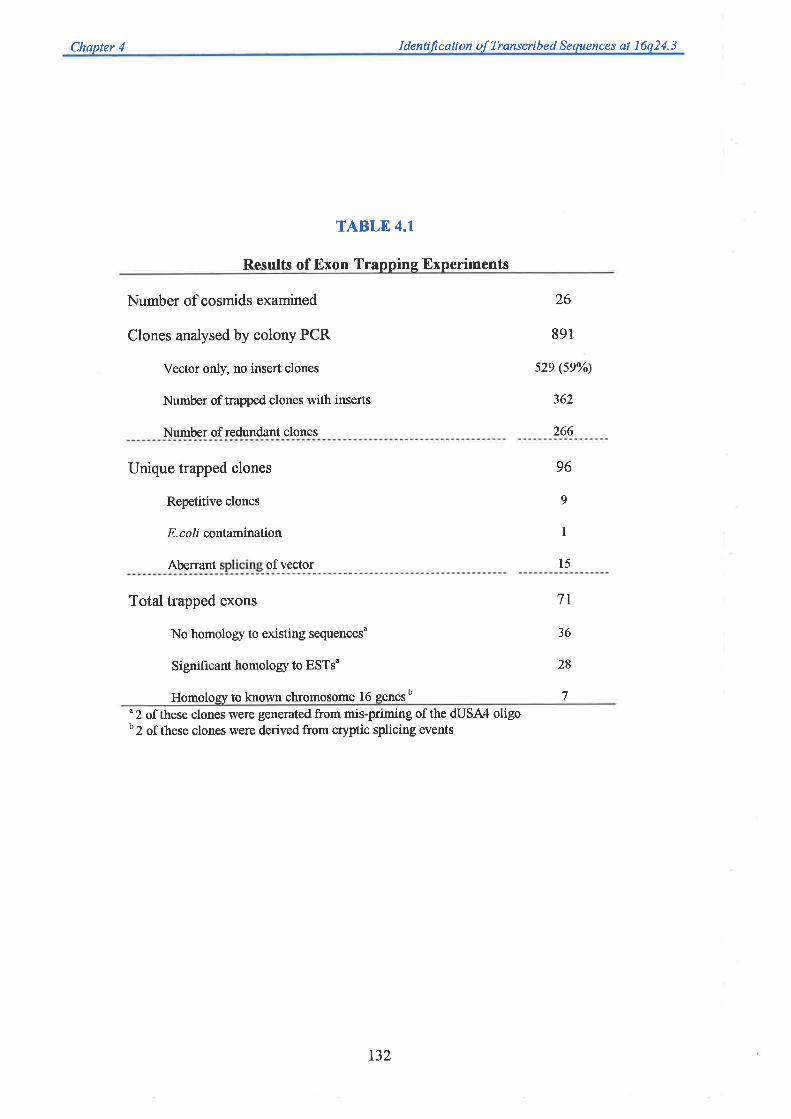
Chapter 4 I denti./ì ca ti on of Transcri b e d Sequences øt 16s24.3
TABLD 4.1
Results of Exon Trapping Experiments
Number of cosmids examined
Clones analysed by colony PCR
Vector only, no insert clones
Number of trapped clones with inserts
Number of redundant clones
26
891
s2e (sew
362
266
Unique trapped clones
Repetitive clones
E.coli contanination
Aberrant
96
15
9
1
ofvector
Total trapped exons
No homolory to existing sequencesu
Significant homolory to ESTs"
7t
36
28
7Homology to known chromosome 16 genesbu 2 of these clones were generated from mis-priming of the dUSA4 oligoo 2 of these clones were derived from cryptic splicing events
132

t2 3456ÈÈ(t)È(t) ABÄBABABABAB
Kb Kb
8.s17.3
8.51
.35
6.114.84
3.59
2.8t
6.114.84
3.59
2.81
1.95
1.861.51
r.39
1.160.98
0.72
1.95
1.861.51
t.39
1.160.98
0.72
Ç-* {FEïriË
-t**Ç
-r*r:*t-ËtltFÈ
. t +è :ia;
ü-
r- *Õ
8È*
rif5¡Ë
G
-
Figure 4.2: Subcloning of PstI digested cosmids into the pSPL3B-CAM exon trapping vector.In each case lane A represents the original cosmid digested with Psfl, while lane B represents aPsd digest of the same cosmid that has been subcloned into the tapping vector. In most cases,
each restriction fragment is represented by a pSPL3B-CAM subclone, indicating success of theinitial stages of the happing procedure. Cosmid 1: 431F1; 2: 354812;3:427Bll;4: 410H4;5;42184;6: 371D5. Green dots represent the linearised exon trapping vector.
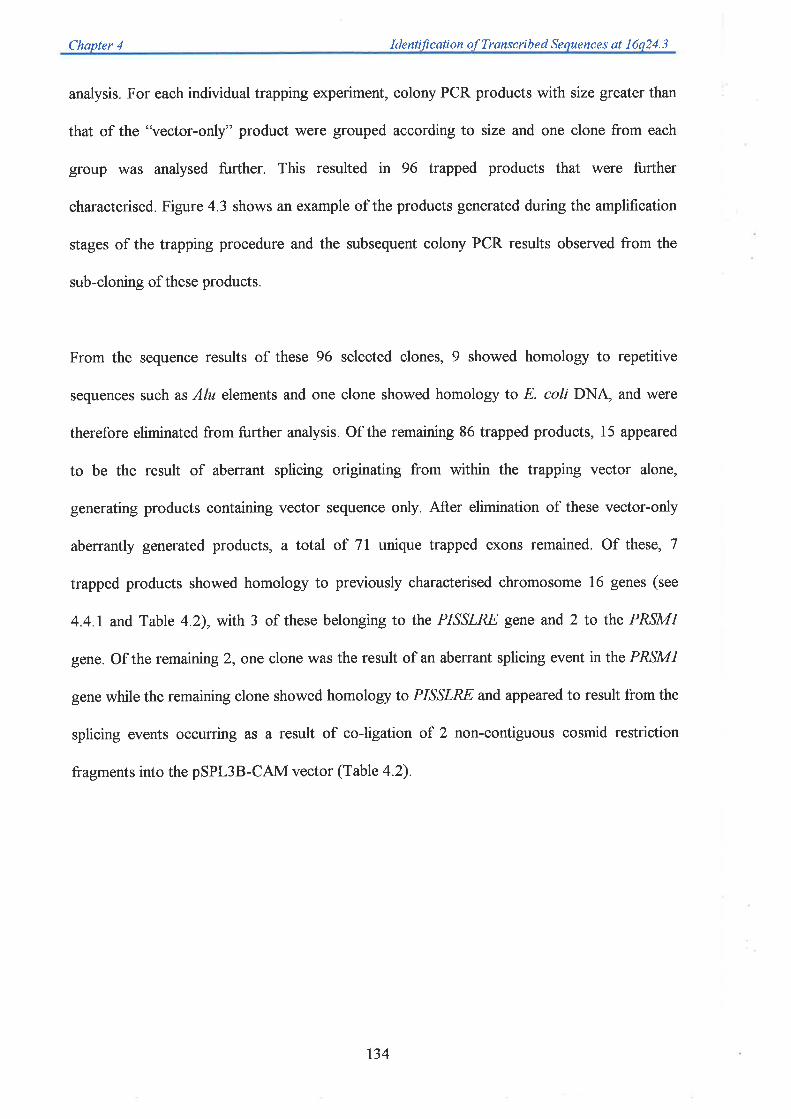
Chapter 4 I denti fi cati on of Transcri b e d Se quence s at I 6q 2 4. 3
analysis. For each individual trapping experiment, colony PCR products with size greater than
that of the 'lector-only" product were grouped according to size and one clone from each
group was analysed further. This resulted in 96 trapped products that were further
characterised. Figure 4.3 shows an example of the products generated during the amplification
stages of the trapping procedure and the subsequent colony PCR results observed from the
sub-cloning of these products.
From the sequence results of these 96 selected clones, 9 showed homology to repetitive
sequences such as Alu elements and one clone showed homology to E. coll DNA, and were
therefore eliminated from fuither analysis. Of the remaining 86 trapped products, 15 appeared
to be the result of aberrant splicing originating from within the trapping vector alone,
generating products containing vector sequence only. After elimination of these vector-only
aberrantly generated products, a total of 7l unique trapped exons remained. Of these, 7
trapped products showed homology to previously characterised chromosome 16 genes (see
4.4.1 and Table 4.2), with 3 of these belonging to the PISSLRE gene and 2 to the PRSMI
gene. Of the remaining 2, one clone was the result of an aberrant splicing event in the PRSMI
gene while the remaining clone showed homology to PISSLRE and appeared to result from the
splicing events occurring as a result of coJigation of 2 non-contiguous cosmid restriction
fragments into the pSPL3B-CAM vector (Table 4.2).
734
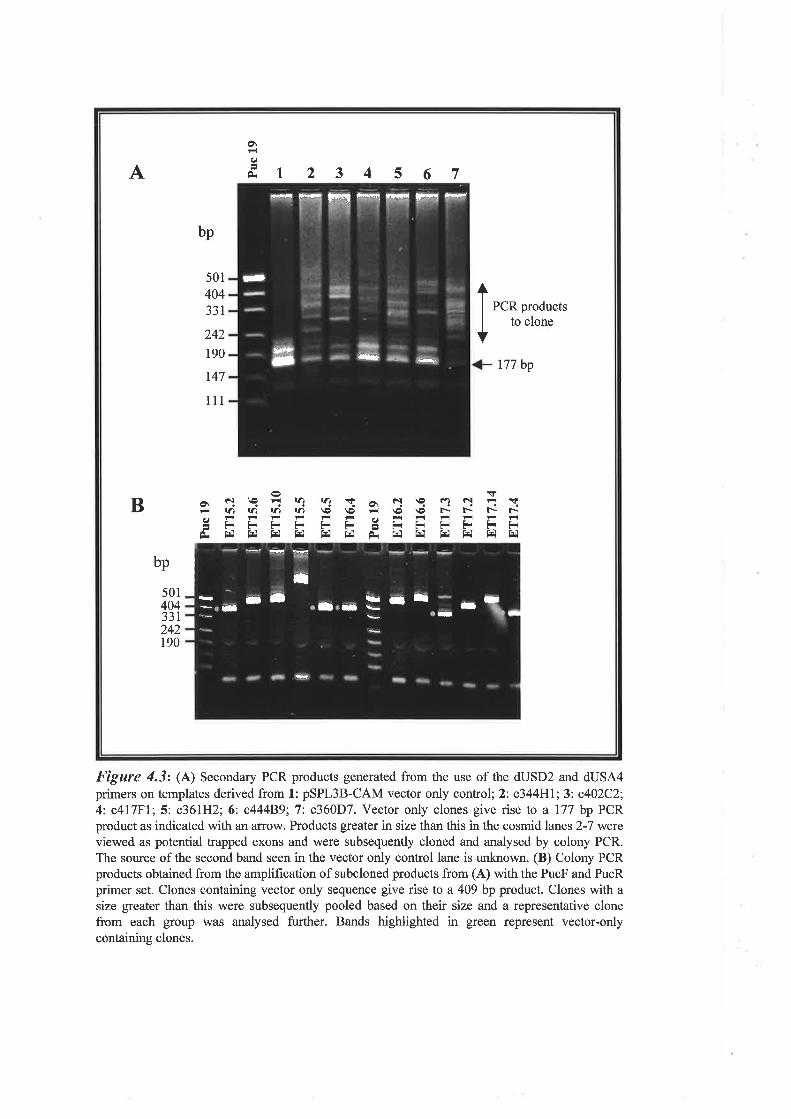
o\a
oçr\¡ \O Ê la¿ |1r¡ s ôt \Þ (l ôl F tt
ti ìÔ lf) ln iñ \O \Þ t-{ \ê \Þ Ì* F- F- ¡-.r F F F F F
- '\ F F F F F F
=------=------ó t¡l t¡J kl td ÊJ [r) õ r¡J r¡J EJ lrJ Ê] t¡J
A
B
l2 3 4 5 67
bp
501
404331
242
190
r47
lll
PCR productsto clone
177 bp
bp
501404331242190
H Fld Fqq -q r!!É iFri ãrr
*r.il*
a)
{rÉPÕ
r'r:'-
rd-E
¡-
ã
tIr-- tl.-,Õ
Figure 4.32 (l) Secondary PCR products generated from the use of the dUSD2 and dUSA4primers on templates derived from 1: pSPL3B-CAM vector only control; 2: c344Hl;3: c402C2;4: c4l7Fl;5: c361H2;6: c44489;7: c360D7. Vector only clones give rise to a 177 bp PCRproduct as indicated with an alrow. Products greater in size than this in the cosmid lanes 2-7 wereviewed as potential trapped exons and were subsequently cloned and analysed by colony PCR.The source of the second band seen in the vector only control lane is unknown. (B) Colony PCRproducts obtained from the amplification of subcloned products from (A) with the PucF and PucRprimer set. Clones containing vector only sequence give rise to a 409 bp product. Clones with asize greater than this were subsequently pooled based on their size and a representative clonefrom each group was analysed further. Bands highlighted in green represent vector-onlycontaining clones.
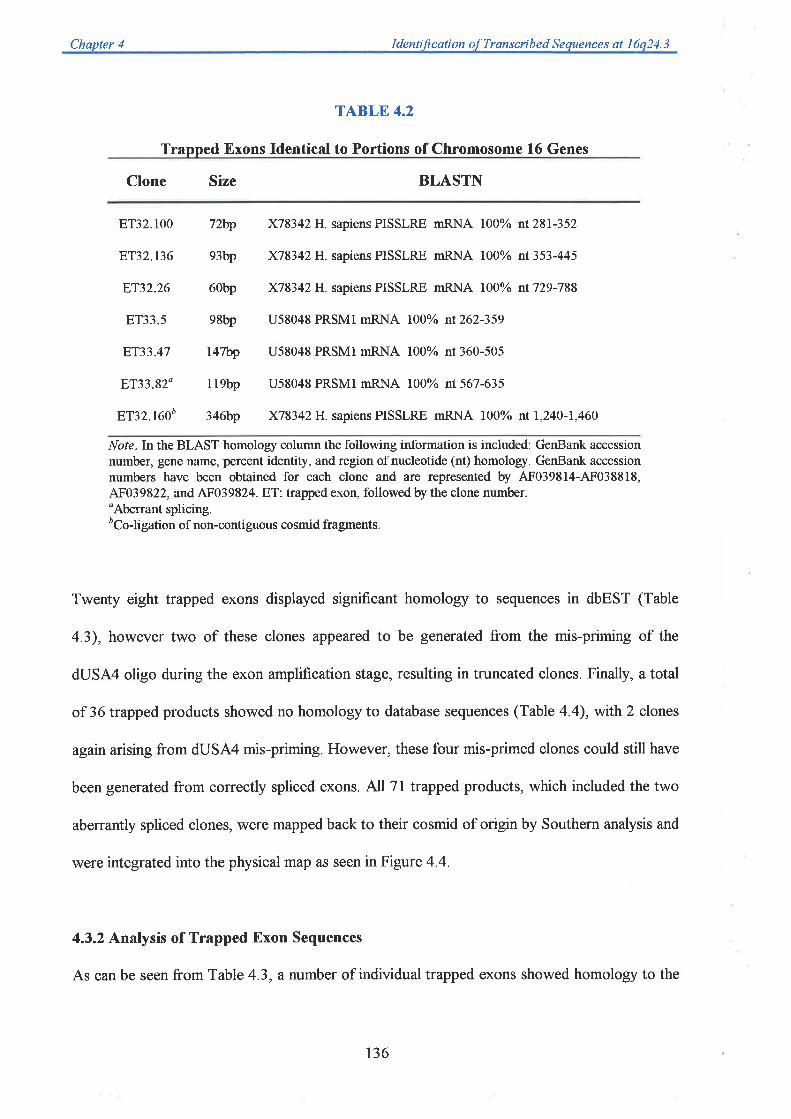
Chapter 4 IdentiJication of Transcri b ed Se quences at I 6q24. 3
TABLE 4.2
Trapped Exons Identical to Portions of Chromosome 16 Genes
Clone Size BLASTN
ET32.100
8T32.136
8T32.26
ET33.5
8T33.47
8T33.82"
ET32.t60b
72bp
93bp
6Obp
98bp
r47W
119bp
346bp
X78342 H. sapiensPISSLRE mRNA I0O%o nt28l-352
X78342 H. sapiens PISSLRE mRNA 100% nt 353-445
X18342 H. sapiens PISSLRE mRNA l00o/o nt729-788
U58048 PRSMI mRNA 100% nt 262-359
U58048 PRSMI mRNA 100% nt 360-505
U58048 PRSMI mRNA 100% nt 567-635
X78342 H. sapiensPISSLRE mRNA 100% nt I,240-1,460
Note.In the BLAST homology column the following information is included: GenBank accessionnumber, gene name> percent identity, and region of nucleotide (nt) homology. GenBank accessionnumbers have been obtained for each clone and are represented by 4F039814-4F038818,AF039822, and 4F039824. ET: trapped exon, followedby the clone number.oAberrant splicing.åCo-ligation of non-contiguous cosmid fragments.
Twenty eight trapped exons displayed significant homology to sequences in dbEST (Table
4.3), however two of these clones appeared to be generated from the mis-priming of the
dUSA4 oligo during the exon amplification stage, resulting in truncated clones. Finally, a total
of 36 trapped products showed no homology to database sequences (Table 4.4),with 2 clones
again arising from dUSA4 mis-priming. However, these four mis-primed clones could still have
been generated from correctly spliced exons. Nl Tl trapped products, which included the two
aberrantly spliced clones, were mapped back to their cosmid of origin by Southern analysis and
were integrated into the physical map as seen in Figne 4.4.
4.3.2 Analysis of Trapped Exon Sequences
As can be seen from Table 4.3, a number of individual trapped exons showed homology to the
736
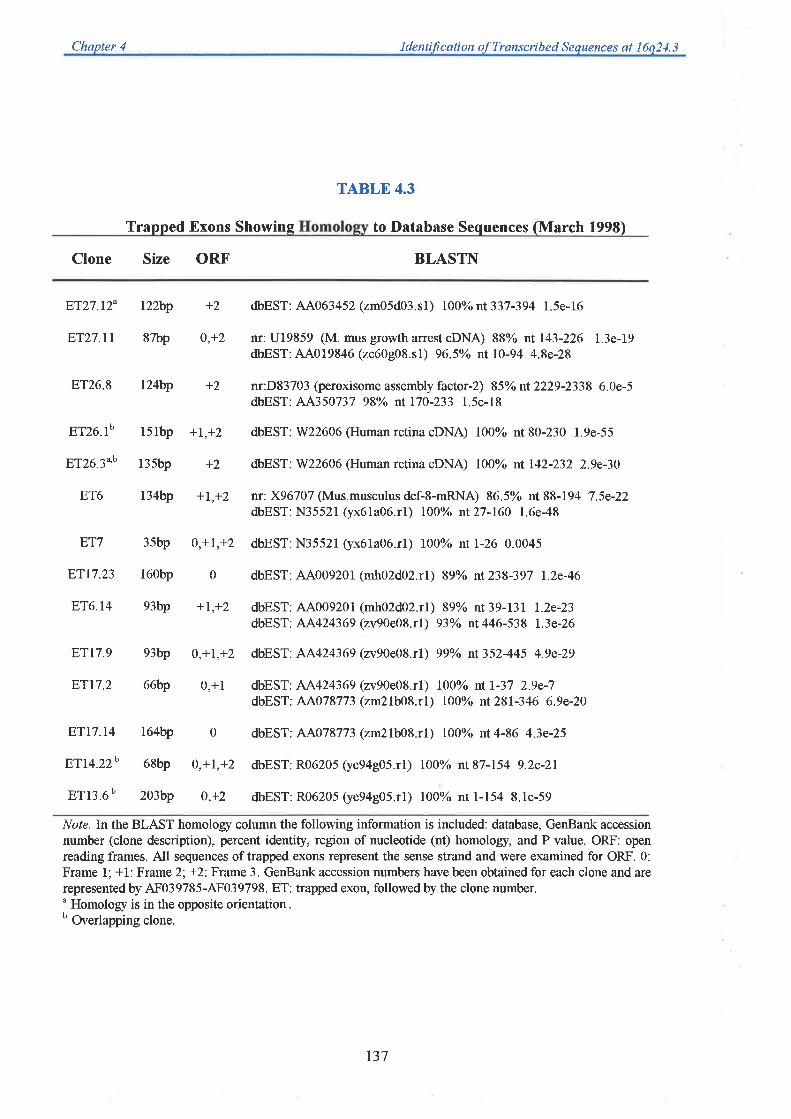
Chapter 4 I denti fr cati on of Transcri b e d Se que n ce s at I 6q 2 4, 3
TABLE 4.3
Trapped Exons Showing to Database Sequences (March 1998)
Clone Size ORF BLASTN
ET27.t2^
ET27.II
ET26.f
ET2634b
ET6
t22bp
87bp
l5lbp
135bp
t34bp
0,+2
+L,+2
+2
+1,+2
0,+1,+2
0
+1,+2
0,+I,+2
0,+1
0
0,+1,+2
o,+2
+2 dbEST: 1111063452 (zm05d03.sl) 100% nt 337 -394 1.5e-16
nr: U19859 (M. mus growth arrest cDNA) 88% nt 143-226 l.3e-19dbEST:44019846 (ze60g08.sl) 96.50/0 nt 10-94 4.8e-28
nr:D83703 (peroxisome assembly factor -2) 85%ó nt 2229 -2338 6.0e-5dbEST: 1'1.350737 98% nt 170-233 1.5e-18
dbEST:W22606 (HumanretinacDNA) l00o/o nt 80-230 l.9e-55
dbEST: W22606 (Human retina cDNA) I0Oo/o nt 142-232 2.9e-30
nr:X96707 (Mus.musculus def-8-mRNA) 865yo nt 88-194 7.5e-22dbEST: N35521 (yx6la06.r1) 100% nt 27-160 1.6e-48
dbEST:N35521 $x61a06.r1) 100% nt l-26 0.0045
dbEST: 44009201 (mh02d02.rl) 89% nt 238-397 I.2e-46
dbEST: 44009201 (mh02d02.r1) 89% nt 39-131 l.2e-23dbEST:
^4424369 (2v90e08.r1) 93%o nt446-538 l.3e-26
dbEST: ^A424369
(2v90e08.r1) 99o/o nt352-445 4.9e-29
dbEST: N\424369 (2v90e08.r1) 100% nt I-37 2.9e-7dbEST: 44078773 (zm21b08.rl) 100% nt 281-346 6.9e-20
dbEST: A.1i078773 (zm21b08.rl) 100% nt 4-86 4.3e-25
dbEST:R06205 (ye94g05.r1) 100% nt 87-154 9.2e-21
dbEST: R06205 (ye94g05.rl) 100% nt 1-154 8.1e-59
8T26.8 l24bp +2
ET7
ETI7.23
ET6.t4
ETI7.9
E"rn.2
E'rn.ru
ETr4.22h
ET13.6b
35bp
160bp
93bp
93bp
66bp
t64bp
68bp
203bp
Note.Inthe BLAST homology column the following information is included: database, GenBank accessionnumber (clone description), percent identity, region of nucleotide (nt) homology, and P value. ORF: openreading frames. All sequences of trapped exons represent the sense strand and were examined for ORF. 0:
Frame l; +1: Frame 2; +2:Frame 3. GenBank accession numbers have been obtainedfor each clone andarerepresented by 4F039785-4F039798. ET: trapped exon, followed lry the clone number.
" Homolory is in the opposite orientation.b Overlapping clone.
737

Chapter 4 I denti /ì cati o n o f Transcri b e d Se qu e n ce s at I 6 q 2 4. 3
TABLE 4.3 (Cont.)
Traoped Exons Showins to Database Sequences (March 1998)
Clone Size ORF BLASTN
ETT3.2
ETls.24
ET19
ETt5.22
ETl5.l0
ET15.5
ET3.5
ET2.I
8T2.5
23Ûbp
109bp
258bp
13 lbp
l04bp
466bp
0,+2
+1,+2
+l
0,+3
+l
none
8T3.25 276bp 0
ET2.8 103bp
229bp
8T24.35
8T33.6"
93bp
158bp
85bp
19rbp
o,+1,+2
0
+1
none
dbEST: 44064599 (zm13c09.rl) 97% nt 1-149 7.4e-51
dbEST:R07213 (yfl4a03.rl) l00o/o nt 87-I94 8.0e-34
dbEST: R072I3 $fi4a03.rl) 97o/o nt l-86 9.5e-26
dbEST: R07213 (yf14a03.r1) 98%;o nt 195-256 3e-22
dbEST: R6 16 18 (yh09a04.rl) I00%o nt 143 -219 l.6e-24
dbEST: R07162 (yfi4aO3.sl) 99Yo nt7-204 le-105dbEST:R61618 (yh09a04.rl) 97Vo nt 380-419 8e-11
dbEST: 239757 (clonec-1ih04) 98Vo nt30-122 l.3e-32
rtt:U83246 (human copine I mRNA) 65Yo nt 1018-1149 3.3e-lldbEST: F05508 (clone c-0dc06) 77% ntTO-214 1.3e-28
nr: U83246 (human copine I mRNA) 54%ó nt 694-861 0.044dbEST: 241974 (clone c-04fl5) 65yo nt 15-170 3.9e-15
dbEST: C15128 (human fetal brain cDNA) 90o/o nt ll0-212 5.Ie-32
dbEST: AAO237I5 (mh78alO.rl) 89% nt 108-336 7.le-73dbEST: D63 198 (Hum505B01B) 96yo nt 176-300 l. 1e-43
dbEST: A.^027336 (ze97gll.sI) 100% nt 49-130 2.6e-25
nr: 4C002479 (human BAC clone) 90Yo nt 3905-4000 2.3e-I0dbEST: W81593 (zd88g02.rl) 77Yo nt 165-248 1.9e-1 1
dbEST: AAO237I5 (mh78a10.rl) 86% nt37l-449 5.3e-17
0
0
ET34.l" l09bp 0
Note. lnthe BLAST homolog¡r column the following information is included: database, GenBank accessionnumber (clone description), percent identity, region of nucleotide (nt) homology, and P value. ORF: openreading frames. All sequences of trapped exons represent the sense strand and were examined for ORF. 0:
Frame 1; +1: Frame 2; +2:Frame 3. GenBank accession numbers have been obtained for each clone and are
representedby 4F039799-4F039807,4F039812, 4F039813, and 4F039819-4F039821. ET: trapped exon,followed by the clone number.' Due to mis-priming of the dUSA4 primer during exon amplification.
138
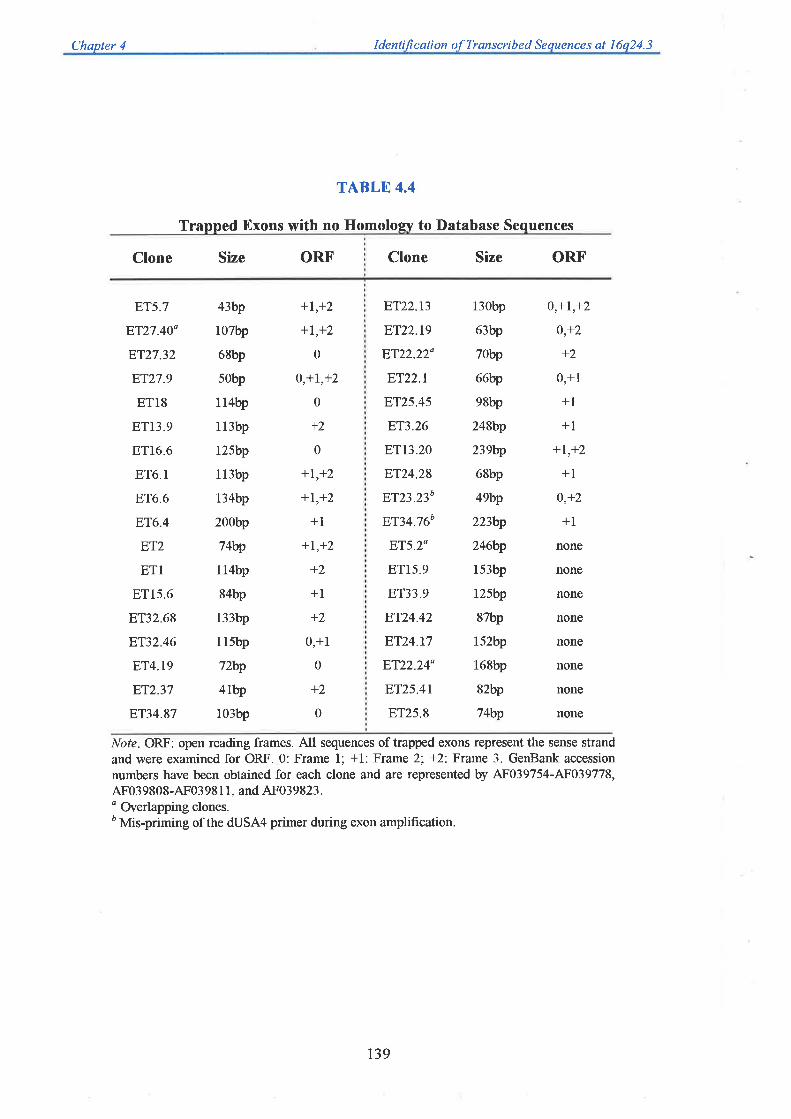
Chapter 4 I den ti fì c ati on of Transcr i b e d Se qu ence s at I 6 a 2 4. 3
TABLE 4.4
Trapped Exons with no Homolow to Database Sequences
Clone Size ORF Clone Size ORF
E'rs.7
8T27.40"
8T27.32
8T27.9
ET18
ET13.9
trT16.6
ET6.1
ET6.6
8T6.4
ET2
ETl
ET1s.6
8T32.68
8T32.46
ET4.19
8T2.37
8T34.87
43bp
107bp
68bp
5Obp
114bp
113bp
12Sbp
113bp
134bp
200bp
74bp
114bp
84bp
133bp
I 15bp
72bp
4lbp
l03bp
+I,+2
+1,+2
0
0,+I,+2
0
+2
0
+L,+2
+I,+2
+l+I,+2
+2
+l+2
0,+1
0
+2
0
ET22.t3
ET22.I9
E't22.22'
ET22.l
ETzs.45
8T3,26
ETL3.2O
8T24.28
8T23.23b
FT34.76b
FTs.2'
ET15.9
ET33.9
8T24.42
ET24.t7
8T22.24'
ET25.4t
ET25.8
13Obp
63bp
70bp
66bp
98bp
248bp
239bp
68bp
49bp
223bp
246bp
l53bp
125bp
87bp
Is2bp
168bp
82bp
74bp
0,+1,+2
0,+2
+2
0,+1
+1
+l+1,+2
+l
0,+2
+l
none
none
none
none
none
none
none
none
Nofe. ORF: open reading frames. All sequences of trapped exons represent the sense strandand were examined for ORF. 0: Frame 1; +1: Frame 2; +2'. Frame 3. GenBank accession
numbers have been obtained for each clone and are represented by 4F039754-4F039778,4F039808-4F03981 l, and 4F039823." Overlapping clones.å Mis-priming of the dUSA4 primer during exon amplification.
t39

same ESTs. This enabled some of the exons to be placed into tentative transcription units
based on their homology to identical cDNAs. The first example is the group of exons
comprising ETl7.23lET6.l4lETl7.9lETl7.2lET17.74 Ihat could be linked together based on
three overlapping oDNA clones (Genome Systems clones mh02d02,2v90e08, and zm2lb08).
In addition,ETIT .9 and ET6. 14 appear to be adjacent exons based on the homology observed
with the zv90e08 oDNA clone. The trapped exons ET6 and ET7 could also be linked based on
a common homology to the oDNA clone yx6la06. Again, these trapped products appear to be
adjacent exons ofthis cDNA.
Both ET2.1 and 8T3.25 showed 65 and 54Yo homology, respectively, to the human copine I
mRNA (unpublished reference in GenBank) and to a number of EST clones in dbEST. One of
these cDNAs (y170c06) belongs to a contig of sequences present in the TIGR database
(http://www.tigr.orgltigr home/tdb/), THC126737. A clone from this contig (ym60b12)
however, could not be mapped to the cosmid contig ai. 16q24.3 by Southern hybridisations.
Using this clone as a probe for FISH to metaphase chromosomes showed signals at both 3q21
and 16q24.3 (data of Elizabeth Baker). This suggests that the oDNA clones belonging to
THCL26737 are part of the copine I gene, which maps to chromosome 3q21, whereas exons
ET2.l andBT3 .25 are part of a closely related gene at 76q24.3 .
There were a number of examples of exons overlapping with each other. The trapped exon
ETl4.22 was contained within the last 68 base pairs of ET13.6, suggesting the latter trapped
product contained at least 2 oontiguous exons of a transcript simultaneously trapped from a
single genomic cosmid fragment. Similarly, the 70 base pair exonBT22.22 is contained within
the 168 base pair exon 8T22.24. There were two instances where clones overlapped each
other but were trapped from opposite strands of DNA (ET26.llET26.3 andET5.2lET27.40),
740

Chapter 4 I denti lì cati on of Tran scri b e d Se quences at I 6q 2 4. 3
and one instance where two non-overlapping trapped products identified a coflrmon oDNA
clone, however again, one appeared to be trapped from the opposite strand (ET2.5 and
8T34.1). The remaining trapped products presented in Table 4.3 identified unique EST
homology and therefore probably represent individual genes. In total, 15 separate novel
transcripts can be identified based on EST homologies in dbEST, which map to the cosmid
contig.
Table 4.4 indicates that 36 trapped products did not show homology to sequences in available
databases. These may represent exons that belong to the 5' portions of the transcripts
identified above, or may themselves belong to genes not yet represented by ESTs in dbEST.
Given that 28 of them have open reading frames (ORF), the chances that they do represent real
exons is encouraging. Those clones without ORFs, are likely to result from splicing events
occurring within non-coding genomic DN,\ or may represent non-coding exons present in the
3' or 5'untranslated regions ofgenes.
4.3.3 Cloning of the FAA Gene
4.3.3.1 ldentiftcøtion of cDNA Clones Homologous to Trøpped Exons
Another large group of trapped products that could be linked based on their EST homologies
was ET15.24lETl9lET75.22lETl5.10 and ETl5.5. The cDNA clones that these exons had in
coÍrmon were yfl4a03, and yho9a}4, the latter of these being one of the initial EST markers
used for physical map construction. The yh09a04 clone was originally identified by direct
cDNA selection with a cosmid overlapping with c36lH2, and subsequently sequenced by Dr.
Sinoula Apostolou. She also sequenced the yfl4a03 clone and together showed that these
cDNAs contained 2,140 base pairs. From sequence alignments, the trapped exon ETl9
overlapped with the 5' end of this combined sequence by 87 base pairs, thus extending it a
741
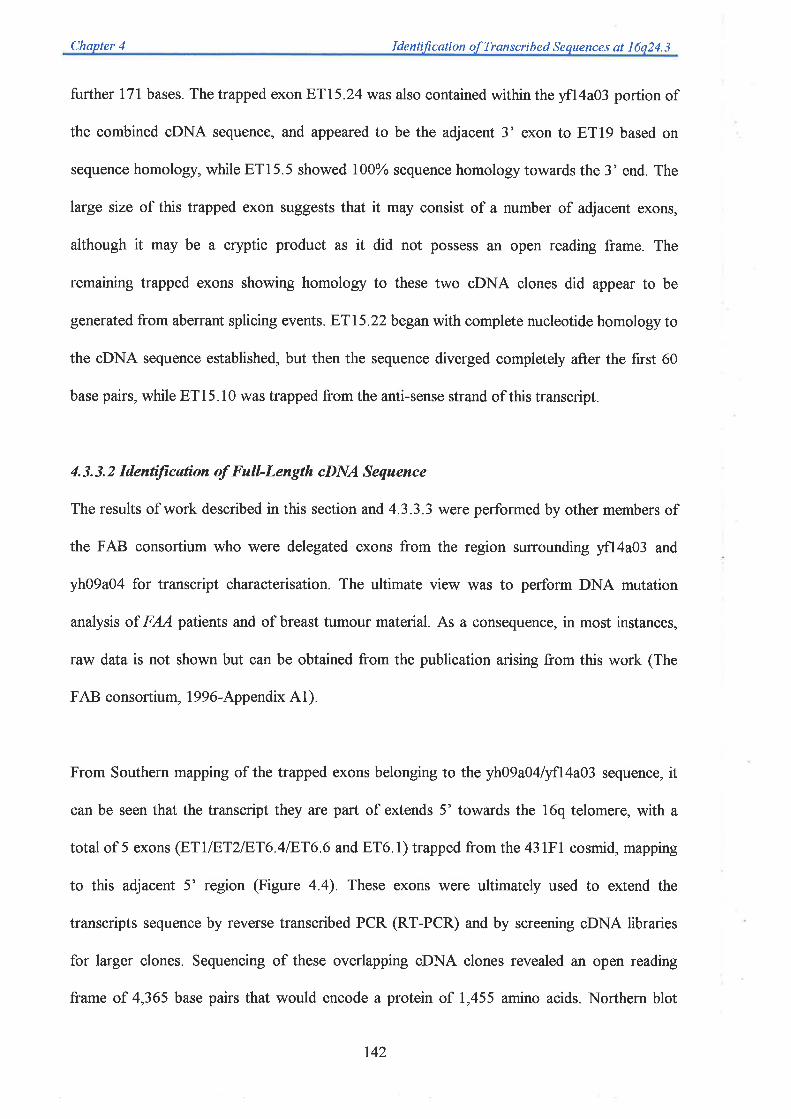
Chapter 4 Identi/ìcøtion of Transcribed Sequences at I 6s24. 3
further 171 bases. The trapped exon ETls.24 was also contained within the yfl4a03 portion of
the combined oDNA sequence, and appeared to be the adjacent 3' exon to ET19 based on
sequence homology, while 8T15.5 showed l00Yo sequence homology towards the 3' end. The
large size of this trapped exon suggests that it may consist of a number of adjacent exons,
although it may be a cryptic product as it did not possess an open reading frame. The
remaining trapped exons showing homology to these two cDNA clones did appear to be
generated from aberrant splicing events. ETls.22 began with complete nucleotide homology to
the oDNA sequence established, but then the sequence diverged completely after the first 60
base pairs, while ET 1 5 . I 0 was trapped from the anti-sense strand of this transcript.
4.3.3.2 Identiftcatíon of Full-Length cDNA Sequence
The results of work described in this section and 4.3.3.3 were performed by other members of
the FAB consortium who were delegated exons from the region surrounding yfl4a03 and
yh}9a04 for transcript characterisation. The ultimate view was to perform DNA mutation
analysis of FAA patients and of breast tumour material. As a consequence, in most instances,
raw data is not shown but can be obtained from the publication arising from this work (The
FAB consortium, 1996-Appendix A1).
From Southern mapping of the trapped exons belonging to the yh09a04lyfl4a03 sequence, it
can be seen that the transcript they are part of extends 5' towards the 16q telomere, with a
total of 5 exons (FT1|ET2|ET6.4|ET6.6 and ET6.l) trapped from the 43lFl cosmid, mapping
to this adjacent 5' region (Figure 4 4) These exons were ultimately used to extend the
transcripts sequence by reverse transcribed PCR (RT-PCR) and by screening oDNA libraries
for larger clones. Sequencing of these overlapping oDNA clones revealed an open reading
frame of 4365 base pairs that would encode a protein of 1,455 amino acids. Northern blot
t42
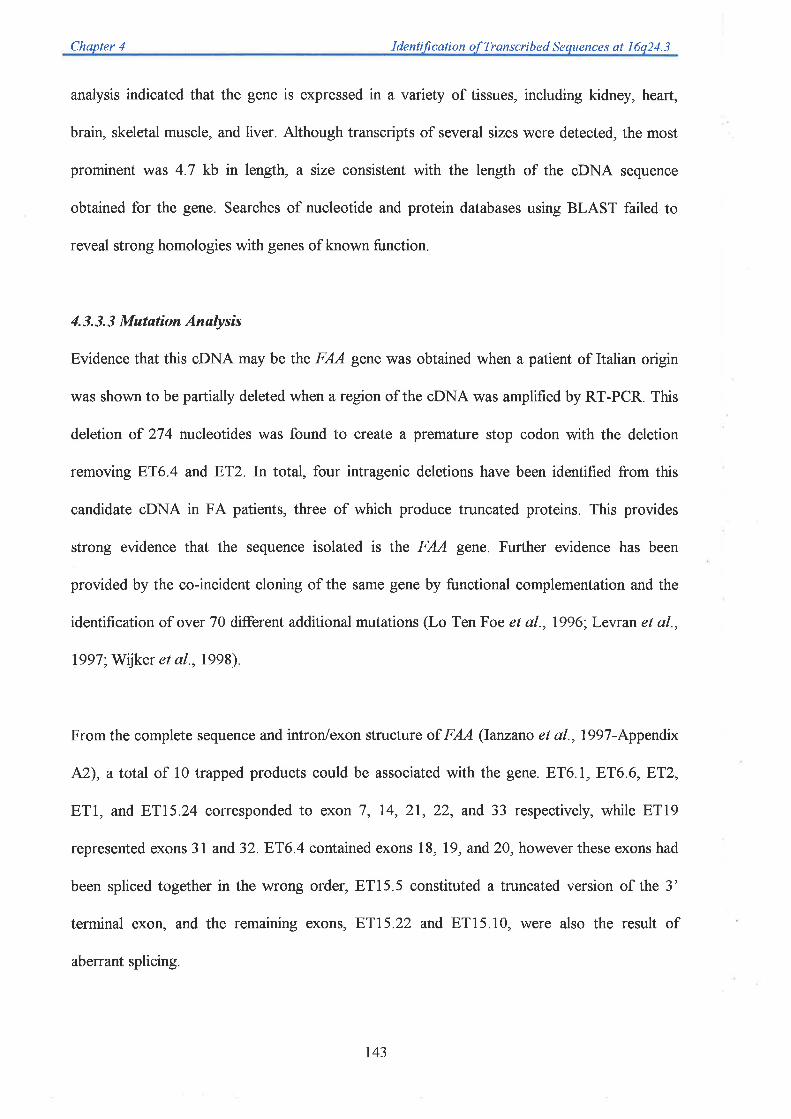
Chanter 4 I de n ti fi c ati on of Tr anscri b e d Se qu e nc e s at I 6 s 2 4. 3
analysis indicated that the gene is expressed in a variety of tissues, including kidney, heart,
brain, skeletal muscle, and liver. Although transcripts of several sizes were detected, the most
prominent was 4.7 kb in length, a size consistent with the length of the oDNA sequence
obtained for the gene. Searches of nucleotide and protein databases using BLAST failed to
reveal strong homologies with genes of known function.
4. 3. 3. 3 Mutation Anølysis
Evidence that this oDNA may be the FAA gene was obtained when a patient of Italian origin
was shown to be partially deleted when a region of the cDNA was amplified by RT-PCR This
deletion of 274 nucleotides was found to create a premature stop codon with the deletion
removing 8T6.4 and ET2. In total, four intragenic deletions have been identifìed from this
candidate cDNA in FA patients, three of which produce truncated proteins. This provides
strong evidence that the sequence isolated is the FAA gene. Further evidence has been
provided by the co-incident cloning of the same gene by functional complementation and the
identification of over 70 different additional mutations (Lo Ten Foe et a1.,1996; Levran et al.,
7997 ;Wijker et al., I 998)
From the complete sequence and intron/exon structure of FAA (Ianzano et a|.,1997-Appendix
A2), a total of 10 trapped products could be associated with the gene. ET6.l,8T6.6,8T2,
ET1, and ETl5.24 corresponded to exon 7, 74,21,22, and 33 respectively, while ET19
represented exons 3l and 32.8T6.4 contained exons 18, 19, and 20, however these exons had
been spliced together in the wrong order, ETl5.5 constituted a truncated version of the 3'
terminal exon, and the remaining exons,8T1522 and ET15.10, were also the result of
aberrant splicing
143
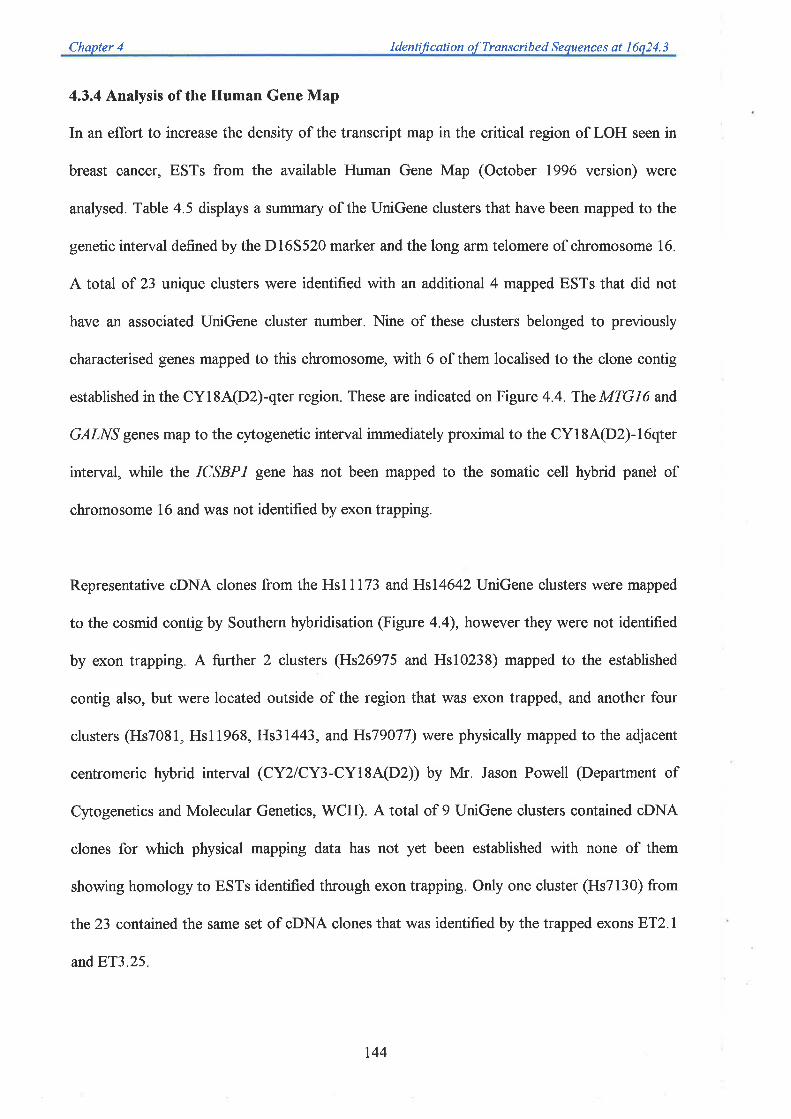
Chapter 4 I dentifi cati on of Transcri b e d S e qu e nce s at I 6q 2 4. 3
4.3.4 Analysis of the Human Gene Map
In an effort to increase the density of the transcript map in the critical region of LOH seen in
breast cancer, ESTs from the available Human Gene Map (October 1996 version) were
analysed. Table 4 5 displays a summary of the UniGene clusters that have been mapped to the
genetic interval defined by the D165520 marker and the long arm telomere of chromosome 16.
A total of 23 unique clusters were identified with an additional 4 mapped ESTs that did not
have an associated UniGene cluster number. Nine of these clusters belonged to previously
characterised genes mapped to this chromosome, with 6 of them localised to the clone contig
established in the CYl8A(D2)-qter region. These are indicated on Figure 4.4. The MTGI6 and
GALNS genes map to the cytogenetic interval immediately proximal to the CYl8A(D2)-l6qter
interval, while the ICSBPI gene has not been mapped to the somatic cell hybrid panel of
chromosome 16 and was not identified by exon trapping.
Representative oDNA clones from the Hsl l173 and Hsl4642UnGene clusters were mapped
to the cosmid contig by Southern hybridisation (Figure 4.4), however they were not identified
by exon trapping. A further 2 clusters (Hs26975 and Hsl0238) mapped to the established
contig also, but were located outside of the region that was exon trapped, and another four
clusters (Hs7081, Hsl 1968, Hs31443, and Hs79077) were physically mapped to the adjacent
centromeric hybrid interval (CY2|CY3-CY18A(D2)) bV Mr. Jason Powell (Department of
Cytogenetics and Molecular Genetics, WCH). A total of 9 UniGene clusters contained oDNA
clones for which physical mapping data has not yet been established with none of them
showing homology to ESTs identified through exon trapping. Only one cluster (Hs7l30) from
the 23 contained the same set of cDNA clones that was identified by the trapped exons ET2.l
andBT3.25.
144
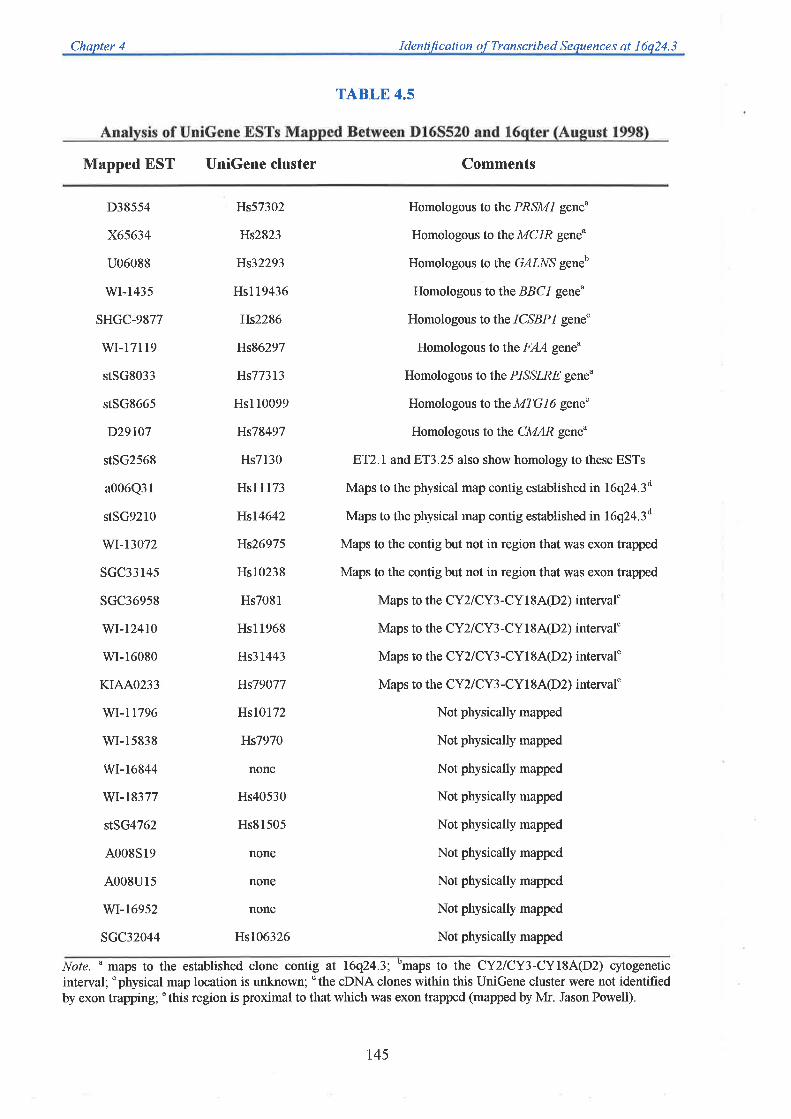
Chapter 4 I denti li c a ti on o f Tran s cri b e d Se que nce s qt I 6q 2 4. 3
TABLE 4.5
Mapped EST UniGene cluster Comments
D38554
x65634
u06088
wr-1435
SHGC-9877
wr-17119
stSG8033
stSG8665
D29107
stSG2568
a006Q31
stSG9210
wr-t3072
scc33145
sGC36958
wI-12410
wI-16080
KIAAO233
wl-l1796
wI-15838
wI-16844
wI-18377
stSG4762
A008sl9
A008u1s
wI-169s2
sGC32044
Hs57302
Hs2823
Ils32293
Hs119436
Hs2286
Hs86297
Hs77313
Hs110099
}{s78497
Hs7130
Hsl1173
IIsI4642
Hs26975
Hs10238
Hs708l
Hs11968
Hs31443
Hs79077
HsIOlT2
Hs7970
none
Hs40530
Hs81505
none
none
none
Hs106326
Homologous totlrre PRSMI gene"
Homologous to the MC I R gene"
Homologous to the G,4LAIS geneb
Homologous totlrre BBCI gene"
Homologous totlrre ICSBPI geneo
Homologous totlrre FAA gene"
Homologous to the PISSZRE gene"
Homologous ß fhe MTG Ió geneb
Homologous tolhe CMAR gene"
ET2.I andBT3.25 also show homology to these ESTs
Maps to the physical map contig established inh6q24.3d
Maps to the physical map contig established in 16q24.3d
Maps to the contig but not in region that was exon trapped
Maps to the contig but not in region that was exon trapped
Maps to the CY2l CY3-CYI 8A(D2) interval"
Maps to the CY2|CY3-CYI8A(D2) intewal"
Maps to the CY 2/ CY3-CY I 8A(D2) interval"
Maps to the CY 2l CY3 -CYl 8A(D2) interval"
Not physically mapped
Not physically mapped
Not physically mapped
Not physically mapped
Not physically mapped
Not physically mapped
Notphysically mapped
Not physically mapped
Not physically mapped
Note. u maps to the established clone contig at I6q24.3; omaps to the CY2|CY3-CY18A(D2) rytogeneticinterval; "physical map location is unlcrown; dthe cDNA clones within this UniGene cluster were not identifiedby exon trapping; "this region is proximal to that which was exon trapped (mapped by Mr. Jason Powell).
t45
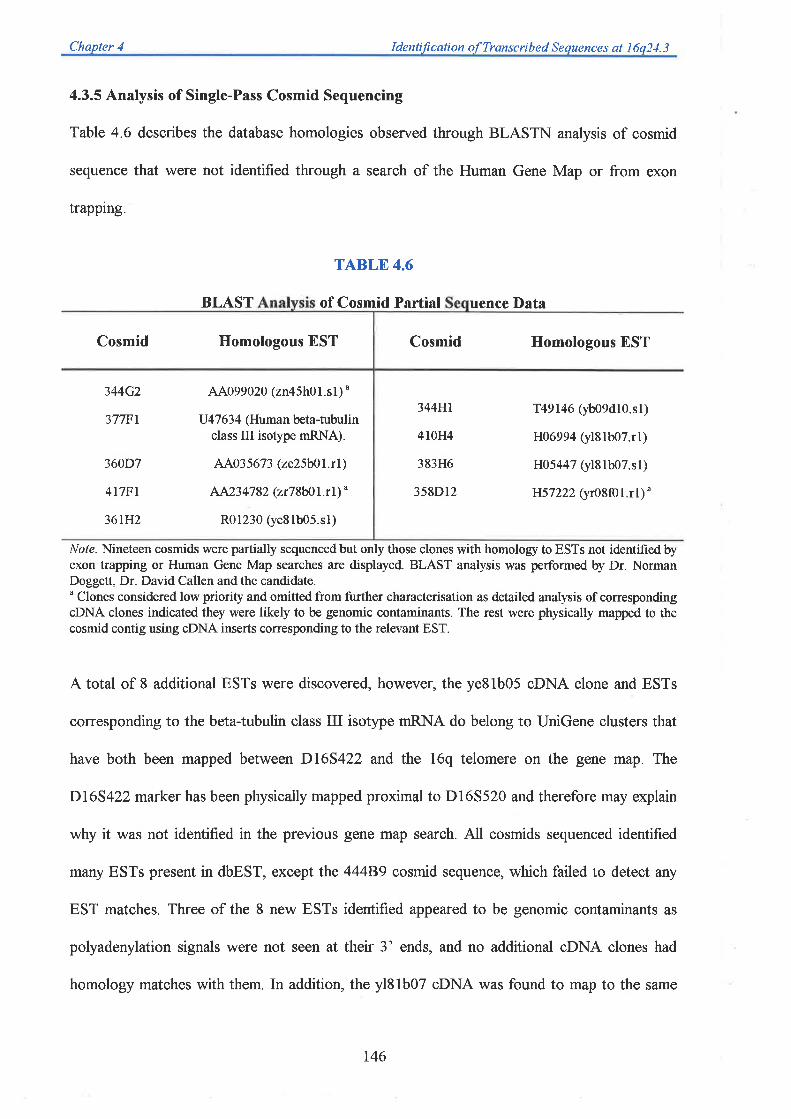
Chapter 4 Identi./ìcation of Transcribed Sequences qt 16q24.3
4.3.5 Analysis of Single-Pass Cosmid Sequencing
Table 4.6 describes the database homologies observed through BLASTN analysis of cosmid
sequence that were not identified through a search of the Human Gene Map or from exon
trapping.
TABLE 4.6
BLAST of Cosmid Partial uence Data
Cosmid Homologous EST Cosmid Homologous EST
344G2
37TFI
360D7
4t7Fl
36tH2
44099020 (zn45h0l.sl) "
V 47 63 4 (Human beta-tubulinclass III isotype mRNA).
1'11035673 (ze21b0l.rl)
AA23 47 82 (zr78b0 1. r 1) "
R01230 (ye81b05.s1)
344H1
410H4
383H6
358D12
T49146 (yb09d10.sl)
H06994 (yl81b07.rl)
H05447 (yl81b07.sl)
Hs7222 (yr08f01.r1)'
iy'ole. Nineteen cosmids were partially sequenced but only those clones with homologr to ESTs not identified byexon trapping or Human Gene Map searches are displayed. BLAST analysis was performed þ Dr. NormanDoggett, Dr. David Callen and the candidate." Clones considered low priority and omitted from further characterisation as detailed analysis of correspondingcDNA clones indicated they were likely to be genomic contaminants. The rest were physically mapped to thecosmid contig using cDNA inserts corresponding to the relevant EST.
A total of 8 additional ESTs were discovered, however, the ye8lb05 oDNA clone and ESTs
corresponding to the beta-tubulin class III isotype mRNA do belong to UniGene clusters that
have both been mapped between D165422 and the l6q telomere on the gene map. The
Dl6S422 marker has been physically mapped proximal to Dl65520 and therefore may explain
why it was not identified in the previous gene map search. All cosmids sequenced identified
maîy ESTs present in dbEST, except the 44489 cosmid sequence, which failed to detect any
EST matches. Three of the 8 new ESTs identified appeared to be genomic contaminants as
polyadenylation signals were not seen at their 3' ends, and no additional cDNA clones had
homology matches with them. In addition, the yl8lb07 oDNA was found to map to the same
r46

EcoF.l restriction fragment as the oDNA clone identified by 8T2.8 and therefore was omitted
from further analysis as they probably represented the same transcript. This left only 4 new
ESTs that were subsequently mapped by Southern hybridisation back to the clone contig and
were incorporated into the transcript map (Figure 4.4).
4.4 Discussion
4.4.1 Exon Trapping
In total, 71 different exons (including aberrantly generated clones) were identified from fhe 26
cosmids used in the trapping procedure. This represents an average of 2.7 traps per cosmid or
1 exon every 13 kb. Similar successes with this procedure have been reported (Burn et al.,
1996; Chen et al., 1996a; Church et al., 1997). To maximise the number of unique exons
trapped it is important to minimise the complexity of the pSPL3B-CAM recombinant clones
introduced into the COS-7 cells. In most cases, trapping from 1 cosmid at a time provided the
maximum return of trapped exons. Due to the size of the region being analysed, a single clone
representing a particular size group from each trapping experiment was chosen for further
analysis. Given more time, a detailed analysis of additional clones within each size group would
undoubtedly reveal the presence of different exons possessing a similar size to the one chosen,
which would further increase the effectiveness of the exon trapping procedure (this was found
in later studies, see chapter 7).
A high proportion (59%) of clones analysed by colony PCR appeared to be 'lector-on1y"
clones. These would be generated if the cosmid genomic insert did not have a functional exon
present (an exon with an attached 5' splice donor and 3' splice acceptor site). The BstXI
digestion of the trapping procedure (4.2.9) is designed to eliminate such clones, however it
147
Figure4.4
Integrated physical and transcription map of the restricted region of loss of
heterozygosity (LOH) atl6q24.3 seen in breast cancer. The map is divided into
6 segments which span 2 pages and extends from A (telomeric end) to G
(centromeric end). Only the region that was exon trapped is indicated. Clones
representing a minimum tiling path in the contig are shown, with cosmids used
for exon trapping indicated by black horizontal lines. The clone number of
cosmids used as templates for partial genomic sequencing at Los Alamos
National Laboratories is indicated in green type. Black circles above the scale
bars indicate the markers mapping to the region, while the hatched black circles
show the location of the D16S3721 and D16S3026 markers which define the
centromeric limit of the LOH region. The position of exons trapped from the
region are indicated by red circles, while exons generated from aberrant splicing
events are represented by green circles. EST clones identified from database
homologies with trapped exons are shown by blue boxes. ESTs homologous to
parlial cosmid sequence are represented as red boxes, while ESTs from mapped
UniGene clusters are shown as green boxes. Characterised genes, including
FAA, are indicated by black boxes, with their orientation, if known, shown in a
5' fo 3' direction (as indicated by arrows). Red asterisks above certain trapped
exons indicate that the order of these clones could not be determined with
respect to exons immediately distal to them. For each EST clone shown, the
GenBank accession number is indicated above the appropriately coloured box.
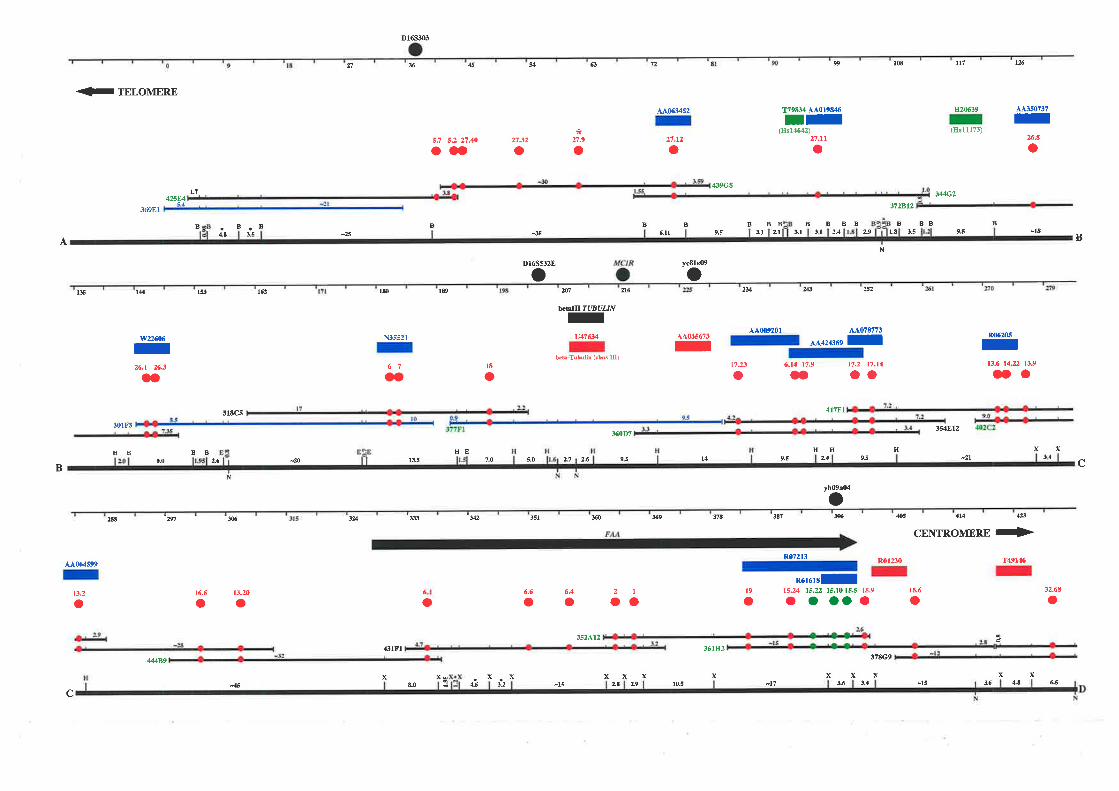
D16S303
27 x s4 ß 72
aÀt163452
27.12
99
T79834 A.A019846II(Hs14642)
27,11
o
108 1t7
w20639
(8611173)
t2Á
-
TELOMERE
ß
s1 5.2 27.4
.O
4t.350737I26.8
oo¿
n9Oo
2:132
t-142584
369E1
439C834442
372812
B BBBBB3.5
B B B BB B B BB3.1 zt al 31 2.4 2.9 1.8 a5
N
BBd8 B
611 9.5 9.5 -lEÆA
D1655328 yc8le(D
1S 162
318CS
lm ls 2v Æ E2oo
AA0356?3
I
ñl
bÉ,bITITUBUIJNIu47614
b6-Tubú (cLñ m)
216
360D7
t4
26.1 26.3
aa
tlzzß06IN35521
67
AA0(p201 A.A078773
aA42436e I
17.23 6.14 11.9 17.2 17.t4
O OO OO
R06205It3ß 14.22 t3.9
aoaIE
oao
4I7FL
354812F3+402C2301 F3
1$
BB BB HH H
ûs
R0r¡0
34-21l4t070145-2Ã
414
HE2.6 95
333 v2 sl m s9
6
o
352A12
ß1Fl
9-5 24 9Jxx
32..68
9.0
2S N
2.6 cBN
yh09a04
os % 374
361H2
%
Rø213
l9
oR6r61sI
15.)A "t5.22 15.10 15.5 lsJaaooa t5.6
o
ßCENTROMERE +
T49rú
3E7
o2toa6.4
o6.6
o13.2016.6
a oo
aÀ064599
13.2
378G9
xxx444ß9
45x
&0x
¿.6
x-15 LA lo.5 -t7 3.6 t4 -15 a6 +E
xxxx3.2
xxx
c
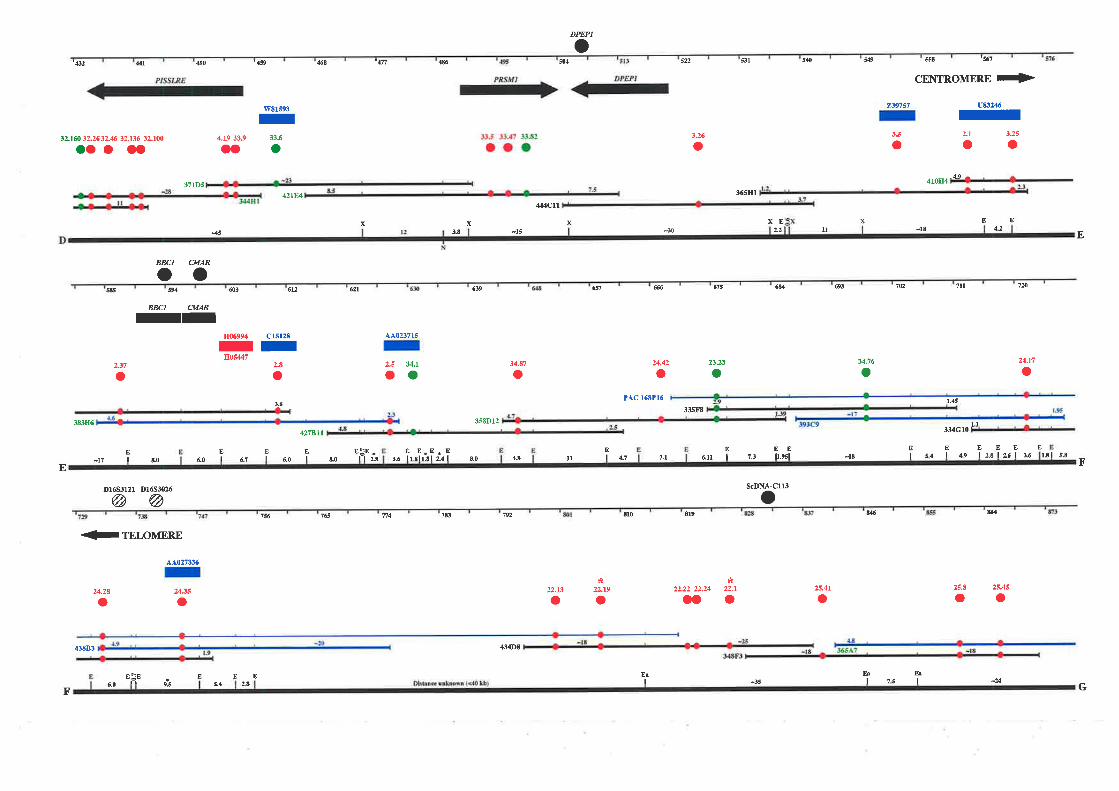
,DPEP1
$l 540
3-:
Mctt
s58 's67
CENTROMERE
->239757 u4324ó,I
o46E 'ffi M 504 ' 'sl3
DPEPl.Fs8'ß2
32.1fi 3L263L46 X2.136 32,100ooo aa
'6
w81593
4.19 335 13.6ooo
4504t
P¡SSI.RE
-
It.2s2.t
o o3-5
Oo
3?IDs
42tra
4roE4
3658r
x XE x EEx xat -15 -18 4.2-30 1t4 E
BK] CMAR
oos94s
BBCI CMAR
603 612
H06994 Crsr28
IIEO5447
621 69 651 66
u,42
fr5
23.23
6U ß 702 7ll 7n
24.11
IIAÀ02371s
34.81 x4.16237 ooooo34,r
a o2.8
o
3.6
oPAC 16EPT6
335141.45
J34G10
54 49
38386 3sED12 !.r427ßtt
EI
EI
EEEI
EI &0
E5Ett u 3.6 2"4 48 4-7 1-t ó.ll
E E.Elr slrrl
El&o
EI
EI
E
I-18
Eula6za
EI
EI
EILó
EI s.8
-11 6.0 6-7 6,0&0
D16S3121 D16S3026
ØØ
11 1.3 lr.esl
SGDNA-C113
FE
oT4 7ß M
22.13 22.19
819
?2.22 214 22.7ooo
tl0 % æ
25.8 25.45
156 765
-
TELOMERE
AÀ02733ó
2435 25.4tA.2a ooog
oooo
E¡I
4I4DE
EE E¡&I 7s I
F
43683
t0E:E
9.5
Es.4 2A -35 4
G
appears that this step is not effïcient. This, coupled with the fact that a high percentage of
cosmid fragments cloned into the trapping vector probably do not contain a functional exon,
may account for the large proportion of contaminaling clones. The procedure could be
improved through the purification of primary PCR products before subsequent digestion with
Bstñ,. These clones however did not interfere with the overall effectiveness of the trapping
procedure, as they could be simply eliminated by colony PCR before further characterisation.
A total of two exons were trapped from the PRSMI gene, which had been previously mapped
incorrectly between the somatic cell hybrid breakpoints CY2|CY3 and CYl8A(D2) at 16q24.3
(Scott et al., 1996), and two exons were identified from the PISSLRE gene, which had also
been previously mapped to chromosome 16q24 (Bullrich et al., 1995). This study therefore
provided refined localisations for these two genes. Both the CMAR and MCIR genes are
intronless, explaining why no exons were trapped from them, however the DPEPI gene has l0
exons, none of which were identified through exon trapping. Similarly, no exons were trapped
from the BBCI gene. This may be a reflection of the distribution of Bsl)il, PstI, Bamïil, and
BgIII sites within these genes, resulting in either large restriction fragments not ligating into the
pSPL3B-CAM vector efficiently, or small restriction fragments that lack intact exons. Similar
gaps in transcription maps have been encountered (Brody et al., 1995; Burn et al., 1996)
suggesting that exon trapping should be coupled with other gene identification methods for the
completion of a comprehensive transcription map. However, even using a combination of five
methods in a 600 kb region around the BRCAI locus, Brody and co-workers (1995) were
unable to identify clones for at least2 known genes.
A total of 10 exons (represented by 7 independent traps) were isolated from the FAA gene that
aided in its initial identification and subsequent genomic characterisation. This gene has been
150
Chapter 4 I de nti fi c ati on of Transcri b e d Se guen ce s at I 6q 2 4. 3
shown to consist of 43 exons (Ianzano et al.,1997) indicating that the trapping procedure was
successful in cloning approximately 25Yo of its exons. Given that the gene spans about 80 kb of
genomic sequence, a total of 6 exons would be expected to be identified based on the average
number of exons trapped per cosmid The trapped exon ET6.l corresponded to exon 7 of
FAA, and was the most 5' exon identified. This product therefore provided essential
information for the subsequent identification of the 5' sequence of the gene by RT-PCR. This
is often a difficult and time consuming task in gene characterisation, especially in larger genes
whose corresponding oDNA clones may only extend a maximum of 3 kb towards the 5' end in
most conventional libraries. Since FA patients are at a higher risk of developing cancers, and
their cells show an increased sensitivity to DNA crosslinking agents, the FAA gene could be
the target for LOH at 16q24.3. A recent study has screened this gene for mutations by SSCP
analysis in 19 breast tumours with specific LOH at 76q24.3 (Cleton-Jansen et al., 1999).
However, no tumour-specific mutations were identified, indicating this gene is not involved in
breast carcinogenesis.
There were a number of instances of exons being trapped as a result of the incorrect usage of
splice sites, either in the trapping vector or in the cloned genomic cosmid DNA. This has not
been reported in other studies and may be a reflection of the number of products characterised
from each trapping experiment with the result that these rarer clones were being analysed. The
availability of the genomic structure of the FAA gene has assisted in identifying how some of
these trapped products were generated. The first example isETl5.22 whose first 60 base pairs
is identical to exon 34 of FAA, with the remainder of the sequence identical to intron 34. From
the analysis of sequence within this intron it appears that the 5' splice donor site of intron 34
has been ignored with an alternative site being used 72 base pairs downstream of the correct
site. This results in the generation of a change in reading frame for the protein and is most
151
likely not a true alternative splicing event. The score of this aberrant splice site based on its
identity to consensus donor sites (Shapiro and Senapathy, 1987) was 75o/o, compared to a
score of 83%o for the correct splice site. The similarity of sequences at these 2 regions reflects
the complex and extremely sensitive mechanism of mRNA processing. The second example
was ET15.10, which was the result of the use of aberrant splice donor and acceptor sites
withinintron 40 and exon 41 onthe opposite strand of theFAAgene. ET15.5 used a cryptic
splice donor site within the 3'UTR of the gene as a result of the absence of splice donor sites
at 3' terminal exons, and finally 8T64 was the result of coJigation of non-contiguous
fragments of cosmid DNA into the trapping vector. This led to exons 18, 19, and 2O being
spliced together in the wrong order. Detailed information regarding the associated genes of
other trapped exons is not yet available, but presumably some of these exons were also
generated by similar mechanisms.
At least 14 potential new transcripts have been identified by database homologies of trapped
products to EST sequences that can now be considered candidates for a breast cancer tumour
suppressor gene. This does not include those trapped exons that had no database homology,
which may represent as yet unsequenced transcripts or genes expressed in defined
developmental stages or tissues. Eight of the 14 potential new transcripts were homologous to
UniGene clusters, with only one of these 8 placed on the NCBI Human Gene Map. Thus exon
trapping has succeeded in mapping 7 UniGene clusters to chromosome 16q24.3. Of the
remaining 6 new transcripts that did not have associated UniGene clusters, all but one
overlapped with additional cDNA clones. This indicates that construction of these clusters is
not l00o/o efficient. An alternative would be to examine the tentative human consensus (THC)
clusters constructed at The Institute of Genomic Research (see 1.2.3.6) with these remaining
transcripts.
152
Chapter 4 I denti fi cati on of Tr anscri b e d Se quence s at I 6 q 2 4. 3
4.4.2 Comparison of Transcript Identification Methods
From analysis of the 1996 NCBI Human Gene Map, 27 UruGene clusters and singleton ESTs
have been mapped between the D16552o-qter region, with only nine of these not yet physically
mapped to the somatic cell hybrid panel. Of these nine, seven are located proximal to either
D16S3l2l or D16S3026 by genetic linkage, suggesting that they may not be located within the
region defining the minimum LOH seen in breast cancer. All nine clones will be physically
mapped in the immediate future. A total of 17 clusters are either physically located outside of
the critical LOH region or represent previously characterised chromosome 16 genes. Ordy 2
new transcripts were identified, mapping to the critical LOH region, that were not found with
exon trapping.
Analysis of single-pass cosmid sequence helped identift 4 new oDNA clones not identified by
exon trapping or searches of the Human Gene Map. Together, these techniques of transcript
identification have allowed the isolation of at least 20 new putative genes, each of which needs
to be characterised further to determine if it has a role in breast tumourigenesis. By far, the
most efficient method was the exon trapping procedure, although analysis of the complete
sequence of the entire cosmid contig, if available, would serve as the ultimate resource for
gene isolation. Combined with the 7 previously characterised genes, at least 27 transcripts can
be placed on the transcript map between D16S3026 and D16S303, a region of approximately
750 kb, giving a density of I gene per 28 kb. Given that an estimated 50,000 to 100,000 genes
exist in the 3Xl0e human genome, there is expected to be on average I gene every 30 to 60
kb, suggesting that a large percentage of the genes located in this region may already have
been identified. However it is still to be determined if some of these transcripts relate to the
same gene or if they are actually transcribed.
153
Chapter 4 I denti /ì c ati on of Tr a nscri b e d Se qu en ce s at I 6 q 2 4. 3
4.4.3 Candidate Breast Cancer Tumour Suppressor Genes
Through the development of the transcript map of the critical region of LOH, three previously
characterised genes have now been located to this region. The fìrst of these is the PISSLRE
gene, which belongs to a family of cyclin-dependant protein serine/threonine kinases that are
critical for cell cycle progression. Dominant-negative constructs of the gene have been shown
to halt cell cycle progression in Gz-M, and when overexpressed in U2OS cells (osteosarcoma
cell line with an inactive Rb protein), suppresses growth (Li et al., 1995). Although tumour
suppressor gene inactivation involves loss of function mutations, the PISSLRE gene may still
play arole in breast cancer due to its role in the cell cycle. Recent SSCP mutation analysis of
this gene however, has failed to identify nucleotide changes specific for breast tumour DN,\
which suggests it is not involved in breast carcinogenesis (Crawford et al., manuscript
submitted). The second is the PRSMI gene, a metallopeptidase of the zincin superfamily.
These genes play a major role in many biological processes including pattern formation,
growth factor activation, and the synthesis of collagen which forms the fibrous scaffold of the
extracellular matrix of tissues (Scott et al., 1996). A role in cancer metastasis could therefore
be predicted, through the degradation of extracellular matrix promoting tumour invasion. The
third characterised gene to be identified is the class III isotype beta tubulin gene. Tubulin is an
alpha/beta heterodimer and is the subunit protein of microtubules. Both the alpha and beta
units exist in many isotypes each encoded by different genes, with some appearing to have no
functional significance while others perform specific functions such as formation of particular
organelles and interactions with specific proteins. The beta tubulin class III isotype has been
shown to be expressed exclusively in neuronal tissues (Draberova et a1.,1998) and therefore is
not a likely candidate breast cancer tumour suppressor gene.
To determine which of the remaining novel transcripts identified may be involved in breast
154
Chapter 4 I denti lì c ati on of Transcri b e d Se quen ce s a t I 6s 2 4. 3
carcinogenesis, clues to the functions must be derived from the homology that may be
observed between them and genes already characterised. One of the more interesting trapped
exon homologies was to a mouse growth arrest-specific oDNA clone. The mouse sequence
was 88o/o identical withBT27.11, suggesting that this was the human homologue. Growth
arrest-specific genes were first identified from a mouse NIH 3T3 subtracted oDNA library
enriched for RNA sequences preferentially expressed during growth arrest (Schneider et al.,
1988). The possibility that the transcript identified by this trapped exon is a tumour suppressor
gene is investigated in detail in chapter 5. Further characterisation of trapped exons that do not
show homology to presently known genes, and therefore there is no immediate clue to their
function, will be described in chapter 6.
155

Churüclerisøtion
of the
GASll ünd
C16orf3 Genes
Chapter 5 Charqcterisation of the GAS| l and CI6o113 Genes
Table of Contents
5.1 Introduction
5.2 Methods
5.2.7 GASI1 Sequence Assembly
5.2.2Isolation of 5'End Sequences
5.2.3 Database Homology Searches
5. 2.4 Northern Hybridisations
5.2.5 Genomic Structure Characterisation of GASI I5.2.5.1 Direct Cosmid Sequencing
5.2.5.2 PCR Amplification of cDNA and Genomic DNA
5.2.5.3 Sequencing c344G2 BamHI Subcloned DNA
526PCR
5.2.7 RT-PCR
5.2.8 RZ//, PCR
5.2.9 3' RACE
5 .2.70 Mutation Analysis
5.2.10.1 Single Stranded Conformation Polymorphism (SSCP) Analysis
5. 2. I 0. 2 Screening for Homozygous Deletions
5.2.10.3 Exon Skipping
5.3 Results
5.3.1 GAS 11 Sequence Determination
5.3.1.1 Sequencing cDNA Clones
5.3.1.2 5' Sequence Isolqtion
5.3.2 GASLl Northern Analysis
5.3.3 GASII Gene Structure
5.3 4 Comparison oî GASI I and its Mouse Homologue
5.3.5 Analysis of zb57b10
5.3.6 Amino Acid Identity
5.3.7 Sequence Determination and Characterisation of Cl6orf3
5.3.7.1 5' Sequence ldentification of C I6orf3
5.3.7.2 Allele Frequencies of Cl6orf3
Page
156
160
161
161
r64
164
764
r66
166
t66
161
167
168
168
t69769
769
169
17l
t7lt71
173
t73
t78
178
180
782
782
183
186
Chapter 5 Characterisøtion of the GASI I and C16orß Genes
5.3. 8 Analysis of ET27 .72
5.3.8.1 Orientation of ET27.I2
5,3.8.2 Linking ET27.12 to Cl6orf3
5.3.8.3 3',RACE
5.3.9 Mutation Analysis of GASI I5.3.9.1 SSCP Analysis
5. 3. 9. 2 Homozygous Deletions
5.3.9.3 Exon Skipping
5.3.10 Mutation Analysis of CI6orf3
5.4 Discussion
s.4.1GASTI
5.4.2 Cl6orf3
186
186
188
188
189
189
189
191
t9t
t9l191
794
Chapter 5 Characterisstion of the GASL l and CI6orß Genes
5.1 Introduction
During exon amplification from cosmids mapping to the minimum region of LOH at 16q24.3,
dbEST homology searches identified a trapped exon with significant homology to a mouse
transcript described as a growth arrest-specific (G/^T) gene. As their name implies, these genes
were first identified and isolated in mice based on their preferential expression when cell
division in culture was stopped by serum deprivation or growth to confluence (Schneider et al.,
1988). Their isolation was achieved through subtractive hybridisation, where a oDNA library
specific for the arrested stage was pre-hybridised with a lO-fold excess of mRNA obtained
from NIH 3T3 cells that were actively growing in nutrient rich medium. The resultant library
led to the identification of six oDNA clones (GasI-6) which represented genes specifically
expressed during the quiescent phase of the cell cycle (Gs) These genes were likely to be
functionally distinct rather than representing a family of related proteins. In principle, Gas
genes could encode products that cause arrested cell growth and are therefore likely tumour
suppressor gene candidates.
Studies of the mouse GasI gene have shown it codes for a membrane-associated protein that
accumulates at the surface of cells following growth arrest and is then down regulated during
the Go-S phase transition. Down regulation of its expression has been correlated with an
increase in the expression of the c-myc gene following the addition of serum to quiescent NIH
3T3 cells, and similarly, as cells enter G6 following serum deprivation, GasI mRNA levels
increase while those of c-myc decrease (Del Sal et al., 1992).In addition, the down-regulation
of GasI was also observed in NIH 3T3 cells that had been transfected in vitro with activated
h-ras and k-ras oncogenes when compared to untransfected cells (Cairo et al., 1992). Taken
together, the membrane protein encoded by GasI may suppress growth with its down-
156
Chapter 5 Characterisation of the GASI l and Cl6or/3 Genes
regulation resulting in cell cycle progression. The human homologue of this gene has been
isolated and shares 82Yo amno acid identity with mouse GasI, with the domains typical for an
integral membrane protein being conserved (Del Sal et a1.,1994). Again, the up regulation of
GASI was observed in human fibroblasts arrested for growth by either serum deprivation or
contact inhibition, while the levels decreased signifìcantly during exponential growth. The
finding that this gene maps to human chromosome 9q21.3-q22 (EvdoÞ,tou et al., 1993), a
region commonly deleted, or otherwise rearranged in certain myeloid malignancies
(Sreekantaiah et al., 1989), coupled with its ability to inhibit DNA synthesis, suggest GASI
may be a potential tumour suppressor gene.
The expression of Gas2 mRNA is also abundant during growth arrest, but is subsequently
down regulated upon reintroduction into the cell cycle by serum stimulation or dilution
(Schneider et al., 1988). The gene encodes a cytoplasmic protein that colocalises with the
microfilament system, and upon serum stimulation of quiescent cells, is hyperphosphorylated
and becomes more abundant at the cell border (Brancolini and Schneider, 1994). An important
post-translational modification of the Gas2 protein is observed during apoptosis, with
antibodies specific for the carboxy- or amino-terminal ends of the protein indicating that the
carboxy-terminal end is removed. Subsequent overexpression of the carboxy-terminal
truncated forms gave rise to dramatic alterations in the actin cytoskeleton and in cell shape,
changes which are normally encountered during cell death by apoptosis (Brancolini et al.,
1995). A consensus binding site for the interleukin-l B-converting enzyme (ICE)Jike protease,
a gene which is activated during apoptosis (Kumar, 1995), eústs at the carboxy-terminal end
of the Gas2 gene, providing further evidence for a possible regulatory role of Gas2 in
microfilament dynamics, during both cell cycle and apoptosis. The human GAS2 gene has
subsequently been isolated and the amino acid sequence has been shown to be extremely
157
Chapter 5 Characterisation of the GASI I and C16orJ3 Genes
conserved between the two species, with only 81314 residues different, 7 of which represented
conservative substitutions. The human homologue has also been shown to share functional
homology to murine Gas2, with a similar pattern of tissue distribution, similar intracellular
localisation, and identical proteol¡ic processing during apoptosis (Collavin et aL.,1998). This
gene has been mapped to human chromosome lIp74.3-p15.2, a region demonstrated to
contain tumour suppressor loci using subchromosomal fragments $ioi et al., 1993), with
deletions or rearrangements of the short arm of chromosome 11 also observed in human
tumours (Mitelman et al., 1997) In addition, arelated human gene, GAR22, maps to a region
on chromosome 22 which shows LOH in a variety of tumours (Zucman-Rossi et al., 1996).
This suggests that GAS2 may be a candidate tumour suppressor gene that is part of a gene
family, with inactivation of these genes disrupting the apoptotic response of certain cells to
specific signals, possibly allowing cells with aberrations to continue dividing and become
cancerous
The Gqs3 gene codes for a 144 amino acid protein that consists of three putative
transmembrane domains, with in vitro translation products of Gqs3 mRNA showing it
associates with the detergent TX-114, indicating it is a true integral membrane protein
(Manfiolettiet a1.,1990). The protein of the rat homologue,,SR-13, has been localised to the
fully-differentiated and quiescent Schwann cells that constitute the myelin sheath of sciatic
nerves, and following nerve injury,.9A,l3 mRNA is rapidly down regulated, coinciding with the
time of Schwann cell proliferation (Welcher et al., 1991). PMP22, the human homologue to
these genes, maps to chromosome l7p1l.2 and has been shown to be duplicated in Charcot-
Marie-Tooth disease type lA (CMTI), a disease which is characterised by distal muscle
wasting and weakness, severely slowed nerve conduction and demyelination in nerve biopsies.
Altered expression of the PMP22 gene may therefore affect Schwann cell proliferation giving
158
Chapter 5 Charqcterisation o{the GASL l and Cl6orß Genes
rise to these clinically observed features
The biological function of both the Gas4 and Gas5 genes is presently unclear. However the
Gas6 gene and its human homologue share similar patterns of expression and have been shown
to possess a high degree of homology with each other, and significant similarity to human
protein S, a negative coregulator in the blood coagulation palhway, suggesting it is a member
of the same family (Manfioletti et al., 1993). The product of Gas6 has been shown to be the
ligand for the Sþ receptor tyrosine kinase and can stimulate tyrosine phosphorylation of this
receptor (Ohashi et a1.,1995). It is also aligand for the Axl tyrosine kinase adhesion receptor
which is closely related to Sþ (Stitt er al., 1995; Varnum et al., 1995). Receptor tyrosine
kinases play a major role in signal transduction pathways that lead to cell proliferation and
differentiation suggesting Gas6 may play an important role in these processes.
Subsequent to the initial identification of GasI-Gasí by Schneider et a/ (1988), three
additional Gas genes have been detected (Brenner et al., 1989; Lth et al., 1996). One of these
genes has since been shown to encode the platelet-derived growth factor cr-receptor protein,
PDGFcTR. Analysis showed that synthesis of mRNA encoding PDGFcT,R in NIH 3T3 cells was
induced by growth arrest, confirming thatit is a Gas gene (Lih et al., 1996). Expression of the
PDGFc¿R gene product during Go may therefore lead to an accumulation of this protein on the
surface of growth arrested cells, consequently advancing the cell cycle. This shows that not all
products of Gas genes may have a negative effect on the growth of cells but some may act in
conjunction with other growth factors to promote cell cycling.
The mouse Gas gene identified from exon trapping does not seem to correspond to any of the
previously characterised genes and is an unpublished reference in GenBank. The human
159
Chapter 5 Characterisation of the GASI I and Cl6orß Genes
homologue of this gene will therefore be referred to as G,4,SII, named in numerical order to
previous Gl,S genes present in GDB. Based on the functional characterisation of other GAS
genes, this new transcript was considered a potential breast cancer tumour suppressor
candidate. To determine if GASII has a possible role in breast carcinogenesis, the gene must
be screened for mutations in breast tumour material isolated from individuals showing
restricted LOH at 16q24.3. The following steps will be undertaken to allow this screening to
proceed. Firstly, Northern blot anaþsis using probes based on partial gene sequences will
determine the size of the messenger RNA encoded by GASI I. The complete nucleotide
sequence of the gene will then be obtained from the sequencing of overlapping oDNA clones
and use of the 5' RACE procedure that aids in the isolation of the 5' end of genes. The
determination of the fullJength sequence is essential for the prediction of the protein product
of the transcript, which may provide functional information about the gene. The genomic
organisation of GASL1 will then be determined in order to amplify each exon of the gene to
allow screening for DNA mutations in affected individuals using single stranded conformation
polymorphism (SSCP) analysis. Possible gross deletions of GASIl in breast cancer tumours
will also be determined by Southern analysis of breast cancer cell line DNA by hybridisation
with a cDNA probe. Exon skipping is another possible mechanism of mutation that will also be
explored in patient material and cell lines. The characterisation and mutation analysis of
another transcript, Cl6orf3 (chromosome 16 open reading frame 3), that overlaps with
GASI I, will also be presented in this chapter.
5.2 Methods
Only those procedures performed specifically in this chapter are mentioned in detail. More
general techniques are described in detail in chapter 2, however slight modifications are
160

Chopter 5 Characterisation o,f the GASI I and C16or'/3 Genes
referred to when appropriate in the text.
5.2.1 GAS Lf Sequence Assembly
Clones showing homology to the trapped exons ET27.l l (clone zb57bl0) and ET2712
(clones yg1,5d07 and zm05d03) were purchased from Genome Systems and DNA was isolated
as describedin2.2.l.3. Inserts were excised from their respective vectors and used as probes
on Southern blots of digested cosmid DNA to veri$' their physical map location with respect
to the cosmid contig. These methods are described in detail in chapter 2. Sequencing of cDNA
clones was performed by DyeTerminator and DyePrimer chemistry Q.2.18) using the primers
listed in Table 5.1.
5.2.2Isolation of 5' End Sequences
5' RACE was performed as described in 2.2.20. For GASI I, fetal skeletal muscle total RNA
was used as a template with GASll gene specific primers (GasGSP) as listed in Table 5.2.
Two separate GasGSP3 primers were used, GasGSP3A, located in exon 2, and GasGSP3B,
present within the extra 109 bp belonging to intron 2 of GASL.I. For Cl6orf3, polyA. mRNA
isolated from fetal skeletal muscle and total RNA isolated from fetal heart tissue were used as
templates. CL6orf3 gene specific primers (C16GSP) are listed inTable 5.2.
PCR screening of the fetal brain cDNA pools was also used to extend the GASII sequence.
Standard PCR reactions were performed (2.2.14.1) using 2 ¡i of each phage pool as a template
in 20 ¡rl reactions. However, before the addition of the Zaq DNA polymerase, the tubes
containing all components, were overlayed with a drop of paraffin oil, and incubated at 96"C
for 5 minutes. The tubes were then incubated at 80oC while the enzyme was added to each
reaction. Following this, all tubes were incubated at 94"C for 4 minutes, then 35 cycles of
161
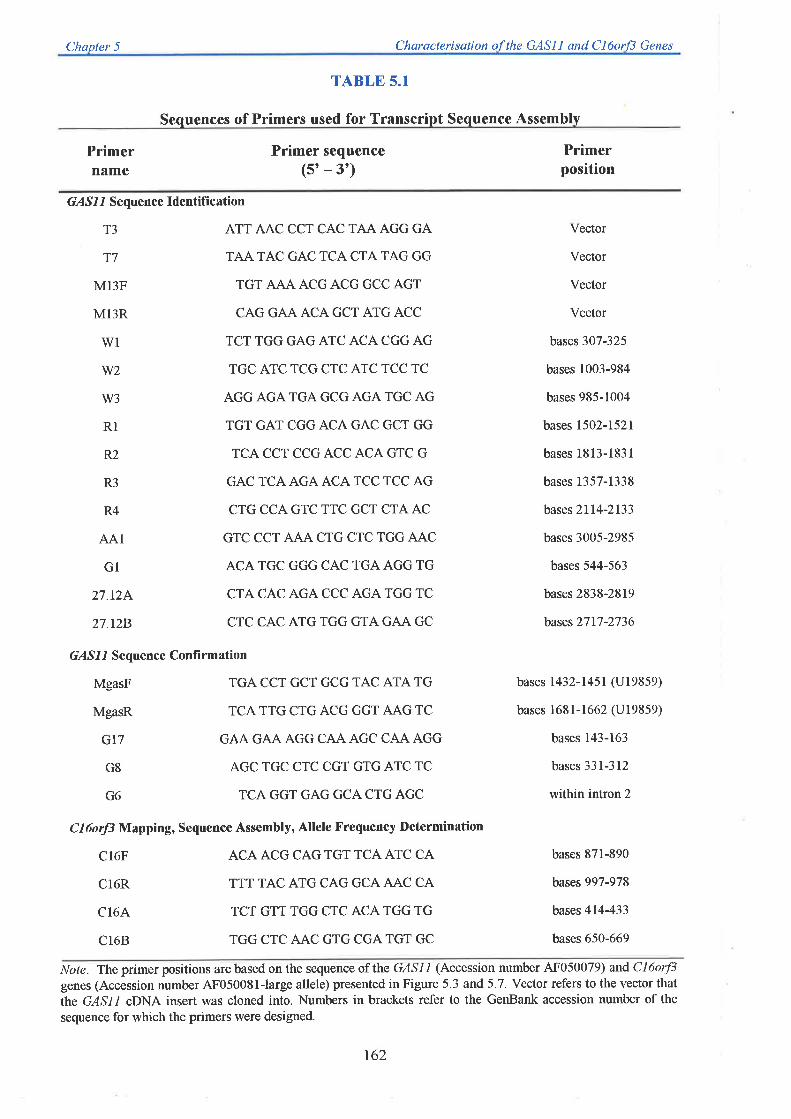
Chapter 5 Characterisation of the GASI I and Cl6orß Genes
TABLE 5.1
sequences of Primers used for Transcript Sequence Assembly
Primername
Primer sequence(5'- 3')
Primerposition
GAS I I Sequence Identifîcation
T3 ATTAACCCTCACTAAAGGGA
T7 TAATACGACTCACTATAGGG
M13F TGT AJA*A' ACG ACG GCC AGT
M13R CAG GAA ACA GCT ATG ACC
Wl TCT TGG GAG ATC ACA CGG AG
W2 TGCATCTCGCTCATCTCCTC
W3 AGG AGA TGA GCG AGATGC AG
RI TGTGATCGGACAGACGCTGG
R2 TCACCTCCGACCACAGTCG
R3 GACTCAAGAACATCCTCCAG
R4 CTGCCAGTCTTCGCTCTAAC
AAl GTCCCT AÁACTGCTCTGGAAC
Gl ACA TGC GGG CAC TGA AGG TG
27.12A CTA CAC AGA CCC AGA TGG TC
27.128 CTC CAC ATG TGG GTA GAA GC
GAS I I Sequence Confirmation
MgasF TGA CCT GCT GCG TAC ATA TG
MgasR TCA TTG CTG ACG GGT AAG TC
GI7 GAA GAA AGG CAA AGC CAA AGG
GS AGCTGCCTCCGTGTGATCTC
G6 TCAGGTGAGGCACTGAGC
C I 6orf3 Mapping, Sequence Assembly, Allele X'requency Determination
C16F ACAACGCAGTGTTCAATCCA
C16R TTT TAC ATG CAG GCAAAC CA
C16A TCTGTTTGGCTCACATGGTG
C16B TGG CTC AAC GTG CGATGT GC
Vector
Vector
Vector
Vector
bases 307-325
bases 1003-984
bases 985-1004
bases 1502-1521
bases 1813-1831
bases 1357-1338
bases 2114-2133
bases 3005-2985
bases 544-563
bases 2838-2819
bases 2717-2736
bases 1432-1451 (Ul9859)
bases 168 l-1662 (U19859)
bases 143-163
bases 331-312
within intron 2
bases 871-890
bases 997-978
bases 414-433
bases 650-669
Note. The primer positions are based on the sequence of the GASL l (Accession number 4F050079) and Cl6orJ-3
genes (Accession number AF050081Jarge allele) presented in Figure 5.3 and 5.7. Vector refers to the vector that
the GASI I cDNA insert was cloned into. Numbers in brackets refer to the GenBank accession number of the
sequence for which the primers were designed.
762
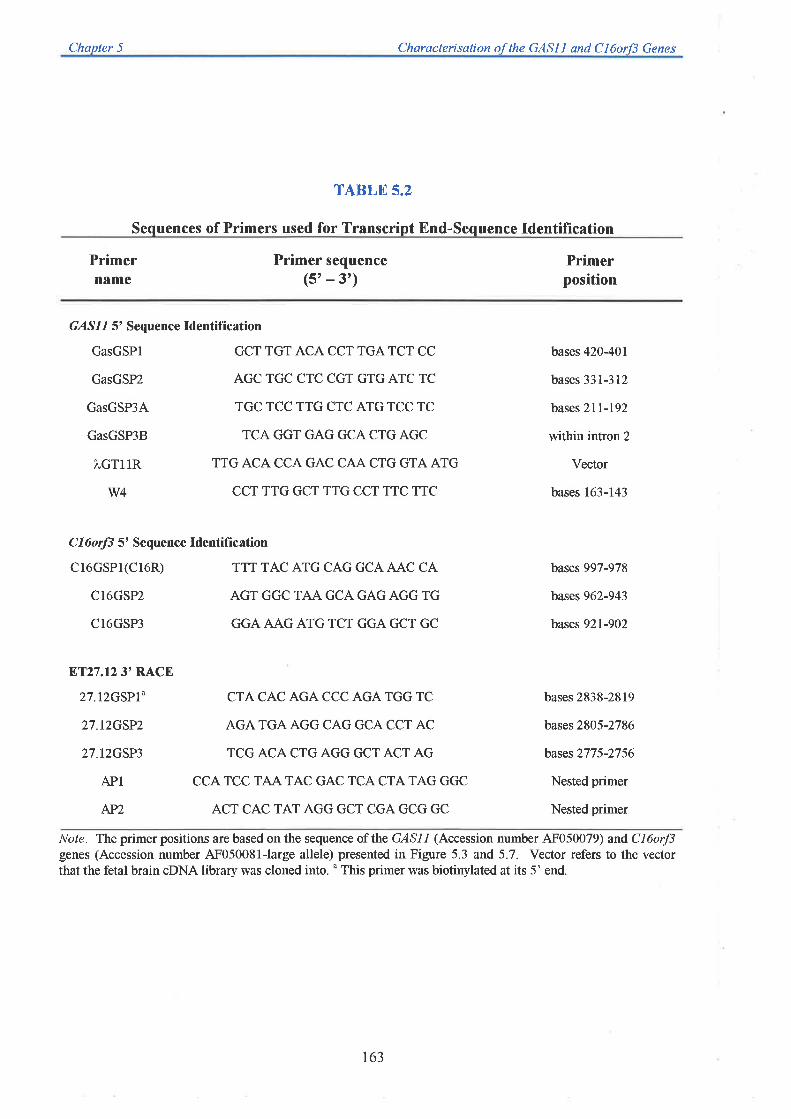
Chapter 5 Chøracterisation of the GASI I and CI6orß Genes
TABLE 5.2
Sequences of Primers used for Transcript End-Sequence Identification
Primername
Primer sequence(5' - 3')
Primerposition
GAS I I 5' Sequence Identifïcation
GasGSPl GCT TGT ACA CCT TGATCT CC
GasGSP2 AGCTGCCTCCGTGTGATCTC
GasGSP3A TGCTCCTTGCTCATGTCCTC
GasGSP3B TCA GGT GAG GCA CTG AGC
¡"GTllR TTG ACA CCA GAC CAA CTG GTA ATG
W4 CCTTTGGCTTTGCCTTTCTTC
C16orJ3 5' Sequence Identification
c16GSp1(C16R) TTT TAC ATG CAG GCAAAC CA
CI6GSP2 AGTGGCTAAGCAGAGAGGTG
C16GSP3 GGAAAGATGTCT GGAGCT GC
bases 420-401
bases 331-312
bases 2l 1-192
within intron 2
Vector
bases 163-143
bases 997-978
bases 962-943
bases 92I-902
bases 2838-2819
bases 2805-2786
bases2775-2756
Nested primer
Nested primer
ET27.t2 3'RACE
27.IzGSPL'
27.I2GSP2
27.L}GSP3
APl
APz
CTA CAC AGA CCC AGATGG TC
AGA TGA AGG CAG GCA CCT AC
TCG ACA CTG AGG GCT ACT AG
CCA TCC TAA TAC GAC TCA CTA TAG GGC
ACT CAC TAT AGG GCT CGA GCG GC
Note. ^|he primer positions are based on the sequence of the GASL l (Accession number 4F050079) and CL6orJ3genes (Accession number 4F050081-large allele) presented in Figure 5.3 and 5.7. Vector refers to the vectorthat the fetal brain cDNA library was cloned into. u This primer was biotinylated at its 5' end.
t63
Chapter 5 Characterisatlon ofJ\p 94Ë1! ottd CI6orJ3 Ç9n9;
94"C for 1 minute; 60"C for 2 minutes; 72"C lor 3 minutes, with a final incubation of 72'C for
7 minutes. Primers used for the PCR were a primer specific for the l,gtll vector cloning site
(l,gtllR), anda primerto the 5'end of zb57b70 (W4), which are shown in Table 5,2. Nl
products were analysed on 2.5Yo agnose gels with aliquots subsequently cloned into the
pGEM-T vector and sequenced.
5.2.3 D atabase Homology Searches
The BLASTN and BLASTP programs (Altschul et al., 1997) were used to, search for
nucleotide sequence homology and amino acid homology respectively, between GASII and
Cl6orf3 and sequences deposited in the GenBank non-redundant and EST databases
(http://www.ncbi.nlm.nih.gov/index.htrrìl). In the majority of cases, the critical P value
indicating significant homology was taken to be <10-5 (1.0e-5).
5.2.4 Northern Hybridisations
Commercial Northern blot filters (Clontech) were probed sequentially with the purified insert
of the oDNA clone 2b57b10, which represented the GASII gene, and a PCR product
generated from primers designed to the oDNA clone representing Cl6orf3 (yd83e07), as
described in 5.2.6. A Northern blot produced from breast cancer cell line RNA (2.2.11) was
probed with the insert of the oDNA clone ygl5d07, representing the GASII gene. This filter
was not probed with the B-Actin control as it was still being used for other purposes not
reported here.
5.2.5 Genomic Structure Characterisation of GASLL
Three methods were chosen as described below, with all primer sequences listed in Table 5.3
t64
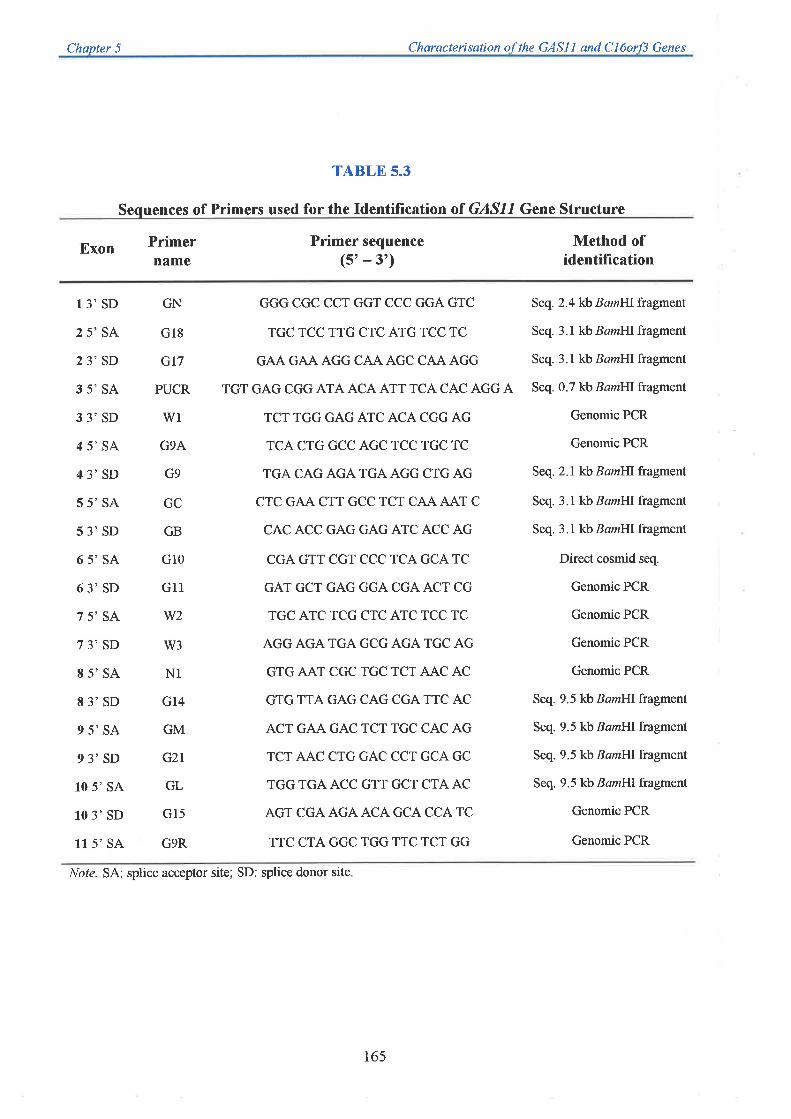
Chapter 5 Characterisation of the GAS| l and Cl6orß Genes
TABLE 5.3
Seq uences of Primers used for the Identification of GASLL Gene Structure
Exon Primername
Primer sequence(5' - 3',)
Method ofidentification
13'SD
25'SA
2 3'SD
35'SA
33'SD
45'SA
43'SD
55'SA
53'SD
65'SA
63'SD
75'SA
73'SD
85'SA
83'SD
95'SA
93'SD
10 s'sA
10 3' SD
11 5' SA
GN
G18
GT7
PUCR
wlG9A
G9
GC
GB
Gl0
Grl
w2
w3
N1
G14
GM
G2r
GL
G15
G9R
GGG CGC CCT GGT CCC GGA GTC
TGC TCC TTG CTC ATG TCC TC
GA-A. GAÂ AGG CAA AGC CAA AGG
TGT GAG CGG ATA ACA ATT TCA CAC AGG A
TCT TGG GAG ATC ACA CGG AG
TCA CTG GCC AGC TCC TGC TC
TGA CAG AGA TGA AGG CTG AG
CTC GAA CTT GCC TCT CAA AAT C
CAC ACC GAG GAG ATC ACC AG
CGA GTT CGT CCC TCA GCA TC
GAT GCT GAG GGA CGA ACT CG
TGC ATC TCG CTC ATC TCC TC
AGG AGA TGA GCG AGA TGC AG
GTG AAT CGC TGC TCT AAC AC
GTG TTA GAG CAG CGA TTC AC
ACT GAA GAC TCT TGC CAC AG
TCTAAC CTG GAC CCT GCAGC
TGGTGAACC GTT GCT CTAAC
AGT CGA AGA ACA GCA CCA TC
TTC CTA GGC TGG TTC TCT GG
Seq. 2.4 kb BamIil fragment
Seq. 3.1 kb Bamlilfragment
Seq. 3. 1 lú Bamlilfragment
Seq. 0.7 lú B am|il fragment
Genomic PCR
Genomic PCR
Seq. 2.1 lú Bqmlilfragment
Seq. 3.1 kb Bamf[ fragment
Seq. 3.1 kb Bamlll fragment
Direct cosmid seq.
Genomic PCR
Genomic PCR
Genomic PCR
Genomic PCR
Seq. 9.5 kb BamIil fragment
Seq. 9.5 kb BamIn fragment
Seq. 9.5 kb BqmÍn fragment
Seq. 9.5 kb BomIII fragment
Genomic PCR
Genomic PCR
l/ole. SA: splice acceptor site; SD: splice donor site
165
Chapter 5 Charqcterisation of the GASI I and C16orß Genes
5.2.5.1 Dírect Cosmid Sequencing
The entire GASI I gene lies within the cosmid 344G2 and as such, DNA from this cosmid was
chosen as a template for direct sequencing using primers designed to the sequence of the gene.
This method has been described inlarz;ano et al. (7997). Ten micrograms of cosmid DNA was
first denatured in 2 M NaOH,2 mM EDTA (pH 8.0) in a 100 ¡rl volume for 30 minutes at
37"C. The DNA was then precipitated \¡vith 10 ¡rl of 3 M NaAc (pH 5.2), and 250 ¡rl of 100%
ethanol at -70"C for 30 minutes. Following a 30 minute spin at 13,000 rpm, the pellet was
washed in 1 ml of 70Yo ethanol, respun for 5 minutes, and allowed to air-dry for 10 minutes.
The DNA was resuspended in 10 pl of sterile water and a standard DyeTerminator cycle
sequencing reaction was performed (2.2.18.1), however 4 ¡rl of halfTERM mix was substituted
for another 4 ¡i of the Dye Terminator mix. Samples were then cleaned as described in
2.2.78.1
5.2.5.2 PCR Ampffication of zDNA snd Genomic DNA
Primers specific for the GASII coding sequence were designed 100 to 150 bp apart and used
in PCR reactions on human genomic DNA or c344G2 DNA. PCR products generated were
compared to the products obtained when oDNA was used as a template in the PCR reaction. If
the products were larger with genomic DNA as template than cDNA, they were subsequently
purified (2.2.16.1) or cloned into pGEM-T and sequenced (2.2.17.2).
5.2.5.3 Sequencing c344G2 BamHI Subcloned DNA
Individual BamHI fragments from cosmid344CrZ were purified from agarose gels (2.2.16.2)
and subcloned into the Puc19 vector (2.2.17). Each subclone then served as a template for
DyeTerminator sequencing reactions using primers specific for the cDNA sequence of the
t66
Chapter 5 Characterisation of the GASL l and Cl6or/3 Genes
gene. In each of the three procedures mentioned, the divergence of the cDNA sequence to
genomic sequence was taken to indicate the exon to intron transition.
5.2.6 PCR
Atl PCR reactions were performed essentially as described in 2.2.14 I Amplification of the 3'
end of the mouse GasI I gene was achieved using 200 ng of mouse A9 cell line DNA as a
template with the MgasF and MgasR primers (Table 5.1) The product was cloned into the
pGEM-T vector and sequenced.
Amplification of the Cl6orf3 gene to generate a product for Northern analysis was achieved
using the C16A and C16R primers (Table 5.1) with 50 ng of c344G2 DNA as a template.
Reaction volumes were scaled up to 50 ¡rl and a 45 ¡l aliquot of the PCR reaction was purified
using QlAquick columns (2.216.1).
The frequency of the large and small alleles of Cl6orf3 were determined using PCR
amplification of DNA isolated from normal Caucasian individuals using the Cl6R and C16B
primers (Table 5.1).
5.2.7 RT-PCR
All RT-PCR reactions were performed as described in 2.2.15. The sequences of all primers
used are shown in Table 5.1. In the cases where products were to be sequenced, an aliquot of
the reaction was subcloned into the pGEM-T vector and sequenced using vector specific
primers.
767

Chapter 5 Characterisation of the GASI I and CI6orß Genes
5.2.8 RTth PCR
This technique allowed reverse transcription to occur at 70"C, due to the reverse transcriptase
activity of Ihermus thermophilus DNA polymerase in the presence of Mn** ions. This enabled
a gene specific primer to be used to initiate oDNA synthesis, and facilitated the denaturing of
any secondary structure of the RNA. All reaction buffers were supplied with the rTth kit. In a
specific primer 7,250 ng of polyA* fetal brain mRNAs and2.5 unts of rTth polymerase, were
mixed and incubated at 70"C lor 25 minutes. Following this, 8 ¡rl of 10X chelating buffer, 6 ¡rl
of 25 mM l||4:gCl2, and 1 00 ng of gene specific primer 2 were added to the initial 20 ¡"rl reaction
and made up to a volume of 100 pl with sterile water. After addition of two drops of paraffin
oil, the tubes were incubated at 95oC for 2 minutes, followed by 35 cycles of 95'C for 30
seconds; 60"C for 30 seconds;72"C for 30 seconds, with a final elongation step of72"C for 7
minutes. Following this, 20 pl of each sample was electrophoresed through a 2.5% (wlv)
agarose gel. A control reaction was performed for each individual experiment where the rTth
enzyme was omitted from the initial reverse transcription step but was added for the PCR step.
This established whether PCR products were derived from genomic contamination from within
the RNA template. A positive control provided with the kit was also used. All primer
sequences used are shown in Table 5.1.
5.2.9 3' RACE
A procedure adapted from Gecz et al (1997) was used with primers specific for 8T27.12.
First strand oDNA was synthesised from polyA. fetal brain mRNA using an anchored oligo-dT
primer, 5' -CCATCCTAATACGACTCACTATAGGGCT-CGAGCGGC(T) rsVN-3', in which
V was any of the four A, C, G, and T nucleotides and N was C, G, or A. Second strand cDNA
168
Chqpter 5 Chqrqcterisation of the GASI I and CI6or/3 Genes
was synthesised in a linear PCR using a biotinylated gene specific primer (27.12GSP1).
8T27.12 specific cDNAs were then captured on streptavidin-coated magnetic beads (Dynal),
and the 3'end was subsequently amplifìed using the nested primers 2t.l2GSP2 and APl,
followed by an additional nested PCR using the primers 27.L}GSP3 and AP2. Resulting PCR
products were then cloned into the pGEM-T vector and sequenced. All primer sequences are
listed in Table 5.2.
5.2.10 Mutation Analysis
5.2.10.1 Single Stranded Conformatíon Polymorphism (SSCP) Anølysis
Other members of the FAB consortium performed SSCP mutation analysis on the GASI I and
Cl6orf3 genes. Individual laboratory variations in procedures employed exist, but were
essentially as described in chapter 6 (6.2.5).Ilowever, only a subset of tumours from the same
panel of breast cancer samples as describedin6.2.6 were used (see Table 5.7),withthe LOH
status of the majority of them shown in Figure 1.4. Primers used for the SSCP analysis of both
these genes are listed in Table 5.4.
5. 2. 1 0. 2 Screening for Homozygous Deletions
DNA from selected breast cancer cell lines (T47D, MDAl34ll,l\!DA231/51, MCF7, and
M8157) and normal male and female individuals was digested with PstI, BamIn, HindIII, or
EcoRI in separate tubes (2.2.7.1). After Southern transfer of the electrophoresed digests,
membranes were hybridised with the insert to the cDNA clone ze60g08 that contains the entire
GASI I coding sequence and3'UTR
5.2.10.3 Exon Skipping
Selected primers listed in Table 5.1 and 5.3 were used in RT-PCR reactions on RNA isolated
169
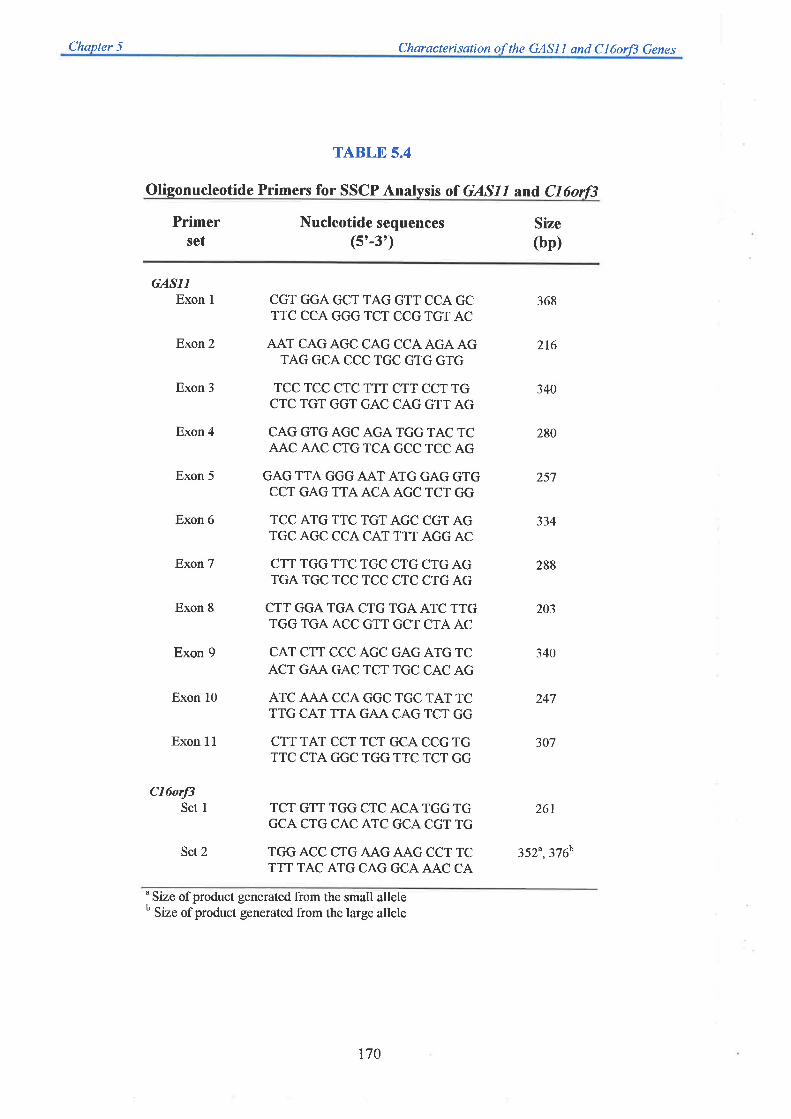
Chaoter 5 Chqrqcterisation of the GASI I and Cl 6o113 Genes
TABLE 5.4
Oligonucleotide Primers for SSCP Analvsis of GASLLând Cf6orß
Primer Nucleotide sequences(5'-3')
Size(bp)set
GASIlExon 1
Exon 2
Exon 3
Exon 4
Exon 5
Exon 6
Exon 7
Exon 8
Exon 9
Exon 10
Exon 11
C16orf3Set I
Set 2
CGT GGA GCT TAG GTT CCA GCTTC CCA GGG TCT CCG TGT AC
AAT CAG AGC CAG CCA AGA AGTAG GCA CCC TGC GTG GTG
TCC TCC CTC TTT CTT CCT TGCTC TGT GGT GAC CAG GTT AG
CAG GTG AGC AGA TGG TAC TCAÁ.C A"A.C CTG TCA GCC TCC AG
GAG TTA GGG AAT ATG GAG GTGCCT GAG TTA ACA AGC TCT GG
TCC ATG TTC TGT AGC CGT AGTGC AGC CCA CAT TTT AGG AC
CTT TGG TTC TGC CTG CTG AGTGA TGC TCC TCC CTC CTG AG
CTT GGATGA CTG TGAATC TTGTGGTGAACC GTT GCT CTAAC
CAT CTT CCC AGC GAG ATG TCACT GAA GAC TCT TGC CAC AG
ATC AÁT{ CCA GGC TGC TAT TCTTG CAT TTA GAA CAG TCT GG
CTT TAT CCT TCT GCA CCG TGTTC CTA GGC TGG TTC TCT GG
TCT GTT TGG CTC ACA TGG TGGCA CTG CAC ATC GCA CGT TG
TGG ACC CTG AAG AAG CCT TCTTT TAC ATG CAG GCAAAC CA
368
216
340
280
257
334
288
203
340
247
307
261
352"376h
'Size of product generated from the small alleleb Size ofproduct generated from the large allele
170
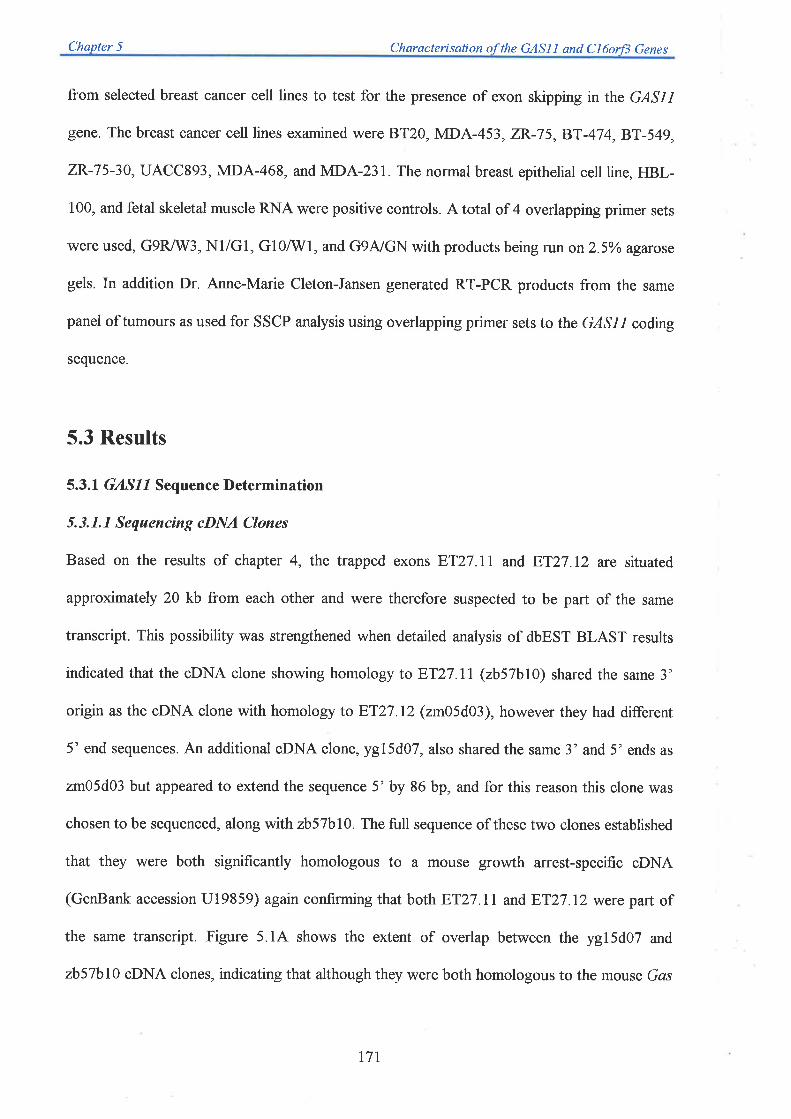
Chapter 5 Characterisation of the GASI I and Cl6or/3 Genes
from selected breast cancer cell lines to test for the presence of exon skipping in the GASI I
gene. The breast cancer cell lines examined were 8T20, MDA-453, ZR-75,8T-474,8T-549,
ZR-75-30, UACC893, MDA-468, and MDA-231. The normal breast epithelial cell line, HBL-
100, and fetal skeletal muscle RNA were positive controls. A total of 4 overlapping primer sets
were used, G9R/W3, Nl/Gl, Gl0/!V1, and G9A/GN with products being run on 2.5%o agarose
gels. In addition Dr. Anne-Marie Cleton-Jansen generated RT-PCR products from the same
panel of tumours as used for SSCP analysis using overlapping primer sets to the GASI I coding
sequence.
5.3 Results
5.3.1 GASll Sequence I)etermination
5.3.1.1 Sequencing cDNA Clones
Based on the results of chapter 4, Ihe trapped exons ET27.l1 and ET27.l2 are situated
approximately 20 kb from each other and were therefore suspected to be part of the same
transcript. This possibility was strengthened when detailed analysis of dbEST BLAST results
indicated that the oDNA clone showing homology toET27 ll (2b57b10) shared the same 3'
origin as the oDNA clone with homology to ET27.l2 (2m05d03), however they had different
5' end sequences. An additional oDNA clone, ygl5d}7, also shared the same 3' and 5' ends as
zm05d03 but appeared to extend the sequence 5' by 86 bp, and for this reason this clone was
chosen to be sequenced, along with zb57bl0. The full sequence of these two clones established
that they were both significantly homologous to a mouse growth arrest-specific oDNA
(GenBank accession Ul9859) again confirming that both ET27.l I and ET27.l2 were part of
the same transcript. Figure 5.14 shows the extent of overlap between the yg15d07 and
zb57bl0 cDNA clones, indicating that although they were both homologous to the mouse Gas
171

5' 3' ET27.llA 3' s', F,T27.12
11g hol876543215'ATG
ATG
-R3
TAG
TAG
AAAAA 3' GAS11
AAAAA 3' yg15d07
AAAAA 3' zb57bl0
u198s9
TEL +
TAG
5'
5'
5t AAAAA 3'
B + CEN
ATG I t' Cr6orJ33'AAAA
)I
B2.4Kb, 3.lKb
3 4 5 6 7 8 9 10 11
GASll 5'
B
AAAAA 3'
B B BB7r 2.lKb IBI
3.tKb 0. 3.lKb 9.sKb tB
ith the cDNA clones yg15d07 and zb5Tbr}, and the trapped exons ET27.l l ande mouseGas gene, which are completely different in sequence composition fromsET27.l2 was trapped from the noncoding strand within the 3'UTR. The cDNA
, and most of the 3' UTR except the last 235 bp. This@) A partial restriction map of the 16q24.3 regionof the GASI I gene and is transcribed in the opposite
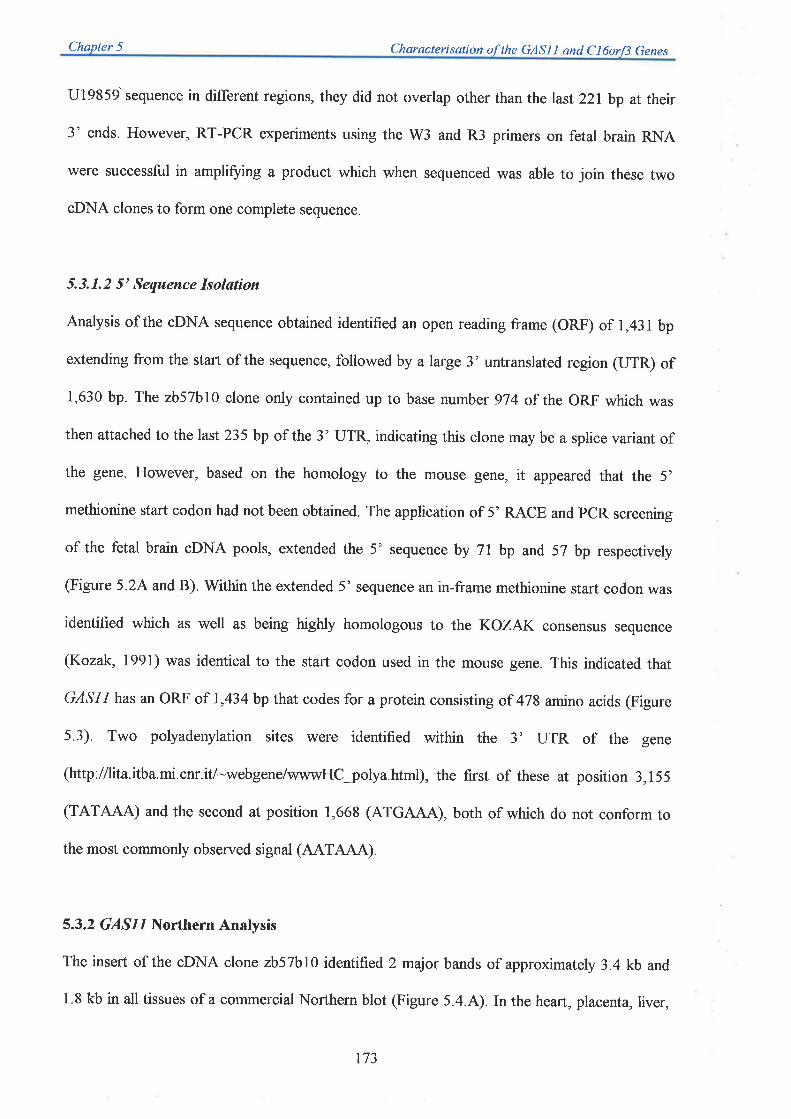
Chapter 5 Characterisation ofthe GASI I and C]6or/3 Genes
Ul9859sequence in different regions, they did not overlap other than the last 221bp at their
3' ends. Ilowever, RT-PCR experiments using the W3 and R3 primers on fetal brain RNA
were successful in amplifuing a product which when sequenced was able to join these two
cDNA clones to form one complete sequence.
5.3.1.2 5' Sequence Isolstion
Analysis of the cDNA sequence obtained identified an open reading frame (ORF) of 1,431bp
extending from the start of the sequence, followed by alarge 3' untranslated region (UTR) of
1,630 bp. The zb57bl0 clone only contained up to base number 974 of the ORF which was
then attached to the last 235 bp of the 3' UTR, indicating this clone may be a splice variant of
the gene. However, based on the homology to the mouse gene, it appeared that the 5'
methionine start codon had not been obtained. The application of 5' RACE and PCR screening
of the fetal brain cDNA pools, extended the 5' sequence by 7l bp and 57 bp respectively
(Figure 52A and B). Within the extended 5' sequence an in-frame methionine start codon was
identified which as well as being highly homologous to the KOZAK consensus sequence
(Kozak, 1991) was identical to the start codon used in the mouse gene. This indicated that
GASI I has an ORF of 1,434 bp that codes for a protein consisting of 478 amino acids (Figure
5 3). Two polyadenylation sites were identified within the 3' UTR of the gene
(http.lllita.itba.mi.cnr.itl-webgene/wwwHC¡rolya.html), the first of these at position 3,155
(TATAAA) and the second at position 7,668 (ATGAAA), both of which do not conform to
the most commonly observed signal (AATAAA).
5.3.2 GASL1 Northern Analysis
The insert of the cDNA clone zb57b10 identifìed 2 major bands of approximately 3.4 kb and
1.8 kb in all tissues of a commercial Northern blot (Figure 5.4.4). In the heart, placenta, liver,
173
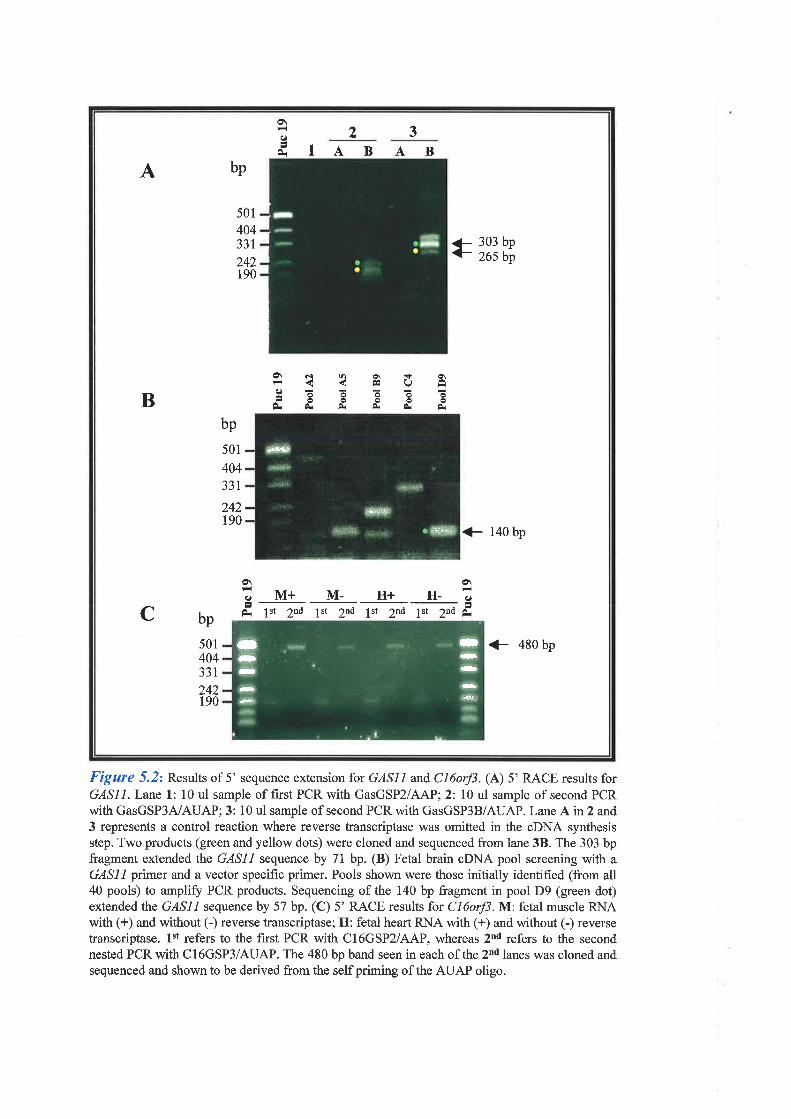
o\(¿
È2 3
1¿,BABA bp
501
404331
242190
¡- 303 bpr zssap
B
o\I
È
d
o
la
oÈ
o\Fq Q
È
g\
bp
501
404331
242190
G 140bp
â o\
cbp:M+M-H+H-E 1., 2nd 1r. .2"d l.t '2"d 1r, ,2trd
q)
501404331
242190
{- 480 bp
seüÈ
-a-ID
-
ü-*-
Figure 5.2: Results of 5' sequence extension for GASI I and CI6orJ3. (A) 5' RACE results forGASI I . Lane 1: l0 ul sample of first PCR with GasGSP2/AAP; 2: l0 ul sample of second PCRwith GasGSP3A/AUAP' 3: l0 ul sample of second PCR with GasGSP3B/AUAP. Lane A in 2 and3 represents a control reaction where reverse transcriptase was omitted in the oDNA synthesisstep. Two products (green and yellow dots) were cloned and sequenced from lane 38. The 303 bpfragment extended the GASll sequence by 71 bp. (B) Fetal brain cDNA pool screening with aGAS| l primer and a vector specific primer. Pools shown were those initially identified (from all40 pools) to ampliff PCRproducts. Sequencing of the 140 bp fragment in pool D9 (green dot)extended the GASI I sequence by 57 bp. (C) 5' RACE results for C16orf3. M: fetal muscle RNAwith (+) and without (-) reverse transcriptase; H: fetal heart RNA with (+) and without (-) reversetranscriptase. 1*t refers to the fust PCR with CI6GSP2/AAP, whereas 2od refers to the secondnested PCR with Cl6GSP3/AUAP. The 480 bp band seen in each of the 2od lanes was cloned andsequenced and shown to be derived from the self priming of the AUAP oligo.

Fígure5.3
Nucleotide and deduced amino acid sequence of the GAS| I gene beginning
from the proposed transcription start site. The gene sequence extends over two
pages. Numbers in the right hand column indicate the nucleotide and amino acid
positions. The translation start site at position 123 andthe stop codon at position
7,557 are indicated by green type. The two polyadenylation signals are
underlined. Horizontal arrowheads are located above the first and last nucleotide
of a given exon. Each exon is represented by a red number with the trapped exon
ET27.l I shown in brackets. Nucleotides in red type indicate the position of the
trapped exonBT27.12 which was trapped from the opposite strand.
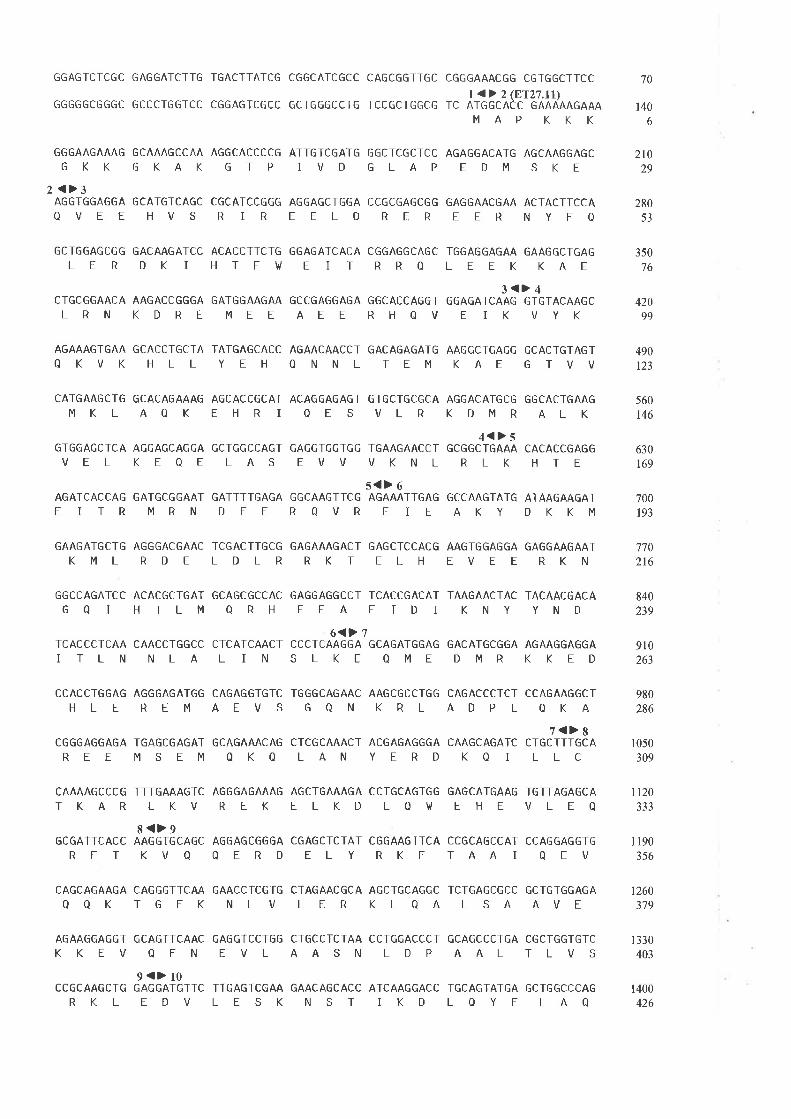
GGAGTCTCGC GAGGATCTTG TGACTTATCG CGGCATCGCC CAGCGGTTGC CGGGAAACGG CGTGGCTTCC
t <> 2 (ET27.rr)GGGGGCGGGC GCCCTGGTCC CGGAGTCGCC GCTGGGCCTG TCCGCTGGCG TC ATGGCACC GAAAAAGAAA
MAPKKK
GGGAAGAAAG GCAAAGCCAA AGGCACCCCG ATTGTCGATG GGCTCGCTCC AGAGGACATG AGCAAGGAGCGKK GKAK GTP IVD GLAP EDM SKE
2<>3AGGTGGAGGA GCATGTCAGC CGCATCCGGG AGGAGCTGGA CCGCGAGCGG GAGGAACGAA ACTACTTCCAQVEE HVS RIR EELD RER EER NYFQ
GCTGGAGCGG GACAAGATCC ACACCTTCTG GGAGATCACA CGGAGGCAGC TGGAGGAGAA GAAGGCTGAG
LER DKI HTFV EIT RRQ LEEK KAE3<> 4
CTGCGGAACA AAGACCGGGA GATGGAAGAA GCCGAGGAGA GGCACCAGGT GGAGATCAAG GTGTACAAGCLRN KDRE MEE AEE RHOV EIK VYK
AGAAAGTGAA GCACCTGCTA TATGAGCACC AGAACAACCT GACAGAGATG AAGGCTGAGG GCACTGTAGTQKVK HLL YEH QNNL TEM KAE GTVV
CATGAAGCTG GCACAGAAAG AGCACCGCAT ACAGGAGAGT GTGCTGCGCA AGGACATGCG GGCACTGAAGMKL AQK EHRI QES VLR KDMR ALK
4<>5GTGGAGCTCA AGGAGCAGGA GCTGGCCAGT GAGGTGGTGG TGAAGAACCT GCGGCTGAAA CACACCGAGGVEL KEQE LAS EVV VKNL RLK HTE
s<> 6AGATCACCAG GATGCGGAAT GATTTTGAGA GGCAAGTTCG AGAAATTGAG GCCAAGTATG ATAAGAAGATEITR MRN DFE RQVR EIE AKY DKKM
GAAGATGCTG AGGGACGAAC TCGACTTGCG GAGAAAGACT GAGCTCCACG AAGTGGAGGA GAGGAAGAATKML RDE LDLR RKT ELH EVEE RKN
GGCCAGATCC ACACGCTGAT GCAGCGCCAC GAGGAGGCCT TCACCGACAT TAAGAACTAC TACAACGACAGQI HTLM QRH EEA FTDI KNY YND
6<> 7TCACCCTCAA CAACCTGGCC CTCATCAACT CCCTCAAGGA GCAGATGGAG GACATGCGGA AGAAGGAGGA
ITLN NLA LIN SLKE QME DMR KKED
CCACCTGGAG AGGGAGATGG CAGAGGTGTC TGGGCAGAAC AAGCGCCTGG CAGACCCTCT CCAGAAGGCT
HLE REM AEVS GQN KRL ADPL QKA7{}g
CGGGAGGAGA TGAGCGAGAT GCAGAAACAG CTCGCAAACT ACGAGAGGGA CAAGCAGATC CTGCTTTGCAREE MSEM QKQ LAN YERD KQ I LLC
CAAAAGCCCG TTTGAAAGTC AGGGAGAAAG AGCTGAAAGA CCTGCAGTGG GAGCATGAAG TGTTAGAGCATKAR LKV REK ELKD LQ!/ EHE VLEQ
8<>9GCGAÏTCACC AAGGTGCAGC AGGAGCGGGA CGAGCTCTAT CGGAAGTTCA CCGCAGCCAT CCAGGAGGTG
RFT KVQ QERD ELY RKF TAAI QEV
CAGCAGAAGA CAGGGTTCAA GAACCTCGTG CTAGAACGCA AGCTGCAGGC TCTGAGCGCC GCTGTGGAGA
QOK TGFK NLV LER KLOA LSA AVE
AGAAGGAGGT GCAGTTCAAC GAGGÏCCTGG CTGCCTCTAA CCTGGACCCT GCAGCCCTGA CGCTGGTGTC
KKEV QFN EVL AASN LDP AAL TLVS9<>10
CCGCAAGCTG GAGGATGTTC TTGAGTCGAA GAACAGCACC ATCAAGGACC TGCAGTATGA GCTGGCCCAG
RKL EDV LESK NST IKD LQYE LAA
70
140
6
28053
21029
42099
490123
770216
840239
630t69
350
76
560146
1260379
1 330403
700t93
910263
I 190
356
1050
309
tt20333
980286
1400
426

l0<> 11GTCTGTAAGG CCCATAACGA CCTGCTGCGC ACGTATGAGG CAAAGCTGCT GGCCTTCGGG ATCCCTCTGGVCK AHND LLR TYE AKLL AFG IPL
ACAACGTGGG CTTCAAGCCC TTGGAAACAG CTGTGATCGG ACAGACGCTG GGCCAGGGCC CCGCGGGACTDNVG FKP LET AVIG QTL GQG PAGL
GGTGGGCACC CCGACG TAGC TGCCCCCCCT GGGGGGCCAC AGCCCAGAGA ACCAGCCTAG GAACACTCGGVGTPT
1470449
1540473
ló10478
GATGACACCC
ACATGTTCTT
CCCTGTCGCT
GACCACAGTC
CTGCCTGTCT
ACACCTGAGT
TGCTCCCTGA
AGGCAGCCTC
ACTTCTGGGC
AGCAGCAAAC
GGGGTGAACC
CGGCTCCAGT
GTCAACAAAG
ACGGGTGTGT
CACCTACCTG
TGCAGATCCC
AGAAGCTTTC
CATCTGGTCC
CCAGAAGCCC
TCAGACTTGG
TGCCCTGTCT
AGCAAGAACC
AACTEIAAA
CTTATCACAC
GCCATCCTCT
CCCTTCCCTG
GGCGGCACCT
TCGCGCCACT
CACAGCTGCC
TGAGCACAAA
CCGCTGCCAG
CTTGCTGGTG
CACCTATCTG
TTCCGCACCA
GTGGGGTGAG
AGGGGATGAA
CCTCGTAGAG
CCACCGCCCA
AGTGAGTCAT
CTGCCCCCTC
AGGACAGTGA
CCCACCCCAG
GTGAGCAGAC
TTAGGAAATC
ACTTTATAGC
GTGGATTATA
CAAGGACAGC
TTCCTGGCTC
GGTGCCGCAC
TCTCAGAGTG
GTTGTCCCAC
CAGTGGGATT
GCCCGCTCTG
TCTTCGCTCT
ATGGTTAAAA
GCCCCAACAC
GAGGGACACT
GCAGTGAGGT
TCACCCTTGG
TCTAfTGCTG
GGACCAGTCT
GAGCCTCAGC
TTC CTCTÀGT
CCATCTGGGT
CTTTCCTGGG
ACAGTGAGGC
ACAACACAGA
TGGCATATAT
CTATTTGTAT
AAGTTTTTTA GATTTTATCA TCAGCAAATG AAAGCTTTTC
TGTGGAGGAG AACCACCTGC AGGACCCTCA CCCATGGTGT
GTCCAGCCTG TGTCCAGGCC TACTCCCTGG TCTCACCTCC
CCCCGCACTC ACCTGGGGGT TGGGGCAATG CCGCGCTGTG
CGAATGGACA GCTTTGCAGG TGCTGGCACT AACTTCATTG
CTCCAGGGGG CCGGGACTTC CCTAGGAAGT GGTGAGCCAA
TTGAGGGCTG GGTGGGTGCA GCCAGCGTGC GGGAACGGGC
AACTCCCTCG GTAGGTGATG TAGGACCAGG GGCACGTGGA
CAACCTGAGA TGGAGAGGCC AGGAGAGAGT ATAAGGGGAT
ACCTGAGAGA ATTCAGCAGC CCAGACTGAG GGTCTGGGAT
CCACAGAAGC CACAGCCCAG TAAGTCAGGC GCTTCTGCGG
TAGGCCCAGA GAGCTGGAGT TGGCTCAGAT GAAAACCTCT
CCCAGCCTCC CCACAAAGCC TGACCCTGGG CAGGTGAGTG
CCTGGACACC TTTCTTTTGG GAGCTCAAAG CAAGTGAGCT
GCCCACTGCC TAAATGATGC CCGGCCAGCA GGACCTGGCC
CCCCTCCAGC CCACTGGGGC TCTCAC CTCC ACATGTGGGT
AGCCCTCAGT GTCGAAGGTG AGCTTGTAGG TGCCTGCCTT
CTGTGTAG CT GGGGAGAGAA TGAGGCTGCA GAGATGGGGA
TCTGCATCCC AGTGGGCCTC AGACACTGCC CTGCCACCTG
TGTTAGGTCC TGCAGTTCCA GAGCAGTCTA GGGACACCAC
GAAGCAAAAA GGGAAAAAGT CTCCCACAAT TTATCCCATG
TTTTCCAGAT TTTCTCTATG CATAAGTATA TTTGTTTAAA
TGTTTT
1ó80
r750
1 820
r890
1960
2030
2100
2170
2240
2310
2380
2450
2520
2590
2660
2730
2800
2870
2940
3010
3080
3 150
3 186
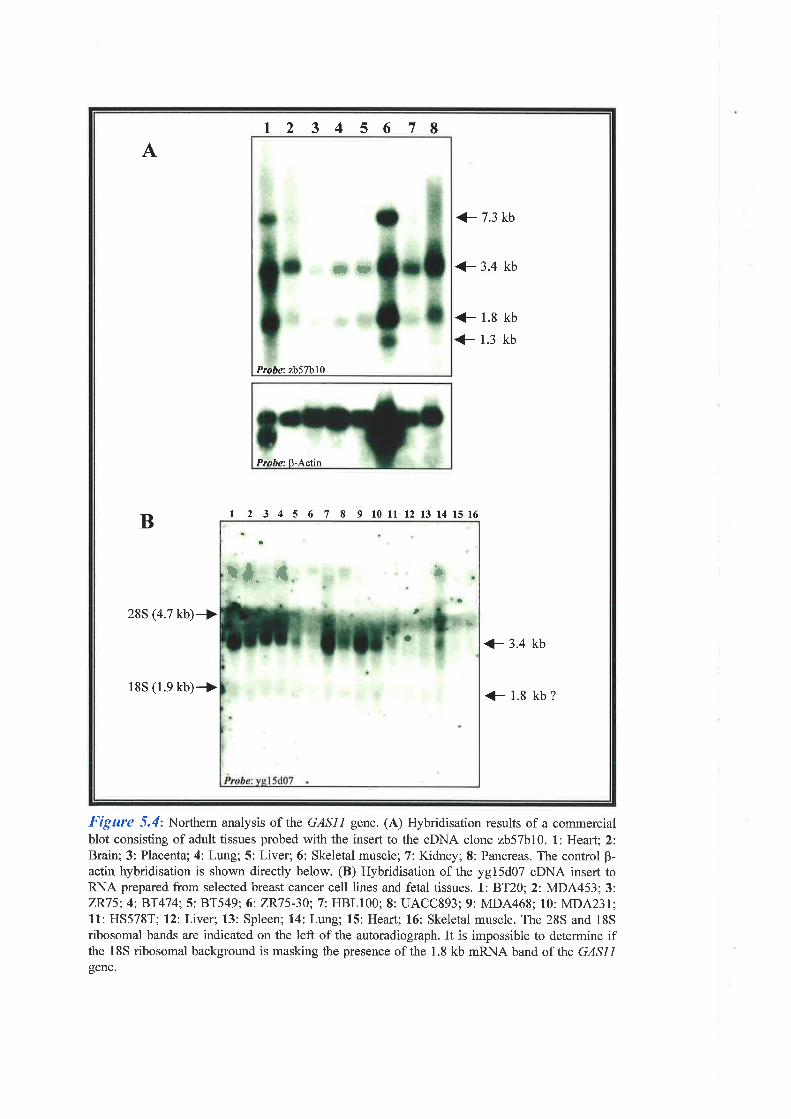
12345678A
<- 7.3 kb
**
Probe'. zb57bl0
+ 3.4 kb
<- 1.8 kb
<- 1.3 kb
Pmhe B-Actin
B I 2 3 4 5 6 7 I 9 10111213141516
285 (4.7 kb)->
+ 3.4 kb
18S (1.9 kb)+ +1.8kb?
*a
t'+
ü
**. dt.
Figure 5.4: Northern analysis of the GASII gene, (A) Hybridisation results of a commercialblot consisting of adult tissues probed with the insert to the cDNA clone 2b57b10. l: Heart; 2:Brain; 3: Placenta; 4: Lung; 5: Liver; 6: Skeletal muscle; 7: Kidney; 8: Pancreas. The control p-actin hybridisation is shown directly below. (B) Hybridisation of the yg15d07 cDNA insert toRNA prepared from selected breast cancer cell lines and fetal tissues. 1: BT20; 2: MDA453;3:ZR75;4:8T474;5: 8T549; 6: ZR75-30;7: HBLIOO; 8: UACC893; 9: MDA468; 10: MDA231;11: HS578T; l2'.Liver;13: Spleen; 14: Lung; 15: Heart; 16: Skeletal muscle. The 28S and 18Sribosomal bands are indicated on the left of the autoradiograph. It is impossible to determine ifthe 18S ribosomal background is masking the presence of the 1.8 kb mRNA band of the GASIlgene.
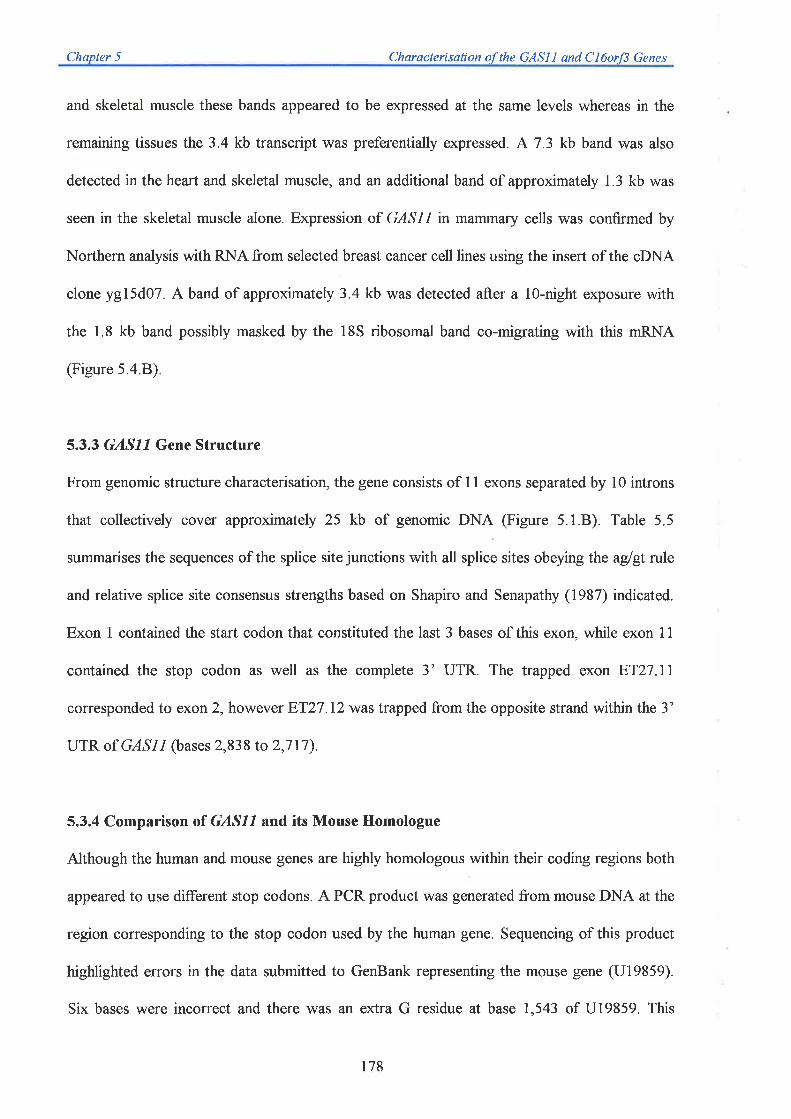
Chapter 5 Characterisation of the GASI I and CI6orß Genes
and skeletal muscle these bands appeared to be expressed at the same levels whereas in the
remaining tissues the3.4 kb transcript was preferentially expressed. A7.3 kb band was also
detected in the heart and skeletal muscle, and an additional band of approximately 1.3 kb was
seen inthe skeletal muscle alone. Expression of GASII in mammary cells was confirmed by
Northern analysis with RNA from selected breast cancer cell lines using the insert of the oDNA
clone yg15d07. A band of approximately 3.4 kb was detected after a lO-night exposure with
the 1.8 kb band possibly masked by the 18S ribosomal band co-migrating with this mRNA
(Figure s.4.8)
5.3.3 GASI1 Gene Structure
From genomic structure characterisation, the gene consists of 1l exons separated by 10 introns
that collectively cover approximately 25 kb of genomic DNA (Figure 5.1.8). Table 5.5
summarises the sequences of the splice site junctions with all splice sites obeying the aglgt rule
and relative splice site consensus strengths based on Shapiro and Senapathy (1987) indicated.
Exon I contained the start codon that constituted the last 3 bases of this exon, while exon 1 I
contained the stop codon as well as the complete 3' UTR. The trapped exon ET2711
corresponded to exon 2, however ET27.l2 was trapped from the opposite strand within the 3'
UTR of G1,S,1,1 (bases 2,838 to 2,717).
5.3.4 Comparison of GASll and its Mouse Homologue
Although the human and mouse genes are highly homologous within their coding regions both
appeared to use different stop codons. A PCR product was generated from mouse DNA at the
region corresponding to the stop codon used by the human gene. Sequencing of this product
highlighted errors in the data submitted to GenBank representing the mouse gene (U19859).
Six bases were incorrect and there was an extra G residue at base 1,543 of U19859. This
178
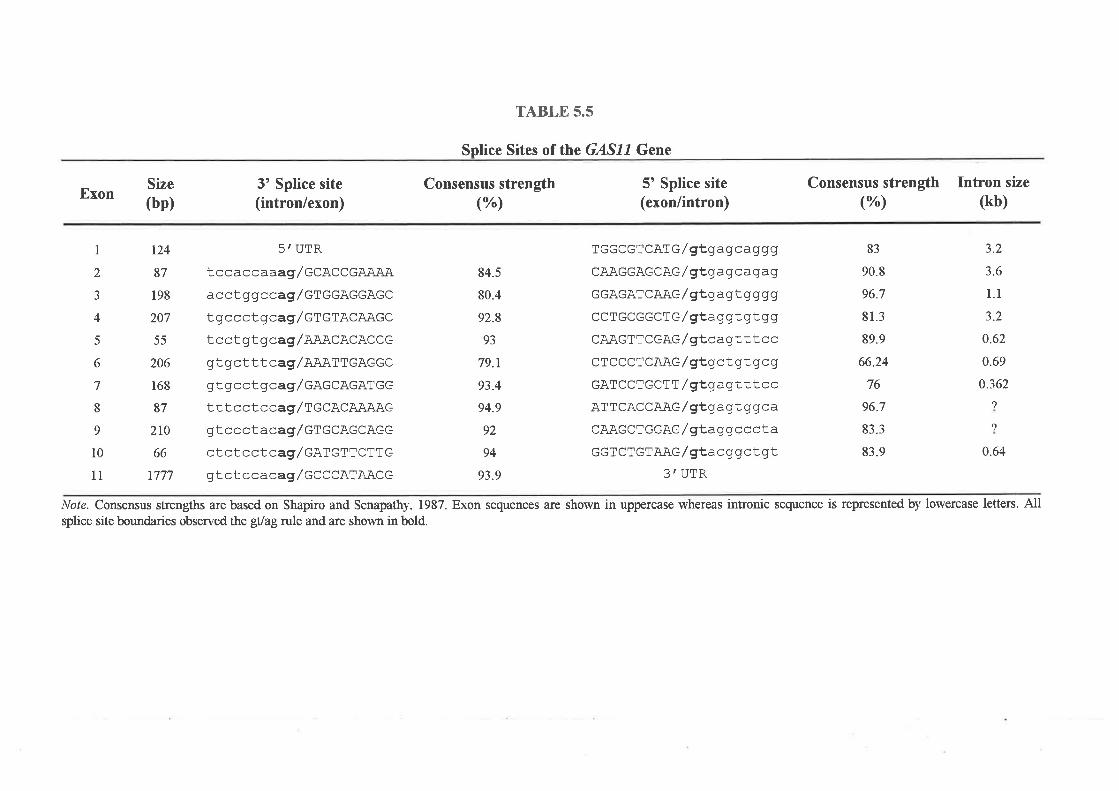
TABLE 5.5
Splice Sites of the GASll Gene
ExonSize(bp)
t24
87
198
207
55
206
168
87
210
66
1777
3' Splice site(intron/exon)
5'UTR
t c c a c c a a agl ececc GA.A.A-ê,
acct ggccagl eteeaccAcct gccct gcagleteracAAGCtcct gt gcaglaRacacAcccgt gct tt cagleearrGAGGCgt g cct g cagl eaecacAT GG
tttcctccag/recacAAAAGgtccct acag/ ercceccAccct ct c ct cagl cRr crT cT T G
gt c t c c a cagl ccccaTAACG
Consensus strength(%)
84.s
80.4
92.8
93
79.1
93.4
94.9
92
94
93.9
5' Splice site(exon/intron)
TGGCGTCAT G / gEgagcagg g
CAAGGAGC AG / gEqagcagag
ccAGATCAAG / gLqaqlq ggS
CCTGCGGCT G / gEaggt gt g g
CAAGTTCG AG / gEcaqt t t cc
CTCCcTCAAG / gEg cl gt gc g
cATCcTGCTT / gEg agt t t ccATTcACCA-A.G / gEg agL q q ca
CAAGCTGG AG / gLag gccctaGGT CT GTA-A,G / gEac q gc t gt
3'UTR
Consensus strength(%)
Intron size
(kb)
I
2
J
4
5
6
7
8
83
90.8
96.7
81.3
89.9
66.24
76
96.7
83.3
83.9
3.2
3.6
1.1
3.2
0.62
0.69
0.362,l
,|
0.64
9
l0
1t
lyofe. Consensus strengths are based on Shapiro and Senapathy, 1987. Exon sequences are shown in uppercase whereas intronic sequence is represented by lowercase letters. Allsplice site boundaries observed lhe gIlag rule and are shown in bold.

Chapter 5 Characterisation of the GASL l and Cl6orJ3 Genes
changes the ORF such that the same stop codon is now shared between the mouse and human
GASII gene.
Two independent human oDNA clones (zb57bl} and ze60g08) contained an additional 109 bp
of sequence between exon 2 and 3 which was not seen in the mouse GasI I homologue or a
mouse cDNA clone (vi93h01). However, inclusion of this extra sequence as a possible
additional exon disrupts the ORF of the gene such that an alternative start site down-stream
would have to be used for translation. RT-PCR using primers located in exon 2 and 3 of
GASL I (Gl7 and G8) failed to amplifii a product containing the extra 109 bp sequence from a
number of tissues (Figure 5.5.4). Ilowever, RT-PCR using a primer located within the 109 bp
sequence (G6) together with the exon 2 primer did amplify products (Figure 5.5.8). A
comparison with genomic sequence of the 0.7 kb BamIII fragment indicated that the 109 bp
was identical to intronic sequence immediately 5' of exon 3. Subsequent cloning of two of the
RT-PCR amplified products followed by a sequence comparison with genomic DNA indicated
the extra 109 bp was most likely derived as a result of the use of a cryptic splice acceptor site
located 109 bp 5' to the true splice acceptor site of exon 3 (score of 88%). The use of an
additional cryptic splice acceptor site located 14 bp 5'to this fìrst cryptic site (score of 82.6%)
appeared to give rise to the second RT-PCR product sequenced. The largest RT-PCR band
seen in Figure 5.5.B was unable to be cloned and most likely represents a heteroduplex band
generated from the two smaller products which differ in sequence by only 14 bp. These results
indicate that transcripts containing this extra sequence must exist but may represent unspliced
mRNA, splicing intermediates generated during processing of this intron, or splicing artifacts.
5.3.5 Analysis of zb57b10
Based on sequence analysis, the fetal lung oDNA clone zb57b10 was missing half of exon 8, all
180
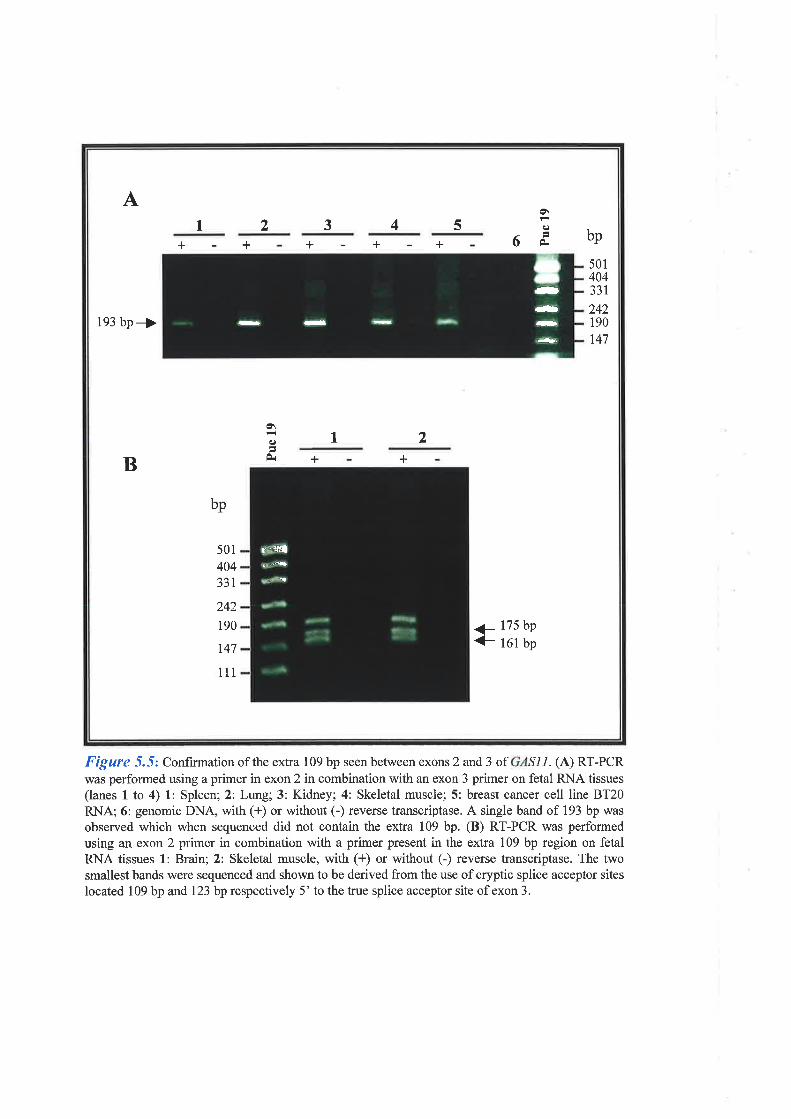
AI 2 3 4 5
o\Ð
oÈ bp+ + + + +
193 bp-}
501404331
242190
147
o\I
È1 2
B + +
bp
501
404331
242
190
r47
111
++ 175 bp
161 bp
.-tþ.D
-.- -
g:q
Figure 5.5: Confirmation of the extra 109 bp seen between exons 2 and 3 of ^S11.
(A) RT-PCR
was performed using a primer in exon 2 in combination with an exon 3 primer on fetal RNA tissues
(lanes L to 4) 1: Spleen;2:Lung;3: Kidney;4: Skeletal muscle;5: breast cancer cell line BT20RNA 6: genomic DNA, with (+) or without (-) reverse transcriptase. A single band of 193 bp was
observed which when sequenced did not contain the extra 109 bp. (B) RT-PCR was performedusing an exon 2 primer in combination with a primer present in the extra 109 bp region on fetalRNA tissues 1: Brain; 2: Skeletal muscle, with (+¡ or without (-) reverse transcriptase. The twosmallest bands were sequenced and shown to be derived from the use of cryptic splice acceptor sites
located 109 bp andI23 bp respectively 5'to the hue splice acceptor site ofexon 3.

Characterisation GASI I and Cl Genes
of exon 9 and most of the 3' UTR including exon l0 and therefore did not appear to be
derived from alternate splicing of the GASII gene. To confirmthe existence of this transcript,
RT-PCR using primers (AA1 and W3) located either side of the region where this clone
diverged in sequence from GASIL was initiated using fetal brain RNA A product was not
generated from this tissue. However, subsequent experiments using polyA. mRNA from
skeletal muscle were successful in amplifying a RT-PCR product of the correct size from this
tissue indicating that the zb57bl0 oDNA clone is not an artifact.
5.3.6 Amino Acid Identity
Overall the GASI I gene is 87Yo and 96%o identical with its mouse homologue (Ul9859) at the
nucleotide and amino acid level respectively. This is a conservative estimate as the U19859
sequence has been shown to have sequencing errors elsewhere and may contain more. In
contrast, the 5' and 3' UTRs in mouse and human do not show any homology. Promoter
prediction (http://www-hgc.lbl.gov/projects/promoter.html) located a possible transcription
start site at position -l2l with respect to the GASII translation start but no TATA box was
located. The program PSORT (http://psort.nibb.ac.jp/) predicted that the gene product might
be located in the nuclear compartment. From BLASTP analysis, significant amino acid
similarity was observed to a T lymphocyte triggering factor of Trypanosoma brucei
rhodesiense (GenBank accession 4F012853) as well as weaker similarities to a portion of the
non-muscle myosin heavy chain of Drosophila melanogaster, chicken, human, rabbit, gallus
gallus, and rat. Other weak similarities included the human and mouse kinesin heavy chain
protein and a kinesin-related protein of Xenopus laevis.
5.3.7 Sequence I)etermination and Characterisation of C16orf3
The oDNA clone yd83e07, had previously been mapped to the 16q24.3 region
5
182
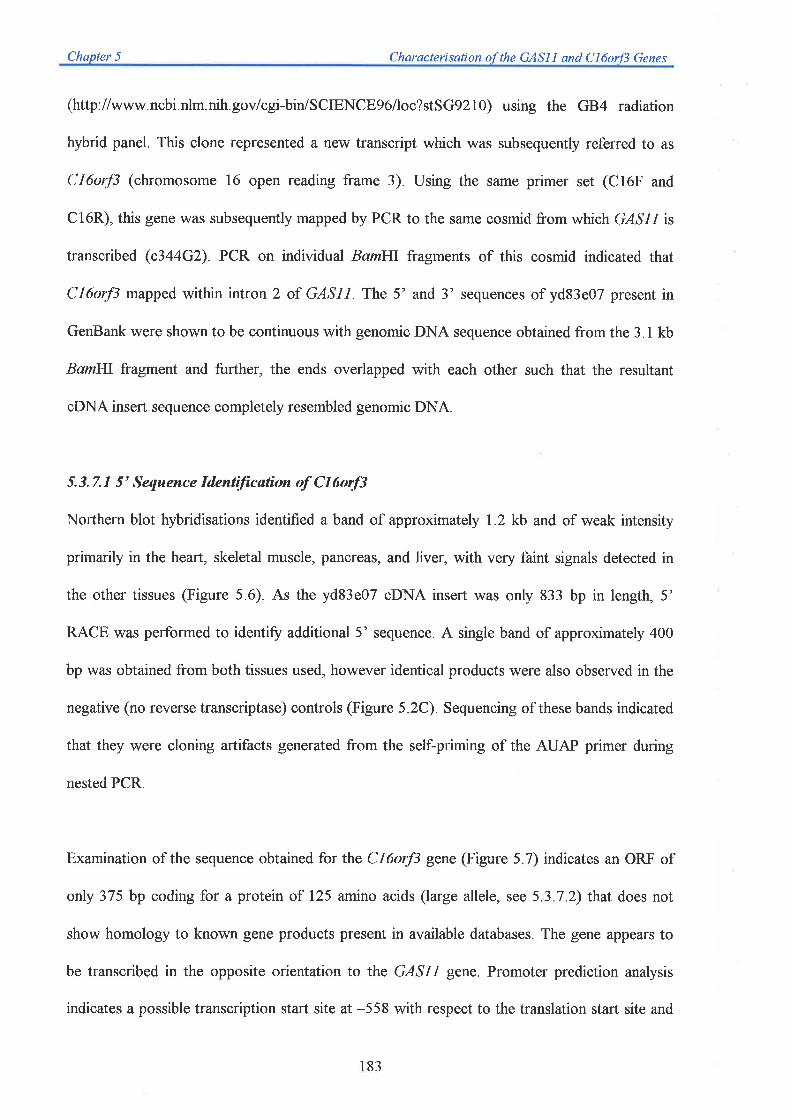
Chapter 5 Characterisation of the GASL I and Cl6or/3 Genes
(http://www.ncbi.nlm.nih.gov/cgi-bin/SclENcE96/loc?stsc9210) using the GB4 radiation
hybrid panel. This clone represented a new transcript which was subsequently referred to as
Cl6orf3 (chromosome 16 open reading frame 3). Using the same primer set (Cl6F and
Cl6R), this gene was subsequently mapped by PCR to the same cosmid from which GASI I is
transcribed @3aaG\. PCR on individual BamI{I fragments of this cosmid indicated that
Cl6orf3 mapped within intron 2 of GASLI. The 5' and 3' sequences of yd83e07 present in
GenBank were shown to be continuous with genomic DNA sequence obtained from the 3.1 kb
BamIil fragment and further, the ends overlapped with each other such that the resultant
oDNA insert sequence completely resembled genomic DNA.
5.3.7.1 5' Sequence Identificøtion of Cl6orß
Northern blot hybridisations identified a band of approximately 1.2 kb and of weak intensity
primarily in the heart, skeletal muscle, pancreas, and liver, with very faint signals detected in
the other tissues (Figure 5 6). As the yd83e07 cDNA insert was only 833 bp in length, 5'
RACE was performed to identify additional 5' sequence. A single band of approximately 400
bp was obtained from both tissues used, however identical products were also observed in the
negative (no reverse transcriptase) controls (Figure 5.2C). Sequencing of these bands indicated
that they were cloning artifacts generated from the selÊpriming of the AUAP primer during
nested PCR.
Examination of the sequence obtained for the Cl6orf3 gene (Figure 5.7) indicates an ORF of
only 37 5 bp coding for a protein of 125 amino acids (large allele, see 5.3 .7 .2) that does not
show homology to known gene products present in available databases. The gene appears to
be transcribed in the opposite orientation to the GASI I gene. Promoter prediction analysis
indicates a possible transcription start site at -558 with respect to the translation start site and
183
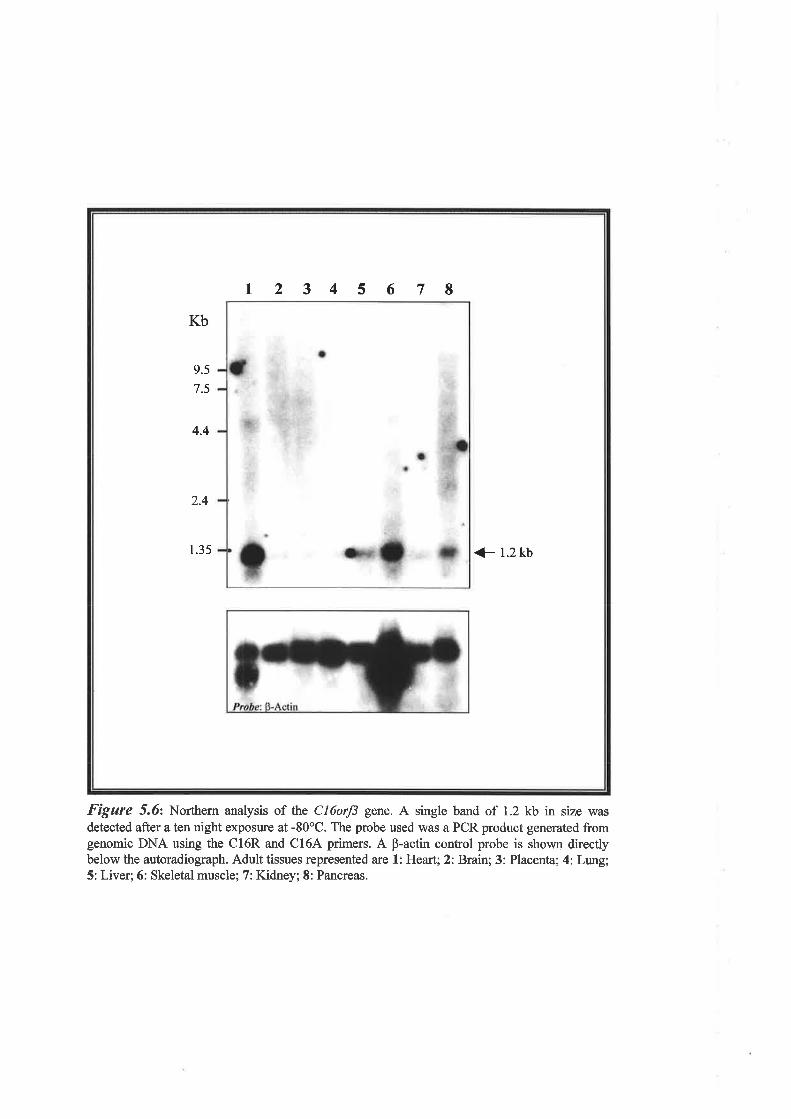
t 2 3 4 5 6 7IKb
9.5
7.5
4.4
2.4
1.35 + 1.2 kb
Fìgure 5.ó: Norttrern anaþsis of tlrre C16orJ3 gene. A single band of 1.2 kb in size wasdetected after a ten night exposr¡re at -80oC. The probe used was a PCR product generated fromgenomic DNA using the C16R and Cl6A primers. A p-actin control probe is shown directþbelow the autoradiograph. Adult tissues represented are 1: Heart; 2: Brain; 3: Placenta; 4: Ltrng;5: Liver;6: Skeletal muscle; 7: Kidney; 8: Pancreas.
ACCTGCAGTC
CGAGGTCGCG
CCCCAGGCCA
AAAAGAAGAC
GAGGGAGACA
AAGCTCCTGG
CTCAATATTC
TCCTAGGCCC
CCAGCTACTG
CCACCGCACT
CTTACTGTGA
AAGACAACGA
cGcAcccccG
GCAGACCTGA
AGATTTCTTA
ACAAGGCACT
GGCAGCCTGA
CCAGCCTGGG
GCCTTTTTCT
GCAAACAAGA
AATCCAACCA
ACCAAGGCTC
TAAATATCCA
CCCCAGTGAA
AGCAGCAGGA TGGTGTGAAC CCAGGAGGTG GAGCTTGCAG TGAGC
CCACACAGCG AGATTCCGTC AGAATCAGTT ACTTTTCGGG CACAG
TTCTCAACAC CACATTCCCC ACAGGGAAAA CACATTTCTC ACCTC
AGGAGCAGCA GGAGGGGTTC TGAGCCGAGG ATGCCGGGCA GACAT
GTGCCTCGGC ACAACGACAA ATGTCTTCAC GTCACAGACC TTTAG
CTGACTGGTC TGTTTGGCTC ACATGGTGTT GAGATTTTGC CATCA
GATTTCCAGC TTCTCTTGGA AAATCAGAAA AAAACAGCAC TGAAC
CAG ATGAAAC TGTCCTCTGC TGCGGGGCAG GAGTCTCCAG GTCAC
MKLSSAAGOESPGH
75
150
225
300
375
450
525
60014
CCCCATCCCT CCCCACCTGC CTGGACCCTG AAGAAGCCTT CTGAGTCTGT GGCTCAACGT GCGATGTGCA GTGCA
PHP SPPA VTL KKP SESV AQR AMC SA
AGGGCCTGCC CCGTAGCCTG CCCCGTAGGC TGCCCCGCAG CCTGCCCCGT AGGCTGCCCC ATAGCCTGCC CCGTA
RAC PVAC PVG CPA ACPV GCP IAC PV
GAATGGGAAG CGGACAGGGA GACGGGCAGC AGCTCACATG CTGGGACAAC GCAGTGTTCA ATCCATÍCTC CATCC
EVE ADRE TGS SSH AGTT QCS IHS PS
AGCAGCTCCA GACATCTTTC CAGAACACAA ACC TGACCCC ATCACCTCTC TGCTTAGCCA CTGGCTTAAA CTGCC
SSSRHLSRTQT
67539
75064
AGCTGCCCCG TAGCCTGCCC CGTAGGCTGC CCCGTA GGCT CCATGGCCAC TGCCCCACAA GGCC-IGTCTC CACAG 825
SCP VACP VGC PVG SMAT APO GLS PO 89
900tt4
97s125
AATGGTTTGC CTGCATGTAA AATAAAGCCA TTCTTTACCA TTAAAAAA 1023
Figure 5.7: Nucleotide sequence of the C16orf3 gene. The coresponding amino acids are indicated
below the nucleotide sequence. Residue numbers are indicated in the right hand column. The small allele is
missing 2 copies of the 12 bp imperfect repeat situated in the open reading frame (ORF) of the gene. This
repeat region is shown in red. The translation start site and the ORF stop codon are indicated by green type
and the position of the poyadenylation signal is underlined.
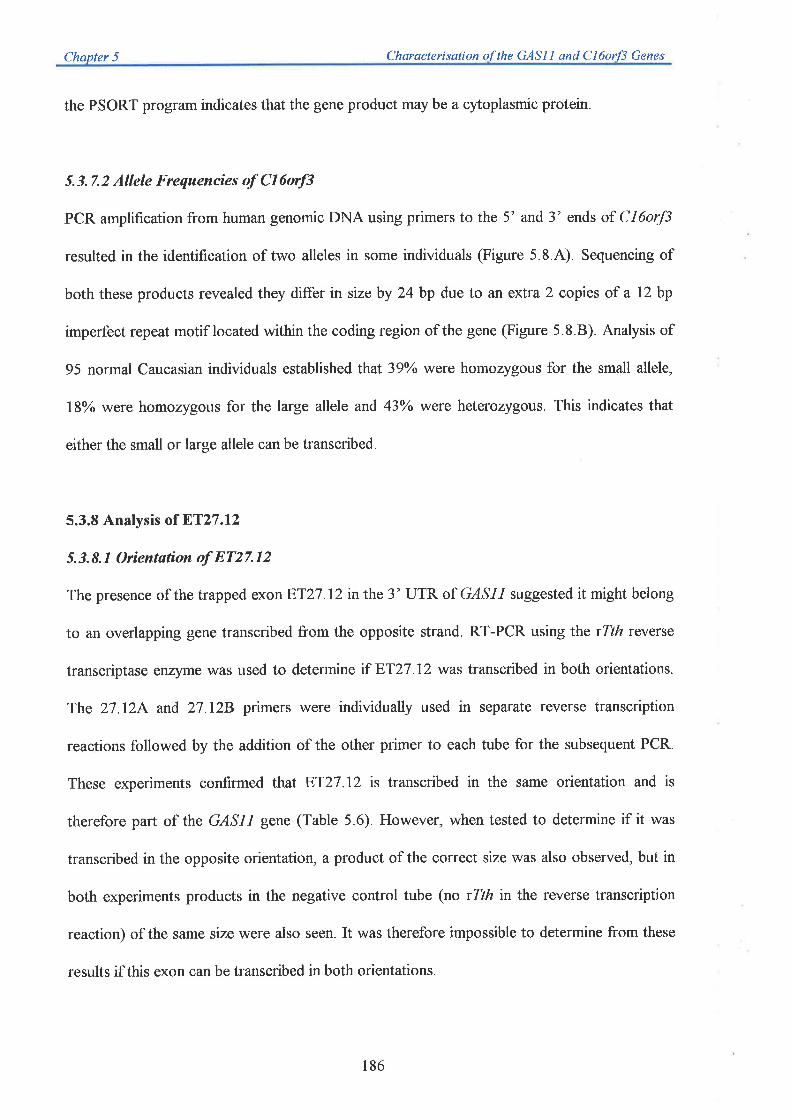
Chapter 5 Characterisation of the GASL l and CI6orß Genes
the PSORT program indicates that the gene product may be a cytoplasmic protein.
5.3.7.2 Allele Frequencies of Cl6orf3
PCR amplification from human genomic DNA using primers to the 5' and 3' ends of Cl6orf3
resulted in the identification of two alleles in some individuals (Figure 5.8 A) Sequencing of
both these products revealed they differ in size by 24 bp due to an extra 2 copies of a 12 bp
imperfect repeat motif located within the coding region of the gene (Figure 5.8.8). Analysis of
95 normal Caucasian individuals established lhat 39o/o were homozygous for the small allele,
18olo were homozygous for the large allele and 43Yo were heterozygous. This ìndicates that
either the small or large allele can be transcribed.
5.3.8 Analysis of ET27.l2
5.3.8.1 Orientutíon of 8T27.12
The presence of the trapped exonET2T .72 in the 3' UTR of GASI I suggested it might belong
to an overlapping gene transcribed from the opposite strand. RT-PCR using lhe rTth reverse
transcriptase enzyme was used to determine if ET27.72 was transcribed in both orientations.
The 27.12A and 2712B primers were individually used in separate reverse transcription
reactions followed by the addition of the other primer to each tube for the subsequent PCR.
These experiments confirmed that 8T27.12 is transcribed in the same orientation and is
therefore part of the GASI I gene (Table 5.6). However, when tested to determine if it was
transcribed in the opposite orientation, a product of the correct size was also observed, but in
both experiments products in the negative control tube (no rTth in the reverse transcription
reaction) of the same size were also seen. It was therefore impossible to determine from these
results if this exon can be transcribed in both orientations.
186
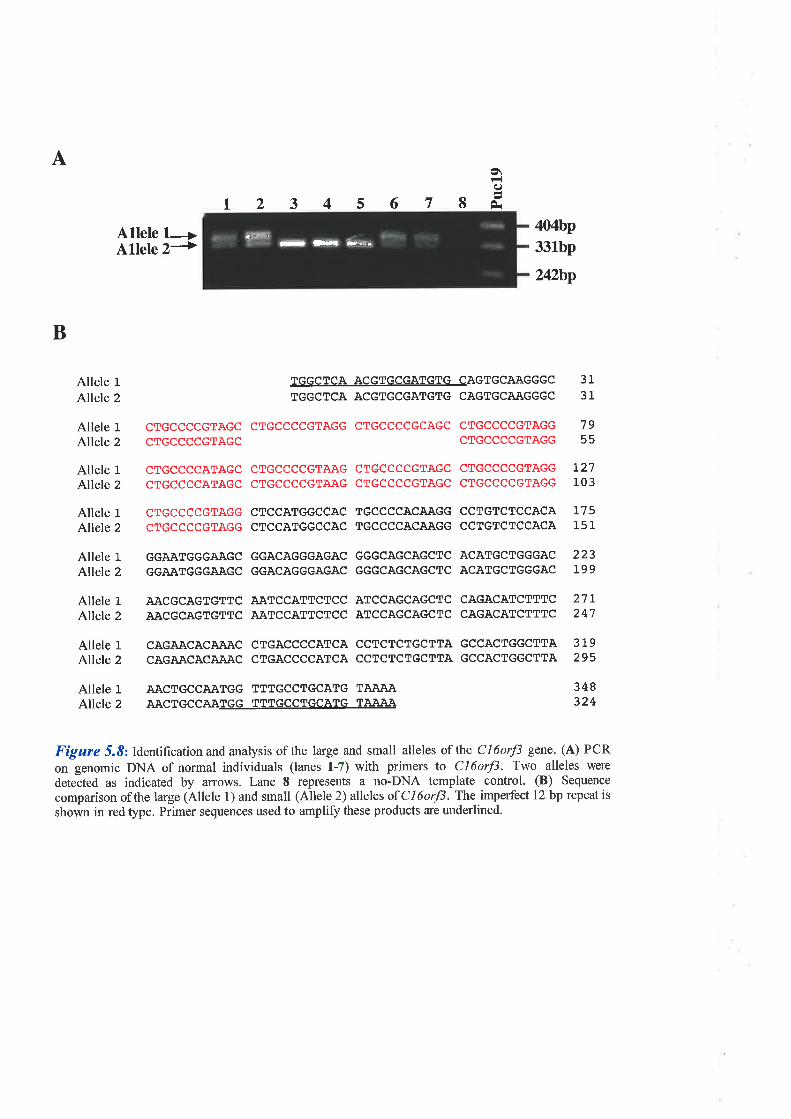
A
r2345678g\9È
Al,leleAllele
1---2+
404bp
33lbp
?A2bp
B
Allele 1
Allele 2
Allele 1
Allele 2
Allele 1
Allele 2
Allele IAllele 2
Allele 1
Allele 2
Allele 1
Allele 2
Allele 1
Allele 2
Allele 1
Allele 2
TGGCTCA ACGTGCGATGTG CAGTGCAAGGGC
TGGCTCA ACGTGCGATGTG CAGTGCAAGGGC
CTGCCCCGTAGC CTGCCCCGTAGG CTGCCCCGCAGC CTGCCCCGTAGG
CTGCCCCGTAGC CTGCCCCGTAGG
CTGCCCCATAGC CTGCCCCGTA.AG CTGCCCCGTAGC CTGCCCCGTAGG
CTGCCCCATAGC CTGCCCCGTA.A,G CTGCCCCGTAGC CTGCCCCGTAGG
CTGCCCCGTAGG CTCCATGGCCAC TGCCCCACAÀGG CCTGTCTCCACA
CTGCCCCGTAGG CTCCATGGCCAC TGCCCCACAAGG CCTGTCTCCACA
GGAATGGGAAGC GGACAGGGAGAC GGGCAGCAGCTC ACATGCTGGGAC
GGAATGGGAAGC GGACAGGGAGAC GGGCAGCAGCTC ACATGCTGGGAC
AACGCAGTGTTC AATCCATTCTCC ATCCAGCAGCTC CAGACATCTTTCAACGCAGTGTTC AATCCATTCTCC ATCCAGCAGCTC CAGACATCTTTC
CAGAACACAAAC CTGACCCCATCA CCTCTCTGCTTA GCCACTGGCTTA
CAGAACACAÄAC CTGACCCCATCA CCTCTCTGCTTA GCCACTGGCTTA
AACTGCCAATGG TTTGCCTGCATG TAÀAAAACTGCCAA@
3131
7955
127103
17515 t_
223199
27L247
319295
348324
Figure 5.8: Identificationandanalysis of the large and small alleles of the C16orJ3 gene. (A) PCR
on genomic DNA of normal individuals (lanes 1-7) with primers to C16orf3. Two alleles were
detected as indicated by arrows. Lane 8 represents a no-DNA template control. (B) Sequence
comparison of the large (Allele I ) and small (Allele 2) alleles of C I 6or/3 . The imperfect 12 bp repeat is
shown in red type. Primer sequences used to ampli$ these products are underlined.
i-
-
Fka
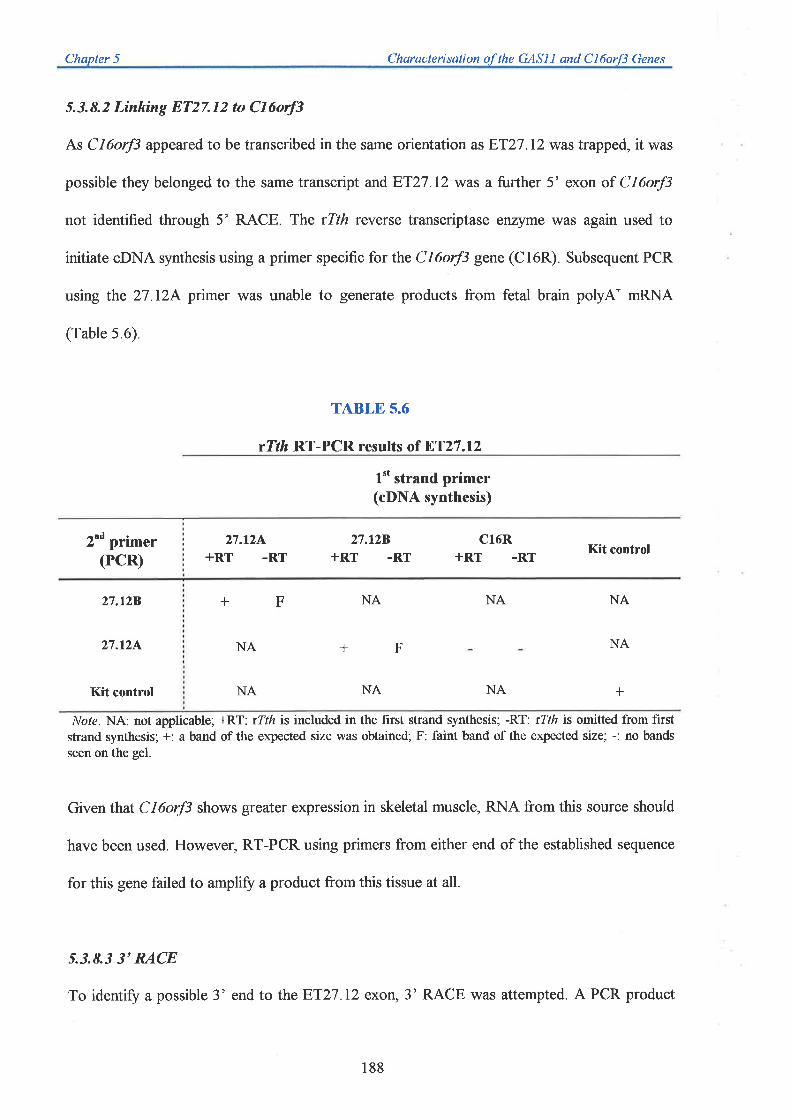
Chapter 5 Characterisation of the GASI I and Cl6orß Genes
5.3.8.2 Linking 8T27.12 to Cl6orf3
Ãs Cl6orf3 appeared to be transcribed in the same orientation as ET27 .12 was trapped, it was
possible they belonged to the same transcript and 8T27.12 was a further 5' exon of Cl6orf3
not identified through 5' RACE. The rTth reverse transcrþase enzyme was again used to
initiate cDNA synthesis using a primer specific for the CI6orf3 gene (C16R). Subsequent PCR
using lhe 27.124 primer was unable to generate products from fetal brain polyA* mRNA
(Table 5.6).
TABLE 5.6
rTthRT-PCR results of ET27.l2
l't strand primer(cDNA synthesis)
2nd primer(PCR)
27.12L+RT -RT
27.128+RT .RT
C16R+RT .RT Kit control
27.128 +
27.12^ NA + F
Kit control NA NA
ì/ofe. NA: not applicable; +RT: rTth is included in the first strand synthesis; -RT: rTfh is omitted from firststrand synthesis; +: a band ofthe expected size was obtained; F: faint band ofthe expected size; -: no bands
seen on the gel.
Given that Cl6orf3 shows grealer expression in skeletal muscle, RNA from this source should
have been used. However, RT-PCR using primers from either end of the established sequence
for this gene failed to amplifi a product from this tissue at all.
5.3.8.3 3'RACE
To identify a possible 3' end to the 8T27.12 exon, 3' RACE was attempted. A PCR product
NA
NA
F NA NA
NA +
188
Charqcterisation the GASI I qnd Cl Genes
v/as generated from polyA+ mRNA only, of about 23O bp (data not shown). From sequence
analysis this product appeared to have been generated from the binding of the original
anchored oligo-dT primer to bases 3,046 to 3,058 present in the 3' UTR of the GASII gene,
where the A residue constituted 10 of these 13 bases. The sequence of the product beyond the
ET27.l2 3' end was continuous with the sequence seen beyond this exon in the 3' UTR of
GASII, suggesting this product does not represent part of an overlapping gene to which
8T27.12 belongs.
5.3.9 Mutation Analysis of GASll
5.3.9.1 SSCP Analysis
To determine if this gene was a potential tumour suppressor gene involved in breast cancer,
primers were designed adjacent to exon sequences in intronic DNA to test for the presence of
mutations in breast tumour DNA. Primer sequences are listed in Table 5.4 and SSCP results
for the analysis of 17 tumour and matching normal DNA samples are shown in Table 5.7. No
nucleotide base changes were observed in the coding region of GASI I, however
polymorphisms were detected in introns 2 and 10 (IVS2+39G/A; IVS10+264IG and
rvsl0+44clT).
5. 3. 9. 2 llomozygous Deletions
A probe representing the entire coding region of GASI I (2e60g08 oDNA insert) indicated that
the genomic interval containing this gene is polymorphic for all enzymes tested which
complicated interpretation of results. However, hybridisation patterns seen in DNA from
normal individuals were also observed in the breast cancer cell line samples indicating that no
homozygous deletions of this region were disrupting the gene in the cell lines tested.
5
189

TABLE 5.7
Results of SSCP Analysis of GASll
ExonTumour
Loss16 1
.,3 456 7 8 91011
Complex
Note. +l+ indicates the same SSCP pattern was observed in both the tumour DNA and normal DNA respectively from the same
affected individual. P indicates a polymorphism detected as a bandshift in tumour and normal DNA from the same individual. ND:not done.
loss
+l++l++l++l++l++l++l++l+ND+l++l++l+ND
+l++l++l++l+
NDP
+l++l++l++l+P
+l++l++l++l++l++l+
+l++l++l++l+
+l++l++l++l++l++l+
+l++l++l++l+
ND+l++l++l++l++l++l+
ND+l++l++l++l++l++l++l++l++l++l++l++l+
+l++l++l++l+
+l++l++l++l++l++l++l++l+ND+l++l++l+ND
+l++l++l++l+
+l++l+ND+l++l++l+ND
+l++l++l++l+
+l++l++l++l++l++l+
ND+l++l++l++l++l++l++l++l++l++l++l++l+
+l++l++l++l+
+l++l++l++l++l++l++l++l++l++l++l++l+
+l++l++l++l+
ND
+l++l++l+ND+l++l++l+ND
+l++l++l++l+
+l++l++l++l++l+
ND+l++l++l++l++l++l++l++l++l++l++l+P
+l++l++l++l+
+l++l++l++l++l++l++l++l++l++l++l++l++l+
+l++l++l++l+
204
309
358
367
413
549
559
589
645
666757
819
979
t52380
670
683

Chapter 5 Characterisation of the GASL l ond Cl6orß Genes
5.3.9.3 Exon Skipping
Of all the breast cancer cell lines and breast tumours examined, not one gave rise to truncated
RT-PCR products with all primer sets tested. This excluded exon skipping as a mutational
mechanism and confirmed that there was no alternative splicing occurring in the gene.
5.3.10 Mutation Analysis of Cl6orß
Primers designed to encompass the ORF of the Clúorf gene (Table 5.4) were unable to
identify SSCP changes specific for the breast tumour DNA samples analysed.
5.4 Discussion
s.4.1GAS|l
The oDNA clones belonging to the trapped exons ET2717 and ET27.l2 have been
successfully linked and shown to be part of the GASI I gene.8T27.11 corresponded to exon 2
of this gene while 8T27.12 was trapped from the antisense strand within the 3'UTR. The
possibility that this trapped product belonged to an overlapping gene transcribed in the
opposite orientation was explored but failed to confirm the existence of such a gene. Analysis
of the nucleotide sequences surrounding this exon established that they highly resembled splice
acceptor and donor consensus sequences (scores of 89.2Yo and 97%o respectively). Therefore it
was likely this exon was trapped from genomic DNA. Based on the results of Northern
analysis it appears that many isoforms of this gene exist, particularly in skeletal muscle and
heart. Ubiquitous expression of a 3.4 kb mRNA corresponds to the observed nucleotide
sequence length obtained for the gene, while the ubiquitous 1.8 kb mRNA was most likely
derived from the use of an alternative polyadenylation signal located in the 3' UTR due to the
fact that exon skipping experiments failed to identiff alternatively spliced GASI I transcripts.
191
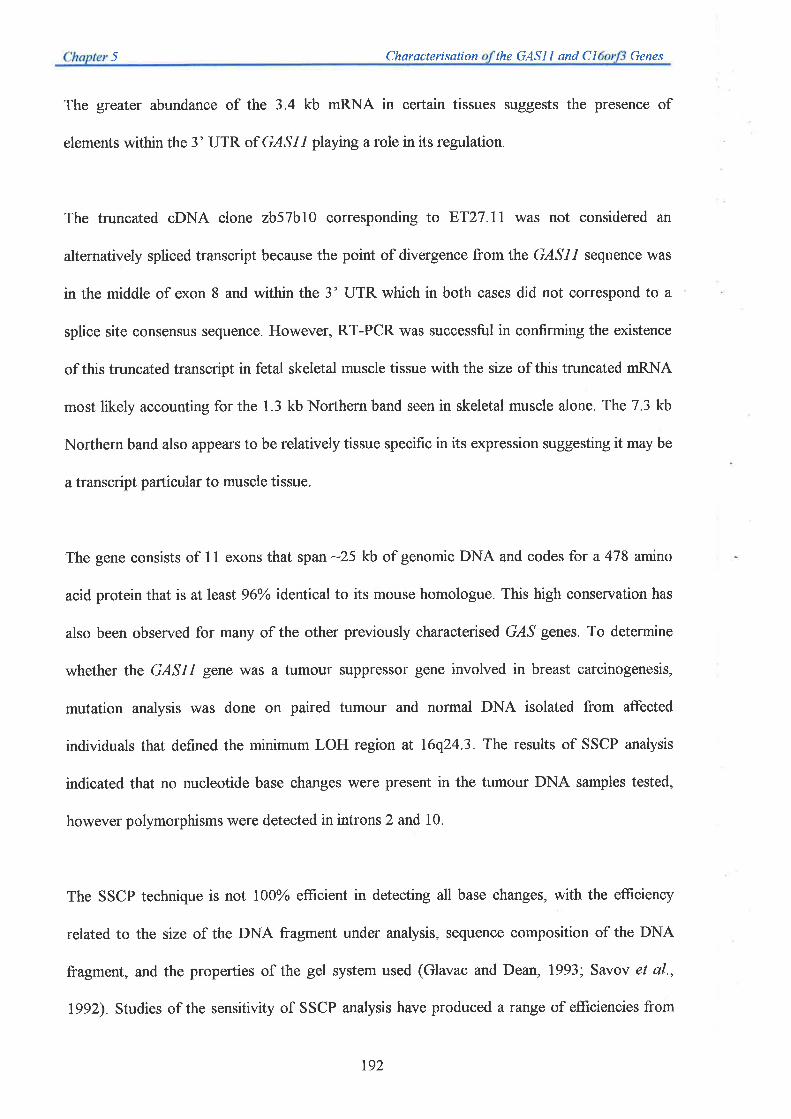
Characterisation the GASI I and CI Genes
The greater abundance of the 3.4 kb mRNA in certain tissues suggests the presence of
elements within the 3'UTR of G1S1,l playing a role in its regulation.
The truncated oDNA clone zb57b10 corresponding to 8T27.11 was not considered an
alternatively spliced transcript because the point of divergence from the GASI I sequence was
in the middle of exon I and within the 3'UTR which in both cases did not correspond to a
splice site consensus sequence. Ilowever, RT-PCR was successful in confirming the existence
of this truncated transcript in fetal skeletal muscle tissue with the size of this truncated mRNA
most likely accounting for the 1.3 kb Northern band seen in skeletal muscle alone. The 7.3 kb
Northern band also appears to be relatively tissue specific in its expression suggesting it may be
a transcript particular to muscle tissue.
The gene consists of l l exons that span -25 kb of genomic DNA and codes for a 478 amino
acid protein that is at least 96Yo identical to its mouse homologue. This high conservation has
also been observed for many of the other previously characterised G1,S genes. To determine
whether the GASI I gene was a tumour suppressor gene involved in breast carcinogenesis,
mutation analysis was done on paired tumour and normal DNA isolated from a.ffected
individuals that defined the minimum LOH region at 16q24.3. The results of SSCP analysis
indicated that no nucleotide base changes were present in the tumour DNA samples tested,
however polymorphisms were detected in introns 2 and 10.
The SSCP technique is not l}\yo efiìcient in detecting all base changes, with the efficiency
related to the size of the DNA fragment under analysis, sequence composition of the DNA
fragment, and the properties of the gel system used (Glavac and Dean, 1993; Savov et al.,
1992) Studies of the sensitivity of SSCP analysis have produced a range of efficiencies from
5
192

Chapter 5 Characterisation of the GAS| l and CI6orß Genes
-30 to over 90olo (reviewed in Jordanova et al., 7997), with the highest figures reported when
DNA fragments of -150 bp were used together with a range of electrophoretic conditions.
However since polymorphisms were identified in the GASI l SSCP screening and given the
sporadic nature of the tumours that were being analysed, the chance of missing all disease
causing mutations within the 17 tumour samples tested was therefore quite low.
Despite this, other methods of mutation detection were also examined and included a test for
exon skipping within the gene and a search for homozygous deletions in a subset of breast
cancer cell lines. Exon skipping as a result of splice site mutations or intronic deletions has
been observed as a mutation mechanism for a number of genes including TP53 in breast
cancer, RB in hepatocellular carcinoma, and ATPTA in occipital horn syndrome (Farshid et al.,
1994; Voglino et al., 1997; Qi and Byers, 1998). Homozygous deletions have also been
instrumental in identifying and narrowing down regions known to contain disease genes
identified from LOH studies or linkage analysis (Fearon et a1.,1990; Mollenhauer et a1.,1997;
Town et al., 1998). With the use of the whole GAS( l cDNA insert, 25 kb of genomic DNA
was effectively screened at once. Again these studies failed to detect aberrations in the GAS| l
transcript in breast tumour material suggesting this gene does not have a role in breast
carcinogenesis.
A function for the GASII gene based on its amino acid sequence and database homology
searches is not immediately obvious. What is consistent, is the similarity of this gene to the
non-muscle myosin heavy chain gene of a number of species, as well as similarity to the kinesin
heavy chain gene. Kinesin is a member of a family of microtubule based motor proteins that
perform force-generatingtasks which include organelle transport and chromosome segregation
(reviewed in Goldstein, 1993). The kinesin molecule consists of a tail domain at the C-
193
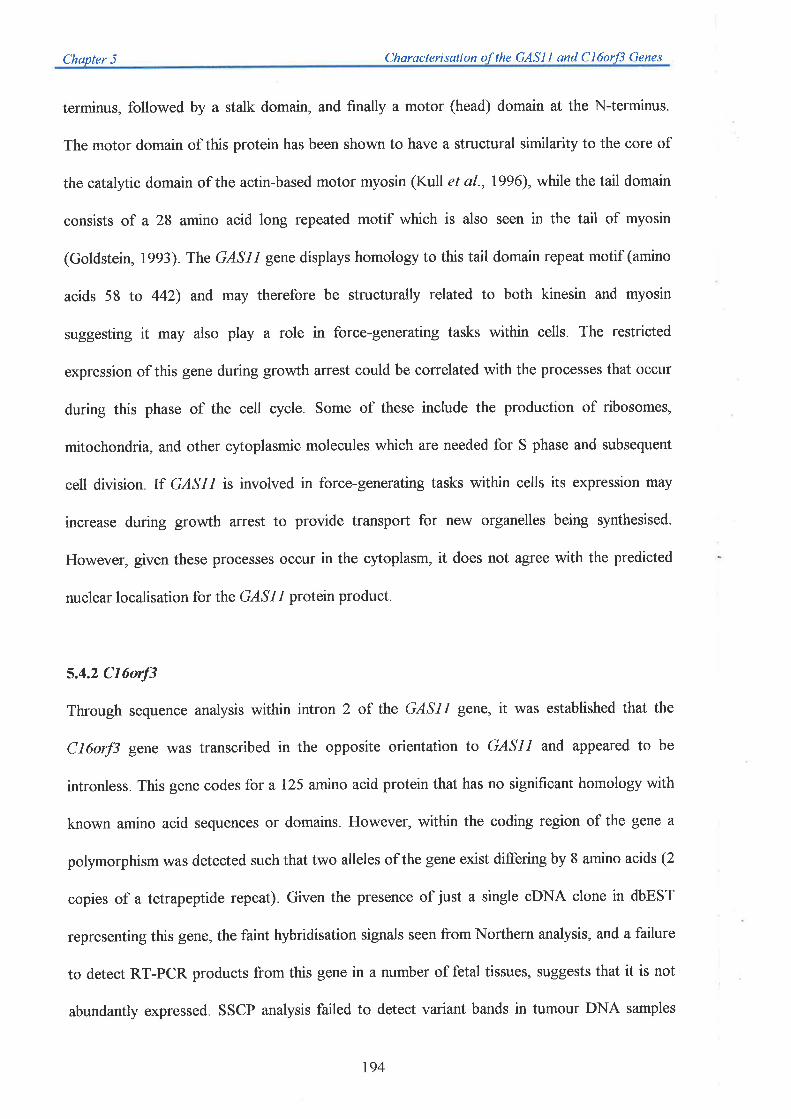
Chapter 5 Characterisation of the GASI I and Cl6orß Genes
terminus, followed by a stalk domain, and finally a motor (head) domain at the N-terminus.
The motor domain of this protein has been shown to have a structural similarity to the core of
the catalytic domain of the actin-based motor myosin (Kull el a1.,1996), while the tail domain
consists of a 28 amino acid long repeated motif which is also seen in the tail of myosin
(Goldstein, 1993). The GASI I gene displays homology to this tail domain repeat motif (amino
acids 58 to 442) and may therefore be structurally related to both kinesin and myosin
suggesting it may also play a role in force-generating tasks within cells. The restricted
expression of this gene during growth arrest could be correlated with the processes that occur
during this phase of the cell cycle. Some of these include the production of ribosomes,
mitochondria, and other cytoplasmic molecules which are needed for S phase and subsequent
cell division. If GASLI is involved in force-generating tasks within cells its expression may
increase during growth arrest to provide transport for new organelles being synthesised.
However, given these processes occur in the cytoplasm, it does not agree with the predicted
nuclear localisation for the GASI I protein product.
5.4.2 CI6od3
Through sequence analysis within intron 2 of the GASII gene, it was established that the
Cl6orf3 gene was transcribed in the opposite orientation to GASLI and appeared to be
intronless. This gene codes for a 125 amino acid protein that has no significant homology with
known amino acid sequences or domains. Ilowever, within the coding region of the gene a
polymorphism was detected such that two alleles of the gene exist differing by I amino acids (2
copies of a tetrapeptide repeat). Given the presence of just a single cDNA clone in dbEST
representing this gene, the faint hybridisation signals seen from Northern analysis, and a failure
to detect RT-PCR products from this gene in a number of fetal tissues, suggests that it is not
abundantly expressed. SSCP analysis failed to detect vanant bands in tumour DNA samples
794
Chapter 5 Characterisatian of the GAS| l and Cl6orß Genes
when compared to matched normal samples suggesting this gene does not play a role in breast
tumourigenesis
The possibility of mutations occurring outside the coding region of both these genes was not
explored in this study. Alterations in the pattern of DNA methylation have been observed as a
consistent mechanism in a wide variety of cancers (Jones, 1996) due to aberrant
hypermethylation of CpG islands in the 5' regulatory regions of genes. Transcriptional
silencing by methylation of several tumour suppressor genes has been identified including RB
(Sakai et a1.,1991), VHL (Herman et al., 1994), and CDHI (Yoshiura et al., 1995). Future
DNA methylation studies of both GASII and Cl6orf3 therefore may need to be explored to
provide further evidence that both of these genes are not involved in breast tumourigenesis.
195
Churücterisation
of Trunscription
Unit 6 Q6)
Chqoter 6 Characterisation of Transcription Unit 6 [6)
Table of Contents
6.L Introduction
6.2 Methods
6.2.1 T 6 Sequence Assembly
6.2.2 Direct Cosmid Sequencing
6.2.3 Genomic Structure Characterisation
6.2.4PCF.
6.2.5 Single Stranded Conformation Polymorphism (SSCP) Analysis
6.2.5.1 PCRAmplificqtion of Tumour and Normal DNA
6.2.5.2 SSCP Gels
6.2.5.2.1 l0oÁ Polyacrylamide Gels
6.2.5.2.2 Mutation Detection Enhqncement (A4DE) Gels
6.2.6Patient Material used for SSCP
6.2.7 Exon Skipping
6.3 Results
6 3 1 Sequence Analysis of T6 oDNA Clones
6.3.2T6 Northern Analysis and 5' Sequence Isolation
6.3.3 T6 Sequence Homologies
6.3.4 T6 Genomic Structure
6 3.5 Mutation Analysis
6.3.5.1,S,SCP Results
6.3.5.2 Exon Skipping
6.3.6 Alternative T6 TranscriPts
6.3.6.1 T6A
6.3.6.2 T68
6.3.6.2.1 Mapping T68
6.3.6.2.2 T68 Northern Arnlysis and Sequence Homologies
6.3.6.3 T6C
6.4 Discussion
6.4.7 T6
6.4 2 T6Isoforms
196
Page
197
197
199
r99
199
199
200
203
203
203
204
204
205
205
205
206
210
210
210
274
214
217
217
220
22t227
222
222
223
Chapter 6 Characferisation Unit 6 (76)
6.1 Introduction
From the results described in chapter 4, a number of potential novel genes were identified in
16q24.3 based on the nucleotide sequence homology of trapped exons to ESTs present in
dbEST. A group of five exons consisting of ETfi .23,8T6.14,8T77 .9,ETl7 .2 andETlT .I4
could be grouped into a single transcription unit termed T6, based on the nucleotide homology
of overlapping oDNA clones (see Table 4.3).In addition, the close physical location of these
trapped exons with respect to each other provided further evidence that they belonged to the
same gene (Figure 4.4). Another feature of this region was the presence of two additional
cDNA clones. The first of these, yc81e09, was identified following the construction of a hn-
cDNA library of human chromosome 16 (Whitmore et al., 1994). The hn-cDNA clone
SoDNA-455 was used as a probe to screen a gridded fetal brain oDNA library at Lawrence
Livermore laboratories, subsequently selecting yc8le09 as a homologous clone. A second
additional cDNA clone located close to this group of trapped exons was 2e25b01, identifìed
from BLASTN analysis of the partial sequence of cosmid 360D7 (Table 4 6). Based on their
close physical proximity, these trapped exons and cDNA clones may therefore collectively
represent a single gene, which because of its location at 16q243, could be considered a
candidate breast cancer tumour suppressor gene.
This chapter describes the determination of the relationship of the trapped exons and
homologous oDNA clones located within this close physical proximity and the subsequent
characterisation of the transcript. As described in the previous chapter, this involves
determining the complete nucleotide sequence of the associated gene in order to obtain the
amino acid sequence of the encoded protein product. This may provide functional information
based on homology to previously characterised gene products present in available databases,
196

Chapter 6 Characterisøtion ption Unit 6 (76)
and therefore a prediction of its possible role in breast carcinogenesis. In addition,
determination of its genomic structure and subsequent mutation analysis of the fullJength
transcript using an extended panel of breast tumour material from that used in the previous
chapter, will determine if this gene is mutated in breast cancer.
The majority of the work presented in this chapter was performed by the candidate and Ms.
Joanna Crawford with a small amount of sequence data provided by Dr. Sinoula Apostolou.
Both individuals will be acknowledged for their contributions where appropriate in the text.
6.2 Methods
Only those procedures performed specifically in this chapter are mentioned in detail. More
general techniques are described in chapter 2, or other chapters as indicated. However slight
modifications are referred to when appropriate in the text.
6.2.1 T6 Sequence Assembly
The gDNA clones yc81e09, ze25b}l, and zbl7g05 were purchased from Genome Systems and
DNA was isolated using Qiagen columns (2.2.1.3). All clones were initially sequenced using
DyePrimer chemistry Q.218.2) which was specific for vector sequences adjacent to the insert
cloning sites, followed by DyeTerminator sequencing Q..2.1S.1) with insert specific primers.
Clones yc81e09 and ze25b01 were sequenced by the candidate with confirmation provided
from the sequencing of the zblTg}S clone by Ms. Joanna Crawford. Dr. Sinoula Apostolou
also provided assistance in sequence confirmation. Primers used to sequence yc81e09 and
ze25b01 are shown in Table 6.1. The BLASTN and BLASTP programs (Altschul et al., 1997)
were used to search for nucleotide sequence homology and amino acid homology respectively,
between T6 and sequences deposited in the GenBank non-redundant and EST databases as
197
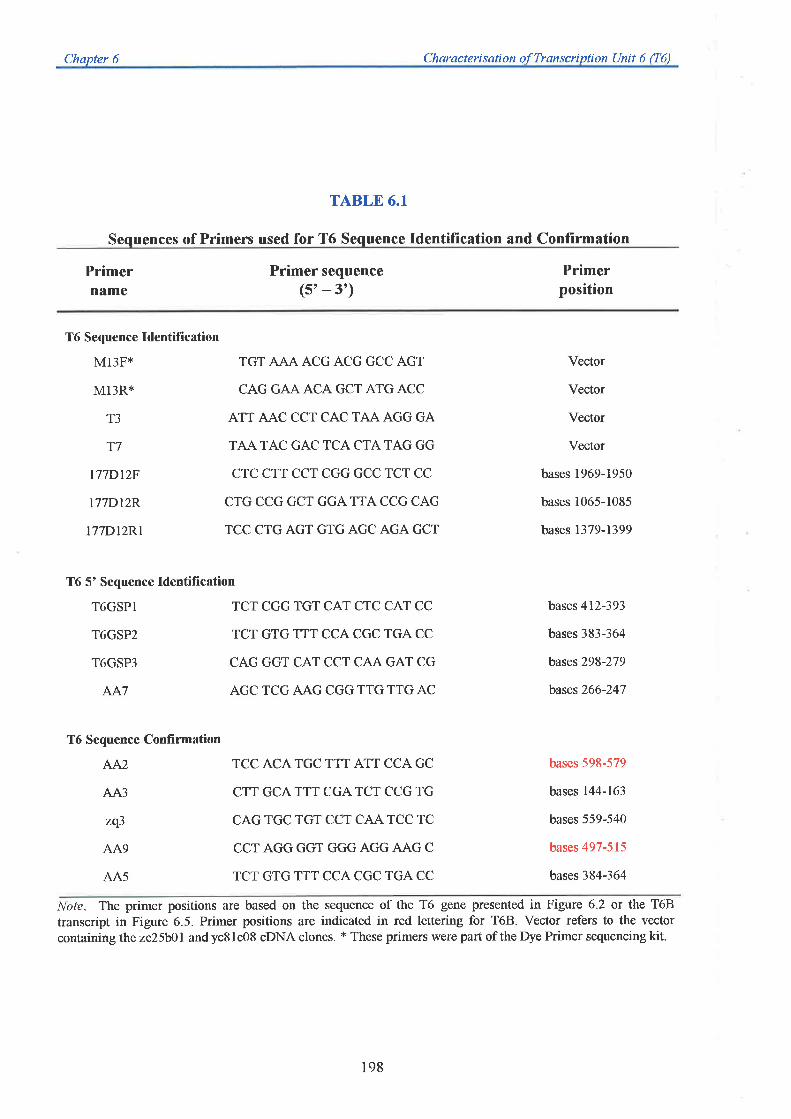
Chapter 6 Characterisation of Transcription Unit 6 (76)
TABLE 6.1
Sequences of Primers used for T6 Sequence Identification and Confirmation
Primername
Primer sequence(s',- 3')
Primerposition
T6 Sequence Identification
MI3F* TGT fuqÁ. ACG ACG GCC AGT
MI3R* CAG GAA ACA GCT ATG ACC
T3 ATTAACCCTCACTAAAGGGA
T7 TAATAC GAC TCA CTATAG GG
I77DI2F CTC CTT CCT CGG GCC TCT CC
L77DI2R CTG CCG GCT GGA TTA CCG CAG
ITTDIZF.I TCCCTGAGTGTGAGCAGAGCT
T6 5' Sequence Identification
T6GSP1 TCTCGGTGTCATCTCCATCC
T6GSP2 TCTGTGT]TCCACGCTGACC
T6GSP3 CAG GGT CAT CCT CAAGAT CG
AA7 AGCTCGAAGCGGTTGTTGAC
Vector
Vector
Vector
Vector
bases 1969-1950
bases 1065-1085
bases 1379-1399
bases 412-393
bases 383-364
bases 298-279
bases 266-247
bases 598-579
bases 144-163
bases 559-540
bases 497-515
bases 384-364
T6 Sequence ConfÏrmation
AA2
AA3
zq3
AA9
AA5
TCC ACATGC TTT ATT CCA GC
CTT GCATTT CGATCT CCGTG
CAG TGC TGT CCT CAA TCC TC
CCT AGG GGT GGG AGG AAG C
TCT GTG TTT CCA CGC TGA CC
Note. The primer positions are based on the sequence of the T6 gene presented in Figure 6.2 or the T6B
transcript in Figure 6.5. Primer positions are indicated in red lettering for T6Ël. Vector refers to the vector
containing the ze25b0l and yc8le08 cDNA clones. * These primers were part of the Dye Primer sequencing kit.
198
Chapter 6 Characterisqtion of Transcription Unit 6 (16)
described in 5.2.3
6.2.2 Direct Cosmid Sequencing
The cosmid 360D7 contains the T6 transcript and was used as a template to sequence the 5'
UTRusing the BigDye Terminator sequencing kit. In a20 ¡tl volume, 600 ng of cosmid DNA
was mixed with 30 ng of AA7 primer (Table 6 1) and 8 pl of the BigDye mix. After addition of
a drop of paraffin oil, the tubes were incubated at 95"C for 5 minutes. PCR was then
performed with 80 cycles of 95"C for 30 seconds; 50"C for 20 seconds; 60'C for 4 minutes.
All reactions were cleaned as describedin2.2.18.7.
6.2.3 Genomic Structure Characterisation
Ms. Joanna Crawford was solely responsible for the sequencing of all exon/intron boundaries
of the T6 gene using methods similar to those described in chapter 5. Primarily the two
methods chosen were sequencing genomic PCR products generated from primers specific for
the cDNA sequence of T6, and direct sequencing of the 360D7 cosmid with cDNA specific
primers as described in 6.2.2
6.2.4 PCR
PCR reactions were performed essentially as describedin2.2.14.l. All products were analysed
on 2.5Yo (ilÐ agarose gels. RT-PCR reactions were performed as described in 2.2.15. The
sequences of all primers used are shown in Table 6.1.
6.2.5 Single Stranded Conformation Polymorphism (SSCP) Analysis
The large number of exons and tumour samples to be analysed dictated that the SSCP analysis
was to be shared among three individuals. Exons 1 to 10 were analysed by Ms. Joanna
799
Chøpter 6 Charac
Crawford using tumour samples 204, 309, 358, 589, 645, 757, 919, 424, 438, 439, 377, 355,
555, 581, 152,380, 670, 683,768, and 594. Exons 1l to 18 were examined by the candidate
using the same set of tumour samples as above, except sample 448 was used instead of sample
377,wllle Dr. Anna Savoia (Italy) tested all exons with the tumour samples 367,473,549,
559,666, and 819. Exons 1 and l8 were each split into two overlapping PCR fragments due to
their size. These are referred to as exon 7.1,7.2,18.1, and 18.2
6.2.5.1 PCRAmpfficatíon of Tumour and Normøl DNA
Exon specific sequences were amplified from tumour and control DNA samples using
procedures modified from Kogan et al. (7987). Ten microlitre reactions were prepared which
contained 5 ¡rl of 2X PCR mix, 150 ng of each primer (Table 6.2), 30 ng of patient DNA! 0.5
units of Zaq DNA polymerase,0.2 ¡l of ¡a-32l1dCTP and MgCl2 optimal for each primer pair
(see Table 6.2). After addition of a drop of paraffin oil, the tubes were incubated for 10 cycles
at94"C for 1 minute; 55'C for 1.5 minutes; 72"C for 1.5 minutes, followed by a further 25
cycles of 94"C for I minute; 60"C for 1.5 minutes; 72"C for 1.5 minutes, with afnal extension
of 72"C for 7 minutes. Primers specific for exons 7.2 and 18.2 were amplified for 35 cycles
with an annealing temperature of 60oC. Following the PCR reaction, l0 pl of formamide
loading buffer was added to each sample, mixed, spun down, and left at 4"C until ready to load
on the appropriate gel. Prior to loading, samples were incubated at 100"C for 10 minutes, then
placed on ice. Four microlitres of each sample was then immediately loaded on the appropriate
gels.
Exons in which SSCP changes were detected were amplified from tumour and normal DNA
from the same individual using the conditions originally used for the SSCP analysis with the
200

Chapter 6 Chara
TABLE 6.2
Olisonucleotide Primers for Mutation Analvsis of T6
Primer Nucleotide sequences(5'-3')
Size(bp)
Optimal[Mg**]set
T6 SSCPExon 1.1
ExonL2
Exon 2
Exon 3
Exon 4
Exon 5
Exon 6
Exon 7
Exon 8
Exon 9
Exon 10
Exonl1
Exonl2
GCA CGG CGC GCA GAC ACC CAACA TAG GAC CGA ACG ACC AC
GTG GTC GTT CGG TCC TAT GTCTG GCA TCA CAA CCC CGC T
CAC ATC TCA CTA TTC ATA TCT CGGC TGG GTG CCT TGG AAC TC
CGC TTG CTG CTT TAA TTC TCA CCAC AGC CAG GCC CAA CTC AC
GTAAAT ACA GTG TAATAG GTC TCGCC ACA CCT GTG CTC CAC
CTT TTG GAA TCG TCT TAG AACGGT AAA CTA GCT TCA GGA AC
CTT GGT CCC CAC ACG CCA CGGG CCA GTG CAC AGA CAA C
CGG AGC TGC CCA CGT CCT TGGGG CAG GAG GCA GCA TGC CT
AGC TGG GGC CTT GCT GAG TGCTG TCT TGA TAG CTT GAG GTG
CAG AGG AGG GGC CGT GGT TGCCC AGC CTC ACT CGC AGG AG
GCA TTC TCC TTT GTG TCG TTGGAA CAG GGG CAT CGT CAG G
CCA CTC TCA GCC TGA CGA TGGCG CAC AGA TAC TGA ACC AAG
GTC TTT ATG ACT TAA GGC TCC ACCCA GGA AGA GCA GCC CCC AC
276
299
222
246
3t7
172
232
215
204
313
215
227
275
0.5 mM
0.5 mM
1.5 mM
1.5 mM
0.5 mM
1.5 mM
2.5 mM
l5mM
1.5 mM
1.5 mM
1.5 mM
1.5 mM
0.5 mM
201
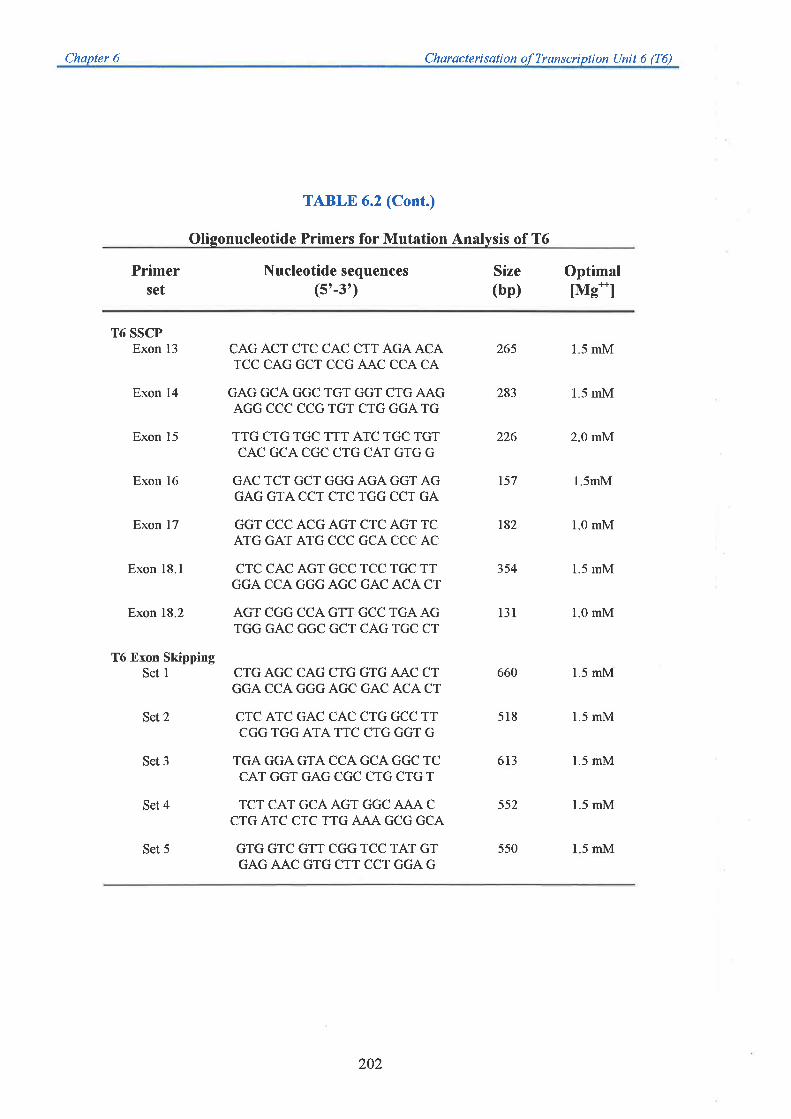
Chapter 6 Characterisation ofTranscription Unit 6 (f6)
TABLE 6.2 (Cont.)
Oligonucleotide Primers for Mutation Analysis of T6
Primer Nucleotide sequences(5'-3')
Size(bp)
OptimalIMg**lset
T6 SSCPExon 13
Exon 14
Exon 15
Exon 16
Exon 17
Exon 18.1
Exon 18.2
T6 Exon SkippingSet I
Set 2
Set 3
Set 4
Set 5
CAG ACT CTC CAC CTT AGA ACATCC CAG GCT CCG AAC CCA CA
GAG GCA GGC TGT GGT CTG AAGAGG CCC CCG TGT CTG GGATG
TTG CTG TGC TTT ATC TGC TGTCAC GCA CGC CTG CAT GTG G
GAC TCT GCT GGG AGA GGT AGGAG GTA CCT CTC TGG CCT GA
GGT CCC ACG AGT CTC AGT TCATG GAT ATG CCC GCA CCC AC
CTC CAC AGT GCC TCC TGC TTGGA CCA GGG AGC GAC ACA CT
AGT CGG CCA GTT GCC TGA AGTGG GAC GGC GCT CAGTGC CT
CTG AGC CAG CTG GTG AAC CTGGA CCA GGG AGC GAC ACA CT
CTC ATC GAC CAC CTG GCC TTCGG TGG ATA TTC CTG GGT G
TGA GGA GTA CCA GCA GGC TCCAT GGT GAG CGC CTG CTG T
TCT CAT GCAAGT GGC fu\ACCTG ATC CTC TTG tu{r\ GCG GCA
GTG GTC GTT CGG TCC TAT GTGAGAAC GTG CTT CCT GGAG
265
226
283
157
182
354
l3l
518
613
552
1.5 mM
1.5 mM
2.0 mM
1.5mM
1.0 mM
1.5 mM
660
1.0 mM
1.5 mM
15mM
1.5 mM
1.5 mM
1.5 mM
550
202
Chapter 6 Characterisation ofTranscriotion Unit 6 ï6)
omission of [ü,-32P]dCTP. PCR products were cleaned using QlAquick columns Q.2.76.1) and
sequenced using DyeTerminator chemistry Q.2.18.1) with the primers originally used for the
amplification.
Population screening of polymorphisms identified from SSCP analysis used the same PCR
conditions as above, however 50 ng of genomic DNA was used as a template. Gel conditions
were performed as for the original SSCP analysis (6.2.5.2).
6.2.5.2 SSCP Gels
To reveal any conformational differences between PCR products generated from tumour as
opposed to normal tissue within affected individuals, non-denaturing gels were used. The
dimensions of the gel plates used were 50 cm X 37.5 cm X 0.4 cm and two separate gel
systems were used to maximise the chance of detecting a bandshift (Hayashi, 1992; Orita et ø1.,
1e8e).
6.2.5.2.1 I0%o Polyacrylamide Gels
10% S SCP gels were prepared by the addition of 24.5 nl of 40Yo acrylamide, 10 ml of 2Yo Bis,
5%o glycerol,20 n11, of 5X TBE, and 130 pl each of TEMED and25Yo (dv) APS per 100 ml of
gel solution. Polymerisation was allowed to proceed for at least 2 hours. The gel was then run
for 24 hours at70O volts in lX TBE after sample loading.
6.2.5.2.2 Mutation Detection Enhqncement (MDE) Gels
To increase the chance of detecting any mutation, samples were also run on MDE gels. MDE
is a modified polyacrylamide based vinyl polymer, which allows for increased sensitivity
203

Chapter 6 Characterisation of Transcription Unit 6 [6)
without loss of resolution. MDE gels were prepared by the addition of 30 ml of MDE solution,
9.6 rnl of lX TBE, and 100 pl each of TEMED aîd25yo (w/Ð APS per 80 rnl of gel solution.
The gel was run for 24 hours at7Ù0 volts in 0.6X TBE.
6.2.6Patient Material used for SSCP
Tumour DNA was isolated from freshly frozen breast tissue containing at least 50olo tumour
cells as assessed by H and E stained sections. Corresponding normal DNA was isolated from
peripheral blood lymphocytes from the same patients. All DNA samples were generously
isolated and provided by one of our collaborators, Dr. Anne-Marie Cleton-Jansen (Leiden).
The tumours used for this analysis were selected for LOH only at 76q24.3,loss at 16q24.3 and
76q22.7 with retention in between, whole 16q loss, and a small number with complex loss.
This was to ensure that in the majority of samples tested, chromosomal band 16q24.3 was the
region targeted by LOH. All LOH analysis of tumour samples was done by Dr. Anne-Marie
Cleton-Jansen as previously described (Cleton-Jansen et al., 7994), using at least 25
polymorphic markers spanning the whole 16q chromosome arm (see Figure 1.4 for the latest
unpublished data).
6.2.7 Exon Skipping
Selected primers listed in Table 6.2 were used in RT-PCR reactions (2.2.15) on RNA isolated
from breast cancer cell lines to test for the presence of exon skipping in the T6 gene. The
breast cancer cell lines examined were BT20, MDA-453 , ZR-75,8T-474,8T-549, ZR-75-30,
UACC893, MDA-468, and MDA-23L,with amplifìcation from fetal heart RNA and the normal
breast epithelial cell line, HBL-100, acting as positive controls. A total of 5 overlapping primer
sets were used, 777 .371777 .25, 777 .341777 .17, 777 .131777 .22, 177 .381777 .40, and
177.11177.5 with products being run on 2.5Yo agarose gels.
204
Chapter 6 Characterisation ofTranscription Unit 6 (16)
6.3 Results
6.3.1 Sequence Analysis of T6 cDNA Clones
Sequencing of the cDNA clone yc81e09 indicated an insert of 1,640 nucleotides which
contained an open reading frame (ORF) of 1,540 bp extending from the 5' end. This sequence
was used to screen dbEST which identified a total of 92 independent homologous human
cDNA clones (including yc81e09) together with 51 mouse ESTs, indicating that it is a
relatively abundant transcript. An overlapping cDN{ zbl7g05, contained alarger insert which
not only contained an extra 66 bp absent in yc8le09, but extended the sequence 5' a further
264 bp, with both additions maintaining the ORF. The 5' end was also homologous to the
oDNA ze25b}l that was originally identified from sequence analysis of the cosmid 360D7.
This clone provided a further 190 bp of 5' sequence and confirmed that both itself and yc81e09
most likely form part of the same transcript, as suggested by physical mapping results.
Additional oDNA homologies (oDNA clone zq50d09) identified a further 60 bp of 5' sequence
such that in total 2,220 bp of sequence was obtained which contained an ORF of 2,055 bp
extending from the 5' end.
This sequence also contained all of the trapped exons (8T77.23,8T6.14,8T77.9,8T77.2, and
8T77.14) which had been physically mapped to the same region, with ETl7.9 being the
adjacent 5' exon to ET6.14. These exons immediately provide apafüal genomic structure to
the gene.
6.3.2T6 Northern Analysis and 5' Sequence Isolation
Ms. Joanna Crawford used the insert of the oDNA clone zbl7g05, which contained most of the
T6 sequence, to probe a coÍrmercial Northern blot filter. A 2.4 kb band was detected in all
205
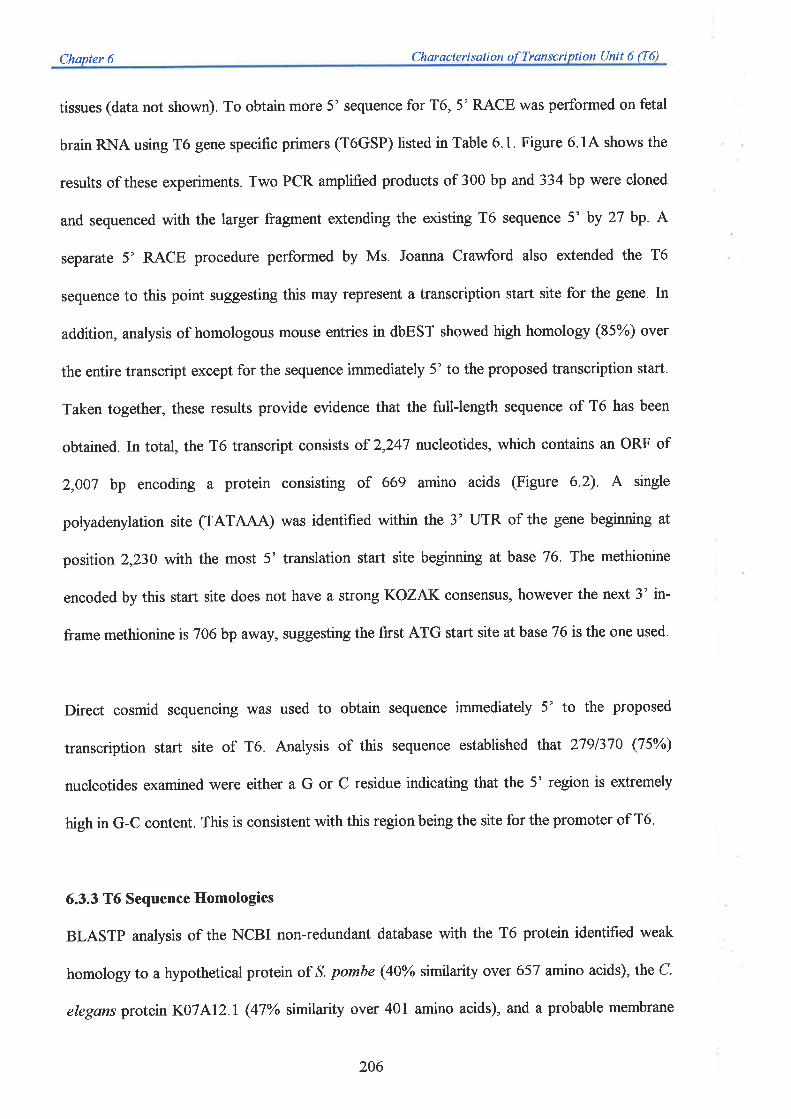
Chapter 6 Characterisation ofTranscription Unit 6 (T6)
tissues (data not shown). To obtain more 5' sequence for T6, 5' RACE was perfbrmed on fetal
brain RNA using T6 gene specific primers (T6GSP) listed in Table 6.1. Figure 6.14 shows the
results of these experiments. Two PCR amplified products of 300 bp and 334 bp were cloned
and sequenced with the larger fragment extending the existing T6 sequence 5' by 27 bp. A
separate 5' RACE procedure performed by Ms. Joanna Crawford also extended the T6
sequence to this point suggesting this may represent a transcription start site for the gene. In
addition, analysis of homologous mouse entries in dbEST showed high homology (85%) over
the entire transcript except for the sequence immediately 5' to the proposed transcription start.
Taken together, these results provide evidence that the full-length sequence of T6 has been
obtained. In total, the T6 transcript consists of 2,247 nucleotides, which contains an ORF of
2,007 bp encoding a protein consisting of 669 amino acids (Figure 6 2) A single
polyadenylation site (TATAAA) was identifìed within the 3' UTR of the gene beginning at
position 2,230 with the most 5' translation start site beginning at base 76. The methionine
encoded by this start site does not have a strong KOZAK consensus, however the next 3' in-
frame methionine is 706 bp away, suggesting the first ATG start site at base 76 is the one used.
Direct cosmid sequencing was used to obtain sequence immediately 5' to the proposed
transcrþion start site of T6. Analysis of this sequence established that 2791370 (75%)
nucleotides examined were either a G or C residue indicating that the 5' region is extremeþ
high in G-C content. This is consistent with this region being the site for the promoter of T6.
6.3.3 T6 Sequence Homologies
BLASTP analysis of the NCBI non-redundant database with the T6 protein identified weak
homology to a hypothetical protein of ,S. pombe (4O% similarity over 657 amino acids), the C.
elegans protein KO7AlzJ (47% similarity over 401 amino acids), and a probable membrane
206
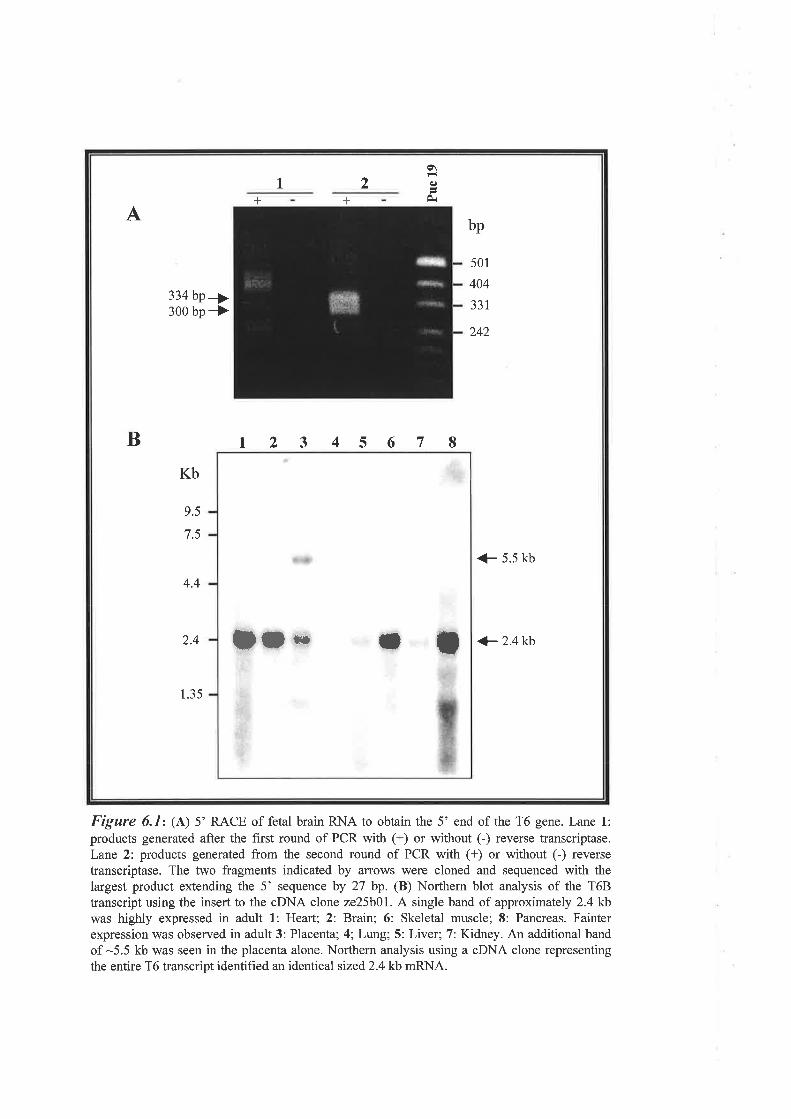
1 2
o\q)
È+ +A
bp
334300
bpbp+_>
501
404
331
242
B t 2 3 4 5 6 7 8
Kb
9.5
7.5
+ s.s kb
4.4
2.4 + 2.4kb
1.35
ll* t T
Figure 6.1: (l) 5' RACE of fetal brain RNA to obtain the 5' end of the T6 gene. Lane 1:
products generated after the first round of PCR with (+) or without (-) reverse transcriptase.Lane 2: products generated from the second round of PCR with (+) or without (-) reverse
transcriptase. The two fragments indicated by arrows were cloned and sequenced with thelargest product extending the 5' sequence by 27 bp. (B) Northern blot analysis of the T68transcript using the insert to the cDNA clone 2e25b01. A single band of approximately 2.4kbwas highly expressed in adult 1: Heart; 2: Braín; 6: Skeletal muscle; 8: Pancreas. Fainterexpression was observed in adult 3: Placenta; 4; Lung; 5: Liver; 7: Kidney. An additional bandof -5.5 kb was seen in the placenta alone. Northern analysis using a cDNA clone representing
the entire T6 transcript identified an identical sized2.4 kb mRNA.
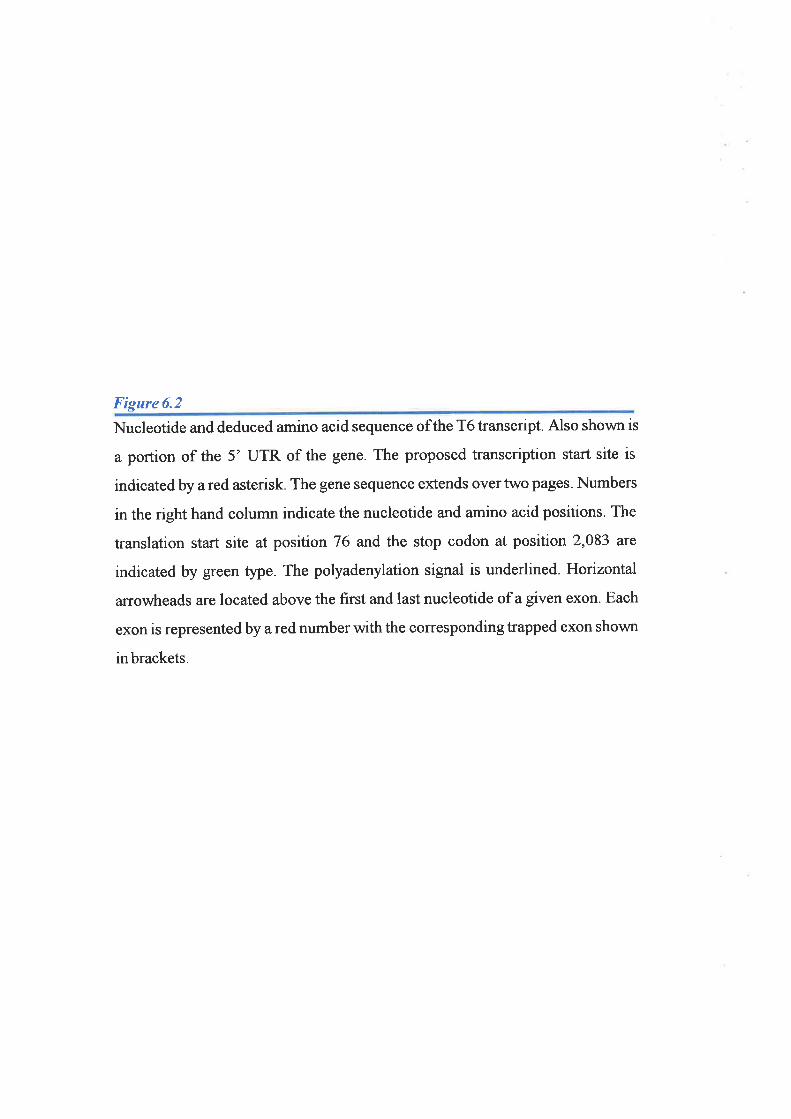
Figure6.2
Nucleotide and deduced amino acid sequence ofthe T6 transcript. Also shown is
a portion of the 5'UTR of the gene. The proposed transcription start site is
indicated by a red asterisk. The gene sequence extends over two pages. Numbers
in the right hand column indicate the nucleotide and amino acid positions. The
translation start site at position 76 and the stop codon at position 2,083 are
indicated by green type. The polyadenylation signal is underlined. Horizontal
arrowheads are located above the first and last nucleotide of a given exon. Each
exon is represented by a red number with the corresponding trapped exon shown
inbrackets.
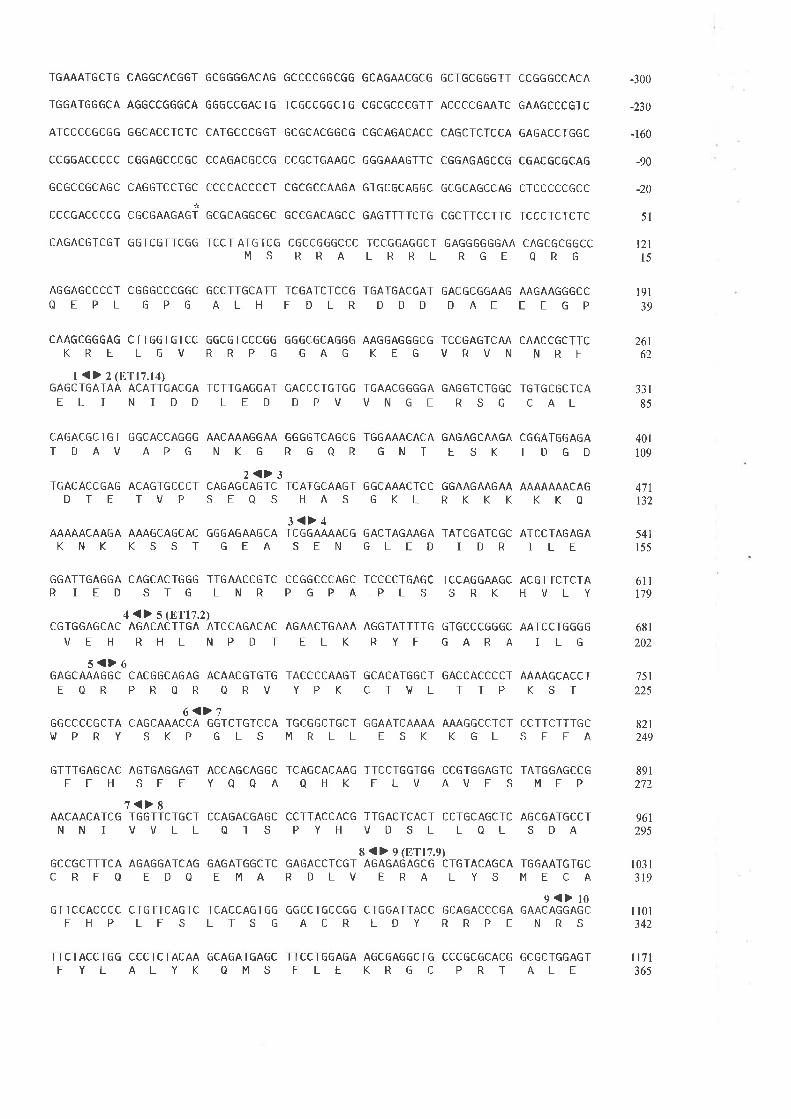
TGAAATGCTG
TGGATGGGCA
ATCCCCGCGG
ccGGACCCCC
GCGCCGCAGC
CCCGACCCCG
CAGGCACGGT
AGGCCGGGCA
GGCACCTCTC
CGGAGCCCGC
CAGGTCCTGC
CGCGAAGAGÏ
GCGGGGACAG
GGGCCGACTG
CATGCCCGGT
CCAGACGCCG
ccccAccccT
GCGCAGGCGC
GCCCCGGCGG
TCGCCGGCTG
GCGCACGGCG
CCGCTGAAGC
CGCGCCAAGA
GCCGACAGCC
GCAGAACGCG
CGCGCCCGTT
CGCAGACACC
GGGAAAGTTC
GTGCGCAGGC
GAGTTTTCTG
GCTGCGGGTT
ACCCCGAATC
CAGCTCTCCA
CCGAGAGCCG
GCGCAGCCAG
CGCTTCCTTC
CCGGGCCACA
GAAGCCCGIC
GAGACCTGGC
CGACGCGCAG
CTCCCCCGCC
TCCCTCTCTC
-300
-230
-160
-90
-20
5l
t2ll5
CAGACGTCGT GGTCGTTCGG TCCT ATGTCG CGCCGGGCCC TCCGGAGGCT GAGGGGGGAA CAGCGCGGCCMSRRALRRLRGEQRG
AGGAGCCCCT CGGGCCCGGC GCCTTGCATT TCGATCTCCG TGATGACGAT GACGCGGAAG AAGAAGGGCC
QEPL GPG ALH FDLR DDD DAE EEGP
CAAGCGGGAG CTTGGTGTCC GGCGTCCCGG GGGCGCAGGG AAGGAGGGCG TCCGAGTCAA CAACCGCTTCKRE LGV RRPG GAG KEG VRVN NRF
r <> 2 (ETr7.r4)GAGCTGATAA ACATTGACGA TCTTGAGGAT GACCCTGTGG TGAACGGGGA GAGGTCTGGC TGTGCGCTCAELI NIDD LED DPV VNGE RSG CAL
191
39
26162
CAGACGCTGT GGCACCAGGG
TDAVAPG
TGACACCGAG ACAGTGCCCTD T E TV P
AAAAACAAGA AAAGCAGCACKNKKSST
AACAAAGGAA GGGGTCAGCG
NKGRGQR
2<>3CAGAGCAGTC TCATGCAAGTSEQSHAS
3<>4GGGAGAAGCA TCGGAAAACG
GEASEN
TGGAAACACA GAGAGCAAGA CGGATGGAGA
GNTESKTDGD
GGCAAACTCC GGAAGAAGAA AAAAAAACAGGKLRKKKKKQ
GACTAGAAGA TATCGATCGC ATCCTAGAGAGLEDIDRILE
33r85
401
109
471132
821249
GGATTGAGGA CAGCACTGGG TTGAACCGTCRIEDSTGLNR
4 <> s @T17.2)CGTGGAGCAC AGACACTTGA ATCCAGACAC
VEHRHLNPDTs<>6
GAGCAAAGGC CACGGCAGAG ACAACGTGTGEQRPRQRQRV
6<>7GGCCCCGCTA CAGCAAACCA GGTCTGTCCAI¡/PRYSKPGLS
CCGGCCCAGC TCCCCTGAGC TCCAGGAAGC ACGTTCTCTAPGPAPLSSRKHVLY
AGAACTGAAA AGGTATTTTG GTGCCCGGGC AATCCTGGGG
ELKRYFGARAILG
TACCCCAAGT GCACATGGCT GACCACCCCT AAAAGCACCTYPKCTVLTTPKST
TGCGGCTGCT GGAATCAAAA AAAGGCCTCT CCTTCTTTGCMRLLESKKGLSFFA
541155
6ll179
681
202
75t225
GTTTGAGCAC AGTGAGGAGT ACCAGCAGGC TCAGCACAAG TTCCTGGTGG CCGTGGAGTC TATGGAGCCGFEH SEE YOAA QHK FLV AVES MEP
7<> 8AACAACATCG TGGTTCTGCT CCAGACGAGC CCTTACCACG TTGACTCACT CCTGCAGCTC AGCGATGCCTNNI VVLL QTS PYH VDSL LQL SDA
I <> 9 (ETr7.9)GCCGCTTTCA AGAGGATCAG GAGATGGCTC GAGACCTCGT AGAGAGAGCG CTG
891272
961295
103 I319
I l0l342
CRFQEDQEMARDLVERALTACAGCA TGGAATGTGCYSMECA
9 <> 10GTTCCACCCC CTGTTCAGTC TCACCAGTGG GGCCTGCCGG CTGGATTACC GCAGACCCGA GAACAGGAGC
FHP LFS LTSG ACR LDY RRPE NRS
TTCTACCTGG CCCTCTACAA GCAGATGAGC TTCCTGGAGA AGCGAGGCTG CCCGCGCACG GCGCTGGAGTFYL ALYK QMS FLE KRGC PRT ALE
ttTt365
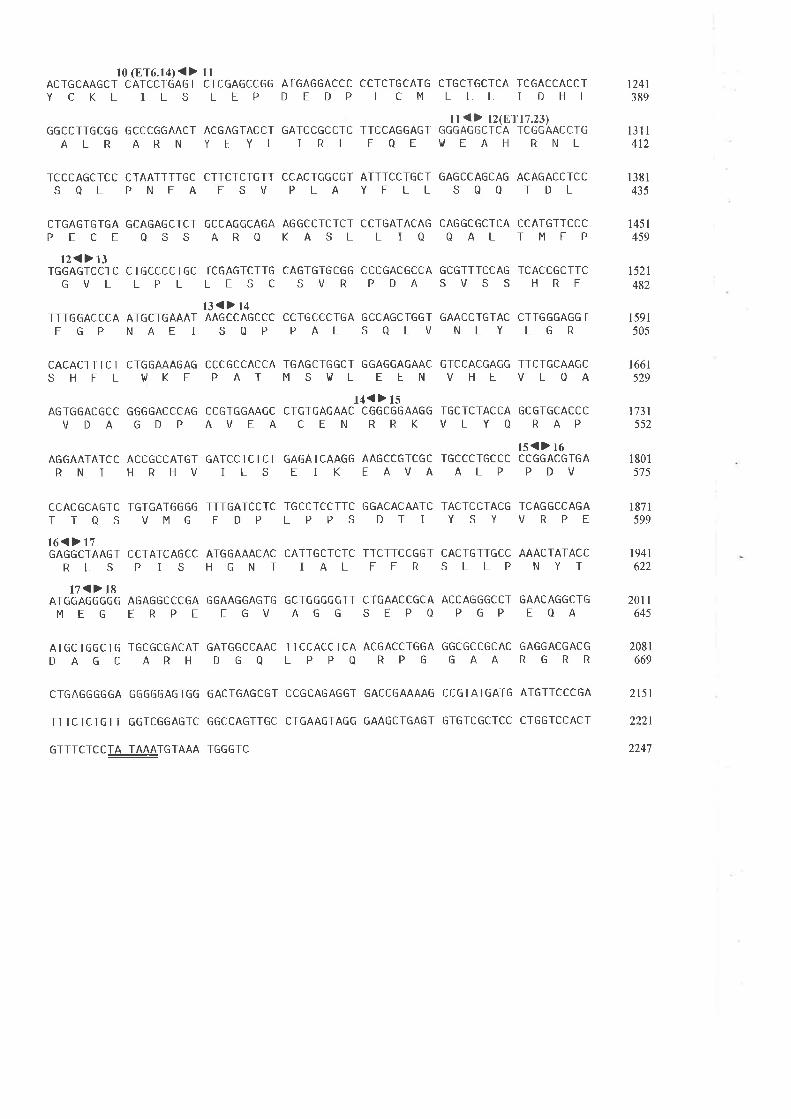
r0 (ET6.l4) <> llACTGCAAGCT CATCCTGAGT CTCGAGCCGG ATGAGGACCC CCTCTGCATG CTGCTGCTCA TCGACCACCTYCKL ILS LEP DEDP LCM LLL IDHL
GGCCTTGCGG GCCCGGAACT ACGAGTACCT GATCCGCCTC TTCCAGGAGTALRARNYEYLIRLFOE
il <> 12(8T17.23)GGGAGGCTCA TCGGAACCTG
TCCCAGCTCC CTAATTTTGC CTTCTCTGTT CCACTGGCGT ATTTCCTGCT GAGCCAGCAG ACAGACCTCCSQL PNFA FSV PLA YFLL SAO TDL
VEAHRNL
t24t389
l3l I412
l38l435
14s I459
1521482
l59l505
1661529
t73t552
I 801575
1871599
t94t622
CTGAGTGTGA GCAGAGCTCT GCCAGGCAGAPECEQSSARQ
t2<> 13TGGAGTCCTC CTGCCCCTGC TCGAGTCTTG
GVLLPLLESC13<> 14
TTTGGACCCA ATGCTGAAAT AAGCCAGCCC
FGPNAE]SQP
AGGCCTCTCT CCTGATACAG CAGGCGCTCA CCATGTTCCCKASLLIOOALTMFP
CAGTGTGCGG CCCGACGCCA GCGTTTCCAG TCACCGCTTCSVRPDASVSSHRF
CCTGCCCTGA GCCAGCTGGT GAACCTGTAC CTTGGGAGGTPALSOLVNLYLGR
CACACTTTCT CTGGAAAGAG CCCGCCACCA TGAGCTGGCT GGAGGAGAAC GTCCACGAGG TTCTGCAAGCSHFL VKE PAT MSI¡/L EEN VHE VLQA
14<> 15AGTGGACGCC GGGGACCCAG CCGTGGAAGC CTGTGAGAAC CGGCGGAAGG TGCTCTACCA GCGTGCACCC
VDA GDP AVEA CEN RRK VLYQ RAP
15<> 16AGGAATATCC ACCGCCATGT GAÍCCTCTCT GAGATCAAGG AAGCCGTCGC TGCCCTGCCC CCGGACGTGA
RNI HRHV ILS EIK EAVA ALP PDV
CCACGCAGTC TGTGATGGGG TTTGATCCTC TGCCTCCTTC GGACACAATC TACTCCTACG TCAGGCCAGA
TTQS VMG FDP LPPS DTI YSY VRPE
16<> l7GAGGCTAAGT CCTATCAGCC ATGGAAACAC CATTGCTCTC TTCTTCCGGT CACTGTTGCC AAACTATACC
RLS PIS HGNT IAL FFR SLLP NYT
17<> t8ATGGAGGGGG AGAGGCCCGA GGAAGGAGTG GCTGGGGGTT
MEGERPEEGVAGGCTGAACCGCA ACCAGGGCCT GAACAGGCTGSEPQPGPEQA
201 I645
ATGCTGGCTG TGCGCGACAT GATGGCCAAC TTCCACCTCA ACGACCTGGA GGCGCCGCAC GAGGACGACG
DAGC ARH DGQ LPPQ RPG GAA RGRR
CTGAGGGGGA GGGGGAGTGG GACTGAGCGT CCGCAGAGGT GACCGAAAAG CCGTATGATG ATGTTCCCGA
TTTCTCTGTT GGTCGGAGTC GGCCAGTTGC CTGAAGTAGG GAAGCTGAGT GTGTCGCTCC CTGGTCCACT
GTTTCTCCEI4TGTAAA TGGGTC
2081669
2l5r
2221
2247

Chapter 6 Characterisation of Transcription Unit 6 (76)
protein of S. cerevisiae (44Yo similarity over 366 amino acids). In addition, the high nucleotide
sequence homology (55%) to mouse ESTs suggests this gene is conserved. Unfortunately, no
significant homology was observed to known human proteins or proteins with known
functions. The PSORT program (5.3.6) suggested the protein product may be targeted to the
nucleus, however no functional domains were identified in the protein.
6.3.4 T6 Genomic Structure
The genomic structure of T6 was characterised by Ms. Joanna Crawford. The gene consists of
18 exons separated by 17 introns that collectively cover approximately 30 kb of genomic
DNA. Table 6.3 summarises the sequences of the splice site junctions and relative splice site
consensus strengths based on Shapiro and Senapathy (1987). All splice sites obeyedthe aglgt
rule. Exon I contained the start codon while exon l8 contained the stop codon as well as the
complete 3' UTR. The trapped exon F,TIT .14 corresponded to exon 2, ETIT .2 was exon 5,
8T17.9 was exon 9,8T6.14 was exon 10, andBTl7.23 corresponded to exon 12.
6.3.5 Mutation Analysis
6.3.5.1 SSCP Results
To determine if this gene was a potential tumour suppressor gene involved in breast cancer,
primers were designed from the intron sequences flanking each exon. These were used to test
for the presence of mutations in breast tumour DNA. Primer sequences are listed inTable 6.2
and SSCP results for the analysis of all 27 tumour and matching normal DNA samples are
shown in Table 6.4. Analysis of the first 10 exons by Ms. Joanna Crawford identified SSCP
changes in exons 1.7,9, and 10 These were considered to be polymorphisms as these changes
were also seen in normal DNA from the same individuals. SSCP analysis of the remaining 8
exons by the candidate again identified changes seen in both normal and tumour DNA from the
210
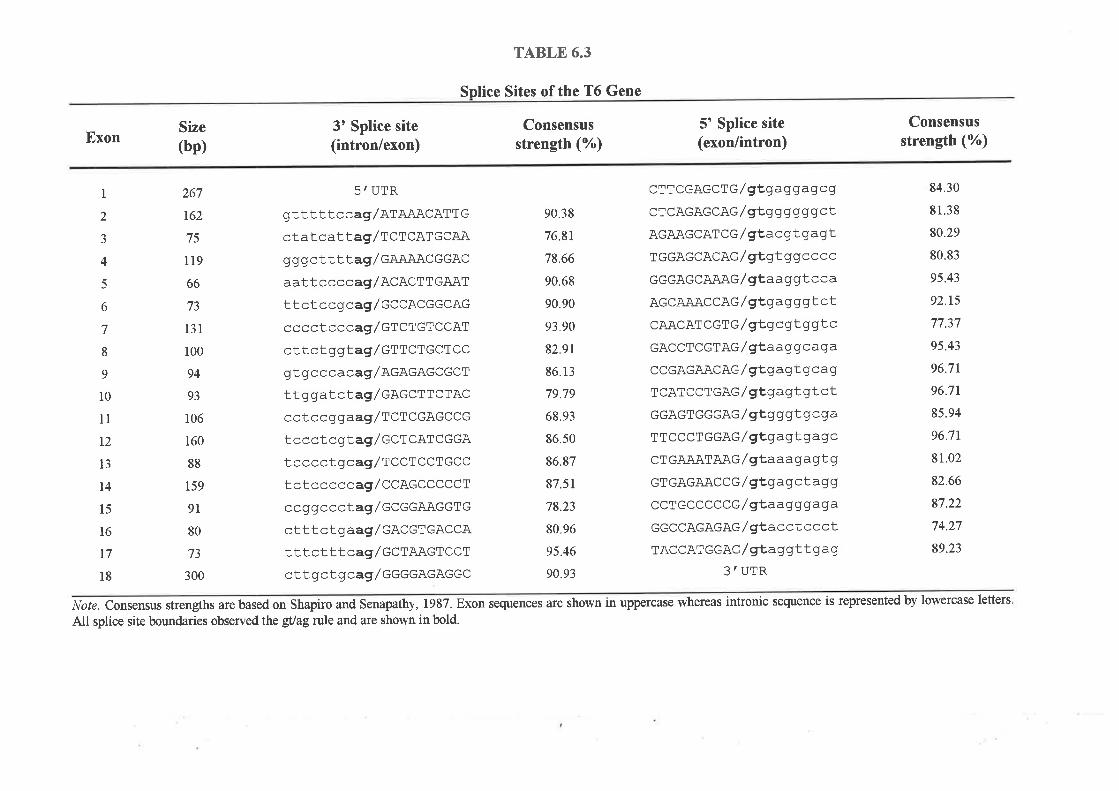
ExonSize(bp)
267
t62
75
119
66
t-,
131
100
94
93
106
160
88
159
91
80
73
300
I
2
-)
4
5
6
7
8
9
10
11
t2
13
t4
15
16
T7
18
3' Splice site(intron/exon)
5'UTR
gt t t t tccaglareaacATTGct at cat t agl t cr cRT GCAA
g g gct tttag/eaneecccAcaatt ccccag/acactTGAATt t ct cc g cag/ cccecGGCAG
c ccct cccag/ ercrcTCCAT
ctt ct ggtagl errcrGCTccg t g c c c a cag / eeaeacc GC T
t t g gat ct agl eaecr T cTAC
c ct ccg g aag/ rcrceAGCCG
t ccct c g t agl cct cRT cGGA
t cccct gc ag / t cct cCTGCC
t ctcccccag/ ccaecccccTcc g g c cct agl eceeeaccT G
ct ttct gaagl cacetGACCA
t t t ct t t cagl ecraecTCCT
c t t g c t g cagl eeeeacAccc
TABLE 6.3
Splice Sites of the T6 Gene
Consensusstrength (%)
5' Splice site(exon/intron)
CTTCGAGCT G / gEgag g ag cq
CTCAGAGC AG / gEgqgqqgcT
AGAAGCAT CG / gEacgt gagtTGGAGCAC AG / gEgLggcccc
GGGAGCAAAG / gLaagqtccaAGCAAACC AG / gEgagg gt ctCAACATCGT G / gEgcgt ggt c
GACCTCGT AG / gt'aaqqcaqa
CCGAGAAC AG / gEqagtgcag
T CAT cCTG AG / gbg agt gt ctGGAGTGGG AG / gEq g gLg cga
TTCCCTGGAG / gbgaqt ga gc
cT G A-AAT AAG / gEaaa qa g t IGTGAGAAC CG / gEg agcL agg
CCTGCCCC CG / gEaaggg aga
cccCAGAGAG / gEacctccctTACCATGGAG / gEaqgtt ga g
3IUTR
90.38
76.81
78.66
90.68
90.90
93.90
82.9r
86.13
79.79
68.93
86.50
86.87
87.51
78.23
80.96
95.46
90.93
Consensusstrength (7o)
84.30
81.38
80.29
80.83
95.43
92.15
77.37
95.43
96.71
96.71
85.94
96.71
81.02
82.66
87.22
74.27
89.23
ly'ofe. Consensus strengths are based on Shapiro and Senapatþ, 1987. Exon sequences are shown in uppercase
All splice site boundaries observed the gllagrale and are shown in bold.whereas intronic sequence is represented by lowercase letters
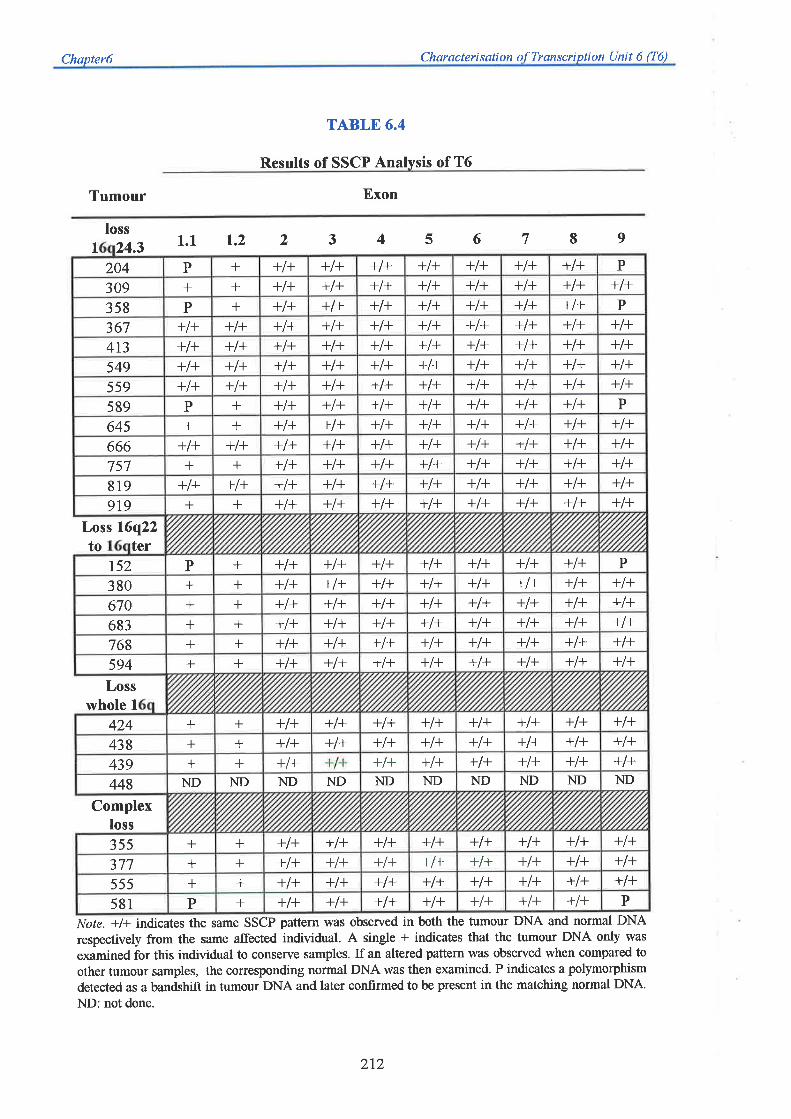
Chapter6 Characterisation of Transcription Unit 6 (f6)
TABLE 6.4
Results of SSCP Analvsis of T6
Tumour Exon
P+l+ +l+ +l+ +l+ +l+ +l+P + +l+204+l+ +l+ +l+ +l++ +l+ +l+ +l+ +l+309 +
P+l+ +l+ +l+ +l+ +l+ +l+P + +l+358+l+ +l+ +l+ +l++l+ +l+ +l+ +l+ +l+367 +l+
+l++l+ +l+ +l+ +l+ +l++l+ +l+ +l+ +l+473+l+ +l+ +l+ +l++l+ +l+ +l+ +l+ +l+549 +l+
+l++l+ +l+ +l+ +l+ +l++l+ +l+ +l+ +l+559+l+ +l+ +l+ P+l+ +l+ +l+ +l+589 P +
+l+ +l+ +l+ +l+ +l+ +l++ + +l+ +l+64s+l+ +l+ +l++l+ +l+ +l+ +l+ +l+666 +l+ +l+
+l++l+ +l+ +l+ +l+ +l++ + +l+ +l+757+l+ +l+ +l+ +l++l+ +l+ +l+ +l+819 +l+ +l+
+l++l+ +l+ +l+ +l+ +l+ +l++ + +l+919
+l+ +l+ +l+ +l+ +l+ P+ +l+ +l+152 P+l+ +l+ +l++l+ +l+ +l+ +l+ +l+380 + +
+l++l+ +l+ +l+ +l+ +l++ + +l+ +l+670+l+ +l+ +l+ +l++l+ +l+ +l+ +l+683 + +
+l++l+ +l+ +l+ +l+ +l++ + +l+ +l+768+l+ +l+ +l+ +l++l+ +l+ +l+ +l+594 + +
+l+ +l+ +l++l+ +l+ +l+ +l++ + +l+424+l++l+ +l+ +l+ +l+ +l++ +l+ +l+438 +
+l+ +l+ +l+ +l++l+ +l+ +l++ +439NDND ND ND ND NDND ND ND448 ND
+l+ +l+ +l+ +l+ +l++ +l+ +l+ +l+355 ++l+ +l+ +l++l+ +l+ +l+ +l++ + +l+377
+l+ +l+ +l+ +l+ +l++ +l+ +l+ +l+s55 ++l+ +l+ P+l+ +l+ +l+ +l+P + +l+58r
loss 1.1 1.2234s67891 24.3
Loss 16q22to ter
Losswhole 1
Complexloss
Note. +/+ indicates the same SSCP pattern was obsewed in both the tumour DNA and normal DNArespectively from the same affected individual. A single + indicates that the tumour DNA only was
examined for this individual to conserve samples. If an altered pattern was observed when compared to
other tumour samples, the corresponding normal DNA was then examined. P indicates a polymorphism
detected as a bandshift in tumour DNA and later confirmed to be present in the matching normal DNA.
ND: not done.
272

Chapte16 Characterisation of TranscriDtion Unit 6 ff6)
TABLE 6.4 (Cont.)
Results of SSCP Analysis of T6
Tumour Exon
++l+ P + + + +l+ + +204 P+ + +l+ + + ++l+ +l+ +l+ +309
P + + + +l+ + + +358 P +l++l+ +l+ +l+ +l+ +l+ +l++l+ +l+ +l+ +l+367
+l+ +l+ +l+ +l+ +l+ +l+ +l+ +l+413 +l+ +l++l+ +l+ +l+ +l+ +l++l+ +l+ +l+ +l+ +l+549
+l+ +l+ +l+ +l+ +l+ +l+ +l+ +l+559 +l+ +l++ +l+ + + +P +l+ P + +589
P+l+ + + + +l+ + +645 +l+ +l++l+ +l+ +l+ +l+ +l++l+ +l+ +l+ +l+ +l+666
++l+ + + + +l+ + +757 +l+ +l++l+ +l+ +l+ +l+ +l++l+ +l+ +l+ +l+ +l+819
++/+ +l+ + + + +l+ + +919 +l+
+ + + +l+ + + +752 P +l+ P+l+ + + ++l+ +l+ + + +380 +l+
+ + + +l+ + + +670 +l+ +l+ +l++l+ + + ++l+ +l+ + + +683 +l+
++ + + +l+ + +768 +l+ +l+ +l++l+ + + ++l+ +l+ + + +594 +l+
+l+ + + ++l+ +l+ + + +424 +l++ + +l+ + + ++l+ +l+ +l+ +438
+l+ + + ++ + +439 +l+ +l++ + + +l+ + + PND +l+ P448
+ + +l+ + + ++l+ +l+ +l+ +355ND ND NDND ND ND ND ND377 +l+ ND
+ + +l+ + + P+l+ +l+ +l+ +555+ + +P + + + +l+581 P +l+
Loss 10 11 t2 13 14 15 16 17 18.1 18.21 24.3
Loss 16q22to1
Losswhole L
Complexloss
Note. +l+ indicates the same SSCP pattern was observed in both the tumour DNA and normal DNArespectively from the same affected individual. A single + indicates that the tumour DNA only was
examined for this individual to conserye samples. P indicates a polymorhism detected as a bandshift intumour DNA and later confirmed to be present in the matching normal DNA. ND: not done.
213

Chapter 6 Characterisation Unit 6 (76)
same individual in exons 12, and 18.2. Figure 6.3 shows the altered conformation pattern and
associated nucleotide change seen for exons 12 and 18.2. The frequency of the polymorphisms
in the general population is shown in Table 6.5 with the relevant base changes also indicated.
TABLE 6.5
T6 Polvmorphisms Detected Durins SSCP Analvsis
Exon Polymorphism Frequency
1.1
9
10
t2
18.2
ND
IVSs-44/G
Gl1884
rvsr2+1sr/c
3'UTR+I24CÆ
0.11 (121110)
o.rt7 (t4lr2o)
0.102 (121118)
o.lo5 (121114)
0.042 (s/r18)
Note. Figxes in brackets represent the number of chromosomes with the observed SSCP
change as a fraction of the total number of chromosomes analysed. ND: not determined.
All five of the polymorphisms were found to be relatively rare with four occurring outside the
coding region. The polymorphism detected in exon 10 identified a base change within the
coding region at base 1,188. This presumably neutral polymorphism resulted in an acidic
glutamine amino acid being replaced by a basic lysine residue. The absence of tumour specific
sscP changes suggests T6 is not involved in breast carcinogenesis.
6.3.5.2 Exon Skipping
Of all the breast cancer cell lines examined, each one gave rise to the expected sized RT-PCR
product with all primer sets tested. This excluded exon skipping as a mutational mechanism.
6.3.6 Alternative T6 TranscriPts
As shown in Figure 6.4,three alternate T6 transcripts (T6A' T6B, and T6C) were identified
214
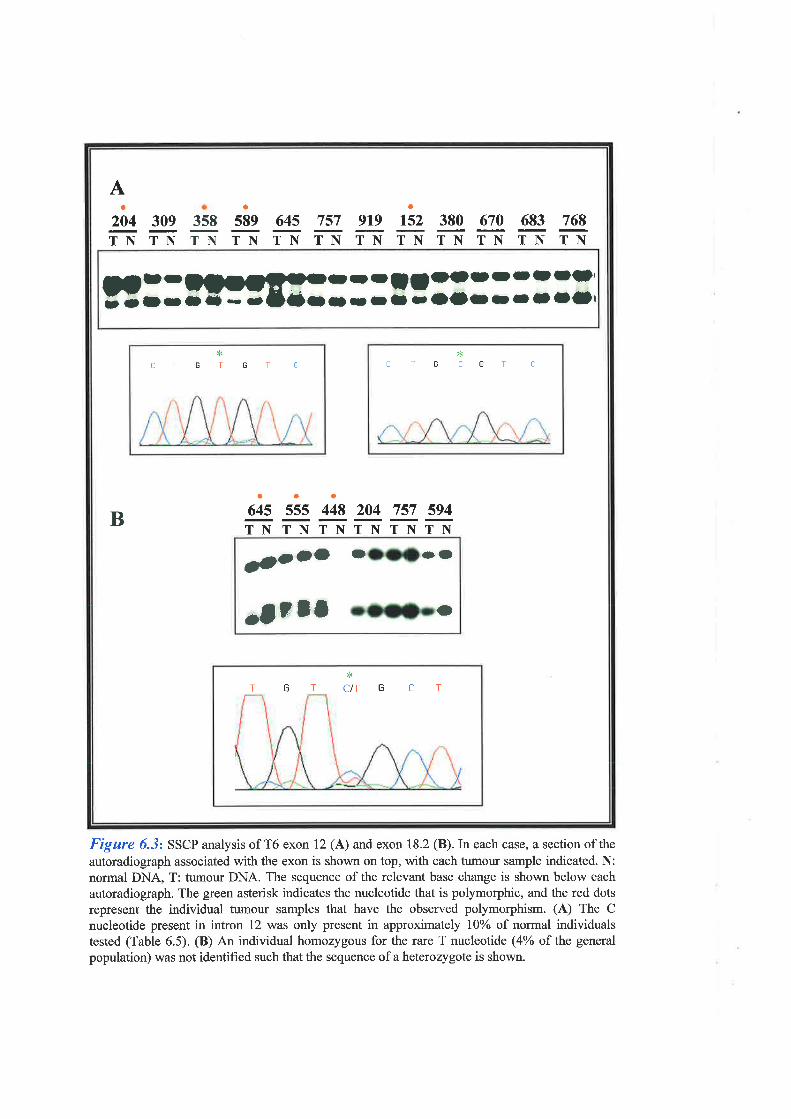
Aa
204 309TN TN
3s8aa
589 645 757 919 lsz 380 670 683 768TN TN TN TN TN TN TN TN TNTN
frrFo--rt--oo'rt; - rr I õ - -Õlr-r -- r OOr- ro ---
Baao
645 555 448 204 757 594TNTNTNTNTNTN
aPe o' o o'
'|?rl .
TGfC/TGI]T
ôITGTGTI]
ùCTGCGTC
Figure ó.-1: SSCP analysis of T6 exon 12 (A) and exon 18.2 (B).In each case, a section of the
autoradiograph associated with the exon is shown on top, with each tumour sample indicated. N:normal DNA, T: tumour DNA. The sequence of the relevant base change is shown below each
autoradiograph. The green asterisk indicates the nucleotide that is polymorphic, and the red dots
represent the individual tumour samples that have the observed polymorphism. (A) The C
nucleotide present in intron 12 was only present in approximately l0%o of normal individualstested (Table 6.5). (B) An individual homozygous for the rare T nucleotide (4% of the general
population) was not identified such that the sequence of a heterozygote is shown.
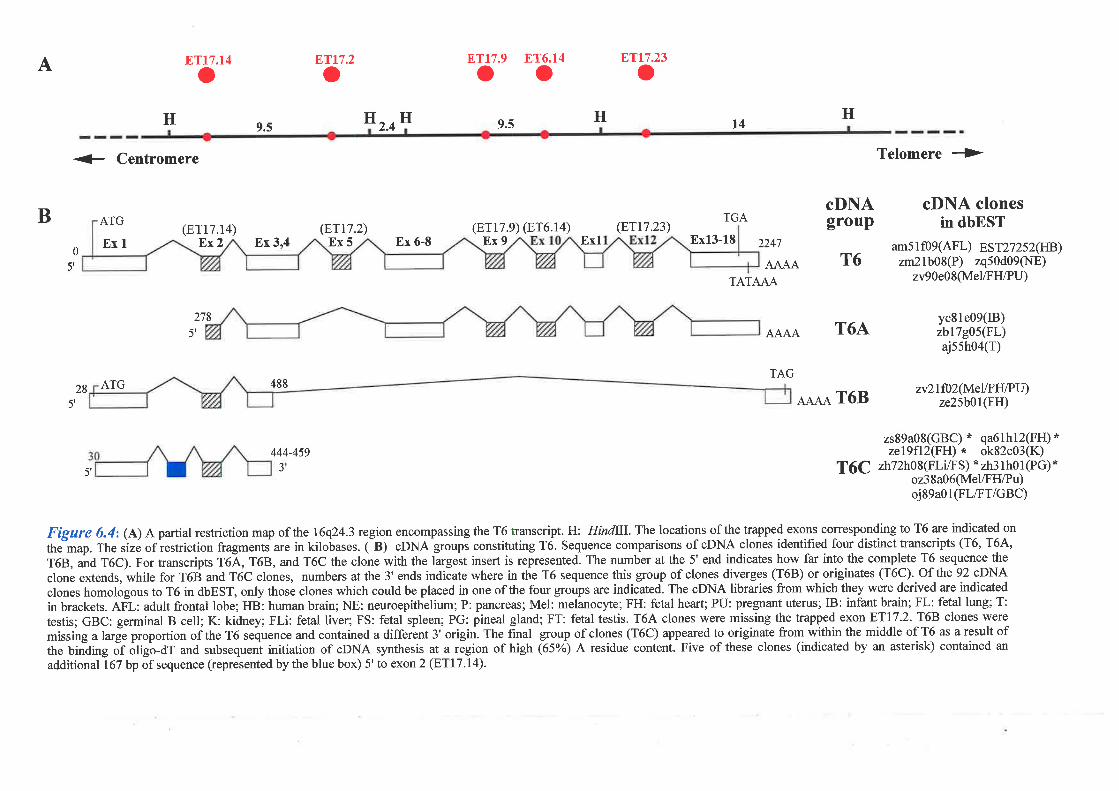
A oETt7.2oETt7.t4 ETr7.9 ET6.14oo ETt7.23
o
H HH H H9.5 l42.49.s
B
+ Centromere
ATG
Exl
TGA
Ex13-18 2247
TATAAA
CDNAgroup
AAAA T6
Telomere *
cDNA clonesin dbEST
am5 1 f09(AFL) nSrZtzSzçn¡zm21b08(P) zq50d09(NE)
zv90e08(MelÆH/PU)
yc8le09(IB)zbl7905(FL)ajssh04(r)
(8T17.14)ßx2 Ex 3,4
278
5'
(F.117.2)Ex5 Ex 6-8
(Er17.e) (Er6.14) (8Tr7.23)Ex9 Exl
0
5'
Auq,AÁ T6A
TAG
5'
28 ATG
5'
488
444-459
AAAA T6Bnr2lfO2(MelÆI{/PU)
ze25b01(FH)
J
zs89a08(GBC) * qa61h12(FH) *2e19fl2(Ftl) * ok82c03(K)
| $Ç zh72h08(FLi/FS) * zm lhOl(PG) *
oz38a06(Mel./FI{/Pu)oj89a0l(FLIFT/GBC)
T68, and T6C). For transcripts T6Á, T6B, and T6C the clone with the tu.g"it insert is represented. The number at the 5' end indicates how far into the complete T6 sequence the
clone extends, while for T6É and T6C clones, numbers at the 3' ends indiðate where in the T6 sequence this group of clones diverges (T68) or originates (T6C). Of the 92 cDNA
clones homologous to T6 in dbEST, only those clones which could be placed in one of the four groups are indicated. The cDNA libraries from which they were derived are indicated
missing a large proportion of the T6 ,"[rr"n"" and contained a differènt 3' origin. The final group of clones (T6C) appeared to originate fom within the middle of T6 as a result oftlre biñding õf ôUgã-af and subsequent initiation of oDNA synthesis at a region of high (65%) A residue content. Five of these clones (indicated by an asterisk) contained an
additional 167 bp of sequence (represented by the blue box) 5' to exon 2 (ETl7 '14).

Chapter 6 Characterisation of Transcriotion Unit 6 ff6)
from BLASTN analysis of human ESTs, a search of the TIGR human gene index database
(http://www.tigr.org/tdb/hgi/searching/hgi_seq_search.html), and trapped exon content.
6.3.6.1 T6A
T6A oDNA clones (THC230405), which included yc81e09, did not contain exon 5 (ETl7.2).
Of the 92 human ESTs homologous to T6 in dbEST, only eight had 5' sequence which
extended beyond exon 6, and three of them did not contain exon 5. Therefore, the relative
frequency of the T6A transcript within the 92 cDNA clones could not be determined due to the
majority of clones not extending beyond exon 6 or 5' DNA sequences not being available.
During exon skipping mutation analysis of T6 (6.3.5.2), RT-PCR on breast cancer cell lines
and fetal heart RNA confirmed that the alternative transcript T6A was present in RNA from
these sources. The absence of 8T77.2 does not alter the ORF of the transcript since this exon
is 66 bp in length. This indicates T6A may represent a functional alternatively spliced form of
T6.
6.3.6.2 T68
The T6B transcript (THC230404) was represented by only two cDNA clones (2e25b07 and
n27fD2) from the 92 ESTs homologous to T6 in dbEST. This transcript contains only the first
489 nucleotides of T6 (including exon 1, exon 2, and 59 bp of exon 3) followed by 724 bp of
unique sequence that results in an alternative stop codon and 3' end. The T68 transctiptis 612
bp in length (Figure 6.5) and contains a single polyadenylation signal (AATAAA) 23 bp from
the 3' end and an in-frame stop codon l0 bp after the point of divergence from T6 exon 3,
such that it codes for a potential l4l amino acid protein.
RT-PCR experiments were performed to verifii the presence of T6B transcripts (Figure 6.6)
217
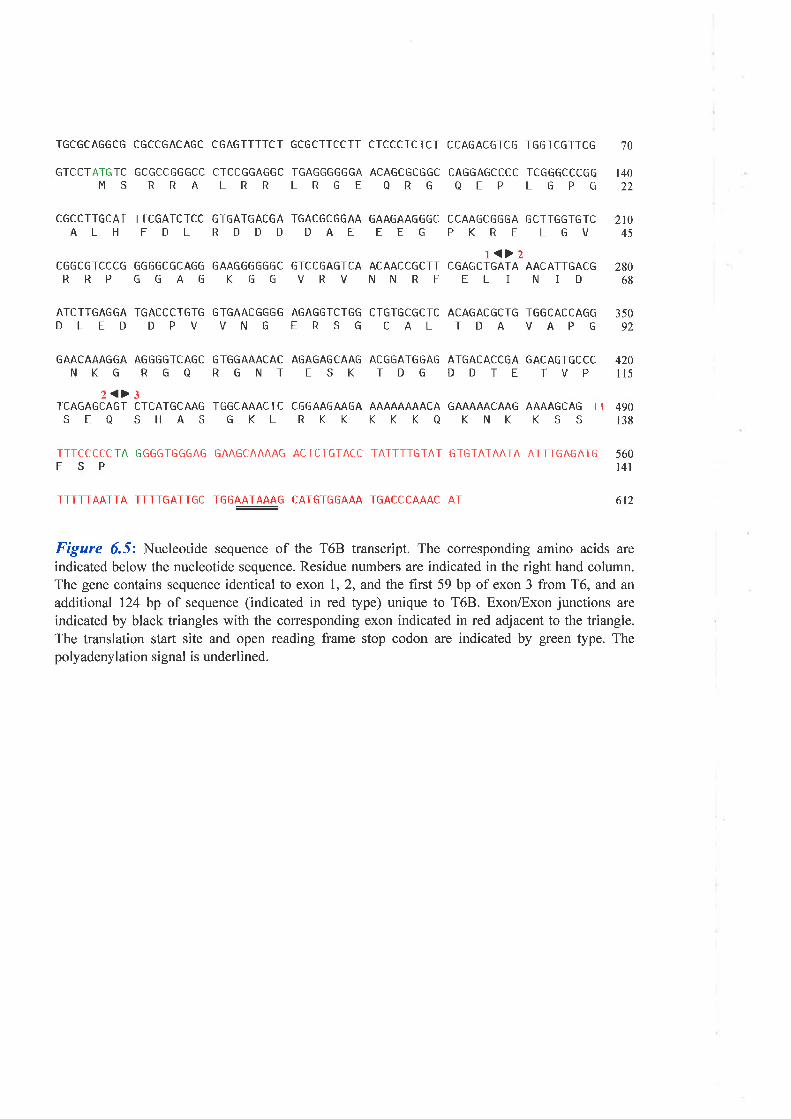
TGCGCAGGCG CGCCGACAGC CGAGTTTTCT GCGCTTCCTT CTCCCTCTCT CCAGACGTCG TGGTCGTTCG 70
GTCCTATGTC GCGCCGGGCC CTCCGGAGGC TGAGGGGGGA ACAGCGCGGC CAGGAGCCCC TCGGGCCCGGMS RRA LRR LRGE ORG OEP LGPG
CGCCTTGCAT TÏCGATCTCC GÏGATGACGA TGACGCGGAA GAAGAAGGGC CCAAGCGGGA GCTTGGTGTCALH FDL RDDD DAE EEG PKRE LGV
l<>2CGGCGTCCCG GGGGCGCAGG GAAGGGGGGC GTCCGAGTCA ACAACCGCTT CGAGCTGATA AACATTGACGRRP GGAG KGG VRV NNRF ELI NID
ATCTTGAGGA TGACCCTGTG GTGAACGGGG AGAGGTCTGG CTGTGCGCTC ACAGACGCTG TGGCACCAGGDLED DPV VNG ERSG CAL TDA VAPG
GAACAAAGGA AGGGGTCAGC GTGGAAACAC AGAGAGCAAG ACGGATGGAG ATGACACCGA GACAGTGCCCNKG RGQ RGNT ESK TDG DDTE TVP
2<>3TCAGAGCAGT CICATGCAAG TGGCAAACTC CGGAAGAAGA AAAAAAAACA GAAAAACAAG AAAAGCAG TTSEQ SHAS GKL RKK KKKQ KNK KSS
TTTCCCCCTA GGGGTGGGAG GAAGCAAAAG ACTCTGTACC TATTTTGTAT GTGTAIAATA ATTTGAGATGFSP
14022
21045
280ó8
35092
420115
490138
560t4t
TTTTTAATTA TTTTGATTGC TGGAATAAAG CATGTGGAAA TGACCCAAAC AT 612
Figure ó.5: Nucleotide sequence of the T6B transcript. The corresponding amino acids are
indicated below the nucleotide sequence. Residue numbers are indicated in the right hand column.The gene contains sequence identical to exon 1,2, and the first 59 bp of exon 3 from T6, and an
additional 124 bp of sequence (indicated in red type) unique to T6B. ExonÆxon junctions are
indicated by black triangles with the corresponding exon indicated in red adjacent to the triangle.The translation start site and open reading frame stop codon are indicated by green type. Thepolyadenylation signal is underlined.
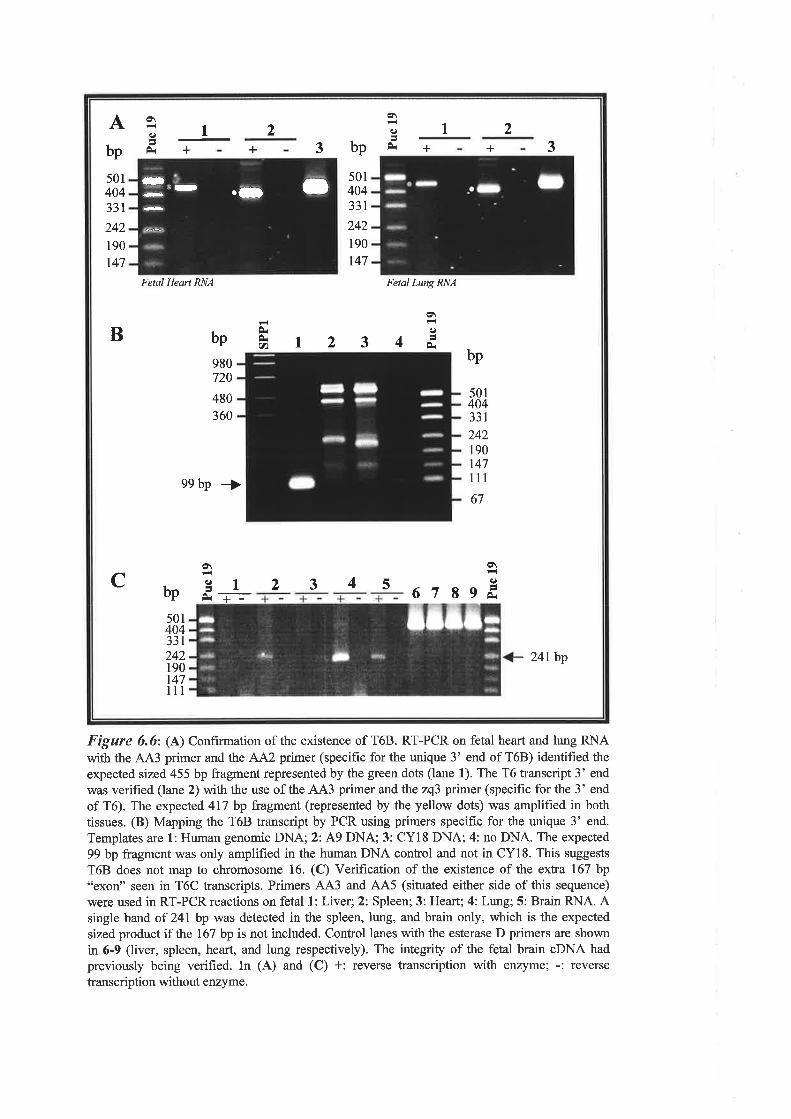
- ,)- .¡l t
A o\9
ÈI 2
o\<,
È1 2
bp 3bp + + 3 + +
501404331
242
190
t47
50140433t242
190
t47
Fetal Hearl RNA Fetal Lung RNA
B bp
980720
480
360
ÈÈ(n 1234
o\9
Èbp
501404
99bp *
33r242190747111
67
Co\q)
È
o\
bp 12345 6789I
È+-50140433r242190147111
24lbp
Figure 6.6= (L) Confirmation of the existence of T68. RT-PCR on fetal heart and lung RNAwith the AA3 primer and the AA2 primer (specific for the unique 3' end of T68) identifred the
expected sized 455 bp fragment represented by the green dots (lane 1). The T6 transcript 3' end
was verified (lane 2) with the use of the AA3 primer and the zq3 primer (specifrc for the 3' end
of T6). The expected 417 bp fragment (represented by the yellow dots) was amplified in bothtissues. (B) Mapping the T6B transcript by PCR using primers specific for the unique 3' end.
Templates are 1: Human genomic DNA;2: A9 DNA 3: CYl8 DNA; 4: no DNA. The expected
99 bp fragment was only amplified in the human DNA control and not in CY18. This suggests
T68 does not map to chromosome 16. (C) Verification of the existence of the extra 167 bp"exon" seen in T6C transcripts. Primers AA3 and AA5 (situated either side of this sequence)
were used in RT-PCR reactions on fetal 1: Liver; 2: Spleen; 3: Heart; 4: Lung; 5: Brain RNA. Asingle band of 247 bp was detected in the spleen, lung, and brain only, which is the expected
sized product if the 167 bp is not included. Control lanes with the esterase D primers are shown
in 6-9 (liver, spleen, heart, and lung respectively). The integdty of the fetal brain cDNA had
previously being verified. In (A) and (C) +: reverse transcription with enzyme; -: reverse
transcription without enzyme.
Chapter 6 Charac
lVhen a primer located in a region shared by T6 and T68 (AA3) was used in combination with
a primer unique to T6B (AA2), products of the expected size corresponding to T6B were
identified in all tissues examined (Figure 6.64)
6.3.6.2.1 Mapping T68
Since the sequence of the 3' end of T68 did not correspond to T6 it was possible that this
transcript represented an independent gene. Primers were designed specifically to the 3' end of
T6B (AA9 and AA2) and used in a PCR reaction on human DNA and on DNA from the
mouse/human somatic cell hybrid CY18 that contains chromosome 16 as its only human
content. A band of the correct size was detected with human DNA as a template, however no
product was seen when CY18 DNA was the template (Figure 6.68). This suggested that the
transcript was derived from another chromosome.
FISH analysis of metaphase chromosomes using the cDNA clone zq50d09 (representing the
majority of the T6 transcript) detected signal on chromosome 16 at q24.3 (data of Elizabeth
Baker, WCH). Although the homology between T6 and T6B extends for 489 bp, the zq50d09
clone contained only 2ll bp of sequence in common with T6B. Therefore, when zq50d09 was
used as a FISH probe, the amount of homology to T6B was likely to be too small to generate
an observable FISH signal elsewhere in the genome corresponding to T6B. The oDNA clones
available for the T6B transcript (nr21f02 and ze25b}7) were less than 1 kb in size and
therefore were also considered too small to be used as FISH probes for mapping purposes.
220
Chapter 6 Characterisation of Transcription Unit 6 (T6)
6.3.6.2.2 T68 Northern Analysis and Sequence Homologies
The insert of the cDNA clone corresponding to T6B (ze25b0l) was used as a hybridisation
probe on Northern blot filters containing normal adult tissues. A single ubiquitously expressed
mRNA of approximately 2.4 kb was detected which was identical in size to that observed with
a T6 probe. The strongest signal was observed in the heart, brain, liver, and pancreas (Figure
6.lB). An additional band of -5.5 kb was also seen in the placenta alone. However, a mRNA
corresponding to the size of the T6B transcript was not identified.
The 724 bp of unique nucleotide sequence in T6B displays 98olo homology over its entire
length to a portion of the 3' UTR of the mouse and human alpha-l collagen type I (COLIAI)
gene. PSORT analysis of this protein suggests it may be targetted to the nucleus, however
BLASTN and P analysis of this transcript revealed no significant homology to known proteins
or to protein domains.
6.3.6.3 T6C
T6C oDNA clones (THC213907) appeared to originate from within the middle of T6 due to
the binding of oligo-dT, and subsequent initiation of oDNA synthesis, at a region of high
(65%) A residue content (bases 445 to 484). Of the 92 human ESTs homologous to T6, 8
corresponded to T6C transcripts. Of these, 5 contained an additional 767 bp of sequence
immediately 5' to exon 2 (ET17.14) which was not seen in all other overlapping oDNA clones
(Figure 6.48). Of the remaining three, 2 clones did not contain this extra sequence while the
final clone did not extend far enough 5' to determine if the 167 bp was present or absent.
Collectively, these 8 oDNA clones corresponding to T6C were derived from 10 different tissue
sources, which suggested they may not be artifacts generated during the construction of the
cDNA libraries. The presence of this extra sequence however results in a disruption of the
221

Characterisation Unit 6
open reading frame of T6. Therefore, to confirm the existence of transcripts containing this
sequence, RT-PCR using primers located either side of this sequence (AA3 and AA5) was
performed on a number of fetal tissues from which these clones were originally derived. Of 5
tissues used (liver, spleen, heart, lung, brain), none confirmed the presence of transcripts
containing this extra sequence (Figure 6.6C). Subsequently, the characterisation of the
genomic structure of T6 (see 6.3.4) established that the extra 767 nucleotide "exon" present in
T6 did not correspond to the intron sequence of the flanking T6 exons. However, the entire
intron was not sequenced and it is suggested that this extra sequence may have originated from
further within this intron.
6.4 Discussion
6.4.1T6
The T6 gene has an ORF of 2,007 bp that codes for a protein of 669 amino acids. The gene
spans approximately 30 kb of genomic DN,\ is transcribed from the centomere toward the
telomere, and consists of 18 exons, five of which were identified from exon trapping. A single
polyadenylation signal at base 2,230 was observed and a single transcription start site based on
RT-PCR results was detected.
Based on Northern analysis the gene is expressed as a single 2 4 kb mRNA in all tissues
examined. The gene is also expressed in the breast, as detected by RT-PCR on breast cancer
cell lines and the normal breast epithelial cell line, HBL-100. The T6 gene shares 85Yo
nucleotide identity to its mouse homologue, and significant amino acid homology with proteins
of unknown function from ^S.
pombe, C. elegans, and ,S. cerevisiae (6.3.3) suggesting that the
gene may be conserved. Although the gene is predicted to code for a protein that is targetted
6
222
Chapter 6 Characterisalion of Trqnscription Unil 6 (76)
to the nucleus, the lack of homology with any other proteins or protein motifs meant it was not
possible to define a role for the protein product in the cell cycle. However, given that T6 is
ubiquitously expressed and its 5' UTR is G-C rich (75% in 370 bp), it is most likely a
housekeeping gene.
The results of SSCP mutation analysis on breast tumour DNA failed to detect nucleotide
substitutions specific for tumour material and exon skipping was unable to identify breast
cancer cell lines deleted for T6 exons. This suggests T6 is not a tumour suppressor gene
mutated in breast cancer. Of the 5 polymorphisms detected, only one occurred in the coding
region of T6 within exon 10 resulting in the substitution of a glutamic acid residue for a lysine.
The significance of this change is not known but would be expected to have some effect on the
protein product due to an alteration of its overall charge. One polymorphism in intron I
occurred only 4 bases from the start of exon t however this change did not affect the
consensus splice site score and would not be expected to have any effect on exon splicing. It is
still possible that T6 may be involved in breast tumourigenesis if mutations occur outside the
coding region or transcriptional unit. However, as explained with the GASI I gene, the
sporadic nature of the tumours examined would dictate that not all disease causing mutations
would occur outside the coding region.
6.4.2T6Isoforms
Based on sequence homology searches of dbEST, a number of possible T6 isoforms were
identified although only a single ubiquitous band was detected on Northern blots. T6A
transcripts did not contain exon 5 (ETl7.2), but Northern analysis would be unable to resolve
such a small size difference between T6 and T6A. However, the presence of T6A transcripts in
breast cancer cell lines and the fetal heart was confirmed by RT-PCR. Coupled with the fact
223
Chapter 6 Characterisqtion of Trønscription Unit 6 (76)
that exon 5 is 66 bp in length and its absence would not disrupt the ORF, suggests T6A is a
functional alternatively spliced form of T6
The T6B transcript is 612 bp in length and codes for a putative protein of 141 amino acids. It
contains sequence identical to exon 1, exon 2, and the first 59 bp of exon 3 from T6, and an
additional 724bp of sequence unique to T68. This transcrþt does not appear to originate from
chromosome 16. The exact location of T6B in the genome was not determined due to time
constraints. The existence of RNA transcripts corresponding to T6B was confirmed by RT-
PC& however only two oDNA clones present in dbEST (from the 92 that showed homology
to T6) represented T6B transcripts. This suggests T6B is not abundantly expressed.
Northern analysis using a T6B cDNA clone identified the 2.4 kb mRNA corresponding to T6
as well as a 5.5 kb mRNA seen in the placenta alone. Although the sequence of this larger
transcrþt was not determined, it may have been derived from the use of an alternative
polyadenylation signal 3' to the one used by either T6 or T68. This extra sequence may
contain signals specific for expression in the placenta. A mRNA signal corresponding to the
612bp T6B gene was not seen from Northern hybridisations. It is possible that because of the
small size of the associated mRNAÞ it may have been run offthe gel during preparation of the
Northern filter and hence not seen during hybridisations. Another explanation is that the gene
may be poorly expressed such that it can only be detected by RT-PCR. Alternatively, the RNA
blot probed consisted of adult tissues whereas all RT-PCRs and cDNA clones were derived
from fetal tissues suggesting T68 may be only expressed during development stages.
BLASTN analysis of the unique 3'UTR of T68 revealed almost lÙOyo homology to a section
ofthe 3' UTR of the COLIAI gene. This corresponds to a stretch of nucleotides present in the
224
Chapter 6 Charqcterisation Unit 6 (76)
vicinity of the second polyadenylation signal (pAZ) of this gene (Maatta et al., l99l), which is
also seen in the equivalent pA5 site of the COLIA2 gene (Myers et al., 1983). This region
includes a GCATGT motif that immediately follows the polyadenylation site together with a
conserved TGTACCTATTTTGTAT element present about 30 bp upstream. In protein gel
shift assays, a334 bp region of the COLIAI gene incorporating this conserved polyadenylation
site was shown to exhibit cell-specific binding of nuclear proteins from a HeLa nuclear extract
but not an NS-l extract (Maatta et a1.,1991). In addition, nuclear proteins of human fetal and
embryonic chicken tendon fibroblasts also recognised this region, with this specific binding
inhibited by an excess of nonspecific competitors. This strongly suggested the conserved
domain contained regulatory elements important for cell specific expression of the COLIAI
gene. The identification of the same region in the T68 gene suggests it too may bind the same
proteins as COLIA-| to regulate its expression possibly by affecting the half-life of the T6B
¡RNA. T6B may therefore be an independent gene on another chromosome, which shares
homology to both the T6 transcript and to 3' regulatory elements present in the COLIAI gene.
The T6C transcripts originated by incorrect binding of the RNA with the oligo-dT primer used
for the construction of the oDNA libraries from where they derived. The majority of these
clones contained an extra 167 bp of sequence between exons 1 and 2 that did not correspond
to intronic DNA immediately adjacent to these exons. Inclusion of this sequence disrupts the
ORF of T6 such that the next available methionine is present in exon 7. It is most likely that
this 167 bp "exon" was derived from splicing occurring within intron 1 of T6. However, given
that the entire intron was not sequenced, this cannot be confirmed at this stage. As all T6C
cDNA clones were sequenced from normalised libraries and RT-PCR on total RNA failed to
confirm the existence of this "exon" in the tissues from which T6C cDNA clones were derived,
it appears that if these transcripts are functional, they are expressed at a relatively low
225

Chapter 6 Charqcterisation ption Unit 6 (76)
abundance. It was concluded that this transcript is most likely an artifact of cDNA library
production
226
Cloning of the
Gene "fo,
Cystinosis
Chapter 7 Cloning of the Gene for Cystinosis
Table of Contents
7.1 Introduction
7. 1. 1 Nephropathic Cystinosis
7.1.2 Clincal Course of Cystinosis
7.1.3 Basic Defect in Cystinosis
7.7.4Mapping the Cystinosis Gene
7.2 Methods
7.2.7Exon Trapping
7 .2.2Exon Analysis
7.2.2.1 Colony PCR of Subcloned Trapped Exons
7.2.2.2 Trapped Exon Insert Amplification
7.2.2.3 Colony Master Plate Screening of Second Round Exon Trapped Products
7.2-2.4 Sequence Analysis and Physical Mapping
7.3 Results
7.3.lFirst Round Exon Trapping
7.3.2Furlher Refinement of the Genetic Interval for the Cystinosis Gene
7.3.3 Second Round Exon Trapping
7.3.4 Clonng of the Cystinosis (CZN,S) Gene
7.3.4.1 Screening CINSfor Small Mutotions
7.4 Discussion
Page
227
227
227
228
228
230
230
231
237
231
232
232
233
233
236
238
243
245
245
Chapter 7 Clonins of the Gene for Cvstinosis
7.1lntroduction
7.1.1 Nephropathic Cystinosis
Nephropathic cystinosis is an autosomal recessive disease with an incidence of approximately 1
in 200,000 live births. The disease is characterised clinically by generalised proximal renal
tubular dysfunction (the renal Fanconi syndrome) and biochemicalþ, by intracellular
accumulation of cystine. This is caused by a defect in the transport of cystine out of the
lysosome, a process mediated by an unidentified carrier (reviewed in McDowell et al., 1997).
Although rare, it is an important disorder as it serves as the prototype for lysosomal storage
diseases due to deficiency of a membrane transporter as opposed to an enzyme deficiency
(Gahl et al., lg95). The diagnosis for cystinosis is based upon elevated leukocyte or libroblast
cystine levels as well as the presence of corneal crystals. Prenatal diagnosis is also possible
based upon measurement of cystine levels in cultured amniotic fluid cells or chorionic villi
(Gahl et ø1.,1995).
Cystinosis has been subdivided into three types. The classical disorder, referred to as
nephropathic cystinosis, occurs in 95Yo of cases and results in renal failure within the first
decade of life. Late onset, or adolescent cystinosis, has only been diagnosed in a few patients
whose renal disease occurs later compared with the infantile form. Finally, in adult cystinosis,
the few patients that have been identified to date have corneal cystine crystals but do not have
renal disease. Based on complementation studies, it has been suggested that the different forms
of cystinosis are allelic (Pellet et a|.,1988).
7.1.2 Clinical Course of Cystinosis
Newborns with nephropathic cystinosis are clinically normal, however by 6 to 18 months of
227
Chapter 7 of the Gene for Cvstinosis
age some of the effects of the renal tubular Fanconi syndrome are usually present, such as
severe fluid and electrolyte disturbance (vomiting, dehydration, rickets), poþria, and a failure
to grow and gain weight At the age of about 10, most patients present with end-stage renal
failure due to deterioration of glomerular function. While the renal failure can be treated by
renal transplantation, the donor kidney does not correct the metabolic disorder resulting in the
accumulation of cystine in other organs, leading to additional complications. These include
continued retinal damage and eventual blindness in many patients, hand muscle weakness and
wasting, difficulty in swallowing, pancreatic exocrine and endocrine insufficiency, and delayed
puberty (reviewed in McDowell et a1.,1997).
7.1.3 Basic Defect in Cystinosis
The intracellular cystine accumulation was demonstrated in the late 1960s, however further
research failed to reveal a defect in the degradation of cystine (Gahl et al., 1995). Although a
lysosomal membrane transport defect was suspected, evidence for such a molecule was not
available until 1982, when cystinotic leukocyte lysosomes were shown to exhibit virtually no
cystine removal following cystine loading, as compared to normal cells. In addition, cystinotic
cells had a prolonged half-life for cystine retention, but normal halÊlife for the removal of other
amino acids (reviewed in McDowell et al., 1,997). Further experiments established that cystine
transport was bi-directional and stimulated by ATP, and heterozygotes for cystinosis had half
the velocity of cystine transport in their cellular lysosomes as compared to normal cells. This
gene dose effect therefore verified thal. a lysosomal transport defect was the primary cause of
cystinosis.
7.l.4Mapping the Cystinosis Gene
The direct purification of the lysosomal cystine carrier protein using biochemical methods was
228
Chapter 7 Clonins ol the Gene for Cystinosis
technically difficult such that a genomic approach to identify the protein was initiated. This
began with genetic linkage mapping of 23 families segregating the disease, using 328
polymorphic marker loci covering the entire genome. Results from these studies indicated that
the gene was most likely to be located on the short arm of chromosome 17 between D17S796
and DITSl 583, a distance of approximately 7.6 cM (The Cystinosis Collaborative Research
Group, 1995). Subsequent haplotype anaþsis with additional markers mapping to this region
was successful in narowing this interval to 3.6 cM between Dl7Sl584 and Dl7Sl583
(McDowell et a1.,1996) while another study reduced this to 3.1 cM between D17S1828 and
D17S1798 (Iean et al., 1996).
Following the initial linkage mapping studies, a physical map was constructed based on YACs
covering most of the region between D17S15S4 and D17S1583 (McDowell et al.,7996). A'
selection of these YACs were then used to identify additional CA repeats located within the
region, and in total, 10 were subsequentþ isolated and sequenced. Two of these repeats,
Dl7S2l67 andDl7S2169, were sufficiently polymorphic for additional linkage mapping. Two
cystinosis families were then found to have recombination events between D17S1828 and the
new markerDlT3216T (McDowell et al.,1997). The affected individuals in both these families
shared only the interval between these markers indicating that this region must contain the
cystinosis gene. Radiation hybrid mapping determined that the lengfh of this interval was 10.2
cR"8¡ss, or approúmately 500 kb, a region small enough to allow positional cloning of the
cystinosis gene.
A collaboration was established between the Department of Cytogenetics and Molecular
Genetics at the Women's and Children's Hospital in Adelaide and those groups focussed on
the cloning of the gene for cystinosis. A physical map based on cosmids has been pattrally
229
Chapter 7 of the Gene for Cystinosis
constructed across the critical region by a collaborating group in London. The aim of the
project in this chapter therefore is to assist in the identification of the gene through the
isolation of novel transcribed sequences present within cosmids mapping to this region. This
will primarily involve the use of exon trapping from clones representing a minimum tiling path.
Further characterisation of trapped exons will be performed by consortium members in
London, followed by mutation analysis in affected individuals.
T.2M.ethods
The cloning of the cystinosis gene involved collaborative efforts from a number of laboratories
and only the methods involved in the contribution from the candidate towards this project will
be presented. This primarily centred onthe trapping of exons from cosmid clones mapping in
the cystinosis critical region. All other methods used can be obtained from the publication
arising from this work (Town et a1.,l998-Appendix A5).
7.2.lExon Trapping
The same exon trapping procedure as described in chapter 4 was used. Slight modifications to
the method are listed below. Cosmid bacterial stabs were streaked for single colonies on L-
Ampicillin plates and DNA was isolated from 200 ml overnight cultures as describedin2.2.l.l.
Two rounds of trapping were performed. The first involved 5 cosmid clones indicated in
Figure 7.1C, which were subcloned separately into the pSPL3B-CAM vector using
BglIIlBamHI double digests and PstI digests. A single flask of COS-7 cells was subsequently
transfected with2 pg of each subcloned cosmid (1 pg from the BgllVBamfil subclones and I
¡rg from the PslI subclones). In the second round of trapping, 3 overlapping cosmid clones
were used as indicated in Figure 7.3A- F;ach was separately subcloned into the trapping vector
230
Chapter 7 Clonins ofthe Gene for Cvstinosis
with PslI digests and BglIIlBamHI double digests as with the initial exon trapping. Each
subcloned cosmid was then transfected into a separate flask of COS-7 cells. Subsequent
procedures were followed as describedin 4.2.7 to 4.2.11.
7.2.2Exon Analysis
7.2.2.1 Colony PCR of Subcloned Trapped Exons
From the first round of exon trapping, a total of fi6 exon trapped products were analysed by
colony PCR (2.2.14.2). Products were grouped according to size and representative clones
from each size group were analysed further (see 7.2.2.4). In the second round of trapping
colony PCR of 24 randonly selected trapped products for each cosmid was performed. An
additional2l colonies were streaked onto the same master plate, such that in total, 45 colonies
were kept from each cosmid trap which were subsequently screened by hybridisation (see
7.2.2.2 andT.2.2.3).
7.2.2.2 Trapped Exon Insert Ampfficatíon
From the initial 24 clones analysed by colony PCR for each cosmid from the second round of
trapping, clones representing each size group were chosen for insert amplification by colony
pcp Q.2.14.2) and subsequent hybridisations to check for clone redundancy. Each trapped
product contained exon sequence as well as a small amount of pSPL3B-CAM sequence
adjacent to its splice donor and splice acceptor site. Therefore PCR amplification of exon
sequences alone was achieved using the SA5 and SD5 primers (see Table 2.1) which lie
immediately adjacent to the splice donor and splice acceptor site of the trapping vector. The
entire PCR reaction was run on a 2Yo (wlv) agarose gel and the amplified insert excised with a
sterile scalpel blade.
237
Chapter 7 C of the Gene for Cystinosis
7.2.2.3 Colony Master Pløte Screening of Second Round Exon Trøpped Products
Each master plate containing 45 colonies from the second round of trapping (7.2.2.1), was
replica plated onto fresh L-Ampicillin plates using a sterile pipette tip for each clone
transferred. After growth overnight at 37"C, the plates were colony blotted as described in
2.2.17.5. PCR amplified inserts of clones from each size group (7.2.2.2) were then used
individualþ as hybridisation probes to detect identical clones on the master plate (redundancy
screening). Such positive clones were eliminated from subsequent analysis. Those clones that
were negative but were in the same size group as the clone used for hybridisation were likely
to represent unique trapped exons and so were analysed further (see 7.2.2.4). Screening of
master plates continued until every clone was accounted for. Labelling of DNA fragments in
agarose, hybridisation and washing of membranes, and stripping of membranes for re-use is
described in chapter 2.
7.2.2.4 Sequence Anølysis and Physical Møppíng
Clones selected for further analysis were grownin20 ml of L-Broth plus ampicillin (100 ¡rg
/nrl) and DNA was isolated using Qiagen Tip-20 columns (2.2.1.3). The trapped products were
sequenced using DyePrimer F and R sequencing kits (2.2.18.2). Trapped exon sequence
homology searches of both the non-redundant and dbEST databases at NCBI were performed
using the BLASTN algorithm (Althschul et al., 1997). Unique trapped products were then sent
to the collaborating group in London for physical mapping and identification of transcripts
associated with the exons. Specific details of the procedures can be found in Town et al.,
(1ee8).
232
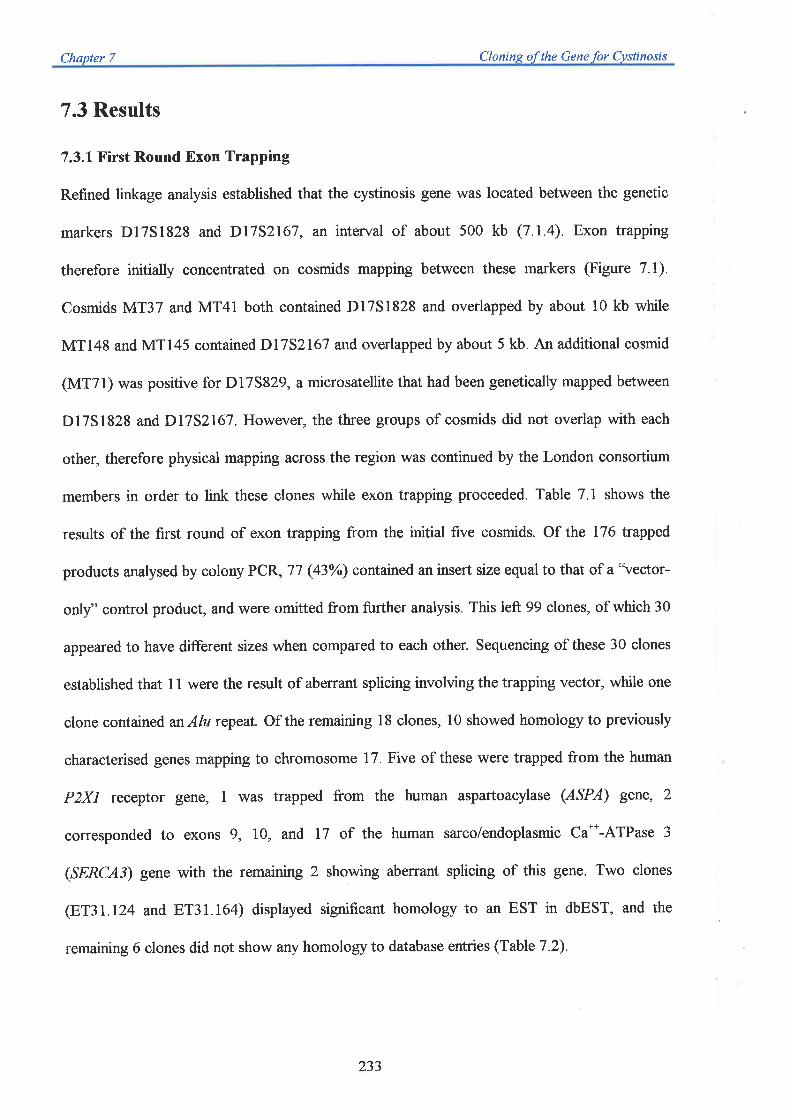
Chapter 7 Cloning of the Gene for Cystinosis
7.3 Results
7.3.1 First Round Exon Trapping
Refined linkage analysis established that the cystinosis gene was located between the genetic
markers D17S1828 and D17S2767, an interval of about 500 kb (7.1.4). Exon trapping
therefore initially concentrated on cosmids mapping between these markers (Figure 7.1).
Cosmids MT37 and MT41 both contained D17S1828 and overlapped by about 10 kb while
MT148 and MTl45 contained Dl7S2l67 and overlapped by about 5 kb. An additional cosmid
(MT71) was positive for D17S829, a microsatellite that had been genetically mapped between
D17S1828 andD77S2167. However, the three groups of cosmids did not overlap with each
other, therefore physical mapping across the region was continued by the London consortium
members in order to link these clones while exon trapping proceeded. Table 7.1 shows the
results of the first round of exon trapping from the initial five cosmids. Of the 176 trapped
products analysed by colony PCR, 77 (43%) contained an insert size equal to that of a'\¡ector-
only" control product, and were omitted from further analysis. This left 99 clones, of which 30
appeared to have different sizes when compared to each other. Sequencing of these 30 clones
established that 11 were the result of aberrant splicing involving the trapping vector, while one
clone contained an Alu repeat Of the rernainng 18 clones, l0 showed homology to previously
characterised genes mapping to chromosome 17. Five of these were trapped from the human
P2XI receptor gene, 1 was trapped from the human aspartoacylase (ASPA) gene, 2
corresponded to exons 9, 10, and 17 of the human sarco/endoplasmic Ca**-ATPase 3
(SERCA3) gene with the remaining 2 showing abenant splicing of this gene. Two clones
(ET31 .724 and ET31.164) displayed signifïcant homology to an EST in dbEST, and the
remaining 6 clones did not show any homology to database entries (TableT .2).
233
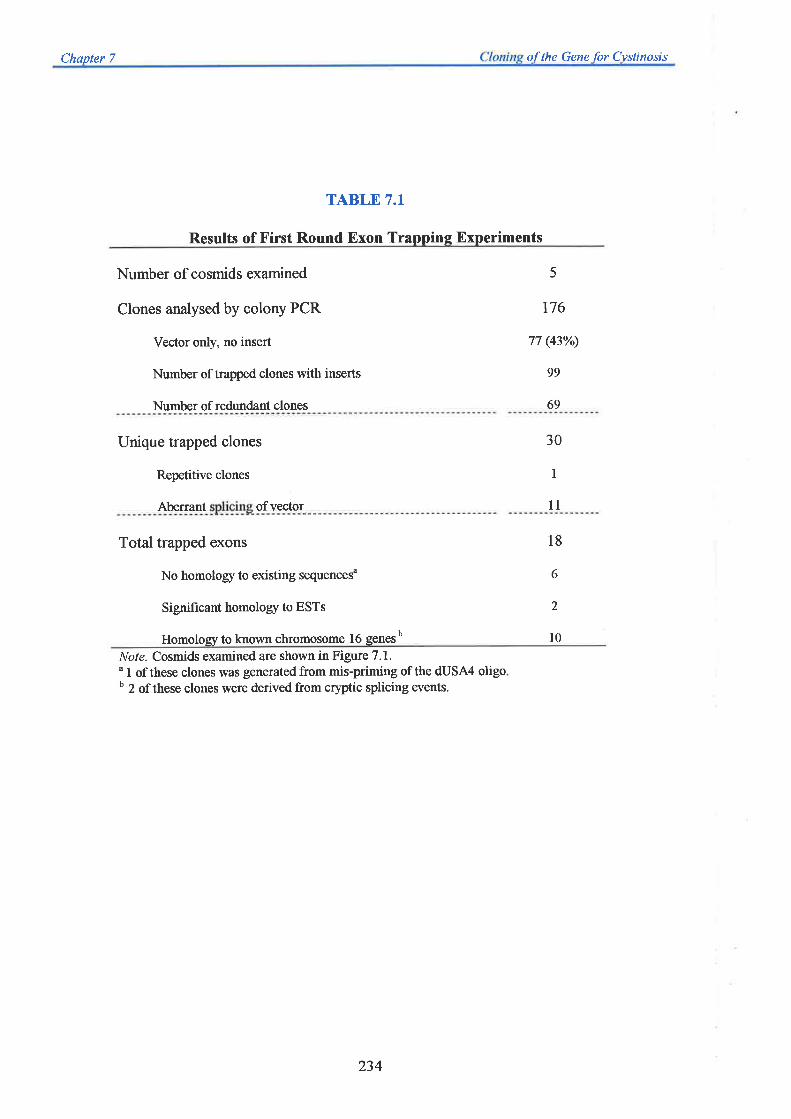
Chapter 7 of the Gene for Cvstinosis
TABLE 7.1
Results of First Round Exon Trapping Experiments
Number of cosmids examined
Clones analysed by colony PCR
Vector only, no insert
Number of trapped clones with inserts
Number of redundant clones
5
176
77 (43W
99
69
Unique trapped clones
Repetitive clones
Aberrant
30
I
ofvector 11
Total trapped exons
No homolory to existing sequencesu
Significant homolory to ESTs
l8
6
2
Homolog¡r to known chromosome 16 genesb l0l/o/e. Cosmids examined are shown in Figure 7.1.
'1 of these clones was generated from mis-priming of the dUSA4 oligoo 2 of these clones were derived from cryptic splicing events.
234
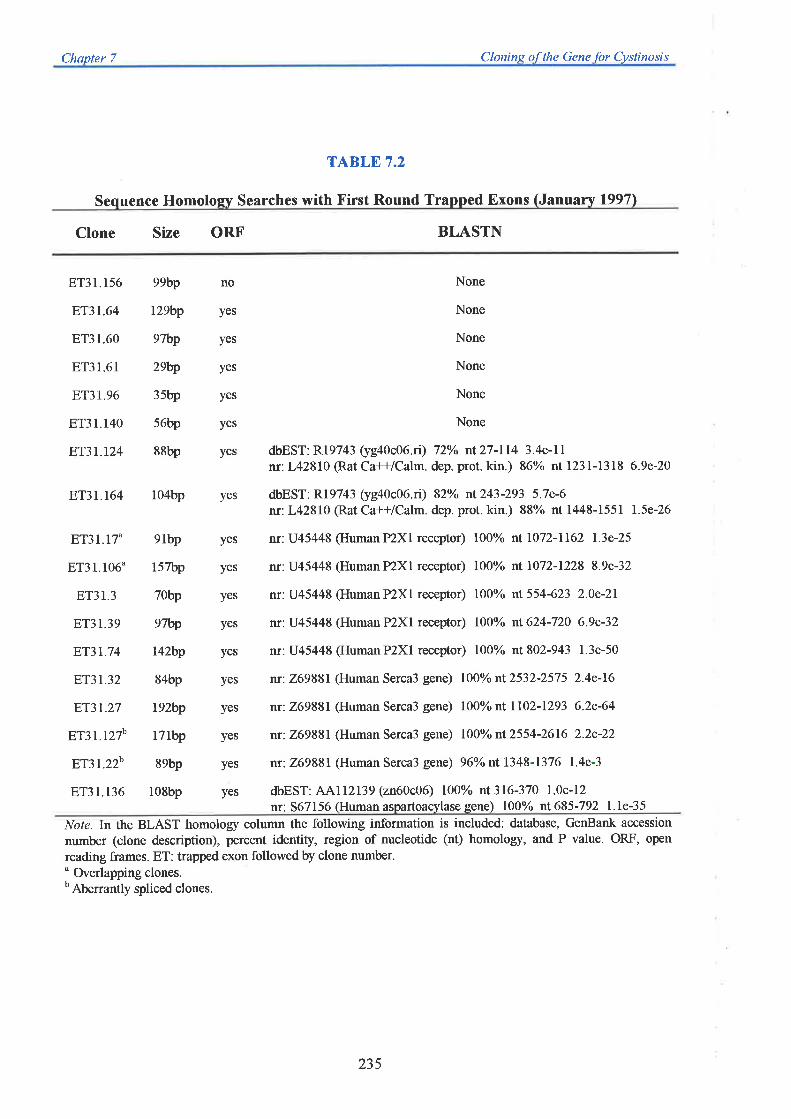
Chqpter 7 Cloning of the Gene for Cystinosis
TABLE 7.2
Sequence Homology Searches with First Round Trapped Exons (January 19971
Clone Size ORF BLASTN
ET31.164 104bp
ET3 1. t5ó
ET3t.64
ET31.60
8T31.61
ET31.96
ET31.140
ET3t.t24
ET31.17"
ET31.106'
ET31.3
ET3t.39
ET3t.74
ET3l.32
ET3t.27
FjT3t.t27b
E't3t.22b
8T31.136
99bp
I29bp
97bp
29bp
35bp
56bp
88bp
9lbp
l57bp
7Obp
97bp
r42bp
84bp
192bp
17lbp
89bp
108bp
no
yes
yes
yes
yes
yes
yes
yes
yes
yes
yes
yes
yes
yes
yes
yes
yes
yes
None
None
None
None
None
None
dbEST: Rl 9743 (yga0c06.ri) 72Yo nt 27 -ll4 3.4e-1 Inr:L42810 (Rat Ca++/Calm. dep. prot. kin.) 86Vo nt 1231-1318 6.9e-20
dbEST: R19743 (yga0c06.ri) 82Vo nt243-293 5.7e-6
nr:L42810 @at Ca++/Calm. dep. prot. kin.) 88% nt 1448-1551 l.5e-26
nr: U45448 (Human P2X1 receptor) 100% nt 1072-1162 I.3e-25
nr: U45448 (Human P2Xl receptor) 100% nt lO72-1228 8.9e-32
nr:U45448 (HumanP2Xl receptor) l00o/o nt554-623 2.0e-2I
nr: U45448 (Human P2Xl receptor) l00o/o nt624-720 6.9e-32
nr:U45448 (HumanP2Xl receptor) 100% nt 802-943 1.3e-50
nr: 2;69881(Human Serca3 gene) 100% nt2532-2575 2.4e-16
tu: 269881(Human Serca3 gene) 100o/o nt 1102-1293 6.2e-64
nr: 2;6988I (Human Serca3 gene) 100% nt2554-2616 2.2e-22
nr:2;69881 (Human Serca3 gene) 96Vo nt 1348-1376 l.4e-3
dbEST: 44112139 (2n60c06) 100% nt 316-370 1.0e-12
nr: 567156 (Human aspartoacylase gene) 100% nt 685-792 1.1e-35
Note. In the BLAST homolory column the following information is included: database, GenBank accession
number (clone description), percent identity, region of nucleotide (nt) homology, and P value. ORF, open
reading frames. ET: trapped exon followed by clone number.
" Overlapping clones.b Aberrantly spliced clones.
235

Chapter 7 of the Gene for Cvstinosis
As can be seen from Table 7 .2,8T31.124 and ET31.164 also showed significant homology to
a rat Ca**lcalmodulin dependant protein kinase gene (GenBank accession number L42810).
These exons therefore most likely represent the human homologue to this gene. Of the 6
trapped products that did not show BLAST nucleotide homology, only 1 failed to have an
open reading frame suggesting that the majority of these may belong to transcribed sequences.
Each exon was successfuþ mapped back to its cosmid of origin (Figure 7.1). Interestingly, no
products were trapped from the cosmid MT71. Further analysis of this cosmid with PCR
indicated that it did not contain the D17S829 marker as originally stated, which was fortuitous
given the trapping results. Detailed characterisation of each of the trapped exons was
abandoned following additional linkage analysis of cystinosis families (see 7 .3.2).
7.3.2 Further Refinement of the Genetic Interval for the Cystinosis Gene
During the exon trapprng experiments, consortium members typed DNA from a collection of
cystinosis families with novel microsatellites mapping between the region containing
D1752167 and D1751828. In 23 out of 70 unrelated patients with nephropathic cystinosis, no
amplification product for D17S829 was obtained. In addition, 14 patients initially thought to
be homozygous for this marker were found to be missing one parental allele, suggesting they
carried heterozygous deletions for this locus. Further studies showed that in every family, the
deletion segregated with the disease. DNA from 100 unrelated and unaffected individuals was
also typed for this marker. No homozygous deletions were detected indicating that the deletion
found in the cytinosis patients was not a polymorphism. These results suggested that a deletion
of the D17S829 marker in these patients may also be disrupting the gene responsible for
cystinosis. As none of the previous cosmids analysed by exon trapping contained D175289, a
total of 6 cosmids containing this marker were subsequently isolated from a chromosome-17-
specific cosmid library (CRFo105) *ith an additional 8 identified from subsequent cosmid
236

A Dt7Sl529 D17S1798 Dl73829 Dl7S1828 Dl751810
J.J 3.0 0.1 1.8
2.6 1.0
D1751584
-
Dl7S2l67 Dl731828
r 10.2 r
cM Cen--->
cR¡ooo
Tel<- 0.5
D1731583
B
c
D17S1798
r or.4 1
D1751583 D1731584
56.5
MT145
Dt7S2t67
?H:
Dl7S829o
D17S1828a
H25100MT148 18
öö
MT3719
MT71H
öööö
2306HHH H
160 80H
15 6066 MT41
ö3r 60 31 124 3r 164
iiliiööö (lÖ
3r l0ó 3t 74 31 3
3t 17 31 39
ì
ö3r.27
öir 136 3l I40 31 64 31 96
cystinosis region are indiäted1y black circles. Red circles indicate the positions of the trapped exons. Cosmid MT71 was later found to be negative for the Dl7S829 marker and so
does not map to the critical cystinosis region.
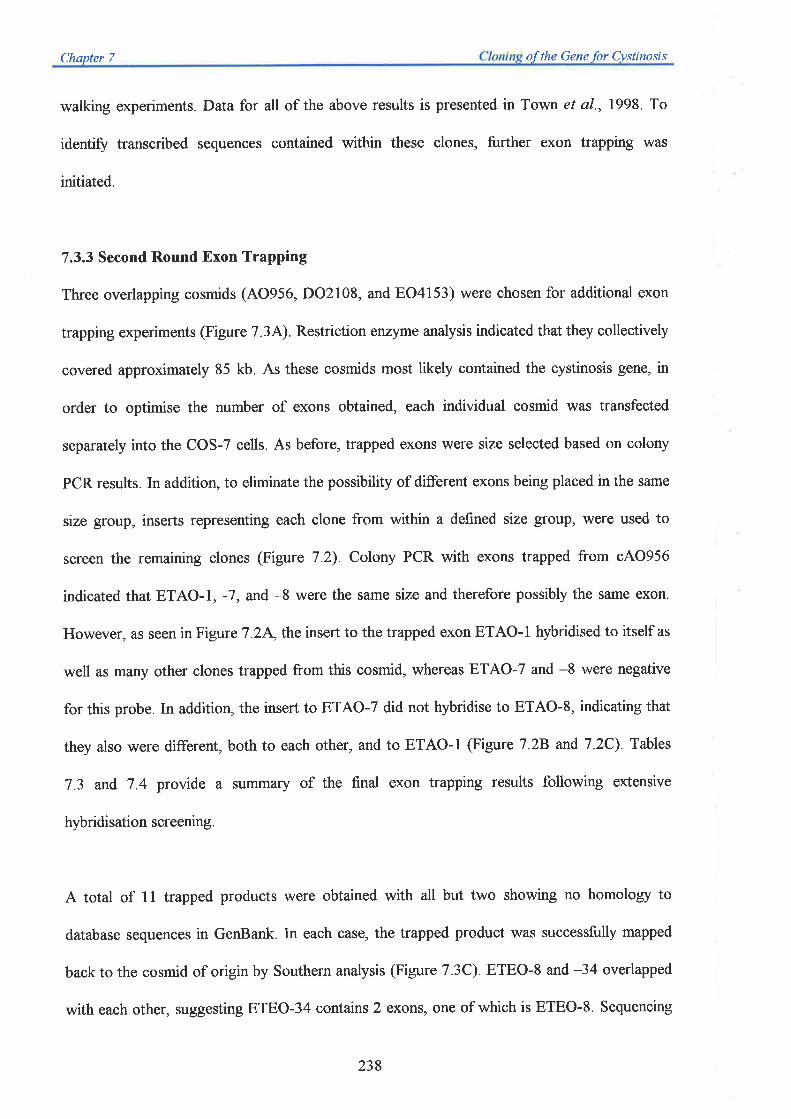
Chapter 7 of the Gene for Cvstinosis
walking experiments. Data for all of the above results is presented in Town et al., 1998. To
identify transcribed sequences contained within these clones, further exon trapping was
initiated.
7.3.3 Second Round Exon Trapping
Three overlapping cosmids (40956, DO2108, and EO4153) were chosen for additional exon
trapping experiments (Figure 7.3A). Restriction enzyme analysis indicated that they collectivd
covered approximately 85 kb. As these cosmids most likely contained the cystinosis gene, in
order to optimise the number of exons obtained, each individual cosmid was transfected
separately into the COS-7 cells. As before, trapped exons were size selected based on colony
PCR results. In addition, to eliminate the possibility of different exons being placed in the same
size group, inserts representing each clone from within a defined size group, were used to
screen the remaining clones (Figure 7.2). Colony PCR with exons trapped from cAO956
indicated that ETAO-I, -7, and -8 were the same size and therefore possibly the same exon.
However, as seen in Figure 7.2A, the insert to the trapped exon ETAO-1 hybridised to itself as
well as many other clones trapped from this cosmid, whereas ETAO-7 and -8 were negative
for this probe. In addition, the insert to ETAO-7 did not hybridise to ETAO-8, indicating that
they also were different, both to each other, and to ETAO-I (Figure 7.28 and 7.2C). Tables
7.3 and 7.4 provide a summary of the final exon trapping results following extensive
hybridisation screening.
A total of 1l trapped products were obtained with all but two showing no homology to
database sequences in GenBank. In each case, the trapped product was successfully mapped
back to the cosmid of origin by Southern analysis (Figure 7 .3C). ETEO-8 and -34 overlapped
with each other, suggesting ETEO-34 contains 2 exons, one of which is ETEO-8. Sequencing
238

Probe:ETAO-I
Positive clones:ETAO-I, -4, -5, -6, -loETAO-I1, -13, -15, -16ETAO-2l, -24,-26,-27ETAO-28, -30, -32, -35
ETAO-36, -37
Probe: ETAO-7
Positive clones:ETAO-7, -20, -38
rð
Probe: ETAO-8
Positive clones:
ETAO-8, -r4, -22ETAO-34, -40, -44
It
$a
111¡
¡Þ,r tl
wrl
al
IJ
to'
¡a
lt
rt
rl
å t
a
tt
r{
,t
lt
t
T
,,
Irr,r llr¡
t{
¡a
L' \t
a |D¡r
rJ
¿lr
lt
¡t
}l
rf ¡t
¡L ¡l
¡f&ll
vrrt¡
¡l
¡
t¡
l.
tr
a
¡l at
Figure 7.2: Sueentng exon trapped clones isolated from the cosmid 40956 by colony
hybridisation with inserts from individual exons. (A) The ETAO-I hybridises to itself as well as
a number of other identical clones. ETAO-7 and -8 are negative for this probe even though they
had the same sized insert by colony PCR. (B) ETAO-7 hybridises to itself and two other clones.
It does not hybridise to ETAO-8 and is therefore different. (C) ETAO-8 identifies itself and 5
other clones. These results indicate that hybridisation screening of clones is important to identiffdifferent trapped exons possessing a similar size as determined by colony PCR .
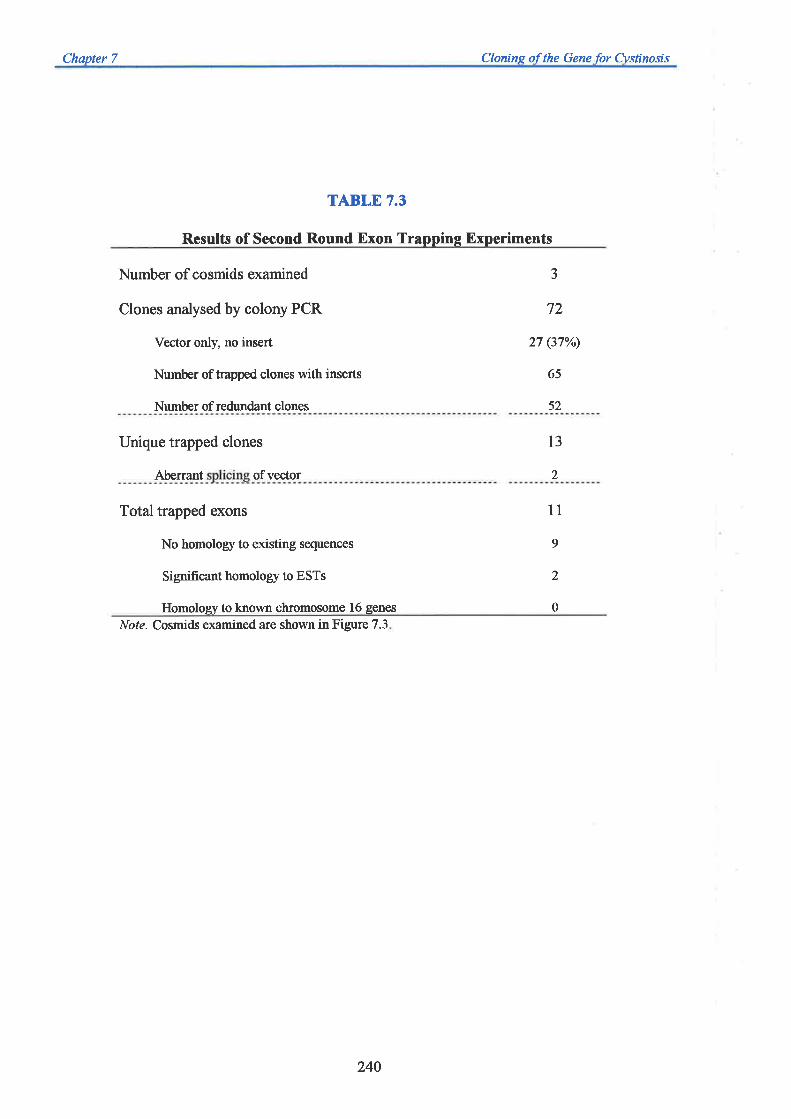
Chapter 7 Clonins of the Gene for Cvstinosis
TABLE 7.3
Results of Second Round Exon Trapping Experiments
Number of cosmids examined
Clones analysed by colony PCR
Vector only, no insert
Number of trapped clones with inserts
Number of redundant clones
J
72
27 (37yù
65
52
Unique trapped clones
Aberrant ofvector
13
2
Total trapped exons
No homology to existing sequences
Significant homolory to ESTs
Homolory to known chromosome 16 genes
11
9
2
0
l/o/e. Cosmids examined are shown in Figure 7.3
240
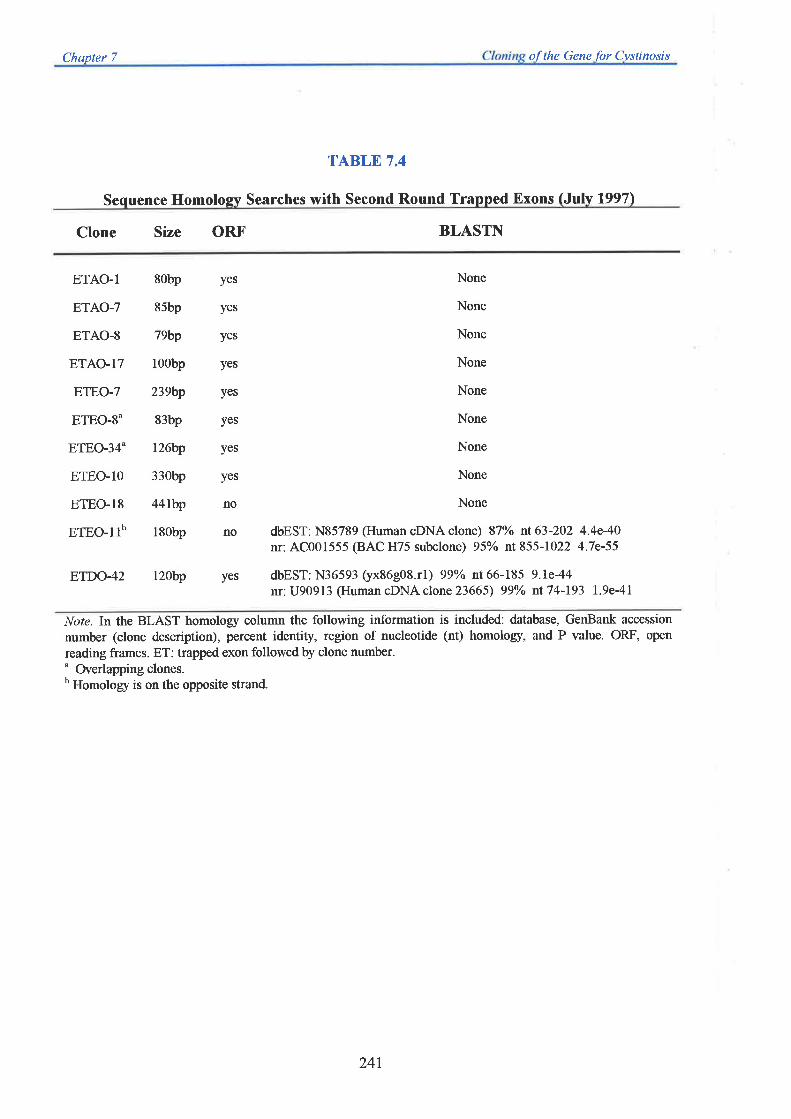
Chapter 7 of the Gene {or Cvstinosis
TABLE 7.4
Sequence Homolow Searches with Second Round Trapped Exons lJulv 19971
Clone Size ORF BLASTN
ETAO-1
ETAO-7
ETAO-8
ETAO-17
ETEO-7
ETEO-8"
ETEO-34'
ETEO-10
ETEO-T8
ETEO-llb
8Obp
85bp
79bp
100bp
239bp
83bp
l26bp
33Obp
44lbp
180bp
yes
yes
yes
yes
yes
yes
yes
yes
no
no
yes
Nonc
None
None
None
None
None
None
None
None
dbEST:N85789 (Human cDNA clone) 87%io nt63-2O2 4.4e-4O
nr: 4C001555 (BAC H75 subclone) 95Yo nt 855-1022 4.7e-55
dbEST:N36593 (yx86g08.rl) 99%o nt 66-185 9.le-44nr: U90913 (Human cDNA clone 23665) 99Yo nt74-193 1.9e-41
ETDO-42 120bp
Note.In the BLAST homology column the following information is included: database, GenBank accession
number (clone description), percent identity, region of nucleotide (nt) homolory, and P value. ORF, open
reading frames. ET: trapped exon followed by clone number.' Overlapping clones.b Homology is on the opposite strand.
241
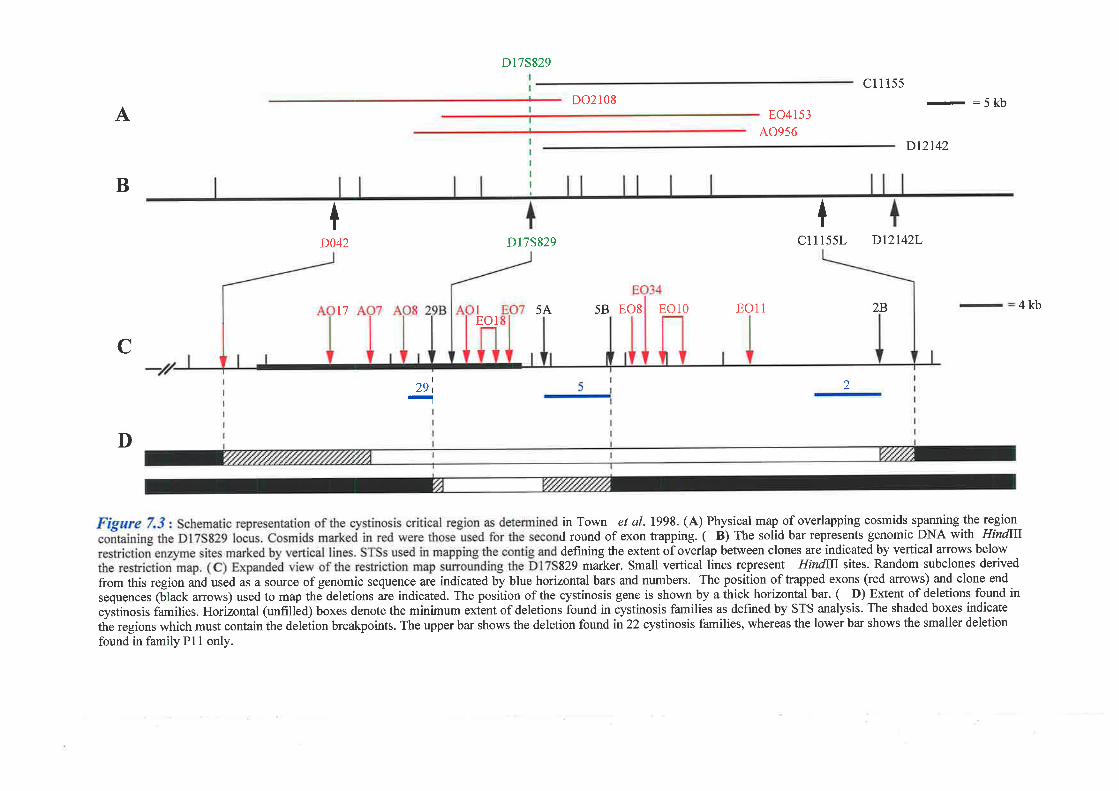
A
B
D173829
cl1i55DO2108
EO4ls3AO956 -:5kb
Dl2l42
+ Icl1l55L Dl2l42LD042
77
D175829
IEOl
5A 5B EO8 EO10 EOll kb42B
C
I
29tI-t
Jl
-
I
D
in Town et at. 1998. (A) Physical map of overlapping cosmids spanning the region
d round of exon trapping. ( B) The solid bar represents genomic DNA with HindIIIdefining the extent of overlap between clones are indicated by vertical arrows below829 marker. Small vertical lines represent HindIII sites. Random subclones derived
from this region and used as a source of genomic sequence are indicated by blue horizontal bars and numbers. The position of trapped exons (red arrows) and clone end
sequences (Èlack arrows) used to map thJ deletions are indicated. The position of the cystinosis gene is shown by a thick horizontal bar. ( D) Extent of deletions found in
cystinosis families. Horizontal (unfrllèd) boxes denote the minimum extènt of deletions found in cystinosis families as defined by STS analysis' The shaded boxes indicate
the regions which must contain the deletion breakpoints. The upper bar shows the deletion found in 22 cystinosis families, whereas the lower bar shows the smaller deletion
found in family P1l only.
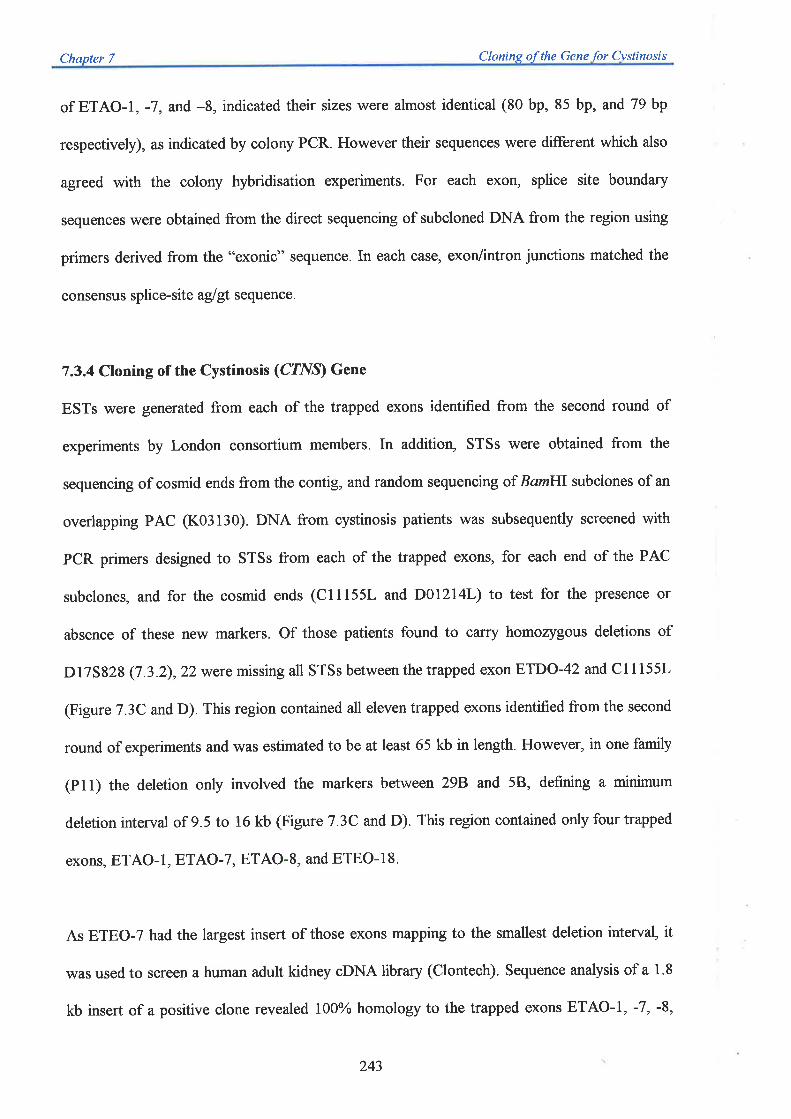
Chapter 7 Clonine of the Gene for Cystinosis
of ETAO-I , -'7, and -8, indicated their sizes were almost identical (80 bp, 85 bp, andT9bp
respectivelÐ, as indicated by colony PCR. However their sequences were different which also
agreed with the colony hybridisation experiments. For each exon, splice site boundary
sequences were obtained from the direct sequencing of subcloned DNA from the region using
primers derived from the "exonic" sequence. In each case, exon/intron junctions matched the
consensus splice-site ag/gt sequence.
7.3.4 Cloning of the Cystinosis (CfNÐ Gene
ESTs were generated from each of the trapped exons identified from the second round of
experiments by London consortium members. In addition, STSs were obtained from the
sequencing of cosmid ends from the contig, and random sequencing of Bamfil. subclones of an
overlapping PAC (K03130). DNA from cystinosis patients was subsequently screened with
PCR primers designed to STSs from each of the trapped exons, for each end of the PAC
subclones, and for the cosmid ends (Clll55l and D01214L) to test for the presence or
absence of these new markers. Of those patients found to carry homozygous deletions of
D17S828 (7 .3.2),22 were missing all STSs between the trapped exon ETDO-42 and Cl1155L
(Figure 7.3C andD). This region contained all eleven trapped exons identified from the second
round of experiments and was estimated to be at least 65 kb in length. However, in one family
(P11) the deletion only involved the markers between 298 and 58, defining a minimum
deletion interval of 9.5 to 16 kb (Figure 7 .3C and D). This region contained only four trapped
exons, ETAO-I, ETAO-7, ETAO-8, and ETEO-I8.
As ETEO-7 had the largest insert of those exons mapping to the smallest deletion interval, it
was used to screen a human adult kidney oDNA library (Clontech). Sequence analysis of a 1.8
kb insert of a positive clone revealed 700yo homology to the trapped exons ETAO-I, -7, -8,
243
Chanter 7 Clonins of the Gene for Cvstinosis
and part of ETEO-7. The screening of additional libraries coupled with 5' and 3' RACE
allowed the identification of a 2.6 kb cDNA clone containing an open reading frame of 1,101
bp. The size of this cDNA was subsequently shown to be in agreement with the size of the
transcript detected by Northern analysis.
The gene, designated CTNS, consists of twelve exons, with the ORF beginning in exon 3.
ETAO-I, -7, and -B corresponded to exons 3,4, and 5 respectively, while ETEO-7 appeared
to arise from aberrant splicing events as it was trapped from the opposite strand of the gene
and contained most of exon 2 and apart of intron 1. ETEO-18 was also most likely derived
from the use of cryptic splice sites as it too was trapped from the opposite strand of CZIIS
within intron 2. In addition, although ETAO-17 was mapped within the gene by Southern
hybridisation, it did not contain any CTNS sequence, and may also be an aberrantly generated
product located within an intron. In the 22 patients with the large homozygous deletion, PCR
amplification of exons 2to 12 revealed that the deletion spans all of the 5' end of the gene,
with a 3'breakpoint in intron 10. In contrast, the deletion in family Pl1 affected only exons I
to 3.
The CZIIS gene spans approximately 23 kb of genomic DNA and codes for a protein oî 367
amino acids. Homology searches with database sequences showed 48% identity and 66Yo
similarity over 244 amino acids with a predicted 55.5 kD protein (C41C4.7) of C. elegans, as
well as 43o/o identity and 64Yo simllanty over 102 amino acids with the yeast transmembrane
protein ERS1. CTNS appears to encode an integral membrane protein with six or seven
membrane-spanning domains, which appear to be conserved between the three species.
244
Chapter 7 C of the Gene for Cvslinosis
7.3.4.1 Screening CTNSfor Small Mutøtions
Single stranded conformation polymorphism (SSCP) analysis was performed for seven of the
coding exons on 47 unrelated patients that did not have detectable homozygous deletions. In
total, eleven different mutations were detected which included 6 small (less than 10 bp)
deletions, and 5 missense mutations. When DNA from other family members was available,
SSCP analysis confirmed that each mutation segregated with the disease, while SSCP analysis
of 36 to 72 control chromosomes for each exon failed to identi$ the abnormal SSCP pattern
seen in these affected families.
7.4 Discussion
Exon trapping of cosmid DNA from within the 500 kb cystinosis critical region was successful
in the identification of 29 individual unique products. A total of five exons were trapped from
fhe P2XI receptor gene, which had been previously mapped to chromosome 17 (Longhutst et
al., 1996). The identifïcation of exons corresponding to the previously characterised SERCA3
gene, also mapped to chromosome 17p at the D17S1828 marker (Dode et a1.,1998), provided
a refined localisation. In addition, a product was trapped that corresponded to exon 4 of the
Canavan disease causing gene, aspartoacylase (ASPA), which also had previously been mapped
to this chromosomal region (Kaul et a1.,1994) In addition, 2 exons showed high homology to
a rat protein kinase gene, suggesting the human homologue had been identifed.
A number of trapped products were then isolated from a group of three cosmid clones that
spanned the D17S829 microsatellite repeat. This marker had been shown during the course of
the exon trapping to be deleted in a number of affected individuals. Due to this fact, the
method used to screen exons trapped from these cosmids was modified so as to increase the
245
Chapter 7 Clonins of the Gene for Cvstinosis
number of potential exons identified. This involved screening all exons using a hybridisation
based approach rather than soleþ relying on size determination from agarose gel
electrophoresis. The result of this method confirmed that a colony hybridisation screening step
is important to achieve maximum yields of trapped exons.
Although two of the exons identified from the second round of exon trapping displayed
nucleotide homology to ESTs, both were excluded as candidates for the cystinosis gene based
on physical mapping data. Three of the remaining nine trapped products mapped to the
smallest region of deletion established for the interval, and were subsequently found to belong
to a novel gene, CTNS. The D17S829 locus was shown to map to the third intron of CTNS,
which localised this gene within the cystinosis region previously established by linkage analysis.
A total of six trapped products showed homology to CTNS, three corresponded to exons 3, 4,
and 5, while three others were aberrantly spliced clones from within the CTNS genomic
interval.
Deletions involving the loss of the 5' end of the gene were characterised and eleven different
small mutations were identifìed which segregated with the disease. All mutations identified to
date have been shown to severely disrupt the open reading frame of the gene, suggesting
possibly complete loss of function of the protein. Affected individuals were found to be either
homozygous for a specific mutation or compound heterozygotes, consistent with an autosomal
recessive mode of inheritance. These findings, coupled with the absence of these mutations in
normal individuals, demonstrates that CTNS is the cystinosis gene.
CTNS was shown to be expressed at varying levels in all fetal and adult tissues tested, a finding
which is consistent with the high levels of intracellular cystine identified in different cell types
246

Chapter 7 of the Gene for Cvstinosis
and the multisystem involvement of the disorder (Gahl et al., 1995). The encoded protein has
been predicted to contain six or seven transmembrane domains, typical of an integral
membrane protein. The absence of specific targetting sequences in the gene product suggests
that the protein is not localised to the Golgi apparatus, ER lumen, peroxisome, mitochondria,
or the nucleus. However, the presence of a GY)O(-hydrophobic amino acid motif found in
several lysosomal membrane proteins, suggests it may be a lysosomal membrane protein
(Hunziker and Geuze, 1996).In addition, predicted heavy glycosylation of the N-terminal end
of cystinosin, as seen in regions of lysosome-associated membrane glycoproteins, further
supports the localisation of the protein to the membranes of lysosomes (Hunzicker and Geuze,
1996). This is consistent withthe predicted role of the protein in lysosomal cystine removal,
however further work is required to determine the exact role of cystinosin in the transport
process
247

Generul Discussion
und
Future Directions

Chapter I General Discussion and Future Directions
The work presented in this thesis enabled the positional cloning of the Fanconi anaemia group
A(FAA) gene and the gene responsible for nephropathic cystinosis (Cf¡fÐ. An additional aim
of the study, which has not been achieved to date, is the identification of a breast cancer
tumour suppressor gene, which has been localised to chromosome 16q24.3 between the
microsatellite markers D16S3026 and D16S303. This -750 kb interval has been shown to
consist of 7 previously characterised genes (one of which was FAA), and 20 individual EST
clones identified by a combination of exon trapping, EST mapping, and dbEST screening of
partial genomic sequence.
Three of these ESTs (GASII, Cl6orf3, and T6) were analysed in detail to determine if they
were involved in breast carcinogenesis. All three were shown to be transcribed and expressed
in breast tissue. However, mutation analysis failed to identifr nucleotide changes specific for
breast tumour DNA, which ruled them out as candidate tumour suppressor genes. Further
characterisation of the remaining transcripts not reported in this thesis has shown that at least
14 individual transcription units now eúst within the 750 kb candidate region. This does not
include the 7 previousþ characterised genes, GASI I, CI6orf3, T6, or the SPGT gene. Of these
14 transcripts, 3 have been examined for mutations in breast tumour DNA by SSCP analysis,
and subsequently eliminated as candidate genes. Four transcription units have been proposed
based on the presence of a single trapped exon and have not been analysed further. The
remaining 7 transcription units are being examined presentþ. The development of the
transcription map at 76q24.3 provides an important source of candidate genes for other
diseases that may be mapped to this region in the future. An example is the gene for
deþdrated hereditary stomatocytosis, which has recentþ been mapped by genetic linkage to
16q23-qter (Carella et a|.,1998).
248

Chapter I General Disclssion and Future Directions
The gene density within this region is quite high with an average of I gene every 30 kb. The
gene identification methods used in this thesis involved exon trapping from cosmid DNA"
analysis of ESTs mapped to 16q24.3 as part of the Human Gene Map construction at NCBI,
and dbEST screening with partial cosmid sequence. These methods were also used by Cooper
et al. (1998) in the analysis of the 1.65 IVIb Best macular dystrophy disease region. Combined
with previous mapping studies (Cooper et al., 1997) they were able to identify at least 31
transcrþs in the candidate region, or I gene per:'50 kb. In another study of a 900 kb region
at Xp22.l-p22.2 (Warneke-Wittstock et aI., 1998), the same procedures identified at least 12
novel transcripts in addition to the two genes already localised to this region. Therefore the use
of these three methods has proven successful in the identification of novel genes. It is highly
probable that not all genes were identified in each of these studies, including the transcription
map presented in this thesis. In a comparison of methods used in the positional cloning of the
BRCAI gene (Harshman et a|.,7995), none of the four independent studies analysed identified
all genes within the candidate region. This illustrates the enormous effort required to complete
a positional cloning project successfully. Unfortunately, in most laboratories, a subset of
transcript identification methods will have to be chosen. The success of the exon trapping
procedure in the cloning of FAA and CZN^S in this study as well as the success of this technique
in other positional cloning projects suggests this technique should be one of those employed.
At the onset of this project, the rate-limiting step in positional cloning was the identification
and characterisation of genes in the region of interest. During the course of this thesis,
significant progress in the physical mapping of human ESTs developed to the point where a
positional candidate approach to disease gene isolation can now be utilised. As a first step in
this approach, ESTs known to map to a candidate region can be analysed for their possible role
in the associated disease. If this is unsuccessful then more general techniques of transcript
249
Chqpter I General Discussion and Future Directions
identification, such as exon trapping, may then be employed to identiS additional candidate
genes. Although the release of the GeneMap '98 (Deloukas et al., 1998) reports 30,000
mapped transcripts (¡- one-third of all genes) the coverage of these transcripts in 76q24.3 is
less than what is expected. Only three unique UniGene clusters are on the new map of the 14
that were identified by exon trapping. Therefore until such time as the majority of genes have
been end-sequenced and mapped as ESTs, gene hunting methods such as exon trapping and
direct selection still need to be employed for positional clo.ting projects.
The final phase of the Human Genome Project is in progress, the identification of the complete
nucleotide sequence of man. Many studies have benefited greatly from the availability of only
partial genomic sequence of the region under investigation (Osborne et a|.,1996; Bernot et al.,
1998; Hisama et al., 1998; Warneke-\ù/ittstock et al., 1998). This thesis also used partial
cosmid sequence in the 16q24.3 region to screen dbEST for homologous cDNA clones with
the successful identification of three novel ESTs and 1 gene (beta III tubulin). An independent
aim of our Department is to completely sequence the 76q24.3 region. The dense physical map
produced during the course of this thesis will serve as an ideal sequencing template with
analysis ofthis sequence further enhancing the transcription map produced to date.
An emerging tool for the identification of genes within large stretches of genomic DNA is the
use of computational methods of gene prediction (Fickett, 1996). Although research into these
methods has been going on for the past 15 years (Claverie, 1997), the field has evolved from
the design of programs to identi$ protein coding regions of bacterial genomes to the challenge
of predicting detailed multi-exon vertebrate genes. A number of programs have been developed
and their performances compared (reviewed in Fickett,1996; Claverie, 1997). Some of these
include GENSCAì{ (Kulp et al., 1996) which perfectþ locates more than 80% of internal
250

Chapter I General Discussion and Future Directions
coding exons, \IZFIF (Zhang, 1997), and GI{AIL (Milanesi et al., 1993). The latter 2 are
simple exon finders and are best suited to low coverage genomic sequence data while
GENSCAì{ is best suited to large contigs of complete genomic sequence similar to those being
generated at present. Unfortunately, with most of the programs, a large percentage (60%) of
predicted proteins are wrong, and nearly I0Oo/o of the predicted gene structures have incorrect
5' and 3' boundaries (Claverie,1997). Therefore, computational methods of gene identification
have to be combined and compared with the results of experimenfal dala. Given that most 3'
gene extremities will eventually be identified as ESTs, the key to the next generation of gene
identification programs will be the efücient detection of vertebrate promoters, and thus the 5'
end of genes. Undoubtedly, the availability of the complete nucleotide sequence of a disease
gene region will have an enormous impact on positional cloning and positional candidate
cloning. As well as computer generated predictions of possible gene content, a direct sequence
homology scan of established EST and gene databases will identify homologous ESTs and
provide an immediate gene structure for any transcripts identified. This signifies a new era in
disease gene cloning, where transcript identification by exon trapping and direct selection may
join zoo blots in being 'tlassical approaches" for the identification of transcribed sequences.
\üithin the breast cancer tumour suppressor candidate region at 76q24.3, many transcripts have
been characterised and found not to be involved in breast carcinogenesis. While there are still
many other transcripts to be analysed, and possibly more genes to be found, the underlying
basis for this approach is the definition of the localisation of the tumour suppressor gene by
loss of heterozygosity (LOH) studies. The LOH data generated from the panel of 27 breast
tumours used during the course of this thesis are shown in Figure 1.4. The chosen candidate
region between D16S3026 and D16S303 was based on the restricted LOH seen in two
tumours, 8T559 and 8T410. The availability and typing of additional microsatellite markers in
257

Chapter I Generql Discussion and Future Directions
this panel of tumours has recently highlighted problems with the data generated from detailed
LOH studies. Tumour 8T410 has since been shown to have LOH for DI652624 andDl6S752
(data of Dr. Anne-Marie Cleton-Jansen), two markers that map proximal to Dl6S289 (see
Figure 1.4) such that the candidate region is now defined by a single tumour (BT559).
Interpretation of LO}J data using microsatellite markers can often be difficult due to
contaminating normal DNA and preferential PCR amplification of alleles This is demonstrated
by reports of extensive regions of intermittent loss (Tsuda et a1.,7994; Dorion-Bonnet et al.,
1995; Skirnisdottft et al., 1995; Chen et al., 1996b; Driouch et al., 1997) which may be
biologically unrealistic and more likely represent experimental artifacts. However given these
complications, a number of tumours (seven) in the Leiden data still support the loss of 16q24.3
in breast tumourigenesis along with independent LOH data from the analysis of an additional
724 pimary breast tumours (unpublished dafa of FAB consortium). Unfortunately a broader
region to the one analysed during the course of this thesis may need to be considered in future
studies.
Alternative methods to those presented in this thesis may need to be employed to examine the
region proximal to D16S3026. Anumber have been proposed with the majority focussing on a
more functional based approach. Microcell-mediated chromosome transfer has provided
functional evidence for the presence of a tumour suppressor gene within a genomic region (Koi
et al., 1989). Many studies of this type have demonstrated that the introduction of normal
chromosomes into malignant cell lines can restore gene function and reverse the malignant
phenotype (Weissman et al., 7987; Negrini et al., 7992; Phillips et al., 1996).In addition, the
introduction of defined subchromosomal transferable fragments has led to the identification of
specific regions of the genome most likely to contain tumour suppressor genes (Koi et al.,
1993;Tanaka et a|.,7993;Hu et a|.,1997; Steck et ø1.,1997). Following the identification of
252
Chapter 8 General Discussion and Future Directions
a defined region at 76q24.3 which suppresses tumourigenicity, the availability of a detailed
physical map of this region (1.1 IVIb presented in this thesis combined with - 1 Mb under
construction proximal to the CYl8A(D2)-qter region) could provide a source of cloned DNA
with which to conduct additional functional complementation experiments. 'Whole
cosmid,
BAC or PAC genomic inserts can be cloned into mammalian expression vectors and tested for
their ability to rescue the tumourigenic potential of selected breast cancer cell lines as detected
by colony forming assays in soft agar (Epstein et al., 7980) and reduced tumourigenicity in
immunocompromised mice. A genomic insert shown to reduce the tumourigenicity of a cell
line can then be examined to determine the genes present within the clone, which will be
tumour suppressor candidates.
Another approach is the use of cDNA microarrays. This emerging technology allows a rapid
survey of the tissue expression of a large number of genes and provides the ability to compare
the expression pattern of genes between different tissues (Schena et al., 1995; Iyer et al.,
1999). Recently, the temporal pattern of gene expression following serum treatment of
growth-arrested human fibroblasts was examined using oDNA microarrays (Iyer et al., 1999).
In this study, cDNA made from purified mRNA from a serum stimulated fibroblast, was
labelled with the fluorescent dye Cy5. This was mixed with a cornmon reference probe
(consisting of cDNA made from purified mRNA from quiescent fibroblast cells) labelled with
a second fluorescent dye, Cy3, and hybridised to a DNA microarray containing 8,613 human
ESTs and genes. The colour images from the hybridisation results were made by representing
the Cy3 fluorescent image as green and the Cy5 image as red and merging the two colours.
Yellow spots on the microarray filters therefore represented genes whose expression did not
vary between the resting and stimulated fibroblast cell. Genes whose mRNAs were more
abundant in the serum-deprived fibroblasts appeared green, whereas those genes whose
253
Chapter I General Discussion and Future Directions
mRNAs were more abundant in the serum-treated cells appeared as red spots. As a result, the
expression profile of individual genes in the human fibroblast in response to serum addition
could be determined. This technique could also be applied to allow a comparison between the
expres"sion patterns of genes in a breast tumour and normal cell. Genes that are not expressed
in the tumour sample (as a result of mutational inactivation) but are expressed in the
corresponding normal tissue would be of interest as potential candidate tumour suppressor
genes. Unfortunately this approach is costly, can only be performed in specialised laboratories
at the present time, and will detect up-regulated or down-regulated genes from the whole
genome. Given that a breast cancer tumour suppressor candidate region at 76q24.3 has already
been identified, this approach therefore may not be the best option unless inhouse arrays of
cDNA clones mapping to this region can be produced and analysed.
The exploration of any one of these techniques may assist in the identification of the breast
cancer tumour suppressor gone mapping to chromosome 16q24.3. This will aid to improve our
understanding of the development and progression of breast cancer and ultimately have an
impact on the diagnosis and hopefully treatment of this disease.
254

References
Abbott, D.Vy'., Freeman, M.L., and Holt, J.T. (1998). Double-strand break repair deficiencyand radiation sensitivity in BRCA2 mutant cancer cells. I Natl. Cancer Inst.90: 978-985.
Adams, M.D., Kelley, J.M., Gocayne, J.D., Dubnick, M., Polymeropoulos, M.H., Xao, H.,Merril, C.R., Wu, 4., Olde, B., Moreno, R.F., Kerlavage, 4.R., McCombie, W.R., and
Venter, J.C. (1991). Complementary DNA sequencing. expressed sequence tags and
human genome project. Science 252. 7651-1656.
Adams, M.D., Kerlavage, 4.R., Fleischmann, R.D., Fuldner, R.4., Bult, C.J., et al. (7995).Initial assessment of human gene diversity and expression patterns based upon 83 millionnucleotides of cDNA sequence. Nqture 377 Suppl: 3-17.
Adams, S.M., Helps, N.R., Sharp, M.G.F., Brammar, W.J., Walker, R.4., and Varley, J.M.(1992).Isolation and characterisation of a novel gene with differential expression in benignand malignant human breast tumours. Hum. Mol. Genet. l'. 9l-96.
Albertsen, H.M., Abderrahim, H., Cann, H.M., Dausset, J., Le Paslier, D., and Cohen, D.(1990). Construction and characterisation of a yeast artiftcial chromosome librarycontaining seven haploid human genome equivalents. Proc. NotL Acad. Sci. USA 87'.
4256-4260.
Aldaz, C.M., Chen, T., Sahin, 4., Cunningham, J., and Bondy, M. (1995). Comparativeallelotype of in situ and invasive human breast cancer: high frequency of microsatelliteinstability in lobular breast carcinomas. Cqncer.Res. 55: 3976-3981.
Allikmets, R.L., Kashuba,Y J., Petterssor¡ 8., Gzatullin, R., Lebedeva, T., Kholodnyuk, I.D.,Bannikov, V.M., Petrov, N., Zakharyev, V.M., V/inberg, G., Modi, W., Dean, M., IJhlen,M., Kisselev,L.L., Klein, G., and Zabarovsky, E.R. (1994). NotIliril<ing clones as a toolfor joining physical and genetic maps of the human genome. Genomics 19.303-309.
Altschul, S.F., Gish, W., Miller, W., Myers, E.W., and Lipman, D.J. (1990). Basic local
alignment search tool. I MoL Biol. 215: 403-470.
Altschul, S.F., Madden, T.L., Schaffer, 4.4., Zhang, L, Zhang, Z.,lvhller, W., and Lipman,
D.I. (1997). Gapped BLAST and PSI-BLAST: a new generation of protein database
search programs. Nucleic Acids Res. 25:3389-3402.
Antequer4 F., and Bird, A. (1993). Number of CpG islands and genes in human and mouse.
Proc. Natl. Acqd. Sci. USA.90: I1995-11999.
Apostolou, S. (1997). Physical mapping of human chromosome 16. Thesis submission
(Department of Pediatrics, University of Adelaide, Australia).
Austruy, E., Cohen-Salmon, M., Antignac, C., Beroud, C., Henry, I., Nguyen, V.C.,Brugieres, L., Junien, C., and Cornelisse, C. (1993).Isolation of a kidney oDNA down-expressed in Wilms'tumour, by a subtractive hybridisation approach. Cancer rRes. 53:
2888-2894.
Baens, M., Aerssens, J., YanZand, K., Van den berghe, H., and Marynen, P. (1995). Isolationand regional assignment of human chromosome I2p cDNAs. Genomics 29. 44-52.
255
References
Balaban, G., Gilbert, F., Nichols, W., Meadows, 4.T., and Shields, J. (1982). Abnormalities ofchromosome 13 in retinoblastomas from individuals with normal constitutionalkaryotypes . Cancer Genet. Cytogenet. 6. 213-221.
Ballabio, A. (1993). The rise and fall of positional cloning? Nature Genet.3:277-279
Banfi, S., Borsani, G., Rossi, E., Bernard, L., Guff¿nti, 4., Rubboli, F., Marchitiello, 4.,Giglio, S., Colucciã,8., Zollo, M., Zuffardi, O., and Ballabio, A. (1996). Identificationand mapping of human cDNAs homologous to Drosophila mutant genes through ESTdatabase searching. Nature Genet. 13: 767-174.
Bartkova, J., Lukas, J., Muller, H., Lutzhft, D., Strauss, M., and Bartek, J. (1994). Cyclin Dlprotein expression and function in human breast cancer. Intl. J. Cancer 57.353-361.
Bassett, D.E. Jr., Boguski, M.S., Spencer, F., Reeves, R., Kim, S., Weaver, T., and Hieter, P.(1997). Genome cross-referencing and XREFdb: implications for the identification and
analysis of genes mutated in human disease. Nature Genet. l5:339-344.
Baumann, P., Bensor¡ F.E., and West, S.C. (1996). Human Rad51 protein promotes ATP-dependent homologous pairing and strand transfer reactions in vitro. Cell87:757-766.
Bellanne-Chantelot, C., Lacroix, 8., Ougen, P., Billault, 4., Beaufils, S., Bertrand, S.,
Georges, I., Glibert, F., Gros, I., Lucotte, G., Susini, L., Codani, J-J., Gesnouin, P., Pook,S., Vaysseix, G., Lu-Kuo, J., Ried, T., Ward, D., Chumakov, l.,Le Paslier, D., Barillot,8., and Cohen, D. (1992). Mapping the whole human genome by fingerprinting yeast
artificial chromosomes. Cell 70: 1059-1068.
Bergerheim, IJ., Nordenskjold, M., and Collins, V.P. (1989). Deletion mapping in human renal
cell carcinoma. Cancer Res. 49. 1390-7396.
Bernot, 4., Heilig, R., Clepet, C., Smaoui, N., Da Silva, C., Petit, J-L., Devaud, C.,Chiarurilkulchai, N., Fizames, C., Samsoî, D., Cruaud, C., Caloustian, C., Gyapy, G.,Delpech, M., and Weissenbach, J. (1998). A transcription map of the FMF region.
Genomics 50. 147-160.
Berry, R., Stevens, T.J., Walter, N.A.R.,'Wilcox, 4.S., Rubano, T., Hopkins, J.4.,'Webe1 J.,
Goold, R., Bento Soares, M., and Sikela, J.M. (1995). Gene-based sequence-tagged-sites
(STSs) as the basis for a human gene map. Nature Genet. l0 415-423.
Berx, G., Cleton-Jansen, A-M., Nollet, F., de Leeuw, W.J., van de Vijver, M., Cornelisse, C.,
and van Roy, F. (1995). E-cadherin is a tumour/invasion suppressor gene mutated inhuman lobular breast cancers. EMBO J. 14: 6107-6115.
Berx, G., Cleton-Jansen, A-M., Strumane, K., de Leeuw, W.J., Nollet, F., van Roy, F., and
Cornelisse, C. (1996). E-cadherin is inactivated in a majority of invasive human lobularbreast cancers by truncation mutations throughout its extracellular domain. Oncogene 13.r9t9-t925.
Bird, A.P. (1987). CpG islands as gene markers in the vertebrate nucleus. Trends in Genet. 3342-347
256
References
Bodmer, W.R., Bailey, C.J., Bodmet,I., Bussey, H.J.R., Ellis,4., Gorman, P., Lucibello, F.C.,Murday, V.4., Rider, S.H., Scambler, P., Sheer, D., Solomon, E., and Spurr, N.K. (1987).Localisation of the gene for familial adenomatous polyposis on chromosome 5. Nature328:614-676.
Boguski, M.S., Lowe, T.M.J., and Tolstoshev, C.M. (1993). dbEST-database for "expressedsequence tags". Nqture Genet. 4. 332-333.
Boguski, M.S., and Schuler, G.D. (1995). ESTablishing a human transcript map. NatureGenet. 1O.369-371
Bonaldo, M.F., Lennon, G., and Soares, M.B. (1996). Normalisation and subtraction: twoapproaches to facilitate gene discovery. Genome Res. 6:797-806.
Botstein, D., White, R.L., Skolnick, M., and Davis, R.W. (1980). Construction of a geneticlinkage map in man using restriction fragment length polymorphisms. Am. J Hum. Genet.32 314-337.
Bouffard, G.G., Idol, J.R., Braden, V.V., Iyer, L.M., Cunningham, A.F., Weintraub, L.4.,Touchman, J.W., Mohr-Tidwell, R.M., Peluso, D.C., Fulton, R.S., Ueltzen, M.S.,Weissenbach, 1., Magness, C.L., and Green, E.D. (1997). A physical map of humanchromosome 7. an integrated YAC contig map with average STS spacing of 79 kb.Genome Res.7: 673-692.
Brancolini, C., Benedetti, M., and Schneider, C. (1995). Microfilament reorganisation duringapoptosis: the role of Gas2, a possible substrate for ICEJike proteases. EIUIBO J. 145179-5790.
Brancolini, C., and Schneider, C. (1994). Phosphorylation of the growth arrest-specific proteinGas2 is coupled to actin rearrangements during Go-Gr transition in NIH 3T3 cells. J. CellBiol. 124: 743-756.
Brenner, 4.J., and Aldaz, C.M. (1995). Chromosome 9p allelic loss and p16lCDKN2 in breast
cancer and evidence of p16 inactivation in immortal breast epithelial cells. Cqncer Res. 55'.
2892-2895.
Brenner, 4.J., and Aldaz, C.M. (1997). The genetics of sporadic breast cancer. Prog. CIin.Biol. Res.396: 63-82.
Brenner, D.G., Lin-Chao, S., and Cohen, S. (1989). Analysis of mammalian cell genetic
regulation in situ by using retrovirus-derived "portable exons" carrying the EscherichiacolilacZ gene.. Proc. Natl. Acad. Sci. USA86:5517-5521.
Brenner, S. (1990). The human genome: the nature of the enterprise. CIBA Found. Symp. 1496-77.
Broc4 P.O. Traite des Tumeurs, Vol 1. Paris: P Asselin, 1886-1889
Brody, L.C., Abel, K.J., Castilla, L.H., Couch, F.J., Mckinley, D.R., Yin, G.Y., Ho, P.P.,Merajver, S., Chandrasekharappa, S.C., Xu, J.2., Cole, J.L., Struewing, J.P., Valdes,
257
References
J.M., Collins, F.S., and weber, B.L. (1995). Construction of a transcription mapsurroundingthe BRCA,I locus of human chromosome 17. Genomics 25 238-247.
Brown, T. (1993). Analysis of DNA sequences by blotting and hybridisation. Current protocolsin molecular biology, F.M. Ausbel, R. Brent, R.E. Kingston, D.D. Moore, J.G. seidman,J.A. Smith, and K. Struhl, eds. (New York: John Wiley & Sons, Inc.), pp. 2.9.1-2.9.20.
Buchwald, M. (1995). Complementation groups: one or more per gene? Nqture Genet. ll228-230.
Buckler, 4.J., Chang, D.D., Graw, S.L., Brook, J.D., Haber, D.4., Sharp, P.4., and Housman,D.E. (1991) Exon amplification: a strategy to isolate mammalian genes based on RNAsplicing. Proc. NatL Acad. Sci. USA 88: 4005-4009
Buetow, K.H., Weber, J.L., Ludwigsen, S., Scherpbier-Heddemã,T., Duyk, G.M., Sheffield,V.C., Wang, 2., and Murray, J.C. (1994). Integrated human genome-wide mapsconstructed using the CEPH reference panel. Nature Genet. 6. 391-393.
Bullrich, F., Maclachlan, T.K., Sang, N., Druck, T., Veronese, M.L., Allen, 5.L., Chiorazzi,N., Kofl 4., Heubner, K., Croce, C.M., and Giordano, A. (1995). Chromosomal mappingof members of the cdc2 family of protein kinases, cdk3, cdk6, PISSLRE, and PITALRE,and a cdk inhibitor, pz'lKpl, to regions involved in human cancer. Cancer rRes. 55: 1199-1205.
Burke, D.T., Carle, G.F., and Olson, M.V. (1987) Cloning of large segments of exogeneousDNA into yeast by means of artificial chromosome vectors. Science 236. 806-812.
Burn, T.C., Connors, T.D., Klinger, K.W., and Landes, G.M. (1995). Increased exon-trappingefficiency through modifications to the pSPL3 splicing vector. Gene 16l. 183-187.
Burn, T.C., Connors, T.D., Van Raay, T.J., Dackowski, W.R., Millholland, J.M., Klinger,K.W., and Landes, G.M. (1996). Generation of a transcriptional map for a 700-kb regionsurrounding the polycystic kidney disease type 1 (PKDI) and tuberous sclerosis type 2
QSC2) disease genes on human chromosome 16p13.3. Genome Res. 6'. 525-537.
Cairo, G., Ferrero, M., Biondi, G., and Colombo, M.P. (1992). Expression of a growth arrest
specific gene (gas-l) in transformed cells. Br. J. Cancer 66.27-31.
Callen, D.F. (1986). A mouse-human hybrid cell panel for mapping human chromosome 16
Ann. Genet. 29 235-239.
Callen, D.F., Baker, E., Eyre,H.I., Chernos, J.E., Bell, J.4., and Sutherland, G.R. (19904)Reassessment of two apparent deletions of chromosome 16p to an ins(l l;16) and a t(1;16)by chromosome painting. Ann. Genet. 33: 279-227.
Callen, D.F., Baker,8., Eyre, H.J., and Lane, S.A. (1990b) An expanded mouse-human
hybrid cell panel for mapping human chromosome 76. Ann. Genet. 33:190-195.
Callen, D.F., Hyland, V.J., Baker, 8., Fratini, 4., Gedeon, 4.K., Mulley, J.C., Fernandez,
K.E.'W., Breuning, M.H., and Sutherland, G.R. (1989). Mapping the short arm of human
258

Reþrences
chromosome 16. Genomics 4.348-354
Callen, D.F., Hyland, V.J., Baker, E.,Fralini, A., Simmers, R.N., Mulley, f.C., and Sutherland,
G.R. (1988). Fine mapping of gene probes and anonymous DNA fragments to the longarm of chromosome 16. Genomics2:144-153.
Callen, D.F., Lane, S.4., Kozman, H., Kremmidiotis, G., Whitmore, S.4., Lowenstein, M.,Doggett, N.4., Kenmochi, N., Page, D.C., Maglott, D.R., Nierman, W.C., Murakawa, K.,Berry, R., Sikela, J.M., Houlgatte, R., Auffray, C., and Sutherland, G.R. (1995).Integration of transcript and genetic maps of chromosome 16 at near-l-Mb resolution:demonstration of a "hot spot" for recombination at l6pl2. Genomics 29. 503-5ll
Carella, M., Stewart, G., Ajetunmobi, J.F., Perrotta, S., Grootenboer, S., Tchernia, G.,Delaunay, J., Totaro, A., Zelante, L., Gasparid, P., and Iolascon, A. (1998). Genomewidesearch for dehydrated hereditary stomatocytosis (hereditary xerocytosis): mapping oflocus to chromosome 16 (76q23-qter). Am. J. Hum. Genet.63 (In Press).
Carter,B.S., Ewing, C.M., Ward, W.S., Treiger,8.F., Aalders, T.W., Schalken, J.4., Epstein,J.L, and Isaacs, W.B. (1990). Allelic loss of chromosomes 16q and 10q in human prostate
cancer. Proc. Natl. Acad. Sci. USA 87: 8757-8755.
Casari, G., De Fusco, M., Ciarmatori, S., Zeviant, M., Mora, M., Fernandez,P., De Michele,
G., Filla, A., Cocozza, S., Marconi, R., Durr, 4., Fontaino, 8., and Ballabio, A. (1998).
Spastic paraplegia and O)GHOS impairment caused by mutations in paraplegin, a nuclear-
encoded mitochondrial metalloprotease. Ce ll 93. 97 3 -983 .
Caspersson, T., Zech, L., and Johanson, C. (1970). Differential banding of alþlatingfluorochromes in human chromosomes. Exp. Cell Res.60: 315-319.
Castilla, L.H., Couch, F.J., Erdos, M.R., Hoskins, K.F., Calzone, K., and Garber, J.E. (1994).
Mutations in the BRCA1 gene in families with early-onset breast and ovarian cancer.
Nature Genet. 8: 387-391.
Cavenee, W.K., DryJa, T.P., Phillips, R.4., Benedict, W.F., Godbout, R., Gallie, 8.L.,Murphree, 4.L., Strong,L.C, and White, R.L. (1983). Expression of recessive alleles bychromosomal mechanisms in retinoblasto ma. Nature 3O5: 7 7 9 -7 84.
Chaconas, G., and van de Sande, J.H. (1980).5'-"P labelling of RNA and DNA restrictionfragments. Methods Enzymol. 65: 75-88.
Chen, H., Chrast, R., Rossier, C., Morris, M.4., Lalioti, M.D., and Antonarakis, S.E. (1996a).
Cloning of 559 potential exons of genes of human chromosome 2l by exon trapping.
Genome Res. 6.747-760.
Chen, T., Sahin, 4., and Aldaz, C.M. (1996á). Deletion map of chromosome l6q in ductal
carcinoma in situ of the breast: refining a putative tumour suppressor gene region . Cancer
rRes. 56: 5605-5609.
Chomczynski, P., and Sacchi, N. (1987). Single-step method of RNA isolation by acid
guanidinium thiocyanate-phenol-chloroform extraction. Anal. Biochem. 162: 156-159.
259

Reþrences
Chumakov, I., Rigault,P., Guillou, S., Ougen, P., Billaut, A., et al. (1992). Continuum ofoverlapping clones spanning the entire human chromosome2Tq. Nqture 359: 380-387.
Chumakov, I., Rigault,P.,Le Gall, I., Bellanne-Chantelot, C., Billault, A.,et al. (1995). AYAC contig map of the human genome. Nqture 377 Suppl. 175-297.
Chung, C.T., Niemela, S.L., and Miller, R.H. (1989). One-step preparation of competentEscherichia coli'. transformation and storage of bacterial cells in the same solution. Proc.Natl. Acad. Sci. USA 86.2172-2775.
Church, D.M., Stotler, C.J., Rutter, J.L., Murrell, J.R., Trofatter, J.4., and Buckler, A.J.(1994).Isolation of genes from complex sources of mammalian genomic DNA using exonamplification. Nature Genet. 6: 98- I 05.
Church, D.M., Yang, J., Bocian, M., Shiang, R., and Wasmuth, J.I. (1997). A high-resolutionphysical and transcript map of the Cri du Chat region of human chromosome 5p. GenomeRes. 7.787-801
Claverie, J-M. (1997). Computational methods for the identification of genes in vertebrategenomic sequences. Hum. Mol. Genet. 6'. 1735-1744.
Cleton-Janser¡ A-M., Collins, N., Lakhani, S.R., Weissenbach, J., Devilee, P., Cornelisse, C.J.,and Stratton, M.R. (1995). Loss of heterozygosity in sporadic breast tumours at theBRCA2 locus on chromosome l3ql2-q13. Br. J. Cancer 72: 7241-1244.
Cleton-Jansen, A-M., Moerland, E.Vy'., Kuipers-Dijkshoorn, N.J., Callen, D.F., Sutherland,G.R., Hansen,8., Devilee, P., and Cornelisse, C.J. (1994). At least two different regions
are involved in allelic imbalance on chromosome aÍn 16q in breast cancer. Genes Chrom.
Cancer 9. l0l-707.
Cleton-Jansen, A-M., Moerland, E.W., Pronk, J.C., van Berkel, C.G.M., Apostolou, S.,
Crawford, J., Savoia, 4., Auerbach, 4.D., Mathew, C.G., Callen, D.F., and Cornelisse,
C.J. (1999). Mutation analysis of the Fanconi anaemia A gene in breast tumours with loss
of heterozygosity at 16q24.3. Br. J. Cancer.In Press.
Coher¡ 4.J., Li, F.P., Berg, S., Marchetto, D.J., Tsai, S., Jacobs, S.C., and Brown, R.S.
(1979). Hereditary renal-cell carcinoma associated with a chromosomal translocation. New
Engl. J. Med.30l: 592-595.
Cohen, D., Chumakov, I., and Weissenbach, J. (1993). A first-generation physical map of thehuman genome. Nature 366: 698-701.
Coles, C., Condie, ,A.., Chetty, U., Steel, C.M., Evans, H.J., and Prosser, J. (1992). p53
mutations in breast cancer. Cancer Res. 52 5291-5298.
Collavin, L'Buzzai, M., Saccone, S., Bernard,L., Federico, C., DellaValle, G., Brancolini, C.,
and Schneider, C. (1998). cDNA characterisation and chromosome mapping of the human
GAS2 gene. Genomics 48:265-269.
Collins, F.S. (1992). Positional cloning: let's not call it reverse anymore. Nature Genet. 1: 3-6
260
References
Collins, F.S. (1995ø). Positional cloning moves from perditional to traditional. Nature Genet.9:347-350.
Collins, F., and Galas, D. (1993). A new five-year plan for the U.S. human genome project.Science 262. 43-46.
Collins, F.S., Patrinos, 4., Jordar¡ E., Chakravarti, ,A.., Gesteland, R., Walters, L., and themembers of the DOE and NIH planning groups. (1998). New goals for the U.S. HumanGenome Project: 7998-2003. Science 282. 682-689.
Collins, F.S., and Weissman, S.M. (1984). Directional cloning of DNA fragments at alargedistance from an initial probe: a circularization method. Proc. NatL Acad. Sci. USA. 81.6812-6816.
Collins, J.E., Cole, C.G., Smink,L.l., Garrett, C.L., Leversha, M.4., et al. (1995á). Ahigh-density YAC contig map of human chromosome22. Nature 377 Suppl: 367-379.
Collins, N., McManus, R., Wooster, R., Mangion, J., Seal, S., Lakhani, S.R., Ormistor¡ W.,Daly, P.4., Ford, D., Easton, D.F., and Stratton, M.R. (1995c). Consistent loss of thewild type allele in breast cancers from a family linked to the BRCA2 gene on chromosome13q72-13. Oncogene lO. 7673-167 5.
Cooper, D.N., Smith, 8.4., Cooke, H.J., Niemann, S., and Schmidtke, J. (1985). An estimate
of unique DNA sequence heterozygosity in the human genome. Hum. Genet. 69.201-205.
Cooper, P.R., Nowak, N.J., Higgins, M.J., Church, D.M., and Shows, T.B. (1998). Transcriptmapping of the human chromosome 11ql2-q13.1 gene-rich region identifies several newlydescribed conserved genes. Genomics 49. 479-429.
Cooper, P.R., Nowak, N.J., Higgins, M.J., Simpson, S.4., Stoehr, H., Weber, B.H., Gerhard,D.S., de Jong, P., and Shows, T.B. (1997). A sequence ready high resolution physical map
of the Best macular dystrophy gene region in l lql2-q13. Genomics 4l: 185-792.
Corbo, L., Maley, J.A., Nelson, D.L., and Caskey, C.T. (1990). Direct cloning of human
transcripts with hnRNA from hybrid cell lines. Science 249. 652-655.
Couch, F.J., Farid, L.M., Deshano, M.L., Tavtigian, S.V., Calzone, K., et ø1. (19964). BRCA2germline mutations in male breast cancer cases and breast cancer families. Nature Genet.
13.123-125.
Couch, F.J., Rommens, J.M., Neuhausen, S.L., Belanger, C., Dumont, M., et al. (1996b).
Generation of an integrated transcription map of the BRCA2 region on chromosomel3ql2-ql3 . Genomics 36. 86-99.
Coulson, 4., Sulston, J., Brenner, S., and Karn, J. (1986). Toward a physical map of thegenome of the nematode Cqenorhabditis elegans. Proc. Natl. Acad. Sci. USA. 83.7821-7825.
Cox, D.R., Burmeister, M., Price, E.R., Kim, S., and Myers, R.M. (1990). Radiation hybridmapping: a somatic cell genetic method for constructing high-resolution maps of
261
References
mammalian chromosomes. Science 25O 245-250
Davies, K.E., Pearson, P.L., Harper, P.S., Murray, J.M., O'Brien, T., Sarfarazi, M., andWilliamson, R. (1983). Linkage analysis of two cloned sequences flanking the Duchennemuscular dystrophy locus on the short arm of the human X chromosome. Nucleic AcidsAes. 11: 2303-2372.
Dear, P.H., Bankier, 4.T., and Piper, M.B. (1998). A high-resolution metric HAPPY map ofhuman chromosome 14. Genomics 48.232-241.
Deloukas, P., Schuler, G.D., Gyapy, G., Beasley, E.M., Soderlund, C., et al. (1998). Aphysical map of 30,000 human genes. Science 282.744-746.
Del Sal, G., Collavin, L., Ruaro, M.E., Edomi, P., Saccone, S., Valle, G.D., and Schneider, C.(1994). Structure, function, and chromosome mapping of the growth-suppressing humanhomologue of the murine gasl gene. Proc. Natl. Acad. Sci. USA 91: 1848-1852.
Del Sal, G., Ruaro, M.E., Phiþson, L., and Schneider, C. (1992). The growth arrest-specificgene, gasl, is involved in growth suppression. Cell TO: 595-607 .
De Sario, 4., Geigl, E-M., Palmieri, G., D'IJrso, M., and Bernardi, G. (1996). Acompositional map of human chromosome band Xq28. Proc. Natl. Acad. Sci. USA. 93.1298-1302
Devilee, P., and Cornelisse, C.l. (1994). Somatic genetic changes in human breast cancerBiochimica et Biophysica Acta 1198: 113-130.
de Winter, J.P., WaisfisZ, Q., Rooimans, M.4., van Berkel, C.G.M., Bosnoyan-Collins, L.,Alon, N., Carreau, M., Bender, O., Demuth, I., Schindler, D., Pronk, J.C., Arwetr, F.,Hoehn, H., Digweed, M., Buchwald, M., and Joenje, H. (1998). The Fanconi anaemiagroup G gene FANCG is identical withXRCC9. Nature Genet. 20. 281-283.
Dib, C., Faure, S., Fizames, C., Samsor, D., Drouot, N., Vignal, 4., Millasseau, P., Marc, S.,
lJazan, J., Seboun,8., Latltop, M., Gyapy, G., Morissette, J., and Weissenbach, J.
(1996). A comprehensive genetic map of the human genome based on 5,264
microsatellites. Nature 380. 152-15 4.
Digweed, M. (1993). Human genetic instability syndromes: single gene defects with increased
risk of cancer. Toxicol. Letters 67 259-281.
Dizikes, G.J. (1995). Update on the human genome project. Genetic Testing 15: 973-988
Dode, L., De Greef, C., Mountian,I., Attard, M., Town, M.M., Casteels, R., and Wuytack, F.
(1998). Structure of the human sarco/endoplasmic reticulum C**-NlPase 3 gene. J. Biot.Chem. 273. 13982-73994.
Doggelt, N.4., Goodwin, L.4., Tesmer, J.G., Meincke, L.J., Bruce, D.C., et al. (7995). Anintegrated physical map of human chromosome 16. Nqture 377 Suppl: 335-365.
Donis-Keller, H., Green, P., Helms, C., Cartinhour, S., Weiffenbach, 8., et al. (1987). A
262
References
genetic linkage map of the human genome. Cell Sl:379-337
Dorion-Bonnet, F., Mautalen, S., Hostein, I., and Longy, M. (1995). Allelic imbalance study of16q in human primary breast carcinomas using microsatellite markers. Genes Chrom.Cancer 14: 171-181.
Dorssers, L.C., Van Agthoven, T., Dekker, 4., Van Agthoven, T.L., and Kok, E.M. (1993).Induction of antiestrogen resistance in human breast cancer cells by random insertionalmutagenesis using defective retroviruses: identification of Bcar-l, a common integrationsite. Mol. Endocrinol. 7'. 87 0-878.
Draberova, E., Lukas,Z.,Ivanyi. D., Viklicky, V., and Draber, P (1998). Expression of classIII beta-tubulin in normal and neoplastic human tissues. Histochem Cell Biol. tÛg'. 231-239.
Driouch, K., Dorion-Bonnet, F., Briffod, M., Champeme, M-H., Longy, M., and Lidereau, R.(1997). Loss of heterozygosity on chromosome arm 16q in breast cancer metastases.Genes Chrom. Cancer 19: 185-191.
Dubovsky, J., Sheffield, V.C., Duyk, G.M., and Weber, I.L. (1995). Sets of short tandemrepeat polymorphisms for efücient linkage screening of the human genome. Hum. Mol.Genet. 4.449-452.
Dutrillaux,8., Gerbault-Seureau, M., and Zafrattt, B. (1990). Characterisation of chromosomalanomalies in human breast cancer. A comparison of 30 paradiploid cases with fewchromosome changes. Cancer Genet. Cytogenet. 49. 203-217 .
Duyk, G.M., Kim, S., Myers, R.M., and Cox, D.R. (1990). Exon trapping: a genetic screen toidenti$ candidate transcribed sequences in cloned mammalian genomic DNA. Proc. NatLAcad. Sci. USA 87:8995-8999.
Easton, D.F. (1994). Cancer risks in A-T heterozygotes. Int. J. Radiat. Biol. 66'. S177-S182.
Easton, D.F., Bishop, D.T., Ford, D., Crockford, G.P., and Breast Cancer LinkageConsortium. (1993). Genetic linkage analysis in familial breast and ovarian cancer: results
from2l4 families. Am. J. Hum. Genet. 52:678-707.
Edwards, 4., Civitello, 4., Hammond, H.4., and Caskey, C.T. (1991). DNA typing and
genetic mapping with trimeric and tetrameric tandem repeats. Am. J. Hum. Genet. 49:746-756.
El-Ashry, D., and Lippman, M.E. (1994). Molecular biology of breast carcinoma. World J.
Surg.18: 12-20.
Elo, J.P., Harkonen, P., Kyllonen, 4.P., Lukkarinen, O., Poutanen, M., Vihko, R., and Vihko,P. (1997). Loss of heterozygosity at 16q24.7-q24.2 is significantly associated withmetastatic and aggressive behavior of prostate cancer. Cancer Res. 57 3356-3359.
Elvin, P., Slynn, G., Black, D., Graham, 4., Butler, R., Riley, J., Anand, R., and Markham,A.F. (1990). Isolation of oDNA clones using yeast artificial chromosome probes. Nucleic
263
References
Acids rRss. 18: 3913-3917
Engh, G., Van den Sachs, R., and Trask, BJ. (1992). Estimating genomic distance from DNAsequence location in cell nuclei by a random walk model. Science 257'. 7410-1472.
Epstein, L.8., Shen, J., Abele, J.S., and Reese, C.C. (1980). Sensitivity of human ovariancarcinoma cells to interferon and other antitumour agents assessed by an in vitro semi-solid agar technique. Ann. NY Acad. Sci. 35O 228-244.
Evans, C., Bouzyk, M., Cox, S., Warne, D., Bryant, S.P., and Spurr, N.K. (1996)Chromosomal assignment of 79 cDNAs from a range of human tissues. Genomics 3l130-134.
Evdokiou, 4., Webb, G.C., Peters, G.8., Dobrovich, ,A.., O'Keefe, D.S., Forbes, I.J., andCowled, P.A. (1993). Localisation of the human growth arrest-specific gene (GASI) tochromosome bands 9q21.3-q22, a region frequently deleted in myeloid malignancies.Genomics 18' 731-733
Fan, J-8., DeYoung, 1., Lagace, R., Lina, R.4., Xu, 2., Murray, J.C., Buetow, K.H.,Weissenbach, J., Goold, R.D., Cox, D.R., and Myers, R.M. (1994). Isolation of yeastartificial chromosome clones from 54 polymorphic loci mapped with high odds on humanchromosome 4. Hum. Mol. Genet. 3.243-246.
Fanconi, G. (1928). Familiare infantile perniziosaartige Anamie (pernizioses Blutbild undKonstitution). Jahrb Kinder he i I ll7'. 257 -280 .
Farshid, M., Hsia, C.C., and Tabor, E. (1994). Alterations of the RB tumour suppressor gene
in hepatocellular carcinoma and hepatoblastoma cell lines in association with abnormalp53expression. J. Viral Hep. l: 45-53.
Fearon, E.R., Cho, K.R., Nigro, J.M., Kern, S.E., Simons, J.W., Ruppert, J.M., Hamilton,S.R., Preisinger, 4.C., Thomas, G., Kinzler, K.W., and Vogelstein, B. (1990).Identification of a chromosome l8q gene that is altered in colorectal cancers. Science 247'.
49-56.
Fearon, E.R., and Vogelstein, B. (1990). A genetic model for colorectal tumourigenesis. Cell6l: 759-767.
Feinberg, 4.P., and Vogelstein, B. (1983). A technique for radiolabelling DNA restrictionendonuclease fragments to high specific activity. Analyt. Biochem. 132. 6-73.
Ferrero, G.8., Franco, B., Roth, E.J., Firulli, B.4., Borsani, G., Delmas-Mata, I.,Weissenbach, J., Halley, G., Schlessinger, D., Chinault, 4.C., Zoghbi, H., Nelson,D.L.,and Ballabio, A. (1995). An integrated physical and genetic map of a 35 Mb region onchromosomeXq22.3-Xp27.3. Hum. Mol. Genet. 4: 1821-1827.
Fickett, J.W. (1996). Finding genes by computer: the state of the art. Trends in Genet. 12
316-320.
Filippova, G.N., Fagerlie, S., Klenovd,8., Myers, C., Dehner, Y., Goodwin, G.H., Neiman,
264
References
P.E., Collins, S., and Lobanenkov, v.v. (1996). An exceptionally conservedtranscriptional repressor, CTCF, employs different combinations of zinc fingers to binddiverged promoter sequences of avian and mammalian c-myc oncogenes. Mot. Cett Biol.16:2802-2813.
Filippova, G.N., Lindblom, 4., Meincke, L.J., Klenova, E.M., Neiman, p.E., Collins, S.J.,Doggett, N.4., and Lobanenkov, V.V. (1998). A widely expressed transcription factorwith multiple DNA sequence specificity, CTCF, is localised at chromosome segment16q22.1 within one of the smallest regions of overlap for common deletions in breast andprostate cancers. Genes Chrom. Cancer 22.26-36.
Flint, J., Thomas, K., Mickleffi, G., Raynham, H., Clark, K., Doggett, N.4., Kng, 4., andHiggs, D.R. (1997) The relationship between chromosome structure and function at ahuman telomeric region. Nature Genet. 15.252-257.
Florijn, R.J., Blonden, L.A.J., Vrolijk, J., Wiegant, I., Yaandrager, J.W., Baas, F., DenDunnen, J.T., Tanke, H.J., Van Ommen, G.J.B., and Raap, A.K. (1995). High resolutionDNA FiberFISH genomic DNA mapping and colour barcoding of large genes. Hum. Mol.Genet. 4: 831-836.
Foote, S., Vollrath, D., Hilton, 4., and Page, D.C. (1992). The human Y chromosome:overlapping DNA clones spanning the euchromatic region. Science 258. 6O-66.
Friedman, L.S., Osterneyer, E.4., Szabo, C.I., Dowd, P., Lynch, E.D., Rowell, S.E., andKi.tg, M-C. (1994) Confirmation of BRCAI by anaþsis of germline mutations linked tobreast and ovarian cancer in ten families. Nature Genet. 8:399-404.
Friend, S.H., Bernards, R., Rogelj, S., Weinberg, R.4., Rapaport, J.M., Albert, D.M., andDryja, T.P. (1986). A human DNA segment with properties of the gene that predisposes
to retinoblastoma and osteosarcoma. Nature 323. 643-646.
Fukushima, ,A.., Okub4 K., Sugino, H., Ilori, N., Matobâ, R., Niiyama, T., Murakawa, K.,Yoshii, J., Yokoyama, M., and Matsubara, K. (1994). Chromosomal assignment ofHepG2 3'-directed partial cDNA sequences by Southern blot hybridisation usingmonochromosomal hybrid cell panels. Genomics 22. 127-136.
Futreal, P.4., Liu, Q., Shattuck-Eidens, D., Cochran, C., Harshman, K., et al. (1994). BRCAImutations in primary breast and ovarian carcinomas. Science 266. l2O-I22.
Gahl, W.4., Schneider,J.A., and Aula, P.P. (1995). Lysosomal transport disorders: cystinosisand sialic acid storage disorders. In The Metabolic and Moleculqr Basis of InheritedDisease. (eds Scriver, C.R. Beaudet, 4.L., Sly, W.S., and Valle, D.) 3763-3797(McGraw-Hill, New York, 1995).
Gecz, J., Bielby, S., Sutherland, G.R., and Mulley.I.C. (1997). Gene structure and subcellularlocalisation of FMR2, a member of a new gene family of putative transcription activators.Genomics 44.207-213.
Gecz, J., Villard, L., Lossi, 4.M., Millasseau, P., Djabali, M., and Fontes, M. (1993). Physicaland transcriptional mapping of DXS56-PGKI 1 Mb region: identification of three new
265

Reþrences
transcripts. Hum. Mol. Genet. 2: 7389-1396
Gemmill, R.M., Chumakov, I., Scott, P., Waggoner, 8., Rigault, p., Cypser, J., Chen, e.,Weissenbach, J., Gardiner, K., Wang, H., Pekarsky, Y., Le Gall, I., Le paslier, D.,Guillou, S., Li, E., Robinson, L., Hahner, L., Todd, S., Cohen, D., and Drabkin, H.A.(1995). A second-generation YAC contig map of human chromosome 3. Nqture 377Suppl: 299-319.
Geraghty, M.T., Brody, L.C., Martin, L.S., Marble, M., Kearns, W., pearson, p., Monaco,4.P., Lehrach, H., and Valle, D (1993). The isolation of cDNAs from OATLI atXqll.2using a 480 kb YAC. Genomics 16: 440-446.
Giles, R.H., Petrij, F., Dauwerse, H.G., den Hollander, 4.I., Lushnikova,T., van Ommen, G-J.8., Goodman, R.H., Deaven, L.L., Doggett, N.4., Peters, D.J.M., and Breuning, M.H.(1997). Construction of a I 2-Mb contig surrounding, and molecular analysis of, thehuman CREB-binding protein (CBP/CREBBP) gene on chromosome 16p13.3. Genomics42:96-714.
Glavac, D., and Dean, M. (1993). Optimisation of the single-strand conformationpolymorphism (SSCP) technique for detection of point mutations. Hum. Mut.2. 404-474.
Godfrey, T.E., Cher, M.L., Chhabra, V., and Jensen, RH (1997). Allelic imbalance mappingof chromosome 16 shows two regions of common deletion in prostate adenocarcinoma.Cancer Genet. Cytogenet. 98: 36-42.
Goldstein, L.S.B. (1993). With apologies to scheherazade: tails of l00l kinesin motors. Annu.Rev. Genet. 27 : 319-351.
Goss, S.J., and Harris, H. (1975). New method for mapping genes in human chromosomesNature 255: 680-684.
Groden, J., Thliveris,4., Samowitz, W., Carlson, M., Gelbert,L., et al. (1991) Identificationand characterisation of the familial adenomatous polyposis coli gene. Cell66: 589-600.
Grodzicker, T., \ /illiams, J., Sharp, P., and Sambrooþ J. (1974). Physical mapping oftemperature-sensitive mutations of adenoviruses. Cold Spring Harbor Symp Quant. Biol.39:439-446.
Grunstein, M., and Hogness, D.S. (1975). Colony hybridisation: a method for the isolation ofcloned DNAs that contain a specific gene. Proc. Natl. Acad. Sci. USA 72'.3961-3965.
Gullick, W.J., Love, S.8., Wright, C., Barnes, D.M., Gusterson, 8., Harris, 4.L., and Altman,D.G. (1991). C-erbB-2 protein overexpression in breast cancer is a risk factor in patientswith involved and uninvolved lymph nodes. Br. J. Cancer 63 434-438.
Gusella, J.F., Wexler, N.S., Conneaþ, P.M., Naylor, S.L., Anderson, M.4., Tanzi, R.E.,'Watkins, P.C., Ottina, K., Wallace, M.R., Sakaguchi, 4.Y., Young, 4.8., Shoulson, L,Bonilla, E., and Martin, J.B. (1983). A polymorphic DNA marker genetically linked toHuntington's disease. Nqture 306. 234-238.
266
References
Gyapy, G., Morisette,J.,Dib, C., Fizames, C., Millasseau, P., Marc, S., Bernardi, G., Lathrop,M., and Weissenbach, J. (1994). The 1993-4 Genethon human genetic linkage map.Nature Genet. 7 : 246-339.
Gyapy, G., Schmitt,K.,Fizames, C., Jones, H., Vega-CzaÍny, N., Spillett, D., Muselet, D.,Prud'Homme, J-F., Dib, C., Auffrey, C., Morissette, J., Weissenbach, L, and Goodfellow,P.N. (1996). A radiation hybrid map of the human genome. Hum. Mol. Genet. 5.339-346.
Hall, J.M., Lee, M.K., Newman, 8., Morrow,J.E., Anderson, L.4., Huey, 8., and King, M-C.(1990). Linkage of early-onset familial breast cancer to chromosome l7q2l. Science 250:1 684-1689
Hansen, R., and Oren, M. (1997). p53; from inductive signal to cellular effect. Curr. Opin.Genet. Devel. 7. 46-51.
Harshman, K., Bell, R., Rosenthal, J., Katcher, H., Miki, Y., et ø1. (1995). Comparison of thepositional cloning methods used to isolate the BRCAI gene. Hum. Mol. Genet. 4. 1259-1266.
Hawkins, J.D. (1988). A survey on intron and exon lengths. Nucleic Acids Res. 16. 9893-9908.
Hayashi, K. (1992). PCR-SSCP: a method for detection of mutations. GATA 9. 73-79
Heng, H.H.Q., Squire, J., and Tsui, L.C. (1992). High resolution mapping of mammalian genes
by in situ hybridisation to free chromatin. Proc. Nstl. Acad. Sci. USA 89: 9509-9513.
Herman, J.G.,Latif, F., Weng, Y., Lerman, M.I., Zbar,B., Liu, S., Samid, D., Duan, D-S.R.,Gnarra, J.R., Linehan, 'W.M., and Baylin, S.B. (1994). Silencing of the VHL tumour-suppressor gene by DNA methylation in renal carcinoma. Proc. Natl. Acad. Sci. USA 91.9700-9704.
Hillier, L., Lennon, G., Becker, M., Fatima Bonaldo, M., Chiapelli, 8., et ql. (1996).Generation and analysis of 280,000 human expressed sequence tags. Genome Res. 6'. 807-828.
Hiraguri, S., Godfrey, T., NakamuÍa, H., Grafl J., Collins, C., Shayesteh, L., Doggett, N.,Johnson, K., Wheelock, M., Herman, J., Baylin, S., Pinkel, D., and &uy, J. (1998).Mechanisms of inactivation of E-cadherin in breast cancer cell lines. Cancer Res. 58:1972-1977.
Flisama, F.M., Oshima, 1., Yu, C-8., Fu, Y-H., Mulligan, L, Weissman, S.M., and
Schellenberg, G.D. (1998). Comparison of methods for identifying transcription units and
transcription map of the Werner syndrome gene region. Genomics 52. 352-357 .
Horowitz, J.M., Yandell, D.W., Park, S.H., Canning, S., Whyte, P., Buchkovich, K., Harlow,E., Weinberg, R.A., and Dryja, T.P. (1989). Point mutational inactivation of theretinoblastoma antioncogene. Science 243. 937 -940.
Houlgatte, R., Mariage-Samson, R., Dupart, S., Tessier, 4., Bentolila, S., Lamy, B., and
267

References
Auffray, C. (1995). The Genexpress Index: a resource for gene discovery and the genicmap of the human genome. Genome Res. 5: 272-304.
Hu, R.J., Lee, M.P., Connors, T.D., Johnson, L.A., Burn, T.C., Su, K., Landes, G.M., andFeinberg, A.P. (1997) A 2.5-Mb transcript map of a tumor-suppressing subchromosomaltransferable fragment from 11p15.5, and isolation and sequence analysis of three novelgenes. Genomics 46. 9-17 .
Hudson, T.J., Steir¡ L.D., Gerety, S.S., Ma, J., Castle, A.8., et al. (1995). An STS-based mapof the human genome. Science 270: 7945-1954.
Hunziker, W., and Geuze, H.J. (1996). Intracellular trafficking of lysosomal membraneproteins. BioEssays l8: 379-389.
Ianøano, L., D'Apolito, M., Centra, M., Savino, M., Levran, O., Auerbach, 4.D., Cleton-Jansen, A-M., Doggett, N.4., Pronk, J.C., Tipping, AJ., Gibson, R.4., Mathew, C.G.,Whitmore, S.4., Apostolou, S., Callen, D.F., Zelantê, L., and Savoia, A. (1997) Thegenomic organisation of the Fanconi anemia group A(FAA) gene. Genomics 4l'.309-314.
Ichikawq H., Hosoda, F., Arai, Y., Shimizut, K., Ohira, M., and Ohki, M. (1993). A Notlrestriction map of the entire long arm of human chromosome2l. Nature Genet. 4'.361-366.
Iida, 4., Isobe, R., Yoshimoto, M., Kasumi, F., Nakamuta, Y., and Emi, M. (1997).Localisation of a breast cancer tumour-suppressor gene to a 3-cM interval withinchromosomal region 16q22. Br. J. Cancer 75.264-267.
Ilyas, M., and Tomlinson, I.P. (1997). The interactions of APC, E-cadherin, and B-catenin intumour development and progression. J. Pathol. 182: 128-137 .
International Batten Disease Consortium. (1995). Isolation of a novel gene underlying Battendisease, CLN3. Cell82: 949-957.
Ioannou, P.4., Amemiya, C.T., Garnes, J., Kroisel, P.M., Shizuya, H., Chen, C.,Batzer, M.4.,and de Jong, P.J. (1994). A new bacteriophage Pl-derived vector for the propogation oflarge human DNA fragments. Nature Genet 6: 84-89.
Isola, J.J., Kallioniemi, O-P., Chu, L.W., Fuqua, S.A.'W., Hilsenbeck, S.G., Osborne, C.K., and
Waldman, F.M. (1995). Genetic aberrations detected by comparative genomichybridisation predict outcome in node-negative breast cancer. Am. J. Pathol 147. 905-911.
Iyer, V.R., Eisen, M.8., Ross, D.T., Schuler, G., Moore, T., Lee, J.C.F., Trent, J.M., Staudt,L.M., Hudson lr, L, Boguski, M.S., Lashkari, D., Shalon, D., Botstein, D., and Brown,P.O. (1999). The transcriptional program in the response of human fibroblasts to serum.
Science 283:83-87.
James, M.R., Richard III, C.\ry., Schott, J-J., Yousry C., Clark, K., Bell, J., Terwilliger,J.D.,Hazan,J.,Dubay, C., Vignal, A., Agrapart. M., Imai, T., Nakamuta",Y., Polymeropoulos,M., Weissenbach, J., Cox, D.R., and Lathrop, G.M. (1994). A radiation hybrid map of 506
268
References
STS markers spanning human chromosome 11. Nqture Genet. 8:70-76
Jean, G., Fuchshuber, 4., Town, M.M., Gribouval, O., Schneider, J.4., Broyeq M., van,tHofl W., Niaudet, P., and Antignac, C. (1996). High-resolution mapping of the gene forcystinosis, using combined biochemical and linkage analysis. Am. J. Hum. Genet.58: 535-s43.
Jeffreys, J.J., Wilsofl, V., and Thein, S.L. (1935). Hypervariable "minisatellite" regions inhuman DNA. Nature 314 67 -73.
Joenje, H., Oostra, 4.B., Wijker, M., Di Summa, F., Van Berker, C., Ebell, W., Van Weel, M.,Pronk, J.C., Buchwald, M., and Arwert,F. (1997). Evidence for at least eight Fanconianemia genes. Am. J. Hum. Genet. 6l:940-944.
Jones, K.W., Chevrette, M., Shapero, M.H., and Fournier, R.E.K. (1992). Generation ofregion- and species-specific expressed gene probes from somatic cell hybrids. NatureGenet. l: 278-283.
Jones, P.A. (1996). DNA methylation errors and cancer. Cancer Aes. 56. 2463-2467
Jordanova, 4., Kalaydjieva, L., Savov, 4., Claustres, M., Schwarz, M., Estivill, X.,Angelichev&,D., Haworth, 4., Casals, T., and Kremensþ,I. (1997). SSCP analysis: ablind sensitMty trial. Hum. Mut. lO'. 65-70.
Kahloun, 4.E., Chauvel, B., Mauvieux, V., Dorval, I., Jouanolle, A-M., Gicquel, I., le Gall, J-Y., and David, V. (1993). Localisation of seven new genes around the HLA-A locus.Hum. Mol. Genet.2: 55-60.
Kallioniemi,4., Kallioniemi, O-P., PipeÍ,J.,TanÍrer, M., Stokke, T., Chen, L., Smith, H.S.,Pinkel, D., Gray, J.W., and Waldman, F.M. (1994). Detection and mapping of amplifiedDNA sequences in breast cancer by comparative genomic hybridisation technique. Proc.Natl. Acod. Sci. USA9I:2156-2760.
Kallioniemi, 4., Kallioniemi, O-P., Sudar, D., Rutovitz, D., Ct ay, J.W., Waldman, F., andPinkel, D. (1992). Comparative genomic hybridisation for molecular cytogenetic analysisof solid tumours. Science 258: 818-821.
Kan, Y., andDozy, A. (1978). Antenatal diagnosis of sickle-cell anaemia by DNA analysis ofamniotic-fluid cells. Lancet 2. 9lO-972.
Kashiwaba, M., Tamura, G., Suzuki, Y., Maesawa, C., Ogasawara, S., Sakata, K., andSatodate, R. (1995). Epithelial-cadherin gene is not mutated in ductal carcinomas of thebreast. Jpn. J. Cancer Res86: 1054-1059.
Kaul, R., Balamurugaî, K., Gao, G.P., and Matalon, R. (1994). Canavan disease: genomicorganisation and localisation of human ASPA to 77p13-ter and conservation of the ASPAgene during evolution. Genomics 2l:364-370.
Kerangueven, F., Essioux, L., Dib, 4., Noguch, T., Allione, F., Geneix, J., Longy, M.,Lidereau, R., Eisinger, F., Pebusque, M.J., Jacquemier, J., Bonaiti-Pellie, C., Sobol, H.,
269
Re.ferences
and Birnbauffi, D. (1995). Loss of heterozygosity and linkage analysis in breast carcinoma:indication for a putative third susceptibility gene on the short arm of chromosome 8.Oncogene 10. 1023-1026.
Khan, A.S., rWilcox, 4.S., Polymeropoulos, M.H., Hopkins, J.4., Stevens, T.J., Robinson, M.,Orpana, 4.K., and Sikela, J.M. (1992). Single pass sequencing and physical and geneticmapping of human brain cDNAs. Nature Genet.2: 180-185.
Kim, IJ-J., Shizuyq H., Kang, H-L., Choi, S-S., Garrett, C.L., Smink, L.J., Birren, B.W.,Korenberg, J.R., Dunham, I., and Simon, M.I. (1996). A bacterial artlficial chromosome-based framework contig map of human chromosome 22q. Proc. Nøtl. Acad. Sci. USA. 93:6297-6307.
King, C.R., Schimke, R.N., Arthur, T., Davorefl, 8., and Collins, D. (1986). Proximal 3pdeletion in renal cell carcinoma cells from a patient with von Hippel-Lindau disease.
Cancer Genet. Cytogenet. 27 : 3 45-348.
I(inzler, K.W., and Vogelstein, B. (1997). Gatekeepers and caretakers. Nature 386. 767-763
Klenova, E.M., Nicolas, R.H., Paterson, H.F., Carne, 4.F., Heath, C.M., Goodwin, G.H.,Neiman, P.E., and Lobanenkov, V.V. (1993). CTCF, a conserved nuclear factor requiredfor optimal transcriptional activity of the chicken c-myc gene, is an ll-Zn-frnger proteindifferentially expressed in multiple forms. MoL Cell Biol. 13.7612-7624.
Knudson, A.G. (1971). Mutation and cancer: statistical study of retinoblastoma. Proc. Natl.Acad. ^Scl. 68: 820-823.
Kogan, S.C., Doherty, 8.S., and Gitsher, J. (1987). An improved method for prenataldiagnosis of genetic diseases by analysis of amplified DNA sequences. N. Eng. J. Med.317: 985-990.
Kohara, Y., Akiyama, K., and Isono, K. (1987). The physical map of the whole E. colichromosome: application of a new strategy for rapid analysis and sorting of a largegenomic library. Cell SO.495-508.
Koi, M., Johnson, L.4., Kalikin, L.M., Little, P.F.R., Nakamura, Y., and Feinberg, A.P.(1993). Tumour cell growth arrest caused by subchromosomal transferable DNAfragments from human chromosome ll. Science 260.361-364.
Koi, M., Shimizu, M., Morita, H., Yamada, H., and Oshimura, M. (1989). Construction ofmouse A9 clones containing a single human chromosomefagged with neomycin-resistancegene via microcell fusion. Jpn. J. Cancer Aes. 80: 413-418
Korn, 8., Sedlacek, 2., Manca, 4., Kioschis, P., Konecki, D., Lehrach, H., and Poustka, A.(1992). A strategy for the selection of transcribed sequences in the Xq28 region. Hum.Mol. Genet.l:235-242.
Kozman, H.M., Phillips, H.4., Callen, D.F., Sutherland, G.R., and Mulley, J.C. (1993).Integration of the cytogenetic and genetic linkage maps of human chromosome 16 using50 physical intervals and 50 polymorphic loci. Cytogenet. Cell Genet. 62: 794-198.
270
References
Krauter, K., Montgomery, K., Yoon, S-J., LeBlanc-Straceski, J., Renault, 8., et al. (1995). Asecond-generation YAC contig map of human chromosome 12. Noture 377 Suppl: 321-JJJ.
Kremmidiotis, G., Baker, E., Crawford,J., Eyre, H.J., Nahmias, J., and Callen, DF. (1993).Localisation of human cadherin genes to chromosome regions exhibiting cancer-relatedloss of heterozygosity. Genomics 49'. 467-471.
Krizman, D.8., and Berget, S.M. (1993). Efücient selection of 3'-terminal exons fromvertebrate DNA. Nucleic Acids Res.2l: 5198-5202.
Kruglyak, L. (1997). The use of a genetic map of biallelic markers in linkage studies. NatureGenet. 17.21-24.
Kull, F.J., Sablin, E.P., Lau, R., Fletterick, R.J., and Vale, R.D. (1996). Crystal structure ofthekinesin motor domain reveals a structural similarity to myosin. Nature 380: 550-555.
Kulp, D., Haussler, D., Reese, M.G., and Eeckman, F.H. (1996). A generalised hidden Markovmodel for the recognition of human genes in DNA. In Proc. Fourth InternationalConference on Intelligent Systems for Molecular Biolog,t, pp. 734-142.
Kumar, S. (1995). ICEJike proteases in apoptosis. Trends Biochem. Sci.20: 198-202
Lagoda,PJ.L., Trent, J.M., and Meese, E.U. (1994). Chromosome specific cDNA libraries:reduction of unspecific priming events by purification of heteronuclear RNA. Mol. Biol.Reports 19:89-92.
Lammie, G.4., and Peters, G. (1991). Chromosome 11q13 abnormalities in human cancerCancer Cells 3: 413-420.
Landegent,J.E., Jansen in de Wal, N., Ommen, G.J.B., Baas, F., De Vijlder, J.J.M., Van Duijn,P., and Van der Ploeg, M. (1985). Chromosomal localisation of a unique gene by non-autoradiographic in situ hybridisation. Nature 317. 175-177.
Lanfrancone, L., Pelicci, G., and Pelicci, P.G. (1994). Cancer genetics. Curr. Opin. Genet.
Devel.4: lO9-119.
Larsen, F., Gundersen, G., Lopez, R., and Prydz,H. (1992). CpG islands as gene markers inthe human genome. Genomics 13: 1095-1107.
Lasko, D., Cavenee, '\{'., and Nordenskjold, M. (1991). Loss of constitutional heterozygosityin human cancer. Annu. Rev. Genet.25 28I-374.
Latil, A.., Cussenot, O., Fournier, G., Driouch, K., and Lidereau, R. (1997). Loss ofheterozygosity at chromosome l6q in prostate adenocarcinoma: identification of threeindependent regions. Cancer Res. 57 . 1058-1062.
Lennon, G., Auffray, C., Polyeropoulos, M., and Soares, M.B. (1996). The I.M.A G.E.consortium: an infegrated molecular analysis of genomes and their expression. Genomics33 757-152.
277
References
Leppert, M., Dobbs, M., Scambler, P., O'Connell, P., Nakamuta",Y., Stauffer, D., Woodward,S., Burt, R., Hughes, J., Gardner,E.,Latlrop, M., Wasmuth, J., Lalouel, J-M., and White,R (1987). The gene for familial poþosis coli maps to the long arm of chromosome 5.
Science 238. 7471-1475 .
Levran, O., Erlich, T., Magdalena, N., Gregory, J.J., Batisl¡ S.D., Verlander, P.C., andAuerbach, A.D. (1997). Sequence variation in the Fanconi anaemia gene FAA. Proc. Natl.Acqd. Sci. USA 94. 73051-13056.
Li, S., Maclachlan, T.K., De luca, 4., Claudio, P.P., Condorelli, G., and Giordano, A. (1995).The cdc2-related kinase, PTSSLRE, is essential for cell growth and acts in G2 phase of thecell cycle. Cancer Res. 55: 3992-3995.
Liaw, D., Marsh, D.J., Li, J., Dahia, P.L., Wang, S.I., Zheng,2., Bose, S., Call, K.M., Tsou,H.C., Peacocke, M., Eng, C., andParsons, R. (1997). Germline mutations of the PTENgene in Cowden disease, an inherited breast and thyroid cancer syndrome. Nature Genet.
16:64-66.
Lih, C-J., Cohen, S.N., 'Wang, C., and Lin-Chao, S. (1996). The platelet-derived growth factor
cr-receptor is encoded by a growth-arrest-specific (g'as) gene. Proc. Natl. Acod. Sci. USA
93 4677-4622.
Litt, M., and Luty, J.A. (1989). A hypervariable microsatellite revealed by in vitroamplification of a dinucleotide repeat within the cardiac muscle actin gene. Am. J. Hum.Genet. 44'.397-407.
Liu, N., Lamerdin, J.E., Tucker, JD.,Zhou,Z.Q., Walter, C.4., Albala, J.S., Busch, D.8., and
Thompson, L.H. (1997). The human XRCC9 gene coffects chromosomal instability and
mutagen sensitivities in CHO UV40 cells. Proc. Natl. Acod. Sci. USA 94. 9232-9237.
Liu, P., Legerski, R., and Siciliano, M.J. (1989). Isolation of human transcribed sequences
from human-rodent somatic cell hybrids . Science 246. 813-815.
Livak, K.J., Marmaro, 1., and Todd, J.A. (1995). Towards fully automated genome-widepolymorphism screenin g. Nøture Genet. 9 : 3 4l -3 42.
Lo Ten Foe, J., Rooimans, 4.A., Bosnoyan-Collins, L., Alon, N., Wijker, M., Parket, L.,Lightfoot, J., Carreau, M., Caller\ D.F., Savoia, 4., Cheng, N.C., van Berkel, C.G.M.,Strunk, M.H.P., Gille, J.J.P., Pals, G., Kruyt, F.A.E., Pronk, J.C., Arweft, F., Buchwald,M., and Joenje, H. (1996). Expression cloning of a oDNA for the major Fanconi anemiagene, FAA. Nature Genet. 14 320-323.
Longhurst, P.4., Schwegel, T., Folander, K., and Swanson, R. (1996). The human P2x1
receptor: molecular cloning, tissue distribution, and localisation to chromosome 17 .
Biochim. Biophys. Acta. l3O8: 1 85-1 88.
Longmire, J.L., Brown, N.C., Meincke, L.J., Campbell, M.L., Albright, K.L., Fawcett, J.I.,Campbell, 8.W., Moyzis, R.K., Hildebrand, C.8., Evans, G.4., and Deaven,L.L. (1993).Construction and characterisation of partial digest DNA libraries made from flow-sortedhuman chromosome 16. GATA lO. 69-76.
272

References
Lovett, M., Kere, J., and Hinton, L.M. (1991). Direct selection: a method for the isolation ofcDNAs encoded by large genomic regions. Proc. Nqtl. Acqd. Sci. USA 88:9628-9632.
Maatta,4., Bornstein, P., and Penttinen, R.P.K. (1991). Highly conserved sequences in the 3'-untranslated region of the COLIAI gene bind cell-specific nuclear proteins. FEBS 279 9-13.
Malkin, D., Li, F.P., Strong, L.C., Fraumeni Jr, J.F., Nelson, C.E., Kim, D.H., Kassel, J.,Gryka, M.A., Bischoff, F.Z.,Tainsky, M.4., and Friend, S.H. (1990). Germ line p53mutations in a familial syndrome of breast cancer, sarcomas, and other neoplasms. Science250:1233-1238
Manfioletti, G., Brancolini, C., Avanzi, G., and Schneider, C. (1993). The protein encoded bya growth arrest-specific gene (gas6) is a new member of the vitamin K-dependant proteinsrelated to protein S, a negative coregulator in the blood coagulation cascade. MoL Cell.Biol. 13. 4976-4985.
Manfioletti, G., Ruaro, M.E., Del Sal, G., Philipsoî,L., and Schneider, C. (1990). A growtharrest-speclfrc (gas) gene codes for a membrane protein. Mol. Cell. Biol. lO 2924-2930.
Maniatis, T., Hardison, R., Lacy 8., Lauer, J., O'Connell, C., Quon, D., Sim, G.K., andEßtratiadis, A. (1978). The isolation of structural genes from libraries of eucaryotic DNA.Cell15. 687-701.
Mansouri, M., Spurr, N., Goodfellow, P.N., and Kemler, R. (1988). Characterisation and
chromosomal localisation of the gene encoding the human cell adhesion moleculeuvomorulin . Dffirentiation 38. 67 -77.
Marra", M.4,, Kucaba, T.4., Dietrich, N.L., Green, E.D., Brownstein, B., Wilson, R.K.,McDonald, K.M., Hillier, L.W., McPherson, J.D., and'Waterston, R.H. (1997). Highthroughput fingerprint analysis of large-insert clones. Genome Res 7'. 1072-1084.
Matise, T.C., Perlin, M., and Chakravarti, A. (1994). Automated construction of genetic
linkage maps using an expert system (MultiMap): a human genome linkage map. NatureGenet. 6.384-390.
Maw, M.4., Grundy, P.E., Millow,LJ., Eccles, M.R., Dunn, R.S., Smith,P.J., Feinberg,4.P.,Law, D.J., Paterson, M.C., Telzerow, P.E., Callen, D.F., Thompson, 4.D., Richards, R.I.,and Reeve, A.E. (1992). A third Wilms' tumour locus on chromosome 16q. Cqncer Res.
52.3094-3098.
McCormick, M.K., Campbell, E., Deaveî, L., and Moyzis, R.K. (1993). Low-frequencychimaeric yeast artificial chromosome libraries from flow-sorted human chromosome 16
and2l. Proc. Natl. Acad. Sci. USA 90: 1063-1067.
McDowell, G., Isogai, T., Tanigemi, A., Hazelwood, S., Ledbetter, D., Polymeropoulos,M.H., Lichter-Konecki, IJ., Konecki, D., Town, M.M., van't hofl W., Weissenbach, J.,
and Gahl, V/.4. (1996). Fine mapping of the cystinosis gene using an integrated genetic
and physical map of a region within human chromosome band 17p13. Biochem. Mol. Med.58: 135-141.
273
References
McDowell, G., Town, M.M., van't Hofl W., and Gahl, W.A. (1997). Clinical and molecularaspects of nephropathic cystinosis. -/. MoL Med.76.295-302.
Miki, Y., Katagin, T., Kasumi, F., Yoshimoto, T., and Nakamura, Y. (1996). Mutationanalysis in the BRCA2 gene in primary breast cancers. Nature Genet. 13.245-247.
Miki, Y., Swensen, J., Shattuck-Eidens, D., Futreal, P.4., Harshman, K., et al (1994). Astrong candidate for the breast and ovarian cancer susceptibility gene BRCAI . Science266:66-71.
Milanesi, L., Kolchanov, N., Rogozin, I., Kel, 4., and Titov, I. (1993). Sequence functionalinference. In Bishop, M.J. (ed.) Guide to Human Genome Computing. Academic Press,
Cambridge, IlK, pp. 249-372.
Mitelman, F., Mertens, F., and Johansson, B. (1997). A breaþoint map of recurrentchromosom al rearrangements in human neoplasia. Nature Gene t. 15: 417 -47 4.
Moerland, E., Breuning, M.H., Cornelisse, C.J., and Cleton-Jansen, A-M. (1997). Exclusion ofBBC1 and CMAR as candidate breast tumour-suppressor genes. Br. J. Cancer 76' l55O-1553.
Mollenhauer,I., Wiemann, S., Scheurlen,'W., Korn,8., Hayashi, Y., \Milgenbus, K.K., vonDeimling,4., and Poustka, A. (1997). DMBTI, a new member of the SRCR superPamily,
on chromosome 10q25.3-26.1 is deleted in malignant brain tumours. Nature Genet. 17.32-39.
Monaco, 4.P., Neve, R.L., Colletti-Feener, C., Bertelson, C.J., Kurnit, D.M., and Kunkel,L.M. (1986). Isolation of candidate cDNAs for portions of the Duchenne musculardystrophy gene. Nature 323 646-650.
Moyzis, R.K., Torney, D.C., Meyne, J., Buckingham, J.M., Wu, J.R., Burks, C., Sirotkin,K.M., and Goad, W.B. (1989). The distribution of interspersed repetitive DNA sequences
in the human genome. Genomics 4.273-289.
Muleris, M., Almeida, A., Gerbault-Seureau, M., Malfoy, 8., and Dutrillaux, B. (1994).
Detection of DNA amplification in 17 primary breast carcinomas with homogeneouslystaining regions by a modified comparative genomic hybridisation technique. Genes
Chrom. Cancer 10: 160-170.
Mulley, J.C., and Sutherland, G.R. (1993). Integrating maps of chromosome 16. Curu. Opin.
Genet. Dev.3: 425-431.
Murakawa, K., Matsubara, K., Fukushima, 4., Yoshii, J., and Okubo, K. (1994).
Chromosomal assignment of 3'-directed partial oDNA sequences representing novel genes
expressed in granulocytoid cells. Genomics 23:379-389.
Murray, J.C., Buetow, K.H., Weber, J.L., Ludwigsen, S., Scherpbier-Heddema, T., et ql.
(1994). A comprehensive human linkage map with centimorgan density. Science 265.2049-2054.
274
References
Mushegian, 4.R., Bassett, D.E. Jr., Boguski, M.S., Bork, P., and Koonin, E.V. (1997).Positionally cloned human disease genes: patterns of evolutionary conservation andfunctional motifs. Proc. Natl. Acod. Sci. USA 94: 5831-5836.
Mushegiar¡ 4.R., Garey, J.R., Martin, J., and Liu, L.X. (1998). Large-scale taxonomicprofiling of eukaryotic model organisms: a comparison of orthologous proteins encodedby the human, fly, nematode, and yeast genomes. Genome Res.8: 590-598.
Myers, J.C., Dickson, L.4., De Wet, W.J., Bernard, M.P., Chu, M-L., Di Liberto, M., pepe,
G., Sangiorgi, F.O., and Ramirez,F. (1933). Analysis of the 3'end of the human pro-alpha 2 (I) collagen gene. Utilisation of multiple polyadenylation sites in culturedfibroblasts. J. Biol. Chem.258: 10128-10135.
NIFVCEPH Collaborative Mapping Group. (1992). A comprehensive genetic linkage map ofthe human genome. Scìence 258: 67-86.
Negrini, M., Castagnoli, ,{., Sabbioni, S., Recanatini, E., Giovannini, G., Possati, L.,Stanbridge, 8.J., Nenci, I., and Barbanti-Brodano, G. (1992). Suppression oftumourigenesis by the breast cancer cell line MCF-7 following transfer of normal humanchromosome 77. Oncogene 7 : 2013-2078.
Nelson, D.L., Ledbetter, S.4., Corbo, L., Victoria, M.F., Ramirez-Solis, R., Webster, T.D.,Ledbetter, D.H., and Caskey, C.T. (1989). Alu polymerase chain reaction: a method forrapid isolation of human-specific sequences from complex DNA sources. Proc. Natl.Acod. Sci. USA.86 6686-6690.
Neuhausen, S., Gilewski, T., Norton, L., Tran, T., McGuire, P., Swensen, J., Hampel, H.,Borgen, P., Brown, K., Skolnick, M., Shattuck-Eidens, D., Jhanwar, S., Goldgar,D., andOffit, K. (1996). Recurrent BRCA2 6l74delT mutations in Ashkenazi Jewish womenaffected by breast cancer. Nqture Genet. 13. 126-128.
Nickerson, D.4., Kaiser, R., Lappin, S., Stewart, I., Hood, L., and Landegren, U. (1990)Automated DNA diagnostics using an ELISA-based oligonucleotide ligation assay. Proc.Notl. Acad. Sci. USA.87' 8923-8927.
ñelsen, K.V., Blichert-Toft, M., and Andersen, J. (1989). Chromosome anaþsis of in situbreast cancer. Acta Oncol.28' 979-922.
Ohashi, K., Nagata, K., Toshima, 1., Nakano, T., Arita, H., Tsuda, H., Suzuki, K., andMizuno, K. (1995). Stimulation of sþ receptor tyrosine kinase by the product of growtharrest-specific gene 6. J. Biol. Chem.27O.22687-22684.
Olson, M., Dutchik, J.E., Graham, M.Y., Brodeur, G.M., Helms, C., Frank, M., MacCollin,M., Scheinman, R., and Frank, T. (1986). Random-clone strategy for genomic restrictionmapping in yeast. Proc. Notl. Acad. Sci. USA 83. 7826-7830.
Olson, M., Hood, L., Cantor, C., and Botstein, D. (1989). A common language for physicalmapping of the human genome. Science 245. 1434-1435.
Onyango, P., Lubyovà,8., Gardellin, P., Kurzbauer, R., and Weith, A. (1998). Molecular
275

Reþrences
cloning and expression analysis of five novel genes in chromosome 1p36. Genomics 5O
187-198.
Orita, M., Suzuki, Y., Sekiyù,T., and Hayashi, K. (1989). Rapid and sensitive detection ofpoint mutations and DNA polymorphisms using the polymerase chain reaction. Genomics5:874-879.
Orkin, S.H. (1986). Reverse genetics and human disease. Cell47:845-350
Osborne, L.R., Martindale, D., Scherer, S.W., Shi, X-M., Huizenga, J., Heng, H.H.Q., Costa,T., Pober, B., Lew, L., Brinkman, I., Rommgns, J., Koop, 8., and Tsui, L-C. (1996).Identification of genes from a 500-kb region at 7qll.23 that is commonly deleted inWilliams syndrome patients. Genomics 36'. 328-336.
Pandis, N., Heim, S., Bardi, G., Idvall, I., Mandahl, N., and Mitelman, F. (1992). Whole-armt(l;16) and i(lq) as sole anomalies identify gain of 1q as a pnmary chromosomalabnormalþ in breast cancer. Genes Chrom. Cancer 5.235-238.
Parimoo, S., Patanjali, S.R., Shukla, H., Chaplin, D.D., and Weissman, S.M. (1991). oDNAselection: efficient PCR approach for the selection of cDNAs encoded in largechromosomal DNA fragments. Proc. Natl. Acod. Sci. USA 88.9623-9627.
Pavletich, N.P., Chambers, K.4., and Pabo, C.O. (1993). The DNA-binding domain of p53contains the 4 conserved regions and the major mutation hotspots. Genes Dev. 7: 2556-2564
Pellet, O.L., Smith, M.L., Greene, 4.4., and Schneider, J.A. (1988). Lack of complementationin somatic cell hybrids between fibroblasts from patients with different forms of cystinosis.Proc. Natl. Acad. Sci. USA 85: 3531-3534.
Peterson, 4., Patli, N., Robbins, C., Wang, L., Cox, D.R., and Myers, R.M. (1994). Atranscript map of the Down Syndrome critical region on chromosome 21 . Hum. Mol.Genet. 3: 7735-7742.
Phelan, C.M., Lancaster, J.M., Tonifl, P., Gumbs, C., Cochran, C., et al. (1996). Mutationanalysis of the BRCA2 gene in 49 site-specific breast cancer families. Nature Genet. 13120-122.
Phillips, K.K.,'Welch, D.R., Miele, M.E., Lee, J-H., Wei, L.L., and Weissman, B.E. (1996).Suppression of MDA-MB-435 breast carcinoma cell metastasis following the introductionof human chromosome 17. Cqncer Res. 56 1222-7227.
Pierceall, V/., Woodard, A., Morrow, J., Rimm, D., and Fearon, E. (1995). Frequent
alterations in E-cadherin and cr- and B-catenin expression in human breast cancer cell lines.
Oncogene ll. 1379-7326.
Polymeropoulos, M.H., Xao, H., Glodek, 4., Gorski, M., Adams, M.D., Moreno, R.F.,Fitzgerald, M.G., Venter, J.C., and Merril, C.R. (1992). Chromosomal assignmefi of 46brain cDNAs. Genomics 12: 492-496.
276
References
Polymeropoulos, M.H., Xao, H., Sikela, J.M., Adams, M.D., Venter, J.C., and Merril, C.R.(1993). Chromosomal distribution of 320 genes from a brain cDNA library. Nature Genet.4: 381-386.
Poustka, 4., Pohl, T.M., Barlow, D.P., Frischauf, A-M., and Lehrach, H. (1987). Constructionand use of human chromosome jumping libraries from l/ofl-digested DNA. Nature 325.353-355.
Pronk, J.C., Gibson, R.4., Savoia, 4., Wijker, M., Morgan, N.V., Melchionda, S., Ford, D.,Temtamy, S., Ortega, J.J. Jansen, S., Havenga, C., Cohn, R.J., de Ravel, T.J., Roberts, I.,Westerveld, 4., Easton, D.F., Joenje, H., Mathew, C.G., and Arwert, F. (1995).Localisation of the Fanconi anemia complementation group A gene to chromosome16q24.3. Nøture Genet. ll. 338-340.
Pullman, W.E., and Bodmer, W.F. (1992). Cloning and characterisation of a gene thatregulates cell adhesion. Nature 356. 529-532.
Quackenbush, J., Davies, C., Bailis, J.M., Khristich, J.V., Diggle, K., Marchuck, Y., Tobin, J.,
Clark, S.P., Rodkins, 4., Marcano, S., Churukian, A.C., Hutchinson, J.S., Probst, S.,
Romberg, L., Wei, Y.H., Nowak, N.J., Garner, H.R., Smith, M.W., Selleri, L., and Evans,
G.A. (1995). An STS content map of human chromosome l1: localisation of 910 YACclones and 109 islands. Genomics 29: 572-525.
Qui, M., and Byers, P.H. (1998). Constitutive skipping of alternatively spliced exon 10 intheATPTA gene abolishes Golgi localisation of the menkes protein and produces the occipitalhorn syndrome. Hum. Mol. Genet. T: 465-469.
Radford, D.M., Fair, K.L., Phillips, N.J., Ritter, J.H., Steinbrueck, T., Holt, M.S., and Donis-Keller, H. (1995). Allelotyping of ductal carcinoma in situ of the breast. deletion of loci on8p, 13q, I6q,l7p and77q. Cancer Res. 55: 3399-3405.
Rajan, J.V., Wang, M., Marquis, S.T., and Chodosh, L.A. (1996). Brca2 is coordinatelyregulated with BrcqL during proliferation and differentiation in manìmary epithelial cells.
Proc. NotL Acad. Sci. U5493.73078-13083.
Reed, K.C., and Mann, D.A. (1985). Rapid transfer of DNA from agarose to nylon
membranes. Nucl. Acids. Res. 13: 7207-7221.
Reed, P.W., Davies, J.L., Copeman,J.B., Bennett, S.T., Palmer, S.M., Pritchard, L.E., Gough,S.C., Kawaguchi, Y., Cordell, H.J., Balfour, K.M., Jenkins, S.C., Powell,8.8., Yigna|4., and Todd, J.A. (1994). Chromosome-specific microsatellite sets for fluorescence-
based semi-automated genome mapping. Nature Genet. 7. 390-395.
Reeders, S.T., Breuning, M.H., Davies, K.E., Nicholls, R.D., Jarman, A.P., Higgs, D.R.,Pearson, P.L., and Weatherall, D.J. (1985). A highly polymorphic DNA marker linked toadult polycystic kidney disease on chromosome 16. Nature 3ll. 542-544.
Renwick, J.H., and Schulze, J. (1965). Male and female recombination fraction of the nail-patella: ABO linkage in man. Ann. Hum. Genet.28:379-392.
277

References
Richards, R.I., Holman, K., Lane, S., Sutherland, G.R., and Callen, D.F. (1991) Humanchromosome 16 physical map: mapping of somatic cell hybrids using multiplex PCRdeletion analysis of sequencetagged sites. Genomics lO. 1047-1052.
Riethman, H.C., Moyzis, R.K., Meyne, L, Burke, D.T., and Olson, M.V. (1989). Cloninghuman telomeric DNA fragments into Saccharomyces cerevisiqe using a yeast-artificial-chromosome vector. Proc. Natl. Acad. Sci. USA 86 6240-6244.
Rockmill, B., Sym, M., Schertham, H., and Roeder, G.S. (1995). Role of two RecA homologsin promoting meiotic chromosome synapsis. Genes Dev.9:2684-2695.
Rommens, J.M., Iannuzzi, M.C., Kerem, B-S., Drumm, M.L., Melmer, G., Dean, M.,Rozmahel, R., Cole, J.L., Kennedy, D., Hidaka, N., Zsig4 M., Buchwald, M., Riordan,J.R., Tsui, L-P., and Collins, F S. (1989). Identification of the cystic fìbrosis gene:
chromosome walking and jumping. Science 245: 1059-1065.
Rommens, J.M., Lin, 8., Hutchinson, G.8., Andrew, S.E., Goldberg, Y.P., Glaves, M.L.,Graham, R., Lai, V., McArthur, J., Nasir, J., Theilmann,J., McDonald, H., Kalchman, M.,Clarke, L.4., Schappert, K., and Hayden, M.R. (1993). A transcription map of the regioncontaining the Huntington disease gene. Hum. Mol. Genet. 2:907-907.
Royle, N.J., Clarkson, R.E., Wong, 2., and Jeffreys, A.J. (1988). Clustering of hypervariableminisatellites in the proterminal region of human autosomes. Genomics 3'.352-360.
Ruddle, F.H. (1984). The William Allan memorial award address: reverse genetics and beyond.Am. J. Hum. Genet.36:944-953.
Russo, J., and Russo, I.H. (1991). Mammary tumorigenesis. Prog. Exp. Tumor Res. 33. 175-t9t.
Ryan, K.M., and Birnie, G.D. (1996). Myc oncogenes: the enigmatic family. Biochem. J. 314713-721.
Saar, K., Schindler, D., Wegner, R.D., Reis, 4., Wienker, T.F., Hoehn, H., Joenje, H.,Sperling, K., and Digweed, M. (1998). Localisation of a Fanconi anaemia gene tochromosome 9p. Eur. J. Hum. Genet.6: 501-508.
Saccone, S., Caccio, S., Kusuda, J., Andreozz\,L., and Bernardi, G. (1996). Identification ofthe gene-richest bands in human chromosomes. Gene 174. 85-94.
Saito, H.,Inazawa, J., Saito, S., Kasumi, F., Koi, S., Sagae, S., Kudo, R., Saito, J., Noda, K.,and Nakamura,Y. (1993). Detailed deletion mapping of chromosome l7q in ovarian and
breast cancers: 2-cM region on l7q2l.3 often and commonly deleted in tumours. CqncerrRes. 53: 3382-3385.
Sakai, K., NagahaÍa, H., Abe, K., and Obata, H. (1992). Loss of heterozygosity onchromosome 16 in hepatocellular carcinoma. J. Gastr. Hepat. T:288-292.
Sakai, T., Toguchida, 1., Ohtani, N., Yandell, D.W., Rapaport, J.M., and Dryja, T.P. (1991).Allele specific hypermethylation of the retinoblastoma tumour-suppressor gene. Am. J.
278

References
Hum. Genet.48: 880-888
Sambrook, J., Fritsch, E.F., and Maniatis, T. (1989). Molecular cloning: a laboratory manual.Second Edition. Cold Spring Harbour Laboratory Press, New York.
Sasaki, M., Okamoto, M., Sato, C., Sugio, K., Soejima, J., Iwama, T., Ikeuchi, T., Tonomur4A., Miyaki, M., and Sasazuki, T. (1989). Loss of constitutional heterozygosity incolorectal tumours from patients with familial polyposis coli and those with nonpolyposiscolorectal carcinoma. Cancer Res. 49. 4402-4406.
Sato, T., Akiyamq F., Sakamoto, G., Kasumi, F., and Nakamura, Y. (1991a). Accumulationof genetic alterations and progression of primary breast cancer. Cancer Res. 51: 5794-5799.
Sato, T., Saito, H., Morita, R., Koi, S., Lee, J.H., and Nakamura, Y. (1991ó). Allelotype ofhuman ovarian cancer. Cancer -¿Res. 51: 5178-5122.
Saurin, 4.J., Borden, K.L.B., Boddy, M.N., and Freemont, P.S. (1996). Does this have afamiliar RING? Trends Biochem. 21. 208-214.
Savov, 4., Angelicheva, D., Jordanova, 4., Eigel, 4., and Kalaydjieva, L. (199Ð. Htghpercentage acrylamide gels improve resolution in SSCP analysis. Nucleic Acids Res. 2O
6747-6742.
Schena, M., Shalon, D., Davis, R.W., and Brown, P.O. (1995). Quantitative monitoring ofgene expression patterns with a complementary DNA microarray. Science 27O'. 467-470.
Schmitt, FI., Kim, U.J., Slepak, T., Blin, N., Simon, M.I., and Shizuya, H. (1996). Frameworkfor a physical map of the human 22q13 region using bacterial artificial chromosomes(BACs) Genomics 33: 9-20.
Schneider, C., King, R.M., and Philipson, L. (1988). Genes specifìcally expressed at growtharrest of mammalian cells. Cell54'.787-793.
Schuler, G.D., Boguski, M.S., Stewart, E.4., Stein,L.D., Gyapy, G., et al. (1996). A gene
map of the human genome. Science 274. 540-546.
Schwartz, D.C., and Cantor, C.R. (1984). Separation of yeast chromosome-sized DNAs bypulsed field gradient gel electrophoresis. Cell37. 67-75.
Scott, I.C., Halila, R., Jenkins, J.M., Mehan, S., Apostolou, S., Winqvist, R., Callen, D.F.,Prockop, D.J., Peltonen, L., and Kadler, K.E. (1996). Molecular cloning, expression and
chromosomal localisation of a human gene encoding a 33 kDa putative metallopeptidase(PRSMI). Gene 174. t35-143.
Scully, R., Chen, J., Plug, 4., Xao, Y., Weaver, D., Feunteun, J., Ashley, T., and Livingston,D.M. (1997). Association of BRCAI with Rad5l in mitotic cells. Cell88:265-275.
Sealy, P.G., Whittaker, P.4., and Southern, E.M. (1985). Removal of repeated sequences fromhybridisation probes. Nucl. Acids R¿s. 13: 1905-7922.
279
ReÍerences
Seizinger,8.R., Rouleau, G.A., Ozelius, L.J.,Lane,4.H., Farmer, G.8., et ø/. (1988). VonHippel-Lindau disease maps to the region of chromosome 3 associated with renal cell
carcinoma. Nature 332. 268-269.
Serova, O.M., Mazoyer, S., Puget, N., Dubois, V., Tonin, P., Shugart, Y.Y., Goldgar, D.,Narod, S.4., Lynch, H.T., and Lenoir, G.M. (1997). Mutations in BRCAI and BRCA2 inbreast cancer families: are there more breast cancer-susceptibility genes? Am. J. Hum.
Genet. 6O 486-495.
Shapiro, M.8., and Senapathy, P. (1987). RNA splice junctions of different classes ofeukaryotes: sequence statistics and functional implications in gene expression. NucleicAcids.Res. L5: 7 755-7 17 4.
Sharan, S.K., Morimatsu, M., Albrecht,IJ., Lim, D-S., Regel, E., Dinh, C., Sands, 4., Eichele,
G., Hasty, P., and Bradley, A. (1997). Embryonic lethality and radiation hypersensitivity
mediated by Rad51 in mice lacking Brca2. Nature 386: 804-810.
Shattuck-Eidens, D., McClure, M., Simard, J., Labrie, F., Narod, 5., et al. (1995). Acollaborative survey of 80 mutations in the BRCA1 breast and ovarian cancer
susceptibility gene: implications for presymptomatic testing and screening. JAMA 273
535-s41.
Shaw, S.H., Farr, J.E., Thiel, B.A., Matise, T.C., Weissenbach, J., Chakaravarti,4., and
Richard III, C.V/. (1995). A radiation hybrid map of 95 STSs spanning human
chromosome l3q. Genomics 21: 502-510.
Shinohara, 4., Ogawa, H., and Ogawa, T. (1992). Rad5l protein involved in repair and
recombination in S. cerevisiae is a RecAlike protein . Cell 69. 457 -470.
Shizuya, H., Birrer¡ 8., Kim, U-J., Mancino, V., Slepak, T., Tachiiri, Y., and Simon, M.
(1992). Cloning and stable maintenance of 3OO-kilobase-pair fragments of human DNA inEscherichia coli using an F-factor-based vector. Proc. Nqtl. Acad. Sci. USA. 89. 8794-
9797.
Simard, J., Tonin, P., Durocher, F., Morgan, K., Rommens, J., and Gingras, S. (1994).
Common origins of BRCA1 mutations in Canadian breast and ovarian cancer families.
Nøture Genet. 8: 392-398.
Skirnisdottir, S., Eiriksdottir, G., Baldursson, T., Barkardottir, R.8., Egilsson, V., and
Ingvarsson, S. (1995). High frequency of allelic imbalance at chromosome region 16q22-
23 in human breast cancer. correlation with high PgR and low S phase. Int. J. Cancer
(Pred. Oncol.) 64. 112-116.
Slamon, D.J., Godolphin, W., Jones, L.4., Holt, J.A., Wong, S.G., Keith, D.E., Levin, W.J.,
Stuart, S.G., Udove, J., Ullrich, 4., and Press, M.F. (1989). Studies of the FIER-2/neu
proto-oncogene in human breast and ovarian cancer. Science 244. 707-772.
Smith, C.L., and Cantor, C.R. (1989). Evolving strategies for making physical maps ofmammalian chromosomes. Genome 31: 1055-1058.
280
References
Smith, S., Easton, D., Evans, D., and Bonder, B. (1992). Allele losses in the region 77q12-q2lin familial breast and ovarian cancer involve the wild-type chromosome. Nøture Genet. 2:128-131.
Soares, M.8., Bonaldo, M.F., Jelene, P., Su, L., Lawton,L., and Efstratiadis, A. (1994).Construction and characterisation of a normalized oDNA library. Proc. NatL Acqd. Sci.
usA 91 9228-9232.
Sood, R., Blake, T., Aksentijevich, I.,'Wood, G., Chen, X., et al. (1997). Construction of a 1-
Mb restriction-mapped cosmid contig containing the candidate region for the familialmediterranean fever locus (MEFþ on chromosome 16p13.3. Genomics 42'. 83-95.
Southern, E.M. (1975). Detection of specific sequences among DNA fragments separated bygel electrophoresis. J. Mol. Biol. 98. 503-507.
Sparkes, R.S., Murphree,4.L., Lingaa, R.W., Sparkes, M.D., Field, L.L., Funderburþ S.J.,and Benedict, W.F. (1983). Gene for hereditary retinoblastoma assigned to chromosome13 by linkage to esteraseD. Science 219.971-973.
Sreekantaiah, C., Baer, M.R., Preisler, H.D., and Sandberg, A.A. (1989). Involvement ofbands 9q27-q22 in five cases of acute nonlymphocytic leukemia. Cqncer Genet.
Cytogenet.39: 55-64.
Stallings, R.L., Torney, D.C., Hildebrand, C.8., Longmire, J.L., Deaven, L.L., Jett, J.H.,Doggett, N.4., and Moyzis, R.K. (1990). Physical mapping of human chromosomes byrepetitive sequence fingerprinting. Proc. Notl. Acad. Sci. USA 87: 6218-6222.
Steck, P.4., Pershouse, M.4., Jasser, S., Yung, W.K.A., Lin, H., Ligon, A.H., Langford, L.4.,Baumgard, M.L., Hattier, T., Davis, T., Frye, C., Hu, R., Swedlund, 8., Teng, D.H.F.,and Tavtigian, S.V. (1997). Identification of a candidate tumour suppressor gene,
MMACI, at chromosome 10q23 .3 that is mutated in multiple advanced cancers. NqtureGenet. 15:356-362.
Steinmetz, M., Stephan, D., and Lindahl, K. (1986). Gene organisation and recombinationalhotspots in the murine major histocompatability complex. Cell44'. 895-904.
Stewart, E.4., McKusick, K.8., Aggarwal, ,A.., Bajorek,E.,Brady,5., et al. (1997). An STS-
based radiation hybrid map of the human genome. Genome Research 7: 422-433.
Stitt, T.N., Conn, G., Gore, M.,Lai, C., Bruno, J., Radziejewski, C., Mattsson, K., Fisher, J.,
Gies, D.R., Jones, P.F., Masiakowski, P., Ryan, T.E., Tobkes, N.J., Chen, D.H.,DiStefano, P.S., Long,G.L., Basilico, C., Goldfarb, M.P., Lemke, G., Glass, D.J., and
Yancopoulos, G.D. (1995). The anticoagulation factor protein S and its relative, Gas6, are
ligands for the Tyro 3/Axl family of receptor tyrosine kinases. Cell SO. 667-670.
Strathdee, C.4., Gavish, H., Shannon, W.R., and Buchwald, M. (1992). Cloning of cDNAs forFanconi's anemia by functional complementation. Nature 356.763-767.
Stratton, M.R., Ford, D., Neuhausen, S., Seal, S., Wooster, R., Friedman, L.S., Kng, M.C.,Egilsson, V., Devilee, P., McManus, R., Daþ, P.4., Smyth, E., Ponder, B.A.J., Peto, J.,
281
References
Cannon-Albright,L., Easton, D.F., and Goldgar, D.E. (1994). Familial male breast cancer
is not linked to the BRCA1 locus on chromosome 17q. Nature Genet. T: 103-107.
Strong, L.C., Riccardi, V.M., Ferrell, R.E., and Sparkes, R.S. (1981). Familial retinoblastoma
and chromosome 13 deletion transmitted via an insertional translocation. Science 213'.
1 501-1503
Struewing, J.P., Brody, L.C., Erdos, M.R., Kase, R.G., Giambarresi, T.R., Smith, S.4.,Collins, F.S., and Tucker, M.A. (1995). Detection of eight BRCA1 mutations in 10
breast/ovarian cancer families, including I family with male breast cancer. Am. J. Hum.
Genet. 57 l-7.
Suggs, S.V., \{allace, R.8., Hirose, T., Kawashima, E.H., and Italura, K. (1981). Use ofsynthetic oligonucleotides as hybridisation probes: isolation of cloned cDNA sequences forhuman beta-2-microglobin. Proc. Natl. Acad. Sci. USA 78. 6613-6617.
Suthers, G.K., Hyland, V.J., Callen, D.F., Oberle, I., Rocchi, M., Thomas, N.S., Morris, C.P.,
Schwartz, C.E., Schmidt, M., Ropers, H.H., Baker, E., Oostra, B.4., Dahl, N., Wilson,
P.J., Hopwood, J.J., and Sutherland, G.R. (1990). Physical mapping of new DNA probes
near the Fragile X mutation (FRAXA) by using a panel of cell lines. Am. J. Hum. Genet.
47. 787-195.
Suzuki, H., Komiyà, A., Emi, M., Kuramochi, H., Shiraishi, T., Yatan, R., and Shimazaki, J'
(1996). Three distinct commonly deleted regions of chromosome arm 16q in human
primary and metastatic prostate cancers. Genes Chrom. Cancer 17 . 225-233.
Szabo, C.I., and King, M-C. (1995). Inherited breast and ovarian cancer. Hum. Mol. Genet. 4
181 1-1817.
Tanaka, K., Yanoshit&, R., Konishi, M., Oshimura, M., Maeda, Y., Mori, T., and Miyaki, M.
(1993). Suppression of tumourigenicity in human colon carcinoma cells by introduction ofnormal chromosome 1p36 region. Oncogene 8.2253-2258.
Tanner, M.M., Tirkkonen, M., Kallioniemi,4., Collins, C., Stokke, T., Karhu, R., Kowbel, D.,
Shadravan, F., Hintz, M., Kuo, W.L., Waldman, F.M., Isola, J.J., Gray, J.W., and
Kallioniemi, O-P. (1994).Increased copy number at20ql3 in breast cancer. defining the
critical region and exclusion of candidate genes. Cancer Res. 54 4257-4260.
Tavtigian, S.V., Simard, J., Rommens, J., Couch, F., Shattuck-Eidens, D., et al. (1996). The
complete BRCA2 gene and mutations in chromosome l3qJinked kindreds. Nature Genet.
12.333-337.
The Cystinosis Collaborative Research Group. (1995). Linkage of the gene for cystinosis tomarkers on the short arm of chromosome 17. Nature Genet. lO:246-248.
The FAB Consortium. (1996). Positional cloning of the Fanconi anaemia group A gene.
Nature Genet. 14. 324-328.
The Huntington's Disease Collaborative Research Group. (1993). A novel gene containing a
trinucleotide repeat that is expanded and unstable on Huntington's disease chromosomes.
282
References
Cell72:977-983
Thomas, G.4., and Raffel, C. (1991). Loss of heterozygosity on 6q, l6q, and l7p in humancentral nervous system primitive neuroectodermal tumours. Cancer Res. 51: 639-643.
Thompson, F., Emerson, J., Dalton, W., Yang, J-M., McGee, D., Villar, H., Knox, S., Massey,K., 'weinstein, R., Bhattacharyya, 4., and Trent, J. (1993). clonal chromosomeabnormalities in human breast carcinomas I. Twenty-eight cases with primary disease.Genes Chrom. Cancer 7: 185-193.
Tijo, J.H., and Levin, A. (1956). The chromosome number of man. Hereditqs 42. l-6
Touchman, J.W., Bouffard, G.G., Weintraub, L.4., Idol, J.R., Wang, L., Robbins, C.M.,Nussbaum, J.C., Lovett, M., and Green, E.D. (1997). 2006 expressed-sequence tagsderived from human chromosome 7-enriched oDNA libraries. Genome Res. 7.281-292.
Town, M., Jean, G., Cherqui, S., Attard, M., Forestier, L., Whitmore, S.4., Callen, D.F.,füibouval, O., Broyer, M., Bates, G.P., van't Hofl W., and Antignac, C. (1998). A novelgene encoding an integral membrane protein is mutated in nephropathic cystinosis. NatureGenet. 18:319-324.
Tribioli, C., Mancini, M., Plassart,E., Bione, S., Rivella, S., Sala, C., Torri, G., and Toniolo,D. (1994).Isolation of new genes in distal Xq28: transcrþtional map and identification ofa human homologue of the ARDI N-acetyl transferase of Saccharomyces cerevisiae.Hum. Mol. Genet.3. 106l-1067.
Trofatter, J.4., MacCollin, M.M., Rutter, J.L., Murrell, J.R., Duyao, M.P., Parry, D.M.,Eldridge, R, Kley, N., Menon, 4.G., Pulaski, K., Haase, V.H., Ambrose, C.M., Munroe,D., Bove, C., Haines, J.L., Martuza, R.L., MacDonald, M.8., Seizinger, 8.R., Short,M.P., Buckler, 4.J., and Gusella, J.F. (1993). A novel moesin-, ezrin-, radixinlike gene isa candidate for the neurofibromatosis 2 tumour suppressor. CeL|72.797-800.
Tsuda, H., Callen, D.F., Fukutomi, T., Nakamura, Y., and Hirohashi, S. (1994). Allele loss onchromosome 16q24.2-qter occurs frequently in breast cancers irrespectively of differencesin phenotype and extent of spread. Cancer Res. 54'. 573-517 .
Tsuda, H., Hirohashi, S., Shimosato, Y., Hirota, T., Tsugane, S., Yamamoto, H., Miyajima,N., Toyoshima, K., Yamamoto, T., Yokota,I., Yoshida, T., Sakamoto, H., Terada, M.,and Sugimura,T. (1989). Correlation between long-term survival in breast cancer patients
and amplification of two putative oncogene-coamplification units: hst-7/int-2 and c-erbB-2lear-|. Cancer Res. 49. 3 104-3 108.
Tsurugi, K., and Mitsui, K. (1991). Bilateral hydrophobic zipper as a hypothetical structurewhich binds acidic ribosomal protein family together on ribosomes in yeast Saccharomycescerevisiqe. Biochem. Biophys. Res. Comm. l7 4; l3l8-I323.
Valverde, P., Healy, E., Jackson, I., Rees, J.L., and Thody, A.J. (1995). Variants of themelanocyte stimulating hormone receptor gene are associated with red hair and fair skin inhumans. Nqture Genet. ll 328-330.
283
References
van Deutekom, J.C.T., Lemmers, R.J., Grewal, P.K., van Geel, M., Romberg, S., Dauwerse,H.G., Wright, T.J., Padberg, G.W., Hofker, M.H., Hewitt, J.E., and Frants, R.R. (1996).Identification of the first gene (FRGI) from the FSHD region on human chromosome4q35. Hum. Mol. Genel. 5: 581-590.
van de Vijver, M.J. (1993). Molecular genetic changes in human breast cancer. Adv. CancerRes. 6l:25-56
Varley, J.M., Swallow, J.E., Brammar, W.J., Whittaker, J.L., and Walker, R.A (1987).Alterations to either c-erbB-2(neu) or c-myc proto-oncogenes in breast carcinomascorrelate with poor short-term prognosis. Oncogene l: 423-430.
Varnum, 8.C., Youî5, C., Elliot, G., Garcia, 4., Bartley, T.D., Fridell, Y.W., Hunt, R.W.,Trail, G., Clogston, C., Toso, R.J., Yanagihara, D., Bennett, L., Sylber, M., Merewether,L.4., Tseng, 4., EscobaÍ,8., Liu, E.T., and Yamane, H.K. (1995). Axl receptor tyrosinekinase stimulated by the vitamin K-dependent protein encoded by growth-arrest-specificgene 6. Nature 373. 623-626.
Venter, J.C., Smith, H.O., and Hood, L. (1996). A new strategy for genome sequencing.Nature 381.364-366.
Voglino, G., Castello, S., Silengo, L., Stefanuto, G., Friard, O., Ferrara, G., and Fessia, L.(1997). An intronic deletion in TP53 gene causes exon 6 skipping in breast cancer. Eur. J.Cancer 33: 1479-1483.
Vulpe, C., Levinsofl, 8., Whitney, S., Packman, S., and Gitschier, J. (1993). Isolation of a
candidate gene for Menkes disease and evidence that it encodes a copper-transportingATPase. Nature Genet. 3. 7 -13.
Wagner, M.J., Ge, Y., Siciliano, M., and Wells, D.E. (1991). A hybrid cell mapping panel forregional localisation of probes to human chromosome 8. Genomlcs 10: ll4-725.
Walter, M.4., Spillett, D.J., Thomas, P., Weissenbach, J., and Goodfellow, P.N. (1994). Amethod for constructing radiation hybrid maps of whole genomes. Nqture Genet. 7:22-28.
Vy'ang, D.G., Fan, J.8., Siao, C.J., Berno,4., Young, P., et al. (1998). Large-scaleidentification, mapping and genotyping of single-nucleotide polymorphisms in the humangenome. Science 280'. 1077-1082.
Warneke-Wittstock, R., Marquardt, A., Gehrig, 4., Sauer, C.G., Gessler, M., and Weber,B.H.F. (1998). Transcript map of a 900-kb genomic region inXp22.1-p22.2: identificationof 12 novel genes. Genomics 51. 59-67.
Washington, S.S., Bowcock, 4.M., Gerken, S., Matsunami, N., Lesh, D., Osborne-Lawrence,S.L., Cowell, J., Ledbetter, D.H., White, R.L., and Chakravarti, A. (1993). A somatic cellhybrid panel of human chromosome 13. Genomics 18: 486-495.
'Weber, J.L., and May, P.E. (1989). Abundant class of human DNA polymorphisms which can
be typed using the polymerase chain reaction. Am. J. Hum. Genet. 44:388-396.
284
References
Weinberg, R.A (1995). The retinoblastoma protein and cell cycle control. Cell Sl:323-330
Weissenbach, J. (1993). A second generation linkage map of the human genome based onhighly informative microsatellite loci. Gene 135'. 275-279.
weissenbach, J., Gyapay, G., Dib, c., vignal, 4., Morissette, J., Millasseau, p., vaysseix, G.,andLaIIrop, M. (1992). A second-generation linkage map of the human genome. Nature359: 794-801
weissman, 8.E., Saxon, P.J., Pasquale, S.R., Jones, G.R., Geiser, 4.G., and Stanbridge, E.J.(1987).Introduction of a normal human chromosome 1l into a Wilms'tumour cell linecontrols its tumourigenic expression. Science 236. 775-180
Welcher, 4.4., Suter, U., De Leon, M., Snipes, G.J., and Shooter, E.M. (1991). A myelinprotein is encoded by the homologue of a growth arrest-specific gene. Proc. Natl. Acod.Sci. USA 88.7195-7199.
Whitmore, S.4., Apostolou, S., Lane, S., Nancarrow, J.K., Phillips, H.4., Richards, R.I.,Sutherland, G.R., and Callen, D.F. (1994). Isolation and characterisation of transcribedsequences from a chromosome 16 hn-cDNA library and the physical mapping of genes andtranscribed sequences using a high resolution somatic cell hybrid panel of humanch¡omosome 16. Genomics 2O'. 769-175.
Whitney, M., Thayer, M., Reifsteck, C., Olsor¡ S., Smith, L., Jakobs, P.M., Leach, R., Naylor,S., Joenje, H., and Grompe, M. (1995). Microcell mediated chromosome transfer maps theFanconi anaemia group D gene to chromosome 3p. Nature Genet. ll:347-343.
Wijker, M., Morgan, N.V., Herterich, S., van Berkel, C.G.M., Tipping, A.J' et al. (1998).Heterogeneous spectrum of mutations in the Fanconi anaemia group A gene. Eur. J. Hum.Genet. (In Press).
Wilcox, 4.S., Khan, 4.S., Hopkins, J.4., and Sikela, J.M. (1991). Use of 3' untranslatedsequences of human cDNAs for rapid chromosome assignment and conversion to STSs:implications for an expression map of the genome. Nucleic Acids Aes. 19: 1837-1843.
Wilkie, A.O.M., and Higgs, D.R. (1992). An unusually large (CA), repeat in the region ofdivergence between subtelomeric alleles of human chromosome 16p. Genomics 13: 8l-88.
Wooster, R., Bignell, G., Lancaster, J., Swift, S., Seal, 5., et al. (1995).Identification of thebreast cancer susceptibility gene BRCA2. Nature 378:789-791.
Wooster, R., Neuhausen, S.L., Mangion, J., Quirk, Y., Ford, D., et al. Q99\. Localisation ofa breast cancer susceptibility gene, BRCA2, to chromosome 13q12-13. Science 265.2088-2090.
Wyman, A., and White, R. (1980). A highly polymorphic locus in human DNA. Proc. Natl.Acad. Sci. USA 77:6754-6758.
Yaspo, M-L., Gellen, L., Mott, R., Korn,8., Nizetic, D., Poustka, A., and Lehrach, H. (1995).Model for a transcript map of human chromosome 21: isolation of new coding sequences
285

References
from exon and enriched oDNA libraries. Hum. Mol. Genet. 4. 1291-1304
Yoshiura, K., Kanai, Y., Ochiai, 4., Shimoyama,Y., Sugimura, T., and Hirohashi, S. (1995).
Silencing of the E-cadherin invasion-suppressor gene by CpG methylation in human
carcinomas . Proc. Natl. Acad. Sci. USA 92. 7416-7419.
Yunis, J., and Ramsay, N. (1978). Retinoblastoma and subband deletion of chromosome 13
Am. J. Dis. Child.l32.76l-163.
Zhang, M.Q. (1997). Identification of protein coding regions in the human genome byquadratic discriminant analysis. Proc. Nqtl. Acad. Sci. USA 94'. 565-568.
Zhang,W., Hirohashi, S., Tsuda, H., Shimosato, Y., Yokota, J., Terada, M., and Sugimura, T.
(1990). Frequent loss of heterozygosity on chromosomes 16 and 4 in human
hepatocellular carcinoma. Jpn. J. Cancer rRes. 81. 108-111.
Zucman-Rossi, J., Legoix, P., and Thomas, G. (1996). Identification of new members of the
Gas2 andRas families in the 22q72 chromosome region. Genomics 38.247-254.
286


Apostolou, S., Whitmore, S.A., Crawford, J., and Lennon, G., et al., (1996) Positional cloning of the Fanconi anaemia group A gene. Nature Genetics, v. 14 (3), pp. 320-323.
NOTE:This publication is included in the print copy
of the thesis held in the University of Adelaide Library.
It is also available online to authorised users at:
http://dx.doi.org/10.1038/ng1196-324


Ianzano, L., d’Apolito, M., Centra, M., and Savino, M., et al., (1997) The genomic organization of the Fanconi anemia group A (FAA) gene. Genomics, v. 41 (3), pp. 309-314.
NOTE:
This publication is included in the print copy of the thesis held in the University of Adelaide Library.
It is also available online to authorised users at:
http://dx.doi.org/10.1006/geno.1997.4675

Whitmore, S.A., Crawford, J., Apostolou, S., and Eyre, H., et al., (1998) Construction of a high-resolution physical and transcription map of chromosome 16q24.3: a region of frequent loss of heterozygosity in sporadic breast cancer. Genomics, v. 50 (1), pp. 1-8.
NOTE:
This publication is included in the print copy of the thesis held in the University of Adelaide Library.
It is also available online to authorised users at:
http://dx.doi.org/10.1006/geno.1998.5316

Whitmore, S.A., Settasatian, C., Crawford, J., and Lower, K.M., et al., (1998) Characterization and screening for mutations of the growth arrest-specific 11 (GAS11) andC16orf3genes at 16q24.3 in breast cancer. Genomics, v. 52 (3), pp. 325-331.
NOTE:
This publication is included in the print copy of the thesis held in the University of Adelaide Library.
It is also available online to authorised users at:
http://dx.doi.org/10.1006/geno.1998.5457


Town, M., Jean, G., Cherqui, S., Attard, M., and Forestier, L., et al., (1998) A novel gene encoding an integral membrane protein is mutated in nephropathic cystinosis. Nature Genetics, v. 18 (4), pp. 319-324.
NOTE:
This publication is included in the print copy of the thesis held in the University of Adelaide Library.
It is also available online to authorised users at:
http://dx.doi.org/10.1038/ng0498-319
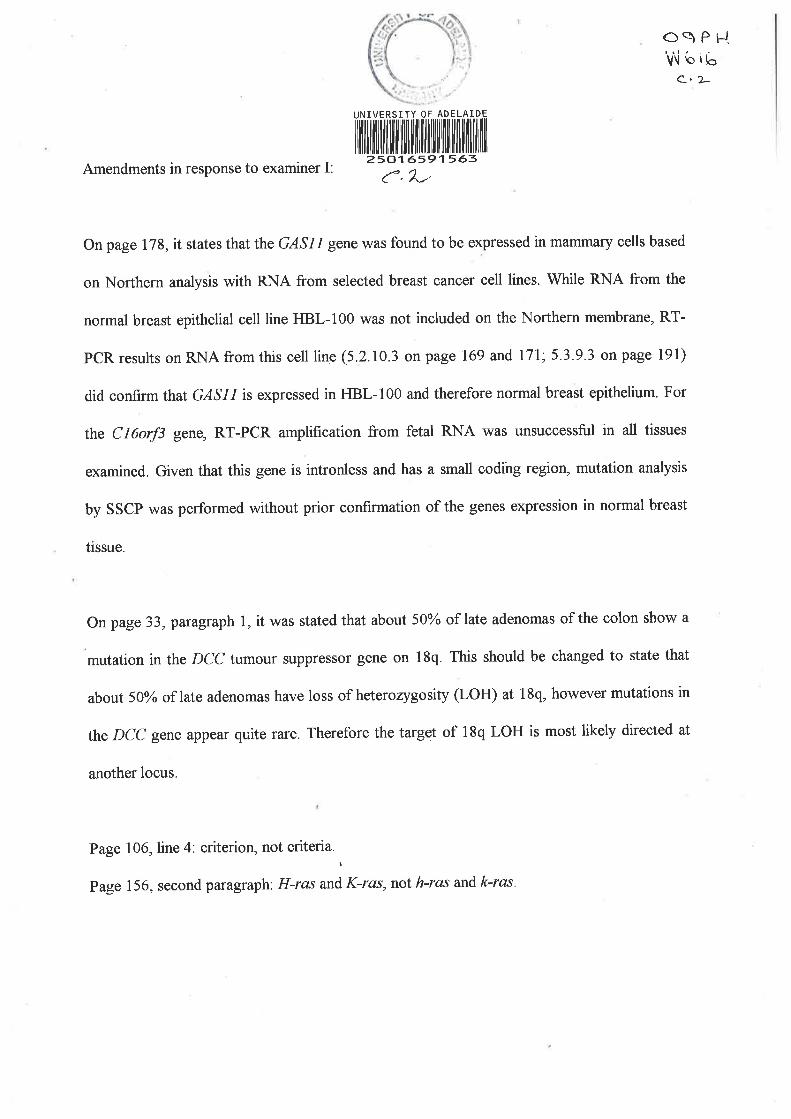
O9Pil.V\ o tçt
C,2-
ilililililiilfr fiililil ilil fr il ilililfi il fr ililfr25016591563
Amendments in response to examiner I: a.2'-
On page 778,it states that the GASI I gene was found to be expressed in mammary cells based
on Northern analysis with RNA from selected breast cancer cell lines. While RNA from the
normal breast epithelial cell line HBL-100 was not included on the Northern membrane, RT-
PCR results on RNA from this cell line (5.2.10.3 on page 169 and 171;5.3.9.3 on page 191)
did confirm thal GASI I is expressed in HBL-100 and therefore normal breast epithelium. For
the Cl6orf3 gene, RT-PCR amplification from fetal RNA was unsuccessful in all tissues
examined. Given that this gene is intronless and has a small coding region, mutation analysis
by SSCP was performed without prior confirmation of the genes expression in normal breast
tissue.
Onpage 33,paragraph 1, itwas statedthat about 50Yoof late adenomas of the colon show a
mutation in the DCC tumour suppressor gene on 18q. This should be changed to state that
about 50Yo of late adenomas have loss of heterozygosity (LOH) at 18q, however mutations in
the DCC gene appear quite rare. Therefore the target of 18q LOH is most likely directed at
another locus.
Page l}6,line 4: criterion, not criteria. ,
Page 756, second paragraph: H-ras and K-ras, not h-ras and k-ras'