Portable Optical Fiber Probe-Based Spectroscopic Scanner for Rapid Cancer Diagnosis: A New Tool for...
10
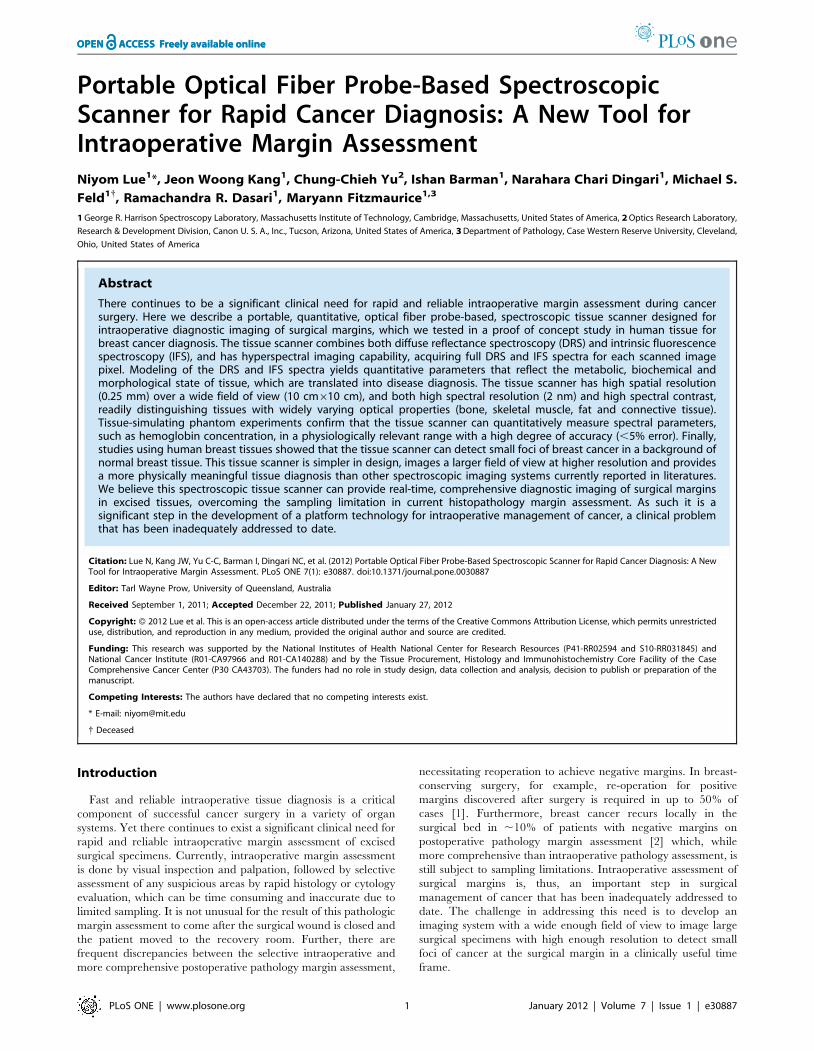
Portable Optical Fiber Probe-Based Spectroscopic Scanner for Rapid Cancer Diagnosis: A New Tool for Intraoperative Margin Assessment Niyom Lue 1 *, Jeon Woong Kang 1 , Chung-Chieh Yu 2 , Ishan Barman 1 , Narahara Chari Dingari 1 , Michael S. Feld 1{ , Ramachandra R. Dasari 1 , Maryann Fitzmaurice 1,3 1 George R. Harrison Spectroscopy Laboratory, Massachusetts Institute of Technology, Cambridge, Massachusetts, United States of America, 2 Optics Research Laboratory, Research & Development Division, Canon U. S. A., Inc., Tucson, Arizona, United States of America, 3 Department of Pathology, Case Western Reserve University, Cleveland, Ohio, United States of America Abstract There continues to be a significant clinical need for rapid and reliable intraoperative margin assessment during cancer surgery. Here we describe a portable, quantitative, optical fiber probe-based, spectroscopic tissue scanner designed for intraoperative diagnostic imaging of surgical margins, which we tested in a proof of concept study in human tissue for breast cancer diagnosis. The tissue scanner combines both diffuse reflectance spectroscopy (DRS) and intrinsic fluorescence spectroscopy (IFS), and has hyperspectral imaging capability, acquiring full DRS and IFS spectra for each scanned image pixel. Modeling of the DRS and IFS spectra yields quantitative parameters that reflect the metabolic, biochemical and morphological state of tissue, which are translated into disease diagnosis. The tissue scanner has high spatial resolution (0.25 mm) over a wide field of view (10 cm6 10 cm), and both high spectral resolution (2 nm) and high spectral contrast, readily distinguishing tissues with widely varying optical properties (bone, skeletal muscle, fat and connective tissue). Tissue-simulating phantom experiments confirm that the tissue scanner can quantitatively measure spectral parameters, such as hemoglobin concentration, in a physiologically relevant range with a high degree of accuracy (,5% error). Finally, studies using human breast tissues showed that the tissue scanner can detect small foci of breast cancer in a background of normal breast tissue. This tissue scanner is simpler in design, images a larger field of view at higher resolution and provides a more physically meaningful tissue diagnosis than other spectroscopic imaging systems currently reported in literatures. We believe this spectroscopic tissue scanner can provide real-time, comprehensive diagnostic imaging of surgical margins in excised tissues, overcoming the sampling limitation in current histopathology margin assessment. As such it is a significant step in the development of a platform technology for intraoperative management of cancer, a clinical problem that has been inadequately addressed to date. Citation: Lue N, Kang JW, Yu C-C, Barman I, Dingari NC, et al. (2012) Portable Optical Fiber Probe-Based Spectroscopic Scanner for Rapid Cancer Diagnosis: A New Tool for Intraoperative Margin Assessment. PLoS ONE 7(1): e30887. doi:10.1371/journal.pone.0030887 Editor: Tarl Wayne Prow, University of Queensland, Australia Received September 1, 2011; Accepted December 22, 2011; Published January 27, 2012 Copyright: ß 2012 Lue et al. This is an open-access article distributed under the terms of the Creative Commons Attribution License, which permits unrestricted use, distribution, and reproduction in any medium, provided the original author and source are credited. Funding: This research was supported by the National Institutes of Health National Center for Research Resources (P41-RR02594 and S10-RR031845) and National Cancer Institute (R01-CA97966 and R01-CA140288) and by the Tissue Procurement, Histology and Immunohistochemistry Core Facility of the Case Comprehensive Cancer Center (P30 CA43703). The funders had no role in study design, data collection and analysis, decision to publish or preparation of the manuscript. Competing Interests: The authors have declared that no competing interests exist. * E-mail: [email protected] { Deceased Introduction Fast and reliable intraoperative tissue diagnosis is a critical component of successful cancer surgery in a variety of organ systems. Yet there continues to exist a significant clinical need for rapid and reliable intraoperative margin assessment of excised surgical specimens. Currently, intraoperative margin assessment is done by visual inspection and palpation, followed by selective assessment of any suspicious areas by rapid histology or cytology evaluation, which can be time consuming and inaccurate due to limited sampling. It is not unusual for the result of this pathologic margin assessment to come after the surgical wound is closed and the patient moved to the recovery room. Further, there are frequent discrepancies between the selective intraoperative and more comprehensive postoperative pathology margin assessment, necessitating reoperation to achieve negative margins. In breast- conserving surgery, for example, re-operation for positive margins discovered after surgery is required in up to 50% of cases [1]. Furthermore, breast cancer recurs locally in the surgical bed in ,10% of patients with negative margins on postoperative pathology margin assessment [2] which, while more comprehensive than intraoperative pathology assessment, is still subject to sampling limitations. Intraoperative assessment of surgical margins is, thus, an important step in surgical management of cancer that has been inadequately addressed to date. The challenge in addressing this need is to develop an imaging system with a wide enough field of view to image large surgical specimens with high enough resolution to detect small foci of cancer at the surgical margin in a clinically useful time frame. PLoS ONE | www.plosone.org 1 January 2012 | Volume 7 | Issue 1 | e30887
-
Upload
independent -
Category
Documents
-
view
3 -
download
0
Transcript of Portable Optical Fiber Probe-Based Spectroscopic Scanner for Rapid Cancer Diagnosis: A New Tool for...
Portable Optical Fiber Probe-Based SpectroscopicScanner for Rapid Cancer Diagnosis: A New Tool forIntraoperative Margin AssessmentNiyom Lue1*, Jeon Woong Kang1, Chung-Chieh Yu2, Ishan Barman1, Narahara Chari Dingari1, Michael S.
Feld1{, Ramachandra R. Dasari1, Maryann Fitzmaurice1,3
1 George R. Harrison Spectroscopy Laboratory, Massachusetts Institute of Technology, Cambridge, Massachusetts, United States of America, 2 Optics Research Laboratory,
Research & Development Division, Canon U. S. A., Inc., Tucson, Arizona, United States of America, 3 Department of Pathology, Case Western Reserve University, Cleveland,
Ohio, United States of America
Abstract
There continues to be a significant clinical need for rapid and reliable intraoperative margin assessment during cancersurgery. Here we describe a portable, quantitative, optical fiber probe-based, spectroscopic tissue scanner designed forintraoperative diagnostic imaging of surgical margins, which we tested in a proof of concept study in human tissue forbreast cancer diagnosis. The tissue scanner combines both diffuse reflectance spectroscopy (DRS) and intrinsic fluorescencespectroscopy (IFS), and has hyperspectral imaging capability, acquiring full DRS and IFS spectra for each scanned imagepixel. Modeling of the DRS and IFS spectra yields quantitative parameters that reflect the metabolic, biochemical andmorphological state of tissue, which are translated into disease diagnosis. The tissue scanner has high spatial resolution(0.25 mm) over a wide field of view (10 cm610 cm), and both high spectral resolution (2 nm) and high spectral contrast,readily distinguishing tissues with widely varying optical properties (bone, skeletal muscle, fat and connective tissue).Tissue-simulating phantom experiments confirm that the tissue scanner can quantitatively measure spectral parameters,such as hemoglobin concentration, in a physiologically relevant range with a high degree of accuracy (,5% error). Finally,studies using human breast tissues showed that the tissue scanner can detect small foci of breast cancer in a background ofnormal breast tissue. This tissue scanner is simpler in design, images a larger field of view at higher resolution and providesa more physically meaningful tissue diagnosis than other spectroscopic imaging systems currently reported in literatures.We believe this spectroscopic tissue scanner can provide real-time, comprehensive diagnostic imaging of surgical marginsin excised tissues, overcoming the sampling limitation in current histopathology margin assessment. As such it is asignificant step in the development of a platform technology for intraoperative management of cancer, a clinical problemthat has been inadequately addressed to date.
Citation: Lue N, Kang JW, Yu C-C, Barman I, Dingari NC, et al. (2012) Portable Optical Fiber Probe-Based Spectroscopic Scanner for Rapid Cancer Diagnosis: A NewTool for Intraoperative Margin Assessment. PLoS ONE 7(1): e30887. doi:10.1371/journal.pone.0030887
Editor: Tarl Wayne Prow, University of Queensland, Australia
Received September 1, 2011; Accepted December 22, 2011; Published January 27, 2012
Copyright: � 2012 Lue et al. This is an open-access article distributed under the terms of the Creative Commons Attribution License, which permits unrestricteduse, distribution, and reproduction in any medium, provided the original author and source are credited.
Funding: This research was supported by the National Institutes of Health National Center for Research Resources (P41-RR02594 and S10-RR031845) andNational Cancer Institute (R01-CA97966 and R01-CA140288) and by the Tissue Procurement, Histology and Immunohistochemistry Core Facility of the CaseComprehensive Cancer Center (P30 CA43703). The funders had no role in study design, data collection and analysis, decision to publish or preparation of themanuscript.
Competing Interests: The authors have declared that no competing interests exist.
* E-mail: [email protected]
{ Deceased
Introduction
Fast and reliable intraoperative tissue diagnosis is a critical
component of successful cancer surgery in a variety of organ
systems. Yet there continues to exist a significant clinical need for
rapid and reliable intraoperative margin assessment of excised
surgical specimens. Currently, intraoperative margin assessment
is done by visual inspection and palpation, followed by selective
assessment of any suspicious areas by rapid histology or cytology
evaluation, which can be time consuming and inaccurate due to
limited sampling. It is not unusual for the result of this pathologic
margin assessment to come after the surgical wound is closed and
the patient moved to the recovery room. Further, there are
frequent discrepancies between the selective intraoperative and
more comprehensive postoperative pathology margin assessment,
necessitating reoperation to achieve negative margins. In breast-
conserving surgery, for example, re-operation for positive
margins discovered after surgery is required in up to 50% of
cases [1]. Furthermore, breast cancer recurs locally in the
surgical bed in ,10% of patients with negative margins on
postoperative pathology margin assessment [2] which, while
more comprehensive than intraoperative pathology assessment, is
still subject to sampling limitations. Intraoperative assessment of
surgical margins is, thus, an important step in surgical
management of cancer that has been inadequately addressed to
date. The challenge in addressing this need is to develop an
imaging system with a wide enough field of view to image large
surgical specimens with high enough resolution to detect small
foci of cancer at the surgical margin in a clinically useful time
frame.
PLoS ONE | www.plosone.org 1 January 2012 | Volume 7 | Issue 1 | e30887
Optical fiber probe-based diffuse reflectance spectroscopy
(DRS) and intrinsic fluorescence spectroscopy (IFS) are being
actively pursued as tools for the real time diagnosis of cancer [3],
and have advantages over other approaches to intraoperative and
comprehensive assessment of surgical margins. DRS and IFS
depend on the inherent optical properties of tissue and, as such, do
not require exogenous imaging probes or contrast agents. The
combination of DRS and IFS provides information on the
metabolic, biochemical and morphological state of tissue, which
can be translated into disease diagnosis. DRS and IFS have
relatively shallow (#1 mm) tissue penetration, and thus interrogate
only the margin of the excised tissue specimen. Unlike traditional
pathology diagnosis, spectroscopic diagnosis can be performed in
real time. Spectroscopic techniques are also quantitative and
therefore more objective than the traditional approach, which is
subject to pathologist interpretation. However, conventional
optical fiber probe-based spectroscopy techniques only examine
a small area of tissue (,1 mm) at a time, and so can suffer from
under sampling and easily miss the lesion of interest. Spectroscopic
imaging techniques [4–9] can examine the entire margin of the
excised tissue specimen, and so are not prone to the sampling
limitations inherent in traditional pathology examination.
Here we present a portable, quantitative, optical fiber probe-
based, spectroscopic tissue scanner that can provide real-time
comprehensive assessment of surgical margins in excised tissue
specimens. The scanner significantly advances our optical fiber
probe-based spectroscopy instruments [10,11], which have been
successfully employed in clinical studies for the diagnosis of oral,
esophageal, cervical and breast cancer [12–15], to a wide field,
high resolution imaging regime as required to be an effective
clinical tool for intraoperative margin assessment at cancer
surgery. This tissue scanner is simpler in design, images a larger
field of view at higher resolution and provides a more physically
meaningful tissue diagnosis than other spectroscopic margin
imaging systems currently in development. Overall, the tissue
scanner can provide fast, accurate, diagnostic images of the entire
margin of excised surgical specimens, overcoming the sampling
limitation in current pathology margin assessment. We believe the
tissue scanner is a platform technology that has the potential to
provide real-time, comprehensive, intraoperative assessment of
surgical margins that will allow more complete resection of
diseased tissue and better conservation of normal tissue at surgery
for breast cancer and other solid tumors.
Materials and Methods
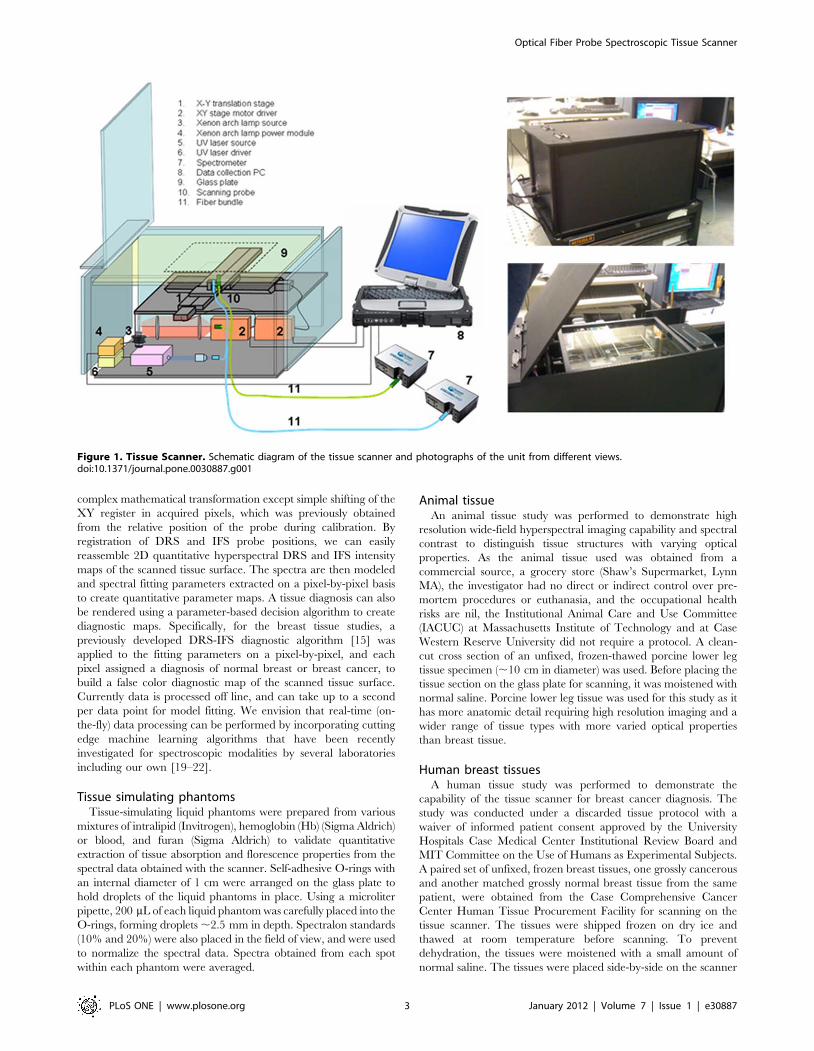
InstrumentationA portable tissue scanner was constructed that can scan large
tissue specimens (up to 20 cm620 cm) at high resolution
(0.25 mm) in a clinically acceptable time frame (less than
20 minutes for 8 cm68 cm area and 0.25 mm resolution).
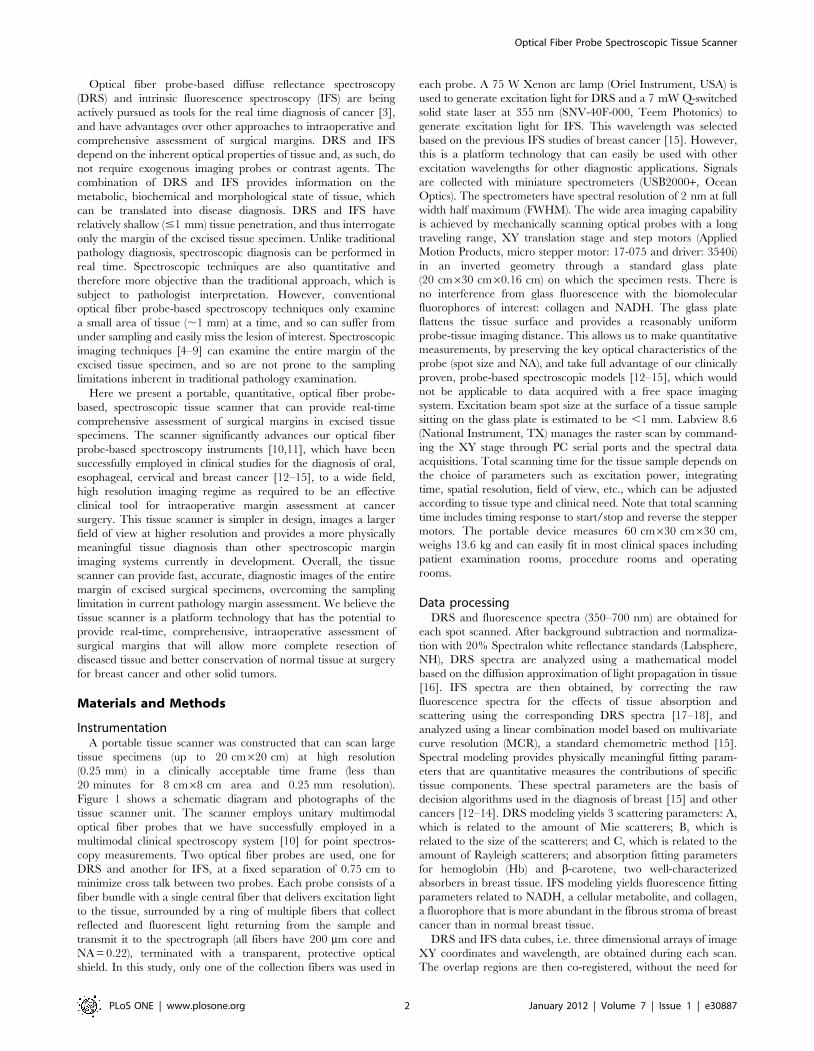
Figure 1 shows a schematic diagram and photographs of the
tissue scanner unit. The scanner employs unitary multimodal
optical fiber probes that we have successfully employed in a
multimodal clinical spectroscopy system [10] for point spectros-
copy measurements. Two optical fiber probes are used, one for
DRS and another for IFS, at a fixed separation of 0.75 cm to
minimize cross talk between two probes. Each probe consists of a
fiber bundle with a single central fiber that delivers excitation light
to the tissue, surrounded by a ring of multiple fibers that collect
reflected and fluorescent light returning from the sample and
transmit it to the spectrograph (all fibers have 200 mm core and
NA = 0.22), terminated with a transparent, protective optical
shield. In this study, only one of the collection fibers was used in
each probe. A 75 W Xenon arc lamp (Oriel Instrument, USA) is
used to generate excitation light for DRS and a 7 mW Q-switched
solid state laser at 355 nm (SNV-40F-000, Teem Photonics) to
generate excitation light for IFS. This wavelength was selected
based on the previous IFS studies of breast cancer [15]. However,
this is a platform technology that can easily be used with other
excitation wavelengths for other diagnostic applications. Signals
are collected with miniature spectrometers (USB2000+, Ocean
Optics). The spectrometers have spectral resolution of 2 nm at full
width half maximum (FWHM). The wide area imaging capability
is achieved by mechanically scanning optical probes with a long
traveling range, XY translation stage and step motors (Applied
Motion Products, micro stepper motor: 17-075 and driver: 3540i)
in an inverted geometry through a standard glass plate
(20 cm630 cm60.16 cm) on which the specimen rests. There is
no interference from glass fluorescence with the biomolecular
fluorophores of interest: collagen and NADH. The glass plate
flattens the tissue surface and provides a reasonably uniform
probe-tissue imaging distance. This allows us to make quantitative
measurements, by preserving the key optical characteristics of the
probe (spot size and NA), and take full advantage of our clinically
proven, probe-based spectroscopic models [12–15], which would
not be applicable to data acquired with a free space imaging
system. Excitation beam spot size at the surface of a tissue sample
sitting on the glass plate is estimated to be ,1 mm. Labview 8.6
(National Instrument, TX) manages the raster scan by command-
ing the XY stage through PC serial ports and the spectral data
acquisitions. Total scanning time for the tissue sample depends on
the choice of parameters such as excitation power, integrating
time, spatial resolution, field of view, etc., which can be adjusted
according to tissue type and clinical need. Note that total scanning
time includes timing response to start/stop and reverse the stepper
motors. The portable device measures 60 cm630 cm630 cm,
weighs 13.6 kg and can easily fit in most clinical spaces including
patient examination rooms, procedure rooms and operating
rooms.
Data processingDRS and fluorescence spectra (350–700 nm) are obtained for
each spot scanned. After background subtraction and normaliza-
tion with 20% Spectralon white reflectance standards (Labsphere,
NH), DRS spectra are analyzed using a mathematical model
based on the diffusion approximation of light propagation in tissue
[16]. IFS spectra are then obtained, by correcting the raw
fluorescence spectra for the effects of tissue absorption and
scattering using the corresponding DRS spectra [17–18], and
analyzed using a linear combination model based on multivariate
curve resolution (MCR), a standard chemometric method [15].
Spectral modeling provides physically meaningful fitting param-
eters that are quantitative measures the contributions of specific
tissue components. These spectral parameters are the basis of
decision algorithms used in the diagnosis of breast [15] and other
cancers [12–14]. DRS modeling yields 3 scattering parameters: A,
which is related to the amount of Mie scatterers; B, which is
related to the size of the scatterers; and C, which is related to the
amount of Rayleigh scatterers; and absorption fitting parameters
for hemoglobin (Hb) and b-carotene, two well-characterized
absorbers in breast tissue. IFS modeling yields fluorescence fitting
parameters related to NADH, a cellular metabolite, and collagen,
a fluorophore that is more abundant in the fibrous stroma of breast
cancer than in normal breast tissue.
DRS and IFS data cubes, i.e. three dimensional arrays of image
XY coordinates and wavelength, are obtained during each scan.
The overlap regions are then co-registered, without the need for
Optical Fiber Probe Spectroscopic Tissue Scanner
PLoS ONE | www.plosone.org 2 January 2012 | Volume 7 | Issue 1 | e30887
complex mathematical transformation except simple shifting of the
XY register in acquired pixels, which was previously obtained
from the relative position of the probe during calibration. By
registration of DRS and IFS probe positions, we can easily
reassemble 2D quantitative hyperspectral DRS and IFS intensity
maps of the scanned tissue surface. The spectra are then modeled
and spectral fitting parameters extracted on a pixel-by-pixel basis
to create quantitative parameter maps. A tissue diagnosis can also
be rendered using a parameter-based decision algorithm to create
diagnostic maps. Specifically, for the breast tissue studies, a
previously developed DRS-IFS diagnostic algorithm [15] was
applied to the fitting parameters on a pixel-by-pixel, and each
pixel assigned a diagnosis of normal breast or breast cancer, to
build a false color diagnostic map of the scanned tissue surface.
Currently data is processed off line, and can take up to a second
per data point for model fitting. We envision that real-time (on-
the-fly) data processing can be performed by incorporating cutting
edge machine learning algorithms that have been recently
investigated for spectroscopic modalities by several laboratories
including our own [19–22].
Tissue simulating phantomsTissue-simulating liquid phantoms were prepared from various
mixtures of intralipid (Invitrogen), hemoglobin (Hb) (Sigma Aldrich)
or blood, and furan (Sigma Aldrich) to validate quantitative
extraction of tissue absorption and florescence properties from the
spectral data obtained with the scanner. Self-adhesive O-rings with
an internal diameter of 1 cm were arranged on the glass plate to
hold droplets of the liquid phantoms in place. Using a microliter
pipette, 200 mL of each liquid phantom was carefully placed into the
O-rings, forming droplets ,2.5 mm in depth. Spectralon standards
(10% and 20%) were also placed in the field of view, and were used
to normalize the spectral data. Spectra obtained from each spot
within each phantom were averaged.
Animal tissueAn animal tissue study was performed to demonstrate high
resolution wide-field hyperspectral imaging capability and spectral
contrast to distinguish tissue structures with varying optical
properties. As the animal tissue used was obtained from a
commercial source, a grocery store (Shaw’s Supermarket, Lynn
MA), the investigator had no direct or indirect control over pre-
mortem procedures or euthanasia, and the occupational health
risks are nil, the Institutional Animal Care and Use Committee
(IACUC) at Massachusetts Institute of Technology and at Case
Western Reserve University did not require a protocol. A clean-
cut cross section of an unfixed, frozen-thawed porcine lower leg
tissue specimen (,10 cm in diameter) was used. Before placing the
tissue section on the glass plate for scanning, it was moistened with
normal saline. Porcine lower leg tissue was used for this study as it
has more anatomic detail requiring high resolution imaging and a
wider range of tissue types with more varied optical properties
than breast tissue.
Human breast tissuesA human tissue study was performed to demonstrate the
capability of the tissue scanner for breast cancer diagnosis. The
study was conducted under a discarded tissue protocol with a
waiver of informed patient consent approved by the University
Hospitals Case Medical Center Institutional Review Board and
MIT Committee on the Use of Humans as Experimental Subjects.
A paired set of unfixed, frozen breast tissues, one grossly cancerous
and another matched grossly normal breast tissue from the same
patient, were obtained from the Case Comprehensive Cancer
Center Human Tissue Procurement Facility for scanning on the
tissue scanner. The tissues were shipped frozen on dry ice and
thawed at room temperature before scanning. To prevent
dehydration, the tissues were moistened with a small amount of
normal saline. The tissues were placed side-by-side on the scanner
Figure 1. Tissue Scanner. Schematic diagram of the tissue scanner and photographs of the unit from different views.doi:10.1371/journal.pone.0030887.g001
Optical Fiber Probe Spectroscopic Tissue Scanner
PLoS ONE | www.plosone.org 3 January 2012 | Volume 7 | Issue 1 | e30887
glass plate. After scanning, the tissue surfaces scanned were
marked with colored colloidal inks to preserve orientation, fixed in
10% neutral buffered formalin, processed and embedded in
paraffin, and hematoxylin and eosin stained tissue sections
prepared for microscopic examination by an experienced breast
pathologist at the University Hospitals Case Medical Center, for
comparison with the spectroscopic imaging results.
Results
A number of studies were performed to test system performance.
A resolution target was used to demonstrate the imaging capability
and to test spatial resolution of the system. A series of tissue-
simulating liquid phantoms was used to validate quantitative
extraction of tissue properties from the reflectance and fluorescence
spectral data. Moreover, animal tissue was used to illustrate the
hyperspectral imaging capability of the system and demonstrate
spectral contrast to distinguish tissues with different scattering and
absorption properties. Finally, normal and cancer tissues from a
breast cancer patient were used to demonstrate the usefulness of the
tissue scanner as a cancer margin assessment device.
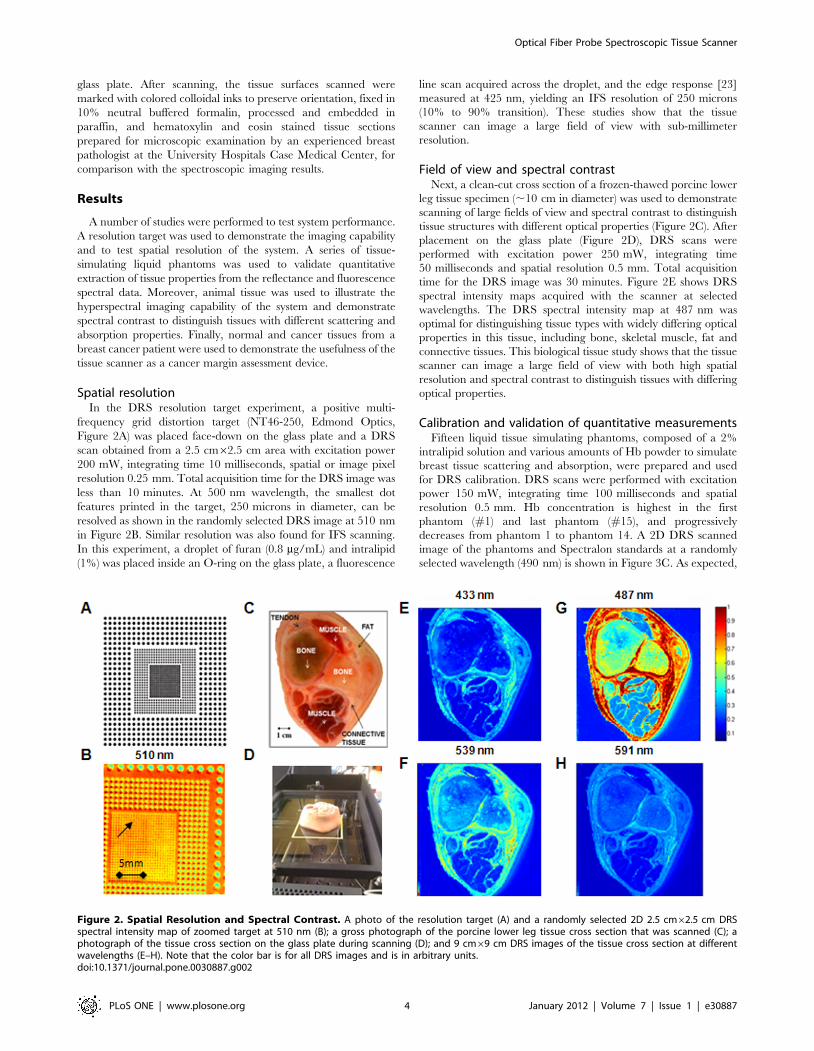
Spatial resolutionIn the DRS resolution target experiment, a positive multi-
frequency grid distortion target (NT46-250, Edmond Optics,
Figure 2A) was placed face-down on the glass plate and a DRS
scan obtained from a 2.5 cm62.5 cm area with excitation power
200 mW, integrating time 10 milliseconds, spatial or image pixel
resolution 0.25 mm. Total acquisition time for the DRS image was
less than 10 minutes. At 500 nm wavelength, the smallest dot
features printed in the target, 250 microns in diameter, can be
resolved as shown in the randomly selected DRS image at 510 nm
in Figure 2B. Similar resolution was also found for IFS scanning.
In this experiment, a droplet of furan (0.8 mg/mL) and intralipid
(1%) was placed inside an O-ring on the glass plate, a fluorescence
line scan acquired across the droplet, and the edge response [23]
measured at 425 nm, yielding an IFS resolution of 250 microns
(10% to 90% transition). These studies show that the tissue
scanner can image a large field of view with sub-millimeter
resolution.
Field of view and spectral contrastNext, a clean-cut cross section of a frozen-thawed porcine lower
leg tissue specimen (,10 cm in diameter) was used to demonstrate
scanning of large fields of view and spectral contrast to distinguish
tissue structures with different optical properties (Figure 2C). After
placement on the glass plate (Figure 2D), DRS scans were
performed with excitation power 250 mW, integrating time
50 milliseconds and spatial resolution 0.5 mm. Total acquisition
time for the DRS image was 30 minutes. Figure 2E shows DRS
spectral intensity maps acquired with the scanner at selected
wavelengths. The DRS spectral intensity map at 487 nm was
optimal for distinguishing tissue types with widely differing optical
properties in this tissue, including bone, skeletal muscle, fat and
connective tissues. This biological tissue study shows that the tissue
scanner can image a large field of view with both high spatial
resolution and spectral contrast to distinguish tissues with differing
optical properties.
Calibration and validation of quantitative measurementsFifteen liquid tissue simulating phantoms, composed of a 2%
intralipid solution and various amounts of Hb powder to simulate
breast tissue scattering and absorption, were prepared and used
for DRS calibration. DRS scans were performed with excitation
power 150 mW, integrating time 100 milliseconds and spatial
resolution 0.5 mm. Hb concentration is highest in the first
phantom (#1) and last phantom (#15), and progressively
decreases from phantom 1 to phantom 14. A 2D DRS scanned
image of the phantoms and Spectralon standards at a randomly
selected wavelength (490 nm) is shown in Figure 3C. As expected,
Figure 2. Spatial Resolution and Spectral Contrast. A photo of the resolution target (A) and a randomly selected 2D 2.5 cm62.5 cm DRSspectral intensity map of zoomed target at 510 nm (B); a gross photograph of the porcine lower leg tissue cross section that was scanned (C); aphotograph of the tissue cross section on the glass plate during scanning (D); and 9 cm69 cm DRS images of the tissue cross section at differentwavelengths (E–H). Note that the color bar is for all DRS images and is in arbitrary units.doi:10.1371/journal.pone.0030887.g002
Optical Fiber Probe Spectroscopic Tissue Scanner
PLoS ONE | www.plosone.org 4 January 2012 | Volume 7 | Issue 1 | e30887
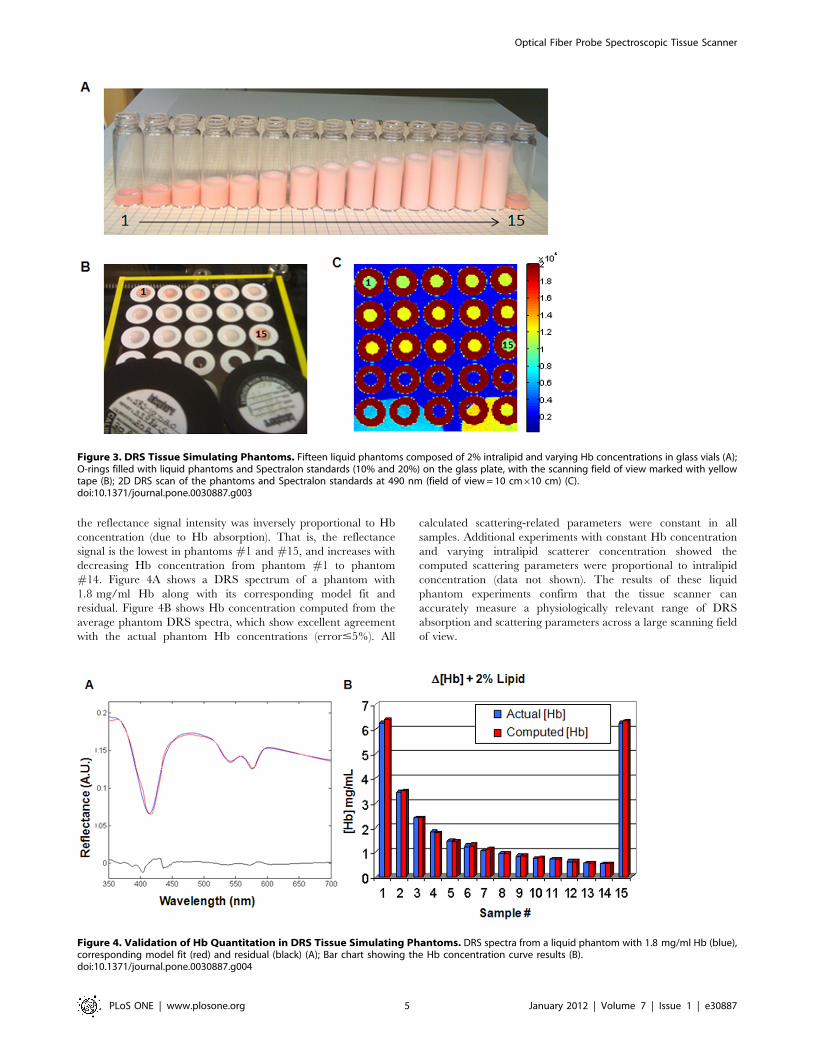
the reflectance signal intensity was inversely proportional to Hb
concentration (due to Hb absorption). That is, the reflectance
signal is the lowest in phantoms #1 and #15, and increases with
decreasing Hb concentration from phantom #1 to phantom
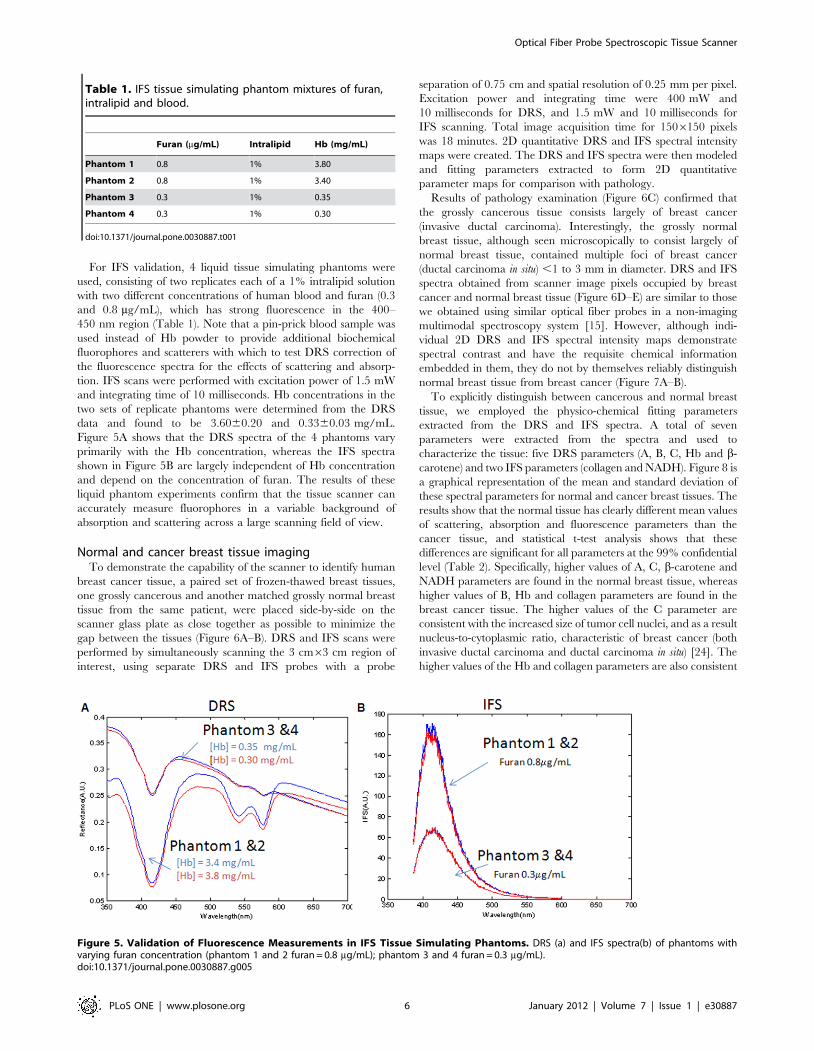
#14. Figure 4A shows a DRS spectrum of a phantom with
1.8 mg/ml Hb along with its corresponding model fit and
residual. Figure 4B shows Hb concentration computed from the
average phantom DRS spectra, which show excellent agreement
with the actual phantom Hb concentrations (error#5%). All
calculated scattering-related parameters were constant in all
samples. Additional experiments with constant Hb concentration
and varying intralipid scatterer concentration showed the
computed scattering parameters were proportional to intralipid
concentration (data not shown). The results of these liquid
phantom experiments confirm that the tissue scanner can
accurately measure a physiologically relevant range of DRS
absorption and scattering parameters across a large scanning field
of view.
Figure 3. DRS Tissue Simulating Phantoms. Fifteen liquid phantoms composed of 2% intralipid and varying Hb concentrations in glass vials (A);O-rings filled with liquid phantoms and Spectralon standards (10% and 20%) on the glass plate, with the scanning field of view marked with yellowtape (B); 2D DRS scan of the phantoms and Spectralon standards at 490 nm (field of view = 10 cm610 cm) (C).doi:10.1371/journal.pone.0030887.g003
Figure 4. Validation of Hb Quantitation in DRS Tissue Simulating Phantoms. DRS spectra from a liquid phantom with 1.8 mg/ml Hb (blue),corresponding model fit (red) and residual (black) (A); Bar chart showing the Hb concentration curve results (B).doi:10.1371/journal.pone.0030887.g004
Optical Fiber Probe Spectroscopic Tissue Scanner
PLoS ONE | www.plosone.org 5 January 2012 | Volume 7 | Issue 1 | e30887
For IFS validation, 4 liquid tissue simulating phantoms were
used, consisting of two replicates each of a 1% intralipid solution
with two different concentrations of human blood and furan (0.3
and 0.8 mg/mL), which has strong fluorescence in the 400–
450 nm region (Table 1). Note that a pin-prick blood sample was
used instead of Hb powder to provide additional biochemical
fluorophores and scatterers with which to test DRS correction of
the fluorescence spectra for the effects of scattering and absorp-
tion. IFS scans were performed with excitation power of 1.5 mW
and integrating time of 10 milliseconds. Hb concentrations in the
two sets of replicate phantoms were determined from the DRS
data and found to be 3.6060.20 and 0.3360.03 mg/mL.
Figure 5A shows that the DRS spectra of the 4 phantoms vary
primarily with the Hb concentration, whereas the IFS spectra
shown in Figure 5B are largely independent of Hb concentration
and depend on the concentration of furan. The results of these
liquid phantom experiments confirm that the tissue scanner can
accurately measure fluorophores in a variable background of
absorption and scattering across a large scanning field of view.
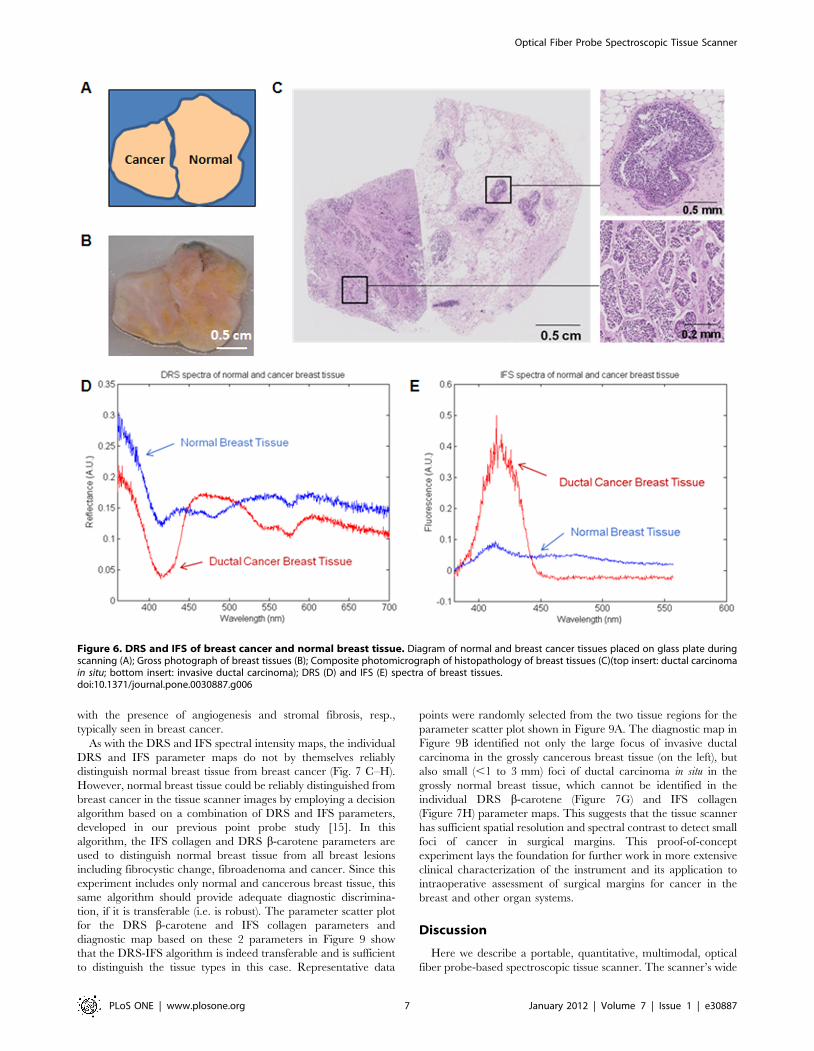
Normal and cancer breast tissue imagingTo demonstrate the capability of the scanner to identify human
breast cancer tissue, a paired set of frozen-thawed breast tissues,
one grossly cancerous and another matched grossly normal breast
tissue from the same patient, were placed side-by-side on the
scanner glass plate as close together as possible to minimize the
gap between the tissues (Figure 6A–B). DRS and IFS scans were
performed by simultaneously scanning the 3 cm63 cm region of
interest, using separate DRS and IFS probes with a probe
separation of 0.75 cm and spatial resolution of 0.25 mm per pixel.
Excitation power and integrating time were 400 mW and
10 milliseconds for DRS, and 1.5 mW and 10 milliseconds for
IFS scanning. Total image acquisition time for 1506150 pixels
was 18 minutes. 2D quantitative DRS and IFS spectral intensity
maps were created. The DRS and IFS spectra were then modeled
and fitting parameters extracted to form 2D quantitative
parameter maps for comparison with pathology.
Results of pathology examination (Figure 6C) confirmed that
the grossly cancerous tissue consists largely of breast cancer
(invasive ductal carcinoma). Interestingly, the grossly normal
breast tissue, although seen microscopically to consist largely of
normal breast tissue, contained multiple foci of breast cancer
(ductal carcinoma in situ) ,1 to 3 mm in diameter. DRS and IFS
spectra obtained from scanner image pixels occupied by breast
cancer and normal breast tissue (Figure 6D–E) are similar to those
we obtained using similar optical fiber probes in a non-imaging
multimodal spectroscopy system [15]. However, although indi-
vidual 2D DRS and IFS spectral intensity maps demonstrate
spectral contrast and have the requisite chemical information
embedded in them, they do not by themselves reliably distinguish
normal breast tissue from breast cancer (Figure 7A–B).
To explicitly distinguish between cancerous and normal breast
tissue, we employed the physico-chemical fitting parameters
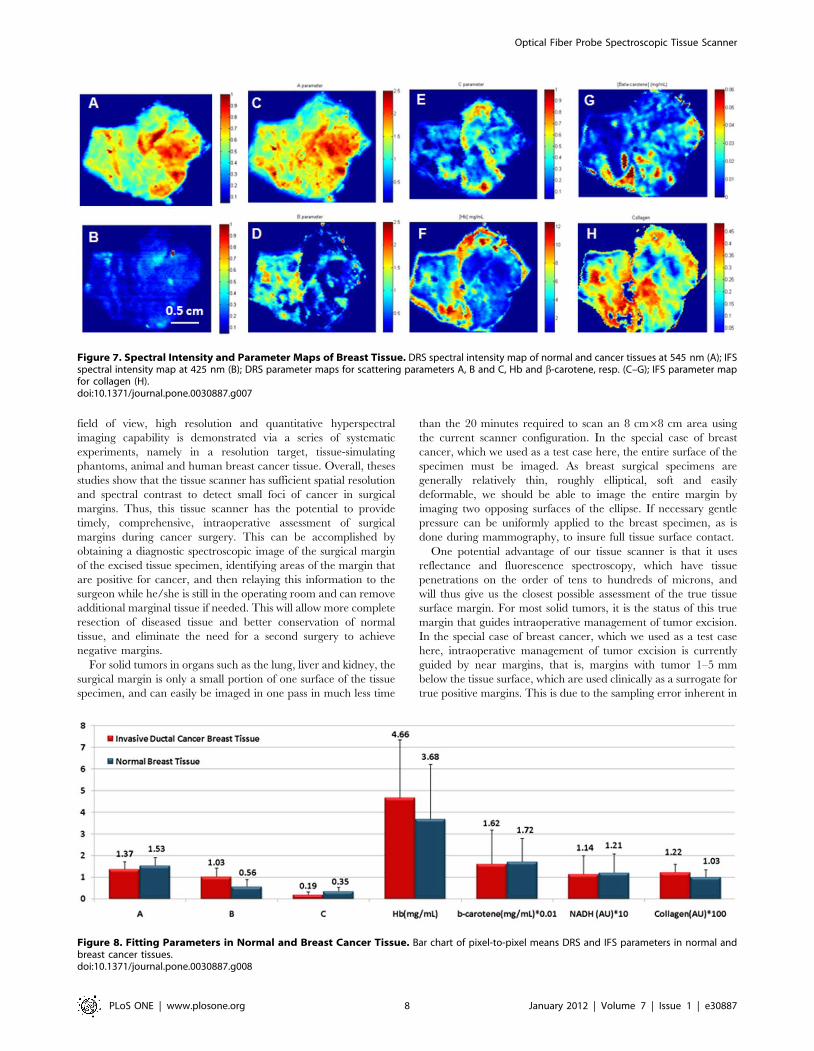
extracted from the DRS and IFS spectra. A total of seven
parameters were extracted from the spectra and used to
characterize the tissue: five DRS parameters (A, B, C, Hb and b-
carotene) and two IFS parameters (collagen and NADH). Figure 8 is
a graphical representation of the mean and standard deviation of
these spectral parameters for normal and cancer breast tissues. The
results show that the normal tissue has clearly different mean values
of scattering, absorption and fluorescence parameters than the
cancer tissue, and statistical t-test analysis shows that these
differences are significant for all parameters at the 99% confidential
level (Table 2). Specifically, higher values of A, C, b-carotene and
NADH parameters are found in the normal breast tissue, whereas
higher values of B, Hb and collagen parameters are found in the
breast cancer tissue. The higher values of the C parameter are
consistent with the increased size of tumor cell nuclei, and as a result
nucleus-to-cytoplasmic ratio, characteristic of breast cancer (both
invasive ductal carcinoma and ductal carcinoma in situ) [24]. The
higher values of the Hb and collagen parameters are also consistent
Figure 5. Validation of Fluorescence Measurements in IFS Tissue Simulating Phantoms. DRS (a) and IFS spectra(b) of phantoms withvarying furan concentration (phantom 1 and 2 furan = 0.8 mg/mL); phantom 3 and 4 furan = 0.3 mg/mL).doi:10.1371/journal.pone.0030887.g005
Table 1. IFS tissue simulating phantom mixtures of furan,intralipid and blood.
Furan (mg/mL) Intralipid Hb (mg/mL)
Phantom 1 0.8 1% 3.80
Phantom 2 0.8 1% 3.40
Phantom 3 0.3 1% 0.35
Phantom 4 0.3 1% 0.30
doi:10.1371/journal.pone.0030887.t001
Optical Fiber Probe Spectroscopic Tissue Scanner
PLoS ONE | www.plosone.org 6 January 2012 | Volume 7 | Issue 1 | e30887
with the presence of angiogenesis and stromal fibrosis, resp.,
typically seen in breast cancer.
As with the DRS and IFS spectral intensity maps, the individual
DRS and IFS parameter maps do not by themselves reliably
distinguish normal breast tissue from breast cancer (Fig. 7 C–H).
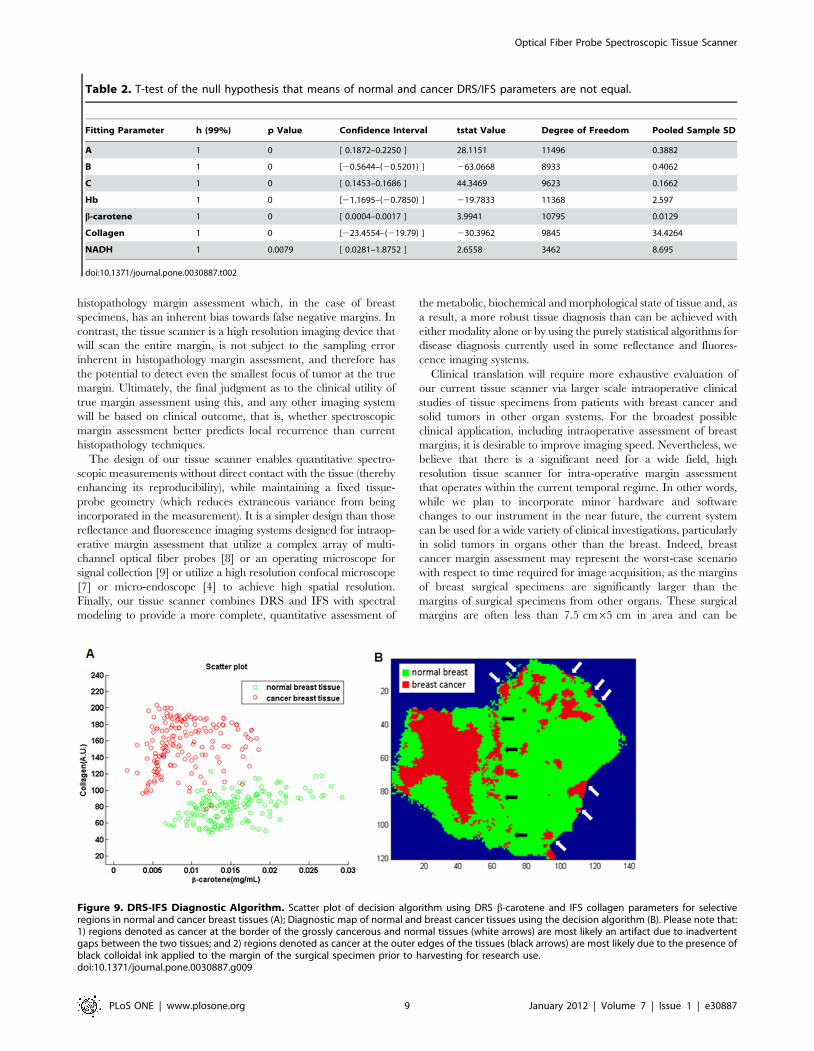
However, normal breast tissue could be reliably distinguished from
breast cancer in the tissue scanner images by employing a decision
algorithm based on a combination of DRS and IFS parameters,
developed in our previous point probe study [15]. In this
algorithm, the IFS collagen and DRS b-carotene parameters are
used to distinguish normal breast tissue from all breast lesions
including fibrocystic change, fibroadenoma and cancer. Since this
experiment includes only normal and cancerous breast tissue, this
same algorithm should provide adequate diagnostic discrimina-
tion, if it is transferable (i.e. is robust). The parameter scatter plot
for the DRS b-carotene and IFS collagen parameters and
diagnostic map based on these 2 parameters in Figure 9 show
that the DRS-IFS algorithm is indeed transferable and is sufficient
to distinguish the tissue types in this case. Representative data
points were randomly selected from the two tissue regions for the
parameter scatter plot shown in Figure 9A. The diagnostic map in
Figure 9B identified not only the large focus of invasive ductal
carcinoma in the grossly cancerous breast tissue (on the left), but
also small (,1 to 3 mm) foci of ductal carcinoma in situ in the
grossly normal breast tissue, which cannot be identified in the
individual DRS b-carotene (Figure 7G) and IFS collagen
(Figure 7H) parameter maps. This suggests that the tissue scanner
has sufficient spatial resolution and spectral contrast to detect small
foci of cancer in surgical margins. This proof-of-concept
experiment lays the foundation for further work in more extensive
clinical characterization of the instrument and its application to
intraoperative assessment of surgical margins for cancer in the
breast and other organ systems.
Discussion
Here we describe a portable, quantitative, multimodal, optical
fiber probe-based spectroscopic tissue scanner. The scanner’s wide
Figure 6. DRS and IFS of breast cancer and normal breast tissue. Diagram of normal and breast cancer tissues placed on glass plate duringscanning (A); Gross photograph of breast tissues (B); Composite photomicrograph of histopathology of breast tissues (C)(top insert: ductal carcinomain situ; bottom insert: invasive ductal carcinoma); DRS (D) and IFS (E) spectra of breast tissues.doi:10.1371/journal.pone.0030887.g006
Optical Fiber Probe Spectroscopic Tissue Scanner
PLoS ONE | www.plosone.org 7 January 2012 | Volume 7 | Issue 1 | e30887
field of view, high resolution and quantitative hyperspectral
imaging capability is demonstrated via a series of systematic
experiments, namely in a resolution target, tissue-simulating
phantoms, animal and human breast cancer tissue. Overall, theses
studies show that the tissue scanner has sufficient spatial resolution
and spectral contrast to detect small foci of cancer in surgical
margins. Thus, this tissue scanner has the potential to provide
timely, comprehensive, intraoperative assessment of surgical
margins during cancer surgery. This can be accomplished by
obtaining a diagnostic spectroscopic image of the surgical margin
of the excised tissue specimen, identifying areas of the margin that
are positive for cancer, and then relaying this information to the
surgeon while he/she is still in the operating room and can remove
additional marginal tissue if needed. This will allow more complete
resection of diseased tissue and better conservation of normal
tissue, and eliminate the need for a second surgery to achieve
negative margins.
For solid tumors in organs such as the lung, liver and kidney, the
surgical margin is only a small portion of one surface of the tissue
specimen, and can easily be imaged in one pass in much less time
than the 20 minutes required to scan an 8 cm68 cm area using
the current scanner configuration. In the special case of breast
cancer, which we used as a test case here, the entire surface of the
specimen must be imaged. As breast surgical specimens are
generally relatively thin, roughly elliptical, soft and easily
deformable, we should be able to image the entire margin by
imaging two opposing surfaces of the ellipse. If necessary gentle
pressure can be uniformly applied to the breast specimen, as is
done during mammography, to insure full tissue surface contact.
One potential advantage of our tissue scanner is that it uses
reflectance and fluorescence spectroscopy, which have tissue
penetrations on the order of tens to hundreds of microns, and
will thus give us the closest possible assessment of the true tissue
surface margin. For most solid tumors, it is the status of this true
margin that guides intraoperative management of tumor excision.
In the special case of breast cancer, which we used as a test case
here, intraoperative management of tumor excision is currently
guided by near margins, that is, margins with tumor 1–5 mm
below the tissue surface, which are used clinically as a surrogate for
true positive margins. This is due to the sampling error inherent in
Figure 7. Spectral Intensity and Parameter Maps of Breast Tissue. DRS spectral intensity map of normal and cancer tissues at 545 nm (A); IFSspectral intensity map at 425 nm (B); DRS parameter maps for scattering parameters A, B and C, Hb and b-carotene, resp. (C–G); IFS parameter mapfor collagen (H).doi:10.1371/journal.pone.0030887.g007
Figure 8. Fitting Parameters in Normal and Breast Cancer Tissue. Bar chart of pixel-to-pixel means DRS and IFS parameters in normal andbreast cancer tissues.doi:10.1371/journal.pone.0030887.g008
Optical Fiber Probe Spectroscopic Tissue Scanner
PLoS ONE | www.plosone.org 8 January 2012 | Volume 7 | Issue 1 | e30887
histopathology margin assessment which, in the case of breast
specimens, has an inherent bias towards false negative margins. In
contrast, the tissue scanner is a high resolution imaging device that
will scan the entire margin, is not subject to the sampling error
inherent in histopathology margin assessment, and therefore has
the potential to detect even the smallest focus of tumor at the true
margin. Ultimately, the final judgment as to the clinical utility of
true margin assessment using this, and any other imaging system
will be based on clinical outcome, that is, whether spectroscopic
margin assessment better predicts local recurrence than current
histopathology techniques.
The design of our tissue scanner enables quantitative spectro-
scopic measurements without direct contact with the tissue (thereby
enhancing its reproducibility), while maintaining a fixed tissue-
probe geometry (which reduces extraneous variance from being
incorporated in the measurement). It is a simpler design than those
reflectance and fluorescence imaging systems designed for intraop-
erative margin assessment that utilize a complex array of multi-
channel optical fiber probes [8] or an operating microscope for
signal collection [9] or utilize a high resolution confocal microscope
[7] or micro-endoscope [4] to achieve high spatial resolution.
Finally, our tissue scanner combines DRS and IFS with spectral
modeling to provide a more complete, quantitative assessment of
the metabolic, biochemical and morphological state of tissue and, as
a result, a more robust tissue diagnosis than can be achieved with
either modality alone or by using the purely statistical algorithms for
disease diagnosis currently used in some reflectance and fluores-
cence imaging systems.
Clinical translation will require more exhaustive evaluation of
our current tissue scanner via larger scale intraoperative clinical
studies of tissue specimens from patients with breast cancer and
solid tumors in other organ systems. For the broadest possible
clinical application, including intraoperative assessment of breast
margins, it is desirable to improve imaging speed. Nevertheless, we
believe that there is a significant need for a wide field, high
resolution tissue scanner for intra-operative margin assessment
that operates within the current temporal regime. In other words,
while we plan to incorporate minor hardware and software
changes to our instrument in the near future, the current system
can be used for a wide variety of clinical investigations, particularly
in solid tumors in organs other than the breast. Indeed, breast
cancer margin assessment may represent the worst-case scenario
with respect to time required for image acquisition, as the margins
of breast surgical specimens are significantly larger than the
margins of surgical specimens from other organs. These surgical
margins are often less than 7.5 cm65 cm in area and can be
Table 2. T-test of the null hypothesis that means of normal and cancer DRS/IFS parameters are not equal.
Fitting Parameter h (99%) p Value Confidence Interval tstat Value Degree of Freedom Pooled Sample SD
A 1 0 [ 0.1872–0.2250 ] 28.1151 11496 0.3882
B 1 0 [20.5644–(20.5201) ] 263.0668 8933 0.4062
C 1 0 [ 0.1453–0.1686 ] 44.3469 9623 0.1662
Hb 1 0 [21.1695–(20.7850) ] 219.7833 11368 2.597
b-carotene 1 0 [ 0.0004–0.0017 ] 3.9941 10795 0.0129
Collagen 1 0 [223.4554–(219.79) ] 230.3962 9845 34.4264
NADH 1 0.0079 [ 0.0281–1.8752 ] 2.6558 3462 8.695
doi:10.1371/journal.pone.0030887.t002
Figure 9. DRS-IFS Diagnostic Algorithm. Scatter plot of decision algorithm using DRS b-carotene and IFS collagen parameters for selectiveregions in normal and cancer breast tissues (A); Diagnostic map of normal and breast cancer tissues using the decision algorithm (B). Please note that:1) regions denoted as cancer at the border of the grossly cancerous and normal tissues (white arrows) are most likely an artifact due to inadvertentgaps between the two tissues; and 2) regions denoted as cancer at the outer edges of the tissues (black arrows) are most likely due to the presence ofblack colloidal ink applied to the margin of the surgical specimen prior to harvesting for research use.doi:10.1371/journal.pone.0030887.g009
Optical Fiber Probe Spectroscopic Tissue Scanner
PLoS ONE | www.plosone.org 9 January 2012 | Volume 7 | Issue 1 | e30887
imaged in less than 5 minutes with the improvements. Clearly,
smaller surgical margins in organs other than the breast
considerably reduce the time required for spectral acquisition
and image analysis.
Never-the-less, in order to further reduce image acquisition
time, we plan to incorporate both hardware and software changes.
Currently, only one of the collection fibers in the optical fiber
probe is coupled to the spectrograph. Prior to embarking on large
scale clinical studies, we plan to couple all 6 collection fibers
available in the existing optical fiber probe to the spectrograph.
The circular array of collection fibers surrounding the excitation
fiber at the proximal end of the probe will be converted into a
linear array at the distal end of the probe, much as in our other
clinical spectroscopy systems [10–11], which will align with the
fiber array on a simple 2-D spectrograph with built-in CCD. With
this configuration, we can image up to 6 separate tissue sites
simultaneously. This change will not significantly increase
instrument complexity or cost, and will provide up to a 6-fold
reduction in imaging time. Further, we will incorporate state-of-
the-art chemometrics and machine learning algorithms to allow
real time processing of the spectral data. These hardware and
software strategies combined should significantly reduce the time
required to scan the margins of surgical specimens, render a
diagnosis of margin status (positive or negative) and provide
feedback to the surgeon. Finally, while our current tissue scanner
provides powerful hyperspectral capabilities with spectral resolu-
tion of ,2 nm, such resolution may not be necessary for all cancer
diagnostics applications. Relaxation of the spectral resolution
constraint can give rise to interesting design possibilities focusing
on particular spectral features of interest. Such an approach is
likely to lead to a substantial reduction in imaging time, instrument
size and the overall cost of future tissue scanner systems.
We anticipate that the current tissue scanner system can be
readily extended to provide real-time comprehensive assessment of
surgical margins in excised tissue specimens, overcoming the
sampling limitation in current histopathology margin assessment.
This device is an important step in the development of a platform
technology for intraoperative management of cancer, a clinical
problem that has been inadequately addressed to date.
Acknowledgments
We would like to acknowledge the patient who contributed the tissue
sample to this project.
Author Contributions
Conceived and designed the experiments: NL JWK C-CY RD M.Feld
M.Fitzmaurice. Performed the experiments: NL. Analyzed the data: NL
JWK M.Fitzmaurice. Contributed reagents/materials/analysis tools: IB
ND M.Fitzmaurice. Wrote the paper: NL JWK C-CY RD M.Fitzmaurice.
References
1. McLaughlin SA, Ochoa-Frongia LM, Patil SM, Cody HS, Sclafani LM (2008)
Influence of frozen-section analysis of sentinel lymph node and lumpectomymargin status on reoperation rates in patients undergoing breast-conservation
therapy. J Am Coll Surg 206(1): 76–82.2. Rowell NP (2010) Are mastectomy resection margins of clinical relevance? A
systematic review. Breast 19(1): 14–22.3. Brown JQ, Vishwanath K, Palmer GM, Ramanujam N (2009) Advances in
quantitative UV-visible spectroscopy for clinical and pre-clinical application in
cancer. Curr Opin Biotechnol 20(1): 119–131.4. Kennedy S, Mueller J, Bydlon T, Brown JQ, Ramanujam N (2011) Using wide-
field quantitative diffuse reflectance spectroscopy in combination with high-resolution imaging for margin assessment. Proc SPIE 7890, 78900C.
5. Lin ZJ, Alexandrakis G, Patel N, Shen J, Tang L, et al. (2009) Time gated
optical imaging to detect positive prostate cancer margins. Proc SPIE 7161:716119.
6. Yu CC, Lau C, O’Donoghue G, Mirkovic J, McGee S, et al. (2008) Quantitativespectroscopic imaging for non-invasive early cancer detection. Opt Express 16(20):
16227–16239.7. Krishnaswamy V, Hoopes PJ, Samkoe KS, O’Hara JA, Hasan T, et al. (2009)
Quantitative imaging of scattering changes associated with epithelial prolifer-
ation, necrosis, and fibrosis in tumors using microsampling reflectancespectroscopy. J Biomed Opt 14(1): 014004.
8. Bydlon TM, Kennedy SA, Richards LM, Brown JQ, Yu B, et al. (2010)Performance metrics of an optical spectral imaging system for intra-operative
assessment of breast tumor margins. Opt Express 18(8): 8058–8076.
9. Keller MD, Majumder SK, Kelley MC, Meszoely IM, Boulos FI, et al. (2010)Autofluorescence and Diffuse Reflectance Spectroscopy and Spectral Imaging
for Breast Surgical Margin Analysis. Lasers Surg Med 42(1): 15–23.10. Tunnell JW, Desjardins AE, Galindo L, Georgakoudi I, McGee SA, et al. (2003)
Instrumentation for multimodal spectroscopic diagnosis of epithelial dysplasia.
Technol Cancer Res Treat 2(6): 505–514.11. Scepanovic OR, Volynskaya Z, Kong CR, Galindo LH, Dasari RR, et al. (2009)
A multimodal spectroscopy system for real-time disease diagnosis. Rev SciInstrum 80(4): 043103.
12. McGee S, Mardirossian V, Elackattu A, Mirkovic J, Pistey R, et al. (2009)
Anatomy-based algorithms for detecting oral cancer using reflectance andfluorescence spectroscopy. Ann Otol Rhinol Laryngol 118(11): 817–826.
13. Georgakoudi I, Feld MS (2004) The combined use of fluorescence, reflectance,and light-scattering spectroscopy for evaluating dysplasia in Barrett’s esophagus.
Gastrointest Endosc Clin N Am 14(3): 519–537.14. Mirkovic J, Lau C, McGee S, Yu CC, Nazemi J, et al. (2009) Effect of anatomy
on spectroscopic detection of cervical dysplasia. J Biomed Opt 14(4): 044021.
15. Volynskaya Z, Haka AS, Bechtel KL, Fitzmaurice M, Shenk R, et al. (2008)Diagnosis of Breast Cancer Using Diffusive Reflectance and Intrinsic
Fluorescence Spectroscopy. J Biomed Opt 13(2): 024012.16. Zonios G, Perelman LT, Backman VM, Manoharan R, Fitzmaurice M, et al.
(1999) Diffuse reflectance spectroscopy of human adenomatous colon polyps in
vivo. Appl Opt 38(31): 6628–6637.17. Zhang Q, Muller MG, Wu J, Feld MS (2000) Turbidity free fluorescence
spectroscopy of biological tissue. Opt Letters 25(19): 1451–1453.18. Mueller MG, Georgakoudi I, Zhang Q, Wu J, Feld MS (2001) Intrinsic
fluorescence spectroscopy in turbid media: disentangling effects of scattering andabsorption. Appl Opt 40(25): 4633–4646.
19. Barman I, Dingari NC, Rajaram N, Tunnell JW, Dasari RR, et al. (2011) Rapid
and accurate determination of tissue optical properties using least-squaressupport vector machines. Biomed Opt Express 2(3): 592–599.
20. Rajaram N, Nguyen TH, Tunnell JW (2008) Lookup table-based inversemodelfor determining optical properties of turbid media. J Biomed Opt 13(5): 050501.
21. Chauchard F, Roussel S, Roger JM, Bellon-Maurel V, Abrahamsson C, et al.
(2005) Least-squares support vector machines modelization for time-resolvedspectroscopy. Appl Opt 44(33): 7091–7097.
22. Cai TT, Zhang D, Ben-Amotz D (2001) Enhanced chemical classification ofRamanimages using multiresolution wavelet transformation. Appl Spect 55(9):
1124–1130.
23. Smith SW The Scientist and Engineer’s Guide to Digital Signal Processing 2ndEdition, California Techical Pub. San Diego. pp 426–428.
24. Backman V, Wallace MB, Perelman LT, Arendt JT, Gurjar R, et al. (2000)Detection of preinvasive cancer cells. Nature 406(6791): 35–36.
Optical Fiber Probe Spectroscopic Tissue Scanner
PLoS ONE | www.plosone.org 10 January 2012 | Volume 7 | Issue 1 | e30887