Population genetic structure of New Zealand's endemic corophiid amphipods: evidence for allopatric...
15
Biological Journal of the Linnean Society, 2004, 81, 119–133. With 3 figures © 2004 The Linnean Society of London, Biological Journal of the Linnean Society, 2004, 81, 119–133 119 Blackwell Science, LtdOxford, UKBIJBiological Journal of the Linnean Society0024-4066The Linnean Society of London, 2003? 2003 811 119133 Original Article POPULATION GENETIC STRUCTURE OF NEW ZEALAND AQUATIC AMPHIPODS M. I. STEVENS and I. D. HOGG *Corresponding author. Current address: Allan Wilson Centre for Molecular Ecology and Evolution, Massey University Pri- vate Bag 11-222, Palmerston North, New Zealand. E-mail: [email protected] Population genetic structure of New Zealand’s endemic corophiid amphipods: evidence for allopatric speciation MARK I. STEVENS* and IAN D. HOGG Centre for Biodiversity and Ecology Research, Department of Biological Sciences, University of Waikato, Private Bag 3105, Hamilton, New Zealand Received 2 January 2003; accepted for publication 28 July 2003 Allozyme electrophoresis was used to examine population genetic structure at inter- and intraspecific levels for the New Zealand endemic corophiid amphipods, Paracorophium lucasi and P. excavatum. Individuals were collected from estuarine and freshwater habitats from North, South and Chatham Islands. Analyses of genetic structure among interspecific populations indicated clear allelic differentiation between the two Paracorophium species (Nei’s genetic distance, D = 1.62), as well as considerable intraspecific substructuring (D = 0.15–0.65). These levels of diver- gence are similar to interspecific levels for other amphipods and it is proposed that at least two groups from the P. lucasi complex and three from the P. excavatum complex correspond to sibling species. In most cases allopatry can account for the differentiation among the putative sibling species. For populations that share a common coastline we found low levels of differentiation and little or no correlation with geographical distance, suggesting that gene flow is adequate to maintain homogeneous population genetic structure. By contrast, populations on separate coastlines (i.e. isolated by land) showed moderate levels of geographical differentiation indicating restricted gene flow. The jux- taposition of population genetic and biogeographical data for Paracorophium in conjunction with the geological record infers past histories of glacial extirpation, and possible isolating effects of sea-level and landmass changes that have occurred throughout the Plio-Pleistocene. © 2004 The Linnean Society of London, Biological Journal of the Linnean Society, 2004, 81, 119–133. ADDITIONAL KEYWORDS: allozyme – glaciation – isolation-by-distance – Paracorophium – Pleistocene – Pliocene – sibling species. INTRODUCTION The isolation of populations, both geographically and genetically, has long been recognized as a potential mechanism conducive to speciation (Kimura, 1953; Mayr, 1954; Avise, 1992). Geographically isolated taxa with limited dispersal capabilities are particularly susceptible to microevolutionary processes (Mayr, 1954; Templeton, 1980). This is especially evident on islands where populations tend to become isolated from the main distributions, both in terrestrial and aquatic systems (Slatkin, 1993). For aquatic inverte- brates large genetic divergences and/or a positive rela- tionship between geographical and genetic distances often occur, albeit with little morphological variation (e.g. Knowlton et al., 1993; Väinölä, 1995; Taylor, Finston & Hebert, 1998; Dawson, 2001). Fortunately, molecular techniques have in recent years made it possible to investigate how distributions of morpholog- ically similar populations may be linked to geograph- ical isolation and/or a taxon’s dispersal capability (e.g. Avise, 1992; Hellberg, 1996; Parker et al., 1998). For taxa with limited dispersal, small or temporary geographical barriers may be sufficient to isolate pop- ulations. For example, the emergence of the Isthmus of Panama has been considered a major isolating bar- rier for the marine shrimp Alpheus, leading to the evo- lution of sibling species by the isolation of populations between the Caribbean and eastern Pacific (Knowlton et al., 1993). In addition, ocean circulation has been found to correspond to phylogeographical breaks among populations of marine taxa between the Cali- fornian and Oregonian coastal regions (Dawson, 2001;
Transcript of Population genetic structure of New Zealand's endemic corophiid amphipods: evidence for allopatric...
Biological Journal of the Linnean Society, 2004, 81, 119–133. With 3 figures
© 2004 The Linnean Society of London, Biological Journal of the Linnean Society, 2004, 81, 119–133 119
Blackwell Science, LtdOxford, UKBIJBiological Journal of the Linnean Society0024-4066The Linnean Society of London, 2003? 2003811119133Original Article
POPULATION GENETIC STRUCTURE OF NEW ZEALAND AQUATIC AMPHIPODSM. I. STEVENS and I. D. HOGG
*Corresponding author. Current address: Allan Wilson Centre for Molecular Ecology and Evolution, Massey University Pri-vate Bag 11-222, Palmerston North, New Zealand. E-mail: [email protected]
Population genetic structure of New Zealand’s endemic corophiid amphipods: evidence for allopatric speciation
MARK I. STEVENS* and IAN D. HOGG
Centre for Biodiversity and Ecology Research, Department of Biological Sciences, University of Waikato, Private Bag 3105, Hamilton, New Zealand
Received 2 January 2003; accepted for publication 28 July 2003
Allozyme electrophoresis was used to examine population genetic structure at inter- and intraspecific levels for theNew Zealand endemic corophiid amphipods, Paracorophium lucasi and P. excavatum. Individuals were collectedfrom estuarine and freshwater habitats from North, South and Chatham Islands. Analyses of genetic structureamong interspecific populations indicated clear allelic differentiation between the two Paracorophium species (Nei’sgenetic distance, D = 1.62), as well as considerable intraspecific substructuring (D = 0.15–0.65). These levels of diver-gence are similar to interspecific levels for other amphipods and it is proposed that at least two groups from theP. lucasi complex and three from the P. excavatum complex correspond to sibling species. In most cases allopatry canaccount for the differentiation among the putative sibling species. For populations that share a common coastline wefound low levels of differentiation and little or no correlation with geographical distance, suggesting that gene flowis adequate to maintain homogeneous population genetic structure. By contrast, populations on separate coastlines(i.e. isolated by land) showed moderate levels of geographical differentiation indicating restricted gene flow. The jux-taposition of population genetic and biogeographical data for Paracorophium in conjunction with the geologicalrecord infers past histories of glacial extirpation, and possible isolating effects of sea-level and landmass changesthat have occurred throughout the Plio-Pleistocene. © 2004 The Linnean Society of London, Biological Journal ofthe Linnean Society, 2004, 81, 119–133.
ADDITIONAL KEYWORDS: allozyme – glaciation – isolation-by-distance – Paracorophium – Pleistocene –Pliocene – sibling species.
INTRODUCTION
The isolation of populations, both geographically andgenetically, has long been recognized as a potentialmechanism conducive to speciation (Kimura, 1953;Mayr, 1954; Avise, 1992). Geographically isolated taxawith limited dispersal capabilities are particularlysusceptible to microevolutionary processes (Mayr,1954; Templeton, 1980). This is especially evident onislands where populations tend to become isolatedfrom the main distributions, both in terrestrial andaquatic systems (Slatkin, 1993). For aquatic inverte-brates large genetic divergences and/or a positive rela-tionship between geographical and genetic distances
often occur, albeit with little morphological variation(e.g. Knowlton et al., 1993; Väinölä, 1995; Taylor,Finston & Hebert, 1998; Dawson, 2001). Fortunately,molecular techniques have in recent years made itpossible to investigate how distributions of morpholog-ically similar populations may be linked to geograph-ical isolation and/or a taxon’s dispersal capability (e.g.Avise, 1992; Hellberg, 1996; Parker et al., 1998).
For taxa with limited dispersal, small or temporarygeographical barriers may be sufficient to isolate pop-ulations. For example, the emergence of the Isthmusof Panama has been considered a major isolating bar-rier for the marine shrimp Alpheus, leading to the evo-lution of sibling species by the isolation of populationsbetween the Caribbean and eastern Pacific (Knowltonet al., 1993). In addition, ocean circulation has beenfound to correspond to phylogeographical breaksamong populations of marine taxa between the Cali-fornian and Oregonian coastal regions (Dawson, 2001;
120 M. I. STEVENS and I. D. HOGG
© 2004 The Linnean Society of London, Biological Journal of the Linnean Society, 2004, 81, 119–133
Edmands, 2001; Wares, Gaines & Cunningham, 2001).Such isolating oceanographic processes have also beeninvoked to explain high levels of genetic substructur-ing and cryptic species among populations of theamphipod Talitrus saltator in the Mediterranean Sea(De Matthaeis et al., 2000). Similarly, genetic subdivi-sion of the greenshell mussel Perna canaliculus (Apte& Gardner, 2002) and of the corophiid amphipod Para-corophium excavatum (Schnabel, Hogg & Chapman,2000) also suggest that coastal currents may be bar-riers to present-day gene flow in New Zealand. Inaddition, the turbulent geological history of NewZealand has been implicated as a potential agent formorphological as well as genetic differentiation of taxa(Craw, 1988; Pole, 1989; Trewick, 2000a; Trewick &Wallis, 2001; Wallis et al., 2001).
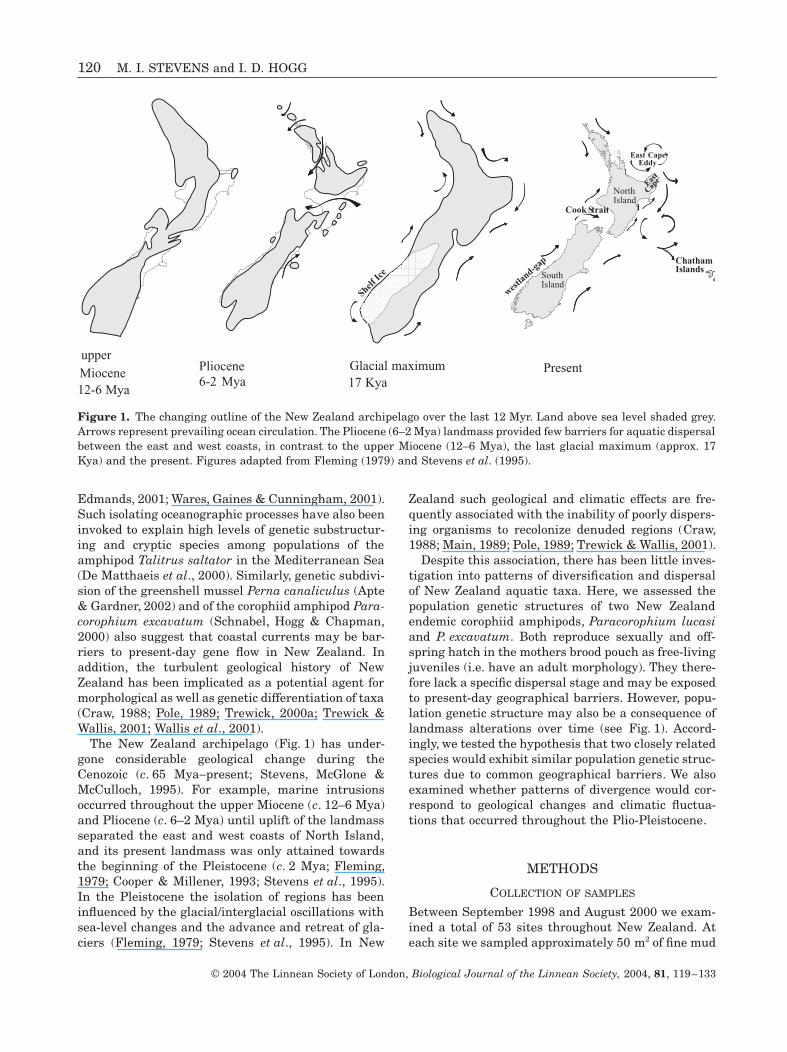
The New Zealand archipelago (Fig. 1) has under-gone considerable geological change during theCenozoic (c. 65 Mya-present; Stevens, McGlone &McCulloch, 1995). For example, marine intrusionsoccurred throughout the upper Miocene (c. 12–6 Mya)and Pliocene (c. 6–2 Mya) until uplift of the landmassseparated the east and west coasts of North Island,and its present landmass was only attained towardsthe beginning of the Pleistocene (c. 2 Mya; Fleming,1979; Cooper & Millener, 1993; Stevens et al., 1995).In the Pleistocene the isolation of regions has beeninfluenced by the glacial/interglacial oscillations withsea-level changes and the advance and retreat of gla-ciers (Fleming, 1979; Stevens et al., 1995). In New
Zealand such geological and climatic effects are fre-quently associated with the inability of poorly dispers-ing organisms to recolonize denuded regions (Craw,1988; Main, 1989; Pole, 1989; Trewick & Wallis, 2001).
Despite this association, there has been little inves-tigation into patterns of diversification and dispersalof New Zealand aquatic taxa. Here, we assessed thepopulation genetic structures of two New Zealandendemic corophiid amphipods, Paracorophium lucasiand P. excavatum. Both reproduce sexually and off-spring hatch in the mothers brood pouch as free-livingjuveniles (i.e. have an adult morphology). They there-fore lack a specific dispersal stage and may be exposedto present-day geographical barriers. However, popu-lation genetic structure may also be a consequence oflandmass alterations over time (see Fig. 1). Accord-ingly, we tested the hypothesis that two closely relatedspecies would exhibit similar population genetic struc-tures due to common geographical barriers. We alsoexamined whether patterns of divergence would cor-respond to geological changes and climatic fluctua-tions that occurred throughout the Plio-Pleistocene.
METHODS
COLLECTION OF SAMPLES
Between September 1998 and August 2000 we exam-ined a total of 53 sites throughout New Zealand. Ateach site we sampled approximately 50 m2 of fine mud
Figure 1. The changing outline of the New Zealand archipelago over the last 12 Myr. Land above sea level shaded grey.Arrows represent prevailing ocean circulation. The Pliocene (6–2 Mya) landmass provided few barriers for aquatic dispersalbetween the east and west coasts, in contrast to the upper Miocene (12–6 Mya), the last glacial maximum (approx. 17Kya) and the present. Figures adapted from Fleming (1979) and Stevens et al. (1995).
L1
NorthIsland
SouthIsland
upperMiocene12-6 Mya
L1
NorthIsland
SouthIsland
Pliocene6-2 Mya
Glacial maximum17 Kya
ShelfIc
e
Present
L1
ChathamIslands
NorthIsland
SouthIsland
NorthIsland
East
Cape
Cook Strait
westlan
d-gap
East CapeEddy
POPULATION GENETIC STRUCTURE OF NEW ZEALAND AQUATIC AMPHIPODS 121
© 2004 The Linnean Society of London, Biological Journal of the Linnean Society, 2004, 81, 119–133
and sand by passing a meshed (2 mm) net through thesuperficial sediment (upper 30–50 mm), and live-sorting for Paracorophium spp. In addition to the twoendemic Paracorophium (P. lucasi and P. excavatum)we included the exotic P. brisbanensis as an outgrouptaxon collected from a single site in Tauranga Harbour(N8) (Fig. 2). Species determination used the diagnos-
tic characters suggested by Chapman et al. (2002),and for P. brisbanensis we used Chapman (2002) andStevens, Hogg & Chapman (2002). All individualsused for allozyme analyses were flash-frozen in liquidnitrogen and stored at -76∞C. Sites were codedaccording to geographical location to indicate commoncoastline or habitat type, for example NE = North
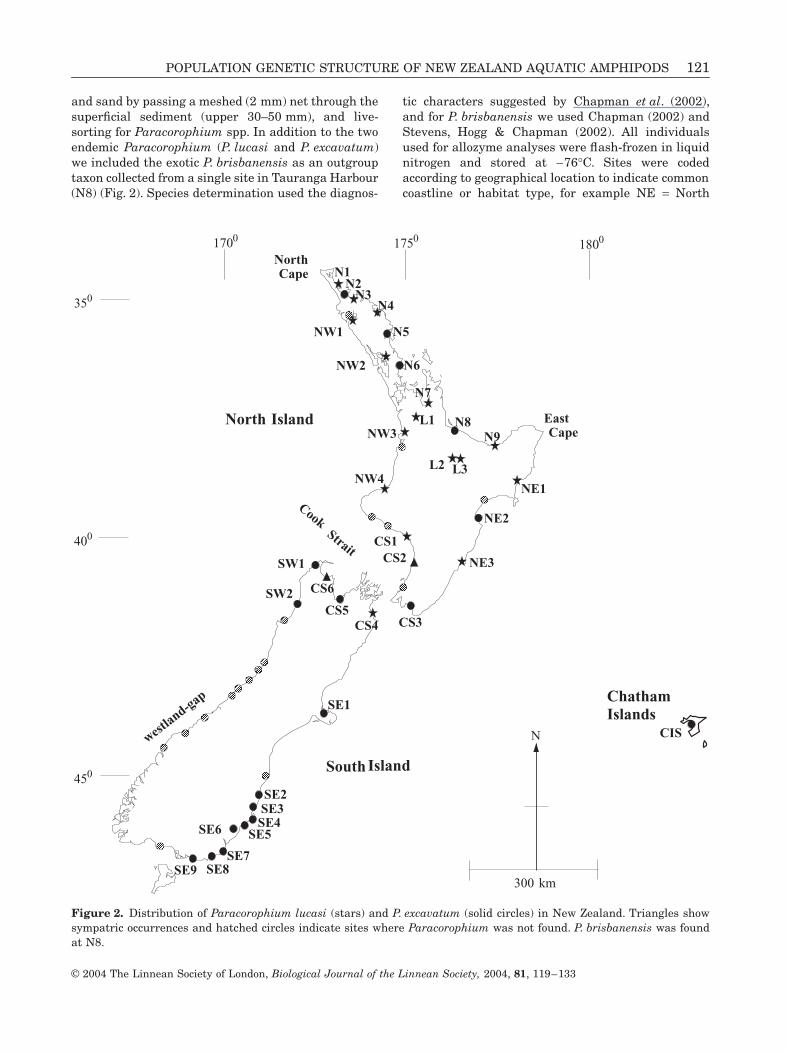
Figure 2. Distribution of Paracorophium lucasi (stars) and P. excavatum (solid circles) in New Zealand. Triangles showsympatric occurrences and hatched circles indicate sites where Paracorophium was not found. P. brisbanensis was foundat N8.
350
400
450
1700 1750 1800
300 km
N
L2 L3
L1
N5
N8
N6
N4
N1N2
N3
N9
N7
North Island
South Island
ChathamIslands
NW1
NW2
NW3
NW4
CS1
NE1
NE2
NE3
CS3
CS2
CS5
CS6
CS4
SW1
SW2
SE1
SE2SE3SE4
SE5SE6
SE7SE8SE9
CIS
CookStrait
EastCape
NorthCape
westland-gap
122 M. I. STEVENS and I. D. HOGG
© 2004 The Linnean Society of London, Biological Journal of the Linnean Society, 2004, 81, 119–133
Island, east coast; SW = South Island, west coast; CS= Cook Strait; and L = Lake.
ALLOZYME ELECTROPHORESIS
We used cellulose acetate electrophoresis to assess lev-els of genetic differentiation among populations (Rich-ardson, Baverstock & Adams, 1986; Hebert & Beaton,1993). Individual specimens were homogenized in14 mL of distilled water and 10 enzyme systems wereused that revealed sufficient activity and resolution tobe reliably scored for Paracorophium (Stevens et al.,2002): aldehyde oxidase (AO: EC 1.2.3.1); argininekinase (ARK: EC 2.7.3.3); glyceraldehyde-3-phosphatedehydrogenase (G3PDH: EC 1.2.1.12); isocitrate dehy-drogenase (IDH: EC 1.1.1.42); lactate dehydrogenase(LDH: EC 1.1.1.27); mannose-6-phosphate isomerase(MPI: EC 5.3.1.8); malate dehydrogenase NADP+ (ME:EC 1.1.1.40); peptidase (PEP: EC 3.4.11/13); phospho-glucomutase (PGM: EC 5.4.2.2); 6-phosphogluconatedehydrogenase (6PGDH: EC 1.1.1.44). Two enzymes(IDH, LDH) were coded by two loci designated numer-ically in order of increasing electrophoretic mobility(e.g. IDH-1, IDH-2). Alleles were designated by the rel-ative differences in anodal mobility of the respectivegene products, i.e. the ‘fastest’ allele was designated ‘A’,the next fastest allele ‘B’, and so on. We detectedbetween 3 and 7 alleles for the loci examined. Two indi-viduals from previous runs were re-run on subsequentgels to control for any variation in mobility between gelplates, and putative novel alleles were verified usinggel line-ups (sensu Richardson et al., 1986).
DATA ANALYSES
BIOSYS-1 (Swofford & Selander, 1981) was used tocalculate descriptive and hierarchical population sta-tistics. Genotypic frequencies were determined foreach population, and polymorphic loci (95% criterion)were examined for agreement of genotypes withHardy–Weinberg (H–W) equilibrium using Fisher’sexact test, followed by sequential Bonferroni correc-tions (Rice, 1989). Divergence was assessed amongpopulations using Wright’s (1978) FST, and amongindividuals in a single population (FIS). Significance ofpairwise comparisons of FST (bootstrapping across lociwith 5000 replicates) was used to pool some popula-tions for P. excavatum only when homogeneous popu-lation genetic structure could be inferred. Preliminaryanalyses of the phenetic relationships among popula-tions used several algorithms (e.g. Roger’s similarity,Cavalli-Sforza & Edwards arc and cord distances,Nei’s distance and identity) and various methods (e.g.Wagner network, neighbour-joining, multidimen-sional scaling) which all revealed identical topologies.Here, we present a hierarchical cluster analysis per-
formed using UPGMA (Sneath & Sokal, 1973) calcu-lated using Nei’s (1978) unbiased genetic distance (D)chosen on the basis of goodness of fit statistics (i.e.cophenetic correlation = 0.904).
Isolation-by-distance (I-D) analyses were performedto examine geographical differentiation among popu-lations (Wright, 1943; Kimura & Weiss, 1964; Slatkin,1993). We performed a regression of log transformedpairwise genetic and geographical (aquatic) distances(logD and logkm, respectively), and calculated ordi-nary least squares regression coefficients (R2) (Kimura& Weiss, 1964; Felsenstein, 1976; Slatkin, 1993; Hell-berg, 1996). Spearman’s rank correlation index (R)was used to test how much of the allelic varianceamong populations could be explained by geographicaldistance alone (De Matthaeis et al., 2000). SPSS (ver.10) for Windows was used for these analyses.
RESULTS
GEOGRAPHIC DISTRIBUTION
Paracorophium was found throughout New Zealandwaters (Fig. 2). P. lucasi was collected from 18 sites,P. excavatum from 21; we were unable to find eitherspecies at a further 17. Both species were found alongthe east coast of North Island and the coastal regionsof Cook Strait. Only P. lucasi was found on the westcoast of North Island, and P. excavatum on the westand east coasts of South Island and Chatham Island.We did not find either species on most of the west coastof South Island.
ALLOZYME VARIATION
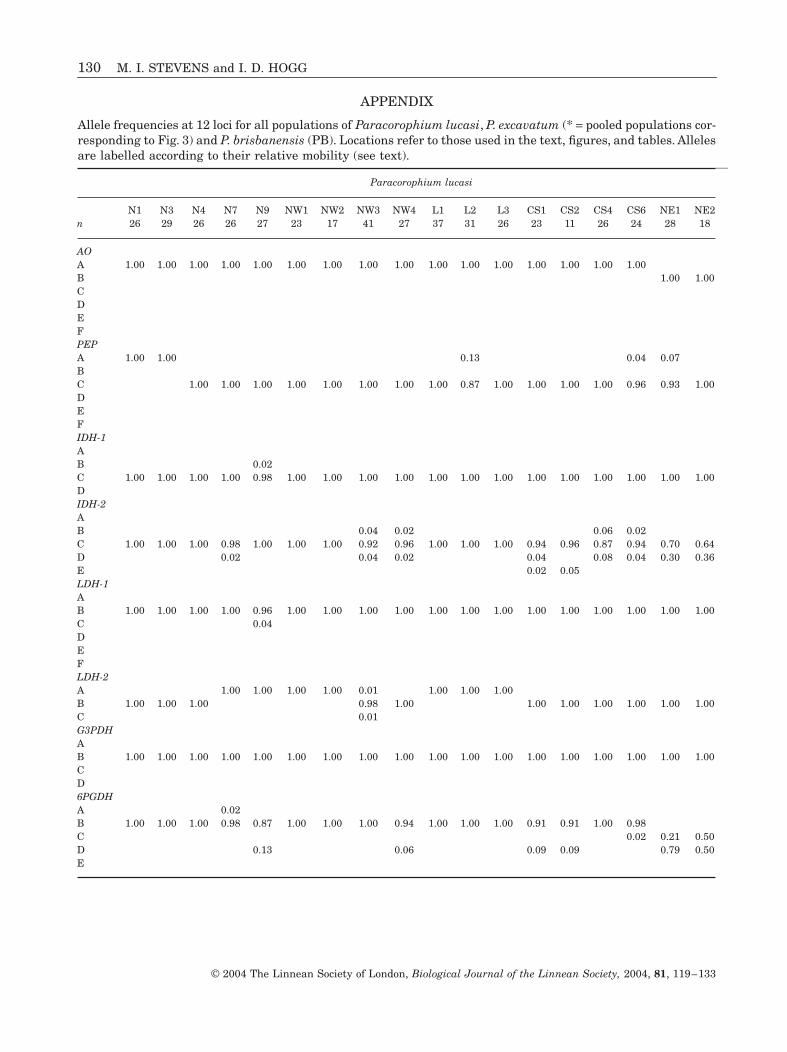
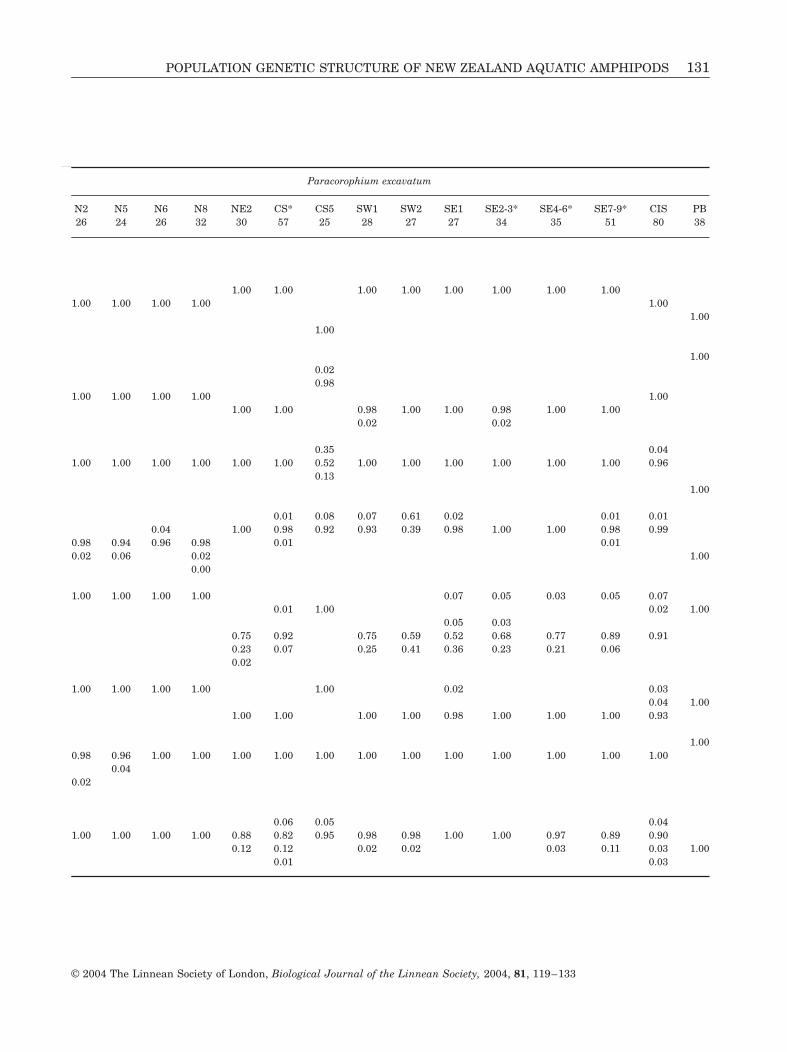
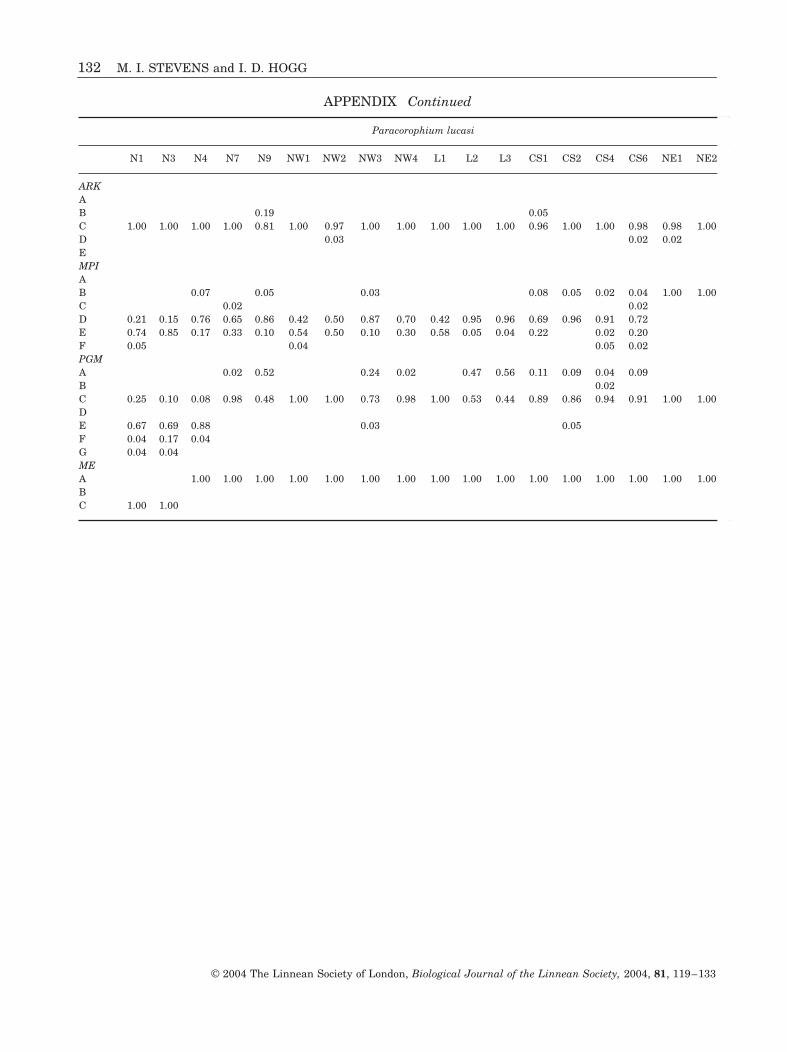
Several diagnostic alleles were identified that couldreliably distinguish between the three Paracorophiumspecies (see Appendix): A and B (AO locus) were diag-nostic for P. lucasi, C, D and F (AO) and A (LDH-1) forP. excavatum, and E (AO), A (G3PDH) and B (IDH-1)for P. brisbanensis (only a single population). Themean number of alleles per locus/polymorphic locuswas 1.5/2.6 for P. lucasi, and 1.6/2.8 for P. excavatum,while the percentage of polymorphic loci (95% crite-rion) was 23.5% and 31.6%, respectively; mean het-erozygosities were similar (Table 1). For P. lucasi,significant deviations from H-W equilibrium weredetected at ARK for N9, at 6PGDH for NE1 and NE3and at PEP for NE1 and L2 (all heterozygote deficien-cies). For P. excavatum, genotypic frequencies devi-ated from H-W at ARK for N8, at MPI for N6, NE2,CS3, SE8 and CIS, and at LDH-1 for CS6, SE5, SW1and SW2 of Cook Strait and South Island. ChathamIslands (CIS) had genotypic frequencies deviatingfrom H-W at LDH-2 and 6PGDH and one Cook Straitpopulation (CS5) at IDH-1.
POPULATION GENETIC STRUCTURE OF NEW ZEALAND AQUATIC AMPHIPODS 123
© 2004 The Linnean Society of London, Biological Journal of the Linnean Society, 2004, 81, 119–133
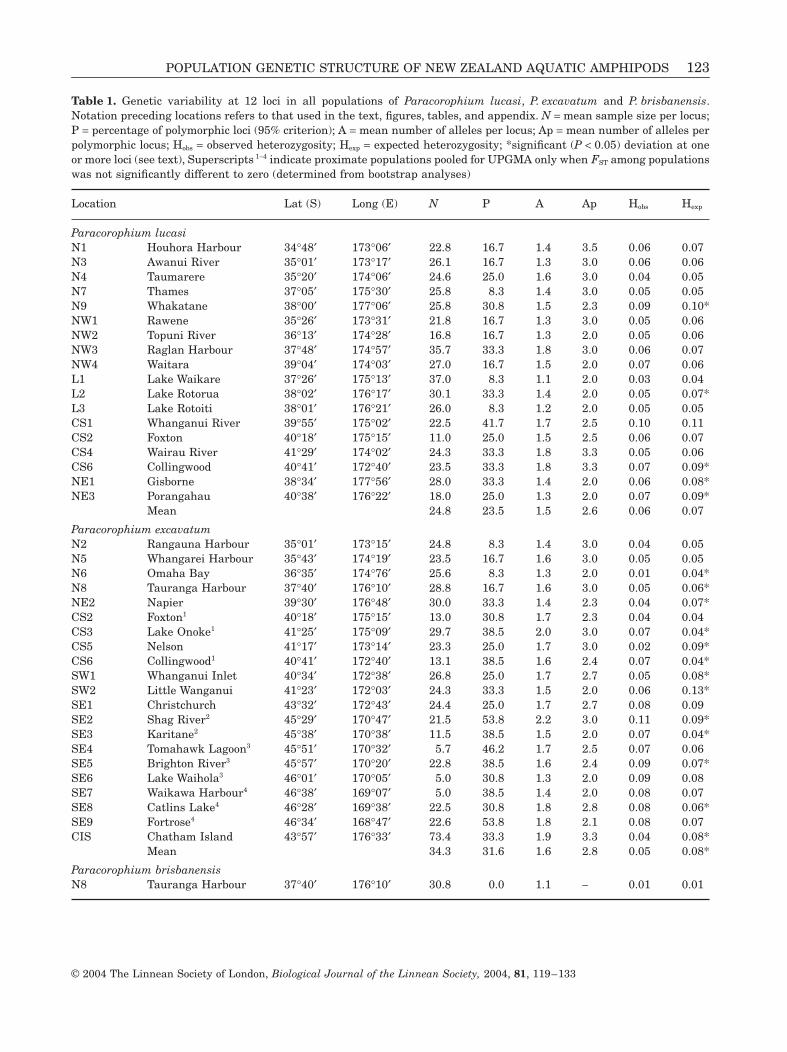
Table 1. Genetic variability at 12 loci in all populations of Paracorophium lucasi, P. excavatum and P. brisbanensis.Notation preceding locations refers to that used in the text, figures, tables, and appendix. N = mean sample size per locus;P = percentage of polymorphic loci (95% criterion); A = mean number of alleles per locus; Ap = mean number of alleles perpolymorphic locus; Hobs = observed heterozygosity; Hexp = expected heterozygosity; *significant (P < 0.05) deviation at oneor more loci (see text), Superscripts 1-4 indicate proximate populations pooled for UPGMA only when FST among populationswas not significantly different to zero (determined from bootstrap analyses)
Location Lat (S) Long (E) N P A Ap Hobs Hexp
Paracorophium lucasiN1 Houhora Harbour 34∞48¢ 173∞06¢ 22.8 16.7 1.4 3.5 0.06 0.07N3 Awanui River 35∞01¢ 173∞17¢ 26.1 16.7 1.3 3.0 0.06 0.06N4 Taumarere 35∞20¢ 174∞06¢ 24.6 25.0 1.6 3.0 0.04 0.05N7 Thames 37∞05¢ 175∞30¢ 25.8 8.3 1.4 3.0 0.05 0.05N9 Whakatane 38∞00¢ 177∞06¢ 25.8 30.8 1.5 2.3 0.09 0.10*NW1 Rawene 35∞26¢ 173∞31¢ 21.8 16.7 1.3 3.0 0.05 0.06NW2 Topuni River 36∞13¢ 174∞28¢ 16.8 16.7 1.3 2.0 0.05 0.06NW3 Raglan Harbour 37∞48¢ 174∞57¢ 35.7 33.3 1.8 3.0 0.06 0.07NW4 Waitara 39∞04¢ 174∞03¢ 27.0 16.7 1.5 2.0 0.07 0.06L1 Lake Waikare 37∞26¢ 175∞13¢ 37.0 8.3 1.1 2.0 0.03 0.04L2 Lake Rotorua 38∞02¢ 176∞17¢ 30.1 33.3 1.4 2.0 0.05 0.07*L3 Lake Rotoiti 38∞01¢ 176∞21¢ 26.0 8.3 1.2 2.0 0.05 0.05CS1 Whanganui River 39∞55¢ 175∞02¢ 22.5 41.7 1.7 2.5 0.10 0.11CS2 Foxton 40∞18¢ 175∞15¢ 11.0 25.0 1.5 2.5 0.06 0.07CS4 Wairau River 41∞29¢ 174∞02¢ 24.3 33.3 1.8 3.3 0.05 0.06CS6 Collingwood 40∞41¢ 172∞40¢ 23.5 33.3 1.8 3.3 0.07 0.09*NE1 Gisborne 38∞34¢ 177∞56¢ 28.0 33.3 1.4 2.0 0.06 0.08*NE3 Porangahau 40∞38¢ 176∞22¢ 18.0 25.0 1.3 2.0 0.07 0.09*
Mean 24.8 23.5 1.5 2.6 0.06 0.07
Paracorophium excavatumN2 Rangauna Harbour 35∞01¢ 173∞15¢ 24.8 8.3 1.4 3.0 0.04 0.05N5 Whangarei Harbour 35∞43¢ 174∞19¢ 23.5 16.7 1.6 3.0 0.05 0.05N6 Omaha Bay 36∞35¢ 174∞76¢ 25.6 8.3 1.3 2.0 0.01 0.04*N8 Tauranga Harbour 37∞40¢ 176∞10¢ 28.8 16.7 1.6 3.0 0.05 0.06*NE2 Napier 39∞30¢ 176∞48¢ 30.0 33.3 1.4 2.3 0.04 0.07*CS2 Foxton1 40∞18¢ 175∞15¢ 13.0 30.8 1.7 2.3 0.04 0.04CS3 Lake Onoke1 41∞25¢ 175∞09¢ 29.7 38.5 2.0 3.0 0.07 0.04*CS5 Nelson 41∞17¢ 173∞14¢ 23.3 25.0 1.7 3.0 0.02 0.09*CS6 Collingwood1 40∞41¢ 172∞40¢ 13.1 38.5 1.6 2.4 0.07 0.04*SW1 Whanganui Inlet 40∞34¢ 172∞38¢ 26.8 25.0 1.7 2.7 0.05 0.08*SW2 Little Wanganui 41∞23¢ 172∞03¢ 24.3 33.3 1.5 2.0 0.06 0.13*SE1 Christchurch 43∞32¢ 172∞43¢ 24.4 25.0 1.7 2.7 0.08 0.09SE2 Shag River2 45∞29¢ 170∞47¢ 21.5 53.8 2.2 3.0 0.11 0.09*SE3 Karitane2 45∞38¢ 170∞38¢ 11.5 38.5 1.5 2.0 0.07 0.04*SE4 Tomahawk Lagoon3 45∞51¢ 170∞32¢ 5.7 46.2 1.7 2.5 0.07 0.06SE5 Brighton River3 45∞57¢ 170∞20¢ 22.8 38.5 1.6 2.4 0.09 0.07*SE6 Lake Waihola3 46∞01¢ 170∞05¢ 5.0 30.8 1.3 2.0 0.09 0.08SE7 Waikawa Harbour4 46∞38¢ 169∞07¢ 5.0 38.5 1.4 2.0 0.08 0.07SE8 Catlins Lake4 46∞28¢ 169∞38¢ 22.5 30.8 1.8 2.8 0.08 0.06*SE9 Fortrose4 46∞34¢ 168∞47¢ 22.6 53.8 1.8 2.1 0.08 0.07CIS Chatham Island 43∞57¢ 176∞33¢ 73.4 33.3 1.9 3.3 0.04 0.08*
Mean 34.3 31.6 1.6 2.8 0.05 0.08*
Paracorophium brisbanensisN8 Tauranga Harbour 37∞40¢ 176∞10¢ 30.8 0.0 1.1 - 0.01 0.01
124 M. I. STEVENS and I. D. HOGG
© 2004 The Linnean Society of London, Biological Journal of the Linnean Society, 2004, 81, 119–133
POPULATION GENETIC STRUCTURE
Genetic differentiation (Wright’s (1978) FST) averaged0.66 among all P. lucasi populations and 0.70 amongP. excavatum, indicating low levels of gene flow forboth species. High levels of intrapopulation substruc-turing were indicated by high FIS values forP. excavatum (mean = 0.48), but less so for P. lucasi(mean = 0.15) (Table 2).
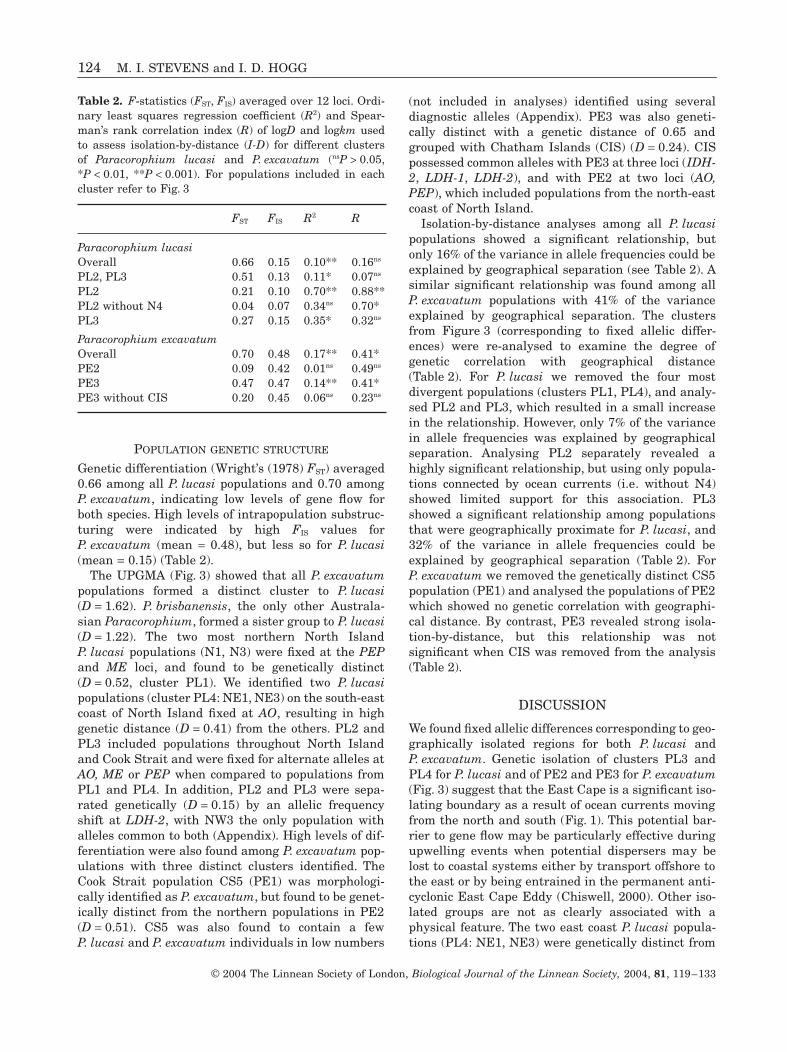
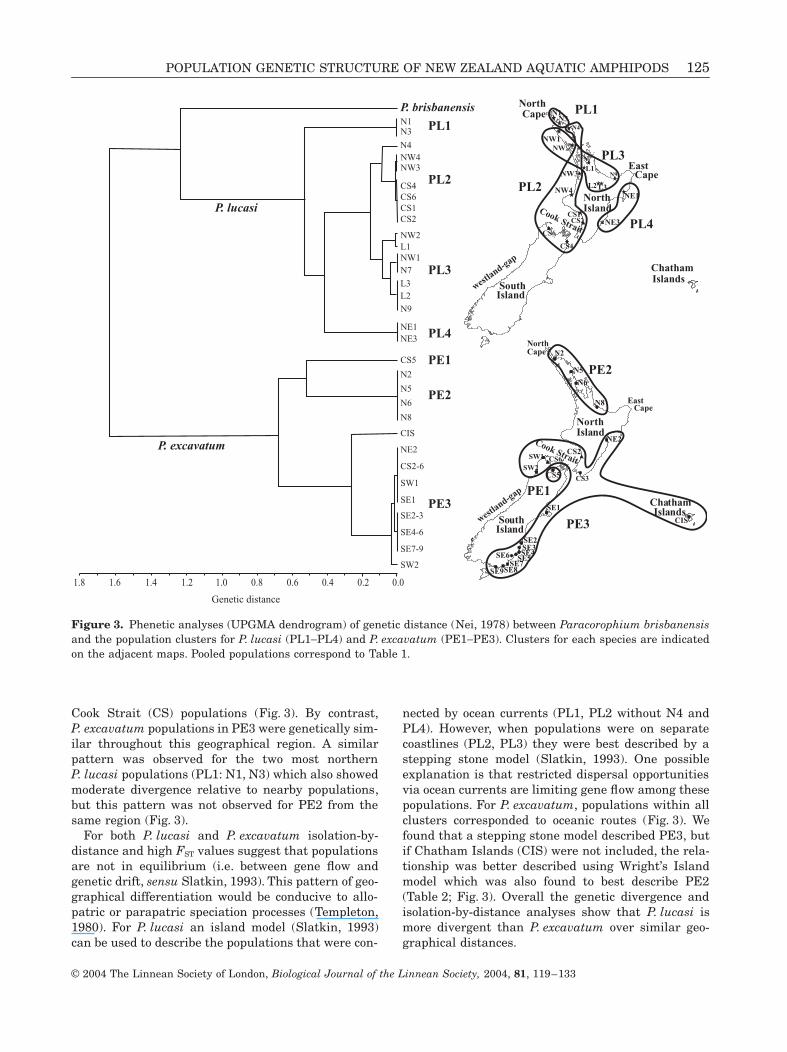
The UPGMA (Fig. 3) showed that all P. excavatumpopulations formed a distinct cluster to P. lucasi(D = 1.62). P. brisbanensis, the only other Australa-sian Paracorophium, formed a sister group to P. lucasi(D = 1.22). The two most northern North IslandP. lucasi populations (N1, N3) were fixed at the PEPand ME loci, and found to be genetically distinct(D = 0.52, cluster PL1). We identified two P. lucasipopulations (cluster PL4: NE1, NE3) on the south-eastcoast of North Island fixed at AO, resulting in highgenetic distance (D = 0.41) from the others. PL2 andPL3 included populations throughout North Islandand Cook Strait and were fixed for alternate alleles atAO, ME or PEP when compared to populations fromPL1 and PL4. In addition, PL2 and PL3 were sepa-rated genetically (D = 0.15) by an allelic frequencyshift at LDH-2, with NW3 the only population withalleles common to both (Appendix). High levels of dif-ferentiation were also found among P. excavatum pop-ulations with three distinct clusters identified. TheCook Strait population CS5 (PE1) was morphologi-cally identified as P. excavatum, but found to be genet-ically distinct from the northern populations in PE2(D = 0.51). CS5 was also found to contain a fewP. lucasi and P. excavatum individuals in low numbers
(not included in analyses) identified using severaldiagnostic alleles (Appendix). PE3 was also geneti-cally distinct with a genetic distance of 0.65 andgrouped with Chatham Islands (CIS) (D = 0.24). CISpossessed common alleles with PE3 at three loci (IDH-2, LDH-1, LDH-2), and with PE2 at two loci (AO,PEP), which included populations from the north-eastcoast of North Island.
Isolation-by-distance analyses among all P. lucasipopulations showed a significant relationship, butonly 16% of the variance in allele frequencies could beexplained by geographical separation (see Table 2). Asimilar significant relationship was found among allP. excavatum populations with 41% of the varianceexplained by geographical separation. The clustersfrom Figure 3 (corresponding to fixed allelic differ-ences) were re-analysed to examine the degree ofgenetic correlation with geographical distance(Table 2). For P. lucasi we removed the four mostdivergent populations (clusters PL1, PL4), and analy-sed PL2 and PL3, which resulted in a small increasein the relationship. However, only 7% of the variancein allele frequencies was explained by geographicalseparation. Analysing PL2 separately revealed ahighly significant relationship, but using only popula-tions connected by ocean currents (i.e. without N4)showed limited support for this association. PL3showed a significant relationship among populationsthat were geographically proximate for P. lucasi, and32% of the variance in allele frequencies could beexplained by geographical separation (Table 2). ForP. excavatum we removed the genetically distinct CS5population (PE1) and analysed the populations of PE2which showed no genetic correlation with geographi-cal distance. By contrast, PE3 revealed strong isola-tion-by-distance, but this relationship was notsignificant when CIS was removed from the analysis(Table 2).
DISCUSSION
We found fixed allelic differences corresponding to geo-graphically isolated regions for both P. lucasi andP. excavatum. Genetic isolation of clusters PL3 andPL4 for P. lucasi and of PE2 and PE3 for P. excavatum(Fig. 3) suggest that the East Cape is a significant iso-lating boundary as a result of ocean currents movingfrom the north and south (Fig. 1). This potential bar-rier to gene flow may be particularly effective duringupwelling events when potential dispersers may belost to coastal systems either by transport offshore tothe east or by being entrained in the permanent anti-cyclonic East Cape Eddy (Chiswell, 2000). Other iso-lated groups are not as clearly associated with aphysical feature. The two east coast P. lucasi popula-tions (PL4: NE1, NE3) were genetically distinct from
Table 2. F-statistics (FST, FIS) averaged over 12 loci. Ordi-nary least squares regression coefficient (R2) and Spear-man’s rank correlation index (R) of logD and logkm usedto assess isolation-by-distance (I-D) for different clustersof Paracorophium lucasi and P. excavatum (nsP > 0.05,*P < 0.01, **P < 0.001). For populations included in eachcluster refer to Fig. 3
FST FIS R2 R
Paracorophium lucasiOverall 0.66 0.15 0.10** 0.16ns
PL2, PL3 0.51 0.13 0.11* 0.07ns
PL2 0.21 0.10 0.70** 0.88**PL2 without N4 0.04 0.07 0.34ns 0.70*PL3 0.27 0.15 0.35* 0.32ns
Paracorophium excavatumOverall 0.70 0.48 0.17** 0.41*PE2 0.09 0.42 0.01ns 0.49ns
PE3 0.47 0.47 0.14** 0.41*PE3 without CIS 0.20 0.45 0.06ns 0.23ns
POPULATION GENETIC STRUCTURE OF NEW ZEALAND AQUATIC AMPHIPODS 125
© 2004 The Linnean Society of London, Biological Journal of the Linnean Society, 2004, 81, 119–133
Cook Strait (CS) populations (Fig. 3). By contrast,P. excavatum populations in PE3 were genetically sim-ilar throughout this geographical region. A similarpattern was observed for the two most northernP. lucasi populations (PL1: N1, N3) which also showedmoderate divergence relative to nearby populations,but this pattern was not observed for PE2 from thesame region (Fig. 3).
For both P. lucasi and P. excavatum isolation-by-distance and high FST values suggest that populationsare not in equilibrium (i.e. between gene flow andgenetic drift, sensu Slatkin, 1993). This pattern of geo-graphical differentiation would be conducive to allo-patric or parapatric speciation processes (Templeton,1980). For P. lucasi an island model (Slatkin, 1993)can be used to describe the populations that were con-
nected by ocean currents (PL1, PL2 without N4 andPL4). However, when populations were on separatecoastlines (PL2, PL3) they were best described by astepping stone model (Slatkin, 1993). One possibleexplanation is that restricted dispersal opportunitiesvia ocean currents are limiting gene flow among thesepopulations. For P. excavatum, populations within allclusters corresponded to oceanic routes (Fig. 3). Wefound that a stepping stone model described PE3, butif Chatham Islands (CIS) were not included, the rela-tionship was better described using Wright’s Islandmodel which was also found to best describe PE2(Table 2; Fig. 3). Overall the genetic divergence andisolation-by-distance analyses show that P. lucasi ismore divergent than P. excavatum over similar geo-graphical distances.
Figure 3. Phenetic analyses (UPGMA dendrogram) of genetic distance (Nei, 1978) between Paracorophium brisbanensisand the population clusters for P. lucasi (PL1-PL4) and P. excavatum (PE1-PE3). Clusters for each species are indicatedon the adjacent maps. Pooled populations correspond to Table 1.
N2
South Island
SE5SO3SE7
SE9
South Island
SE6
SE8
N5
N8
N6
North Isla nd NE2
CS3
CS2
CS5
SW1
SW2
SE1
SE3SE4
Cook Strait
North Island
CS6
SE2
PE1
PE2
PE3
North Cape
Chatham Islands
CIS
Chatham Islands
South IslandSouth Island
L2 L3
L1
N4
N1
N9
N7
NW1NW2
NW3
NW4
CS1
NE1
NE3CS2
CS6
CS4
North Island
L2 L3
L1
N3
N7East
Cape
Cook Strait
North Island
PL1
PL3
PL2
PL4
North Cape
P. brisbanensis
PE3
PE2
PE1
PL4
PL2
PL3
PL1
NE1NE3
N1N3
N4NW4NW3
NW1
CS4
CS2CS1CS6
L3L2N9
N7
NE2
SE1
N2
SE7-9
SW1
SW2
SE4-6
CS5
CS2-6
SE2-3
N8
N5
N6
CIS
Genetic distance
P. lucasi
P. excavatum
NW2L1
0.00.20.40.60.81.01.4 1.21.8 1.6
westland-gap
westland-gap
East Cape
126 M. I. STEVENS and I. D. HOGG
© 2004 The Linnean Society of London, Biological Journal of the Linnean Society, 2004, 81, 119–133
Colonization via oceanic surface currents is possi-ble, and this mode of transport has been implicated forthe occurrence of a number of Chatham Islands taxawith affinities to both North and South Island (Knox,1954; Craw, 1988; Emberson, 1995; Trewick, 2000b).For P. lucasi, it may be possible to explain the rela-tionship of N4 to PL2, and for NW1 and NW2 to PL3by overland dispersal (Fig. 3). Such overland trans-port may be possible by waterfowl which have beenimplicated as vectors for many small aquatic organ-isms (e.g. Rosine, 1956; Maguire, 1959).
Long-term extrinsic barriers to gene flow have beendescribed for marine taxa along the Californian andOregonian coastal regions (Dawson, 2001; Edmands,2001; Wares, Gaines, & Cunningham, 2001). Simi-larly, in New Zealand Apte & Gardner (2002) haverevealed that ocean currents and eddies are sufficientisolating barriers among greenshell mussel (Pernacanaliculus) populations. Schnabel et al. (2000) alsosuggested that the patterns of ocean circulationaround New Zealand were the most likely barriers togene flow for Paracorophium. Because ocean currentsare generally described as a mean (averaged over timeand space) they indicate the dominant surface circu-lation. However, surface and coastal currents arehighly variable and often affected by prevailing windpatterns (Roemmich & Sutton, 1998; Chiswell, 2000).Limited data on Paracorphium (Ford, Thrush & Prob-ert, 1999; Stevens et al., 2002) have shown that juve-niles are abundant in the water column and are proneto being flushed out of bays and estuaries during tidalflows. Accordingly, dispersal among neighbouring pop-ulations may only be successful during times of rare orperiodical climatic events, such as an ENSO (El Niñoand southern oscillation), which results in intenserainfall and increased sea surface temperatures (Tom-czak & Godfrey, 1994). Our data suggest that dispersalat greater distances is less likely where significantgeographical barriers exist (e.g. North Cape and EastCape).
SPECIATION THROUGH ALLOPATRIC ISOLATION
We found no evidence to indicate that recent hybridscan occur between P. lucasi and P. excavatum from thetwo sympatric occurrences in the present study (CS2,CS6) and no hybrids were found among the threeParacorophium species at Tauranga Harbour (N8)(Stevens et al., 2002). The single Cook Strait popula-tion from PE1 (CS5) was found to have allelic similar-ities at some loci to all three species. In addition, a fewP. lucasi and P. excavatum individuals were foundwithin the CS5 population; their sympatric occurrencesuggests the presence of three reproductively isolatedspecies. The degree of reproductive isolation amongother clusters is uncertain in the absence of sympatry.
However, for both P. lucasi and P. excavatum the levelsof genetic divergence within each taxon are likely tocorrespond to sibling species that have divergedthrough allopatric isolation.
Similar levels of divergence have been found amongmorphologically distinct species of the talidrid amphi-pod Orchestia (D = 0.51–0.59) (Conceição, Bishop &Thorpe, 1998; De Matthaeis et al., 2000) and are sim-ilar to reported divergence among congeneric speciesof other Crustacea (Hedgecock, Tracey & Nelson,1982; Stewart, 1993; Thorpe & Solé-Cava, 1994). Suchpatterns may also explain, to a lesser extent, thegenetic similarity of P. excavatum on CIS to southernpopulations from PE3 (Fig. 3). However, common alle-les with the northern cluster PE2 may reveal commonancestry. The level of divergence between CIS and PE3(Fig. 3) is consistent with Campbell’s (1998) hypothe-sis that the Chatham Islands were totally submergedless than 4 Mya. The divergence of one Cook Straitpopulation (CS5) may suggest an older coalescence inthe Miocene. One possibility is that this populationwas isolated in a lake prior to the separation of Northand South Island, but now has access to the coast dueto the intrusion of seawater in the strait (Fig. 1). Thedegree of divergence among the sibling species forParacorophium suggests that these groups were iso-lated well before the Pleistocene glaciations, and aremore likely to have origins in the Pliocene or Miocene.
An increased rate of speciation followed by a highrate of extinction has been hypothesized for NewZealand terrestrial biota during the Oligocene (Coo-per & Cooper, 1995). For aquatic taxa, we suggestthat an increase in land surface during the Mioceneisolated east and west coastal regions, leading tomany populations becoming extinct or locallyrestricted. Subsequent range expansion/overlap mayhave occurred during the Pliocene when more fre-quent east–west exchange among populations wouldhave been possible (Fig. 1). During the Pliocene, tec-tonic changes altered New Zealand from a collectionof islands to the two main islands present today(Fleming, 1979; Craw, 1988; Cooper & Cooper, 1995;Stevens et al., 1995; Campbell, 1998). It is apparentthat the Pleistocene glaciations, sea-level changesand Pliocene landmass alterations were agents fordivergence in several New Zealand terrestrial taxa(Craw, 1988; Trewick & Wallis, 2001 and referencestherein). For Paracorophium, we suggest that thepresence of ephemeral islands throughout thePliocene for the New Zealand landmass may haveallowed for more frequent aquatic dispersal. Substan-tial barriers to aquatic east–west dispersal may havearisen towards the beginning of the Pleistocene(c. 2 Mya) once the present-day New Zealand land-mass formed. However, some some east–west dis-persal may have been possible during interglacial
POPULATION GENETIC STRUCTURE OF NEW ZEALAND AQUATIC AMPHIPODS 127
© 2004 The Linnean Society of London, Biological Journal of the Linnean Society, 2004, 81, 119–133
periods due to an increase in sea-level (Fleming,1979; Stevens et al., 1995).
The advance and retreat of glaciers and fluctuatingsea-level has also had a considerable influence on thedistribution, abundance and diversity of taxa in NewZealand (e.g. Fleming, 1979; Craw, 1988; Wardle,1991). Much of the west coast was covered by sea-iceduring the last glacial maximum (c. 17 Kya) (Stevenset al., 1995) (Fig. 1), and the inability of poorly dis-persing organisms to recolonize such denuded regionsis especially evident (Main, 1989; McDowall, 1997).The westland-gap constitutes an area of the west coastof South Island that lacks beech forest between 42∞30¢and 43∞30¢S (Wardle, 1991). Paracorophium wasabsent from the westland-gap (see Fig. 2) and mayprovide support for the effects of Pleistocene climateconditions. Re-colonization via oceanic dispersal to thesouth appears unlikely during the present interglacialwith the prevailing ocean current flowing northwardalong this coastline (Fig. 1). However, we found no evi-dence to suggest that divergence was promoted overthe last 2 Myr as a consequence of the Pleistocene cli-matic fluctuations.
CONCLUSION
We suggest that P. lucasi and P. excavatum are speciescomplexes consisting of genetically distinct siblingspecies. Such genetic patterns are likely to reflect geo-logical isolation that has occurred since the Miocene.In addition, climatic shifts throughout the Pleistocenemay have restricted the distribution of Paracoroph-ium, particularly in the westland-gap. With no larvalstage, dispersal opportunities may be greatly reducedwhere geographical barriers are concerned. In par-ticular, geological formations and the patterns ofpresent-day ocean currents may be sufficient to isolatepopulations. With limited gene flow among biogeo-graphical regions throughout New Zealand the appar-ent fragmentation of an ancestral gene pool suggeststhat allopatric speciation has played an important rolein the origin of taxon diversity for New Zealandcorophiid amphipods.
ACKNOWLEDGEMENTS
We thank C. E. C. Gemmill, J. D. S. Witt, S. A. Trewickand an anonymous reviewer for comments on themanuscript, and M. A. Chapman, N. Loussert, P. Will-mann-Huerner, K. E. Schnabel and J. L. Laboyrie forassistance in the field. This study was funded in partby a grant from the New Zealand Lotteries Board toI. D. H. and a University of Waikato doctoral scholar-ship to M. I. S.
REFERENCES
Apte S, Gardner JPA. 2002. Population genetic subdivisionin the New Zealand greenshell mussel (Perna canaliculus)inferred from single-strand conformation polymorphismanalysis of mitochondrial DNA. Molecular Ecology 11: 1617–1628.
Avise JC. 1992. Molecular population structure and the bio-geographic history of a regional fauna: a case history withlessons for conservation. Oikos 63: 62–76.
Campbell HJ. 1998. Fauna and flora of the Chatham Islands:less than 4m.y. old? Geology and Genes. Geological Society ofNew Zealand, Misc. Publ. 97: 15–16.
Chapman MA. 2002. Australasian species of Paracorophium(Crustacea, Amphipoda): the separate identities of P. exca-vatum (Thomson, 1884) and P. brisbanensis sp.nov. Journalof the Royal Society of New Zealand 32: 203–228.
Chapman MA, Hogg ID, Schnabel KE, Stevens MI.2002. Synonymy of the New Zealand corophiid amphipodgenus, Chaetocorophium Karaman, 1979, with Para-corophium Stebbing, 1899: morphological and genetic evi-dence. Journal of the Royal Society of New Zealand 32:229–241.
Chiswell SM. 2000. The Wairarapa coastal current. NewZealand Journal of Marine and Freshwater Research 34:303–315.
Conceição MB, Bishop JDD, Thorpe JP. 1998. Geneticrelationships between ecologically divergent species of tal-itrid amphipod (Crustacea). Marine Ecology Progress Series165: 225–233.
Cooper A, Cooper RA. 1995. The Oligocene bottleneck andNew Zealand biota: genetic record of a past environmentalcrisis. Proceedings of the Royal Society of London B 261: 293–302.
Cooper RA, Millener PR. 1993. The New Zealand biota: his-torical background and new research. Trends in Ecology andEvolution 8: 429–433.
Craw R. 1988. Continuing the synthesis between panbio-geography, phylogenetic systematics and geology as illus-trated by empirical studies on the biogeography of NewZealand and the Chatham Islands. Systematic Zoology 37:291–310.
Dawson MN. 2001. Phylogeography in coastal marine ani-mals: a solution from California? Journal of Biogeography28: 723–736.
De Matthaeis E, Davolos D, Cobolli M, Ketmailer V. 2000.Isolation by distance in equilibrium and nonequilibrium pop-ulations of four Talidrid species in the Mediterranean Sea.Evolution 54: 1606–1613.
Edmands S. 2001. Phylogeography of the intertidal copepodTigriopus californicus reveals substantially reduced popula-tion differentiation at northern latitudes. Molecular Ecology10: 1743–1750.
Emberson RM. 1995. The Chathams Islands beetle fauna andthe age of separation of the Chatham Islands from NewZealand. New Zealand Entomology 18: 1–7.
Felsenstein J. 1976. The theoretical population genetics ofvariable selection and migration. Annual Review of Genetics10: 253–280.
128 M. I. STEVENS and I. D. HOGG
© 2004 The Linnean Society of London, Biological Journal of the Linnean Society, 2004, 81, 119–133
Fleming CA. 1979. The geological history of New Zealand andits life. Auckland: Auckland University Press.
Ford RB, Thrush SF, Probert PK. 1999. Macrobenthic col-onisation of disturbances on an intertidal sandflat: the influ-ence of season and buried algae. Marine Ecology ProgressSeries 120: 163–174.
Hebert PDN, Beaton MJ. 1993. Methodologies for allozymeanalysis using cellulose acetate electrophoresis. Beaumont,Texas: Helena Laboratories.
Hedgecock D, Tracey ML, Nelson K. 1982. Evolutionarydivergence and speciation. In: Bliss DE, ed. The biology ofCrustacea, Vol. 2. New York: Academic Press, 339–347.
Hellberg ME. 1996. Dependence of gene flow on geographicdistance in two solitary corals with different larval dispersalcapabilities. Evolution 50: 1167–1175.
Kimura M. 1953. ‘Stepping Stone’ model of population.Annual Report National Institute of Genetics (Japan) 3: 62–63.
Kimura M, Weiss GH. 1964. The stepping stone model of pop-ulation structures and the decrease of genetic correlationwith distance. Genetics 49: 561–576.
Knowlton N, Weigt LA, Solórzano LA, Mills DK, Ber-mingham E. 1993. Divergence in proteins, mitochondrialDNA, and reproductive compatibility across the Isthmus ofPanama. Science 260: 1629–1632.
Knox GA. 1954. The intertidal flora and fauna of the ChathamIslands. Nature 174: 871–873.
Maguire B. 1959. Passive overland transport of small aquaticorganisms. Ecology 40: 312.
Main MR. 1989. Distribution and post-glacial dispersal offreshwater fishes in South Westland, New Zealand. Journalof the Royal Society of New Zealand 19: 161–169.
Mayr E. 1954. Change of genetic environment and evolution.In: Huxley J, Ford EB, eds. Evolution as a process. London:Allen & Unwin, 157–180.
McDowall RM. 1997. Indigenous vegetation type and the dis-tribution of shortjawed kokopu, Galaxias postvectis (Teleo-stei, Galaxiidae), in New Zealand. New Zealand Journal ofZoology 24: 243–255.
Nei M. 1978. Estimation of average heterozygosity and geneticdistance from a small number of individuals. Genetics 89:583–590.
Parker PG, Snow A, Schug MD, Booton GC, Fuerst PA.1998. What molecules can tell us about populations: choos-ing and using a molecular marker. Ecology 79: 361–382.
Pole M. 1989. Early Miocene floras from Central Otago, NewZealand. Journal of the Royal Society of New Zealand 19:121–125.
Rice WR. 1989. Analyzing tables of statistical tests. Evolution43: 223–225.
Richardson BJ, Baverstock PR, Adams M. 1986. Allozymeelectrophoresis: a handbook of animal systematics and pop-ulation studies. New York: Academic Press.
Roemmich D, Sutton P. 1998. The mean and variability ofocean circulation past northern New Zealand: determiningthe representativeness of hydrographic climatologies. Jour-nal of Geophysical Research 103: 13041–13054.
Rosine W. 1956. On the transport of the common amphi-
pod, Hyalella azteca, in South Dakota by the mallard duck.Proceedings of the South Dakota Academy of Sciences 35:203.
Schnabel KE, Hogg ID, Chapman MA. 2000. Populationgenetic structure of two New Zealand corophiid amphi-pods and the presence of morphologically cryptic species:implications for the conservation of diversity. NewZealand Journal of Marine and Freshwater Research 34:637–644.
Slatkin M. 1993. Isolation by distance in equilibrium and non-equilibrium populations. Evolution 47: 264–279.
Sneath PHA, Sokal RR. 1973. Numerical taxonomy. SanFrancisco: W. H. Freeman.
Stevens MI, Hogg ID, Chapman MA. 2002. Corophiidamphipods in Tauranga Harbour, New Zealand: evidence ofan Australian crustacean invader. Hydrobiologia 474: 147–154.
Stevens G, McGlone M, McCulloch B. 1995. PrehistoricNew Zealand. Auckland: Reed Publishing.
Stewart BA. 1993. The use of protein electrophoresis fordetermining species boundaries in amphipods. Crustaceana65: 265–277.
Swofford DL, Selander RB. 1981. BIOSYS-1: a FORTRANprogram for the comprehensive analysis of electrophoreticdata in population genetics and systematics. Journal ofHeredity 72: 281–283.
Taylor DJ, Finston TL, Hebert PDN. 1998. Biogeography ofa widespread freshwater crustacean: pseudocongruence andcryptic endemism in the North American Daphnia laeviscomplex. Evolution 52: 1648–1670.
Templeton AR. 1980. Modes of speciation and inferencesbased on genetic distances. Evolution 34: 719–729.
Thorpe JP, Solé-Cava AM. 1994. The use of allozyme elec-trophoresis in invertebrate systematics. Zoologica Scripta23: 3–18.
Tomczak M, Godfrey JS. 1994. Regional oceanography: anintroduction. London: Elsevier.
Trewick SA. 2000a. Mitochondrial DNA sequences supportallozyme evidence for cryptic radiation of New ZealandPeripatoides (Onychophora). Molecular Ecology 9: 269–281.
Trewick SA. 2000b. Molecular evidence for dispersal ratherthan vicariance as the origin of flightless insect species onthe Chatham Islands, New Zealand. Journal of Biogeogra-phy 27: 1189–1200.
Trewick SA, Wallis GP. 2001. Bridging the ‘beech-gap’: NewZealand invertebrate phylogeography implicates Pleis-tocene glaciation and Pliocene isolation. Evolution 55:2170–2180.
Väinölä R. 1995. Origin and recent endemic divergence of aCaspian Mysis species flock with affinities to the ‘GlacialRelict’ crustaceans in boreal lakes. Evolution 49: 1215–1223.
Wallis GP, Bland J, Judge KF, Waters JM, Berra TM.2001. Genetic diversity in New Zealand Galaxias vulgarissensu lato (Teleostei: Osmeriformes: Galaxiidae): a test of abiogeographic hypothesis. Journal of Biogeography 28: 59–68.
POPULATION GENETIC STRUCTURE OF NEW ZEALAND AQUATIC AMPHIPODS 129
© 2004 The Linnean Society of London, Biological Journal of the Linnean Society, 2004, 81, 119–133
Wardle P. 1991. Vegetation of New Zealand. Cambridge: Cam-bridge University Press..
Wares JP, Gaines SD, Cunningham CW. 2001. A compar-ative study of asymmetric migration events across a marinebiogeographic boundary. Evolution 55: 295–306.
Wright S. 1943. Isolation by distance. Genetics 28: 139–156.
Wright S. 1978. Evolution and the genetics of populations, Vol.4. Variability within and among natural populations. Chi-cago: University of Chicago Press.
130 M. I. STEVENS and I. D. HOGG
© 2004 The Linnean Society of London, Biological Journal of the Linnean Society, 2004, 81, 119–133
Paracorophium lucasi
N1 N3 N4 N7 N9 NW1 NW2 NW3 NW4 L1 L2 L3 CS1 CS2 CS4 CS6 NE1 NE2n 26 29 26 26 27 23 17 41 27 37 31 26 23 11 26 24 28 18
AOA 1.00 1.00 1.00 1.00 1.00 1.00 1.00 1.00 1.00 1.00 1.00 1.00 1.00 1.00 1.00 1.00B 1.00 1.00CDEFPEPA 1.00 1.00 0.13 0.04 0.07BC 1.00 1.00 1.00 1.00 1.00 1.00 1.00 1.00 0.87 1.00 1.00 1.00 1.00 0.96 0.93 1.00DEFIDH-1AB 0.02C 1.00 1.00 1.00 1.00 0.98 1.00 1.00 1.00 1.00 1.00 1.00 1.00 1.00 1.00 1.00 1.00 1.00 1.00DIDH-2AB 0.04 0.02 0.06 0.02C 1.00 1.00 1.00 0.98 1.00 1.00 1.00 0.92 0.96 1.00 1.00 1.00 0.94 0.96 0.87 0.94 0.70 0.64D 0.02 0.04 0.02 0.04 0.08 0.04 0.30 0.36E 0.02 0.05LDH-1AB 1.00 1.00 1.00 1.00 0.96 1.00 1.00 1.00 1.00 1.00 1.00 1.00 1.00 1.00 1.00 1.00 1.00 1.00C 0.04DEFLDH-2A 1.00 1.00 1.00 1.00 0.01 1.00 1.00 1.00B 1.00 1.00 1.00 0.98 1.00 1.00 1.00 1.00 1.00 1.00 1.00C 0.01G3PDHAB 1.00 1.00 1.00 1.00 1.00 1.00 1.00 1.00 1.00 1.00 1.00 1.00 1.00 1.00 1.00 1.00 1.00 1.00CD6PGDHA 0.02B 1.00 1.00 1.00 0.98 0.87 1.00 1.00 1.00 0.94 1.00 1.00 1.00 0.91 0.91 1.00 0.98C 0.02 0.21 0.50D 0.13 0.06 0.09 0.09 0.79 0.50E
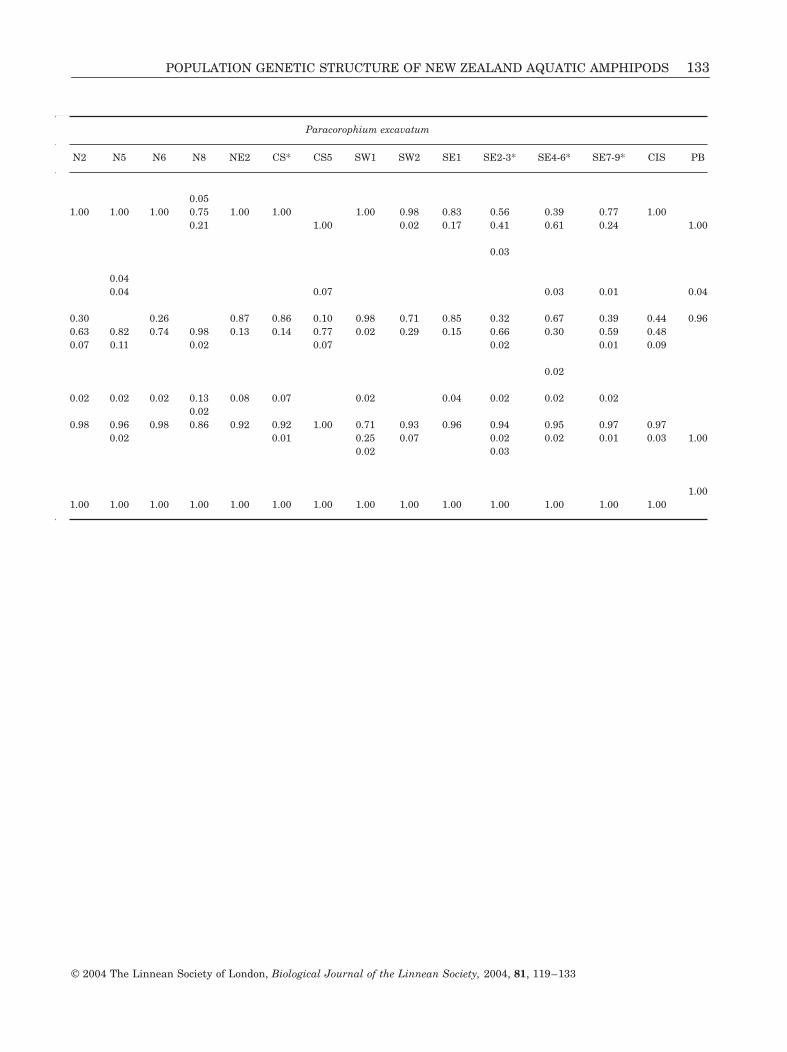
APPENDIX
Allele frequencies at 12 loci for all populations of Paracorophium lucasi, P. excavatum (* = pooled populations cor-responding to Fig. 3) and P. brisbanensis (PB). Locations refer to those used in the text, figures, and tables. Allelesare labelled according to their relative mobility (see text).
POPULATION GENETIC STRUCTURE OF NEW ZEALAND AQUATIC AMPHIPODS 131
© 2004 The Linnean Society of London, Biological Journal of the Linnean Society, 2004, 81, 119–133
Paracorophium excavatum
N2 N5 N6 N8 NE2 CS* CS5 SW1 SW2 SE1 SE2-3* SE4-6* SE7-9* CIS PB26 24 26 32 30 57 25 28 27 27 34 35 51 80 38
1.00 1.00 1.00 1.00 1.00 1.00 1.00 1.001.00 1.00 1.00 1.00 1.00
1.001.00
1.000.020.98
1.00 1.00 1.00 1.00 1.001.00 1.00 0.98 1.00 1.00 0.98 1.00 1.00
0.02 0.02
0.35 0.041.00 1.00 1.00 1.00 1.00 1.00 0.52 1.00 1.00 1.00 1.00 1.00 1.00 0.96
0.131.00
0.01 0.08 0.07 0.61 0.02 0.01 0.010.04 1.00 0.98 0.92 0.93 0.39 0.98 1.00 1.00 0.98 0.99
0.98 0.94 0.96 0.98 0.01 0.010.02 0.06 0.02 1.00
0.00
1.00 1.00 1.00 1.00 0.07 0.05 0.03 0.05 0.070.01 1.00 0.02 1.00
0.05 0.030.75 0.92 0.75 0.59 0.52 0.68 0.77 0.89 0.910.23 0.07 0.25 0.41 0.36 0.23 0.21 0.060.02
1.00 1.00 1.00 1.00 1.00 0.02 0.030.04 1.00
1.00 1.00 1.00 1.00 0.98 1.00 1.00 1.00 0.93
1.000.98 0.96 1.00 1.00 1.00 1.00 1.00 1.00 1.00 1.00 1.00 1.00 1.00 1.00
0.040.02
0.06 0.05 0.041.00 1.00 1.00 1.00 0.88 0.82 0.95 0.98 0.98 1.00 1.00 0.97 0.89 0.90
0.12 0.12 0.02 0.02 0.03 0.11 0.03 1.000.01 0.03
132 M. I. STEVENS and I. D. HOGG
© 2004 The Linnean Society of London, Biological Journal of the Linnean Society, 2004, 81, 119–133
Paracorophium lucasi
N1 N3 N4 N7 N9 NW1 NW2 NW3 NW4 L1 L2 L3 CS1 CS2 CS4 CS6 NE1 NE2
ARKAB 0.19 0.05C 1.00 1.00 1.00 1.00 0.81 1.00 0.97 1.00 1.00 1.00 1.00 1.00 0.96 1.00 1.00 0.98 0.98 1.00D 0.03 0.02 0.02EMPIAB 0.07 0.05 0.03 0.08 0.05 0.02 0.04 1.00 1.00C 0.02 0.02D 0.21 0.15 0.76 0.65 0.86 0.42 0.50 0.87 0.70 0.42 0.95 0.96 0.69 0.96 0.91 0.72E 0.74 0.85 0.17 0.33 0.10 0.54 0.50 0.10 0.30 0.58 0.05 0.04 0.22 0.02 0.20F 0.05 0.04 0.05 0.02PGMA 0.02 0.52 0.24 0.02 0.47 0.56 0.11 0.09 0.04 0.09B 0.02C 0.25 0.10 0.08 0.98 0.48 1.00 1.00 0.73 0.98 1.00 0.53 0.44 0.89 0.86 0.94 0.91 1.00 1.00DE 0.67 0.69 0.88 0.03 0.05F 0.04 0.17 0.04G 0.04 0.04MEA 1.00 1.00 1.00 1.00 1.00 1.00 1.00 1.00 1.00 1.00 1.00 1.00 1.00 1.00 1.00 1.00BC 1.00 1.00
APPENDIX Continued
POPULATION GENETIC STRUCTURE OF NEW ZEALAND AQUATIC AMPHIPODS 133
© 2004 The Linnean Society of London, Biological Journal of the Linnean Society, 2004, 81, 119–133
Paracorophium excavatum
N2 N5 N6 N8 NE2 CS* CS5 SW1 SW2 SE1 SE2-3* SE4-6* SE7-9* CIS PB
0.051.00 1.00 1.00 0.75 1.00 1.00 1.00 0.98 0.83 0.56 0.39 0.77 1.00
0.21 1.00 0.02 0.17 0.41 0.61 0.24 1.00
0.03
0.040.04 0.07 0.03 0.01 0.04
0.30 0.26 0.87 0.86 0.10 0.98 0.71 0.85 0.32 0.67 0.39 0.44 0.960.63 0.82 0.74 0.98 0.13 0.14 0.77 0.02 0.29 0.15 0.66 0.30 0.59 0.480.07 0.11 0.02 0.07 0.02 0.01 0.09
0.02
0.02 0.02 0.02 0.13 0.08 0.07 0.02 0.04 0.02 0.02 0.020.02
0.98 0.96 0.98 0.86 0.92 0.92 1.00 0.71 0.93 0.96 0.94 0.95 0.97 0.970.02 0.01 0.25 0.07 0.02 0.02 0.01 0.03 1.00
0.02 0.03
1.001.00 1.00 1.00 1.00 1.00 1.00 1.00 1.00 1.00 1.00 1.00 1.00 1.00 1.00