A computational model based on Gross' emotion regulation theory
Upload
independentCategory
view
2download
0
Review of Income and Wealth Series 38, Number 1, March 1992
NEW ZEALAND'S GROSS NATIONAL PRODUCT: 1859-1939
University of Auckland
In this paper the author continues the work of Hawke, who used Australian velocity of money data to estimate New Zealand's GDP for 1870-1918, and whose results have been incorporated into international studies through the work of Bairoch. He also provides an alternative set of estimates for the inter-war years to those published by Lineham. The important findings of the paper are: (i) that Australian data show a significant relationship between the velocity of money and the price level; (ii) that New Zealand's income was significantly higher in 1870 than Hawke's estimates suggest; (iii) that sustained per capita growth has not been New Zealand's normal experience; (iv) that previous GDP estimates for the inter-war period have failed to reflect the fluctuations of the New Zealand economy and the extent to which it was operating below its production possibilities frontier during the Great Depression of the 1930s.
In 1962 Noel Butlin published estimates of Australia's gross domestic product (GDP), gross national product (GNP), and gross fixed capital formation (GFCF), covering the period from 1861 to the first official estimates of GNP in the year to June 1939. He also published price deflators for GDP and GFCF. Unfortunately Butlin's work did not extend to New Zealand, despite the fact that before Australian federation in 1901 New Zealand was an Australasian colony of Great Britain. The only published time series of New Zealand's gross product before 1918 is the GDP series of Hawke (1975). For the inter-war years, the only complete series of gross product or national income is that of Lineham (1968). The estimates presented here cover the 80 years of New Zealand's first century to the first official GNP statistic which was published for the year to March 1939.'
Hawke, assuming comparability between the New Zealand and Australian financial systems, used Leff's (1972) method to construct GDP estimates from monetary data. This paper utilises Hawke's technique as a means of interpolating between (and extrapolating from) independently derived national income esti- mates which are available from contemporary sources for a few specific years, the earliest of which is 1865. Hawke based his estimates on the Quantity of Money Identity:
Note: These estimates were first presented to the New Zealand Association of Economists Conference, University of Auckland, on 20 August, 1990. I would like to thank Gary Hawke, Jacques Poot, Brian Philpon, Brian Easton, Tony Endres, Brendan Thompson, William Coleman, Geoff Bertram, Brad Patterson, Grant Fleming and Graeme Snooks for their comments on earlier drafts of this paper.
'New Zealand was annexed a's a British cblony, via the Treaty of Waitangi, in 1840.

where M = quantity of money, V = velocity of circulation of money, P =price level, Q = real gross product, Y = gross product.
When a value for velocity is available, a country's income can be computed from the size of its money stock. Since velocity data for Australia was available, Hawke assumed that Australian velocity trends would be about the same as New Zealand's, given the closeness of the two economies and the shared banking system.2 As a check he derived independent velocity estimates for New Zealand for the years 1918-33, based on the GDP estimates of Lineham, and regressed them against Australian velocity estimates for the same years3 Hawke's GDP estimates were broadly in line with national income estimates produced by contemporaries between 1886 and 1903, but incompatible with an 1865 estimate to which Hawke (1985, pp. 76-77) nevertheless gives a considerable degree of credence. Comparisons with Australian incomes suggest that Hawke's data under- state New Zealand's GDP before the 1880s and after the mid-1900s. Hawke's series is also suspect because New Zealand's fluctuations were not well syn- chronised with Australia's (Dowie, 1963).
While Hawke was careful to state that his 1975 estimates of New Zealand's GDP were no better than "plausible" (1985, p. 79) or a "stop-gap" (1975, p. 306), his series has nevertheless been utilised by national and international studies (Fairburn, 1989, pp. 98, 106-109; Bairoch, 1981, p. 10; De Long, 1988, p. 1152).~ Bairoch's 1860 and De Long's 1870 statistics are serious underestimates of New Zealand's GDP. De Long's 1870 New Zealand per capita datum is only half of the value given for Australia. In the light of the estimates in this paper, New
Estimates of GNPIGDP per capita deflated by Table 3 prices P
- Table 4
-- Hawke
Benchmarks
other con temporary
Note: Values in 1910/11 pounds
Figure 1.
'velocities were calculated by dividing Butlin's GDP estimates by monetary aggregates (bank deposits) provided by S. J. Butlin, Hall and White (1971, pp. 140-156).
3 ~ a w k e (1975, p. 304) obtained the formula: log V,,=log 1.54+0.19 V, (R =0.52). 4~airoch only gives a reference to an unpublished paper, but it is apparent from an earlier paper,
(1977, p. 185) that his 1860 New Zealand datum is estimated from Hawke's series. De Long cites Bairoch as his source.

Zealand is an excellent supporting example for Baumol's (1986) "convergence" hypothesis which De Long's study challenges.
In trying to discover why Hawke's GDP estimates for the 1870s were so low, it became apparent that the Australian velocity estimates might be correlated to the general price level. With New Zealand prices falling more rapidly than Australian prices from the 1860s to the 1880s, it seemed likely that Hawke's velocity approximations for the 1870s were too low.5 An estimation function for velocity could be improved, evidently, by including a price variable. Further examination of the Australian data showed that velocity was not particularly high in the late 1880s, the period of "Marvellous Melbourne" (Davison, 1978) in which Victoria's economy was characterised by a speculative investment boom. A reason for the low velocity statistic during the boom becomes apparent from a consideration of the quantity identity.
Strictly speaking, M V = PT, where T is the volume of transactions rather than output. Thus:
V' = PQ/ M where V' = V. (Q/ T) = Y/ M.
Here, V' is regarded as the ratio of gross national product to trading bank deposits.6 This velocity ("VEL") can be expected to be comparatively low at times in which there is much trade in existing assets. Such periods, when the volume of transactions is high relative to national income, are indicative of a high speculative demand for money.7 The general price level also tends to rise at such times.
It is therefore proposed that the quantity of money per capita is negatively related to its velocity. The essence of Hawke's technique is that the monetary data is scaled up by a velocity parameter to produce GDP estimates. With velocity inversely related to the stock of money, the derived gross product data fluctuate less than the quantity of money data. This paper's GNP estimates are based on estimating velocity ("VEL") from two regressors: trading bank deposits per capita ("MPC") and the price level ("PRI"). Hawke's and Lineham's GDP series are graphed in Figure 1, alongside this paper's GNP estimates. Australia's GNP is presented in Table 1 and Figure 2.8
' ~ a w k e (1985, pp. 78-79) noted that he had, in effect, assumed that velocity decreases were less marked in New Zealand than in many other countries during the 19th century.
61 have chosen to estimate gross national product at market prices, rather than gross domestic product, in order to link up with the official GNP estimates for 1938139.
' ~ i n d l e b e r ~ e r (1984, p. 365) describes such a situation: "while the overall money supply is unchanged, within the total there is a shift from what Keynes called the 'transactions circulation' to the 'financial circulation' " which is the same as "a decline in income velocity."
'~utlin's (1962, pp. 6-7) estimates, scaled to link with official estimates for 1938-40 (Butlin 1962, p. 468), and converted to calender years.

TABLE 1
Population Prices Trading Bank Deposits (000) (1910/11) GNP Em .f p.c. Velocity Dummy
"PRI" Em "MPC" "VEL" "IW" -

TABLE 1--continued
Population hices Trading Bank Deposits (000) (1910/11) GNP Em E p.c. Velocity Dummy
"PRI" E m "MPC" "VEL" " I W
1915 4,937 1299 422.67 164.09 33.24 2.58 1916 4,904 1384 475.93 178.89 36.48 2.66 1917 4,905 1485 512.36 189.22 38.58 2.71 1918 4,983 1566 540.48 210.47 42.24 2.57 1919 5,167 1733 590.60 225.36 43.62 2.62 1 1920 5,358 1832 681.30 240.24 44.84 2.84 1 1921 5,462 1759 727.55 239.97 43.94 3.03 1 1922 5,572 1763 735.77 244.90 43:95 3.00 1 1923 5,692 1814 775.28 263.33 46.26 2.94 1 1924 5,812 1841 841.95 262.79 45.22 3.20 1 1925 5,933 1860 872.98 275.74 46.48 3.17 1 1926 6,052 1855 861.84 283.93 46.92 3.04 1 1927 6,173 1871 871.18 289.12 46.84 3.01 1 1928 6,296 1885 868.21 299.60 47.59 2.90 1 1929 6,396 1796 824.56 309.65 48.41 2.66 1 1930 6,468 1626 709.04 290.96 44.99 2.44 1 1931 6,527 1488 618.71 288.43 44.19 2.15 1 1932 6,579 1418 618.55 314.27 47.77 1.97 1 1933 6,630 1432 657.85 315.81 47.63 2.08 1 1934 6,681 1480 700.97 336.10 50.31 2.09 1 1935 6,730 1536 755.76 334.31 49.67 2.26 1 1936 6,780 1616 828.69 339.35 50.05 2.44 1 1937 6,837 1675 901.68 368.64 53.92 2.45 1 1938 6,899 1709 933.39 382.87 55.50 2.44 1 1939 6,964 1757 975.00 384.21 55.17 2.54 1
Sources: Refer to text (fn. 8, fn. 9); note, World War I years excluded from regressions.
The regression equations are derived from the Australian data presented in Table 1.9 They exclude the years 1914-18, and include a dummy variable ( " IW) for the inter-war years 1919-39. There were 74 observations. Three equations have been estimated, using respectively the current year's ("MPC"), the previous year's ("MPC-,"), and both years' per capita monetary aggregates. The equations found are, with t-statistics in brackets:
(a) ln VEL = -7.94+ 1.57 * In PRI -0.602 * In MPC-0.429 * IW [12.1] [17.5] [20.8] [6.97]
(b) In VEL = -7.27 + 1.47 * In PRI - 0.608 * In MPC-, - 0.371 * IW [11.0] [16.3] [2 1 .O] [5.93]
R2=0.945 D W = 1 . 4 6 F=402
9All time series relating to financial years have been converted to calendar years. I have used Butlin's price series (1962, pp. 33-34) and monetary data from Butlin, Hall and White (1971, pp. 142-157). The Australian population data-averages of the December 31 estimates-is from Maddock and McLean (1987, pp. 353-354) and the Oficial Year Book of the Commonwealth of Australia (1910, pp. 118-119).
(c) In VEL = -7.52 + 1.51 * In PRI - 0.27 * In MPC - 0.34 * In MPC-, - 0.39 * IW [11,2] [16.4] [1.64] [2.01] [6.20]
lZ2=0.947 DW=1.23 F=309
The statistical relationship between the price level and velocity is very strong, as is the negative relationship between the quantity and velocity of money. Although the lagged money stock is a slightly better regressor than current-year stock, a more robust function for New Zealand's velocity can be constructed by including both lagged and current "MPC" series, giving them equal weight. It is also clear from the dummy variable that structural changes in the relationships between the regression variables occurred during the war. These differences between the inter-war years and the pre-World War I years raise further doubts about Hawke's adoption of a function to estimate velocity based on inter-war monetary data.
T Australian GNP per capita
Note: Values in 1910/11 pounds
Figure 2.
New Zealand velocities are likely to reflect some structural factors that do not apply to Australia, because of possible differences in the demand for banking services due to factors such as variation in income distribution and economic geography. These differences are not likely to have been the same in 1939 as they were in 1859. Thus, more accurate New Zealand velocity estimates can be found by using separate regression equations for separate periods, and by scaling the resulting estimates to fit independently derived New Zealand benchmarks. The 80 year time-frame was divided into three sub-periods, and separate regressions on the Australian data were taken for each.
The periods chosen for the three regressions were 1861-1900, 1900-13, and 1919-39. The fitted equations are as follows:

(d) 1861-1900
In VEL = -6.10+ 1.33 * In PRI -0.190 * In MPC -0.491 * In MPC-, [ 5.751 [9.23] [0.858] [2.15]
R2=0.964 DW=1.48 F=320
(e) 1900- 1913
In VEL = -7.46 + 1.32 * In PRI + 0.097 * In MPC - 0.238 * In MPC-, [ 2.211 [2.08] [0.058] [0.478]
R2=0.670 DW=1.28 F=6.76
(f) 1919-1939
In VEL= -8.35+ 1.47 * In PRI -0.594 * ln MPC+0.167 * In MPC-, [ 8.521 [14.5] [2.20] [0.592]
The relative importance of the current and lagged monetary aggregates varies for each function. But when they were used as substitute rather than complement- ing regressors-as in equations (a) and (b)-the coefficients were similar whichever monetary series was used. Serial correlation is present. The effects are shown in Figure 2. In the 1920s, the lack of randomness of the deviations is marked, but their amplitudes are generally small. There are a few short periods where the predicted Australian GNP deviates by about 10 percent from the Table 1 series. This suggests that Australia experienced some events for which dummy variables would raise the regression R2; periods such as the early 1860s, 1879-81, mid-1890s, early 1920s. Similar periods for New Zealand must also have occurred. A likely candidate would be the late-1880s-analogous to the mid-1890s in Australia-when GNP may have been significantly lower than has been estimated.
Independent estimates for New Zealand's gross national product have been derived for the years 1865, 1898199-1902103, 1925126, 1932-33, and 1938139.
TABLE 2
BENCHMARK ESTIMATES OF NEW ZEALAND'S GNP
- -
Year GNP (Lm)

The first benchmark is a contemporary estimate of national income by Charles Knight (1866), a senior public servant. Dowie (1966), in assessing Knight's estimate of £15.8 million, has concluded that any errors which may have lead to overstatement appear to be balanced by factors which would lead to understate- ment.'' Dowie concluded that Knight's effort was one of great intellectual merit, overcoming a lack &data and an absence of methodological precedent. His national income total has therefore been taken as a valid estimate of New Zealand's GNP for 1865. Knight's work indicated that New Zealanders' incomes were significantly higher than Australians' which in turn were well above prevail- ing incomes in any other country. This conclusion has to be seen, however, in the context of higher prices in New Zealand, the low population base, and by the fact that average incomes had been temporarily boosted by the gold rushes of 1861162 and 1865166. The data shown in Figure 2 suggests that there was income parity between Australia and New Zealand in 1860 and 1870.
Dowie also cited four estimates of New Zealand's turn of the century GNP by the New South Welsh economist and statistician, T. A. Coghlan: 1898199, l9OO/Ol, 1901/02 and 1902/03." Coghlan's achievements have been assessed by Arndt (1949) and Butlin (1962, pp. 36-40). Dowie raised Coghlan's Australian estimates by 12.5 percent to make them comparable with Butlin's GDP estimates.'' The benchmarks used for the years 1898/99,1900/01, and 1902103 are the adjusted Coghlan estimates.
Since the introduction of the Reserve Bank in 1934 created a discontinuity in New Zealand's monetary data, it is inappropriate to apply the monetary technique beyond 1933. Instead, I use semi-official estimates of GNPfrom 1931132 which were reconstructed from aggregate private income data published in the 1940s.13 The 1930s' benchmarks are taken from this series. Note that the trough of New Zealand's Great Depression was the year to March 1933, somewhat later than most countries, with an estimated GNP of only £113.7 million. The 1938139 benchmark is the first official estimate (NZOYB, 1957, p. 716).
Fisher (1930) estimated aggregate private income for 1925126 from census and tax data. His estimate was £137.1 million. Assuming that the Fisher estimate of aggregate private income is comparable with the earliest official estimates for the years 1931132 to 1935136 (NZOYB, 1938, p. 737), to convert to GNP his estimate has been scaled up by the same amount that these first official estimates have been scaled. Since estimates of GNP are produced in this paper, and because the 1932 benchmark coincides with the peak of the Great Depression, Fisher's estimate was further adjusted in line with the ratio of GNP:GDP in Butlin's
10 Dowie discusses Knight's procedures in some detail, finding that some "double-counting" in the primary and banking sectors gives an error of about 10 percent of the total estimate. However, an allowance for house rents reduces the error to 3 percent. Knight himself believed his estimate was an understatement, because he omitted some activities for which he could find no data.
I 1 Coghlan's estimates were for Australia and New Zealand, before and after Australian federation in 1901, disaggregated into colonies/states.
lZ~utlin's GNP estimates are lower than his estimates of GDP at market prices. However, the Table 1 GNP estimate for 1902 is equal to Butlin's GDP estimates for 1901/02 and 1902103, so the 12.5 percent scale factor still applies.
1 3 ~ z O Y B (1940, pp. 782-783; 1942, p. 647; 1957, p. 717). I adjusted the series from March years to calendar years so as to make them compatible with the regression estimates. Note also the GNPIGDP series in NZOYB 1990 (p. 679) which goes back to 1935.

Australian data. In the middle of the Depression in Australia, GNP was unusually low compared to GDP. The scaled Fisher estimate (£175.7 m) serves as a useful benchmark, which can be checked against Lineham's GDP estimate of £168.8 million for 1925126. Lineham's series is likely to be comparatively accurate for that year because it was a census year, and because it was a year of low ~nernplo~rnent, '~ Lineham's 1938139 GDP estimate is 95 percent of the official GNP statistic. Similarly, his 1925126 estimate is 96 percent of the Fisher benchmark.
IV. THE NEW ZEALAND DATA SERIES
Since prices constitute a key regressor used to determine velocity, it is necessary to have a series of prices which can be used with some confidence. A price deflator is also necessary to estimate the real GNP per capita series needed to evaluate economic growth and to compare New Zealand and Australian income levels. The deflator used, presented in Table 3 along with bank deposits and population, is a linked series of four segments. The principal segments are the wholesale price index for locally produced products for 1913-40,15 and a confla- tion of four price indexes (McIlraith, 1911; Easton and Wilson, 1984) for 1861- 1910: imports, exports, farm, non-farm. The link from 1910 to 1913 is made up by combining the official retail and wholesale price indexes (NZOYB). The 1859-60 price estimates are derived from the three series provided by Easton and Wilson: imports, all exports, and farm exports. The final deflator series has been based on 1910/11, to conform with the Australian series given in Table 1. Purchasing power parity between the two countries has been assumed for the base years. The monetary data in Table 3 is the series of trading bank deposits given by Bloomfield (1984, pp. 386-87). The population data is exclusive of indigenous ~ a 0 r i s . l ~ The import/export data derives from Bloomfield (pp. 267- 269).17
The functions used to estimate New Zealand velocities are constructed from the Australian regressions (equations (d) to (f)). Equal weighting is given to the current and lagged monetary aggregates. The New Zealand velocity and GNP estimates are presented in Table 4. The New Zealand equations are:18
(g) 1859-1897
VEL = 0.98 * exp [-6.10+ 1.33 * In PRI+ (-0.190+ -0.491) * avg (In MPC, In MPC-,)I
14 Lineham is likely to have overstated GDP for 1935136 another census year, because in years of high unemploymentthere was always a degree of underemployment, making wage rates an unreliable guide to wage incomes.
"NZOYB (1941, p. 710). Note other price indexes for the inter-war period in Rankin (1990a, p. 40), and that the chosen inter-war series is near to an average of these.
16year-end averages from the NZOYB (1901, p. 501; 1919, p. 849; 1924, p. 726) series, and from the New Zealand Statistics of Population and Buildings for each year 1922123-1939140.
loomfi field's series have been deflated by this paper's GNP deflator. Thus, the series depicted in Figure 3 represent trade values, not volumes.
18 For example, the coefficients of (g) are exactly the same as those for equation (d). However, the coefficients for "MPC" and "MPC-1" are added together to give a single coefficient, which is applied to the average of those two variables. The number "0.98" is the scale factor used to fit the equation to the 1865 New Zealand benchmark.
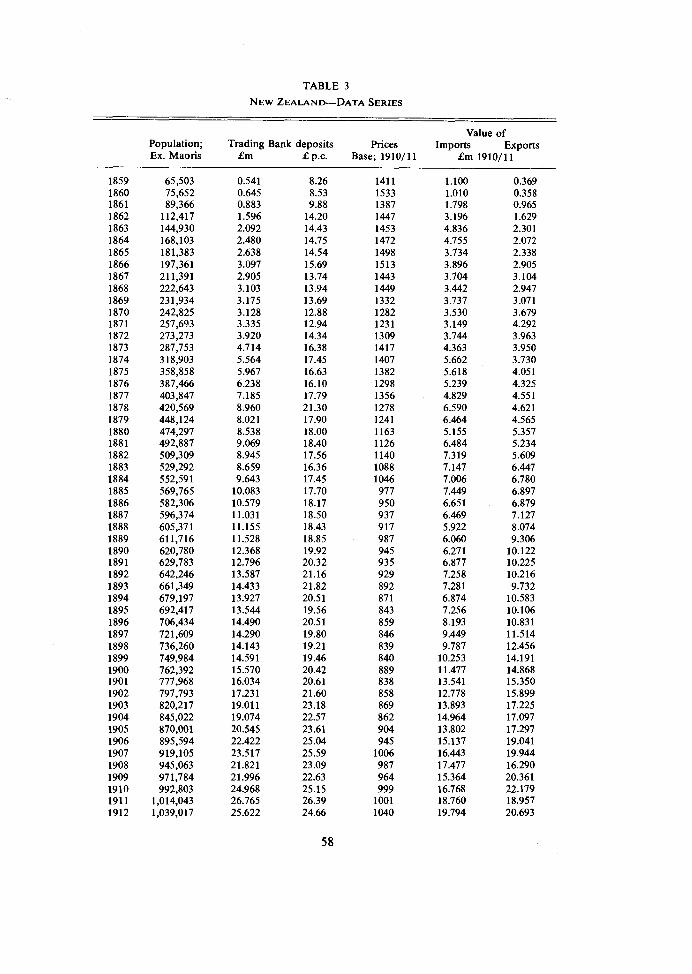
TABLE 3 NEW ZEALAND-DATA SERIES
Population; Ex. Maoris
Value of Trading Bank deposits Prices Imports Exports
E p.c. Base; 1910/11 Em 1910/11 -

TABLE 3--continued
Value of Population; Trading Bank deposits Prices Imports Exports Ex. Maoris f m f p.c. Base; 1910/11 f m 1910/11 -
Sources: Refer to text, Section IV.
(h) 1895-1913
VEL = 1.18 * exp [-7.46+ 1.32 * In PRI + (0.097 + -0.238 * avg (In MPC, In MPC-,)I
(i) 1922-1933
VEL= 1.18 * exp [-8.35+1.47 * In PRI+(-0.594+0.167) * avg (In MPC, In MPC-,)I
The estimates for 1895-97 are made from weighted averages of equations (g) and (h). Those years, chosen partly for the pragmatic reason that equation (h) gave a good fit to the Coghlan benchmarks, constituted a key turning point in the economic history of New Zealand. The "Long Depression" had just come to an end. Coinciding with the Liberal Government's land and labour reforms of 1893-94, the opening up of the North Island dairy industry, made liable by the introduction of refrigerated shipping, gave people with access to capital the confidence to raise investment spending. One result was an increase in the velocity of money without price stability being compromised. It is therefore appropriate that velocity estimates from 1895 should be higher than they would have been under equation (g).

TABLE 4 NEW ZEALAND GNP ESTIMATES
Per Capita Per Capita Calendar Velocity GNP Real GNP Real GNP Economic
Years of Money Em 1910/11Em 1910/11E Growth(%)
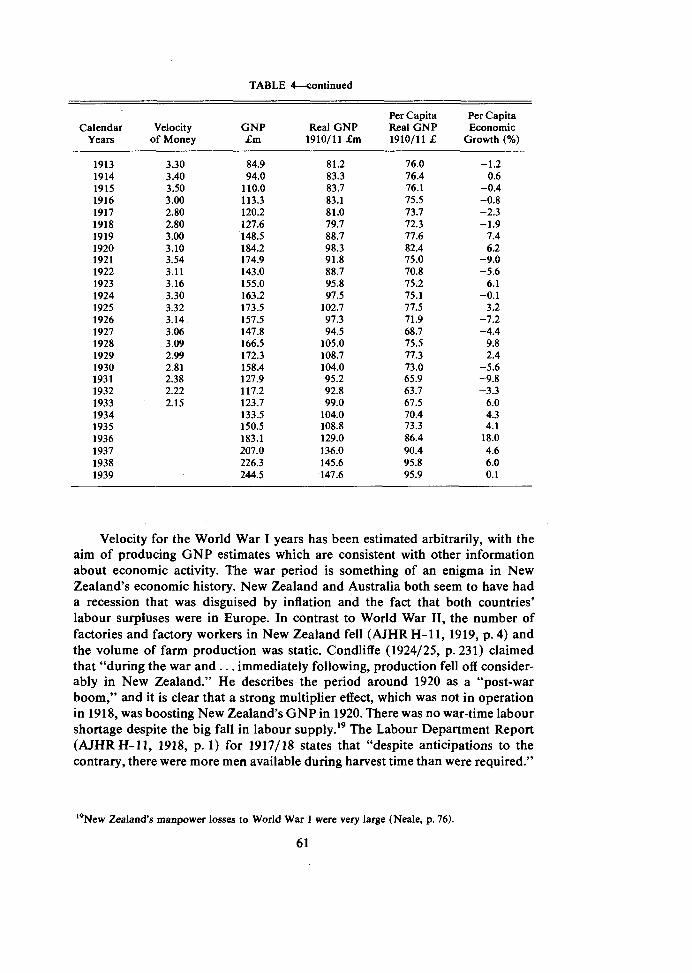
TABLE k o n t i n u e d
Per Capita Per Capita Calendar Velocity GNP Real GNP Real GNP Economic
Years of Money f m 1910/11 Em 1910/11 f Growth (%)
Velocity for the World War I years has been estimated arbitrarily, with the aim of producing GNP estimates which are consistent with other information about economic activity. The war period is something of an enigma in New Zealand's economic history. New Zealand and Australia both seem to have had a recession that was disguised by inflation and the fact that both countries' labour surpluses were in Europe. In contrast to World War 11, the number of factories and factory workers in New Zealand fell (AJHR H-11, 1919, p. 4) and the volume of farm production was static. Condliffe (1924125, p. 231) claimed that "during the war and. . . immediately following, production fell off consider- ably in New Zealand." He describes the period around 1920 as a "post-war boom," and it is clear that a strong multiplier effect, which was not in operation in 1918, was boosting New Zealand's GNP in 1920. There was no war-time labour shortage despite the big fall in labour supply.'9 The Labour Department Report (AJHRH-11, 1918, p. 1) for 1917118 states that "despite anticipations to the contrary, there were more men available during harvest time than were required."
I 9 ~ e w Zealand's manpower losses to World War I were very large (Neale, p. 76).
6 1
An increase in female employment between the 1916 and 1921 censuses appears to be related to falling real disposable household incomes in the face of inflation; that is, an increase in female labour supply rather than in any demand for substitute female workers. Indeed, the 1918119 Report (AJHR H-11, 1919, p. 5) indicates that the increase in teenage factory employment at the end of the war coincided with falls in overtime.
Equation (i), when applied to 1919-21, gives an unrealistically high GNP, especially for 1920. The New Zealand economy did not fully settle into its new pattern until 1922. Post-war money growth was much sharper in New Zealand than Australia. It was linked to land speculation as well as restocking and fixed capital formation. For those years the predicted velocity values have been adjusted to give more plausible estimates. That is somewhat arbitrary, but gives a boom/bust phase for 1918-22 that is sharper than 1905-09 and less pronounced than 1876-79. This conforms with the general impressions of these periods in the historical literature.
The new estimates of real GNP per capita, compared to contemporary estimates of national income cited by Dowie (1966, p. 127) and Lineham (1968, p. 25) are shown in Figure 1. The 1886 estimate of £30 million by Otago Univer- sity's Professor Mainwaring Brown fits the GNP estimate of this paper almost exactly. Dowie (1966, pp. 130-131) regarded Brown's work as an important contribution, although not of the same significance as Knight's.
Mulhall produced estimates for 1888 and 1895 for inter-country comparisons for the London Dictionary of Statistics (1892, 1909). He used two formulae which are of some interest (Dowie, 1966, n15), but his own estimates derived from those techniques cannot be taken with any degree of precision because the data used were taken from a variety of different years. For example, for his 1895 estimate, data were taken from various years in the early 1890s. Mulhall's 1895 estimate for Australia of £179 (Butlin 1962, p. 37) exceeds the Australian GNP (given in Table 2) for 1891-95 by 5 percent, while his New Zealand estimate of £34.2 for 1895 exceeds the Table 4 New Zealand average for those years by a similar 4percent. Therefore, this paper's GNP estimates for the early 1890s are fully consistent with his 1895 estimate of Australia's gross product. Mulhall's 1888 aggregate of £22.5 million appears to be well short of New Zealand's true GNP for that year, although the GNP estimate given here is probably too high. 1888 was the year of the New Zealand "Exodus;" the trough of the Long Depression and a period of mass emigration to Australia.
In the 1894 and 1897 Oficial Year Books, the New Zealand Registrar-General presented national income estimates using both the Brown and Mulhall methods.20 Averaging his two estimates gives £ 27.5 million for 1893, and £28.6 million for 1896. With both numbers being about 18 percent short of the estimates given in this paper, the Registrar-General's estimates consistently understate them."
'O~owie (1966, p. 127); NZOYB (1894, p. 139; 1897, pp. 283-284). *'AS the Registrar-General's 1896 estimate is based on data from the Census in April 1896, to
make the comparison I adjusted my estimates to the year ended September, by taking weighted

Lineham follows a direct approach to the task of gross product estimation for the inter-war period, but his estimates have serious empirical weaknesses (Rankin, 1991, pp. 15-18). He presents contemporary national income estimates by Stephens (1936) and lark.^^ Stephens' estimates for 1925/26-1930131, which are too low for 1925, have been included in Figure 1. Financial, labour market and trade data indicate that the New Zealand economy was buoyant in 1925 but in sharp recession by 1927. Stephens' estimates for 1928-30 are close to those of this paper, although they show a faster slide into depression in 1930. His data are for years ending the following March, so his income estimate for 1930 will have been considerably affected by the much greater extent of depression in early 1931 than in early 1930.
Import, Export & GNP growth quinquennial averages; 191O/ll pounds
per capita, per annum
I .
Sources: Calculated from Table 3 and Table 4 data.
Figure 3.
To be plausible, a GNP series constructed by indirect means should be consistent with other macroeconomic data. Changes in the real value of New Zealand's import payments (shown in Figure 3) indicate the major fluctuations, with the growth in export receipts acting as a leading indicator of economic growth. Australia-New Zealand migration data show that the New Zealand GNP estimates are fully comparable with the Australian series. An inflow of Australian migrants to New Zealand would be expected to follow periods of higher GNP or economic growth in New Zealand. The data in Figure4 shows that New
averages of that year and the previous year. His estimates are 18 percent short of my estimates for the year to September 1893 and the year to September 1896. This slight adjustment is significant because GNP recovered by over 13 percent in 1896.
"~ineham (p. 25) has demonstrated a high level of correlation (R2 = 0.97) between Stephens' and Clark's (2nd. edn., 1951) estimates. Clark (1957, p. 173) sources his estimates to an unpublished memorandum by Stephens and himself.

Zealand experienced a net inflow of Australian migrants in years in which New Zealand incomes were higher (1860s, 1893, 1900s, 1929-31, 1937-39), and net emigration to Australia in years of comparatively low GNP (1880s, 1926-28, 1933-35).'~ For most years, per capita incomes in the two countries were similar. A reduced level of contact between Australia and New Zealand after 1908 can be explained by the general similarity of living standards and of comparative advantage.
Trans-Tasman Migration a) 1860-1920 Departures per Arrival with
2.5 T + adjustments for 1876-1891
0 J I
1860 1870 1880 1890 1900 191 0 1920
sources: Statistics of New Zealand; Gandar @. 167)
b) 1920-1940 "permanent" Emigrants per Immigrant
T
1920 1925 1930 1935136 1940141
sources: New Zealand Statistics of External Migration New Zealand Statistics of Population and Buildings
Figure 4.
2 3 ~ h e Gandar adjustments, which have been converted to calendar years, assume that the entire discrepancy for the years in question related to Trans-Tasman migration. Figure 4b only covers people claiming to be permanent migrants. This is because returning New Zealanders ceased to be classified by place of origin.

It is important to note that the per capita GNP data are exlusive of the indigenous Polynesian (Maori) population. A census of Maori population in 1858 (Bloomfield, pp. 37,42) showed that Maoris comprised 43.5 percent of the total population. That proportion had fallen to 13 percent when the next Maori census was taken in 1 8 7 4 . ~ ~ Knight's 1865 estimate of national income was based solely on the European population. New Zealand's total GNP would have been much higher than stated for 1860 if the full contribution of the Maori economy had been accounted for. As an example of the level of integration in 1860, the Maori warrior and prophet Te Kooti was then a coastal trader on the Auckland- Gisborne route, using two Maori-owned ships to undercut the former settler monopoly (Oliver, 1990, p. 463). As late as 1880, after much of the best Maori- owned land had been confiscated, the lands around the Taranaki town of Parihaka were farmed productively by best-known techniques (Riseborough, 1987, p. 130). Nevertheless, from the Land Wars in the 1860s until the 1940s, there was little integration between the indigenous and settler economies.
The peaks of per capita income in the 1860s coincided with the gold dis- coveries in Otago (1861), Westland (1865) and Coromandel (1868). The New Zealand economy was also growing strongly because of the high demand in Britain for wool, New Zealand's main staple. Expansion in the 1870s was boosted by a program of Government sponsored public works and immigration (the "Vogel boom") financed by borrowing on London. In the 1880s, the government and many producers were burdened by indebtedness in the face of falling land and commodity prices. In the absence of an export staple with powerful linkages into the domestic economy, New Zealand tentatively moved towards a manufac- turing-based economy based in part on the availability of cheap female and teenage labour (Rankin, 1990b, pp. 11-13; Sutch, 1957, p. 25 n41), and also on the buoyancy of the Australian market. In the 1890s, the economy was boosted by a new set of staple primary industries-the processing of meat and dairy products-made possible by advances in refrigeration technology and the growth of the British market for imported food.
A feature of the New Zealand aggregates from the 1890s which was not apparent in Australia is the existence of a 3-5 year trade cycle. From 1907 to 1929, the fluctuations were very sharp oscillations around a nil-growth trend. These short period cycles were the main source of the uncertainty and "instability" that pervaded New Zealand's economic consciousness (Simkin, 1951; Hawke, 1985, p. 100). They were the price New Zealand paid for its narrowly structured economic development, based on pastoral exports to the British market. Those fluctuations explain the popular desire for an insulationist approach to economic policy-making in the years following World War 11. The sharpness of some of the single-year fluctuations in GNP reflect the nature of investment activity in a small commodity-producing economy. For the whole period, the domestic money supply was essentially determined by the level of reserves held by the New Zealand banking system in London. Thus, rapid growth could result from an acceleration of domestic investment made possible by an increase in London funds. A sharp fall in the British price of one or more of New Zealand's primary
24 The Maori population fell from 56,000 in 1858 to less than 40,000 in 1896 before it began to rise.
65
export commodities, or a change of sentiment towards Australia or New Zealand by British investors, would inevitably lead to a sharp contraction of the New Zealand money supply. The 1879 downturn was linked to the collapse of the City of Glasgow Bank in 1878 (Hawke, 1985, p. 80) and the 1926 recession was mainly a result of the General Strike in Great Britain.
Economic growth rates were very high for most of the 1930s, averaging as much as 8 percent from 1933 to 1938. Lineham (1968, p. 18) noted that "the massive public works program would probably have set the economy off on an exponential rather than a linear growth path." This multiplier effect is also the result of the earnings of large numbers of additional workers, mainly women and teenagers, who sought work during the Depression and who contributed to a rapid increase in household incomes during the recovery years (Rankin, 1990a, p. 123).
VI. CONCLUSION
In this paper I have presented a set of GNP estimates for New Zealand that can be linked to official estimates beginning in 1938139. They draw heavily on the work of contemporary economic statisticians. Although no formal model linking monetary aggregates to GNP has been presented. (It has been possible to produce a gross product series that stands up to historical scrutiny.) An important by-product of this exercise has been the demonstration of a significant statistical relationship between the price level and the velocity of circulation of money.
It should be possible to produce improved historical estimates of New Zealand's national income by following procedures similar to those used by Butlin's team in Australia. Indeed, the statistical and archival record has yet to be mined in New Zealand to the extent it has in many other developed countries. The GNP estimates therefore remain a provisional data source against which future estimates can be checked. Their virtue is that they give a better indication of economic growth in New Zealand's first century than any alternative source. They present a macroeconomic picture containing long periods of nil trend growth; a picture which gives credence to the considerable anxiety felt by New Zealanders about their country's economic destiny. That pattern continues today. Per capita incomes are now little higher than they were in 1975, and many economists doubt that a growth trend will emerge before 1995.
APPENDIX
A. THE ECONOMIC SIGNIFICANCE OF THE REGRESSION VARIABLES
While the concept of monetary velocity provides the means to link monetary and income/product variables, in this paper I use variables contained within the quantity identity to estimate velocity. Thus it is possible to remove velocity entirely from the equation, leaving a society's gross product as a function of the money stock, the price level and the population.
66

From equation (a) we have
(A1 In V = a + b l n P - c l n ( M / N ) b>1; O < c < l ;
(A21 v = Apb(M/ N)-" where V = velocity, In A = a, P = prices, M = money stock, N = population. From the Quantity Identiy we have
(A31 PQ=MV
where PQ = gross product, Q = real gross product. Taking the two together:
where M / P / N = real money balances per capita
Looked at in this way, equation (A7) shows that real gross product is positively related to population, money balances and prices. An increase of 1 percent in any of those three variables will, in itself, be associated with an increase of less than 1 percent in gross product. Equation (A6) suggests that rising real money balances are linked with economic growth only when prices are rising.
It is not possible to claim a simple causal link from prices, money or population to real incomes because of the interdependence of the variables. For example, a sharp rise in prices may induce a significant fall in real money balances. Rather, the above is a historical generalisation with respect to the Australian economy, and ipso facto, the New Zealand economy. Economic growth in New Zealand resulted from market situations which brought about both rising prices and a growth in the money supply.
As a by-product of the regressions conducted for this exercise, I performed another set of regressions on the full Australian data set (1861-1939, excl. 1914-18), this time making the price level the independent variable. The data yielded the following equations (with t-values in brackets):
(B1) In PRI = 7.22 - 0.0995 * In MPC-, + 0.604 * IW [63.9] [2.7] [16.2] R2 = 0.888
(B2) In PRI = 6.65 + 0.252 * In VEL-, + 0.548 * IW [215.5] [9.0] [33.9] R2 = 0.942
(B3) In PRI = 5.40+0.314 * In MPC-, +0.529 * In VEL-,+0.32 * IW [45.5] [10.7] [17.0] [13.6] ~ ~ = 0 . 9 7 9
As the results of Equation (Bl) suggest, if there is a simple causal relationship from money (narrowly defined) to prices, then it is negative. This result is contrary

to that predicted by monetarist doctrine. Instead, there is a strong positive relationship from velocity to prices in equation (B2). This is consistent with the discussion at the beginning with this paper about the relationships between monetary velocity and prices, and between the velocity of and the quantity of money. A significant direct relationship from money to prices is revealed, however, when velocity is accounted for as a separate regressor, as in equation (B3).
Appendices to the Journal of the New Zealand House of Representatives (AJHR). Arndt, H. W., A Pioneer of National Income Estimates, Economic Journal 59, pp. 616-625, 1949. Bairoch, P., Estimations du Revenu National dans les Socittds Occidentales Prt-Industrielles et au
Dix-NeuviBme Sikcle: Propositions d'Approches Indirectes, Revue Economique, 1977. Bairoch, P. and LBvy-Leboyer, M. (eds.), Disparities in Economic Development Since the Industrial
Revolution, St. Martins Press, New York, 1981. Baumol, W. J., Productivity, Growth, Convergence and Welfare, American Economic Review 76,
pp. 1072-1085, 1986. Bloomfield, G. T., A Handbook of New Zealand Statistics, Hall & Co., Boston, 1984. Butlin, N. G., Australian Domestic Product, Investment and Foreign Borrowing; 1861-1938/39, Cam-
bridge University Press, Cambridge, 1962. Butlin, S. J., Hall, A. R. and White, R. W., Australian Banking and Monetary Statistics 1817-1945,
Reserve Bank of Australia (Occasional Paper no. 4A), 1971. Clark, Colin, The Conditions of Economic Progress (3rd. edn.), Macmillan, London, 1957. Condliffe, J. B., Changing Price Levels, The Accountants Journal of New Zealand, Vol. 3, pp. 139-46,
197-202, 229-232, 1924125. Davison, G. R., The Rise and Fall of Marvellous Melbourne, Melbourne University Press, Melbourne
1978. De Long, Bradford, Productivity Growth, Convergence and Welfare: Comment, American Economic
Review 78, pp. 1138-1154, 1988. Dowie, J. A., Inverse Relations of the Australian and New Zealand Economies, 1871-1900, Australian
Economic Papers 2, pp. 151-179, December 1963. Dowie, J. A., A Century-Old Estimate of the National Income of New Zealand, Business Archives
and History (now Australian Economic History Review) 6, pp. 117-131, August 1966. Easton, B. and Wilson, N., An Investigation of the Database of New Zealand's Terms of Trade, the
First Draft of a Report Prepared by the New Zealand Institute of Economic Research for the Department of Trade and Industry, Working Paper No. 84/10, Appendix 2, 1984.
Fairburn, Miles, The Ideal Society and its Enemies: the Foundations of Modern New Zealand Society, 1850-1900, Auckland University Press, Auckland 1989.
Fisher, A. G. B., Distribution of Income in New Zealand, The Economic Record 11, pp. 221-234,1930. Gandar, J. M., New Zealand Net Migration in the Latter Part of the Nineteenth Century, Australian
Economic History Review 19, pp. 151-168, 1979. Hawke, G. R., Income Estimation from Monetary Data: Further Explorations, Review of Income and
Wealth 21, pp. 301-307, 1975. Hawke, G. R., The Making of New Zealand, Cambridge University Press, Cambridge, 1985. Kindleberger, C. P., Financial History of Western Europe, Allen & Unwin, London, 1984. Knight, Charles ei al., Final Report of the Civil Service Commissioners, AJHR 1866 D-7B. Leff, N. H., A Technique for Estimating Income Trends from Currency Data and an Application to
Nineteenth Century Brazil, Review of Income and Wealth 18, pp. 355-368, 1972. Lineham, B. T., New Zealand's Gross Domestic Product, 1918/38, New Zealand Economic Papers 2,
pp. 15-26, 1968. McIlraith, J. W., The Course of Prices in New Zealand, Govt. Print, Wellington, 1911. Maddock, Rodney and McLean, I. W., The Australian Economy in the Long Run, Cambridge University
Press, Cambridge, 1987. Neale, E. P., The Post-War Sex- and Age-Constitution of the New Zealand Population and Some of
its Economic Consequences, Economic Record 8, pp. 75-82, 1929. New Zealand Oficial Year Book (NZOYB), various issues. New Zealand Statistics for Population and Buildings, otlicial publication, 1922123-1939140. New Zealand Statistics of External Migration, official publication, 1920s.

Oficial Year Book of the Commonwealth of Australia (OYBCA), 1910. Oliver, W. H. (ed.), Dictionary of New Zealand Biography 1769-1869 (Vol. I), Allen & Unwin, for
the New Zealand Department of Internal Affairs, 1990. Rankin, Keith, Labour Supply in New Zealand and Australia, 1919-1939; unpublished thesis, Victoria
University of Wellington, 1990a. Rankin, Keith, New Zealand's Labour Supply in a Long Term Perspective, Working Paper 5/90,
Industrial Relations Centre, Victoria University of Wellington, 1990b. Rankin, Keith, Gross National Product Estimates for New Zealand; 1859-1939, Graduate School of
Business and Government Management, Working Paper Series 1/91, Victoria University of Wellington, 1991.
Riseborough, Hazel, Days of Darkness; Taranaki 1878-1884, Allen & Unwin, Wellington, 1989. Simkin, C. G. F., The Instability of a Dependent Economy: Economic Fluctuations in New Zealand,
1840-1914, Oxford University Press, Oxford, 1951. Stastics of New Zealand, official publication, (various years). Sutch, W. B., The Long Depression, Industries and Commerce Department, Wellington, 1957. Stephens, F. B., National Income of New Zealand, Economic Record 27, pp. 231-256, 1936.
Copyright © 2022 FDOKUMEN