Impact of Monetary Policy on Bank' Balance Sheet in Pakistan
Upload
khangminh22Category
view
0download
0
GROSS VERSUS NET BALANCE SHEET PRESENTATION OF
OFFSETTING DERIVATIVES ASSETS AND LIABILITIES
Stephen Ryan*
NYU Stern School of Business
Barbara Seitz
Nordea Group
February, 2021
*Corresponding Author. We are grateful for helpful comments from an anonymous referee, Anwer
Ahmed, Aleksander Aleszcyk, Gauri Bhat, Yiwei Dou, Gerald Lobo, Jed Neilson, Scott Richardson
(editor), Dushyant Vyas, Philip Wang, Biqin Xie, and Steve Zeff. The views expressed here are
the authors’ and are not representative of the views of Nordea Group.
GROSS VERSUS NET BALANCE SHEET PRESENTATION OF
OFFSETTING DERIVATIVES ASSETS AND LIABILITIES
Abstract: Accounting rules allow the net balance sheet presentation of offsetting assets and
liabilities only when the reporting firm has the right to set off these positions. Derivatives
dealers and their frequent counterparties engage in master netting agreements (MNAs) that
cover many derivatives with largely offsetting gross fair values. MNAs provide a limited right
of setoff that is insufficient (sufficient) for net presentation under IFRS (US GAAP), and they
provide control rights to the non-defaulting counterparty that render the timing, completeness,
and fairness of any net settlement of the covered derivatives uncertain. To provide comparable
information regarding the effects of MNAs on financial statements, as of 2013 both IFRS and
US GAAP require firms to disclose the gross, reported, and net fair values of derivatives assets
and liabilities that are presented net on the balance sheet or are presented gross and covered
under enforceable MNAs.
We posit that dealers want their net derivatives exposures to be viewed as small and low
risk by market participants. Because the 2013 disclosures provide new information about net
derivatives fair values for IFRS dealers but not for US GAAP dealers, we hypothesize and
provide evidence that the 2013 disclosure requirements have larger and more significant real
effects for IFRS dealers, which reduce the extent of their offsetting gross derivatives and
increase the effectiveness of their use of MNAs, than for US GAAP dealers. Because MNAs
provide a limited and right of setoff and non-defaulting parties the ability to exercise discretion
over that right, we hypothesize and provide evidence that dealers’ reported net derivative fair
values and disclosure quality under the 2013 requirements help users of financial reports
evaluate the dealers’ credit risk uncertainty. These results suggest that MNAs do not eliminate
all significant risks of the covered derivatives assets and liabilities.
Keywords: Derivatives; dealers; master netting agreements; gross versus net balance sheet
presentation; disclosure; real effects; credit risk uncertainty.
JEL Codes: G130, G21, M41.

1
I. INTRODUCTION
A longstanding principle governing balance sheet presentation is that “the offsetting of
assets and liabilities in the balance sheet is improper except where a right of setoff exists” (ASC
210-20-05-1).1 Despite this principle, many accounting rules and practices require or allow net
balance sheet presentation of assets and liabilities when the right of setoff does not exist (e.g.,
the projected benefit obligation and plan assets for defined benefit pension plans under ASC
715-30) or is limited (e.g., derivatives covered by master netting agreements that provide for
net settlement only upon default of a covered position under ASC 210-20). Indeed, most types
of “off-balance sheet financing”— operating leases [short-term leases] under ASC 840 [842],
transfers of financial assets accounted for as sales under ASC 860, and “executory contracts”
under longstanding accounting practice—effectively involve the net presentation of offsetting
economic assets and liabilities on the balance sheet. The most direct effect of net presentation
is to reduce firms’ reported financial leverage, the focus of investors’ analysis of firm solvency.
Reflecting this focus, extant empirical research examining gross versus net balance
sheet presentation mostly examines whether specific types of off-balance sheet financing
constitute financial leverage for the purposes of firm valuation and risk assessment, typically
finding that they do.2 To our knowledge, only Neilson et al. (2020) and our study empirically
examine the role of the right of setoff in determining gross versus net balance sheet presentation.
Like Neilson et al. (2020), we focus on this role in the context of derivatives dealers’3
derivatives covered by master netting agreements (hereafter, MNAs).
While involving some complexity for readers not familiar with derivatives dealing and
the financial reporting for derivatives, this setting is interesting, highly important both
1 As discussed in detail in Section II, the right of setoff is the legal right to receive (obligation to pay) the net asset
(liability) valuation upon the close out of a specified set of gross economic assets and liabilities. 2 See, for example, Bowman (1980), Ely (1995), and Dhaliwal, Lee, and Neamtiu (2011) re operating leases,
Dhaliwal (1986) and Hsieh and Liu (2021) re pensions, and Niu and Richardson (2006) and Chen, Liu, and Ryan
(2008) re securitizations accounted for as sales. 3 A derivatives dealer is a bank or other financial services firm that transacts on both the buy and sell sides of
derivatives markets in order to satisfy customer needs and thereby earn bid-offer spreads and/or other fee income.

2
economically and for financial reporting purposes, and currently salient for the following
reasons. First, derivatives dealers’ gross derivatives holdings are both massive and
interconnected and thus raise concerns about the stability of individual dealers and the financial
system as a whole. Second, derivatives dealers present derivatives assets and liabilities covered
by MNAs at the gross fair values on the balance sheet under IFRS but at the net fair values
under US GAAP. This provides a natural setting for research on the differential impact of
recognition versus disclosure, which is a primary focus of Neilson et al. (2020). Third, these
differing balance sheet presentations of derivatives covered by MNAs constitute the “single
largest quantitative difference in reported numbers in statements of financial position prepared
in accordance with IFRS or US GAAP”, and thus have first-order effects on dealers’ and
aggregate financial report numbers.4 Fourth, effective as of 2013, IFRS and US GAAP require
derivatives dealers to disclose gross and net fair values of derivatives covered by MNAs. These
disclosures enable empirical analysis of the distinct information about financial leverage
conveyed by net fair values (i.e., the amounts that do not offset) versus the difference between
the gross and net fair values (i.e., the amounts that do offset), which our primary focus.
We begin by briefly describing the economic and institutional features of the setting.
Individual derivatives generally have small fair values relative to the capitalization of
derivatives dealers, but these dealers engage in very high volumes of derivatives with
correspondingly large gross fair values. In order to mitigate what would otherwise be the
unacceptably large risk that one or more of their major derivatives counterparties might default
on these large gross positions, dealers typically engage in bilateral MNAs with these
counterparties. These agreements cover large numbers of derivatives for which the gross fair
values, but not necessarily the transferred risks, largely offset (Bliss and Kaufman 2006). MNAs
typically are specified under International Swaps and Derivatives Association (ISDA)
4 http://www.fasb.org/cs/ContentServer?pagename=FASB/FASBContent_C/NewsPage&cid=1176158186333
(15 Aug 2017).

3
agreements in which the covered positions are closed out (i.e., liquidated) and settled for a
single net amount only in the event of a default by either party on any covered position. In this
event, MNAs grant substantively all control rights to the non-defaulting party to close out the
covered positions, subject only to that party exercising those rights in a commercially
reasonable fashion consistent with industry practice. The limitation of the right of setoff to an
event of default and the frictions involved in closing out the covered positions upon default
yield uncertainty about the extent, timing, and fairness of any future net settlement.
We now turn to the financial reporting requirements for derivatives covered by MNAs.
As of January 1, 2013, public firms must disclose the gross, reported, and net fair values of
derivatives that are subject to enforceable MNAs or are presented net on the balance sheet in
their financial reports under both IFRS (amendments to IFRS 7) and US GAAP (ASU 2011-
11, ASC 210-20-50-3). The IASB and FASB jointly developed and issued these disclosure
requirements because firms present their derivatives covered by MNAs differently on the
balance sheet under IFRS and US GAAP. IFRS (IAS 32) requires firms that hold economically
offsetting derivatives to present these positions as gross assets and liabilities unless the firms
have the unconditional right to set off the positions. Transactions with derivatives
clearinghouses5 provide this right, but MNAs, which only provide the counterparties with the
right to set off the positions conditional on a default by a counterparty on any covered position,
do not. In contrast, US GAAP (FIN 39, ASC 210-20-45 and 815-10-45) allows presentation of
derivatives covered under enforceable MNAs as net assets or liabilities. For our sample dealers,
the mean of net (gross) derivative asset fair values equals 30 (437) percent of tangible common
equity, a very sizeable difference. Figure 1 summarizes the 2013 disclosure requirements and
provides a numerical example and visual depiction of a given set of positions that illustrates the
disclosed gross, reported on balance sheet, and net amounts of these positions for IFRS and US
5 Derivatives clearinghouses are designated intermediaries between buyers and sellers of derivatives that validate
and finalize trades and ensure that both parties to a trade honor their contractual obligations.

4
GAAP dealers.6 Appendix 1 provides examples of financial report disclosures by representative
IFRS and US GAAP dealers.
We expect the 2013 disclosure requirements to have different effects on IFRS and US
GAAP dealers. For IFRS dealers that present derivatives (mostly) gross on the balance sheet,
the 2013 disclosure requirements provide new information about net derivative fair values,
because these dealers previously were not required to disclose, and typically did not voluntarily
disclose, these values. In particular, the required disclosures provide the first clear indication of
the extent of IFRS dealers’ offsetting gross derivatives that rely on MNAs to effect net
settlement in the event of default. In contrast, for US GAAP dealers that present derivatives
(mostly) net on the balance sheet, the disclosures provide minimal new information, because
these dealers typically are banks which have long been required to report the gross fair values
of derivatives assets and liabilities in their public regulatory filings. Moreover, over half of the
sample US GAAP dealers voluntarily provide similar disclosures in their 2008−2012 financial
reports. The 2013 requirements may increase the visibility of US GAAP dealers’ gross fair
values of derivatives, however, by requiring these dealers to disclose these gross fair values in
their financial reports.
We examine two effects of dealers’ disclosures under the 2013 requirements. First, we
examine how the disclosures lead dealers to reduce unnecessary offsetting gross derivatives and
to increase the effectiveness of the coverage of their remaining gross derivatives under MNAs.
Second, we examine how an important type of user of financial reports, sellers of credit default
swaps (CDS),7 use these disclosures to evaluate dealers’ credit risk uncertainty.
6 For both IFRS and US GAAP dealers, the 2013 disclosure requirements do not affect the calculation of regulatory
leverage or risk-based capital ratios, which reflect netting to the extents specified by regulators. For example, under
Basel III in Europe and the US, regulatory leverage capital ratios reflect netting of derivatives fair values for groups
of single-product derivatives covered by enforceable MNAs that meet certain qualifying conditions (Basel
Committee on Banking Supervision 2014a,b). 7 A CDS is a derivative in which the seller of the derivative provides the purchaser with insurance against default
of a referenced financial asset in exchange for up-front and/or periodic premium payments.
5
We examine a global sample of 47 dealers (26 IFRS, 21 US GAAP) that hold significant
amounts of derivatives covered under MNAs (Duffie 2010). We identify this sample from lists
of dealers from global regulators and other criteria for dealers. We hand collect gross, reported,
and net derivatives fair values for the 2012–2017 year ends from dealers’ 2013–2017 annual
financial reports. Because the reported fair values of derivatives are not comparable across IFRS
and US GAAP dealers and unlike Neilson et al. 2020 we do not examine the effect of
recognition versus disclosure, we focus the empirical analysis on three components of tangible
financial leverage that are comparable across the two sets of dealers: (1) reported tangible
leverage after removing the reported fair values of derivatives assets from the numerator
(hereafter, non-derivatives leverage); (2) leverage associated with net derivatives fair values
(hereafter, net derivatives leverage); and (3) leverage associated with the difference between
gross and net derivatives fair values (hereafter, gross minus net derivatives leverage).
Reductions of offsetting gross derivatives directly decrease dealers’ gross minus net
derivatives leverage and likely indirectly decrease their net derivatives leverage. More effective
coverage of given gross derivatives under MNAs decreases dealers’ net derivatives leverage.
We first examine real effects of the 2013 disclosure requirements on dealers’ gross
minus net derivatives leverage and net derivatives leverage. We posit that dealers prefer market
participants to view their net derivatives leverage as small and thus low risk. Because these
disclosure requirements provide new information about net derivatives leverage for IFRS
dealers, we hypothesize that the requirements provide strong financial reporting (as opposed to
risk mitigation) incentives for these dealers to reduce unnecessary offsetting gross derivatives
and to use MNAs more effectively after the effective date of the requirements. In contrast,
because these requirements provide no new information for US GAAP dealers, we hypothesize
that the 2013 disclosure requirements provide lesser and possibly no financial reporting
incentives for these dealers to reduce their offsetting gross derivatives or to increase the
effectiveness of their use of MNAs.

6
We test these hypotheses using difference-in-differences models with dealer fixed
effects that distinguish each post treatment year to demonstrate the sharpness of the effects
around the effective date of the 2013 disclosure requirements and to help rule out the possibility
that any uncontrolled for sources of cross-sectional variation, which are likely to arise in such
a dynamic environment as derivatives dealing, drive or obscure our findings. As expected, we
find that both gross minus net derivatives leverage and net derivatives leverage decrease sharply
and significantly for IFRS dealers from 2012 to 2013, when the disclosure requirements become
effective. We further find that gross minus net derivatives leverage continues to decrease for
these dealers through 2017, consistent with them reducing excess offsetting derivatives as their
portfolios turn over, whereas net derivative leverage is flat through 2017.
In contrast, we find that the changes from 2012 to 2013 in US GAAP dealers’ gross
minus net derivatives leverage and net derivatives are much smaller in magnitude than for IFRS
dealers (37 [20] percent as large for gross minus net [net] derivatives leverage), and are only
weakly significant. As for IFRS dealers, there is a perceptible downward trend in gross minus
net derivatives leverage from 2013 to 2017, while net derivatives leverage is flat through 2017.
The difference-in-differences is weakly significant in 2013 and 2014 for gross minus net
derivatives leverage and in 2014 for net derivatives leverage. In future years, the difference-in-
differences does not diminish in magnitude but loses statistical significance, reflecting the rise
of other sources of cross-sectional variation in the leverage variables and the relatively few
dealers of each type in each year in our sample. These findings illustrate that dealers prefer that
market participants view their net derivatives exposures as small and thus low risk.
We next examine the associations of dealers’ disclosed leverage components discussed
above with their credit risk uncertainty, as proxied by the ratio of one-year to five-year maturity
CDS spreads. Duffie and Lando (2001) show theoretically that uncertainty about the value of a
firm’s assets, and thus about how close the firm is to default, raises short-term credit spreads
relative to long-term spreads, flattening (or possibly even inverting) the credit spread curve. Yu

7
(2005), Kim, Kraft, and Ryan (2013), and Arora, Richardson, and Tuna (2014) provide
empirical support for this theoretical finding using alternative proxies for asset uncertainty.
We first hypothesize that dealers’ net derivatives leverage, which we use as the best
available proxy for the incomplete and otherwise imperfect right of setoff provided by MNAs,
is positively associated with their credit risk uncertainty. Our three bases for this hypothesis are
as follows. First, we expect that the incompleteness and imperfections of the right of setoff
provided by MNAs to yield (credit risk) uncertainty about the extent, timing, and fairness of
any future close out. Second, net derivatives leverage reflects the extent to which dealers expect
the derivatives covered under MNAs not to offset, even absent the limitation of the offsetting
of the covered derivatives to the event of default and the frictions involved in closing out the
derivatives covered under these agreements upon default. Third, we expect credit risk
uncertainty to increase with the extent to which the covered gross derivatives do not offset and
thus with net derivatives leverage.8 Consistent with this hypothesis, we provide evidence that
credit risk uncertainty rises with net derivatives leverage. We further find that this effect is
stronger when net derivatives leverage is higher relative to gross derivatives leverage,
consistent with less effective offsetting of gross derivatives,9 and that it is primarily attributable
to one-year maturity CDS spreads rising with net derivatives leverage, consistent with this
leverage capturing credit risk uncertainty rather than the level of credit risk.
Consistent with prior research showing the credit risk uncertainty decreases with
disclosure quality (e.g., Yu 2005 and Akins 2018), we further hypothesize that dealers that
provide more transparent financial report disclosures about their derivatives under the 2013
requirements reduce their credit risk uncertainty related to the effectiveness of their MNAs, all
else being equal, thereby attenuating the association between net derivatives leverage and credit
8 Net derivatives leverage also reflects the extent to which any derivatives subject to unconditional netting in
transactions with derivatives clearinghouses are currently expected not to offset. In contrast with incomplete
conditional netting upon default under MNAs, we do not expect such incomplete unconditional netting to raise
appreciable credit risk uncertainty, because no imbalance of control rights exists between the contracting parties. 9 We thank the anonymous reviewer for suggesting this analysis.

8
risk uncertainty. We measure the transparency of the disclosures using an index that captures
the findability, readability, ease of use, and completeness of the disclosures. We provide
evidence consistent with this hypothesis.
We do not propose similar hypotheses about dealers’ gross minus net derivatives
leverage, because it is a noisy measure of credit risk uncertainty. In particular, gross minus net
derivatives leverage includes both the offsetting and non-offsetting portions of the fair values
of derivatives that are covered by MNAs or otherwise presented net on the balance sheet. Credit
risk uncertainty arising from closing out derivatives upon default under MNAs is logically
unrelated to this non-offsetting portion. We find that the association of gross minus net
derivatives leverage with credit risk uncertainty is insignificantly different from zero both on
average and regardless of the quality of dealers’ disclosures about their derivatives under the
2013 requirements, consistent with CDS sellers viewing gross minus net derivatives leverage
as noise with respect to credit risk uncertainty.
We emphasize that our empirical analysis is subject to two limitations. First, it is limited
by the relatively few, but typically very large (average total assets of about $900 billion) dealers
in our sample, which combined with only six years of data yields a small full sample. We
examine this sample because dealers are the paradigm firm type that holds offsetting positions
covered by MNAs. However, this sample size precludes including dealer fixed effects in our
credit risk uncertainty analysis as well as meaningfully addressing the endogeneity of dealers’
derivatives holdings, use of MNAs, and related disclosure transparency. Hence, while we
propose formal hypotheses to sharpen the exposition, readers should interpret all of the results
reported herein as descriptive.
Second, due to our effort to obtain similar numbers of IFRS and US GAAP dealers in
the full sample, our sample IFRS dealers are larger, more leveraged, and hold more derivatives
than our sample US GAAP dealers. We conduct two supplemental analyses to provide comfort
that our distinct results for the two sets of dealers are not attributable to these or other non-

9
accounting differences between them. First, we replicate our primary analyses on balanced and
more similar but much smaller subsamples of primary dealers according to the New York
Federal Reserve. Second, using entropy balancing (Hainmueller 2012), we reweight the
observations for the control subsample of US GAAP dealers to match the first and second
moments of three key dealer features—size, trading derivatives assets, and the ratio of
derivative liabilities to derivatives assets—in that subsample with those in the treatment
subsample of IFRS dealer observations. Both of these approaches yield substantially improved
(but not perfect) covariate balance, and yield similar but somewhat weaker results than in the
primary analyses using the full sample.
Despite these caveats, our study contributes in two ways to the large literatures in
banking (see Ryan 2011, Beatty and Liao 2014, and Acharya and Ryan 2016 for surveys) and
mandatory disclosure (see Leuz and Wysocki 2016 for a survey). First, we provide evidence
that the 2013 disclosure requirements led IFRS dealers to reduce offsetting gross derivatives
and to increase the effectiveness of their coverage of the remaining gross derivatives under
MNAs. These real effects of mandatory disclosure seem likely to reduce individual IFRS
dealers’ overall risk, although the former effect may involve some decrease in economic
hedging. They also seem likely to reduce systemic risk by decreasing the possibility for
counterparty risk externalities to develop (Acharya and Bisin 2014).
Second, we provide evidence that net derivatives leverage informs about dealers’ credit
risk uncertainty resulting from the incomplete and imperfect right of setoff provided by MNAs.
While Ryan (2011) and Acharya and Ryan (2016) discuss MNAs from an accounting
perspective, only Neilson et al. (2020) and our study empirically examine these implications.
We discuss Neilson et al. (2020) and the differences between this study and ours in Section II.

10
II. BACKGROUND, PRIOR LITERATURE, AND HYPOTHESES DEVELOPMENT
Derivatives, Dealers, and Master Netting Agreements
Derivatives exhibit two general types of risk: transferred risks and counterparty risk.
The risks transferred by a derivative depend on its type. A market risk derivative (such as an
interest rate swap) transfers the risk of movements of a market price (such as an interest rate)
on the value or cash flows of an underlying financial asset (such as a bond). A credit derivative
(such as a CDS) transfers the risk that a referenced credit (such as a borrowing firm) will default
on an underlying financial asset. Counterparty risk is the possibility that a party to a derivative
does not pay the amounts owed to the other party. Counterparty risk and transferred risks
interact because the amounts owed under derivatives reflect their transferred risks, and because
default by a counterparty prevents the transfer of those risks. At the level of derivatives
portfolios, default on a derivative eliminates the ability of the derivative to offset the realized
transferred risks of the remainder of the portfolio. For portfolios covered by MNAs, the ensuing
portfolio closeout eliminates the ability of all the constituent derivatives of the portfolio to offset
the future transferred risks of the portfolio.
Dealers engage in large amounts of derivatives with both end users and other dealers,
generally trying to maintain reasonably well-matched asset and liability positions (Duffie
2010). These large amounts arise in part because, when dealers hold derivatives for which they
do not wish to retain the transferred risks, rather than negotiating with the counterparties to
close out the derivatives contractually, they historically have found it more feasible, faster, and
cheaper to engage in new derivatives with offsetting transferred risks. This approach leads
dealers’ derivatives to have correspondingly large gross asset and liability fair values.
To mitigate counterparty risk, dealers typically engage in bilateral MNAs with their
frequent derivatives counterparties, both dealers and repeat clients (i.e., end-users), that cover
many over-the-counter derivatives with largely offsetting fair values (Bliss and Kaufman 2006).
MNAs generally are specified under ISDA agreements. Under these agreements, covered

11
positions are closed out and net settled only in the event of a default by either counterparty to
any covered position. In that event, MNAs grant substantively all control rights to the non-
defaulting party to close out the covered positions, subject only to the commercial
reasonableness of that party’s exercise of those rights in accordance with industry practice.
These control rights are important primarily because of two frictions that arise in closing
out derivatives. First, the covered derivatives usually comprise various different types that
transfer distinct risks (Summe 2010; Hoenig 2013), and even derivatives of the same type often
have significantly different contractual terms. The non-defaulting party may not be able to close
out disparate covered derivatives as a single net position; it may instead have to close the
derivatives out at lower levels of aggregation or even individually. Second, it is possible and
perhaps even likely that certain relevant markets become dislocated when a major dealer
defaults (e.g., Lehman Brothers on September 15, 2008), dumping large volumes of derivatives
on the market, some of which may be illiquid. Such dislocation provides the non-defaulting
party with room to exercise judgment in closing out derivatives. The non-defaulting party has
incentives to exercise this judgment to strategically close out derivatives at favorable levels of
aggregation (e.g., individually for hard-to-value derivatives to exercise maximal discretion to
increase gains or reduce losses) and at favorable times (e.g., deferring the close out of
derivatives for which it currently owes the defaulting party).
Such strategic close out has been the subject of time-consuming and expensive litigation
in some notable cases (e.g., Lehman Brothers’ bankruptcy, as discussed by Fleming and Sarkar
2014). Moreover, cases in different jurisdictions have been decided differently, yielding legal
ambiguity (Hoenig 2013). Because of the non-defaulting party’s control rights to close out the
derivatives covered under MNAs upon default, as well as legal and other frictions in that party’s
exercise of those rights, (credit risk) uncertainty exists about the extent, timing, and fairness of
any future close out of the covered derivatives upon default.
12
The credit risk uncertainty arising due to these features of MNAs is most likely to be
realized during economic stress periods such as the 2007-2009 financial crisis and the ongoing
pandemic, although this uncertainty should be reflected in CDS spreads (i.e., priced) during
non-crisis periods. In this respect, credit risk uncertainty is similar to the “crash risk” examined
in numerous empirical papers since the crisis (see Habib, Hasan, and Jiang 2018 for a survey).
Gross versus Net Balance Sheet Presentation
Accountants and others have long debated the conditions under which gross versus net
balance sheet presentation of economically offsetting positions better conveys information
about the reporting firm’s rights, obligations, and risks related to those positions.10 Because of
dealers’ extensive use of MNAs, and because derivative assets and derivative liabilities covered
by an enforceable MNA contractually offset in default, gross presentation likely significantly
overstates dealers’ counterparty risk. On the other hand, as discussed above, MNAs provide a
limited right of setoff and are subject to frictions in closing out derivatives that create
uncertainty about the extent, timing, and fairness of any future net settlement, so that net
presentation may suppress dealers’ counterparty risk.
Net presentation may also suppress the transferred risks of dealers’ derivatives. Even if
the close out upon default of the derivatives covered under MNAs occurs without friction, the
offset of the transferred risks of the covered derivatives likely is imperfect, uncertain, and
manipulable for the following reasons. First, the derivatives assets covered under MNAs usually
transfer at least somewhat different risks than the covered derivatives liabilities (Kiff et al.
2009; Hoenig 2013). MNAs generally offset different transferred risks imperfectly, if at all.11
10 The early debate is evident in the discussion in ARB 14 (1942), in particular, in William Paton’s qualified assent
and Sidney Winter’s dissent to that standard. The Basis for Conclusions sections of FTB 88-2, FIN 39, and FIN
41 illustrate the more fully articulated debate during the late 1980s and early 1990s. 11 To provide a simple illustration of this point, assume a netting agreement covers only two plain vanilla interest
rate swaps with the same fixed and floating rates but with differing notional amounts so that they have equal but
opposite fair values: (1) a received fixed swap with five-year remaining tenor (larger notional amount) and (2) a
pay fixed swap with 10-year remaining tenor (smaller notional amount). By assumption, the net fair values of the
swaps are zero. Despite this fact and the facts that the swaps are the same type of derivative exposed to the same
underlying rate spread, the smaller notional amount and longer tenor of the second swap means that the transferred
13
Second, MNAs do not provide the contracting parties with the ability to close out derivatives
in the absence of default, potentially constraining their ability to manage the transferred risks
in real time. Third, most derivatives trade over-the-counter, and dealers typically fair value
these derivatives by inserting (judgmental) Level 2 or 3 inputs into (imperfect) valuation models
based on numerous assumptions. This approach may yield differential noise or bias in the
estimated fair values of different covered derivatives (Fischer 2013). Fourth, to fair value their
large portfolios of derivatives cost effectively, dealers often make numerous additional
assumptions (e.g., bucketing of derivatives based on their maturities, other contractual features,
and relevant market price variables) to calculate significant fair value adjustments, such as bid-
offer reserves and credit and debt valuation allowances, at the portfolio level (EY 2020).12
These additional assumptions can suppress valuation-relevant differences between the covered
derivative assets and liabilities. For these reasons, neither gross nor net balance sheet
presentation of derivatives fully captures their transferred and counterparty risks (Kiff et al.
2009; Ryan 2011; Acharya and Ryan 2016).
Requirements for Net Balance Sheet Presentation under IFRS and US GAAP
The longstanding accounting principle governing gross versus net balance sheet
presentation, expressed no later than in ARB 43 (1953, ¶3B), is “the offsetting of assets and
liabilities in the balance sheet is improper except where a right of setoff exists” (ASC 210-20-
05-1).13 The question is what constitutes a (sufficient) right of setoff. In US GAAP, FIN 39
interest rate risks of the two swaps do not fully offset; specifically, the risk transferred by the first swap dominates
that of the second swap over the first five years of tenor, while only the second swap covers the second five years
of tenor. The coverage of the two swaps under the MNA does nothing to remedy this mismatch. The derivatives
covered by dealers’ MNAs generally transfer far more diverse risks than the two very similar swaps in this
example, and so the offsetting of the transferred risks of dealers’ covered derivatives generally will be less. 12 For example, to adjust the fair values of CDS for the bid-offer spread that CDS dealers would bear were they to
exit the CDS they hold (i.e., to comply with the definition of fair value as exit value), these dealers typically bucket
(i.e., categorize) their derivatives into a limited number of remaining maturity buckets and a limited number of
credit spread (i.e., CDS premium) buckets and estimate a valuation adjustment for each two-dimensional bucket
based on historical data. They then apply that adjustment to the modeled fair value for the CDS in that bucket. A
major CDS dealer’s use of this approach can be found on p. 31 of
https://web.stanford.edu/~jbulow/Lehmandocs/docs/BARCLAYS/LBEX-BARFID%200011765-0011862.PDF 13 ARB 11 (1942) previously expressed the first part of this principle, but without the second part regarding the
right of setoff. Hence, the importance of the right of setoff in financial accounting appears to have crystalized in
14
(1992) first clearly addressed this question in the context of derivatives and similar instruments.
Paragraph 5 of FIN 39 (ASC 210-20-45-1) states that the right of setoff “exists when all of the
following conditions are met: a. Each of two parties owes the other determinable amounts. b.
The reporting party has the right to set off the amount owed with the amount owed by the other
party. c. The reporting party intends to set off. d. The right of setoff is enforceable at law.”
MNAs generally do not satisfy condition b, because the counterparties do not have the right to
set off the amounts owed absent default, or condition c, because contractual terms can be waived
or rewritten if the parties’ intent changes. However, paragraph 10 of FIN 39 (ASC 210-20-45-
5) allows, but does not require, net balance sheet presentation of the derivatives covered by an
enforceable MNA that specifies net settlement only in the event of default, regardless of the
reporting firm’s intent.
In IFRS, IAS 32 (1995) first addressed this question. Paragraph 42 of IAS 32 allows net
presentation only when the reporting firm “(a) currently has a legally enforceable right to set
off the recognized amounts; and (b) intends either to settle on a net basis, or to realize the asset
and settle the liability simultaneously.” The two key differences between IFRS and US GAAP
are the inclusion of “currently” in condition (a) of paragraph 42 of IAS 32, which implies that
the right of setoff must be unconditional, not conditional on default, and the absence of a
provision in IFRS similar to paragraph 10 of FIN 39. Because of these differences, MNAs do
not satisfy the IFRS criteria for the right of setoff. Hence, IFRS dealers present much larger
derivative assets and liabilities on the balance sheet than do US GAAP dealers, all else equal.
These significantly different balance sheet presentations undermine the comparability
of the numbers produced under the two sets of accounting standards (IASB 2011). Compared
to net presentation, gross presentation yields higher leverage measured using reported numbers.
accounting sometime between 1942 and 1953. Likely roots of the notion of the right of setoff in financial
accounting are the law regarding settlements of partnership and other claims (Zeff 1957), the ability for taxpayers
to pay taxes using certain US federal government securities during World War II (ARBs 14 and 43), and the focus
on solvency in the development of financial accounting due to the central use of financial statements by banks
(Heath 1978).

15
Empirical research provides evidence that reported leverage is a key factor in investors’
assessments of firm risk (Blankespoor et al. 2013). 14 For this reason, in this study we focus on
the differential effects of gross versus net presentation on financial leverage.
2013 Disclosure Requirements
After the financial crisis, the IASB and FASB tried and failed to converge their balance
sheet presentation requirements for derivatives and other types of contractually offsetting
financial instruments, such as repurchase agreements. To mitigate the consequences of this
failure and enhance the comparability of financial statements provided under IFRS versus US
GAAP, the two accounting standard setters jointly developed and in December 2011 issued
common disclosure requirements. As of January 1, 2013, IFRS (amendments to IFRS 7) and
US GAAP (ASU 2011-11, ASC 210-20-50-3) require reporting firms to disclose, for all
financial assets and financial liabilities that are presented net on the balance sheet or that are
presented gross but are subject to enforceable MNAs: (a) the gross amounts of the financial
assets and financial liabilities prior to any netting; (b) the amounts netted on the balance sheet
in accordance with IFRS or US GAAP, whichever applies; (c) the amounts presented on the
balance sheet (i.e., a minus b); (d) the amounts that are not netted on the balance sheet, including
financial collateral; and (e) the fully net amounts (i.e., c minus d). US GAAP requires these
disclosures to be made for the current period and “all comparative periods presented.” For both
IFRS and US GAAP dealers, their 2013 annual reports usually contain the disclosures for 2012
(i.e., one prior year).
On the balance sheet, IFRS dealers present derivatives (mostly) gross, while US GAAP
dealers present derivatives (mostly) net. Hence, item (b) generally is large for US GAAP dealers
and small for IFRS dealers, while item (d) generally is large for IFRS dealers but limited to
non-netted collateral for US GAAP dealers. Figure 1 presents a numerical example and visual
14 Koonce, Leiter, and White (2019) conduct experiments to examine the related issue of linked balance sheet
presentation of gross amounts of offsetting assets and liabilities.
16
depiction comparing these required disclosures for the same set of derivatives for firms that
prepare their financial statements under IFRS versus under US GAAP. Since non-netted
collateral generally is a minor amount, to keep the discussion simple, in the remaining text and
Figure 1 (but not in the empirical analysis) we ignore any non-netted collateral, so that item (d)
is portrayed as zero (equivalently, item c equals item e) for US GAAP dealers. Appendix 1
provides examples of disclosures under the 2013 disclosure requirements in the 2013 annual of
UBS Group AG, an IFRS dealer, and JPMorgan Chase & Co, a US GAAP dealer.
The 2013 disclosure requirements provide new information for IFRS dealers, because
these dealers previously were not required to disclose, and typically did not voluntarily disclose,
these net fair values. In particular, these disclosures provide the first clear indication of the
extent of IFRS dealers’ economically offsetting gross derivatives that rely on MNAs to effect
net settlement in the event of default. In contrast, the 2013 disclosure requirements provide no
new information for US GAAP dealers, because they have been required to report the gross fair
values of derivatives in their (public) bank regulatory filings (Schedule HC-L of FR Y-9C)
since 1995. Moreover, unlike IFRS dealers, 11 (12) of the 21 US GAAP dealers in our sample
had previously voluntarily disclosed gross fair values (usually items a, b, and c, but not d or e,
in Figure 1) in their 2008 (2009-2012) financial reports. The disclosure requirements may
increase the visibility of US GAAP dealers’ gross fair values of derivatives, however, by
ensuring that they also provide these fair values in their financial reports.
Prior Literature: Neilson et al. (2020)
While our study is related to the large literature on off-balance sheet financing beginning
with Bowman (1980) cited in footnote 2, it is most directly related in its setting and focus to
Neilson et al. (2020). Hence, in this section we describe Neilson et al. (2020) and discuss how
our study provides additional empirical results and insights beyond that study.
Like our study, Neilson et al. (2020) examine disclosures under the 2013 requirements
by a sample of IFRS and US GAAP banks. Neilson et al. (2020) provide evidence that the

17
difference between gross and net derivatives fair values scaled by total assets, which they refer
to as “offsetable derivatives”,15 is positively associated with banks’ credit risk, as measured by
CDS spreads, and also with their systemic risk, as measured by the decline in share price
conditional on a severe market decline (Acharya, Pedersen, Philippon, and Richardson’s 2017
marginal expected shortfall, or MES). These findings are consistent with MNAs not fully
eliminating the transferred and counterparty risks of gross derivatives. In this respect, these
findings are similar in spirit to ours regarding the association between net derivatives leverage
and credit risk uncertainty. Neilson et al. (2020) further find that recognition rather than
disclosure of offsetable derivatives increases the association of offsetable derivatives with
MES, which is determined in substantial part by less sophisticated equity investors, but not with
CDS spreads, which are determined by sophisticated CDS investors. This finding is consistent
with prior findings in the recognition versus disclosure literature that financial statement
presentation, which can be thought of as the most prominent form of disclosure, helps less
sophisticated users of financial reports to identify information relevant for their decisions.
Our study differs from Neilson et al. (2020) in two primary sets of ways. First, the
samples in the two studies differ reflecting their distinct focuses. Neilson et al. (2020) examine
a substantially broader sample of 57 IFRS banks and 51 US GAAP banks that includes banks
for which derivatives dealing, offsetting derivatives assets and liabilities, and MNAs are of
minor significance. As one manifestation of this low significance, almost half of their US
GAAP banks choose to present offsetting derivatives assets and liabilities gross on the balance
sheet, whereas all of our US GAAP dealers choose net balance sheet presentation. Neilson et
al.’s (2020) broader sample is motivated by their focus on the importance of recognition versus
disclosure. In particular, this broader sample enables Neilson et al. (2020) to compare
recognition versus disclosure of gross derivatives fair values for banks under US GAAP, not
15 Neilson et al.’s (2020) offsetable derivatives variable has the same numerator as our gross minus net derivatives
leverage variable but a different denominator: total assets as opposed to tangible common equity.
18
just recognition for IFRS banks versus disclosure for US banks. In contrast, our narrower
sample of 26 IFRS dealers and 21 US GAAP dealers is motivated by our focus on three leverage
components that users of financial reports can calculate and compare for the two sets of dealers
from their common required disclosures effective as of 2013. Our more restrictive sample
criteria ensure that these leverage components are significant for all sample dealers.
Second, we provide three sets of evidence beyond that reported in Neilson et al. (2020).
(A) We provide entirely new evidence that the 2013 disclosure requirements have real effects
on IFRS dealers’ usage of gross derivatives and the effectiveness of their coverage of those
derivatives under MNAs. (B) Extending Neilson et al.’s (2020) findings that offsetable
derivatives are positively associated with the level of credit risk, as measured by the level of the
five-year CDS spread, we show that net derivatives leverage is associated with uncertainty
about credit risk, as measured by the ratio of one-year CDS spread to the five-year CDS spread.
We also show that net derivatives leverage, but not gross minus net derivatives leverage, is
associated with the levels of both one-year CDS spreads and five-year CDS spreads. These
results differ from those in Neilson et al. (2020), likely reflecting our narrower dealer sample
for which MNAs are more important and probably used more effectively. (C) We provide
entirely new evidence that dealers that provide more transparent disclosures under the 2013
requirements exhibit a less positive association between net derivatives leverage and credit risk
uncertainty.
Hypotheses about the Real Effects of 2013 Disclosure Requirements
As discussed above, under the 2013 disclosure requirements IFRS dealers provide new
information about their net derivatives fair values. These dealers had no incentives to engage
in MNAs prior to these disclosure requirements in order to manage their financial report
numbers (rather than to mitigate their economic risks), as MNAs had no effects on their
financial statements and required disclosures; moreover, IFRS dealers generally did not provide
voluntary disclosures of the economic effects of MNAs. For these reasons, we expect that the
19
requirements provide new financial reporting incentives for IFRS dealers to reduce unnecessary
offsetting gross derivatives, thereby directly reducing their gross minus net derivatives leverage
and indirectly reducing their net derivatives leverage, and to increase the effectiveness of their
coverage of gross derivatives under MNAs, thereby reducing their net derivatives leverage.
In contrast, US GAAP dealers provide no new information under the 2013 disclosure
requirements. Moreover, these dealers have had a strong financial reporting incentive to engage
in MNAs since the 1992 effective date of FIN 39, the standard that first allowed net presentation
of derivatives covered by MNAs. For these reasons, we expect that the requirements have lesser
and possibly no effects for US GAAP dealers.
We expect that dealers have considerable ability to reduce economically offsetting gross
derivatives without increasing their risk or reducing their profit. Dealers that hold offsetting
derivatives can negotiate with their counterparties to contractually close out the derivatives, say
by engaging in bilateral or multilateral compression trades16 that contractually eliminate
offsetting trades. All publicly traded IFRS dealers have had the incentive to reduce the gross
amounts of their derivatives after the effective date of the 2013 disclosure requirements, which
should mitigate hold-up problems arising in close outs of offsetting derivatives. Similarly,
dealers can prevent the accumulation of new offsetting derivatives over time by contractually
closing out unwanted derivatives as soon as they determine that they do not wish to retain the
transferred risks, rather than by engaging in new derivatives that economically offset these
unwanted derivatives, the historically more common approach.
We also expect that dealers have considerable ability to enhance the effectiveness of
MNAs. They can do so by covering more similar derivatives with more fully offsetting
transferred risks under MNAs. They can also amend the contractual language of the ISDA
16 A compression trade replaces a set of preexisting trades among two or more counterparties with a single trade
that captures the net exposure created by the preexisting trades.

20
agreements to mitigate the ability of the non-defaulting party to close out positions in ways that
harm the non-defaulting party.
Based on the discussion above, we formally state our first hypothesis in the alternative
first for the treatment sample of IFRS dealers and then for the difference-in-differences between
the treatment sample and the control sample of US GAAP dealers:17
H1(IFRS): IFRS dealers reduce their gross minus net derivatives leverage and net
derivatives leverage as a result of the 2013 disclosure requirements.
H1(DiD): US GAAP dealers reduce their gross minus net derivatives leverage and net
derivatives leverage less than IFRS dealers as a result of the 2013 disclosure
requirements.
Hypotheses about the Association between Net Derivatives Leverage and Credit Risk
Uncertainty
We next hypothesize that dealers’ net derivatives leverage, which we use as the best
available proxy for the incomplete and otherwise imperfect right of setoff provided by MNAs,
is positively associated with their credit risk uncertainty. Our three bases for this hypothesis are
as follows. First, we expect that the incompleteness and imperfections of the right of setoff
provided by MNAs to yield (credit risk) uncertainty about the extent, timing, and fairness of
any future close out, particularly from the perspective of the counterparty that is more likely to
default. Second, net derivatives leverage reflects the extent to which the derivatives covered
under MNAs are expected not to offset, even absent the limitation of the offsetting of the
covered derivatives to the event of default and the frictions involved in closing out the
derivatives covered under these agreements upon default. Third, we expect credit risk
uncertainty to increase with the extent to which the covered gross derivatives do not offset and
thus with net derivatives leverage. We formally state this hypothesis in the alternative as:
17 In January 2013, the Basel Committee issued its liquidity coverage ratio requirements, a central component of
Basel III. The phase-in of these requirements began in 2015, with the 100% minimum liquidity coverage ratio
requirement applying as of 2019. As even the 2015 phase-in date follows the effective date of the 2013 disclosure
requirements by two years, our tests of H1 should not be affected by the liquidity coverage ratio requirements.
21
H2: Dealers’ credit risk uncertainty is positively associated with their net derivatives
leverage.
Lastly, consistent with prior research showing the credit risk uncertainty decreases with
disclosure quality (e.g., Yu 2005 and Akins 2018), we hypothesize that dealers that provide
more transparent financial report disclosures about derivatives under the 2013 requirements
reduce CDS writers’ credit risk uncertainty related to the dealers’ MNAs, all else equal, and
that this reduction of credit risk uncertainty attenuates the association between dealers’ net
derivatives leverage and credit risk uncertainty. We formally state this hypothesis in the
alternative as:
H3: Credit risk uncertainty is less positively associated with net derivatives leverage for
dealers that provide more transparent disclosures in compliance with the 2013 disclosure
requirements.
We do not propose hypotheses similar to H2 and H3 about dealers’ gross minus net
derivatives leverage, which we expect to be mostly or entirely noise with respect to the credit
risk uncertainty arising from the control rights and frictions associated with closing out
derivatives upon default under MNAs. In particular, gross minus net derivatives leverage
includes both the offsetting and non-offsetting portions of the fair values of derivatives that are
covered by MNAs or otherwise presented net on the balance sheet. Credit risk uncertainty
arising from closing out derivatives upon default under MNAs is logically unrelated to this non-
offsetting portion. This is the case even though, as with any other source of leverage, dealers’
level of credit risk and overall risk should rise with (both portions of) gross minus derivatives
leverage, consistent with the findings of Neilson et al. (2020).
III. RESEARCH DESIGNS
Leverage Components
The most direct effect of gross versus net balance sheet presentation of economically
offsetting derivatives covered by MNAs is on dealers’ reported leverage. Following

22
Blankespoor et al. (2013), we measure reported leverage (RepLev) as tangible assets (TAss)
divided by tangible common equity (𝑇𝐶𝐸). We measure reported derivatives leverage
(RepDerLev) as reported derivatives assets (RepDerAss, i.e., item (c) for assets in Figure 1)
divided by TCE. RepLev and RepDerLev are not comparable for IFRS and US GAAP dealers,
which present derivatives covered by MNAs gross and net, respectively.
Accordingly, we focus on three non-overlapping leverage ratios that are comparable
across the two sets of dealers. First, non-derivatives leverage (NonDerLev) equals RepLev
minus RepDerLev. Second, net derivatives leverage (NetDerLev) equals net derivatives assets
(NetDerAss, i.e., item (e) for assets in Figure 1) divided by TCE. Lastly, gross minus net
derivatives leverage (GroMinNetDerLev) equals the difference between gross derivatives assets
(GroDerAss, i.e., item (a) for assets in Figure 1) and NetDerAss divided by TCE.
To test Hypothesis H1 that the 2013 disclosure requirements, which became effective
on January 1, 2013, led IFRS dealers to reduce their offsetting gross derivatives and increase
the effectiveness of their coverage of derivatives under MNAs more than did US GAAP dealers,
we conduct a difference-in-differences analysis using a regression model with the following
features. First, we include dealer fixed effects in the model to capture the average pre-treatment
year (2012) differences in GroMinNetDerLev and NetDerLev across IFRS and GAAP dealers.
Second, we include indicators for each post-treatment year (2013 to 2017) to demonstrate the
sharpness of the effects and to help rule out the possibility that any uncontrolled for sources of
cross-sectional variation, which are likely to arise in such a dynamic environment as derivatives
dealing, drive or obscure our findings. Third, we include US GAAP separately and interacted
with the year indicators to distinguish the effects for US GAAP dealers versus IFRS dealers in
each post-treatment year. These features are captured in the following regression model:18
18 Equation (1) represents the treatment (actually more heavily treated) group (IFRS dealers) as the benchmark and
includes interactions for the control (actually less heavily treated) group (US GAAP dealers) to capture differences
between the two groups. While atypical, this representation is informationally equivalent to the typical
representation and better captures our framing of H1, thereby allowing for a more linear exposition of the results
of the tests of that hypothesis.

23
GroMinNetDerLev or NetDerLev = Σ5t=1 (bt * Year2012+t) + c * US GAAP
+ Σ5t=1 (dt * Year2012+t * US GAAP) (1)
+ dealer fixed effects + εi,t.
We also estimate a nested version of equation (1) that replaces the five-year indicators with a
single post-treatment indicator variable, POST. As the estimation results will indicate, this
standard difference-in-differences model captures the treatment effects less powerfully and
interpretably than does equation (1). Appendix 2 provides the definitions of all model variables.
Credit Risk Uncertainty
Following Duffie and Lando (2001), Yu (2005), Kim et al. (2013), and Arora et al.
(2014), we measure dealers’ credit risk uncertainty as the ratio of their current one-year
maturity CDS credit spread (CDS1y) to their current five-year maturity CDS spread (CDS5y),
denoted CDS1y5y.19 Because credit risk uncertainty resolves over time, higher uncertainty
results in higher CDS1y relative to CDS5y and thus higher CDS1y5y, that is, a flatter (or
possibly more inverted) CDS spread curve.
Hypothesis H2 posits that dealers’ credit risk uncertainty is positively associated with
NetDerLev. Hypothesis H3 posits that this association is attenuated for dealers that provide
more transparent disclosures in satisfying the 2013 disclosure requirements. We test both of
these hypotheses using the following model:
CDS1y5yi,t = α + β1 NonDerLevi,t + β2 NetDerLevi,t + β3 GroMinNetDerLevi,t
+ γ1 QUAL + γ2 (NetDerLevi,t * QUAL) (2)
+ γ3 (GroMinNetDerLevi,t * QUAL) + Σs δs controlsi,t,s
+ time fixed effects + εi,t.
19 We measure credit risk uncertainty using CDS spreads rather than bond yields or spreads, primarily because
CDS spreads are a purer measure of credit risk (e.g., unlike bond yields, CDS spreads are not affected by the term
structure of risk-free interest rates). A CDS spread reflects CDS sellers’ current expectations of the likelihood that
the referenced credit will be determined to default over the maturity of the CDS and also of the loss given default
in that event (Rathgeber and Wang 2011). Additional reasons for our choice include prior research findings that
CDS sellers have higher ability than bond investors to assess credit risk based on financial report information (Hu,
Liu, and Zhu 2018) and that CDS typically are more liquid than the bonds issued by the referenced credit (Coudert
and Gex 2010).

24
Equation (2) includes all three components of leverage that are comparable across IFRS and
US GAAP dealers to capture the distinct information conveyed by these components. It includes
a proxy for the transparency of dealers’ disclosures under the 2013 requirements, QUAL,
separately and interacted with NetDerLevi,t and GroMinNetDerLevi,t. We describe the
construction of QUAL, which increases with disclosure quality, in Section IV (briefly) and
Appendix 5 (in detail).
H2 predicts that the coefficient β2 on NetDerLevi,t is positive. H3 predicts that the
coefficient γ2 on NetDerLevi,t * QUAL is negative. In order to provide confidence that the results
of the test of H3 are not attributable to QUAL systematically differing for IFRS versus US
GAAP dealers, in specification analysis we also include the indicator US GAAP for dealers that
report under US GAAP linearly and interacted with NetDerLevi,t and GroMinNetDerLevi,t.
Following many banking studies (e.g., Ahmed, Kilic, and Lobo 2011), equation (2)
controls for three variables: the natural logarithm of total assets (Size), net income divided by
total assets (ROA), and non-performing loans divided by total assets (NPL). Following many
CDS studies (e.g., Callen, Livnat, and Segal 2009), the equation includes fixed effects for the
four main types of CDS documentation (or restructuring) clauses (ISDA 2014).20 We include
time fixed effects to ensure that our results are not attributable to variation in CDS1y5y arising
from changing macroeconomic or financial market conditions (Das, Hanouna, and Sarin 2009)
or to common time trends for CDS1y5y and NetDerLev.
We estimate equation (2) using OLS over the 2012−2017 years for which dealers
provide disclosures of current gross and net derivatives fair values in compliance with the 2013
disclosure requirements. We calculate standard errors clustering observations by dealer
(Petersen 2009). Given our small sample of 180 observations and the inclusion of nine or more
explanatory variables and five time fixed effects, the addition of 46 dealer fixed effects simply
20 The four types of documentation clauses (“doc clauses”) in CDS contracts are XR (no restructuring), CR (old/full
restructuring), MR (modified restructuring), and MM (modified-modified restructuring). The relative popularity
of these types has varied over time.

25
absorbs too much sample variation, rendering the results discussed in Section V insignificant.
To demonstrate whether and the extent to which observed variation in CDS1y5y is attributable
to the numerator versus the denominator of this variable, we also estimate equation (2) with
each of CDS1y and CDS5y as the dependent variable. The results using these alternative
dependent variables also corroborate Neilson et al.’s (2020) findings regarding the association
between derivatives leverage and the level of credit risk.
IV. DATA
Sample Selection
We identify dealers reporting under IFRS or US GAAP in two steps. First, we identify
dealers from the “Primary Dealers” list from the New York Federal Reserve,21 which includes
the main US dealers, and from the “Primary Dealers” and “Members” lists from the Association
for Financial Markets in Europe (AFME),22 which include the main European dealers. We
identify each dealer’s ultimate owner (usually the top banking group or bank holding company)
from Bureau van Dijk Bankfocus (hereafter, Bankfocus). We collect and analyze data for these
ultimate owners, which for simplicity we continue to refer to as dealers. After excluding two
dealers that report under Japanese GAAP (Daiwa Securities Group and Mizuho Financial
Group), as well as BGC Holdings owing to its opaque structure and lack of data availability, 35
banking groups remain of which 26 (nine) report under IFRS (US GAAP).
Second, because the sample resulting from the first step yields unbalanced numbers of
IFRS and US GAAP dealers, in part because the ultimate owners of many dealers operating in
the US report under IFRS rather than under US GAAP, we identify additional US GAAP dealers
from the 130 “Holding Companies with Assets Greater than $10 Billion” during the 2005Q1 to
21 https://www.newyorkfed.org/markets/primarydealers (20 Sep 2017). 22 These lists are available at https://www.afme.eu/en/divisions-and-committees/primary-deals-rates/ and
https://www.afme.eu/Membership/Members-Derectory (20 Sep 2017). Adding the AFME’s “Members” list to its
“Primary Dealers” list adds four IFRS dealers (Bankia, Belfius, Lloyds, and Nordea). As these are somewhat to
very important banking groups (e.g., Nordea is the largest bank in Scandinavia) and the AFME’s selection criteria
for primary dealers is rather opaque, we include these four additional dealers in our sample.

26
2017Q4 period from the National Information Center of the Federal Financial Institutions
Examination Council (FFIEC).23 We include these banks in the sample if their ratio of reported
trading derivatives liabilities to reported trading derivative assets lies between 0.80 and 1.20
(indicating fairly well-matched trading derivatives books, consistent with dealing rather than
with speculation or hedging), their ratio of reported trading derivative assets to total assets
exceeds 0.5% (indicating a reasonable amount of dealing activity),24 and their ultimate owner
reports under US GAAP.25 These criteria add 12 US GAAP dealers,26 yielding a final sample
of 47 dealers, of which 26 (21) report under IFRS (US GAAP).
Appendix 3 lists the sample dealers, whether they report under IFRS or US GAAP, and
how we identify them. To provide a sense for the homogeneity of the sample dealers, Appendix
4 plots, for each dealer, the mean of gross derivatives liabilities divided by gross derivative
assets (i.e., a matched-book measure) for 2012−2017 on the vertical axis against the mean of
gross derivative assets divided by total assets (i.e., a derivatives activity measure) for the same
period on the horizontal axis. The dealers all have reasonably to very well-matched books. As
is invariably the case in studies examining banks’ derivatives activity, the level of activity varies
considerably across dealers.
Data Sources
We obtain financial report and CDS credit spread data for our global sample of dealers
for the years 2012–2017 from multiple sources. For both IFRS and US GAAP dealers, we
obtain financial statement data from Bankfocus. We hand collect all five derivatives assets and
liabilities fair value variables required to be disclosed under the 2013 standard (i.e., gross, gross
minus reported, reported, reported minus net, and net, as summarized in Figure 1 and with
23 https://www.ffiec.gov/nicpubweb/nicweb/HCSGreaterThan10B.aspx (2 May 2018). 24 We measure the first two criteria using data from the “Bank Regulatory - Bank Holding Companies” database
of Wharton Research Data Services (WRDS). 25 Five banks whose ultimate owners report under IFRS met the first two of these criteria. 26 A 1.0% threshold for the second criterion would add eight rather than 12 US GAAP dealers.
27
sample disclosures in Appendix 1) from dealers’ 2013−2017 financial reports, which we obtain
from their websites.27 Data coverage for 2013−2017 is very high with only three percent
missing observations. Data coverage for 2012 is somewhat lower with 19 percent missing
observations. While US GAAP dealers have disclosed gross derivatives assets fair values in
bank regulatory reports since 1995, IFRS dealers did not have to disclose, and typically did not
voluntarily disclose, net derivatives fair values prior to 2012.28 We convert all unscaled data to
millions of US dollars using current exchange rates from WRDS Federal Reserve Bank Reports.
We obtain daily data on one-year and five-year maturity CDS spreads for the years 2012–
2017 from WRDS Markit.29 We use end-of-year CDS spreads, but untabulated results using
average spreads during the year are similar. For each of these maturities, we pick the one CDS
spread for each dealer that has the most frequent combination of (1) tier group, (2)
documentation clause (after 2014, we use ISDA’s revised “doc clause” definition), and (3)
currency. As WRDS Markit provides CDS spreads in decimal form, we multiply these spreads
by 10,000 to convert them to basis points.
As described in detail in Appendix 5, we compile zero-one indicators for four dimensions
of the transparency of dealers’ disclosures under the 2013 standards: (1, findability) Is the
information provided in its own subsection of the notes to the financial statements? (2,
27 We obtain these data from dealers’ annual financial reports or Form 10-K filings when they are available. When
these filings are not available, we obtain the data from their Form 20-F filings. We could not obtain a report for
Citizens Financial Group, Inc., in 2013, because it remained a subsidiary of RBS until 2014. We merged the data
for Unionbancal in 2012–2013 and for MUFG Americas Holdings Corporation in 2014–2017 into a single time
series under the name of the latter, because it is the bank holding company for MUFG Union Bank, N.A, which
filed under the name “Unionbancal” through 2013. 28 In an unsuccessful attempt to lengthen the pre-treatment period, we collected whatever derivatives assets and
liabilities fair value information is available for IFRS dealers for the years 2008−2011, trying to construct the same
five variables required to be disclosed under the 2013 requirements. This attempt yields 72 percent missing
observations, consistent with the 2013 disclosure requirements providing substantial new information for IFRS
dealers. The reasons why a minority of IFRS dealers provide more information than the rest about net derivatives
fair values in the years prior to 2012 generally are unclear. One factor that we were able to observe in a few cases
is country-specific regulation; for example, UBS recognized net derivatives fair values under Swiss accounting
and gross fair values under IFRS. 29 We are unable to obtain CDS spreads from WRDS Markit for seven dealers: Belfius Bank SA/NV, BOK
Financial Corporation, Citizens Financial Group Inc., Comerica Incorporated, Cooperatieve Rabobank U.A.,
Jefferies Group LLC, and Regions Financial Corporation. In addition, these data are only partially available for
Northern Trust Corporation and Lloyds Banking Group Plc.
28
readability) Is the information provided in a structured table or list? (3, ease of use) Is the
information for derivatives assets and derivatives liabilities provided or summarized in a single
line? (4, completeness) Are all five required variables disclosed for both derivatives assets and
derivatives liabilities? We create an aggregate disclosure transparency index, QUAL, equal to
the sum of these four indicator variables. Hence, QUAL takes values from 0 (least transparent)
to 4 (most transparent).
V. EMPIRICAL ANALYSIS
Depictions of Differing Balance Sheet Presentations of Offsetting Derivatives by IFRS and
US GAAP Dealers
The upper two panels of Figure 2 depict the sizeable differences in balance sheet
presentation of derivatives (mostly gross) by IFRS dealers under IAS 32 versus (mostly net) by
US GAAP dealers under FIN 39 (ASC 210-20-45) over the 2012-2017 sample period. The
upper left panel depicts reported derivative assets fair values (RepDerAss) divided by gross
derivatives assets fair values (GroDerAss), that is, the extent to which gross derivatives assets
fair values are presented gross rather than net on the balance sheet. This ratio is approximately
65 percent for IFRS dealers, about twice the level of the ratio for US GAAP dealers, throughout
the sample period.
Similarly, the upper right panel of Figure 2 depicts net derivative assets fair values
(NetDerAss) divided by reported derivatives assets fair values (RepDerAss), that is, the extent
to which the fair values of derivatives assets subject to enforceable MNAs are presented net
rather than gross on the balance sheet. This ratio is about 85 percent for US GAAP dealers and
about 15 percent for IFRS dealers.
Depictions of the Real Effects of the 2013 Disclosure Requirements
The lower left panel of Figure 2 and Figure 3 depict real effects of the 2013 disclosure
requirements. The lower left panel of Figure 2 depicts the difference between reported and net
derivatives assets fair values (RepDerAss-NetDerAss) divided by the difference between gross
29
and reported derivatives assets fair values (GroDerAss-RepDerAss). This ratio is meaningful
primarily for IFRS dealers, for which it captures the relative extents to which, in compliance
with IAS 39’s requirements, these dealers present the fair value of derivatives subject to
conditional netting under MNAs gross on the balance sheet versus present the fair values of
derivatives subject to unconditional netting net on the balance. This ratio increases sharply from
2012 to 2013 for IFRS dealers, and, after a small bump down in 2014, continues to trend up
fairly strongly for these dealers through the end of the sample period in 2017. This immediate
increase and subsequent upward trend are consistent with IFRS dealers more effectively
covering derivatives under MNAs after the effective date of the 2013 disclosure requirements.
For completeness, Figure 2 also depicts this ratio over time for US GAAP dealers. For these
dealers, this ratio is close to zero in all sample years, as the numerator only includes the minimal
amount of non-netted collateral.
Figure 3 depicts the sum of non-derivatives leverage (NonDerLev) and either gross
derivatives leverage (GroDerLev) or net derivatives leverage (NetDerLev) for both IFRS and
US GAAP dealers during our sample period; we add NonDerLev to the derivatives leverage
variables to provide a sense for how the two sets of dealers’ reported leverage are differentially
affected by the required versus alternative presentations of derivatives fair values. For IFRS
dealers, the summed leverage variables involving both gross and net derivatives leverage
decrease sharply in 2013, and these variables continue to trend down more gradually over the
remainder of the sample period. The decreases are larger for the sum involving gross derivatives
leverage than for the one involving net derivatives leverage, so that gross minus net derivatives
leverage (GroMinNetDerLev) decreases during the sample period. The immediate decreases
and gradual downward trends in these ratios are consistent with IFRS dealers avoiding
unnecessary gross derivatives usage and increasing the effectiveness of the coverage of their
remaining gross derivatives under MNAs after the effective date of the 2013 disclosure
requirements.
30
For US GAAP dealers, Figure 3 evidences a noticeable decrease in the summed leverage
variable involving gross derivatives leverage in from 2012 to 2013. However, the trend for this
sum for these dealers is only slightly downward over the entire sample period, while the trend
for the sum involving net leverage is slightly upward over that period, so that gross minus net
derivatives leverage (GroMinNetDerLev) decreases during the sample period, similar to the
trend in this variable for IFRS dealers. Overall, however, the real effects of the 2013 disclosure
requirements on the leverage variables are considerably milder for US GAAP dealers than for
IFRS dealers, consistent with disclosures under these requirements conveying much less new
information for US GAAP dealers.
Descriptive Statistics for the Model Variables in the Real Effects Analysis
Table 1 reports descriptive statistics for the equation (1) variables. Panel A of the table
reports the mean and distributions of the variables for the full sample. Panel B reports the mean
and median of the variables for the IFRS and US GAAP dealer subsamples, as well as t-tests of
the differences in the means of the variables and two-sample Wilcoxon rank-sum tests of the
differences of the distributions of the variables. For simplicity we focus the discussion on the
means of the variables and the significance of the t-tests of differences in the means across the
two sets of dealers.
Reflecting dealers’ high leverage, the mean of NonDerLev is 18.74 in the full sample,
and it is significantly higher at 21.88 for IFRS dealers versus 14.84 for US GAAP dealers.
Reflecting dealers’ extensive use of derivatives, the mean of GroMinNetDerLev is 4.37 in the
full sample, and it is significantly higher at 4.92 for IFRS dealers versus 3.65 for US GAAP
dealers. Reflecting dealers’ extensive use of MNAs, compared to the the mean of
GroMinNetDerLev, the mean of NetDerLev is much lower at only 0.30 in the full sample, and
it is significantly higher at 0.34 for IFRS dealers versus 0.25 for US GAAP dealers. As
discussed in the introduction, these differences reflect our expansion of the US GAAP dealer
subsample to obtain more balanced numbers of IFRS and US GAAP dealers. Even with this
31
expansion, only 45 percent of the sample observations are for US GAAP dealers. Later in the
paper, we conduct analyses using a restricted sample of New York Federal Reserve primary
dealers and entropy balancing to help provide confidence that our results are not attributable to
differences between the two sets of dealers.
Tests of the Real Effects of the 2013 Disclosure Requirements
Table 2 reports the tests of the two parts of H1, both of which are based on the estimation
of equation (1). Panel A reports the tests using indicators for each post-treatment year, while
Panel B reports the tests using a single indicator for the entire post-treatment period (i.e., a
standard pre- versus post-treatment period difference-in-differences model).
Columns (1) and (2) of each panel report the results of the estimations of nested versions
of equation (1) for the sample of IFRS dealers only. These columns test H1(IFRS), which posits
that the 2013 disclosure requirements led IFRS dealers to reduce NetDerLev and
GroMinNetDerLev below their pre-treatment levels. Specifically, columns (1) and (2) of Panel
A [B] report the differences in NetDerLev and GroMinNetDerLev, respectively, for IFRS
dealers from the benchmark pre-treatment year of 2012 to each post-treatment year from 2013
to 2017 [the entire post-treatment period].
Consistent with H1(IFRS), in column (1) of Panel A, NetDerLev decreases sharply and
significantly for IFRS dealers from 2012 to 2013 (p<5%). The coefficient of -0.186 indicates
an economically significant reduction in NetDerLev of -43.21 percent from IFRS dealers’
NetDerLev in 2012. In each subsequent post-treatment year from 2014 to 2017, NetDerLev
remains similarly lower than in 2012, with the differences being at least weakly significant in
all years except 2014. There is no perceptible trend in NetDerLev through 2016, although there
is an appreciable further drop in 2017. The results in column (1) of Panel B are consistent with
the results in Panel A.
Also consistent with H1(IFRS), in column (2) of Panel A, GroMinNetDerLev decreases
sharply and highly significantly for IFRS dealers from 2012 to 2013 (p<1%). The coefficient

32
of -4.294 indicates an economically significant reduction in GroMinNetDerLev of 52.80 percent
from IFRS dealers’ GroMinNetDerLev in 2012. In each subsequent post-treatment year from
2014 to 2017, GroMinNetDerLev remains highly significantly lower than in 2012. Moreover,
there is a perceptible downward trend in GroMinNetDerLev through 2017, consistent with IFRS
dealers further reducing their excess offsetting derivatives as their portfolios turn over. The
results in column (2) of Panel B are consistent with those in Panel A.
Columns (3) and (4) of each panel report the results of the estimations of nested versions
of equation (1) for the sample of US GAAP dealers only. We discuss these results as preface to
our subsequent test of H1(DiD), which posits that the 2013 disclosure requirements led to
smaller decreases in NetDerLev and GroMinNetDerLev below their pre-treatment levels for US
GAAP dealers than for IFRS dealers. Specifically, columns (3) and (4) of Panel A [B] report
the differences in NetDerLev and GroMinNetDerLev, respectively, for US GAAP dealers from
the benchmark pre-treatment year of 2012 to each post-treatment year from 2013 to 2017 [the
entire post-treatment period].
In column (3) of Panel A, NetDerLev decreases weakly significantly for US GAAP
dealers from 2012 to 2013 (p<10%), with the magnitude of the decrease being 20 percent of
that for IFRS dealers reported in column (1). In each subsequent post-treatment year from 2014
to 2017, NetDerLev remains similarly lower than in 2012, with the differences being significant
in 2015 and 2017 and insignificant in 2014 and 2016. The results in column (3) of Panel B are
consistent with the results in Panel A.
In column (4) of Panel A, GroMinNetDerLev decreases weakly significantly for US
GAAP dealers from 2012 to 2013 (p<10%), with the magnitude of the decrease being 37 percent
of that for IFRS dealers reported in column (2). As for IFRS dealers, there is a perceptible
downward trend in GroMinNetDerLev through 2017, consistent with US GAAP dealers also
further reducing their excess offsetting derivatives as their portfolios turn over, but the
33
magnitudes of the cumulative reductions remain much smaller than for IFRS dealers. The
results in column (4) of Panel B are consistent with the results in Panel A.
Columns (5) and (6) of Panel A report the full equation (1) used to test H1(DiD).
Specifically, columns (5) and (6) of the table report the differences in the differences in
NetDerLev and GroMinNetDerLev, respectively, for US GAAP dealers versus IFRS dealers
from the benchmark pre-treatment year of 2012 to each post-treatment year from 2013 to 2017.
Note first that the coefficient on US GAAP is highly significantly negative in both columns,
indicating that the average level of both dependent variables is lower for US GAAP dealers
than for IFRS dealers.
Consistent with H1(DiD), in column (5) of Panel A, NetDerLev decreases weakly
significantly less for US GAAP dealers than for IFRS dealers from 2012 to 2013 (p<10%). In
subsequent years, these differences are similar in magnitude but lose statistical significance,
likely reflecting the development other sources of cross-sectional variation in the dependent
variable. Reflecting this insignificance in four of the five post-treatment years, the difference-
in-differences coefficient in column (5) of Panel B is insignificant.
Also consistent with H1(DiD), in column (6) of Panel A, GroMinNetDerLev decreases
weakly significantly less for US GAAP dealers than for IFRS dealers from 2012 to both 2013
and 2014 (p<10%). In subsequent years, these differences again are similar in magnitude but
lose statistical significance. Reflecting this insignificance in three of the five post-treatment
years, the difference-in-differences coefficient in column (6) of Panel B is insignificant.
In summary, the results reported in Table 1 are consistent with the 2013 disclosure
requirements having sharp and strong economic consequences for IFRS dealers, which exhibit
highly significant reductions in GroMinNetDerLev and NetDerLev in the year the requirements
became effective, consistent with these dealers reducing their unnecessary offsetting gross
derivatives and increasing the effectiveness of the coverage of their remaining gross derivatives
under MNAs. The disclosure requirements also have directionally similar but lesser

34
consequences for US GAAP dealers, with the differences-in-differences in the effects for the
two sets of dealers being weakly significant for NetDerLev in 2013 and for GroMinNetDerLev
in both 2013 and 2014. Neither of these difference-in-differences are significant for the entire
post-treatment period.
Descriptive Statistics for the Model Variables in the Credit Risk Uncertainty Analysis
Table 1, Panel A [Panel B] also reports descriptive statistics for the equation (2)
variables in the full sample [IFRS and US GAAP dealer subsamples]. For the full sample
reported in Panel A, the mean of CDS1y5y is 0.35, indicating that the one-year CDS spread
(which has a mean of 36.59 basis points) is on average 35 percent of the five-year spread (which
has a mean of 96.59 basis points), consistent with considerable credit risk uncertainty resolving
over the interval from one to five years. The standard deviation is of CDS1y5y is 0.15, indicating
considerable variation in credit risk uncertainty across the sample. For the IFRS and US GAAP
dealer subsamples reported in Panel B, the t and two-sample Wilcoxon rank-sum tests are both
insignificant for all three CDS spread variables.
In Panel A, the mean of QUAL is 2.94, indicating that dealers’ disclosures typically
satisfy about three of the four dimensions of the disclosure quality score for the 2013
requirements. The most commonly unprovided dimension of the disclosure quality score is the
findability of the disclosures. The standard deviation of QUAL is 0.94, indicating reasonable
spread in disclosure quality. In Panel B, the mean of QUAL is significantly higher for IFRS
dealers (3.35) versus US GAAP dealers (2.429).
In Panel, A, the distributions of the control variables Size, ROA, and NPL are similar to
those in other studies examining very large banks. The average (median) dealer-year
observation holds total assets of $896 billion ($780 billion). In Panel B, IFRS dealers are
significantly larger and less profitable and have significantly more non-performing loans than
US GAAP dealers.
35
Table 3 reports Pearson correlations of the variables for the full sample. We discuss the
more notable correlations. NonDerLev is significantly positively correlated with CDS1y5y, as
well as with both its numerator CDS1y and denominator CDS5y, consistent with this variable
capturing both credit risk uncertainty and credit risk. NetDerLev is significantly positively
correlated with both CDS1y (0.29) and CDS5y (0.17), consistent with NetDerLev capturing
credit risk. While the correlation of NetDerLev with CDS1y is 73% larger than its correlation
with CDS5y, consistent with NetDerLev capturing credit risk uncertainty, unexpectedly
NetDerLev is insignificantly positively correlated with CDS1y5y. As we shall see, as expected
this association is highly significantly positive in the multiple regressions used to test H2 and
H3. In contrast, GroMinNetDerLev is significantly negatively correlated with CDS1y5y; the
opposite and hard-to-interpret sign of this correlation reflects the fact that the correlation of
GroMinNetDerLev with CDS1y (0.13) is about half its correlation with CDS5y (0.24). Hence,
consistent with prior discussion, GroMinNetDerLev captures credit risk but appears to be noise
with respect to (or at least hard to interpret as a measure of) credit risk uncertainty.
The three CDS spread variables are all significantly positively correlated. The three
leverage variables also are all significantly positively correlated.
Not surprisingly, ROA is significantly negatively correlated with CDS1y5y and both its
numerator CDS1y and denominator CDS5y, indicating that ROA inversely captures both credit
risk uncertainty and credit risk. NPL is significantly positively correlated with both CDS1y and
CDS5y, but insignificantly correlated with CDS1y5y, indicating that NPL primarily captures
credit risk. Size is significantly negatively correlated with both CDS1y and CDS1y5y, and
weakly significantly negatively correlated with CDS5y, consistent with Size inversely capturing
both credit risk uncertainty and credit risk, but the former more strongly than the latter.
The correlation of QUAL with CDS5y is weakly significantly negative, consistent with
it inversely capturing credit risk to a limited extent, but the correlations of QUAL with the other
two CDS spread variables are insignificant. QUAL is significantly positively correlated with
36
NonDerLev and NetDerLev, consistent with more leveraged dealers provide lower quality
disclosures under the 2013 requirements. However, QUAL is insignificantly associated with
GroMinNetDerLev. QUAL is significantly negatively correlated with US GAAP, indicating that
US GAAP dealers provide lower quality disclosures than IFRS dealers. QUAL is significantly
positively correlated with Size, indicating that larger dealers provide higher quality disclosures.
Tests of the Association of Net Derivatives Leverage with Credit Risk Uncertainty
The first column of Table 4, Panel A reports the OLS estimation of equation (2) and our
main tests of hypotheses H2 and H3. Equation (2) regresses CDS1y5y on NonDerLev,
NetDerLev, and GroMinNetDerLev, on QUAL linearly and interacted with NetDerLev and
GroMinNetDerLev, and on the control variables.
We first discuss the coefficients on the non-test variables and control variables. Similar
to their Pearson correlations with CDS1y5y reported in Table 3, the coefficient on NonDerLev
is weakly significantly positive, and the coefficient on GroMinNetDerLev is weakly
significantly negative. The coefficients on QUAL and its interaction with GroMinNetDerLev
are insignificant. Similar to its correlation with CDS1y5y reported in Table 3, the coefficient on
ROA is weakly significantly negative. The coefficient on NPL is insignificant, however, despite
its significant positive correlation with CDS1y5y reported in Table 3.
Consistent with H2 that credit risk uncertainty rises with net derivatives leverage, the
coefficient on NetDerLev is strongly significantly positive (0.585, p < 1%). Consistent with H3
that disclosure quality attenuates the positive association of credit risk uncertainty with net
derivatives leverage, the coefficient on NetDerLev*QUAL is strongly significantly negative
(-0.152, p < 1%).
For completeness and to corroborate Neilson et al.’s (2020) findings that the derivatives
leverage is associated with the level of credit risk, columns (2) and (3) of Table 4 report the
estimation of equation (2) replacing the dependent variable with its numerator CDS1y and
denominator CDS5y, respectively. Most notably, the coefficients on both NetDerLev and

37
NetDerLev*QUAL are considerably larger in absolute value and more significant in column (2)
than in column (3), consistent with these variables capturing credit risk uncertainty that resolves
over the medium term.
Because IFRS dealers on average provide higher quality disclosures under the 2013
requirements than US GAAP dealers, it is possible that the support for H3 that we document in
Table 4, Panel A is attributable to differences between the two sets of dealers. To address this
possibility, column (1) of Table 4, Panel B reports the estimation of an expansion of equation
(2) that includes the indicator variable US GAAP linearly and interacted with NetDerLev and
GroMinNetDerLev. Compared to the results reported in Panel A, the inclusion of these variables
slightly increases the absolute magnitude and significance of the coefficients involved in the
tests of H2 and H3, providing confidence that this possibility does not explain our results.
The idea that NetDerLev captures the extent to which the positions covered by MNAs
do not offset, thus rendering this variable a satisfactory proxy for the incompleteness and
imperfections of the right of setoff provided by these agreements, underlies H2 and H3.
Consistent with this idea, we expect the increasing effect of NetDerLev on credit risk
uncertainty to strengthen as NetDerLev increases relative to GroMinNetDerLev. The inclusion
of GroMinNetDerLev in our main tests of H2 and H3 reported in Table 4, Panel A should
control for this effect, but in a fashion that suppresses rather than reveals the effect.
To provide evidence as to whether this effect exists, Table 4, Panel C reports a modified
version of the model reported in column (1) of Table 4, Panel A that includes NetGroRank, the
rank of the ratio of NetDerLev to GroMinNetDerLev scaled from zero to one, linearly and
interacted with NetDerLev. To avoid multicollinearity between the NetGroRank variables and
the GroMinNetDerLev variables (by construction), we eliminate the latter variables from the
model. Column (1) [(2)] of Panel C reports the results without [with] the control variables. In
column (1), the coefficient on NetDerLev remains significantly positive and the coefficient on
NetDerLev*NetGroRank is also weakly significantly positive, providing some evidence that

38
this effect exists. However, the addition of the control variables in the model reported in column
(2) renders the coefficient on NetDerLev only weakly significantly positive and the coefficient
on NetDerLev*NetGroRank insignificantly positive. This likely reflects multicollinearity
between NetDerLev and NetDerLev*NetGroRank (by construction) as well as among these
variables and the control variables.
Supplemental Analyses Mitigating Differences between the IFRS and US GAAP Dealer
Subsamples
As discussed in Section IV, to increase the number of US GAAP dealers to a level close
to the number of IFRS dealers, we included US GAAP banks that are not on the list of primary
dealers of the New York Federal Reserve Bank (NYFed) but that have with sufficiently large
trading derivative assets and sufficiently well-matched derivative assets and liabilities. Not
surprisingly, these additional US GAAP dealers typically are smaller and have smaller
derivatives exposures than, and exhibit various other differences from the IFRS dealers. In this
section, we conduct two analyses to mitigate these differences: (1) we restrict the sample to ten
IFRS dealers and nine US GAAP dealers that are on the NYFed’s list of primary dealers (see
Appendix 3 for these dealers), and (2) following considerable recent accounting research, we
use entropy balancing to reweight the observations for the control subsample of US GAAP
dealers to match the first and second moments of three variables that capture key dealer features
—Size, trading derivative assets, and the ratio of derivative liabilities to derivatives assets—
with those in the treatment subsample of IFRS dealer observations.30
Similar to Table 1, Panel B for the full sample, the first three columns of Table 5 report
the means of the variables in equations (1) and (2) separately for the subsamples of IFRS and
US GAAP primary dealers on the NYFed list, as well as t-tests of the differences in these means.
30 We estimate the entropy balancing weights using the Stata package ebalance. See Hainmueller (2012) for general
discussion of entropy balancing. See Shipman et al. (2017), Chapman, Miller, and White (2019), McMullin and
Schonberger (2020), Kleymenova and Tomy (2020), and Francis and Wang (2021) for recent uses of entropy
balancing in accounting research.

39
The significant differences between the IFRS and US GAAP dealer subsamples in Table 1,
Panel A are substantially mitigated for most variables, eliminated for NetDerLev, and reversed
for GroMinNetDerLev. The only variable for which the difference becomes larger and more
significant is QUAL. Hence, the fairly severe restriction of the sample to NYFed primary dealers
makes the IFRS and US GAAP dealer subsamples appreciably more similar.
The fourth through sixth columns of Table 5 report the means of the variables in
equations (1) and (2) separately for the entropy balanced subsamples of IFRS and (weighted)
US GAAP dealers, as well as t-tests of the differences in these means. The significant
differences between the IFRS and US GAAP dealer subsamples in Table 1, Panel A are again
substantially mitigated for most variables. The only variable for which the difference becomes
larger and more significant is CDS1y5y, which becomes significantly negative. Hence, entropy
balancing makes the IFRS and US GAAP dealer subsamples appreciably more similar.
Similar to Table 2, Panel B, Table 6 reports the real effects analysis using a nested
version of equation (1) that reflects a standard differences-in-differences approach; the post-
treatment year-by-year analysis using the full equation (1) yields similar inferences. Columns
(1) and (2) [(3) and (4)] indicate that NetDerLev and GroMinNetDerLev, respectively, decrease
significantly from the pre-treatment to the post-treatment period for IFRS [US GAAP] dealers,
with the magnitude of both decreases being about 30 percent lower for the US GAAP dealers.
Columns (5) and (6) indicate that the difference-in-differences between the two sets of dealers
are insignificant, however.
Similar to column (1) of Table 4, Panel A, Table 7 reports the credit risk uncertainty
analysis estimating equation (2) using both the NYFed primary dealers sample in column (1)
and entropy balancing in column (2). The significant positive coefficient on NetDerLev and
significant negative coefficient on NetDerLev*QUAL for the NYFed sample reported in column
(1) are both consistent with the corresponding coefficients in the full analysis reported in
column (1) of Table 4, Panel A. Similarly, the weakly significant positive coefficients on

40
NetDerLev and NetDerLev*QUAL in the entropy balancing analysis reported in column (2) are
consistent with the corresponding coefficients in the full sample analysis.
Overall, these supplemental analyses provide the same directional inferences as the full
sample analyses, although statistical significance is lost in the difference-in-differences in the
real effects analysis using the NYFed sample and the results in the credit risk uncertainty using
the entropy balancing approach are only weakly significant.
VI. SUMMARY AND CONCLUSION
In this paper, we empirically examine the real effects and usefulness for assessing credit
risk uncertainty of derivative dealing banks’ financial report disclosures of the gross, reported,
and net fair values of their offsetting derivatives that are presented net on the balance sheet or
are presented gross but are subject to enforceable bilateral master netting agreements (MNAs).
IFRS and US GAAP jointly require these disclosures as of 2013. Dealers extensively use MNAs
to mitigate counterparty risks on derivatives with their frequent derivatives counterparties.
MNAs cover large numbers of derivatives whose fair values, but not necessarily transferred
risks, largely offset. MNAs typically are specified under International Swaps and Derivatives
Association agreements in which the covered positions are closed out and net settled only in
the event of a default by either party on any covered position. In this event, MNAs grant
substantively all control rights to the non-defaulting party to close out the covered positions,
subject only to the commercial reasonableness of that party’s exercise of those rights in
accordance with industry practice. These features of MNAs and related frictions yield
uncertainty about the extent, timing, and fairness of any future net settlement, and thus about
the credit risk of the dealers engaging in these agreements.
We first hypothesize and provide evidence that the 2013 disclosure requirements have
real effects on IFRS dealers for which the disclosures convey new information, but lesser effects
on US GAAP dealers for which the disclosures only increase the visibility of the information.
41
Using a difference-in-differences approach that distinguishes each post-treatment year, as
expected we find that IFRS dealers’ gross minus net derivatives leverage and net derivatives
leverage decrease sharply and significantly from 2012 to 2013, the year the disclosure
requirements became effective. These effects continue to grow for gross minus net derivatives
leverage in future post-treatment years. These results are consistent with the disclosure
requirements leading IFRS dealers to reduce their unnecessary offsetting gross derivatives and
to cover their remaining gross derivatives more effectively under MNAs. The disclosure
requirements have directionally similar but, as expected, substantially weaker effects for US
GAAP dealers. The difference-in-differences for IFRS and US GAAP dealers are weakly
significant for gross minus net derivatives leverage in 2013 and 2014 and for net derivatives
leverage in 2013.
We then examine CDS sellers’ use of dealers’ required financial report disclosures. We
hypothesize and find that dealers’ net derivatives leverage is positively associated with the slope
of their credit default swap (CDS) credit spread curves, consistent with net derivatives leverage
proxying for credit risk uncertainty arising from the incomplete and imperfect right of setoff
provided by MNAs. We further find that this effect is stronger when net derivatives leverage is
higher relative to gross minus net derivatives leverage, consistent with less effective offsetting
of gross derivatives,31 and that it is primarily attributable to one-year maturity CDS spreads
rising with net derivatives leverage, consistent with this leverage capturing credit risk
uncertainty rather than the level of credit risk. We find that this effect is substantially attenuated
for dealers that provide more transparent disclosures about their derivatives under the 2013
disclosure requirements, consistent with these disclosures reducing CDS writers’ perception of
dealers’ credit risk uncertainty. In contrast, we find that dealers’ gross minus net derivatives
31 We thank the anonymous reviewer for suggesting this analysis.
42
leverage is insignificantly associated with the slope of their credit spread curves, consistent with
CDS sellers viewing this variable as mostly noise with respect to credit risk uncertainty.
We emphasize two limitation of our empirical analysis. First, it is limited by the
relatively few dealer-year observations. Second, as a result of our efforts to obtain similar
numbers of IFRS and US GAAP dealers in the full sample, the sample IFRS dealers are larger,
more leveraged, and hold more derivatives than the US GAAP dealers. While we can do nothing
about the first limitation, we address the second limitation by conducting supplemental analyses
on a restricted sample of New York Federal Reserve primary dealers and by using entropy
balancing to reweight the observations for control subsample of US GAAP dealers to match the
key dealer features in that subsample and the treatment subsample of IFRS dealer observations.
We obtain directionally identical but somewhat weaker results in both supplemental analyses
as in the primary analyses using the full sample.
Notwithstanding these caveats, our study contributes to the large banking and
mandatory disclosure literatures first by providing descriptive evidence that the 2013 disclosure
requirements led IFRS and US GAAP dealers to reduce their unnecessary offsetting gross
derivatives and IFRS dealers to increase the effectiveness of their coverage of derivatives under
MNAs, real effects of mandatory disclosure. These effects seem likely to reduce individual
dealers’ overall risk, although it is possible that the former effect involves some reduction of
economic hedging. They also seem likely to reduce systemic risk, by reducing the possibility
for counterparty risk externalities to develop.
43
REFERENCES
Acharya, V., and A. Bisin. (2014). Counterparty risk externality. Centralized versus over-the-
counter markets. Journal of Economic Theory 149: 153–82. doi: 10.1016/j.jet.2013.07.001.
Acharya, V., and S. Ryan. (2016). Banks’ financial reporting and financial system stability.
Journal of Accounting Research 54 (2): 277–340. doi: 10.1111/1475-679X.12114.
Ahmed, A. S., E. Kilic, and G. J. Lobo. (2011). Effects of SFAS 133 on the risk relevance of
accounting measures of banks’ derivative exposures. The Accounting Review 86 (3): 769–
804. doi: 10.2308/accr.00000033.
Akins, B. (2018). Financial reporting quality and uncertainty about credit risk among rating
agencies. The Accounting Review 93 (4): 1-22.
Arora, N., S. Richardson, and I. Tuna. (2014). Asset reliability and security prices: Evidence
from credit markets. Review of Accounting Studies 19 (1): 363-395. doi: 10.1007/s11142-
013-9254-7.
Basel Committee on Banking Supervision. (2014a). Basel III leverage ratio framework and
disclosure requirements. January. Basel: Bank for International Settlements.
Basel Committee on Banking Supervision. (2014b). Frequently asked questions on the Basel
III leverage ratio framework. October. Basel: Bank for International Settlements.
Beatty, A., and S. Liao. (2014). Financial accounting in the banking industry: A review of the
empirical literature.” Journal of Accounting & Economics 58: 339-383. doi:
10.1016/j.jacceco.2014.08.009.
Blankespoor, E., T. J. Linsmeier, K. R. Petroni, and C. Shakespeare. (2013). Fair value
accounting for financial instruments: Does it improve the association between bank leverage
and credit risk? The Accounting Review 88 (4): 1143–77. doi: 10.2308/accr-50419.
Bliss, R. R., and G. G. Kaufman. (2006). Derivatives and systemic risk. Netting, collateral, and
closeout. Journal of Financial Stability 2 (1): 55–70. doi: 10.1016/j.jfs.2005.05.001.
Bowman, R. (1980). The debt equivalence of leases: An empirical investigation. The
Accounting Review 55 (2): 237-253.
Callen, J. L., J. Livnat, and D. Segal. (2009). The impact of earnings on the pricing of credit
default swaps. The Accounting Review 84 (5): 1363-1394. doi: 10.2308/accr.2009.84.5.1363.
Chapman, K., Miller, G. S., and White, H. D. 2019. Investor relations and information assimilation.
The Accounting Review 94, 105-31.
Chen, W., C. Liu, and S. Ryan. (2008). Characteristics of securitizations that determine issuers’
retention of the risks of the securitized assets. The Accounting Review 83 (5):1181-1215.
Coudert, V., and M. Gex. (2010). Credit default swap and bond markets: Which leads the other?
Banque de France Financial Stability Review 14 (July): 161-167.

44
Das, S. R., P. Hanouna, and A. Sarin. (2009). Accounting-based versus market-based cross-
sectional models of CDS spreads. Journal of Banking & Finance 33 (4): 719–30. doi:
10.1016/j.jbankfin.2008.11.003.
Dhaliwal, D. (1986). Measurement of financial leverage in the presence of unfunded pension
obligations. The Accounting Review 61 (4): 651-661.
Dhaliwal, D., Lee, and M. Neamtiu. (2011). The impact of operating leases on firm financial
and operating risk. Journal of Accounting, Auditing and Finance 26 (2): 151-197.
Duffie, D. (2010). The failure mechanics of dealer banks. The Journal of Economic
Perspectives 24 (1): 51–72. doi: 10.1257/jep.24.1.51.
Duffie, D., and D. Lando. (2001). Term structures of credit spreads with incomplete accounting
information. Econometrica 69 (3): 633–64. doi: 10.1111/1468-0262.00208.
Ely, K. (1995). Operating lease accounting and the market’s assessment of equity risk. Journal
of Accounting Research 33 (2): 397-415.
EY. (2020). Revised credit valuation adjustment risk framework. July. Available at:
https://www.ey.com/en_us/banking-capital-markets/final-targeted-revisions-to-the-cva-
risk-framework
Fischer, D. (2013). The hidden effects of derivatives on bank balance sheets. The CPA Journal,
September: 67–69.
Francis, J., and W. Wang. 2021. Common Auditors and Private Bank Loans. Contemporary
Accounting Research, forthcoming. https://doi.org/10.1111/1911-3846.12617
Habib, A., M. Hasan, and H. Jiang. Stock price crash risk: Review of the empirical literature.
Accounting & Finance 58 (21): 211-251.
Hainmueller, J. (2012). Entropy balancing for causal effects: A multivariate reweighting
method to produce balanced samples in observational studies. Political Analysis 20 (1): 25-
46.
Heath, L. (1978). Financial Reporting and the Evaluation of Solvency. Accounting Research
Monograph 3. American Institute of Certified Public Accountants: New York.
Hsieh, S., and S. Liu. (2021). The cost-of-equity implications of off-balance sheet pension
liabilities. Journal of Contemporary Accounting and Economics 17 (1).
Hu, N., L. Liu, and Z. Zhu. (2018). Credit default swap spreads and annual report readability.
Review of Quantitative Finance and Accounting, 50 (2): 591-621. doi: 10.1007/s11156-017-
0639-8.
IASB. (2011). Disclosures - Offsetting financial assets and financial liabilities. Amendments
to IFRS 7.

45
ISDA (International Swap and Derivative Association). (2014). 2014 Credit derivatives &
standard reference obligations. Available at https://www.isda.org/a/1diDE/20140918-cln-
isda-2014-credit-definitions-faq.pdf (2 Oct 2019).
Kiff, J., J. Elliott, E. Kazarian, J. Scarlata, and C. Spackman. (2009). Credit derivatives:
Systemic risks and policy option. IMF Working Papers.
Kim, S., P. Kraft, and S. G. Ryan. (2013). Financial statement comparability and credit risk.
Review of Accounting Studies 18 (3): 783–823. doi: 10.1007/s11142-013-9233-z.
Kleymenova, A., and R. Tomy. (2020). Observing enforcement: Evidence from banking.
Working paper, University of Chicago, Chicago Booth Research Paper No. 19-05.
Koonce, L., Z. Leiter, and B. J. White. (2019). Linked financial statement presentation. Journal
of Accounting and Economics 68 (1): 1–16. doi: 10.1016/j.jacceco.2019.101237
Leuz, C., and P. Wysocki. (2016). The economics of disclosure and financial reporting
regulation: Evidence and suggestions for future research. Journal of Accounting Research,
54 (2): 525-622. doi: 10.1111/1475-679X.12115.
McMullin, J., and Schonberger, B. 2020. Entropy-balanced accruals. Review of Accounting Studies
25: 84-119.
Neilson, J., K. Wang, C. Williams, and B. Xie. (2020). Offsetable derivatives and financial
stability, Working paper, Pennsylvania State University. Available at
https://papers.ssrn.com/sol3/papers.cfm?abstract_id=3168893.
Niu, F., and G. Richardson. (2006). Are securitizations in-substance sales or secured
borrowings? Capital market evidence. Contemporary Accounting Research 23 (4): 1105-
1133.
Petersen, M. A. (2009). Estimating standard errors in finance panel data sets: Comparing
approaches. Review of Financial Studies 22 (1): 435–80. doi: https://doi-
org.proxy.library.nyu.edu/10.1093/rfs/hhn053.
Rathgeber, A., and Y. Wang. (2011). Market pricing of credit-linked notes: The case of retail
structured products in Germany. The Journal of Credit Risk 7 (4): 73–101.
Ryan, S. G. (2007). Financial instruments & institutions: Accounting and disclosure rules,
second edition. John Wiley & Sons: Hoboken, NJ.
Ryan, S. G. (2011). Financial reporting for financial instruments. Foundations and Trends® in
Accounting 6 (3-4): 187–354. doi: 10.1561/1400000021.
Yu, F. (2005). Accounting transparency and the term structure of credit spreads. Journal of
Financial Economics 75 (1): 53-84. doi:10.1016/j.jfineco.2004.07.002.
Zeff, S. (1957). Right of offset vs. partnership act in winding-up process. The Accounting
Review 32 (1): 68-70.
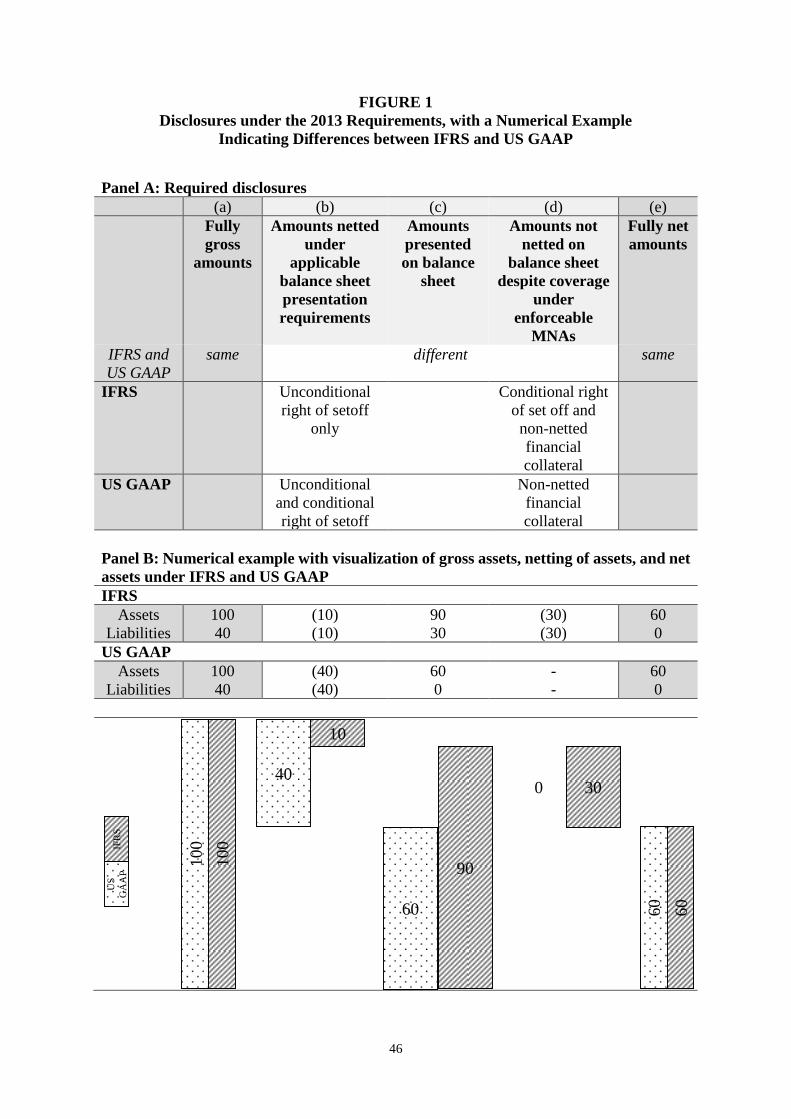
46
FIGURE 1
Disclosures under the 2013 Requirements, with a Numerical Example
Indicating Differences between IFRS and US GAAP
Panel A: Required disclosures
(a) (b) (c) (d) (e)
Fully
gross
amounts
Amounts netted
under
applicable
balance sheet
presentation
requirements
Amounts
presented
on balance
sheet
Amounts not
netted on
balance sheet
despite coverage
under
enforceable
MNAs
Fully net
amounts
IFRS and
US GAAP
same different same
IFRS Unconditional
right of setoff
only
Conditional right
of set off and
non-netted
financial
collateral
US GAAP Unconditional
and conditional
right of setoff
Non-netted
financial
collateral
Panel B: Numerical example with visualization of gross assets, netting of assets, and net
assets under IFRS and US GAAP
IFRS
Assets
Liabilities
100
40
(10)
(10)
90
30
(30)
(30)
60
0
US GAAP
Assets
Liabilities
100
40
(40)
(40)
60
0
-
-
60
0
60
10
0
10
90
3040
60
0
IFR
SU
S
GA
AP
10
0
60

47
FIGURE 1 (Continued)
Notes: Panel A of this figure summarizes the 2013 disclosure requirements, and Panel B
illustrates the required disclosures under IFRS and US GAAP for a numerical example with a
given set of positions. The required information for financial assets and liabilities that are
presented net on the balance sheet or are covered by enforceable MNAs depicted in Panel A
includes: (a) the fully gross amounts (e.g., fair values for derivatives) of financial assets and
financial liabilities before any netting, (b) the amounts netted under the applicable balance sheet
presentation requirements (i.e., IFRS or US GAAP), (c) the amounts presented on the balance
sheet, (d) the amounts not netted on the balance sheet despite coverage of the financial assets
and liabilities under enforceable MNAs, including non-netted financial collateral, and (e) the
fully net amounts. The numerical example in Panel B includes derivative assets and liabilities
with fair values of 100 and 40, respectively; 10 of both of these fair values is attributable to a
transaction with a clearinghouse for which the reporting firm has the unconditional right of
offset, and 30 of both of these fair values is covered by an enforceable MNA for which the firm
has the conditional (on default) right of offset.
Our derivatives variables relate to the required disclosures in Panel A and numerical
example in Panel B as follows: GroDerAss (the numerator of GroDerLev) is item (a) for assets,
i.e., 100 for both IFRS and US GAAP dealers; RepDerAss (the numerator of RepDerLev) is
item (c) for assets, i.e., 90 for IFRS dealers and 60 for US GAAP dealers; and NetDerAss (the
numerator of NetDerLev) is item (e) for assets, i.e., 60 for both IFRS and US GAAP dealers.
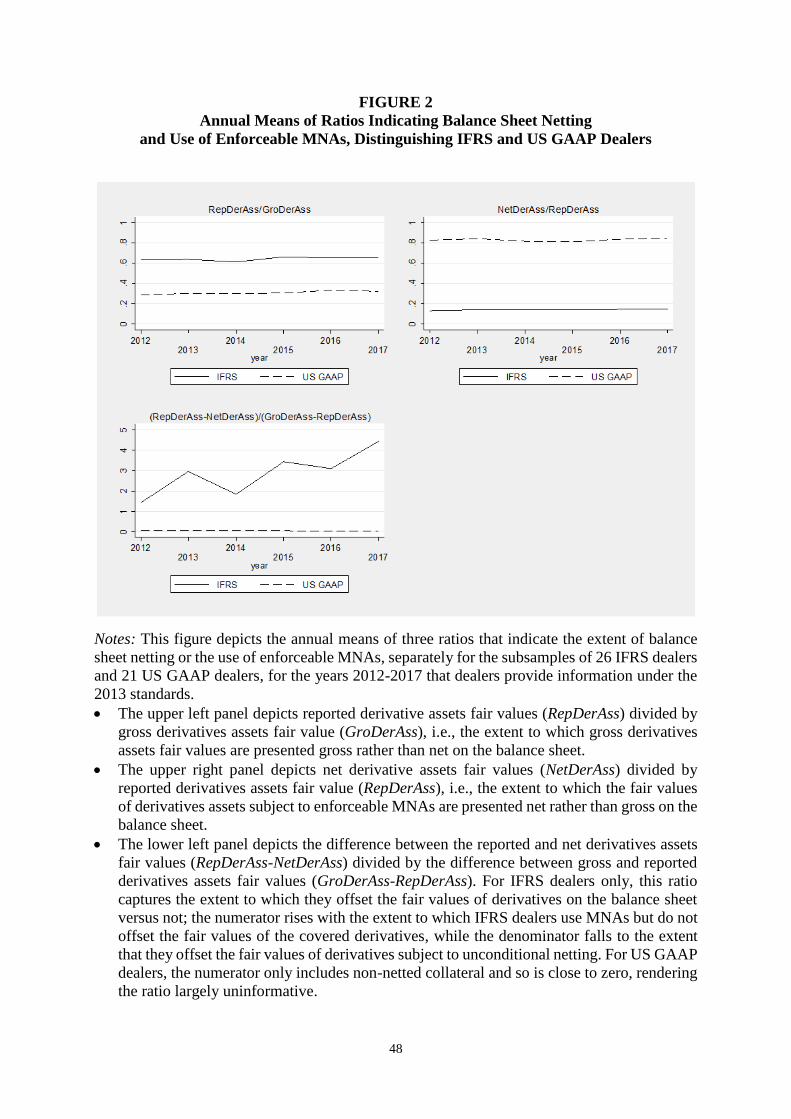
48
FIGURE 2
Annual Means of Ratios Indicating Balance Sheet Netting
and Use of Enforceable MNAs, Distinguishing IFRS and US GAAP Dealers
Notes: This figure depicts the annual means of three ratios that indicate the extent of balance
sheet netting or the use of enforceable MNAs, separately for the subsamples of 26 IFRS dealers
and 21 US GAAP dealers, for the years 2012-2017 that dealers provide information under the
2013 standards.
• The upper left panel depicts reported derivative assets fair values (RepDerAss) divided by
gross derivatives assets fair value (GroDerAss), i.e., the extent to which gross derivatives
assets fair values are presented gross rather than net on the balance sheet.
• The upper right panel depicts net derivative assets fair values (NetDerAss) divided by
reported derivatives assets fair value (RepDerAss), i.e., the extent to which the fair values
of derivatives assets subject to enforceable MNAs are presented net rather than gross on the
balance sheet.
• The lower left panel depicts the difference between the reported and net derivatives assets
fair values (RepDerAss-NetDerAss) divided by the difference between gross and reported
derivatives assets fair values (GroDerAss-RepDerAss). For IFRS dealers only, this ratio
captures the extent to which they offset the fair values of derivatives on the balance sheet
versus not; the numerator rises with the extent to which IFRS dealers use MNAs but do not
offset the fair values of the covered derivatives, while the denominator falls to the extent
that they offset the fair values of derivatives subject to unconditional netting. For US GAAP
dealers, the numerator only includes non-netted collateral and so is close to zero, rendering
the ratio largely uninformative.
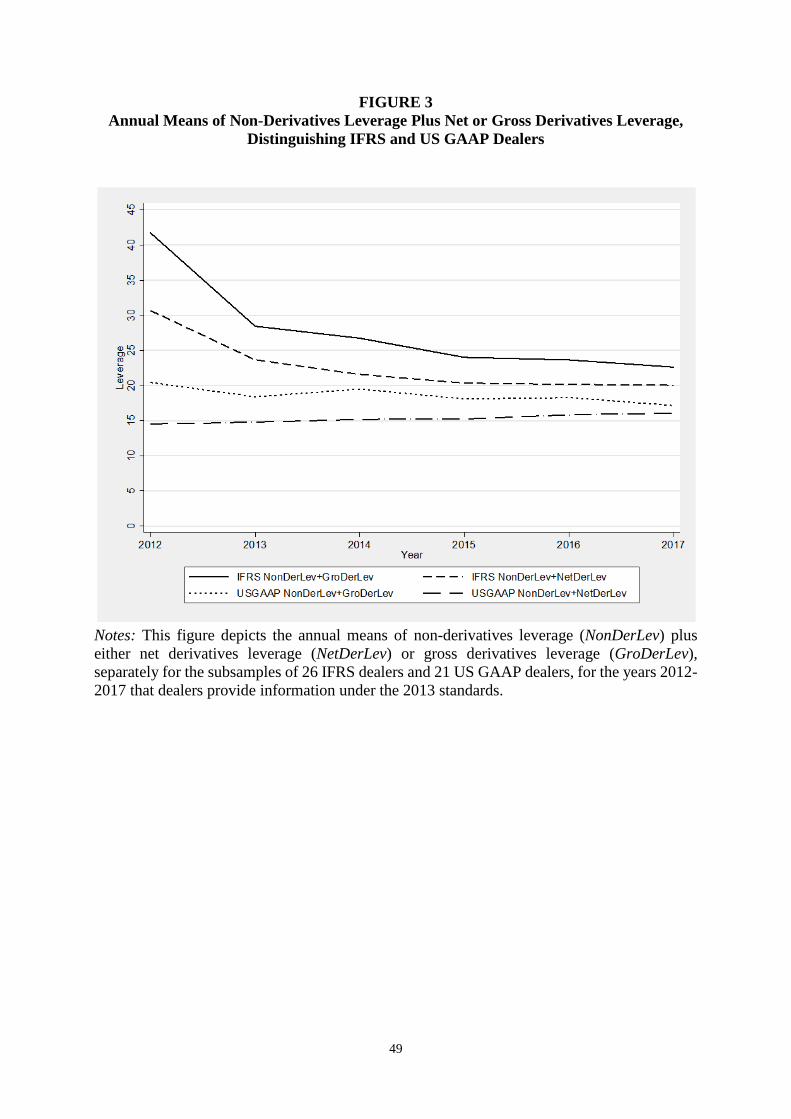
49
FIGURE 3
Annual Means of Non-Derivatives Leverage Plus Net or Gross Derivatives Leverage,
Distinguishing IFRS and US GAAP Dealers
Notes: This figure depicts the annual means of non-derivatives leverage (NonDerLev) plus
either net derivatives leverage (NetDerLev) or gross derivatives leverage (GroDerLev),
separately for the subsamples of 26 IFRS dealers and 21 US GAAP dealers, for the years 2012-
2017 that dealers provide information under the 2013 standards.

50
TABLE 1
Summary Statistics
Full Sample and IFRS and US GAAP Subsamples
Panel A: Variable summary statistics for full sample
count mean p50 sd p5 p25 p75 p95
CDS Spread variables (dependent variables in equation (2))
CDS1y 202 36.590 23.875 49.893 8.678 15.624 38.509 102.214
CDS5y 217 96.947 78.429 65.223 33.433 57.239 118.828 218.888
CDS1y5y 202 0.349 0.338 0.148 0.138 0.256 0.416 0.594
Leverage variables (dependent variables in equation (1) and/or main regressors in equation (2))
NonDerLev 278 18.738 16.926 8.892 10.177 13.659 22.400 29.569
NetDerLev 261 0.302 0.268 0.241 0.041 0.129 0.391 0.769
GroMinNetDerLev 252 4.365 2.486 4.885 0.039 0.798 6.450 14.372
Interactive variables (in equations (1) or (2))
QUAL 282 2.936 3.000 0.933 1.000 2.000 4.000 4.000
USGAAP 282 0.447 0.000 0.498 0.000 0.000 1.000 1.000
Control variables (in equation (2))
Size 282 13.230 13.567 1.136 11.145 12.410 14.168 14.681
ROA 282 0.005 0.006 0.005 -0.002 0.002 0.008 0.012
NPL 282 0.014 0.008 0.019 0.001 0.004 0.016 0.065
Total assets
(in USD billions)
282 896.45 780.04 734.13 69.19 245.16 1,422.97 2,374.99
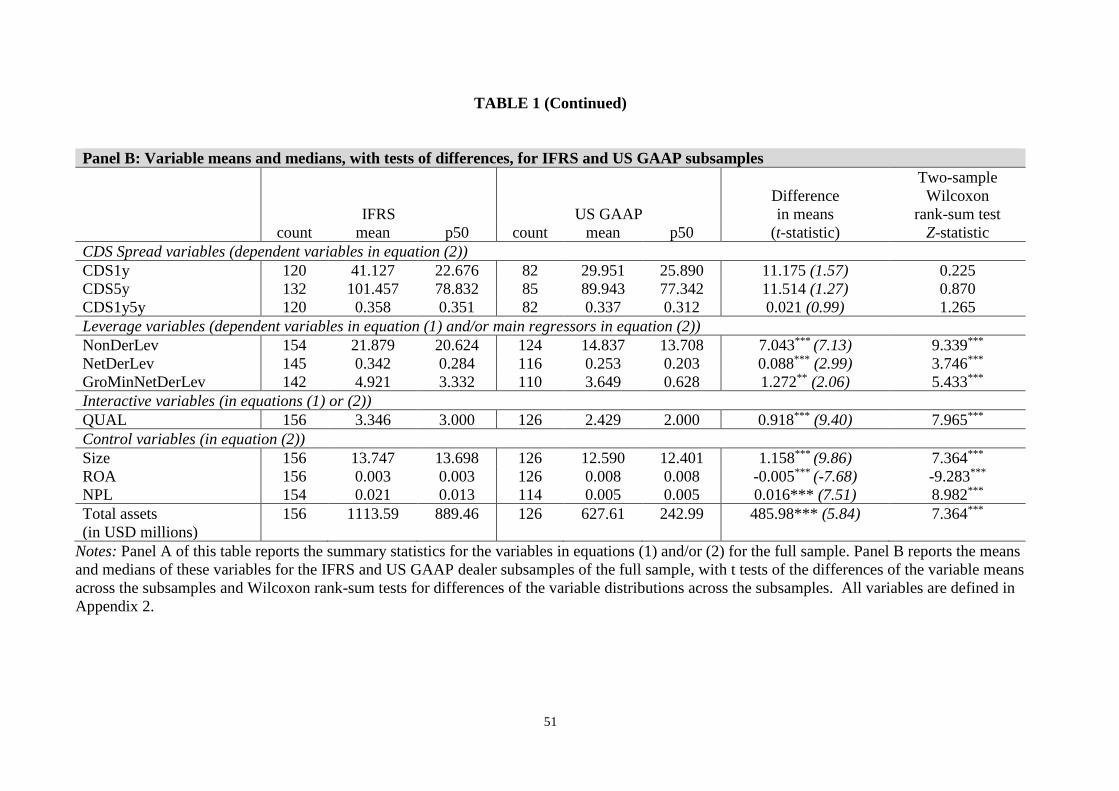
51
TABLE 1 (Continued)
Panel B: Variable means and medians, with tests of differences, for IFRS and US GAAP subsamples
IFRS
US GAAP
Difference
in means
Two-sample
Wilcoxon
rank-sum test
count mean p50 count mean p50 (t-statistic) Z-statistic
CDS Spread variables (dependent variables in equation (2))
CDS1y 120 41.127 22.676 82 29.951 25.890 11.175 (1.57) 0.225
CDS5y 132 101.457 78.832 85 89.943 77.342 11.514 (1.27) 0.870
CDS1y5y 120 0.358 0.351 82 0.337 0.312 0.021 (0.99) 1.265
Leverage variables (dependent variables in equation (1) and/or main regressors in equation (2))
NonDerLev 154 21.879 20.624 124 14.837 13.708 7.043*** (7.13) 9.339***
NetDerLev 145 0.342 0.284 116 0.253 0.203 0.088*** (2.99) 3.746***
GroMinNetDerLev 142 4.921 3.332 110 3.649 0.628 1.272** (2.06) 5.433***
Interactive variables (in equations (1) or (2))
QUAL 156 3.346 3.000 126 2.429 2.000 0.918*** (9.40) 7.965***
Control variables (in equation (2))
Size 156 13.747 13.698 126 12.590 12.401 1.158*** (9.86) 7.364***
ROA 156 0.003 0.003 126 0.008 0.008 -0.005*** (-7.68) -9.283***
NPL 154 0.021 0.013 114 0.005 0.005 0.016*** (7.51) 8.982***
Total assets
(in USD millions)
156 1113.59 889.46 126 627.61 242.99 485.98*** (5.84) 7.364***
Notes: Panel A of this table reports the summary statistics for the variables in equations (1) and/or (2) for the full sample. Panel B reports the means
and medians of these variables for the IFRS and US GAAP dealer subsamples of the full sample, with t tests of the differences of the variable means
across the subsamples and Wilcoxon rank-sum tests for differences of the variable distributions across the subsamples. All variables are defined in
Appendix 2.

52
TABLE 2
Tests of Decreases in Gross Minus Net Derivatives Leverage and Net Derivatives Leverage for IFRS and US GAAP Dealers
From Pre versus Post the 2013 Disclosure Requirements
Panel A: Difference-in-differences estimation distinguishing each post-treatment year from 2012
IFRS Dealers US GAAP Dealers Difference-in-differences
Predicted (1) (2) (3) (4) (5) (6)
coefficient NetDerLev GroMinNetDerLev NetDerLev GroMinNetDerLev NetDerLev GroMinNetDerLev
YEAR13 - (H1:IFRS) -0.186** -4.294*** -0.0366* -1.593* -0.186** -4.294***
(0.039) (0.001) (0.075) (0.053) (0.034) (0.000)
YEAR14 - (H1:IFRS) -0.141 -3.885*** -0.00623 -0.890 -0.141 -3.885***
(0.163) (0.007) (0.834) (0.261) (0.155) (0.005)
YEAR15 - (H1:IFRS) -0.184* -5.416*** -0.0732** -2.375* -0.184* -5.416***
(0.090) (0.001) (0.047) (0.085) (0.083) (0.001)
YEAR16 - (H1:IFRS) -0.192* -5.531*** -0.0532 -2.824** -0.192* -5.531***
(0.083) (0.001) (0.331) (0.046) (0.076) (0.001)
YEAR17 - (H1:IFRS) -0.275** -6.556*** -0.112*** -3.616** -0.275** -6.556***
(0.017) (0.000) (0.002) (0.037) (0.013) (0.000)
USGAAP -0.235*** -3.173**
(0.008) (0.037)
YEAR13_USGAAP + (H1:DiD) 0.149* 2.701*
(0.093) (0.053)
YEAR14_USGAAP + (H1:DiD) 0.135 2.995*
(0.192) (0.055)
YEAR15_USGAAP + (H1:DiD) 0.111 3.042
(0.314) (0.125)
YEAR16_USGAAP + (H1:DiD) 0.139 2.707
(0.246) (0.178)
YEAR17_USGAAP + (H1:DiD) 0.163 2.940
(0.149) (0.198)
N 145 142 116 110 261 252
SE clustering By dealer By dealer By dealer By dealer By dealer By dealer
Firm FE Yes Yes Yes Yes Yes Yes
Intercept Yes Yes Yes Yes Yes Yes
Adjust. R sq. 0.447 0.733 0.850 0.818 0.618 0.780

53
TABLE 2 (continued)
Panel B: Difference-in-differences estimation distinguishing entire post-treatment period from 2012
POST - (H1:IFRS) -0.196* -5.137*** -0.0556* -2.240* -0.196** -5.137***
(0.054) (0.001) (0.071) (0.056) (0.047) (0.000)
USGAAP -0.236*** -3.189**
(0.007) (0.032)
POST_USGAAP + (H1:DiD) 0.140 2.896
(0.168) (0.101)
N 145 142 116 110 261 252
SE clustering By dealer By dealer By dealer By dealer By dealer By dealer
Firm FE Yes Yes Yes Yes Yes Yes
Intercept Yes Yes Yes Yes Yes Yes
Adjust. R sq. 0.433 0.695 0.832 0.794 0.603 0.749
Notes: Panel A of this table reports estimations of equation (1), which distinguishes each post-treatment year in 2013-2017 from the pre-treatment
year 2012. Columns (1) and (2) of this table report the estimations of a nested version of equation (1) that only includes the year indicators as
explanatory variables on the observations for IFRS dealers only. These columns provide the differences in net derivatives leverage (NetDerLev,
column 1) and net minus gross derivatives leverage (GroMinNetDerLev, column 2) for the sample IFRS dealers. Columns (3) and (4) report the
estimations of the same nested equation for the observations for US GAAP dealers only. Columns (5) and (6) report the estimation of the full equation
(1) and provide the difference-in-differences results for the observations for both sets of dealers. The columns of Panel B report analogous tests using
a single indicator for the entire post-treatment period (i.e., standard difference-in-differences models). All variables are defined in Appendix 2.
Statistically significant differences and difference-in-differences are indicated by *, **, and *** for p < 0.10, p < 0.05, and p < 0.01, respectively.

54
TABLE 3
Pearson Correlations CDS1y CDS5y CDS1y5y NonDerLev NetDerLev GroMinNetDerLev QUAL USGAAP Size ROA NPL
CDS1y 1.000
CDS5y 0.814*** 1.000
CDS1y5y 0.688*** 0.355*** 1.000
NonDerLev 0.536*** 0.277*** 0.183*** 1.000
NetDerLev 0.291*** 0.168** 0.054 0.558*** 1.000
GroMinNetDerLev 0.128* 0.236*** -0.146** 0.308*** 0.671*** 1.000
QUAL -0.048 -0.134* -0.001 0.357*** 0.127** -0.092 1.000
USGAAP -0.110 -0.086 -0.069 -0.394*** -0.182*** -0.129** -0.490*** 1.000
Size -0.145** -0.133* -0.142** 0.281*** 0.371*** 0.498*** 0.343*** -0.508*** 1.000
ROA -0.478*** -0.363*** -0.170** -0.460*** -0.353*** -0.396*** -0.098 0.417*** -0.271*** 1.000
NPL 0.326*** 0.382*** 0.115 0.100 -0.052 -0.062 0.072 -0.418*** 0.156** -0.392*** 1.000
N 282
Notes: This table reports the Pearson correlations for the variables in equation (2). All variables are defined in Appendix 2. Statistically significant
correlations are indicated by *, **, and *** for p < 0.10, p < 0.05, and p < 0.01, respectively.

55
TABLE 4
Leverage Components, Disclosure Quality, and Credit Risk Uncertainty
Panel A: Primary Results
Predicted (1) (2) (3)
coefficient CDS1y5y CDS1y CDS5y
NonDerLev 0.0043* 2.428** 0.896
(0.076) (0.023) (0.163)
NetDerLev + (H2) 0.585*** 197.300** 131.500*
(0.006) (0.019) (0.090)
GroMinNetDerLev -0.016* -4.046 -0.386
(0.051) (0.109) (0.903)
QUAL 0.014 4.054 10.440*
(0.372) (0.513) (0.073)
NetDerLev*QUAL - (H3) -0.152*** -51.139** -39.240*
(0.005) (0.018) (0.059)
GroMinNetDerLev*QUAL 0.002 0.561 0.089
(0.422) (0.417) (0.920)
Size 0.008 -6.765 -9.645
(0.623) (0.214) (0.108)
ROA -5.808* -2969.700*** -3633.400***
(0.061) (0.010) (0.000)
NPL 0.462 521.100* 832.300***
(0.521) (0.068) (0.007)
N 180 180 190
SE Clustering By dealer By dealer By dealer
Fixed effects
Documentation (restructuring) clause Yes Yes Yes
Year Yes Yes Yes
Intercept Yes Yes Yes
Adjust. R sq. 0.416 0.593 0.530

56
TABLE 4 (Continued)
Panel B: Controlling Interactively for US GAAP
Predicted (1) (2) (3)
coefficient CDS1y5y CDS1y CDS5y
NonDerLev 0.00310 2.256** 1.013
(0.182) (0.028) (0.154)
NetDerLev + (H2) 1.068*** 306.6** 71.24
(0.004) (0.026) (0.685)
GroMinNetDerLev -0.0374*** -5.621 3.811
(0.003) (0.165) (0.617)
QUAL 0.0176 10.33 9.927
(0.258) (0.122) (0.173)
NetDerLev*QUAL - (H3) -0.275*** -78.07** -24.56
(0.003) (0.020) (0.586)
GroMinNetDerLev*QUAL 0.00703** 0.932 -0.849
(0.015) (0.342) (0.655)
USGAAP -0.0424 22.38* 2.929
(0.235) (0.071) (0.840)
NetDerLev*USGAAP -0.344* -102.6 49.04
(0.096) (0.181) (0.678)
GroMinNetDerLev*USGAAP 0.0152** 1.868 -3.307
(0.050) (0.483) (0.487)
Size 0.00541 -6.123 -9.310
(0.723) (0.235) (0.119)
ROA -6.566* -2930.7** -3440.8***
(0.057) (0.012) (0.001)
NPL 0.134 531.300* 888.3***
(0.857) (0.070) (0.006)
N 180 180 190
SE Clustering By dealer By dealer By dealer
Fixed effects
Documentation (restructuring) clause Yes Yes Yes
Year Yes Yes Yes
Intercept Yes Yes Yes
Adjust. R sq. 0.444 0.602 0.529

57
TABLE 4 (Continued)
Panel C: Controlling Interactively for the Rank of NetDerLev/GroMinNetDerLev
Predicted (1) (2)
coefficient CDS1y5y CDS1y5y
NonDerLev 0.006** 0.005*
(0.049) (0.069)
NetDerLev +(H2) 0.291** 0.206*
(0.033) (0.075)
NetGroRank 0.0363 -0.014
(0.596) (0.822)
NetDerLev*NetGroRank 0.387* 0.252
(0.083) (0.268)
QUAL 0.012 0.012
(0.497) (0.479)
NetDerLev*QUAL -(H3) -0.161*** -0.104**
(0.009) (0.047)
Size 0.002
(0.908)
ROA -4.544
(0.142)
NPL 0.781
(0.305)
N 185 180
SE Clustering By dealer By dealer
Fixed effects
Documentation (restructuring) clause Yes Yes
Year Yes Yes
Intercept Yes Yes
Adjust. R sq. 0.276 0.396
Notes: Panel A of this table reports OLS estimations of equation (2) with dependent variable
CDS1y5y, CDS1y (the numerator of CDS1y5y), and CDS5y (the denominator of CDS1y5y) in
columns (1)-(3), respectively. Panel B reports OLS estimations of expansions of the models in
Panel A that include the indicator variable US GAAP linearly and interacted with NetDerLev
and GroMinNetDerLev. Panel C reports OLS estimations of OLS estimations of models similar
to that in column (1) of Panel A but that exclude GroMinNetDerLev and instead include the
ratio of NetDerLev to GroMinNetDerLev, denoted NetGroRank, linearly and interacted with
NetDerLev. The model in column (1) of Panel C also excludes the three control variables. All
models include fixed effects for the CDS documentation clause and year, and calculate standard
errors clustering observations by dealer. All variables are defined in Appendix 2. Statistically
significant coefficients are indicated by *, **, and *** for p < 0.10, p < 0.05, and p < 0.01,
respectively.

58
TABLE 5
Summary Statistics
IFRS and US GAAP Subsamples of New York Federal Reserve Primary Dealer and Entropy Balanced Samples
NYFed Primary Dealer Sample Entropy Balanced Sample
IFRS US GAAP Difference in
means
IFRS US GAAP Difference in
means
Mean (count) Mean (count) (t-statistic) Mean (count) Mean (count) (t-statistic)
CDS Spread variables (dependent variables in equation (2))
CDS1y 27.634 (46) 26.252 (48) 1.382 (0.40) 37.946 (115) 42.980 (77) -5.034 (-0.43)
CDS5y 77.246 (53) 80.232 (48) -2.986 (-0.46) 95.601 (125) 124.994 (78) -29.393 (-1.30)
CDS1y5y 0.358 (46) 0.333 (48) 0.025 (0.95) 0.353 (115) 0.582 (77) -0.228** (-2.02)
Leverage variables (dependent variables in equation (1) and/or main regressors in equation (2))
NonDerLev 20.522 (60) 15.267 (53) 5.256*** (6.48) 21.994 (148) 22.194 (118) -0.200 (-0.04)
NetDerLev 0.383 (60) 0.413 (47) -0.030 (-0.66) 0.340 (143) 0.422 (110) -0.083 (-0.97)
GroMinNetDerLev 6.374 (57) 8.189 (47) -1.815* (-1.68) 4.921 (142) 6.431 (110) -1.510 (-1.14)
Interactive variables (in equations (1) or (2))
QUAL 3.600 (60) 2.111 (54) 1.489*** (11.25) 3.358 (148) 3.207 (119) 0.151 (0.21)
Control variables (in equation (2))
Size 14.035 (60) 13.612 (54) 0.424** (2.43) 13.747 (148) 17.092 (119) -3.346 (-0.99)
ROA 0.004 (60) 0.006 (54) -0.002** (-2.51) 0.003 (148) 0.007 (119) -0.004* (-1.86)
NPL 0.009 (60) 0.005 (42) 0.004*** (2.70) 0.020 (147) 0.007 (108) 0.013*** (4.68)
Total assets
(in USD billions) 1,431.93 (60) 1,242.99 (54) 188.94 (1.32) 1,118.94 (148) 1,355.22 (119) -236.29 (-0.87)
Notes: This table reports the means of the variables in equations (1) and/or (2) for the IFRS and US GAAP dealer subsamples of the NYFed primary
dealer sample in the first two columns and of the entropy balanced sample in the fourth and fifth columns. t tests of the differences of the variable
means across each of the two pairs of subsamples are reported in the third and sixth columns. NYFed primary dealers are listed in Appendix 3. In the
entropy balance sample, the first and second moments of Size, trading derivative assets, and the ratio of derivative liabilities to derivative assets for
the US GAAP dealer control observations are matched to those of the IFRS dealer treatment observations. All variables are defined in Appendix 2.

59
TABLE 6
Tests of Decreases in Gross Minus Net Derivatives Leverage and Net Derivatives Leverage
for New York Federal Reserve IFRS and US GAAP Primary Dealers
from Pre versus Post the 2013 Disclosure Requirements
IFRS Dealers US GAAP Dealers Difference in Differences
Predicted
coefficient
(1)
NetDerLev
(2)
GroMinNetDerLev
(3)
NetDerLev
(4)
GroMinNetDerLev
(5)
NetDerLev
(6)
GroMinNetDerLev
POST - (H1:IFRS) -0.193* -6.893** -0.136*** -4.774** -0.193* -6.893***
(0.085) (0.010) (0.005) (0.044) (0.065) (0.004)
USGAAP -0.197** -3.901
(0.035) (0.114)
POST_USGAAP + (H1:DiD) 0.0576 2.119
(0.584) (0.461)
N 60 57 47 47 107 104
SE clustering By dealer By dealer By dealer By dealer By dealer By dealer
Firm FE Yes Yes Yes Yes Yes Yes
Intercept Yes Yes Yes Yes Yes Yes
Adjust. R sq. 0.609 0.731 0.721 0.606 0.641 0.682
Notes: This table reports estimations of nested versions of equation (1) that include the single indicator POST for the entire post-treatment period (i.e.,
standard difference-in-differences models) for the NYFed primary dealer sample. Columns (1) and (2) of this table report the estimations of a nested
version of equation (1) that only includes POST for the IFRS dealer subsample of the NYFED sample. These columns provide the difference in net
derivatives leverage (NetDerLev, column 1) and net minus gross derivatives leverage (GroMinNetDerLev, column 2) for these IFRS dealers from the
pre- to the post-treatment period. Columns (3) and (4) report the estimations of the same two equations for the US GAAP dealer subsample of the
NYFed sample. Columns (5) and (6) report the estimation of models that include USGAAP and POST*USGAAP which provide the difference-in-
differences for the two sets of dealers in the NYFed sample. All variables are defined in Appendix 2. Statistically significant differences and difference-
in-differences are indicated by *, **, and *** for p < 0.10, p < 0.05, and p < 0.01, respectively.

60
TABLE 7
Leverage Components, Disclosure Quality, and Credit Risk Uncertainty
New York Federal Reserve Primary Dealers Sample and Entropy Balancing
New York
Fed Primary
Dealers
Entropy
Balancing
Predicted (1) (2)
coefficient CDS1y5y CDS1y5y
NonDerLev 0.00342 0.00296
(0.503) (0.124)
NetDerLev +(H2) 0.540** 0.760**
(0.019) (0.013)
GroMinNetDerLev -0.00842 -0.0109
(0.247) (0.280)
QUAL 0.0706** 0.0438
(0.015) (0.374)
NetDerLev_QUAL -(H3) -0.171** -0.198**
(0.029) (0.020)
GroMinNetDerLev_QUAL 0.000483 0.00132
(0.833) (0.712)
Size 0.0592** 0.00339
(0.019) (0.912)
ROA -8.912** -8.443***
(0.021) (0.005)
NPL -4.380** 0.797
(0.012) (0.216)
N 87 180
SE Clustering By dealer By dealer
Fixed effects
Documentation (restructuring) clause Yes Yes
Year Yes Yes
Intercept Yes Yes
Adjust. R sq. 0.489 0.450
Notes: This table reports OLS estimations of equation (2) with dependent variable CDS1y5y on
the NYFed primary dealer sample in column (1) and the entropy balanced sample in which to
the first and second moments of Size, trading derivative assets, and the ratio of derivatives
liabilities to derivatives assets in the control subsample of US GAAP dealer observations are
matched to those of the treatment subsample of IFRS dealer observations. All models include
fixed effects for the CDS documentation clause and year, and calculate standard errors
clustering observations by dealer. All variables are defined in Appendix 2. Statistically
significant coefficients are indicated by *, **, and *** for p < 0.10, p < 0.05, and p < 0.01,
respectively.

61
APPENDIX 1
Sample Disclosures for IFRS and US GAAP Dealers from 2013 Annual Reports
IFRS Dealer Example: UBS Group AG

62
US GAAP Dealer Example: JPMorgan Chase & Co
JPMorgan Chase also includes similar tables for derivatives payables and derivatives
collateral payables.

63
APPENDIX 2
Definitions of Variables
Variable Description Source
Derivatives
GroDerAss
(GroDerLiab)
Fully gross fair value of derivative assets
(liabilities) before any netting
Post-2013
disclosure
requirements
Hand collected
(see Figure 1)
GroMinRepDerAss
(GroMinRepDerLiab)
Fair value of derivative assets (liabilities)
netted on the balance sheet in accordance with
applicable balance sheet presentation
requirements
RepDerAss
(RepDerLiab)
Post-2013 disclosure
requirements
Fair value of derivative assets (liabilities)
reported on the balance sheet
RepMinNetDerAss
(RepMinNetDerLiab)
Fair value of derivative assets (liabilities)
subject to enforceable MNAs but not netted on
the balance sheet, including financial collateral
NetDerAss
(NetDerLiab)
Fully net fair value of derivative assets
(liabilities)
Leverage measures and components
TAss Total assets minus intangibles (data52500) Bankfocus
following
Blankespoor et
al. (2013)
TCE Shareholders equity (also book value) minus
intangibles minus preferred equity (data63300
- data52500 - data62100)
NonDerLev (TAss – RepDerAss)/TCE Hand collected
and Bankfocus
NetDerLev (NetDerAss)/TCE
GroDerLev (GroDerAss)/TCE
GroMinNetDerLev (GroDerAss-NetDerAss)/TCE
GroMinRepDerLev (GroDerAss-RepDerAss)/TCE
RepMinNetDerLev (RepDerAss-NetDerAss)/TCE
Risk variables
CDS1y 1year CDS Spread in basis points (as Markit
includes more than just one spread, we select
the spread which is most frequently available
per id based on three criteria: (1) tier group, (2)
docclause definition, and (3) currency)
WRDS Markit
CDS5y 5year CDS Spread in basis points (as Markit
includes more than just one spread, we select
the spread which is most frequently available
per id based on three criteria: (1) tier group, (2)
docclause definition, and (3) currency)
WRDS Markit
CDS1y5y Ambiguity about credit risk calculated by the
ratio of 1year CDS spreads to 5year CDS
spreads
WRDS Markit
following
Duffie and
Lando (2001)
and Kim et al.
(2013)
64
Control variables
Size Bank size calculated as the natural logarithm of
total assets
Handcollected
and Bankfocus
following
Blankespoor et
al. (2013)
ROA Return on assets calculated as net income
divided by total assets (data94300/TA)
Bankfocus
following
Ahmed et al.
(2011) and
Blankespoor et
al. (2013)
NPL Non-performing loans calculated as total
impaired/non-performing loans divided by
total assets (data80380/TA)
Bankfocus
following
Ahmed et al.
(2011)
Interactive variables
QUAL Index capturing the quality of disclosures
following the 2013 amendment. Values range
from 0 to 4 with 0 being the lowest “quality
and readability” of the related offsetting
information and 4 being the highest (see
Appendix 5).
Hand collection
US GAAP An indicator variable that equals one if the
dealer reports under US GAAP and zero
otherwise
Hand collection
Docclause
Fixed effects for the four types of restructuring
clauses (called ‘doc clauses’) in CDS contracts
following ISDA (2014): XR (no restructuring),
CR (old/full restructuring), MR (modified
restructuring), and MM (modified-modified
restructuring).
WRDS Markit
following Callen
et al. (2009)

65
APPENDIX 3
List of Dealers
# Ultimate owner Accounting Source
1 ABN AMRO Group N.V. IFRS AFME
2 Banco Bilbao Vizcaya Argentaria SA-
BBVA
IFRS AFME/
FFIEC
3 Banco Santander SA IFRS AFME
4 Bank of America Corporation USGAAP NYFED/
FFIEC
5 Bank of Montreal-Banque de Montreal IFRS NYFED
6 Bank of New York Mellon Corporation USGAAP FFIEC
AFME (Members)
7 Bank of Nova Scotia (The) -
SCOTIABANK
IFRS AFME/ NYFED
8 Bankia, SA IFRS AFME (Members)
9 Barclays Plc IFRS AFME/ NYFED/
FFIEC
10 Belfius Banque SA/NV-Belfius Bank
SA/NV (in October 2011, when Dexia
Belgium Bank separated from Dexia)
IFRS AFME (Members)
11 BNP Paribas IFRS AFME/ NYFED/
FFIEC
12 BOK Financial Corporation USGAAP FFIEC
13 Citigroup Inc USGAAP AFME/ NYFED/
FFIEC
14 Citizens Financial Group Inc. USGAAP FFIEC
15 Comerica Incorporated USGAAP FFIEC
16 Commerzbank AG IFRS AFME
17 Cooperatieve Rabobank U.A. IFRS AFME
18 Crédit Agricole S.A. IFRS AFME
19 Credit Suisse Group AG USGAAP AFME/ NYFED
20 Danske Bank A/S IFRS AFME
21 Deutsche Bank AG IFRS AFME/ NYFED/
FFIEC
22 Fifth Third Bancorp USGAAP FFIEC
23 Goldman Sachs Group, Inc USGAAP AFME/ NYFED/
FFIEC
24 HSBC Holdings Plc IFRS AFME/ NYFED/
FFIEC
25 ING Groep NV IFRS AFME
26 Intesa Sanpaolo IFRS AFME
27 Jefferies Group LLC USGAAP AFME/ NYFED
28 JPMorgan Chase & Co USGAAP AFME/ NYFED/
FFIEC
29 KeyCorp USGAAP FFIEC
30 Lloyds Banking Group Plc IFRS AFME (Members)
31 Morgan Stanley USGAAP AFME/ NYFED/
FFIEC
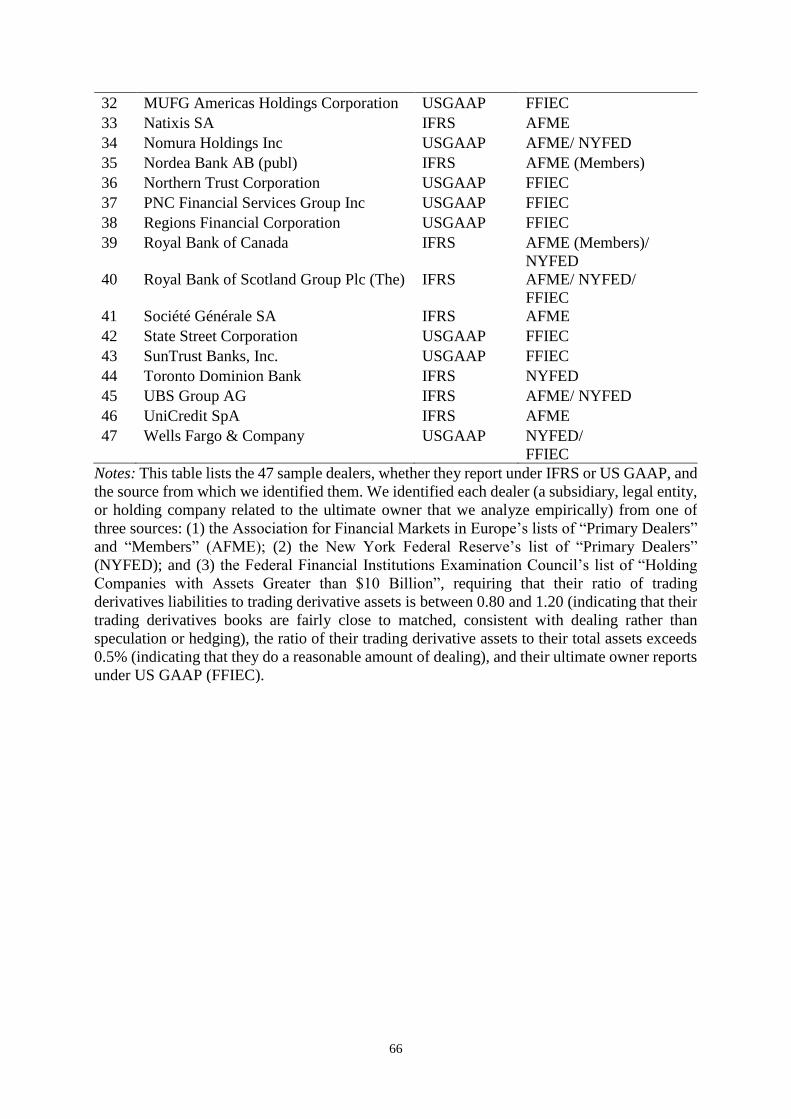
66
32 MUFG Americas Holdings Corporation USGAAP FFIEC
33 Natixis SA IFRS AFME
34 Nomura Holdings Inc USGAAP AFME/ NYFED
35 Nordea Bank AB (publ) IFRS AFME (Members)
36 Northern Trust Corporation USGAAP FFIEC
37 PNC Financial Services Group Inc USGAAP FFIEC
38 Regions Financial Corporation USGAAP FFIEC
39 Royal Bank of Canada IFRS AFME (Members)/
NYFED
40 Royal Bank of Scotland Group Plc (The) IFRS AFME/ NYFED/
FFIEC
41 Société Générale SA IFRS AFME
42 State Street Corporation USGAAP FFIEC
43 SunTrust Banks, Inc. USGAAP FFIEC
44 Toronto Dominion Bank IFRS NYFED
45 UBS Group AG IFRS AFME/ NYFED
46 UniCredit SpA IFRS AFME
47 Wells Fargo & Company USGAAP NYFED/
FFIEC
Notes: This table lists the 47 sample dealers, whether they report under IFRS or US GAAP, and
the source from which we identified them. We identified each dealer (a subsidiary, legal entity,
or holding company related to the ultimate owner that we analyze empirically) from one of
three sources: (1) the Association for Financial Markets in Europe’s lists of “Primary Dealers”
and “Members” (AFME); (2) the New York Federal Reserve’s list of “Primary Dealers”
(NYFED); and (3) the Federal Financial Institutions Examination Council’s list of “Holding
Companies with Assets Greater than $10 Billion”, requiring that their ratio of trading
derivatives liabilities to trading derivative assets is between 0.80 and 1.20 (indicating that their
trading derivatives books are fairly close to matched, consistent with dealing rather than
speculation or hedging), the ratio of their trading derivative assets to their total assets exceeds
0.5% (indicating that they do a reasonable amount of dealing), and their ultimate owner reports
under US GAAP (FFIEC).

67
APPENDIX 4
Dealer Heterogeneity
Notes: This figure plots, for each of the 47 sample dealers during 2012–2017, the mean of gross
derivative liabilities fair value (GroDerLiab) divided by gross derivative assets fair value
(GroDerAss), a measure of the matching of their derivatives books, on the vertical axis against
the mean ratio of GroDerAss to total assets, a measure of derivatives activity, on the horizontal
activity.
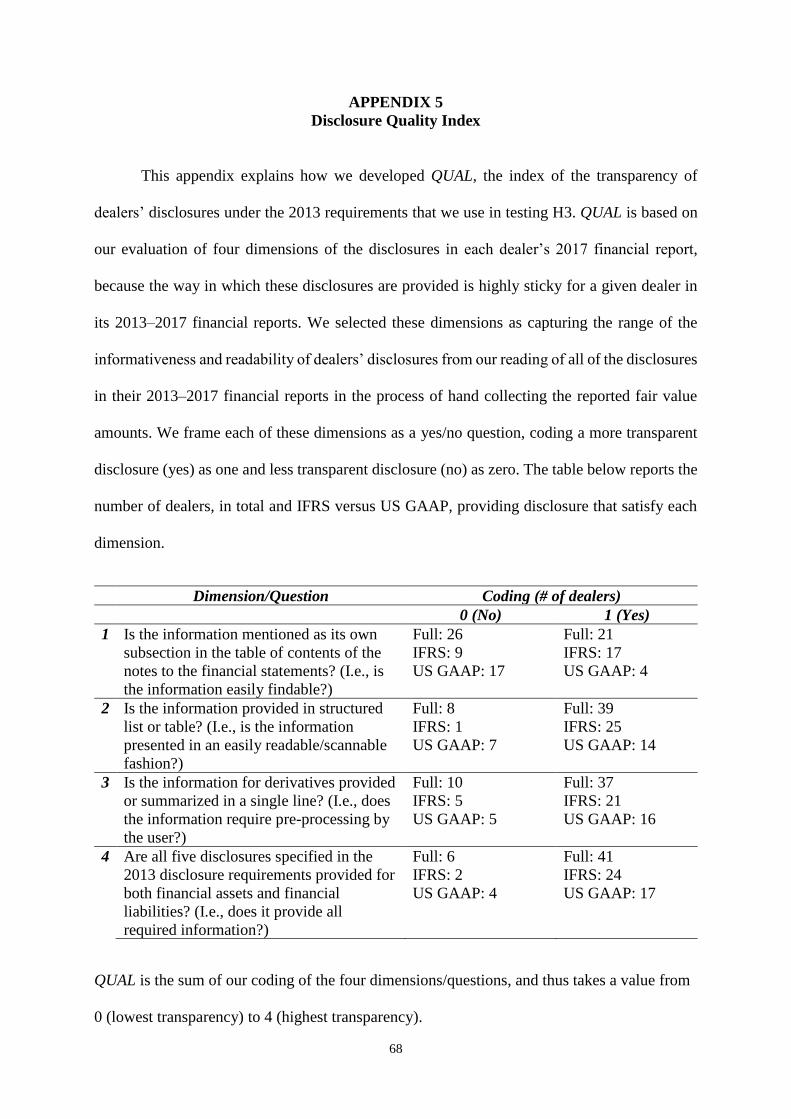
68
APPENDIX 5
Disclosure Quality Index
This appendix explains how we developed QUAL, the index of the transparency of
dealers’ disclosures under the 2013 requirements that we use in testing H3. QUAL is based on
our evaluation of four dimensions of the disclosures in each dealer’s 2017 financial report,
because the way in which these disclosures are provided is highly sticky for a given dealer in
its 2013–2017 financial reports. We selected these dimensions as capturing the range of the
informativeness and readability of dealers’ disclosures from our reading of all of the disclosures
in their 2013–2017 financial reports in the process of hand collecting the reported fair value
amounts. We frame each of these dimensions as a yes/no question, coding a more transparent
disclosure (yes) as one and less transparent disclosure (no) as zero. The table below reports the
number of dealers, in total and IFRS versus US GAAP, providing disclosure that satisfy each
dimension.
Dimension/Question Coding (# of dealers)
0 (No) 1 (Yes)
1 Is the information mentioned as its own
subsection in the table of contents of the
notes to the financial statements? (I.e., is
the information easily findable?)
Full: 26
IFRS: 9
US GAAP: 17
Full: 21
IFRS: 17
US GAAP: 4
2 Is the information provided in structured
list or table? (I.e., is the information
presented in an easily readable/scannable
fashion?)
Full: 8
IFRS: 1
US GAAP: 7
Full: 39
IFRS: 25
US GAAP: 14
3 Is the information for derivatives provided
or summarized in a single line? (I.e., does
the information require pre-processing by
the user?)
Full: 10
IFRS: 5
US GAAP: 5
Full: 37
IFRS: 21
US GAAP: 16
4 Are all five disclosures specified in the
2013 disclosure requirements provided for
both financial assets and financial
liabilities? (I.e., does it provide all
required information?)
Full: 6
IFRS: 2
US GAAP: 4
Full: 41
IFRS: 24
US GAAP: 17
QUAL is the sum of our coding of the four dimensions/questions, and thus takes a value from
0 (lowest transparency) to 4 (highest transparency).
Copyright © 2022 FDOKUMEN