Speciation dynamics in the SE Asian tropics - Digital CSIC
10
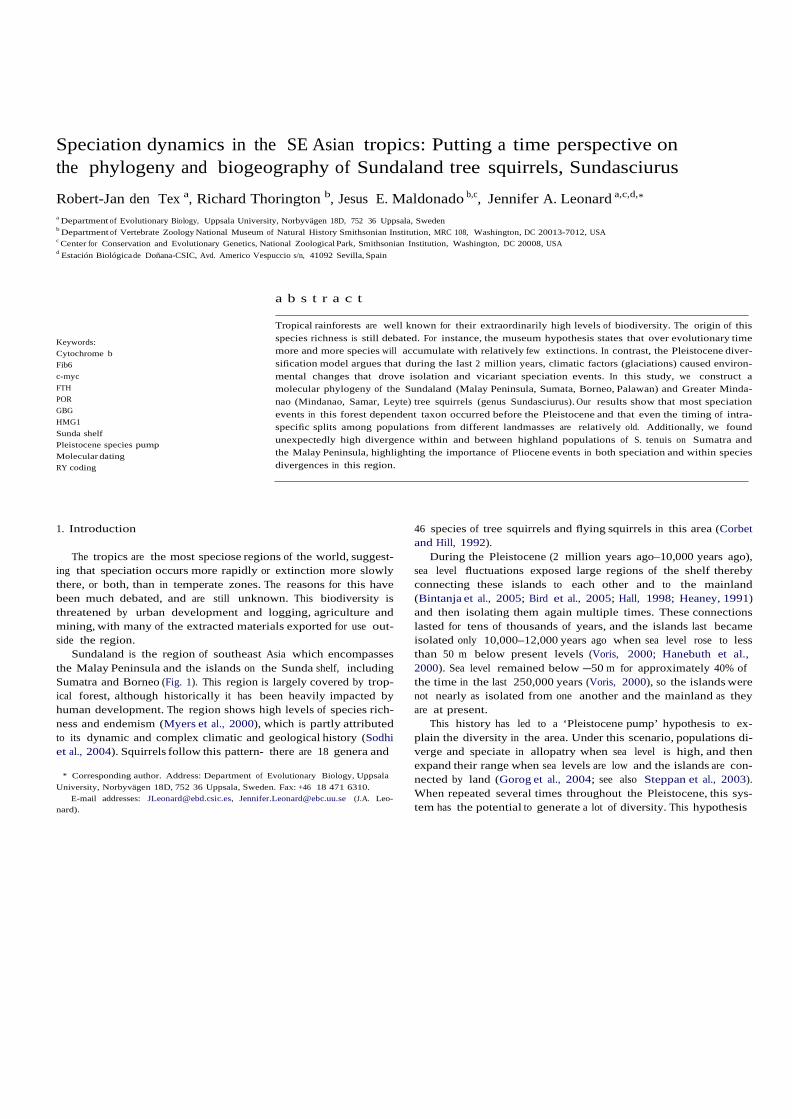
Speciation dynamics in the SE Asian tropics: Putting a time perspective on the phylogeny and biogeography of Sundaland tree squirrels, Sundasciurus Robert-Jan den Tex a , Richard Thorington b , Jesus E. Maldonado b,c , Jennifer A. Leonard a,c,d, * a Department of Evolutionary Biology, Uppsala University, Norbyvägen 18D, 752 36 Uppsala, Sweden b Department of Vertebrate Zoology National Museum of Natural History Smithsonian Institution, MRC 108, Washington, DC 20013-7012, USA c Center for Conservation and Evolutionary Genetics, National Zoological Park, Smithsonian Institution, Washington, DC 20008, USA d Estación Biológica de Doñana-CSIC, Avd. Americo Vespuccio s/n, 41092 Sevilla, Spain Keywords: Cytochrome b Fib6 c-myc FTH POR GBG HMG1 Sunda shelf Pleistocene species pump Molecular dating RY coding a b s t r a c t Tropical rainforests are well known for their extraordinarily high levels of biodiversity. The origin of this species richness is still debated. For instance, the museum hypothesis states that over evolutionary time more and more species will accumulate with relatively few extinctions. In contrast, the Pleistocene diver- sification model argues that during the last 2 million years, climatic factors (glaciations) caused environ- mental changes that drove isolation and vicariant speciation events. In this study, we construct a molecular phylogeny of the Sundaland (Malay Peninsula, Sumata, Borneo, Palawan) and Greater Minda- nao (Mindanao, Samar, Leyte) tree squirrels (genus Sundasciurus). Our results show that most speciation events in this forest dependent taxon occurred before the Pleistocene and that even the timing of intra- specific splits among populations from different landmasses are relatively old. Additionally, we found unexpectedly high divergence within and between highland populations of S. tenuis on Sumatra and the Malay Peninsula, highlighting the importance of Pliocene events in both speciation and within species divergences in this region. 1. Introduction The tropics are the most speciose regions of the world, suggest- ing that speciation occurs more rapidly or extinction more slowly there, or both, than in temperate zones. The reasons for this have been much debated, and are still unknown. This biodiversity is threatened by urban development and logging, agriculture and mining, with many of the extracted materials exported for use out- side the region. Sundaland is the region of southeast Asia which encompasses the Malay Peninsula and the islands on the Sunda shelf, including Sumatra and Borneo (Fig. 1). This region is largely covered by trop- ical forest, although historically it has been heavily impacted by human development. The region shows high levels of species rich- ness and endemism (Myers et al., 2000), which is partly attributed to its dynamic and complex climatic and geological history (Sodhi et al., 2004). Squirrels follow this pattern- there are 18 genera and * Corresponding author. Address: Department of Evolutionary Biology, Uppsala University, Norbyvägen 18D, 752 36 Uppsala, Sweden. Fax: +46 18 471 6310. E-mail addresses: [email protected], [email protected] (J.A. Leo- nard). 46 species of tree squirrels and flying squirrels in this area (Corbet and Hill, 1992). During the Pleistocene (2 million years ago–10,000 years ago), sea level fluctuations exposed large regions of the shelf thereby connecting these islands to each other and to the mainland (Bintanja et al., 2005; Bird et al., 2005; Hall, 1998; Heaney, 1991) and then isolating them again multiple times. These connections lasted for tens of thousands of years, and the islands last became isolated only 10,000–12,000 years ago when sea level rose to less than 50 m below present levels (Voris, 2000; Hanebuth et al., 2000). Sea level remained below —50 m for approximately 40% of the time in the last 250,000 years (Voris, 2000), so the islands were not nearly as isolated from one another and the mainland as they are at present. This history has led to a ‘Pleistocene pump’ hypothesis to ex- plain the diversity in the area. Under this scenario, populations di- verge and speciate in allopatry when sea level is high, and then expand their range when sea levels are low and the islands are con- nected by land (Gorog et al., 2004; see also Steppan et al., 2003). When repeated several times throughout the Pleistocene, this sys- tem has the potential to generate a lot of diversity. This hypothesis
-
Upload
khangminh22 -
Category
Documents
-
view
0 -
download
0
Transcript of Speciation dynamics in the SE Asian tropics - Digital CSIC
Speciation dynamics in the SE Asian tropics: Putting a time perspective on the phylogeny and biogeography of Sundaland tree squirrels, Sundasciurus
Robert-Jan den Tex a, Richard Thorington b, Jesus E. Maldonado b,c, Jennifer A. Leonard a,c,d,*
a Department of Evolutionary Biology, Uppsala University, Norbyvägen 18D, 752 36 Uppsala, Sweden b Department of Vertebrate Zoology National Museum of Natural History Smithsonian Institution, MRC 108, Washington, DC 20013-7012, USA c Center for Conservation and Evolutionary Genetics, National Zoological Park, Smithsonian Institution, Washington, DC 20008, USA d Estación Biológica de Doñana-CSIC, Avd. Americo Vespuccio s/n, 41092 Sevilla, Spain
Keywords: Cytochrome b Fib6 c-myc FTH POR GBG HMG1 Sunda shelf Pleistocene species pump Molecular dating RY coding
a b s t r a c t Tropical rainforests are well known for their extraordinarily high levels of biodiversity. The origin of this species richness is still debated. For instance, the museum hypothesis states that over evolutionary time more and more species will accumulate with relatively few extinctions. In contrast, the Pleistocene diver- sification model argues that during the last 2 million years, climatic factors (glaciations) caused environ- mental changes that drove isolation and vicariant speciation events. In this study, we construct a molecular phylogeny of the Sundaland (Malay Peninsula, Sumata, Borneo, Palawan) and Greater Minda- nao (Mindanao, Samar, Leyte) tree squirrels (genus Sundasciurus). Our results show that most speciation events in this forest dependent taxon occurred before the Pleistocene and that even the timing of intra- specific splits among populations from different landmasses are relatively old. Additionally, we found unexpectedly high divergence within and between highland populations of S. tenuis on Sumatra and the Malay Peninsula, highlighting the importance of Pliocene events in both speciation and within species divergences in this region.
1. Introduction
The tropics are the most speciose regions of the world, suggest- ing that speciation occurs more rapidly or extinction more slowly there, or both, than in temperate zones. The reasons for this have been much debated, and are still unknown. This biodiversity is threatened by urban development and logging, agriculture and mining, with many of the extracted materials exported for use out- side the region.
Sundaland is the region of southeast Asia which encompasses the Malay Peninsula and the islands on the Sunda shelf, including Sumatra and Borneo (Fig. 1). This region is largely covered by trop- ical forest, although historically it has been heavily impacted by human development. The region shows high levels of species rich- ness and endemism (Myers et al., 2000), which is partly attributed to its dynamic and complex climatic and geological history (Sodhi et al., 2004). Squirrels follow this pattern- there are 18 genera and
* Corresponding author. Address: Department of Evolutionary Biology, Uppsala
University, Norbyvägen 18D, 752 36 Uppsala, Sweden. Fax: +46 18 471 6310. E-mail addresses: [email protected], [email protected] (J.A. Leo-
nard).
46 species of tree squirrels and flying squirrels in this area (Corbet and Hill, 1992).
During the Pleistocene (2 million years ago–10,000 years ago), sea level fluctuations exposed large regions of the shelf thereby connecting these islands to each other and to the mainland (Bintanja et al., 2005; Bird et al., 2005; Hall, 1998; Heaney, 1991) and then isolating them again multiple times. These connections lasted for tens of thousands of years, and the islands last became isolated only 10,000–12,000 years ago when sea level rose to less than 50 m below present levels (Voris, 2000; Hanebuth et al., 2000). Sea level remained below —50 m for approximately 40% of the time in the last 250,000 years (Voris, 2000), so the islands were not nearly as isolated from one another and the mainland as they are at present.
This history has led to a ‘Pleistocene pump’ hypothesis to ex- plain the diversity in the area. Under this scenario, populations di- verge and speciate in allopatry when sea level is high, and then expand their range when sea levels are low and the islands are con- nected by land (Gorog et al., 2004; see also Steppan et al., 2003). When repeated several times throughout the Pleistocene, this sys- tem has the potential to generate a lot of diversity. This hypothesis

Fig. 1. Map of Southeast Asia showing Sundaland (Malay Peninsula, Sumatra, Java, Borneo and Greater Palawan) and the oceanic Philippine Islands that make up Greater Mindanao (Mindanao, Samar, Leyte, Bohol and smaller adjacent islands) and the Sulu archipelago. Lighter color land areas are more than 1000 m above sea level. The black lines show the maximum exposure of land during the Last Glacial Maximum (LGM) around 18,000 years ago when sea levels were 120 m below their current level (after Voris, 2000). The dashed line shows the contour line of exposed land when sea levels were around 40 m below current. For Palawan, Greater Mindanao and the Sulu Islands the 40 m contour line coincides with the current coastline. The basic map was obtained from http://www.ngdc.noaa.gov/mgg/topo/pictures/ASIAcolshadezw.tif.
has been supported by low levels of genetic divergence between populations of some Sunda shelf mammals (Campbell et al., 2004, 2006; Gorog et al., 2004; Lucchini et al., 2005; Roos et al., 2003). However, the vegetation during the Pleistocene glacial peri- ods was undoubtedly very different from the present, and the interactions between climate and sea level and their effects on the distribution of the fauna and flora is complex (van den Bergh et al., 2001). For example, Cranbrook (2000) interpreted the large mammal fauna of the Pleistocene of coastal Borneo as being more adapted to savannas than to the rainforests of the present. Gorog et al. (2004) adduced evidence that populations of rainforest rats on the Sunda Islands and Malay Peninsula (Maxomys and Leo- poldamys) became isolated from one another in the mid- to late Pli- ocene, perhaps 2 million years ago. This evidence may support the museum or stasis hypothesis, which states that the high diversity in the tropics was generated over a much longer time period due to high ecological stability (Gathorne-Hardy et al., 2002; Morley, 2002).
Many Sunda taxa have also colonized the southwestern Philip- pine Islands (Heaney, 1986), particularly the Palawan Islands and Greater Mindanao (including Mindanao, Samar, Leyte and smaller nearby islands, Fig. 1). The Philippines lie just to the east of the Sun- da shelf. It is possible that the Palawan Islands were connected to Borneo by land in the middle and/or late Pleistocene (Bird et al., 2005; Heaney, 1986). The islands of Greater Mindanao were con- nected to each other during Pleistocene low sea level stands (Heaney et al., 2005), but were separated from the Sunda shelf by a series of narrow straits of deep water and small islands (Musser and Heaney, 1985; Jones and Kennedy, 2008; Steppan et al., 2003). It is possible that the Sunda fauna colonized the Philippines via a land bridge to Palawan and then spread through the main Philippine
Islands to Greater Mindanao. Alternatively, they could have colo- nized Palawan and Greater Mindanao separately, as suggested by geographic distance from Borneo. Both of these hypotheses require squirrels to have colonized and then gone extinct on some islands.
Tree squirrels in the genus Sundasciurus are a good model sys- tem in which to test these biogeographic hypotheses. They are for- est dependent squirrels distributed across the Sunda shelf, the Palawan Islands and Greater Mindanao (Fig. 1). The genus includes both narrowly and widely distributed species (Corbet and Hill, 1992). However, they are poor over-water dispersers (Mercer and Roth, 2003). The alpha taxonomy is relatively well known and the group is not too species rich (Thorington and Hoffmann, 2005).
We use near complete mitochondrial cytochrome b sequences from most species from the genus Sundasciurus, and as many major populations as possible for widely distributed species, to construct a phylogeny of the genus. We use this phylogeny to test the Pleis- tocene pump and the museum/stasis hypotheses and to determine the colonization history of the Philippine Islands. 2. Materials and methods 2.1. Materials
Fourteen of the 15 species of the genus Sundasciurus recognized by Thorington and Hoffmann (2005) are included in this study. The missing species is S. davensis, which is only known from its type locality on Mindanao, Philippines (Thorington and Hoffmann 2005) and considered a synonym of S. philippinensis by Corbet and Hill (1992) and Heaney et al. (1998). A minimum of two indi- viduals per species were included, and more for the widely distrib-

uted species (S. tenuis, S. lowii and S. hippurus). In total 79 individ- uals were included, the majority of which (n = 61) came from mu- seum specimens (Table 1). The remaining 18 samples were obtained from fresh tissue (Table 1). Cytochrome b sequences from the squirrel genus Callosciurus were selected as the most appropri- ate outgroup based on Steppan et al. (2004) and Mercer and Roth (2003) and sequences were downloaded from GenBank (Oshida et al. 2001; AB043875, AB043879, AB043880 and AB043882).
2.2. Molecular methods
The museum samples were extracted in a special dedicated labora-
tory for low quality DNA that is physically separated from the main laboratory. DNA was extracted by phenol–chloroform and concen- trated in Centricons as in Leonard et al. (2005) or by DNeasy animal tis- sue and blood extraction kit (Qiagen, Hilden, Germany) following the animal tissue protocol. To monitor for contamination, negative extrac- tions were included in every batch of extractions. DNA from the fresh tissue samples was extracted by phenol–chloroform extraction and alcohol precipitated (Sambrook et al., 1989). DNA samples were quan- tified by taking absorbance readings using a Nanodrop ND-1000 Spec- trophotometer (Thermo Scientific) at 260 nm wavelength.
We amplified the whole cytochrome b gene in one fragment for the high quality samples and in four to nine fragments from the his- toric specimens (Table 2). Seven nuclear intron fragments were screened in high quality tissue samples. They were Fib6 (Rod- Fib6Fwd: 50 -GAA GAA GTA CTG GCT TGC CAG; RodFib6Rev: 50 -CAT TGC CAA GCC AAT ATT C) designed from mouse, rat and human sequences from GenBank (NP_862897.1, NP_064456.1, NP_005132.2); AP5 (DeBry and Seshadri, 2001); c-myc (cmycFwd: 50 -AAT TTT CTT GCC TGT GCC ATA ACC; cmycRev: 50 -CTG TGA GGA GGT TTG CTG TGG CTT) based on sequences from Steppan et al. (2003); and FTH1, POR, GBG and HMG1 from Jiang et al. (1998).
Fragments were amplified in 25 ll reactions that included 1× Gold Buffer (Applied Biosystems, Foster City, CA, USA), 2.5 mM MgCl2, 0.8 mM dNTPs (0.2 mM each), 1 lM of each primer, 1.25 U AmpliTaq Gold DNA polymerase (Applied Biosystems) and between 10 and 50 ng of DNA. The PCR program started with an initial dena- turation step of 95 °C for 10 min followed by 36 cycles of 95 °C for 30 s, annealing of 50–60 °C for 30 s and extension of 72 °C for 45 s; with a final extension of 72 °C for 10 min. In all cases negative con- trols were included to identify possible contamination.
The PCR products were checked on a 2% agarose gel stained with ethidium bromide. Successful amplifications were purified in 25 ll reactions containing 21 ll PCR product, 16.8 U of Exonu- clease I (New England Biolabs, Ipswich, MA, USA) and 1.68 U of Shrimp Alkaline Phosphatase (USB Corporation, Staufen, Germany) incubated at 37 °C for 15 min followed by 80 °C for 15 min. Both strands of each PCR product were sequenced with BigDye (Applied Biosystems) according to manufacturer’s recommendations with the same primers as used for amplification. Sequencing reactions were separated and analyzed on an automated ABI 3730xl DNA Analyzer (Applied Biosystems).
In order to control for possible apparent mutations caused by DNA damage, each fragment from all historical specimens was amplified in at least two independent reactions and sequenced. The sequence fragments were checked, edited and concatenated in Sequencher 4.6 (Gene Codes Corporation, Ann Arbor, MI, USA) into one sequence that was used in phylogenetic and molecular dating analyses.
2.3. Phylogenetic analyses
The Akaike Information Criterion (AIC), as implemented in the
program Modeltest version 3.7 (Posada and Crandall, 1998), was used to infer the most appropriate models of sequence evolution for both the whole data set and the codon-partitioned data set.
The base composition among the variable sites of the ingroup was tested with a v2 test as implemented in PAUP+ version 4.10b (Swofford, 2002). To investigate if saturation affects our data set, the Maximum Likelihood corrected distances were plotted against both the 3rd codon uncorrected transversion distances and 3rd codon uncorrected transition distances.
Different methods of phylogenetic inference were used to con- struct phylogenies: maximum parsimony (MP), maximum likelihood (ML) and Bayesian analyses. The MP and ML analyses were conducted with PAUP+ version 4.10b. We used a heuristic search algorithm with a 1000 additional sequence replicates with random sequence addi- tion and tree bisection and reconnection (TBR) for the MP analysis. The MP bootstrap (1000 replicates) analysis was performed using a heuristic search with 1000 additional sequence replicates with ran- dom sequence addition and TBR for each bootstrap replicate.
The ML analysis was performed with a heuristic search and 100 additional sequence replicates with random sequence addition and TBR and the model based on the whole data set selected by Mod- eltest. ML bootstrap (100 replicates) used 10 additional sequence replicates with random sequence addition and TBR for each boot- strap replicate.
MrBayes version 3.1.2 (Ronquist and Huelsenbeck, 2003) was used for the Bayesian inference. Bayesian analyses were performed both with and without codon partitioning and for the partitioned data set it was replicated twice. Four heated chains were used that ran for 5 million generations, at which point the average standard deviation of split frequencies approached zero (<0.0001). Trees were sampled every 100 generations and the first 25% were discarded as burnin.
2.4. Molecular dating
We first tested if the cytochrome b sequences evolved under a molecular clock by comparing the ML scores of the unconstrained tree versus the ML tree constrained with a molecular clock. No sig- nificant difference was found. Therefore, branch lengths of the molecular clock were estimated with the baseml package in PAML version 4.1 (Yang, 2007). Age estimates for the different nodes were calculated by calibrating the root of the tree with an age esti- mate of 10 million years ago (MYA) that corresponds with the approximate split between the outgroup Callosciurus and the in- group Sundasciurus (Mercer and Roth 2003). Age estimates were also calculated in a Bayesian framework as implemented in the mcmctree package included in PAML version 4.1, using an age interval between 7 and 11 MYA for the root of the tree.
Irwin et al. (1991) have shown that generally in mammals 3rd codon transversions in cytochrome b evolve at around 0.5% per mil- lion year and Harrison et al. (2003) found the same value for ground squirrels. However, substitution rates in rodents may be much higher than other mammals (e.g. Spradling et al., 2001). To compare our rate estimates with other rate estimates in rodents, cytochrome b se- quence data from two different studies in which rates were calibrated based on fossil information, were downloaded from GenBank (Apo- mys, Steppan et al., 2003 and Rattus, Robins et al., 2008). In both cases the data evolved under a (nearly) molecular clock. The age estimates in millions of years of the different nodes were plotted against the 3rd codon transversion distances and linear regression lines were plotted through the data points and forced through the origin. The slope val- ues constitute an estimate of the rate of 3rd codon transversions per million year and these values were used to obtain age estimates based on the 3rd codon transversion distances from our study. 3. Results
Twenty-one of the 61 museum specimens did not produce a po- sitive PCR amplification, 19 yielded partial sequences and 21
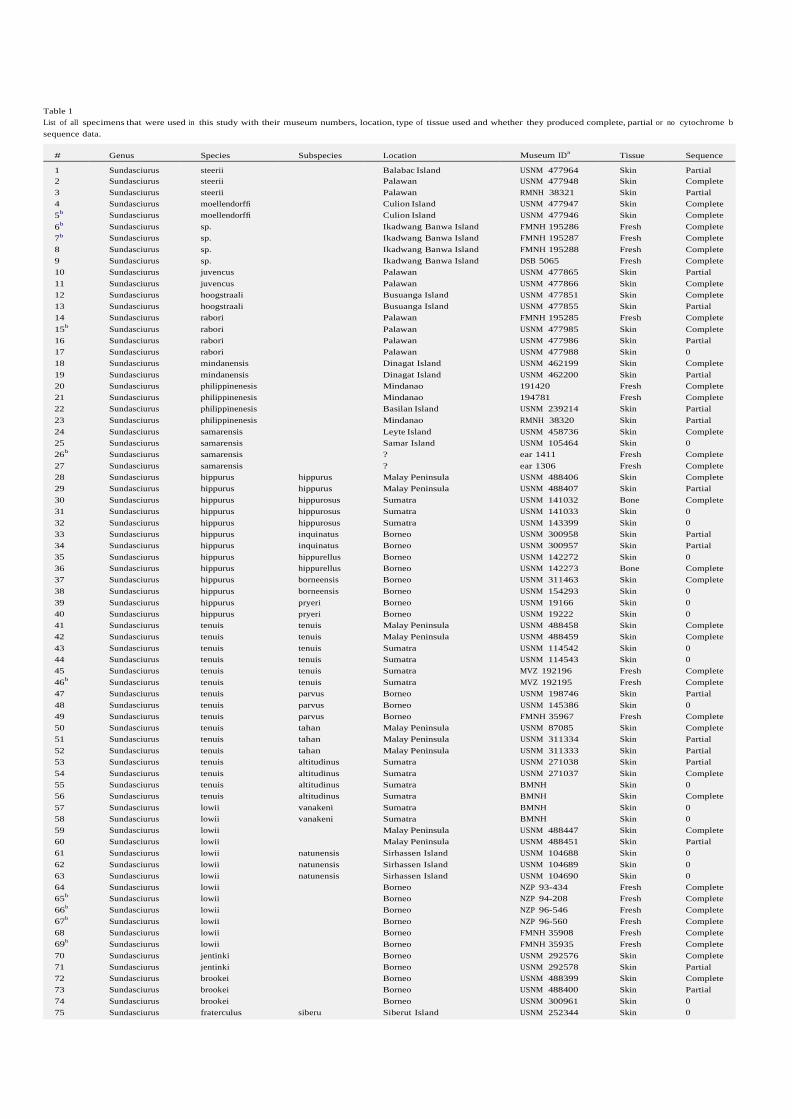
Table 1 List of all specimens that were used in this study with their museum numbers, location, type of tissue used and whether they produced complete, partial or no cytochrome b sequence data.
# Genus Species Subspecies Location Museum IDa Tissue Sequence 1 Sundasciurus steerii Balabac Island USNM 477964 Skin Partial 2 Sundasciurus steerii Palawan USNM 477948 Skin Complete 3 Sundasciurus steerii Palawan RMNH 38321 Skin Partial 4 Sundasciurus moellendorffi Culion Island USNM 477947 Skin Complete 5b Sundasciurus moellendorffi Culion Island USNM 477946 Skin Complete 6b Sundasciurus sp. Ikadwang Banwa Island FMNH 195286 Fresh Complete 7b Sundasciurus sp. Ikadwang Banwa Island FMNH 195287 Fresh Complete 8 Sundasciurus sp. Ikadwang Banwa Island FMNH 195288 Fresh Complete 9 Sundasciurus sp. Ikadwang Banwa Island DSB 5065 Fresh Complete 10 Sundasciurus juvencus Palawan USNM 477865 Skin Partial 11 Sundasciurus juvencus Palawan USNM 477866 Skin Complete 12 Sundasciurus hoogstraali Busuanga Island USNM 477851 Skin Complete 13 Sundasciurus hoogstraali Busuanga Island USNM 477855 Skin Partial 14 Sundasciurus rabori Palawan FMNH 195285 Fresh Complete 15b Sundasciurus rabori Palawan USNM 477985 Skin Complete 16 Sundasciurus rabori Palawan USNM 477986 Skin Partial 17 Sundasciurus rabori Palawan USNM 477988 Skin 0 18 Sundasciurus mindanensis Dinagat Island USNM 462199 Skin Complete 19 Sundasciurus mindanensis Dinagat Island USNM 462200 Skin Partial 20 Sundasciurus philippinenesis Mindanao 191420 Fresh Complete 21 Sundasciurus philippinenesis Mindanao 194781 Fresh Complete 22 Sundasciurus philippinenesis Basilan Island USNM 239214 Skin Partial 23 Sundasciurus philippinenesis Mindanao RMNH 38320 Skin Partial 24 Sundasciurus samarensis Leyte Island USNM 458736 Skin Complete 25 Sundasciurus samarensis Samar Island USNM 105464 Skin 0 26b Sundasciurus samarensis ? ear 1411 Fresh Complete 27 Sundasciurus samarensis ? ear 1306 Fresh Complete 28 Sundasciurus hippurus hippurus Malay Peninsula USNM 488406 Skin Complete 29 Sundasciurus hippurus hippurus Malay Peninsula USNM 488407 Skin Partial 30 Sundasciurus hippurus hippurosus Sumatra USNM 141032 Bone Complete 31 Sundasciurus hippurus hippurosus Sumatra USNM 141033 Skin 0 32 Sundasciurus hippurus hippurosus Sumatra USNM 143399 Skin 0 33 Sundasciurus hippurus inquinatus Borneo USNM 300958 Skin Partial 34 Sundasciurus hippurus inquinatus Borneo USNM 300957 Skin Partial 35 Sundasciurus hippurus hippurellus Borneo USNM 142272 Skin 0 36 Sundasciurus hippurus hippurellus Borneo USNM 142273 Bone Complete 37 Sundasciurus hippurus borneensis Borneo USNM 311463 Skin Complete 38 Sundasciurus hippurus borneensis Borneo USNM 154293 Skin 0 39 Sundasciurus hippurus pryeri Borneo USNM 19166 Skin 0 40 Sundasciurus hippurus pryeri Borneo USNM 19222 Skin 0 41 Sundasciurus tenuis tenuis Malay Peninsula USNM 488458 Skin Complete 42 Sundasciurus tenuis tenuis Malay Peninsula USNM 488459 Skin Complete 43 Sundasciurus tenuis tenuis Sumatra USNM 114542 Skin 0 44 Sundasciurus tenuis tenuis Sumatra USNM 114543 Skin 0 45 Sundasciurus tenuis tenuis Sumatra MVZ 192196 Fresh Complete 46b Sundasciurus tenuis tenuis Sumatra MVZ 192195 Fresh Complete 47 Sundasciurus tenuis parvus Borneo USNM 198746 Skin Partial 48 Sundasciurus tenuis parvus Borneo USNM 145386 Skin 0 49 Sundasciurus tenuis parvus Borneo FMNH 35967 Fresh Complete 50 Sundasciurus tenuis tahan Malay Peninsula USNM 87085 Skin Complete 51 Sundasciurus tenuis tahan Malay Peninsula USNM 311334 Skin Partial 52 Sundasciurus tenuis tahan Malay Peninsula USNM 311333 Skin Partial 53 Sundasciurus tenuis altitudinus Sumatra USNM 271038 Skin Partial 54 Sundasciurus tenuis altitudinus Sumatra USNM 271037 Skin Complete 55 Sundasciurus tenuis altitudinus Sumatra BMNH Skin 0 56 Sundasciurus tenuis altitudinus Sumatra BMNH Skin Complete 57 Sundasciurus lowii vanakeni Sumatra BMNH Skin 0 58 Sundasciurus lowii vanakeni Sumatra BMNH Skin 0 59 Sundasciurus lowii Malay Peninsula USNM 488447 Skin Complete 60 Sundasciurus lowii Malay Peninsula USNM 488451 Skin Partial 61 Sundasciurus lowii natunensis Sirhassen Island USNM 104688 Skin 0 62 Sundasciurus lowii natunensis Sirhassen Island USNM 104689 Skin 0 63 Sundasciurus lowii natunensis Sirhassen Island USNM 104690 Skin 0 64 Sundasciurus lowii Borneo NZP 93-434 Fresh Complete 65b Sundasciurus lowii Borneo NZP 94-208 Fresh Complete 66b Sundasciurus lowii Borneo NZP 96-546 Fresh Complete 67b Sundasciurus lowii Borneo NZP 96-560 Fresh Complete 68 Sundasciurus lowii Borneo FMNH 35908 Fresh Complete 69b Sundasciurus lowii Borneo FMNH 35935 Fresh Complete 70 Sundasciurus jentinki Borneo USNM 292576 Skin Complete 71 Sundasciurus jentinki Borneo USNM 292578 Skin Partial 72 Sundasciurus brookei Borneo USNM 488399 Skin Complete 73 Sundasciurus brookei Borneo USNM 488400 Skin Partial 74 Sundasciurus brookei Borneo USNM 300961 Skin 0 75 Sundasciurus fraterculus siberu Siberut Island USNM 252344 Skin 0

Table 1 (continued)
# Genus Species Subspecies Location Museum IDa Tissue Sequence 76 Sundasciurus fraterculus pumilus South Pagi Island USNM 121628 Bone Complete 77 Sundasciurus fraterculus fraterculus Sipora Island USNM 252349 Skin 0 78 Sundasciurus fraterculus fraterculus Sipora Island USNM 252347 Skin 0 79 Sundasciurus fraterculus siberu Siberut Island USNM 252339 Skin Partial
a Acronyms: BMNH = British Museum of Natural History (now, the Natural History Museum), London; DSB, EAR = uncatalogued specimens from the FMNH; FMNH = Field Museum, Chicago; MVZ = Museum of Vertebrate Zoology, Berkeley; NZP = National Zoological Park (Smithsonian Institution), Washington, DC; RMNH = Rijksmuseum van Natuurlijke Historie (now, National Museum of Natural History ‘Naturalis’), Leiden; USNM = US National Museum (Smithsonian Institution), Washington, DC.
b Individuals that differed less than 1% in uncorrected pairwise distance with the same taxon and therefore were left out in the phylogenetic analyses.
yielded the complete 1075 bp fragment of cytochrome b used in these analyses (Table 1). No differences were found in the sequences of the multiple replicates amplified from individual historic speci- mens. All fresh tissue samples were amplified and sequenced suc-
Table 2 Primers used in this study with the 50 position number that refers to the character position in the cytochrome b gene sequence from the complete mtDNA sequence of Sciurus vulgaris (cytochrome b from 14167–15306; GenBank Accession No. NC_002369; Reyes et al., 2000).
Sequence 50 –30 50 Position
Forward primers 1 L14724 GAT ATG AAA AAC CAT CGT TG 14126 2 Steerii fwd1 ATG ACA AAC ATT CGC AAA ACT CAC CC 14167 3 UniCB51 CCA ACA TCC GTA AAT CCC ACC C 14171 4 Phil fwd1 ATC CTA ACH GGR CTC TTC CT 14299 5 sqCB53 GGA CTC TTC CTA GCC ATA CA 14308 6 Phil fwd2 TAC ATA CAY GCC AAC GGC GC 14407 7 L15045 GCC TAT TCC TAC ATG TAG GAC G 14444 8 L15162Irw GCA AGC TTC TAC CAT GAG GAC AAA TAT C 14555 9 L15200 GTC ATT ACC AAC CTC CTA TC 14599 10 Phil fwd3 TCA GCW ATC CCY TAY RTC GG 14617 11 Phil fwd4 GTC GAC AAA GCA ACC CTC ACA CG 14674 12 Alt fwd1 GTY CAT CTC CTA TTY CTW CAY GA 14749 13 Palawan fwd1 CTC TTT CTT CAC GAA ACC GGA TC 14758 14 L15370 CAC GAA ACA GGA TCA AAC AAC C 14767 15 Phil fwd5 AAC AAC CCA TCT GGT ATT ATC TC 14782 16 Alt fwd2 TCC GGY CTW ATC TCG GAC TC 14791 17 Rabori fwd1 TCT GGC CTA ATC TCT GAC TCC 14791 18 Phil fwd6 CTA GCC TTT ATA ATG CTA GT 14875 19 Rabori fwd2 GCC TTT ATA ATG CTA GTC CTC TTT TC 14878 20 L15506 CCT GAT CTC CTA GGA GAT CC 14905 21 L15513Ir CTA GGA GAC CCT GAC AAC TA 14914 22 UniCb33 GGT ACT TCC TAT TTG CCT ACG 14981 23 L15878 CAC ACA TCA AAA CAA CGA AGC AT 15088 24 Phil fwd7 ACA CTW ACC TGR ATC GGA GG 15166 25 CarnCB31 GAA TTG GTG GAC AAC CAG TAG AA 15176
Reverse primers 1 Phil rev208 GGC YGT WAG WGT YTC TGA TG 14352 2 CarnCB52 CCG TAG TTA ACG TCT CG GCA 14393 3 Steerii rev1 TCA GCC ATA GTT TAC GTC TCG GC 14397 4 Phil rev1 GCC TAC GTG GAG GAA GAG GC 14463 5 sqCB58 CCG ATG TTT CAT GTT TCG AA 14513 6 Steerii rev2 ACC CAT GAA TGC TGT GGC TAT TAC GG 14556 7 Phil rev2 TAT TTG MCC TCA TGG GAG GAC 14580 8 sqCB56 CCT CCT CAG ATT CAT TCT AC 14666 9 Phil rev3 TTC ATG AAG GAA TAG TAG GT 14772 10 Phil rev4 GTG GAA GGG AAT TTT GTC GG 14829 11 H15417 AGT AGG GGT GGA AAG GGA TTT 14836 12 Phil rev5 GTC TCC TAA GAG GTC AGG GG 14922 13 H15494 TAG TTG TCA GGG TCT CCT AG 14933 14 Alt rev1 TGT GTA ATT ATC GGG GTC TCC 14937 15 Palawan rev1 TGG CTT GAT ATG GGG AGG GGT GT 14976 16 H15683 CGA AGG ATA GCG TAG GCG AA 15011 17 Alt rev2 TCC RCC TAA TTT GTT MGG GAT TG 15036 18 Phil rev6 GAC TCC TCC CAG TTT GTT TG 15039 19 Rabori rev1 TTG TTT GGA TAA ATG GAG GGT AG 15102 20 H15509 CAT TGG CTT AGA GGT CGG AA 15134 21 CarnCB32 GGA GAA GTA TAG GAT TGA GGC TAG 15247 22 Phil rev7 TTA TAC TAT TAG GGC GTC 15321 23 Rabori rev2 CGT TAT ACT ATT AGG GCA TC 15323 24 H15910 GAT TTT TGG TTT ACA AGA CCG AG 15352
cessfully. The alignment was unambiguous due to the coding nature of the cytochrome b gene. Within the ingroup, the distribu- tion of variable sites over the three codon positions showed that most variable sites were at 3rd codon positions (n = 334 or 77.8%) followed by the 1st codon position (n = 75 or 17.5%) leaving the 2nd codon position with only 20 variable sites (4.7%).
Three of the nuclear loci failed to amplify in all cases (Fib6, POR and GBG). It was not possible to get clean homologous se- quences for three loci due to clear double signals likely due to the amplification of multiple loci in two cases (FTH1 and HMG1) and possible double signal and poly G in the third (AP5). The lo- cus c-myc was almost invariant within the genus. For these rea- sons no nuclear loci were amplified in all taxa or included in phylogenetic analyses.
Nuclear copies of mitochondrial DNA fragments (numts) of var- iable lengths were found in several species. They were identified by incongruence in base pair calling in the overlapping regions from the different PCR fragments, the presence of heterozygote bases in the electropherogram and/ or the presence of indels in the numt fragment. Further, the concatenated sequences were translated to identify inappropriate stop codons or other amino acid changes. All nuclear copies were excluded from all analyses.
In cases where multiple individuals from the same taxon and locality had an identical haplotype or an uncorrected pairwise se- quence difference of less than 1%, only one individual was used in the phylogenetic analyses (see Table 1). The final dataset consisted of 29 ingroup and four outgroup sequences of 1075 base pairs (bp) of cytochrome b. Of these 1075 bp, 609 characters were constant, 63 variable but parsimony uninformative and 403 were parsimony informative.
The base composition of the variable sites was significantly dif- ferent among the ingroup taxa (v2 = 120.55, df = 84, p = 0.0055). This was solely due to differences at the 3rd codon positions. Sat- uration seemed to be present in our data set, especially for 3rd co- don transitions (Fig. 2). To circumvent possible problems with differences in base composition and saturation, all phylogenetic analyses were also performed with only transversions at the 3rd codon position (RY coding). With this coding scheme the base com- position of variable sites was not significantly different among the ingroup taxa (Chi square = 79.14; df = 84; p = 0.63) and also 3rd co- don transversions seemed not to be saturated (Fig. 2). When using RY coding, 800 characters were constant, 72 variable but parsi- mony uninformative and 203 were parsimony informative. No sub- stantial differences were observed in support values between the analyses based on the original data and the RY coded data set, so only results based on the original data are discussed further.
Three most parsimonious trees were found (tree length = 1865; CI = 0.361; RI = 0.625; and RC = 0.226). Few of the deep nodes had bootstrap support greater than 70% (Fig. 3). The ML analysis pro- duced one tree (model used TVM + I + G with I = 0.5788 and alpha shape = 2.7626; tree score —ln = 8866.60685) and it was not in con- flict with the MP bootstrap tree, although the ML tree was slightly more resolved. In the Bayesian analyses, partitioning of the data by codon position improved the posterior probabilities substan-

Fig. 2. Graph to illustrate the near saturation-free 3rd codon transversion distance versus the heavily saturated 3rd codon transitions. Both the uncorrected 3rd codon transversion distance and the uncorrected 3rd codon transition distance are plotted against the ML corrected distance based on the complete sequences (1075 bp). The evolutionary model used to calculate the ML distances is the same one that was used for estimating the ML tree topology.
tially, as compared with a non-partitioned data set. The three differ- ent phylogenetic methods used produced trees that were not in conflict with each other. The Bayesian analyses yielded more signif- icantly supported deep nodes than the other analyses (Fig. 3).
3.1. Phylogenies
The subgenus Sundasciurus, as defined by Moore (1958) and
comprising the species S. tenuis, S. jentinki, S. brookei, S. lowii and S. fraterculus, was not monophyletic. However, the clade including the species of the subgenus Aletesciurus (including S. hippurus, all Palawan taxa and Greater Mindanao taxa) was monophyletic. These subgenera were defined based on size and the presence of a sagittal crest.
3.2. The S. tenuis group
Together with the widespread S. tenuis, two Borneo endemic
species, S. brookei and the montane S. jentinki, form a monophyletic clade (ML bootstrap 91%, posterior probability of 1). The relation- ships within this clade are poorly resolved. Only the basal place- ment of S. brookei is supported by the Bayesian analysis (posterior probability of 0.94). The relationship of S. jentinki, with the montane populations of S. tenuis or the lowland forms remained unclear.
3.3. Lowland populations of S. tenuis
Deep divergences were identified between the populations of
S. tenuis on the Malay Peninsula, Sumatra and Borneo. The Malay samples differed by 2.5–2.8% at 3rd codon transversions from the Borneo S. tenuis, and the Sumatra S. tenuis differed by 4.85% with Malay S. tenuis and 5.6% with the Borneo sample. No support for monophyly of the three different lowland S. tenuis populations was found. A sister relationship between Borneo and Malay Penin-
sula S. tenuis was supported (MP bootstrap <50%, ML bootstrap 87% and posterior probability of 1).
3.4. Highland/lowland divergence within S. tenuis
Two highland subspecies of S. tenuis (S. t. altitudinis from Suma- tra and S. t. tahan from the Malay Peninsula) showed considerable genetic divergence between each other and the other S. tenuis pop- ulations, as measured by 3rd codon TV distances (6.1–6.4% be- tween S. t. tahan and S. tenuis from Malay Peninsula and 6.7– 7.2%. between S. t. altitudinis and S. tenuis from Sumatra). Even more surprising was the large difference between the two S. t. altit- udinis samples from North and Central Sumatra (3.9%). The two dif- ferent montane subspecies (S. t. tahan and S. t. altitudinis) formed a monophyletic clade (MP bootstrap <50%, ML bootstrap 82%, poster- ior probability of 1).
3.5. Colonization of the Philippines
All analyses identified two well-supported and distinct Philip- pine clades. One included all taxa from the Palawan Islands (S. rabori, S. steeri, S. hoogstraali, S. moellendorffi, S. juvencus and two haplotypes derived from 4 all-white animals from Ikadwang Banwa Island) and their monophyly had strong support (MP bootstrap 100%, ML bootstrap 97%, posterior probability 1). The highland species S. rabori from Palawan was consistently basal to all other taxa in the clade (MP bootstrap 100%, ML bootstrap 97%, posterior probability 1). The taxa occurring in the Palawan and nearby islands (S. juvencus, S. hoogstraali, S. moellendorffi and the white squirrels from a previously undescribed population on Ikadwang Banwa Island of an unknown species) showed very little genetic differentiation (uncorrected 3rd codon TV 0–0.3% and uncorrected p distances less than 1%). The 3rd codon TV differences between S. rabori and the other Palawan taxa ranged from 3.6% to

Fig. 3. Phylogenetic tree of Sundasciurus squirrels based on the Bayesian analysis using a codon partitioned model. Above the branches the corresponding Bayesian posterior probability is given and below the branch first the ML bootstrap value followed by the MP bootstrap value. The letters refer to the node age estimates as tabulated in Table 3.
4.2% and was 1.7% to 1.9% between S. steeri and the others from the Palawans.
The other Philippine clade consisted of all sampled taxa from Greater Mindanao (S. mindanensis, S. samarensis and S. philippinen- sis: MP bootstrap 100%, ML bootstrap 97% and posterior probability of 1). Within this clade, only a sister relationship between the two S. samarensis individuals was recovered, leaving relationships be- tween the other taxa unresolved despite on average an uncorrected 3rd codon transversion distance of 1.4%.
The relationship between the two Philippine clades was unre- solved in the MP and ML analysis; however, the Bayesian analyses showed a well-supported branching pattern in which the two Phil- ippine clades were not sisters to each other. The Greater Mindanao clade was sister to the widespread S. hippurus clade (posterior probability of 0.98) and the Greater Palawan clade was basal to this group (posterior probability of 0.99).
3.6. Widespread species S. hippurus and S. lowii
The widespread species S. lowii is paraphyletic because S. fratercu-
lus is sister to the Malay Peninsula S. lowii sample (MP bootstrap value 100%, ML bootstrap value 96% and Bayesian posterior probability of
1). This clade was sister to the two Borneo S. lowii squirrels, from Sabah and Kalimantan (MP bootstrap 95%, ML bootstrap 94%, posterior probability of 1). The Borneo samples claded together with high support (MP bootstrap 100%, ML bootstrap 97%, posterior probability 1).
Divergence within S. lowii, as measured by uncorrected trans- versions at 3rd codon positions, showed unexpectedly high values between the Malay Peninsula and Borneo samples (5.8%). Within Borneo this difference was 0.6% and S. fraterculus differed by 2.8% with the Malay Peninsular sample and 4.7–5.8% with the Borneo samples. Malay S. lowii and S. fraterculus are morphologically dis- tinguishable by the color of the belly (Malayan S. lowii are white and S. fraterculus are gray).
The widespread species S. hippurus was monophyletic (MP bootstrap 100%, ML bootstrap 97% and Bayesian posterior probabil- ity of 1) with both Borneo samples (S. h. borneensis and S. h. hippu- rellus) basal to the Malay-Sumatra clade (MP bootstrap 86%, ML bootstrap 89%, posterior probability of 0.98). The divergences be- tween the populations were also much smaller. The uncorrected pairwise TV 3rd codon difference within Borneo was 0.6% and be- tween Sumatra and Malay 0%. Between the two Borneo and Malay- Sumatra samples this difference was on average 0.7%.

Root = 10 Palawan = 5 7 < root < 11 Palawan < 5; 7 < root < 11
1.85% per MY
I 0.63 0.46 1.10 0.71 0.97 P 1.16 0.84 1.81 1.34 0.32 G 1.24 0.90 1.76 1.28 0.76 F 1.41 1.02 2.10 1.49 0.38 J 2.64 1.92 2.90 2.10 1.41 O 2.82 2.04 3.14 2.37 1.51 H 2.90 2.10 3.44 2.28 2.05 K 3.10 2.25 2.65 2.05 2.11 L 4.11 2.98 3.74 2.81 2.86 N 5.07 3.68 5.95 4.43 2.92 M 6.12 4.44 6.31 4.66 3.78 E 6.33 4.59 5.88 4.14 5.08 D 6.90 5.00 7.03 4.93 6.38 C 7.47 5.42 7.69 5.57 5.78 B 8.41 6.10 8.81 6.58 6.27 A 10.00 7.25 9.23 7.27 7.89
3.7. Molecular dating
No significant difference in ML tree scores from constrained and unconstrained trees was identified, so the molecular clock could not be rejected for our data (v2 = 35.18, df = 31, p = 0.2767). Most speciation events predate the Pleistocene (Table 3 and Fig. 4).
The montane subspecies S. tenuis tahan and S. tenuis altitudinis show remarkably deep divergences (nodes K and L in Fig. 3). Also the populations of S. lowii from the Malay Peninsula and Borneo di- verged in the Pliocene (node N). Only the lowland species from the
Table 3 Age estimates in millions of years (MY) for the different nodes using different methods and calibration points. The node letters correspond with the letters in Fig. 3. The columns labeled ‘Clock’ are estimates using a molecular clock with the root set at 10 MYA (root = 10) or the Palawan group set at 5 MYA (Palawan = 5). The two Bayesian estimates were made either by constraining the root to between 7 and 11 MYA or by also constraining the Palawan clade to less than MYA. Estimates based on the rate of third codon transversions using the rate of 1.85% per million years as estimated in other rodents, is labeled 1.85% per MY.
Node Clock Bayesian % TV 3rd
codon
Palawan Islands (node I) and Greater Mindanao taxa (node G) di- verged in the Pleistocene.
The age estimate of the Palawan Islands clade (node D at 6.9 MYA) is substantially older than the geological age estimate of the Palawan Islands (5 MYA; Hall, 1998; Heaney, 1986; Steppan et al., 2003). The Bayesian age estimates using a root calibration interval of 7–11 MYA were comparable with the clock estimates with an average age estimate for the Palawan clade at 7 MYA (Table 3). The age estimates lowered overall when the clock data were calibrated with (1) a maximum age for the Palawan clade of 5 MY or (2) the Bayesian analysis calibrated with the root be- tween 7 and 11 MYA and a maximum age for the Palawan clade of 5 MY (Table 3). Nevertheless, most divergence date estimates were pre-Pleistocene (Fig. 4). Four splits were estimated to be around the end of the Pliocene or the beginning of the Pleistocene, namely the Palawan montane species S. rabori from the Palawan lowland taxa; the split between the lowland populations of S. tenuis from the Malay Peninsula and Borneo; the endemic spe- cies S. fraterculus from the Mentawai Islands (west of Sumatra and formerly treated as a subspecies of S. lowii) versus S. lowii from the Malay peninsula and finally the split within the montane sub- species S. tenuis altitudinis from north and central Sumatra.
When estimating the node ages based on uncorrected 3rd co- don transversion distances under the assumption of the molecular clock we used an average of 1.85% per MY based on the data of Steppan et al. (2003) and Robins et al. (2008). Most age estimates correspond well to estimates based on other analyses using a cal- ibration of Palawan at 5 MYA. Only the Palawan clade (node D) is, again, older than the geological age estimate.
4. Discussion 4.1. Pleistocene species pump
Regardless of the molecular clock calibration, almost all specia- tion events predate the Pleistocene. The divergences within the widespread species S. lowii and S. tenuis also likely predate the
Fig. 4. Plot of age estimates for the different nodes to illustrate the effect of using different methods and calibration points. Nodes marked with an asterisk are intra-specific splits. When the root is calibrated at 10 MYA (Mercer and Roth, 2003) or around an interval of 7–11 MYA (as in the Bayesian analysis), the age estimate for the Palawan clade (node D) is in disagreement with the age estimate of Palawan based on geological data.

Pleistocene. Therefore, Pleistocene climatic and sea level fluctua- tions were not responsible for much of the diversification in this group. The bats, rodents and primates in which divergence esti- mates have been found to be consistent with Pleistocene differen- tiation are perhaps better able to disperse across non-forest habitat, whereas the tree squirrels are quite tightly associated with the forest. This may support the hypothesis that, although the is- lands and Malay peninsula were connected by land in the Pleisto- cene, the exposed shelf was much drier and may not have supported extensive forest habitat. The various lowland species of the Philippine Islands are the exception, and likely do have a re- cent origin. Pleistocene age isolation due to sea level fluctuations could have driven speciation in this system.
4.2. Philippines
The Philippine taxa did not form a monophyletic group. The
taxa from the Palawan Islands and the taxa from Greater Mindanao each formed well-supported monophyletic groups. This indicates that the Palawan Islands and Greater Mindanao were indepen- dently colonized each one time. The colonization of Greater Minda- nao, which was never connected to Borneo by land (Musser and Heaney, 1985), likely took place during the Pliocene. The coloniza- tion of the Palawan Islands likely occurred earlier than the coloni- zation of Greater Mindanao. During the Pleistocene the various islands within these two areas were connected and isolated vari- ous times, leading to the possibility of a local Pleistocene species pump. All of the lowland species in both clades, including the all- white squirrels, appear to have diverged in the Pleistocene, sup- porting this hypothesis in these two island groups.
4.3. Highland forms
Within the widespread species S. tenuis several subspecies have
been named (Corbet and Hill, 1992; Thorington and Hoffmann, 2005). Some of these subspecies are isolated in high altitude areas both on the Malay Peninsula (S. t. tahan) and Sumatra (S. t. altitud- inis). There has been disagreement about the status of S. t. tahan, which was originally described as a distinct species by Bonhote (1908) but placed in the species S. tenuis by Chasen (1940). These data find a sister relationship between S. t. tahan and S. t. altitudinis but indicate that they may not form a monophyletic clade with the other populations of S. tenuis sampled. They are likely more closely related to the high attitude species S. jentinki from Borneo, than to the lowland populations of S. tenuis from the Malay Peninsula and Sumatra. The divergence of the highland forms from the lowland forms is clearly pre-Pleistocene, and the divergence between the two highland forms (S. t. tahan and S. t. altitudinis) is also pre-Pleis- tocene. Even the two populations of S. t. altitudinis sampled were highly differentiated, and probably diverged around the Pliocene/ Pleistocene boundary. Despite a high level of morphological con- servation across the genus, there are morphological characters that define these two high altitude taxa (Miller, 1942; Bonhote, 1908). The morphological, ecological and genetic differentiation between these taxa supports resurrecting the status of each as a valid spe- cies. A revision of the taxonomy of the group is beyond the scope of this paper, and will be dealt with in a separate publication.
Although some differentiation of the high altitude taxa was rec- ognized by naming them as separate species and subspecies, the very deep divergences both between high and low altitude taxa and between the high altitude taxa, was unexpected. High diver- gence of high altitude taxa on the Sunda shelf has previously been identified in forest dependent ants (Quek et al., 2007). This may suggest a general biogeographical pattern of ancient diversity in the high altitude forests of Sundaland, and a common Pliocene ori- gin for that diversity.
4.4. Conservation implications
The pattern of divergence between species and populations, especially the high altitude ones, was unexpectedly deep. The range of some of the taxa, especially the high altitude taxa, may be quite limited. This, in combination with rapid development, may place these taxa at risk of extinction. The high altitude taxa S. (t.) tahan may already be extirpated in one locality (Gunung Ulu Kali, Malaysia), as the mountain top where it was collected has since been developed into a hotel-resort, and these taxa are highly habitat sensitive.
Although more work is required to determine the specific status of some of the divergent populations identified in this study, the deep genetic divergence alone qualifies many of these populations as Evolutionary Significant Units (ESU) sensu Moritz (1994). This region is under particularly high population pressure (Cincotta et al. 2000), and this puts a lot of pressure on the native forests and the species dependent upon them. Acknowledgments
The authors thank Larry Heaney for providing tissue samples and advice. Andrew Rivara and Lauren Helgen helped with DNA sequencing of tissue samples. Dr. Tabitha Viner, The National Zoological Park (Smithsonian Institution), Department of Patho- logy, provided zoo tissue samples. Samples were kindly provided by The National Museum of Natural History, Smithsonian Institu- tion, Washington DC; The Field Museum, Chicago; The Museum of Vertebrate Zoology, Berkeley; The British Museum of Natural History, London; and NNM ‘Naturalis’ (formerly Rijksmuseum van Natuurlijke Historie), Leiden, The Netherlands. This project was funded by the Smithsonian Restricted Endowment Walcott Fund and the Swedish Research Council. Logistical support was provided by the Center for Conservation and Evolutionary Genet- ics, National Zoological Park, Smithsonian Institution, USA. References Bintanja, R., van de Wal, R.S.W., Oerlemans, J., 2005. Atmospheric temperatures and
global sea levels over the past million years. Nature 437, 125–128. Bird, M.I., Taylor, D., Hunt, C., 2005. Palaeoenvironments of insular Southeast Asia
during the Last Glacial Period: a savanna corridor in Sundaland? Quaternary Science Reviews 24, 2228–2242.
Bonhote, J.L., 1908. Report on the mammals. Report on the Gunong Tahan Expedition, May–September 1905. Journal of the Federated Malay States Museums Chasen 3, 1–11.
Campbell, P., Schneider, C.J., Adnan, A.M., Zubaid, A., Kunz, T.H., 2004. Phylogeny and phylogeography of Old World fruit bats in the Cynopterus brachyotis comples. Molecular Phylogenetics and Evolution 33, 764–781.
Campbell, P., Schneider, C.J., Adnan, A.M., Zubaid, A., Kunz, T.H., 2006. Comparative population structure of Cynopterus fruit bats in peninsular Malaysia and southern Thailand. Molecular Ecology 15, 29–47.
Chasen, F.N., 1940. A handlist of Malaysian mammals. Bulletin of the Raffles Museum Cranbrook 15, 1–209.
Cincotta, R.P., Wisnewski, J., Engelman, R., 2000. Human population in the biodiversity hotspots. Nature 404, 990–992.
Corbet, G.B., Hill, J.E., 1992. The Mammals of the Indomalayan Region: A Systematic Review. Oxford University Press, Oxford.
Cranbrook, E., 2000. Northern Borneo environments of the past 40,000 years: archaeozoological evidence. The Sarawak Museum Journal 55, 62–109.
DeBry, R.W., Seshadri, S., 2001. Nuclear intron sequences for phylogenetics of closely related mammals: an example using the phylogeny of Mus. Journal of Mammalogy 82, 280–288.
Gathorne-Hardy, F.J., Davies, S.R.G., Eggleton, P., Jones, D.T., 2002. Quaternary rainforest refugia in south-east Asia: using termites (Isoptera) as indicators. Biological Journal of the Linnean Society 75, 453–466.
Gorog, A.J., Sinaga, M.H., Engstrom, M.D., 2004. Vicariance or dispersal? Historical biogeography of three Sunda shelf murine rodents (Maxomys surifer, Leopoldamys sabanus and Maxomys whiteheadi). Biological Journal of the Linnean Society 81, 91–109.
Hall, R., 1998. The plate tectonics of Cenozoic SE Asia and the distribution of land and sea. In: Hall, R., Holloway, J.D. (Eds.), Biogeography and Geological Evolution of SE Asia. Backhuys, Leiden, The Netherlands, pp. 99–131.
Hanebuth, T., Stattegger, K., Grootes, P.M., 2000. Rapid flooding of the Sunda shelf: a
late-glacial sea-level record. Science 288, 1033–1035. Harrison, R.G., Bogdanowicz, S.M., Hoffmann, R.S., Yensen, E., Sherman, P.W., 2003.
Phylogeny and evolutionary history of the ground squirrels (Rodentia: Marmotinae). Journal of Mammalian Evolution 10, 249–276.
Heaney, L.R., 1986. Biogeography of mammals in SE Asia: estimates of rates of colonization, extinction and speciation. Biological Journal of the Linnean Society 28, 127–165.
Heaney, L.R., 1991. A synopsis of climatic and vegetational change in Southeast Asia. Climate Change 19, 53–61.
Heaney, L.R., Balete, D.S., Dolar, L., Alcala, A.C., Dans, A., Gonzales, P.C., Ingle, N., Lepiten, M.V., Oliver, W., Rickart, E.A., Tabaranza Jr, B.R., Utzurrum, R.C.B., 1998. A synopsis of the mammalian fauna of the Philippine Islands. Fieldiana Zoology New Series 88, 1–61.
Heaney, L.R., Walsh Jr., J.S., Peterson, A.T., 2005. The roles of geological history and colonization abilities in genetic differentiation between mammalian populations in the Philippine archipelago. Journal of Biogeography 32, 229–247.
Irwin, D.M., Kocher, T.D., Wilson, A.C., 1991. Evolution of the cytochrome b gene of mammals. Journal of Molecular Evolution 32, 128–144.
Jiang, Z., Priat, C., Galibert, F., 1998. Traced orthologous amplified sequence tags (TOASTs) and mammalian comparative tags. Mammalian Genome 9, 577–587.
Jones, A.W., Kennedy, R.S., 2008. Plumage convergence and evolutionary history of the Island Thrush in the Philippines. Condor 110, 35–44.
Leonard, J.A., Vilà, C., Wayne, R.K., 2005. Legacy lost: genetic variability and population size of extirpated US gray wolves (Canis lupus). Molecular Ecology 14, 9–17.
Lucchini, V., Meijaard, E., Diong, C.H., Groves, C.P., Randi, E., 2005. New phylogenetic perspectives among species of South-east Asian wild pig (Sus sp.) based on mtDNA sequences and morphometric data. Journal of Zoology London 266, 25–35.
Mercer, J.M., Roth, V.L., 2003. The effects of Cenozoic global change on squirrel phylogeny. Science 299, 1568–1572.
Miller, G.S., 1942. Zoological results of the George Vanderbilt Sumatran Expedition, 1936–1939. Part V. Mammals collected by Frederick A Ulmer, Jr. on Sumatra and Nias. Proceedings of the Academy of National Science, 94, 107–165, pls. 3–6.
Moore, J.C., 1958. New genera of East Indian squirrels. American Museum Novitates 1914, 1–5.
Moritz, C., 1994. Defining ‘‘evolutionary significant units” for conservation. Trends in Ecology and Evolution 9, 373–375.
Morley, R.J., 2002. Tertiary Vegetational history of Southeast Asia, with emphasis on the biogeographical relationships with Australia. In: Kershaw, P., David, B., Tapper, N., Penny, D., Brown, J. (Eds.), Bridging Wallace’s Line: The Environmental and Cultural History and Dynamics of the SE-Asian–Australian Region. Catena Verlag, Reiskirchen, Germany, pp. 49–60.
Musser, G.G., Heaney, L.R., 1985. Philippine Rattus: a new species from the Sulu archipelago. American Museum Novitates 2818, 1–32.
Myers, N., Mittermeier, R.A., Mittermeier, C.G., da Fonseca, G.A.B., Kent, J., 2000. Biodiversity hotspots for conservation priorities. Nature 403, 853–858.
Oshida, T., Yasuda, M., Endo, H., Hussein, N.A., Masuda, R., 2001. Molecular phylogeny of five squirrel species of the genus Callosciurus (Mammalia, Rodentia) inferred from cytochrome b gene sequences. Mammalia 65, 473–482.
Posada, D., Crandall, K.A., 1998. Modeltest: testing the model of DNA substitution. Bioinformatics 14, 817–818.
Quek, S.-P., Davies, J., Ashton, P.S., Itino, T., Pierce, N.E., 2007. The geography of diversification in mutualistic ants: a gene’s-eye view into the Neogene history of Sundaland rain forests. Molecular Ecology 16, 2045–2062.
Reyes, A., Gissi, C., Pesole, G., Catzeflis, F.M., Saccone, C., 2000. Where do rodents fit? Evidence from the complete mitochondrial genome of Sciurus vulgaris. Molecular Biology and Evolution 17, 979–983.
Robins, J.H., McLenachan, P.A., Phillips, M.J., Craig, L., Ross, H.A., Matisoo-Smith, E., 2008. Dating of divergences within the Rattus genus phylogeny using whole mitochondrial genomes. Molecular Phylogenetics and Evolution 49, 460–466.
Ronquist, F., Huelsenbeck, J.P., 2003. MrBayes 3: Bayesian phylogenetic inference under mixed models. Bioinformatics 19, 1572–1574.
Roos, C., Ziegler, T., Hodges, J.K., Zischler, H., Abegg, C., 2003. Molecular phylogeny of Mentawai macaques: taxonomic and biogeographic implications. Molecular Phylogenetics and Evolution 29, 139–150.
Sambrook, E., Fritsch, F., Maniatis, T., 1989. Molecular Cloning. Cold Spring Harbor Press, Cold Spring Harbor, New York.
Sodhi, N.S., Koh, L.P., Brook, B.W., Ng, P.K.L., 2004. Southeast Asian biodiversity; an impending disaster. Trends in Ecology and Evolution 19, 654–660.
Spradling, T.A., Hafner, M.S., Demastes, J.W., 2001. Differences in rate of cytochrome-b evolution among species of rodents. Journal of Mammalogy 82, 65–80.
Steppan, S.J., Zawadzki, C., Heaney, L.R., 2003. Molecular phylogeny of the endemic Philippine rodent Apomys (Muridae) and the dynamics of diversification in an ocean archipelago. Biological Journal of the Linnean Society 80, 699–715.
Steppan, S.J., Storz, B.L., Hoffmann, R.S., 2004. Nuclear DNA phylogeny of the squirrels (Mammalia: Rodentia) and the evolution of arboreality from c-myc and RAG1. Molecular Phylogenetics and Evolution 30, 703–719.
Swofford, D.L., 2002. PAUP+: Phylogenetic Analysis Using Parsimony (+ and Other Methods) v 4.10b. Sinauer Associates, Sunderland, Massachusetts.
Thorington, R.W., Hoffmann, R.S., 2005. Family Sciuridae. In: Wilson, D.E., Reeder, D.M. (Eds.), Mammal Species of the World, third ed. John Hopkins University Press, Baltimore, pp. 754–818.
Van den Bergh, G.D., de Vos, J., Sondaar, P.Y., 2001. The late quaternary palaeogeography of mammal evolution in the Indonesian Archipelago. Palaeogeography, Palaeoclimatology, Palaeoecology 171, 385–408.
Voris, H.K., 2000. Maps of Pleistocene sea levels in Southeast Asia: shorelines, river systems and time durations. Journal of Biogeography 27, 1153–1167.
Yang, Z., 2007. PAML 4: a program package for phylogenetic analysis by maximum likelihood. Molecular Biology and Evolution 24, 1586–1591 .