Progress in zeolite synthesis promotes advanced applications
Upload
independentCategory
view
0download
0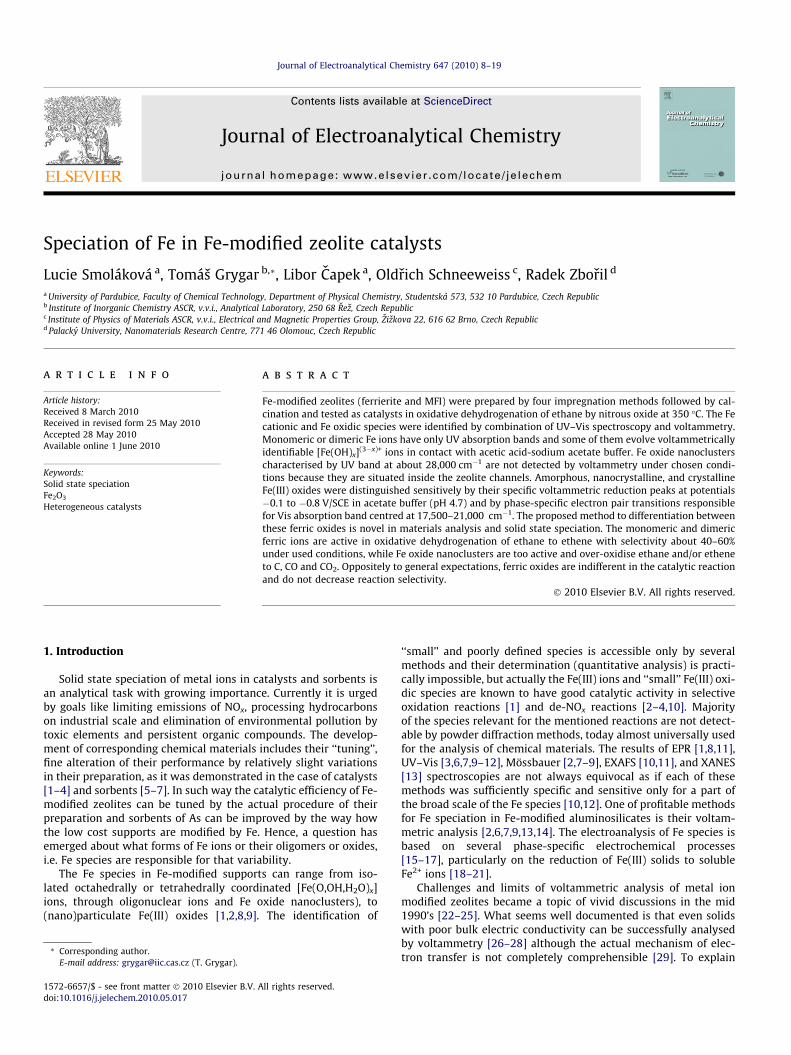
Journal of Electroanalytical Chemistry 647 (2010) 8–19
Contents lists available at ScienceDirect
Journal of Electroanalytical Chemistry
journal homepage: www.elsevier .com/locate / je lechem
Speciation of Fe in Fe-modified zeolite catalysts
Lucie Smoláková a, Tomáš Grygar b,*, Libor Capek a, Oldrich Schneeweiss c, Radek Zboril d
a University of Pardubice, Faculty of Chemical Technology, Department of Physical Chemistry, Studentská 573, 532 10 Pardubice, Czech Republicb Institute of Inorganic Chemistry ASCR, v.v.i., Analytical Laboratory, 250 68 Rez, Czech Republicc Institute of Physics of Materials ASCR, v.v.i., Electrical and Magnetic Properties Group, Zizkova 22, 616 62 Brno, Czech Republicd Palacky University, Nanomaterials Research Centre, 771 46 Olomouc, Czech Republic
a r t i c l e i n f o
Article history:Received 8 March 2010Received in revised form 25 May 2010Accepted 28 May 2010Available online 1 June 2010
Keywords:Solid state speciationFe2O3
Heterogeneous catalysts
1572-6657/$ - see front matter � 2010 Elsevier B.V. Adoi:10.1016/j.jelechem.2010.05.017
* Corresponding author.E-mail address: [email protected] (T. Grygar).
a b s t r a c t
Fe-modified zeolites (ferrierite and MFI) were prepared by four impregnation methods followed by cal-cination and tested as catalysts in oxidative dehydrogenation of ethane by nitrous oxide at 350 �C. The Fecationic and Fe oxidic species were identified by combination of UV–Vis spectroscopy and voltammetry.Monomeric or dimeric Fe ions have only UV absorption bands and some of them evolve voltammetricallyidentifiable [Fe(OH)x](3�x)+ ions in contact with acetic acid-sodium acetate buffer. Fe oxide nanoclusterscharacterised by UV band at about 28,000 cm�1 are not detected by voltammetry under chosen condi-tions because they are situated inside the zeolite channels. Amorphous, nanocrystalline, and crystallineFe(III) oxides were distinguished sensitively by their specific voltammetric reduction peaks at potentials�0.1 to �0.8 V/SCE in acetate buffer (pH 4.7) and by phase-specific electron pair transitions responsiblefor Vis absorption band centred at 17,500–21,000 cm�1. The proposed method to differentiation betweenthese ferric oxides is novel in materials analysis and solid state speciation. The monomeric and dimericferric ions are active in oxidative dehydrogenation of ethane to ethene with selectivity about 40–60%under used conditions, while Fe oxide nanoclusters are too active and over-oxidise ethane and/or etheneto C, CO and CO2. Oppositely to general expectations, ferric oxides are indifferent in the catalytic reactionand do not decrease reaction selectivity.
� 2010 Elsevier B.V. All rights reserved.
1. Introduction
Solid state speciation of metal ions in catalysts and sorbents isan analytical task with growing importance. Currently it is urgedby goals like limiting emissions of NOx, processing hydrocarbonson industrial scale and elimination of environmental pollution bytoxic elements and persistent organic compounds. The develop-ment of corresponding chemical materials includes their ‘‘tuning’’,fine alteration of their performance by relatively slight variationsin their preparation, as it was demonstrated in the case of catalysts[1–4] and sorbents [5–7]. In such way the catalytic efficiency of Fe-modified zeolites can be tuned by the actual procedure of theirpreparation and sorbents of As can be improved by the way howthe low cost supports are modified by Fe. Hence, a question hasemerged about what forms of Fe ions or their oligomers or oxides,i.e. Fe species are responsible for that variability.
The Fe species in Fe-modified supports can range from iso-lated octahedrally or tetrahedrally coordinated [Fe(O,OH,H2O)x]ions, through oligonuclear ions and Fe oxide nanoclusters), to(nano)particulate Fe(III) oxides [1,2,8,9]. The identification of
ll rights reserved.
‘‘small’’ and poorly defined species is accessible only by severalmethods and their determination (quantitative analysis) is practi-cally impossible, but actually the Fe(III) ions and ‘‘small’’ Fe(III) oxi-dic species are known to have good catalytic activity in selectiveoxidation reactions [1] and de-NOx reactions [2–4,10]. Majorityof the species relevant for the mentioned reactions are not detect-able by powder diffraction methods, today almost universally usedfor the analysis of chemical materials. The results of EPR [1,8,11],UV–Vis [3,6,7,9–12], Mössbauer [2,7–9], EXAFS [10,11], and XANES[13] spectroscopies are not always equivocal as if each of thesemethods was sufficiently specific and sensitive only for a part ofthe broad scale of the Fe species [10,12]. One of profitable methodsfor Fe speciation in Fe-modified aluminosilicates is their voltam-metric analysis [2,6,7,9,13,14]. The electroanalysis of Fe species isbased on several phase-specific electrochemical processes[15–17], particularly on the reduction of Fe(III) solids to solubleFe2+ ions [18–21].
Challenges and limits of voltammetric analysis of metal ionmodified zeolites became a topic of vivid discussions in the mid1990’s [22–25]. What seems well documented is that even solidswith poor bulk electric conductivity can be successfully analysedby voltammetry [26–28] although the actual mechanism of elec-tron transfer is not completely comprehensible [29]. To explain

L. Smoláková et al. / Journal of Electroanalytical Chemistry 647 (2010) 8–19 9
electrochemical signal from species separated from the workingelectrode by a non-conducting support, electron hoping [30] andsome soluble or nano-sized electron-transfer mediators [23] wereproposed. Low conductivity of zeolites and clay minerals in theirelectroanalytical applications is conventionally overcome eitherby using modified carbon paste electrodes [26,31] or working withvery thin films of these aluminosilicates on working electrode [31].However, in some cases useful analytical signals are obtained di-rectly from solids with low bulk electric conductivity even withoutconducting additives [27,28].
This study is a continuation of our systematic effort in complet-ing the scale of Fe(III) oxides with a well defined and analyticallyuseful electrochemical behaviour [19,21] by including supportedFe(III) ions and oxidic species [7,9]. We prepared Fe-modified zeo-lites by four impregnation methods, performed their analysis byUV–Vis spectroscopy, a conventional tool to Fe(III) speciation, andby voltammetric analysis, and tested their catalytic activity in oxi-dative dehydrogenation of ethane by N2O to verify whether the dif-ferent Fe species have different catalytic properties. The oxidativedehydrogenation of ethane is usually carried out in the presenceof oxygen. Nevertheless, Fe-modified zeolites have been reportedto exhibit interesting activity under N2O presence in the ODH ofethane [32] and propane [33,34]. Our aim was to specify the num-ber of species present in the catalysts and contribute to knowledgeon relationship between their structure and functionality.
2. Experimental
2.1. Analytical techniques for Fe speciation
Voltammetric analysis was performed using methodologydeveloped by Scholz et al. [28,35]. Working electrode was preparedby mechanical deposition of powdered samples on the surface ofparaffin impregnated graphite rod (PIGE) and removal of looselyattached particles by cellulose tissue. The voltammetric curveswere obtained in acetate buffer (total acetate concentration0.2 M, sodium acetate and acetic acid 1:1, pH 4.7 unless otherwiseis stated), or in HCl–KCl solution (0.01 and 0.1 M, respectively) atscan rate 3 mV/s from open circuit potential in cathodic direction.The repeatability of the measurement has been successfully testedby interlaboratory trial [21]. The characteristic potentials of indi-vidual Fe(III) oxides are sufficiently reproducible if the scan rate,start potential, and supporting electrolyte composition are appro-priately chosen. Reference Fe(III) oxides were diluted by pureMFI zeolite for VMP to obtain similar current response during mea-surement as with analysed catalysts. The peak potentials of the di-luted samples were very similar to undiluted oxides reportedpreviously [7,21].
57Fe Mössbauer spectra were measured by a standard transmis-sion method with a 57Co(Rh) radioactive source. Calibration of thevelocity scale was done against a pure a-Fe foil. The spectra werecollected at room temperature and fitted to distinguish magneti-cally ordered and disordered phases [36].
UV–Vis spectroscopy was used for determination of Fe distribu-tion. UV–Vis diffuse reflectance spectra of Fe-modified zeoliteswere recorded using GBS CINTRA 303 spectrometer equipped witha diffuse reflectance attachment with a Spectralon-coated integrat-ing sphere against a Spectralon reference. The catalysts were mea-sured in the optical cell of 5 mm thickness. The spectra werecollected in a wavelength range 190–900 nm with the scanningspeed 100 nm min�1, scanning step 1 nm and the slit width1 nm. The reflectance were re-calculated to the absorption usingthe Schuster–Kubelka–Munk equation, F(R1) = (1�R1)2/(2�R1),where R1 is the diffuse reflectance from a semi-infinite layer[36]. Reference ferric oxides were mixed with parent MFI zeolite
(2.5–10% of oxides) to have absorbance in the examined spectralregion in the range of 0.3–1.0 Kubelka–Munk, i.e. similar as Feoxide containing catalysts. The spectra were smoothed by fast Fou-rier transformation (FFT) and their second derivatives were evalu-ated (smoothing and derivation was performed with Origin 7.5,OriginLab, USA). The spectra deconvolution was performed withGaussian components and exponential background in Origin’s PeakFitting Module.
2.2. Materials
2-Line ferrihydrite, poorly crystalline ferric hydroxyoxide[38,39] was prepared by adding NaOH solution to Fe(NO3)3 aque-ous solution and filtration off the precipitate following simple pro-cedure described [40]. The ferrihydrite was calcined to obtain nearamorphous Fe2O3 (350 �C, 15 min, specimen D250-2/350) [35].Pure amorphous Fe2O3 with particle size 3–4 nm (specimenW250) was obtained by calcination Prussian Blue at 250 �C as de-scribed previously [42]. Mixtures with amorphous Fe2O3 were ob-tained by calcination of Fe-overexchanged smectite SAz-1 at400 �C. Their preparation by interaction of smectite with partlyhydrolysed Fe ions (in suspensions with their OH/Fe ratios ad-justed by NaOH and Fe(NO3)3 solutions) was reported [7]. TwoFe-modified smectites were calcined: D253-8 (OH/Fe in prepara-tion 0.7, total Fe 6.05%) and D258-4 (OH/Fe in preparation 2.6, totalFe 8.75%). The precursors contained condensed Fe(III) cations inthe smectite interlayer as well as some sort of XRD amorphousFe(III) oxide, the calcines were free of hematite and containedamorphous Fe2O3 [7]. Hematite samples were red pigments Bayfer-rox 110 M and 130 M (Bayer, Germany) which differs in crystal size[21]. Nanocrystalline maghemite (specimen FeNV) with particles<25 nm was prepared by boiling nanocrystalline Fe metal in waterand subsequent calcination in air at about 350 �C. Well crystallinemaghemite c-Fe2O3 (specimen SCP21) was produced by SocieteChimique Provence, France. The identity of the reference Fe oxideswas confirmed by X-ray powder diffraction and Mössbauer spec-troscopy [21,36,41] according to characteristics published in liter-ature [38,39].
H-MFI zeolite with Si/Al 12.5 and H-FER zeolite with Si/Al 10.0were purchased from Zeolyst (USA). Four impregnation procedureswere used to prepare Fe-modified zeolites. The products were de-noted using abbreviations of zeolites FER or MFI for zeolite, theway of impregnation NO3 (by ferric nitrate) or acac (by ferric ace-tylacetonate) or Cl (by ferric chloride) or SO4 (by ferrous sulphate),and Fe/Al molar ratio, e.g., Fe–MFI–acac �0.06 is MFI impregnatedby ferric acetylacetonate with final molar ratio Fe/Al = 0.06. Theimpregnation procedures were performed in the followingmanner:
2.2.1. Samples NO3
Zeolites were subjected to Fe(III) ion exchange in aqueous solu-tions of ferric nitrate [43] at room temperature (RT). After that, thezeolites were filtered off, washed three times by distilled water anddried on air under RT.
2.2.2. Samples acacZeolites were impregnated by ferric acetylacetonate [Fe(acac)3]
in ethanol. The mixture was heated up to 70 �C and stirred untilethanol was evaporated off. Then the mixture was dried up inthe oven at 120 �C for 16 h.
2.2.3. Samples ClZeolites were impregnated with anhydrous FeCl3 in acetyl ace-
tone, as it was firstly described by Wichterlová’s group [9]. Driedparent zeolite was mixed with a solution of FeCl3 in acetyl acetone,the suspension was mixed for 12 h while the solvent evaporated,
10 L. Smoláková et al. / Journal of Electroanalytical Chemistry 647 (2010) 8–19
and the resulting solid was heated under vacuum at 350 �C for 4 h.Small loss of Fe in the last step was observed as coloured conden-sates at tubes to the vacuum pump. The resulting solids werewashed with distilled water and dried at RT.
2.2.4. Samples SO4
Zeolites were subjected to Fe(II) ion exchange in aqueous solu-tions of ferrous sulphate [44] under room temperature and ambi-ent air. After that, the zeolites were filtered off, washed threetimes by distilled water and dried on air at RT.
The precursors after impregnation were pressed, gently groundand sieved to obtain size fraction 0.25–0.50 mm, and the separatedgranules were calcined at 500 �C in air unless otherwise is stated.Total Fe concentration in catalysts was determined using X-rayfluorescence spectrometry (Elva X, Elvatech Ltd., Kiev, Ukraine) cal-ibrated using Fe-modified zeolites with Fe content obtained byconventional atomic absorption spectrometry (AAS) after wetdecomposition using HF [45].
2.3. Catalytic tests
The oxidative dehydrogenation of ethane was carried out in aquartz flow-through micro-reactor at 350 �C and atmosphericpressure, with 200 mg of the Fe-modified zeolites (grain0.25–0.50 mm) diluted with 1 ml of silicon carbide inert. The reac-tion mixture consisted of 8.0 vol.% C2H6, 10 vol.% N2O and a rest ofHe was kept at a total flow of 100 ml/min (W/F 0.12 gcat s ml�1).Catalysts were pre-treated in an oxygen stream at 450 �C for 1 hbefore each catalytic test. Concentrations of CO2, CO, N2, N2O and
Fig. 1. Linear potential scan voltammograms of catalysts in acetate buffe
hydrocarbons were provided by an on-line connected gas chro-matograph Shimadzu GC 17A. The entire set up has successfullybeen used in several recent studies [37,45,46]. The amount of otherC-containing products (mostly coke) was estimated by the massbalance of C-containing products.
3. Results
3.1. Voltammetric analysis of catalysts
Reduction peaks C1–C5 in acetate buffer have been recorded incatalysts (Figs. 1A–D and 2). Cyclic voltammetry showed that theproducts of C1 and C2 reductions can be re-oxidised (peak A inFig. 2) at faster scan rates. The reduction peaks increase withincreasing concentration of Fe in catalysts in each series. Zeolitesafter Cl modification (Fig. 1C) have very small or no reductionpeaks, while zeolites modified by aqueous solution of Fe(NO3)3
have best developed voltammograms as for both peak currentsand peak numbers. This statement is valid not only for acetate buf-fer but also for HCl–KCl as supporting electrolytes. At low concen-trations of Fe, most positive reduction peaks C1 (about +0.2 V/SCE)and C2 (about +0.1 V/SCE), mostly present simultaneously, ap-peared in all Fe-modified zeolites in acetate buffer. In the samesupporting electrolyte, at growing concentration of Fe in Fe–MFI–NO3 (Fig. 1A), Fe–MFI–acac (Fig. 1B) and Fe–MFI–SO4 (Fig. 1D) dou-ble peak C3 + C4 or a peak C4 (about �0.24 V/SCE) with a shoulderC3 (about �0.1 V/SCE) were registered in addition to C1 and C2.Only in Fe–MFI–NO3 and Fe–MFI-acac zeolites at the highest Fe/Al ratios, C5 peak (about�0.6 V/SCE) was observed. Cl modification
r (pH 4.7) at 3 mV/s scan rate. C1–C5 peaks are indicated by arrows.

Fig. 2. C1 and C2 reduction and A re-oxidation peaks in cyclic voltammograms ofFe-MFI–NO3-0.08 in acetate buffer (pH 4.7) at scan rates of 1, 2, 5, and 8 mV/s.
L. Smoláková et al. / Journal of Electroanalytical Chemistry 647 (2010) 8–19 11
produced the least amount of electrochemically active species inboth acetate buffer and HCl–KCl solution.
Although peaks C1 and C2 have much smaller absolute values ofpeak currents than C3–C5, there is surely some electrochemicalreduction in that region with its corresponding current significantwith respect to the background currents, obtained on electrodemodified with parent zeolite (Fig. 1). It is not clear whether C1and C2 in acetate buffer (Fig. 2) should be assigned to two differentreactions or to two kinetically different pathways. Similarly uncer-tain is the assignment of the double peak C3 and C4 to one or twoelectrochemical processes. In most cases the shoulder C3 can beconsidered a pre-peak of C4, while in others, such as Fe-MFI–NO3-0.08 there is obviously a pair of peaks C3 and C4. The peak assign-ment must be based on comparison with the reference compounds.
Fig. 3. Linear potential scan voltammograms of Fe(NO3)3 solution at 3 mV/s scanrate in two acetate buffers at bare paraffin impregnated graphite working electrode(PIGE) and at PIGE with deposited ferrierite.
3.2. Voltammetric analysis of reference Fe(III) species
Electrochemical reduction of Fe(III) species formed in Fe(NO3)3
solution in acetate buffer produced signal in potential region of thepeaks C1 and C2 (Fig. 3A and B). It is noteworthy that the peak po-tential of this reduction on bare paraffin impregnated electrode ismore negative than on the electrode covered by the unmodifiedparent zeolite. Due to hydrolysis at supporting electrolyte (pH4.7) (Fig. 3A) and only weak complexation of ferric ions by acetate,ferric ions should be present as [Fe(OH)]2+ and [Fe(OH)2]+ ions[47,48]. The surface of zeolite contains acid sites and so the
Fig. 4. Linear potential scan voltammograms at 3 mV/s scan rate in HCl–KClsolution. Panel A: Fe–MFI–NO3 with Fe/Al indicated at the curves. Panel B: referencespecies, Fe(NO3)3 solutions at bare PIGE and at PIGE with deposited ferrierite,Fe-overexchanged smectite.
Fig. 5. Linear potential scan voltammograms of reference ferric oxides in acetatebuffer (pH 4.7) at 3 mV/s scan rate. 1 amorphous Fe2O3 (W250), 2 nanocrystallinemaghemite (c-Fe2O3), 3 ferrihydrite, 4 well crystalline hematite (a-Fe2O3), 5 wellcrystalline maghemite (c-Fe2O3).

Table 1EPT bands identified as minima in the second derivative of smoothed Vis–UV spectra, EP obtained by voltammetry of reference oxides in acetate buffer.
Note EPT band maxima EP, V/SCE
W250 Amorphous Fe2O3 20,300 �0.10D253-8/400 Cacined Fe-overexchanged smectite 20,000 21,200 �0.12D258-4/400 Calcined Fe-overexchanged smectite 19,700 21,000 �0.11D250-2 Ferrihydrite 18,100 minor 20,400 major �0.17D250-2/350 Calcined ferrihydrite (near amorphous Fe2O3) 18,200 major 20,400 minor �0.20FeNV Nanocrystalline maghemite, c-Fe2O3 20,600 major �0.18B110 Well crystalline hematite a-Fe2O3 pigment 18,100 sharp �0.69B130 Well crystalline hematite a-Fe2O3 pigment 17,900 sharpSCP21 Well crystalline maghemite c-Fe2O3 ferromagnetics 19,400 sharp 20,600 sharp �0.85
12 L. Smoláková et al. / Journal of Electroanalytical Chemistry 647 (2010) 8–19
hydrated interface of zeolite could be more acidic than the bulksolution. To evaluate the effect of the acidity, voltammetry of Fe(III)cations was also performed in slightly more acid acetate buffer (pH3.9) (Fig. 3B). The existence of a pair of peaks C1 + C2 can hence beexplained by either different speciation of Fe(III) ions on the zeoliteinterface than on a bare working electrode, or by different kineticsof Fe(III) reduction on clean and zeolite covered electrode, butprobably these two phenomena cannot be differentiated with theavailable experimental results. Actually close to pH 4 there is aboundary of maximal populations of [Fe(OH)]2+ and [Fe(OH)2]+
ions in solution [47,48].The potential separation between C1 and C2 peaks and reduc-
tion peaks of dissolved Fe(III) cations is enhanced by use of moreacidic supporting electrolyte shown in Fig. 4A. C1 + C2 double peakof Fe-MFI-NO3 in acetate buffer is merged to single peak denotedC12 (+0.35 V/SCE) in Fig. 4, and shifted to more positive potentials
Fig. 6. UV–Vis diffuse reflectance spectra of catalysts with assigned UV b
with respect to Fe(III) ions dissolved in the same supporting elec-trolyte (Fig. 4B). The effect of the surface state of the working elec-trode (bare and with deposited zeolite) is noteworthy. Reductionpeak C12 should be attributed to Fe(III) ions ‘‘kinetically activated’’with respect to mere dissolved Fe(III) ions. This phenomenon is notspecific to zeolites: reductive peak with EP +0.33 V/SCE was ob-tained with Fe-overexchanged smectites (Fig. 4B).
The following Fe oxide phases were used as reference com-pounds of Fe(III) containing solid forms: ferrihydrite, calcined fer-rihydrite (near amorphous Fe2O3), amorphous Fe2O3, maghemite(c-Fe2O3), and hematite (a-Fe2O3). These oxides, except for ferrihy-drite, could theoretically be formed by 500 �C calcination of zeo-lites impregnated by solutions of Fe salts or complexes. Theobtained voltammetric peaks of reductive dissolution of those Feoxides (Fig. 5) are in agreement with previous results (detailed dis-cussion is in part 4.3) in acetate buffer. Noteworthy is a single C3
ands B1–B4 and diagnostic EPT bands of ferric oxides in Vis region.

L. Smoláková et al. / Journal of Electroanalytical Chemistry 647 (2010) 8–19 13
peak, only once reported previously and assigned to amorphousFe2O3 [7]. This peak is dominant in the calcined Fe-overexchangedsmectite (D253-8/400 and D258-4/400) as well as in pure amor-phous Fe2O3 (W250) (Table 1).
3.3. Spectroscopic analyses
Diffuse reflectance UV–Vis spectra of Fe-modified zeolites(Fig. 6A–D) are controlled by the actual Fe loading and the modeof preparation of Fe–MFI zeolites. For a given Fe loading, the spec-tra of Fe–MFI zeolites obtained by different impregnation proce-dures have a different proportion of UV (B1, B2, B3, B4) and Vis(EPT) absorption bands. The B1, B2 and B3 bands were observedin the UV–Vis spectra of all Fe–MFI zeolites. Their intensity de-pended on Fe loading. These bands are attributed to the ligand-to-metal O ? Fe charge-transfer transitions of isolated Fe(III) ionsin the octahedral or tetrahedral coordination [49,50]. The relativeproportions of B4 and EPT (d–d electron pair transitions of Fe(III)[52]) are the most obvious differences in the shapes of the spectrafor individual impregnation modes at comparable Fe/Al loading.
For a given Fe modification and parent zeolite, the increasingFe-loading usually leads to growing areas of all bands, and more-over, preferential relative growth of UV band B4 and Vis absorptionEPT. There is no ready-to-use consensually accepted theory forthese spectra interpretation [10,12], but its general basis can besummarised as follows: free non-condensed [Fe(O,OH,H2O)x] poly-hedra should have allowed only charge-transfer transitions in UVregion (above 33,000 cm�1), of which further detailed assignmentis missing. Dimerization or oligomerization of [Fe(O,OH,H2O)x]polyhedra shifts charge-transfer transitions toward lower wave-numbers in UV and in some complexes even to Vis region [51],and finally the formation of extensive oxide crystal lattice withedge- and face-sharing octahedra [Fe(O,OH)6] allows d–d electronpair transitions (EPT) in Vis region close to 20,000 cm�1
[39,52,53]. The UV–Vis band assignment is not a trivial task andin many recent references incorrect interpretations can be foundas it was demonstrated by Pirngruber et al. [10] and Brandenbergeret al. [12]. The sound interpretation must be based on the ‘‘firstprinciples’’ and/or well chosen reference compounds.
The EPT bands of ‘‘normal’’ (crystalline) Fe(III) oxides in Vis canbe considered relatively easily interpretable on the base of compar-ison with reference compounds (Fig. 7), available theory [52] andmeasurements of numerous synthetic and natural specimens
Fig. 7. UV–Vis diffuse reflectance spectra of reference ferric oxides (A) and the detail omaghemite (c-Fe2O3), 3 ferrihydrite, 4 well crystalline maghemite (c-Fe2O3), 5 well crys
[53]. The Vis spectral features of EPT and voltammetric peak poten-tials of Fe oxides are shown in Table 1. The major, sharp EPT bandnear 18,000 cm�1 (�556 nm) with only minor or no EPT bandabove 20,000 cm�1 (below 500 nm), is always observed in sampleswith voltammetric peak at about �0.6 V/SCE. Obviously, thishematite-like EPT is also obvious in calcined ferrihydrite (D250-2/350), that means that this specimen is probably extremely poorlycrystalline hematite. The assignment of the EPT band at about18,000 cm�1 to hematite [39,52,53] is unequivocal: that unique(highly phase-specific) spectral feature of hematite is caused byface-sharing [FeO6] octahedra in its structure [39]. On the otherhand, we tried to use room temperature Mössbauer spectroscopyto confirm whether Fe–FER–NO3-0.23 contain hematite accordingto both hematite-like EPT band (major band at 18,800 cm�1) andvoltammetric peaks �0.26 V/SCE and �0.55 V/SCE, but surprisinglyonly doublets of magnetically disordered phases were obtained asin amorphous or extremely poorly crystalline oxides. The hematiteparticles in that specimen are obviously super-paramagnetic, i.e.they are smaller than about 20 nm, and they hence yieldMössbauer doublets at room temperature.
Majority of ferric oxides including FeOOH are built from edgeand/or corner sharing [Fe(O,OH)6] octahedra [39] producing muchless phase-specific (similar) EPT bands between 20,000 and 20,800cm�1 (500–480 nm, [53]). Amorphous Fe2O3 (W250) and maghe-mite also have EPT in that region (Table 1). It is noteworthy thatW250 does not exhibit the hematite-like EPT band at all.
Additionally, even sheets of condensed [Fe(O,OH)6] octahedra,i.e., not real oxide sensu stricto, produces similar absorption bandsas FeOOH [7]. Sherman and Vergo [54] found a band centred at21,500 cm�1 in Fe-rich smectites (nontronites) and supposed thatit could be attributed to EPT of structural Fe(III) cations in smectitestructures. The electron pair transitions are active due to thesuperexchange of electrons (magnetic coupling) between twoneighbouring Fe(III) ions separated by bridging O anions with geo-metrical arrangement respecting Fe and O orbitals allowing theiroverlap. The EPT band energies have been calculated for welldefined (infinite) oxide crystal lattice [52], but perhaps the samegeometrical arrangement of [Fe(O,OH)6] octahedra in sheets (2-Dfragments of the oxide lattice) could allow EPT. Such can be thecase of two specimens of calcined Fe-overexchanged smectite (Ta-ble 1), which have two EPT bands centred at about 20,000 and21,000 cm�1. If one compare the properties of amorphous Fe2O3
(W250), near amorphous Fe2O3 (D250-2/350) and calcined
f the spectra in the EPT region (B). 1 amorphous Fe2O3 (W250), 2 nanocrystallinetalline hematite (a-Fe2O3).

Fig. 8. Percentages of C-containing components in reaction mixture after 20 min time on stream, not shown balance to 100% is mainly non-consumed ethane.
14 L. Smoláková et al. / Journal of Electroanalytical Chemistry 647 (2010) 8–19
Fe-overexchanged smectites (D253-8/400 and D258-4/400), theydo probably have different microstructure because of differentstructure of the EPT bands.
3.4. Catalytic properties
The oxidative dehydrogenation of ethane by N2O produces eth-ene as the only desired product and a scale of side products, mainlyCO and CO2
C2H6 þ N2O ! C2H4 þ COþ CO2 þ CXHY þ CðcokeÞ þ N2
Very low amount of CH4 was produced (<1% in all experiments)and neither propane nor propene were identified. The yield ofother C-containing products, mostly coke, was calculated as thedifference between the consumed ethane and the sum of deter-mined C-containing products. The coke deposition on the catalystwas visible on the surface of the catalyst grains; it has already beenreported to deactivate the catalysts [55–57]. The catalytic activityhas been evaluated in details for Fe–MFI–Cl and Fe–MFI–NO3, be-cause Cl and NO3 modifications cover most of the variability ofall catalysts examined. The composition of C-containing productsin the reaction mixture after 20 min of ‘‘time on stream’’ is shownin Fig. 8A and B. At growing Fe/Al, Fe–MFI–Cl exhibited higher con-version of ethane in comparison with Fe–MFI–NO3. However, bothFe–MFI–NO3 and Fe–MFI–Cl catalysts produced C2H4 in amountalmost independent on Fe/Al. Higher conversion of ethane byFe–MFI–Cl could only be attributed to a larger amount of CO andCO2 as compared to Fe–MFI–NO3. The properties of other catalystshave not been estimated so minutely under the same conditions.Fe–MFI–SO4 zeolites do not produce coke but correspondingly lar-ger amount of CO + CO2 and their yield of C2H4 was a bit lower thanin the case of Fe–MFI–Cl and Fe–MFI–NO3. The catalytic behaviourof Fe–FER–acac catalysts was similar to Fe–MFI–Cl, i.e. the increasein the ethane conversion was observed with increasing Fe/Al load-ing, but it was accompanied with the formation of carbon oxides.Fe–FER–acac exhibited similar production of C2H4 as Fe–FER–Cl(slightly above 10% in reaction mixture).
4. Discussion
4.1. Voltammetric peaks C1 + C2 and C12
The easiest reducible Fe(III) species, which is not thermody-namically stabilised by solid state against its reduction to Fe2+,should be free Fe3+ ion, or better saying its actual partly hydrolysedform [Fe(OH)x(H2O)6�x]3�x [47,48], in this work abbreviated as
[Fe(OH)x](3�x)+, where x depends on pH. This ion could be reducedat the electrode whenever it is detached from the zeolite surfaceand can be in contact with working electrode – that mechanismof charge transfer was called extra-zeolite mechanism [23]. Fe(III)exchanged zeolite was reported to produce the reduction wavewith inflex at about +0.2 V/SCE due to Fe(III) species leached tosolution after their ion exchange with cations of the supportingelectrolyte [58]. In neutral solutions of K salts Fe(III) exchangednon-calcined zeolite Y produces reduction peak between +0.3and 0.0 V/SCE depending on the ionic composition of solution;charge transfer was assumed to proceed by extra-zeolite mecha-nism [59]. The peak potentials between +0.2 and 0.0 V/SCE wereassigned to free ionic species in ion-exchangeable positions ofexpandable clay minerals [7] and zeolites [9] also in our previousreports. We hence assume that C1 and C2 voltammetric peaks inacetate buffer (Figs. 1 and 2) and C12 in HCl–KCl solution (Fig. 4)can be attributed to [Fe(OH)x](3�x)+ reduction
½FeðOHÞx�ð3�xÞþ þ e� ! ½FeðOHÞx�
ð2�xÞþ
and corresponding anodic peak A (Fig. 2) to the re-oxidation of[Fe(OH)x](2�x)+.
Peak C12 obtained in HCl–KCl solution is at potential +0.38 V/SCE for zeolites modified by Fe(NO3)3 solution and +0.33 V/SCEwith Fe-overexchanged smectite. Doménech et al. [2,14] studiedelectrochemical behaviour of parent zeolite MFI with skeletal Feand the products of its calcination and steam treatment whichmoved the skeletal Fe ions to ex-framework sites. The latter mate-rial produced two more reductive voltammetric peaks than theparent Fe zeolite, one of them at +0.30 V/SCE in 0.01 M HCl and0.1 M NaCl. Doménech et al. assigned it to Fe(III) ions attached toion-exchangeable sites of the zeolite. In all these cases, mere Fe(III)ions dissolved in supporting electrolyte produced reduction peakby about 100–150 mV more negative.
It is necessary to point that these actual voltammetric signalsC1 and C2 or C12 are not necessarily produced directly by the ori-ginal Fe(III) species in Fe-modified zeolites but that [Fe(OH)x](3�x)+
can be formed by the interaction of Fe-modified zeolite with sup-porting electrolyte. In principle, either isolated Fe(III) or small olig-omeric Fe(III) ions can be expected to interact with solution andgenerate some soluble [Fe(OH)x](3�x)+ ions. Fe(III) oxides are notsufficiently quickly dissolved into the supporting electrolytes usedin this work. The oxides are thermodynamically stable at the pH ofacetate buffer chosen and kinetically stable in HCl–KCl solution;accordingly neither C1 + C2 nor C12 peaks were yet observed withpure ferric oxides in so weakly acid solutions, even the least stableferrihydrite does not yield it as it was found in this work (Fig. 5) as

L. Smoláková et al. / Journal of Electroanalytical Chemistry 647 (2010) 8–19 15
well as previously [15,21]. No signs of dissolution of Fe oxides havebeen observed in 0.01 M HCl–0.1 M KCl in this work (voltammo-grams are not shown). Acetate buffer is much safer from this pointof view, than, for example, 0.1–1 M HCl having been used by otherelectrochemists [2,13,14]. In solutions with pH<<3 many Fe(III)phases and Fe oxidic species can be quickly dissolved before andduring the voltammetric scanning, which considerably decreasesthe selectivity of the desired solid state ‘‘speciation’’.
It is known that the Fe-modification of zeolites favours dimer-ization and oligomerization of monomeric Fe(III) ions: already atFe/Al about 0.3, less than half of Fe(III) ions are monomers accord-ing to thorough UV–Vis and IR spectral analyses and statisticalmodelling [12]. It is possible that preference of Fe(III) ions to dimer-ization or oligomerization in calcined Fe(III)-zeolites depends onthe way of Fe(III) deposition and calcination, however, such depen-dence has not yet been studied. It is noteworthy that the C1 and C2voltammetric signals are not equally well developed in Fe loadedzeolites obtained by different impregnation methods (Fig. 1). Par-ticularly important seems the lack of C1 + C2 peaks after impregna-tion using Cl method at low Fe/Al loading, firstly noted by Capeket al. [9]. Although this difference is demonstrated only with acetatebuffer in the voltammograms in this work, the same phenomenonwas observed with HCl–KCl supporting electrolyte.
The absence of C1 + C2 and C12 peaks of [Fe(OH)]2+ and[Fe(OH)2]+ in catalysts obtained by impregnation by FeCl3 at lowFe/Al seems surprising if we assume that monomeric Fe(III) ionsshould be major species in Fe-zeolites at Fe/Al up to about 0.2[12]. However, it is known that higher valent transition metal ionsintroduced to zeolites by ion exchange are not easily back ex-changed. The supporting electrolyte used in this work containsH+ and Na+ or K+ ions which do not have larger affinity to zeoliteexchangeable sites than Fe(III). The fact that C1 + C2 and C12 peaksare missing in some Fe-modified zeolites should hence be ex-plained by their too strong bond of Fe(III) and low conductivityof the zeolite support preventing the charge transfer from theworking electrode to the Fe(III) ions. The absence of voltammetricsignal in low and medium Fe-loaded catalysts obtained by FeCl3
impregnation (Fig. 1C) is not due to mere low sensitivity of voltam-metry, because well developed C1 and C2 peaks are obtained al-ready at Fe/Al 0.06 after impregnation by Fe(NO3)3 solution (Figs.1 and 2). It is essential to mention here the opinion of Rolisonet al. [23–25] that metal ions in the channels in the bulk of non-conducting zeolite should not produce electrochemical signal i.e.,that intra-zeolite charge transfer to the zeolite bulk is not effective.We have recently confirmed this opinion by observing voltammet-rically inactive isolated V(V) species in mesoporous silica [37,61].The lack of electrochemical activity of Fe(III) monomers stronglyattached to the permanent negative charges in the channels ofnon-conducting zeolites is hence understandable.
The catalysts producing C1 + C2 and C12 peaks already fromlower Fe/Al loading (particularly Fe-modified zeolites obtained byNO3 impregnation method) would then need a special explanationwhy they are active. We propose a hypothesis that dimeric or low-degree oligomeric Fe(III) cations are present in them, which aresplit by the interaction with supporting electrolyte into[Fe(OH)x](3�x)+ ions remaining strongly bound to the cation ex-change site of zeolite and soluble [Fe(OH)x](3�x)+, which can pro-duce a voltammetric signal. The hypothetic reaction can beformalised as follows
Z�O� Fe�O� FeþHþ þH2O ! Z�O� Fe�Oþ½FeðOHÞx�ð3�xÞþ
where Z stands for negatively charged zeolite matrix, O–Fe–O–Feand O–Fe–O are electrochemically inactive dimeric and monomericFe(III) ions on the zeolite surface, and [Fe(OH)x](3�x)+ is detached/dissolved and hence the only electrochemically active species.
Alternative explanation of the activity of Fe-MFI-NO3 zeolitesand lack of activity of Fe-MFI-Cl zeolites can be in the actual posi-tion of Fe(III) species in the zeolite crystals. On the base of carefulstudy of [Co(salen)]-modified zeolites, Bessel and Rolison [25] spec-ified that insoluble interchannel species in zeolites can be electroac-tive only if they are present very close to the outer surface, while the[Co(salen)] molecules in the inner volume of crystals are not acces-sible to the electrochemical reaction. Doménech [30] estimated thesuperficial layer with the depth 0.1–0.5 lm with [Mn(salen)]encapsulated in zeolite is accessible to electron hopping andcompensating cation diffusion. The primary zeolite crystals in thisstudy have particle size 0.3–0.6 lm but it is not sure the primarycrystals were not aggregated during impregnation. The Fe-MFI-NO3 and Fe-MFI-Cl zeolites might hence also be different becausethe two impregnation procedures have different penetrationdepths, the latter being able to reach the bulk of zeolite crystals.
4.2. Non-oxidic species with UV band B4 and invisible by voltammetry
The Fe-modified zeolites obtained by Cl method at low Fe load-ing have very similar distribution of UV absorption bands B1–B3 asFe-modified zeolites obtained by all other impregnation methods,but in the spectra there is one clearly discernible difference: in Clmodified catalysts the relative proportion of B4 band is more pro-nounced while EPT bands are negligible or less pronounced (Fig. 6).The band B4 is identical to the band centred at about 28,000 cm�1,which is most probably attributable to Fe oxide nanoclusters [10].However, the UV band assignment must be done with care, be-cause there are serious discrepancies between the published inter-pretations and observations.
Pirngruber et al. [10] assumed that the UV bands in the regionof B1–B3 can be assigned to both [Fe(O,OH)6] monomers and di-mers, while Brandenberger et al. [12] and many other authors as-sign them exclusively to monomers, but these bands are alsopresent in spectra of Fe(III) oxides (Figs. 7 and 9), which in fact con-tain neither monomers nor dimers sensu stricto [39]. All ‘‘normal’’oxides have diagnostic EPT bands, and so whenever these oxidesare present in Fe-modified zeolites, the bands B1–B3 cannot beattributed exclusively to monomeric to oligomeric Fe(III) ions asit is conventionally done [9,12]. Perhaps similarly cautious oneshould be in assignment of the band B4. The Gaussian deconvolu-tion of ferrihydrite, calcined ferrihydrite (near amorphous Fe2O3)and calcined Fe-overexchanged smectite also produces a majorband centred in the range 28,000–29,000 cm�1 (Fig. 9). To supporta hypothesis, that the band B4 could be attributed to some partic-ular Fe(III) species but not to ‘‘normal’’ oxides, a case should existwhere it is well developed but EPT is missing. Such case is best rep-resented by Fe-modified zeolites obtained by Cl impregnation atFe/Al 0.05 and 0.13 (Figs. 6C and 9A and B). One more sign thatthere is some particular Fe(III) species in these specimens is thatthey actually do not produce definite voltammetric signals neitherin acetate buffer (Fig. 1C) nor in 0.01 M HCl–0.1 M KCl solution.
Several previous researchers observed well developed band B4in Fe(III) modified MFI [3,9,64] but interestingly not in Fe(III) mod-ified BEA [64]. The species with ‘‘diagnostic’’ feature of UV absorp-tion band �28,000 cm�1 was first attributed to Fe(III) ion dimers[9], but later on the base of careful analysis and evaluation it wasassigned to Fe(III) oxide nanoclusters [10]. If such clusters werepresent inside the zeolite channels, they would be separated fromthe working electrode surface by non-conducting matrix, and un-less they were dissolved (ion-exchanged) in supporting electrolyte,they would not produce any measurable reductive signal, analo-gously as insoluble isolated Fe(III) ions inside the channels dis-cussed above. Such clusters cannot be formed on the outersurface of zeolite crystals where they would convert to amorphousor crystalline Fe2O3 with characteristic spectral and voltammetric

Fig. 9. Gaussian deconvolution of Fe–MFI–Cl-0.05 (A), Fe–MFI–Cl-0.13 (B), Fe–FER–NO3-0.06 (C) and calcined ferrihydrite D250-2-350 (D).
16 L. Smoláková et al. / Journal of Electroanalytical Chemistry 647 (2010) 8–19
properties. Because ferric oxides are not sufficiently soluble in thesupporting electrolyte, as discussed in part 4.1, there is no hint toassume that the oxide-like clusters in zeolite channels would bedissolved to produce electrochemically active [Fe(OH)x](3�x)+ ions.
4.3. Fe(III) oxides: amorphous (voltammetric peak C3), nanocrystalline(C4), and crystalline (C5)
The phase selectivity of voltammetric identification of Fe(III)oxides is based on the phase-specific kinetics and thermodynamicsof their reduction dissolution
Fe2O3 þ 2e� þ ð6� 2xÞH3Oþ ! 2½FeðOHÞx�ð2�xÞþ þ ð9� 4xÞH2O
Table 2Summary of voltammetric peak potentials of ferric oxides in acetate buffer.
Fe(III) oxide EP,V vs.SCE
Reference
Amorphous Fe2O3 �0.1 [7], C3 in thiswork
Ferrihydrite �0.17 [36], this workNear amorphous Fe2O3 (calcined ferrihydrite),
nanocrystalline a-Fe2O3, nanocrystallinemaghemite
�0.2 to�0.3
[9,20,36], C4 inthis work
Finely crystalline defective a-Fe2O3
(dehydrated a-FeOOH)�0.35 to�0.6
[60]
Well crystalline a-Fe2O3 or c-Fe2O3 �0.6 to�0.9
[21], C5 in thiswork
In this reaction, the charge transfer (reduction of Fe(III) to Fe(II)proceeds in solid state as it has already been reported [18,19,62].The overview of peak potentials of Fe(III) oxides in acetate bufferis in Table 2.
Ferrihydrite has EPT band centred at �20,500 cm�1 with noclear band centred below 18,000 cm�1 and voltammetric peakC3 at potential �0.17 V/SCE in acetate buffer (Tables 1 and 2,[53]). Both these features were found in non-calcined zeolitesmodified by NO3 method. The presence of ferrihydrite in NO3
impregnated zeolites is not surprising. The hydrolysis of aqueoussolutions of ferric ions at pH > 3 usually produces actually ferrihy-drite [38–40]. If such hydrolysis proceeds in contact with a suitablealuminosilicate matrix, the resulting ferrihydrite is extremely fi-nely dispersed in it [7,63]. Crystallization of ferrihydrite to thermo-dynamically stable goethite, a-FeOOH, or hematite has not beenobserved in Fe modified (yet not calcined) zeolites that is in linewith the sluggish kinetics of ferrihydrite aging in near neutral pHof solution and in the presence of aluminosilicate matrix (more de-tails can be found in Cornell and Schwertmann’s monograph [39]).The calcination of the composites of ferrihydrite and expandableclay minerals at 400 or 500 �C produces amorphous Fe2O3 [7,65].Amorphous Fe2O3 with particle size in order of a few nm is alsoproduced as a side product of calcination and particularly steamtreatment of zeolites with framework Fe(III) ions [1,8,14]. The crys-tallization of this amorphous polymorph to thermodynamicallystable hematite is hindered actually by the aluminosilicate matrixas it has been reported for metastable c-Fe2O3 and e-Fe2O3 poly-morphs in silica glass [47]. The inhibiting effect of clay mineralsheets on aggregation nanoparticulate Fe(III) oxides [66] has re-

Table 3Operationally defined classes of Fe species according to analytical characteristics and catalytic performance.
Species class Diagnostic signs Prevailing in catalysts Catalytic properties
UV–Vis spectra Voltammetry
Non-ion exchangeable/insolublemonomeric or dimeric Fe(III)a
Only UV bands B1 to B3 No peaks Cl Active and selective to ethene
Ion exchangeable/solublemonomericor dimeric Fe(III)b
Only UV bands B1 to B3 C1, C2 NO3
Oxide nanoclustersc B4 (�28,000 cm�1)and no EPT bands No peaks Cl Fe/Al > 0.1 Over-oxidation of ethane and/orethene
Amorphous Fe2O3 �20,500 cm�1 C3 NO3, acac Fe/Al < 0.1 Inactive (lower TOF), harmlessNanocrystalline a-Fe2O3 Always two EPT bands �20,500 cm�1minor
�18,000 cm�1C4 NO3, acac Fe/Al < 0.1
Hematite Fe2O3 EPT band at �18,000 cm�1 C5 Very large Fe/Al
a Probabbly mainly monomers.b Probably mainly dimers.c Probably inside the zeolite tunnels.
L. Smoláková et al. / Journal of Electroanalytical Chemistry 647 (2010) 8–19 17
cently been used in nanomaterials science to stabilise small, ther-modynamically unstable particles [67].
The amorphous Fe2O3 (peak C3 at about �0.1 V/SCE in acetatebuffer) was not found as a major product in Fe-modified zeolites,but it is probably present as an admixture beside other nanocrys-talline Fe(III) oxides. Accordingly, even though in some Fe-modi-fied zeolites there was EPT bands centred between 19,500 and21,000 cm�1, they were always accompanied by hematite-likeband at �18,000 cm�1.
Near amorphous Fe2O3, calcined ferrihydrite can be distin-guished by voltammetric peak C4 at about �0.2 V/SCE in acetatebuffer and simultaneous presence of hematite-like EPT (�18,000cm�1) and FeOOH like EPT (�20,500 cm�1) in Vis spectra. In Fezeolites, nanocrystalline hematite was commonly found, whichhave EP centred at �0.24 to �0.28 V/SCE in acetate buffer, espe-cially in the case of Fe–MFI–NO3 with Fe/Al �0.1 it was accompa-nied by pre-peak (shoulder) at �0.1 V/SCE. Peak potential EP
around �0.3 V/SCE (C4) has also been found in nanocrystallinehematite formed by heating of pure (unsupported) ferrihydritewith extremely broad X-ray diffraction lines and collapsed sextetin Mössbauer spectroscopy [36]. The voltammetric peak potentialsfound in various unsupported and supported amorphous to verypoorly crystalline Fe(III) oxides yet studied cover relatively broadrange from �0.1 to �0.35 V/SCE in acetate buffer (Table 2); it isnecessary to point out that these oxides cannot be identified bypowder diffraction methods and so their classification has not beenestablished yet. In reports on UV–Vis spectral analysis of Fe in Fe-modified zeolites, all species absorbing near 20,000 cm�1 are de-noted as Fe(III) oxides with no further specification; obviously itis possible to further distinguish them by voltammetry. Furtherwork improving the classification of nanocrystalline Fe(III) oxidesbased on sensitivity of voltammetry and Vis spectroscopy, essen-tial for deeper understanding this complex system, is in progress.
The difference between amorphous Fe2O3 and nanocrystallinehematite is not so well defined in Fe-modified zeolites as in unsup-ported reference Fe oxides, perhaps because they occur in mixtureswith other Fe(III) oxidic species. In part 4.4 these two oxides in Fe-modified zeolites are not distinguished and they are discussed asone class of Fe(III) oxides.
The assignment of the Fe(III) species with EP between �0.5 and�0.8 V/SCE in acetate buffer to some moderately to well crystallinepolymorph of Fe2O3 is unquestionable on the base of comparisonwith well crystalline hematite, a-Fe2O3, or maghemite, c-Fe2O3
(Tables 1 and 2). Hematite is unequivocally identified by sharpEPT band centred at �18,000 cm�1 and practically no other dis-cernible EPT bands. Its actual EP depends on the particle size sim-ilarly as in other crystalline Fe(III) oxides: EP is shifted by
50–200 mV to more negative values if the particle size is increasedby one order of magnitude [18,19]. Hematite was found in severalFe-modified zeolites (Fe–FER–NO3-0.23, Fe–FER–NO3-0.30, Fe–FER–SO4-0.045, Fe–MFI–NO3-0.3), Mössbauer spectroscopy foundits particle size is below 20 nm (Fe–FER–NO3-0.23).
4.4. Structure–activity relationship in Fe-modified zeolite catalysts
Catalysts can be generally evaluated from several points ofview, namely total yields of desired products, total activity in con-version of reactants, selectivity of formation of the desired prod-ucts or turn-over-frequency (TOF, the number of reactantmolecules participated in the reaction per one atom of Fe andtime). It is practically impossible to quantify the participation ofthe individual species on the activity of Fe-modified zeolites dueto the contribution of a lot of different sites, both various Fe speciesand acid sites (surface OH groups). In this work we defined differ-ent Fe species, i.e. monomeric, dimeric, or low-condensed oligo-meric Fe(III) species, Fe(III) oxide nanoclusters and Fe-oxides(amorphous, nanocrystalline, or crystalline hematite). Table 3summarise Fe(III) species identified by analyses and their catalyticproperties in a qualitative manner.
The species with the best selectivity under conditions used aremonomeric to low-condensed oligomeric Fe(III) ions. It is clearlyseen that the presence of Fe-oxide species formed in Fe–MFI–NO3 already at Fe/Al 0.08 (Figs. 1A and 6A) does not change theethane conversion and the ethene yield (Fig. 8A). While the relativepopulation of Fe-oxide species increased in Fe–MFI–NO3, the eth-ane conversion and ethene yield was approximately constant inODH of ethane over Fe–MFI–NO3 with the increasing Fe content.The Fe-oxides species were simply just not active in ODH of ethane.It could be concluded based on the approximately constant valuesof the ethane conversion and ethene yield in ODH of ethane overFe–MFI–NO3 at various Fe level that the relative population of ac-tive species was preserved in the whole range of Fe/Al. At low Fecontent (<0.08 Fe/Al), the activity could be mainly attributed tothe monomeric or dimeric Fe(III) ions. The presence of catalyticallyneutral (inactive) Fe oxides causes that the TOF of oxide containingsamples is lower than of oxide free samples.
From the practical point of view, the selectivity is very impor-tant parameter as the formation of unwanted products representsthe definite loss of the reactant. For Fe–MFI–Cl, the ethane conver-sion increased with the increasing Fe loading, but the ethene yieldwas approximately similar in the whole range of Fe/Al. At thesematerials, the formation of Fe oxide nanoclusters prevailed com-pared to Fe–MFI–NO3. Fe oxide nanoclusters were formed inFe–MFI–Cl at medium and high Fe/Al instead of Fe-oxides formed

18 L. Smoláková et al. / Journal of Electroanalytical Chemistry 647 (2010) 8–19
after other impregnation methods. The formation of oxide nanocl-usters started in Fe–MFI–Cl already at Fe/Al 0.05 as it is evidencedfrom the characteristic UV–Vis band at �28,000 cm�1 and lack ofEPT bands (Fig. 6C) and absence of voltammetric peaks C3–C5. Thisspecies is probably responsible for the increase of the ethane con-version and the decrease of the selectivity. At higher Fe/Al loadingsthese catalysts are exceptional by excessive formation of CO andCO2 side products (Fig. 8). This might be caused by the participa-tion of these species in over-oxidation of ethane and/or ethene.Over-oxidation of propane by oligomeric Fe clusters has also beenreported by Perez-Ramírez and Llamas [43]. Although the forma-tion of these species seems to be more detrimental from practicalpoint of view compared to Fe-oxide species at the reaction condi-tions used here, these species might be useful in different design ofthe ODH experiment, e.g. at lower values of the ethane conversion.
5. Conclusions
Voltammetry can substantially help in the solid state speciationof Fe(III) in zeolites, a very complex problem of high urgency foroptimization of their catalytic performance. Combination of vol-tammetry and UV–Vis spectroscopy can contribute significantlyto identification of Fe(III) oxides, which have yet not been furtherdistinguished to polymorphs. Amorphous Fe2O3, nanocrystalline,and medium to well crystalline hematite can be positively identi-fied by voltammetry and spectroscopy, while identification ofoxide-like nanoclusters, perhaps inside the zeolite channels, canbe performed only by spectroscopy and only in the absence ofFe(III) oxides. Two classes of Fe(III) ionic species were identified:one electrochemically active and the other ‘‘silent’’ in linear poten-tial scan voltammetry in acetate buffer; these species cannot bedistinguished by UV spectra. The description of structure–propertyrelationship in oxidative dehydrogenation of ethane shown that‘‘normal’’ Fe(III) oxides are inactive in the reaction and that theoxide nanoclusters irretrievably over-oxidise ethane and/or etheneunder the studied reaction conditions.
Acknowledgments
Voltammetric analysis is developed within Project AV0Z-40320502. The Grant Agency of Czech Republic financially sup-ported spectral and catalytic works (Project No. 203/08/H032).XRD measurements were kindly performed by L. Beneš and analy-sis of total Fe by XRF spectroscopy by M. Pouzar (both University ofPardubice).
References
[1] A. Ribera, I.W.C.E. Arends, S. de Vries, J. Perez-Ramirez, R.A. Sheldon, J. Catal.195 (2000) 287–297.
[2] J. Perez-Ramirez, G. Mul, F. Kapteijn, J.A. Moulijn, A.R. Overweg, A. Domenech,A. Ribera, I.W.C.E. Arends, J. Catal. 207 (2002) 113–126.
[3] M. Rivallan, G. Berlier, G. Ricchiardi, A. Zecchina, M.T. Nechita, U. Olsbye, Appl.Catal. B 84 (2008) 204–213.
[4] J.A.Z. Pieterse, S. Booneveld, R.W. van den Brink, Appl. Catal. B 51 (2004) 215–228.
[5] V. Lenoble, O. Bouras, V. Deluchat, B. Serpaud, J.C. Bollinger, J. Colloid. InterfaceSci. 255 (2002) 52–58.
[6] B. Dousova, T. Grygar, A. Martaus, L. Fuitova, D. Kolousek, V. Machovic, J.Colloid. Interface Sci. 302 (2006) 424–431.
[7] T. Grygar, D. Hradil, P. Bezdicka, B. Dousova, L. Capek, O. Schneeweiss, ClaysClay Miner. 55 (2007) 165–176.
[8] P. Fejes, J.B. Nagy, K. Lazar, J. Halasz, Appl. Catal. A 190 (2000) 117–135.[9] L. Capek, V. Kreibich, J. Dedecek, T. Grygar, B. Wichterlova, Z. Sobalik, J.A.
Martens, R. Brosius, V. Tokarova, Micropor. Mesopor. Mater. 80 (2005) 279–289.
[10] G.D. Pirngruber, P.K. Roy, R. Prins, Phys. Chem. Chem. Phys. 8 (2006) 3939–3950.
[11] M. Hoj, M.J. Beier, J.D. Grunwaldt, S. Dahl, Appl. Catal. B 93 (2009) 166–176.[12] S. Brandenberger, O. Kröcher, A. Tissler, R. Althoff, Appl. Catal. A 373 (2010)
168–175.
[13] M.Y. Kim, K.W. Lee, J.H. Park, C.H. Shin, J. Lee, G. Seo, Korean J. Chem. Eng. 27(2010) 76–82.
[14] A. Domenech, J. Perez-Ramirez, A. Ribera, G. Mul, F. Kapteijn, I.W.C.E. Arends, J.Electroanal. Chem. 519 (2002) 72–84.
[15] F. Marken, D. Patel, C.E. Madden, R.C. Millward, S. Fletcher, New. J. Chem. 26(2002) 259–263.
[16] G. Cepria, A. Uson, J. Perez-Arantegui, J.R. Castillo, Anal. Chim. Acta 477 (2003)157–168.
[17] G.V.M. Jacintho, P. Corio, J.C. Rubim, J. Electroanal. Chem. 603 (2007) 27–34.
[18] M.T. Mouhandess, F. Chassagneux, O. Vittori, A. Accary, R.M. Reeves, J.Electroanal. Chem. 181 (1984) 93–105.
[19] T. Grygar, Collect. Czech. Chem. Commun. 61 (1996) 93–106.[20] K.J. McKenzie, F. Marken, Pure Appl. Chem. 73 (2001) 1885–1894.[21] T. Grygar, P. Bezdicka, D. Hradil, A. Domenech-Carbo, F. Marken, L. Pikna, G.
Cepria, Analyst 127 (2002) 1100–1107.[22] F. Bedioui, L. Roue, E. Briot, J. Devynck, S.L. Bell, K.J. Balkus, J. Electroanal. Chem.
373 (1994) 19–29.[23] C. Senaratne, J. Zhang, M.D. Baker, C.A. Bessel, D.R. Rolison, J. Phys. Chem. 100
(1996) 5849–5862.[24] D.R. Rolison, C.A. Bessel, M.D. Baker, C. Senaratne, J. Zhang, J. Phys. Chem. 100
(1996) 8610–8611.[25] C.A. Bessel, D.R. Rolison, J. Phys, Chem. B 101 (1997) 1148–1157.[26] K.Z. Brainina, M.B. Vydrevich, Stripping analysis of solids, J. Electroanal. Chem.
121 (1981) 1–28.[27] T. Grygar, F. Marken, U. Schröder, F. Scholz, Collect. Czech. Chem. Commun. 67
(2002) 63–107.[28] F. Scholz, U. Schröder, R. Gulaboski, Electrochemistry of Immobilized Particles
and Droplets, Springer Heidelberg, Berlin, 2005. XIII, 290 p., ISBN: 3-540-22005-4.
[29] E. Briot, F. Bedioui, K.J. Balkus, J. Electroanal. Chem. 454 (1998) 83–89.[30] A. Domenech, J. Phys, Chem. B 108 (2004) 20471–20478.[31] A. Walcarius, Electroanalysis 20 (2008) 711–738.[32] A. Held, J. Kowalska, K. Nowinska, Appl. Catal. B 64 (2006) 201–208.[33] J. Pérez-Ramírez, E.V. Kondratenko, Chem. Commun. (2003) 2152–2153.[34] R. Bulanek, B. Wichterlova, K. Novoveska, V. Kreibich, Appl. Catal. A 264 (2004)
13–22.[35] F. Scholz, L. Nitschke, G. Henrion, Z. Fresenius, Anal. Chem. 334 (1989) 56–58.[36] T. Grygar, P. Bezdicka, V. Simova, O. Schneeweiss, Quantitative Analysis of
Poorly Crystalline Fe2O3 Specimens, in: XX Congress of the International Unionof Crystallography (IUCr), Florence, August 23–31, 2005.
[37] L. Capek, J. Adam, T. Grygar, R. Bulanek, L. Vradman, G. Kosova-Kucerova, P.Cicmanec, P. Knotek, Appl. Catal. A 342 (2008) 99–106.
[38] J.L. Jambor, J.E. Dutrizac, Chem. Rev. 98 (1998) 2549–2585.[39] R.M. Cornell, U. Schwertmann. The Iron Oxides: Structure, Properties,
Reactions, Occurrences and Uses. Wiley VCH 2003, ISBN 3-527-30274-3.[40] J. Subrt, V. Stengl, M. Skokanek, Thermochim. Acta 211 (1992) 107–
119.[41] R. Zboril, M. Mashlan, D. Petridis, Chem. Mater. 14 (2002) 969–982.[42] R. Zboril, L. Machala, M. Mashlan, V. Sharma, Cryst. Growth Design 4 (2004)
1317–1325.[43] J. Pérez-Ramírez, A. Gallardo-Llamas, Appl. Catal. A 279 (2005) 117–123.[44] H.-Y. Chen, W.M.H. Sachtler, Catal. Today 42 (1998) 73–83.[45] L. Smolakova, L. Capek, T. Grygar, L. Vanek, M. Pouzar, N2O as an oxidant for
oxidative dehydrogenation of ethane, in: Nineth Pannonian InternationalSymposium On Catalysis, in: B. Horvath, M. Hronec (Eds.), Slovak University ofTechnology in Bratislava, Bratislava, 2008, pp. 447–452. (ISBN 978-80-227-2923-9).
[46] L. Capek, L. Vanek, L. Smolakova, R. Bulanek, J. Adam, Collect. Czech. Chem.Commun. 73 (2008) 1177–1191.
[47] J.P. Jolivet, C. Chaneac, E. Tronc, Chem. Commun. 5 (2004) 481–487.[48] A. Stefansson, Environ. Sci. Technol. 41 (2007) 6117–6123.[49] P. Marturano, L. Drozdová, G.D. Pirngruber, A. Kogelbauer, R. Prins, Phys. Chem.
Chem. Phys. 3 (2001) 5585–5595.[50] S. Bordiga, R. Buzzoni, F. Geobaldo, C. Lamberti, E. Giamello, A. Zecchina, G.
Leofanti, G. Petrini, G. Tozzola, G. Vlaic, J. Catal. 158 (1996) 486–501.[51] L. Lopes, J. de Laat, B. Legube, Inorg. Chem. 41 (2002) 2505–2517.[52] D.M. Sherman, Phys. Chem. Miner. 12 (1985) 161–175.[53] A.C. Scheinost, A. Chavernas, V. Barron, J. Torrent, Clays Clay Miner. 46 (1998)
528–536.[54] D.M. Sherman, N. Vergo, Am. Minerol. 73 (1988) 1346–1354.[55] J. Perez-Ramirez, A. Gallardo-Llamas, J. Catal. 223 (2004) 382–388.[56] J. Pérez-Ramírez, A. Gallardo-Llamas, C. Daniel, C. Mirodatos, Chem. Eng. Sci.
59 (2004) 5535–5543.[57] A. Gallardo-Llamas, C. Mirodatos, J. Perez-Ramirez, Ind. Eng. Chem. Res. 44
(2005) 455–462.[58] Y.X. Jiang, M.Z. Zou, K. Yuan, H.D. Xu, Electroanalysis 11 (1999) 254–259.[59] M.M. Ardakani, Z. Akrami, H. Kazemian, H.R. Zare, J. Electroanal. Chem. 586
(2006) 31–38.[60] I.H.M. van Oorschot, T. Grygar, M.J. Dekkers, Earth Planet. Sci. Lett. 193 (2001)
631–664.[61] T. Grygar, L. Capek, J. Adam, V. Machovic, J. Electroanal. Chem. 633 (2009) 127–
136.[62] C.Y. Cummings, M.J. Bonne, K.J. Edler, M. Helton, A. McKee, F. Marken,
Electrochem. Commun. 10 (2008) 1773–1776.[63] L. Borgnino, M.J. Avena, C.P. De Pauli, Colloid Surf. A 341 (2009) 46–52.

L. Smoláková et al. / Journal of Electroanalytical Chemistry 647 (2010) 8–19 19
[64] R. Brosius, D. Habermacher, J.A. Martens, L. Vradman, M. Herskowitz, L. Capek,Z. Sobalik, J. Dedecek, B. Wichterlova, V. Tokarova, O. Gonsiorova, Top. Catal.30–31 (2004) 333–339.
[65] C. Belver, M.A. Vicente, M. Fernandez-Garcia, A. Martinez-Arias, J. Mol. Catal.219 (2004) 309–313.
[66] H. Bartonkova, M. Mashlan, R. Zboril, J. Pechousek, O. Schneeweiss, P. Martinec,Hyperfine Interact. 165 (2005) 221–225.
[67] K. Kluchova, R. Zboril, J. Tucek, M. Pecova, L. Zajoncova, I. Safarik, M. Mashlan, I.Markova, D. Jancik, M. Sebela, H. Bartonkova, V. Bellesi, P. Novak, D. Petridis,Biomaterials 30 (2009) 2855–2863.
Copyright © 2022 FDOKUMEN