Transcriptional Regulation of Secondary Metabolite Biosynthesis in Plants
Upload
independentCategory
view
1download
0
APPLIED AND ENVIRONMENTAL MICROBIOLOGY, Aug. 2007, p. 4741–4750 Vol. 73, No. 150099-2240/07/$08.00�0 doi:10.1128/AEM.00315-07Copyright © 2007, American Society for Microbiology. All Rights Reserved.
Population Dynamics and Metabolite Target Analysis ofLactic Acid Bacteria during Laboratory Fermentations
of Wheat and Spelt Sourdoughs�
Roel Van der Meulen,1 Ilse Scheirlinck,2 Ann Van Schoor,1 Geert Huys,2 Marc Vancanneyt,2Peter Vandamme,2 and Luc De Vuyst1*
Research Group of Industrial Microbiology and Food Biotechnology (IMDO), Department of Applied Biological Sciences andEngineering, Vrije Universiteit Brussel, Pleinlaan 2, B-1050 Brussels, Belgium,1 and Laboratory of Microbiology and
BCCM/LMG Bacteria Collection, Department of Biochemistry, Physiology and Microbiology, Ghent University,K. L. Ledeganckstraat 35, B-9000 Ghent, Belgium2
Received 8 February 2007/Accepted 1 June 2007
Four laboratory sourdough fermentations, initiated with wheat or spelt flour and without the addition of astarter culture, were prepared over a period of 10 days with daily back-slopping. Samples taken at allrefreshment steps were used for determination of the present microbiota. Furthermore, an extensive metabolitetarget analysis of more than 100 different compounds was performed through a combination of variouschromatographic methods including liquid chromatography-mass spectrometry and gas chromatography-massspectrometry. The establishment of a stable microbial ecosystem occurred through a three-phase evolutionwithin a week, as revealed by both microbiological and metabolite analyses. Strains of Lactobacillus plantarum,Lactobacillus fermentum, Lactobacillus rossiae, Lactobacillus brevis, and Lactobacillus paraplantarum were domi-nating some of the sourdough ecosystems. Although the heterofermentative L. fermentum was dominating oneof the wheat sourdoughs, all other sourdoughs were dominated by a combination of obligate and facultativeheterofermentative taxa. Strains of homofermentative species were not retrieved in the stable sourdoughecosystems. Concentrations of sugar and amino acid metabolites hardly changed during the last days offermentation. Besides lactic acid, ethanol, and mannitol, the production of succinic acid, erythritol, andvarious amino acid metabolites, such as phenyllactic acid, hydroxyphenyllactic acid, and indolelactic acid, wasshown during fermentation. Physiologically, they contributed to the equilibration of the redox balance. Thebiphasic approach of the present study allowed us to map some of the interactions taking place duringsourdough fermentation and helped us to understand the fine-tuned metabolism of lactic acid bacteria, whichallows them to dominate a food ecosystem.
Sourdough is a mixture of ground cereals (e.g., wheat or rye)and water that is spontaneously fermented. Sourdough fer-mentations improve dough properties, enhance both breadtexture and bread flavor, and delay bread spoilage (28). Lacticacid bacteria (LAB) and yeasts play a key role in sourdoughfermentation processes (9, 21, 26, 28, 29, 55). Sourdough LABhave been intensively studied with respect to their carbohy-drate metabolism (16, 24, 60), proteolysis and amino acid me-tabolism (16, 23, 58, 69), lipid metabolism (16), and productionof volatile compounds (7, 31, 32). Besides these general met-abolic traits, specific metabolic properties have been recog-nized in sourdough LAB, such as the use of alternativeelectron acceptors (59, 61), the production of antifungal com-pounds (38, 45, 57), the biosynthesis of exopolysaccharides (36,63, 64), and arginine catabolism (8, 53). These metabolic traitsof sourdough LAB highlight their adaptation to the sourdoughenvironment. For instance, fructose-to-mannitol and arginine-to-ornithine conversion favor ATP generation and/or acid
stress (16). Also, interactions between sourdough LAB andyeasts have been studied in detail (9, 21).
The microbial growth and activity of LAB in sourdough areinfluenced by endogenous factors (e.g., flour carbohydratesand enzymes); process parameters (e.g., water content andtemperature); and interactions between LAB, yeasts, andother bacteria (21, 28, 44, 71). Despite changes in raw materialor the bakery environment, the sourdough microbiota is oftenremarkably stable, even for several years (17, 54). However,the metabolism of certain sourdough LAB may be influencedby process factors to obtain higher-quality end products. Anexample of the latter is the stimulated release or addition ofalternative electron acceptors (e.g., fructose) or pentosans(e.g., through pentosanases) to stimulate the production ofacetic acid (25, 37, 52). In this way, an optimal fermentationquotient (molar ratio of lactic acid to acetic acid) of about 2.5can be attained (52).
The population dynamics of microbial food ecosystems havebeen studied mainly through microbiological analysis (20). Inrecent years, culture-independent methods have been devel-oped to circumvent the limitations of conventional cultivationfor the analysis of microbial communities in fermented foods(11). In this regard, denaturing gradient gel electrophoresis(DGGE) of PCR-amplified 16S rRNA fragments (16S rRNAPCR-DGGE) is frequently used as a relatively rapid and reli-
* Corresponding author. Mailing address: Research Group of In-dustrial Microbiology and Food Biotechnology (IMDO), Vrije Uni-versiteit Brussel, Pleinlaan 2, B-1050 Brussels, Belgium. Phone: 32 26293245. Fax: 32 2 6292720. E-mail: [email protected].
� Published ahead of print on 8 June 2007.
4741
on Novem
ber 27, 2014 by guesthttp://aem
.asm.org/
Dow
nloaded from
able cultivation-independent method to study the biodiversityand population dynamics of microbial communities (11). A fewstudies have already described the use of PCR-DGGE to mon-itor the diversity and dynamics of LAB and yeast populationsduring sourdough fermentation processes (18, 42, 44, 51).
In the last couple of years, metabolomics has found its placeamong the “-omics” technologies, such as genomics, transcrip-tomics, and proteomics (48). Unfortunately, due to differencesin physical and chemical properties of metabolites, a compre-hensive approach is lacking (12). Therefore, metabolite targetanalysis and metabolite profiling are the most widespread tech-niques to study the metabolism of organisms (13). Metabolitetarget analysis involves a combination of techniques to quantifya limited number of metabolites. Metabolite profiling aims atgenerating metabolic profiles of certain classes of compoundsand usually generates only semiquantitative data (13, 14). Re-cently, a combined analysis of acidity, amino acids, and se-lected volatiles has been performed for wheat sourdoughs toelucidate possible relationships between process parametersand formation of metabolites (34). However, the last study didnot report on population dynamics during sourdough fermen-tation, because well-defined starter cultures were used thatdominated the entire fermentation process.
The aim of the present study was an extended biphasicapproach of spontaneously fermented laboratory sourdoughs.The population dynamics of yeasts and LAB were assessed bymicrobiological analysis (both yeasts and LAB) and PCR-DGGE (only LAB). In parallel, an extensive metabolite targetanalysis of more than 100 compounds was performed on thewhole sourdough ecosystem to document the in situ metabolicpotential of sourdough LAB and to explain why certain sour-dough LAB species became dominant during spontaneoussourdough fermentation.
MATERIALS AND METHODS
Flours. Wheat and spelt flours were provided by two local flour mills (A andB). Two types of each flour were used to prepare spontaneous sourdoughs bymeans of back-slopping (Table 1). Flour protein content was determined usingnear-infrared spectroscopy, and amylase activity was assessed by the Hagbergmethod (6).
Laboratory sourdough preparation. The production of sourdough (8 kg) wascarried out in two Biostat C fermentors (Sartorius AG, Goettingen, Germany)and started by mixing 6 liters of sterile water with 2 kg of flour in one fermentorwith a resulting dough yield [(dough mass/flour mass) � 100] of 400. This doughwas incubated at 30°C for 24 h, during which the mixture was kept homogeneousthrough stirring (300 rpm). After 24 h of incubation, 800 g of ripe sourdough wascollected in a sterile bottle to inoculate a fresh water-flour mixture (5.2 liters ofwater and 2 kg of flour) in the second fermentor on day 2. This dough was againincubated under the same conditions as described above. The back-slopping wascarried out during a period of 10 days. At each refreshment step (every 24 h),samples were withdrawn from the ripe sourdough for culture-dependent micro-biological analysis and immediate measurement of pH and total titratable acidity(TTA). The latter was done by suspending 10 g of sourdough in 100 ml ofultrapure water. The TTA value is expressed as the amount (in milliliters) of 0.1M NaOH needed to achieve a final pH of 8.5. Cell counts were determined bymixing 10 g of fresh sourdough with 90 ml of sterile 0.85% (wt/vol) NaCl solutionand homogenizing the mixture for 5 min (Stomacher 400; Seward, Worthington,United Kingdom). A 10-fold dilution series was made and plated on de Man-Rogosa-Sharpe-5 (MRS-5) agar (44) or yeast extract-glucose-chloramphenicolagar (43) to determine LAB and yeast counts, respectively, after incubation ofthe agar plates at 30°C for 48 h. A given amount of sourdough (approximately100 g) was centrifuged (8,041 � g for 20 min at 4°C) to remove solids, and thesupernatant was stored at �20°C for metabolite target analysis. In addition, partof the ripe sourdough was stored at �20°C for culture-independent microbio-logical analysis through PCR-DGGE.
Bacterial population dynamics of back-slopped sourdoughs analyzed througha culture-dependent approach. On average 10 to 15 purified gram-positive andcatalase-negative isolates, recovered from MRS-5 agar plates based on colonymorphology, were subjected to repetitive DNA element PCR (rep-PCR) analysisto dereplicate and classify potential LAB. Therefore, a small portion of onecolony was resuspended in 20 �l lysis buffer (2.5 ml of 10% [wt/vol] sodiumdodecyl sulfate, 5.0 ml of 1 N NaOH, and 92.5 ml of ultrapure water). Themixture was heated at 95°C for 15 min and cooled immediately on ice. After ashort centrifugation step at high speed, 180 �l of sterile ultrapure water wasadded. Subsequently, the mixture was centrifuged (13,000 � g for 5 min) andstored at �20°C. If this alkaline lysis method was not able to produce high-quality rep-PCR profiles, the phenol-chloroform method was used, as describedby Gevers et al. (19). The rep-PCR oligonucleotide primer pair used was (GTG)5
(5�-GTGGTGGTGGTGGTG-3�) with the following temperature program: ini-tial denaturation (95°C, 7 min); 30 cycles of denaturation (94°C, 1 min), anneal-ing (40°C, 1 min), and extension (65°C, 8 min); and a single final extension step(65°C, 16 min) (70). The PCR products were separated in a 1.5% (wt/vol)agarose gel at a constant voltage of 55 V in 1� TAE buffer (40 mM Tris-acetate,1 mM EDTA, pH 8.0) at 4°C for 16 h. The rep-PCR profiles were visualized afterstaining with ethidium bromide under UV light, followed by digital image cap-turing using a charge-coupled device camera. The resulting (GTG)5-PCR fin-gerprints were analyzed using the BioNumerics v4.0 software package (AppliedMaths, Sint-Martens-Latem, Belgium). To obtain a collection of unique strains,the resulting (GTG)5-PCR patterns were clustered together with an in-housereference framework. rep-PCR clusters were delineated at 50% Pearson simi-larity, and clustering was performed with the unweighted pair group methodusing arithmetic averages. Isolates were tentatively assigned to a given specieswhen they belonged to a cluster that contained one or more type or referencestrains. To verify the tentative identifications obtained by (GTG)5-PCR cluster-ing and to identify the remaining unknown isolates, representatives of eachcluster were subjected to a polyphasic taxonomic approach. This included iden-tification through amplified fragment length polymorphism (62), sodium dodecylsulfate-polyacrylamide gel electrophoresis of whole-cell proteins (50), 16S rRNAgene sequence analysis (65), pheS gene sequence analysis (47), and/or DNA-DNA hybridizations (56).
Bacterial population dynamics of back-slopped sourdoughs analyzed throughPCR-DGGE. For the extraction of total DNA from sourdough samples, 90 ml ofpeptone-physiological solution (0.1% [wt/vol] bacteriological peptone [Oxoid,Basingstoke, Hampshire, United Kingdom] and 0.85% [wt/vol] NaCl) was addedto 10 g of sourdough and homogenized for 5 min. Fifty milliliters of this solutionwas centrifuged (1,000 � g at 4°C for 5 min). To harvest the cells, the supernatantwas centrifuged for a second time (5,000 � g at 4°C for 15 min), and the cellpellet was stored at �20°C. The extraction of total DNA was performed as de-scribed by Pitcher et al. (49), except that an extra lysis step with lysozyme (7.5 mglysozyme powder in 150 �l Tris-EDTA buffer; Serva, Heidelberg, Germany) andmutanolysine (40 �l mutanolysine at 5,000 U/ml; Sigma-Aldrich, St. Louis, MO), aswell as an additional chloroform-isoamyl alcohol extraction step, was added.
Amplification of 16S rRNA fragments was carried out with universal primers,amplifying the V3 region of the 16S rRNA gene, by using a thermocycler(MyCycler; Bio-Rad, Hercules, CA). The forward primer F357 possessed thesequence 5�-ATTACCGCGGCTGCTGG-3� and contained a GC clamp (5�-CGCCCGCCGCGCGCGGCGGGCGGGGCGGGGGCACGGGGG-3�). The re-verse primer 518R possessed the sequence 5�-ATTACCGCGGCTGCTGG-3�.PCR volumes of 50 �l contained 6 �l of 10� PCR buffer (containing 15 mMMgCl2), 2.5 �l bovine serum albumin, 2.5 �l deoxynucleoside triphosphates (2mM each), 2 �l of each primer (5 �M), 0.25 �l Taq polymerase (5 U �l�1), 32.75�l ultrapure water, and 2 �l of DNA solution. The following PCR program wasused: initial denaturation at 94°C for 5 min; 30 cycles of denaturation at 94°C for20 s, annealing at 55°C for 45 s, and extension at 72°C for 1 min; and finalextension at 72°C for 7 min, followed by cooling to 4°C. PCR products were
TABLE 1. Characteristics of flours from two mills (A and B) usedfor the production of laboratory sourdoughs
Flour Moisture(%)
Ash (% ofdry matter)
Protein (% ofdry matter)
Amylase activity(Hagberg
method �6�; s)
Wheat A 13.8 0.51 14.3 412Spelt A 13.9 0.62 12.2 369Wheat B 14.1 0.51 12.6 384Spelt B 13.6 0.61 13.5 281
4742 VAN DER MEULEN ET AL. APPL. ENVIRON. MICROBIOL.
on Novem
ber 27, 2014 by guesthttp://aem
.asm.org/
Dow
nloaded from
checked by mixing 8 �l of the PCR product with 2 �l of loading dye, followed byelectrophoresis on a 1.5% (wt/vol) agarose gel at 100 V for 30 min, flanked by theEZ Load 100-bp Molecular Ruler (Bio-Rad).
PCR products were analyzed on DGGE gels based on the protocol of Muyzeret al. (46). Polyacrylamide gels (160 � 160 � 1 mm) consisted of 8% (vol/vol)polyacrylamide (National Diagnostics, Atlanta, GA) in 1� TAE buffer (Bio-Rad), using a 35 to 70% denaturant gradient (100% denaturing polyacrylamidesolution, corresponding to 7 M urea [National Diagnostics] and 40% [vol/vol]formamide [Sigma-Aldrich]). Electrophoresis was performed for 16.5 h at 70 Vin 1� TAE buffer at a constant temperature of 60°C using the Dcode System(Bio-Rad). Gels were stained with CyberGold (solution of 50 �l in 500 ml 1�TAE buffer) for 1 h, followed by visualization of DGGE band profiles under UVlight and digital capturing with a charge-coupled device camera.
A reference pattern was designed consisting of V3 16S rRNA amplicons from13 different bacterial type strains. By inclusion of this reference pattern three tofour times on each DGGE gel, resulting band profiles could be digitally normal-ized by comparison with a standard reference, using the BioNumerics v4.0 soft-ware package (Applied Maths).
For sequencing of DGGE bands, bands of interest were excised from the gels,resuspended in 50 �l of sterile water, and incubated overnight at 4°C to allowdiffusion of DNA from the gel cuts. Five microliters of this aqueous solution wasused to reamplify the PCR products with the same primers, including the GCclamp. The amplicons were checked for purity by another DGGE run under theconditions described above with amplified DNA of the original sample as acontrol. Only reamplified PCR products migrating as a single band and at thesame position as the control were amplified with the primer pair (without GCclamp) and sequenced using an ABI Prism 3100 Genetic Analyzer (AppliedBiosystems, Foster City, CA) with the BigDye Terminator v3.1 Cycle Sequencingkit (Applied Biosystems), applied according to the manufacturer’s instructions.Searches in the international nucleotide sequence library (EMBL) database wereperformed using the BLAST program (1) to determine the closest known rela-tives of the partial 16S rRNA sequences obtained.
Metabolite target analysis. Concentrations of glucose, fructose, xylose, arabi-nose, sucrose, maltose, erythritol, and mannitol were determined by high-per-formance anion-exchange chromatography with pulsed amperometric detection(Dionex, Sunnyvale, CA) using a CarboPacPA10 column. The mobile phase, ata flow rate of 1.0 ml min�1, consisted of ultrapure water (0.015 �S cm�1; eluentA), 167 mM NaOH (eluent B), and 500 mM NaOH (eluent C) with the followinggradient: 0.0 min, 87% A and 13% B; 20.0 min, 87% A and 13% B; 40.0 min,15% A and 85% B; 41.0 min, 100% C; 49.0 min, 100% C; 50.0 min, 87% A and13% B; 65.0 min, 87% A and 13% B. To remove proteins, sourdough superna-tant was treated with Carrez A and B reagent. Therefore, 350 �l of Carrez Areagent [3.6% (wt/vol) K4Fe(CN)6 � 0.3H2O] and 350 �l of Carrez B reagent(7.2% [wt/vol] ZnSO4 � 7H2O) were added to 700 �l of sourdough supernatant.After centrifugation (16,060 � g for 15 min) the supernatant was filtered (0.2�m; Minisart; Sartorius AG) prior to injection.
Concentrations of lactic acid and formic acid were determined by high-per-formance liquid chromatography analysis with a Waters chromatograph (WatersCorp., Milford, MA), equipped with a 2414 differential refractometer, a 600Scontroller, a column oven, and a 717plus autosampler. An ICSep ICE ORH-801column (Interchim, Montlucon, France) was used with 10 mN H2SO4 as mobilephase at a flow rate of 0.4 ml min�1. The column temperature was kept at 35°C.Sample preparation was performed as described above.
Concentrations of citrulline, ornithine, and amino acids were determined usinga Waters 2695 liquid chromatograph coupled to a Quattro Micro mass spec-trometer (Waters). The column (Atlantis; Waters) was kept at 35°C. The mobilephase, starting at a flow rate of 0.2 ml min�1 and linearly increasing to 0.5 mlmin�1 over a period of 45 min with a flow rate of 0.2 ml min�1 afterwards, wascomposed of 0.1% (vol/vol) formic acid in ultrapure water (eluent A) and 0.1%(vol/vol) formic acid in acetonitrile (eluent B). The following gradient was used(vol/vol): 0.0 min, 90% A and 10% B; 45.0 min, 10% A and 90% B; 46.0 min,90% A and 10% B; 60.0 min, 90% A and 10% B. Sourdough supernatant wasdiluted 10-fold with ultrapure water and stirred for 15 s. Then, 100 �l of internalstandard (IS) (0.002% [wt/vol] of 2-aminobutyric acid in ultrapure water) wasadded to 500 �l of the diluted sample. The amino acids were derivatized using anAccQ Fluor reagent kit (Waters). Therefore, 70 �l of borate buffer was added to15 �l of the sample-IS mixture. The latter was stirred for 15 s, after which 30 �lof derivatization reagent was added. After being stirred for another 15 s, themixture was heated at 55°C for 10 min, cooled, transferred to a vial, and injected.
Metabolites of the aromatic amino acids (phenylpyruvic acid, phenyllacticacid, phenylacetic acid, phenylpropionic acid, hydroxyphenylpyruvic acid, hy-droxyphenyllactic acid, hydroxyphenylacetic acid, hydroxyphenylpropionic acid,indolelactic acid, indoleacetic acid, and indolepropionic acid) and succinic acid
were determined using the same liquid chromatography-mass spectrometry ap-paratus as described above. The mobile phase, at a flow rate of 0.2 ml min�1, wascomposed of ultrapure water (eluent A), acetonitrile (eluent B), and 10 mMammonium acetate (pH 6.5; eluent C). The following gradient was used (vol/vol):0.0 min, 85% A, 5% B, and 10% C; 15.0 min, 40% A, 50% B, and 10% C; 15.1min, 10% A, 80% B, and 10% C; 23.0 min, 10% A, 80% B, and 10% C; 23.1 min,85% A, 5% B, and 10% C; 30.0 min, 85% A, 5% B, and 10% C. One hundredmicroliters of IS (0.25% [wt/vol] of 3,4-dihydroxybenzoic acid in ultrapure water)was added to 500 �l of sourdough supernatant. After mixing, 600 �l of aceto-nitrile was added and the samples were centrifuged (16,060 � g for 15 min). Thesupernatant was filtered (Minisart RC4) and injected.
Short-chain fatty acids (SCFA; acetic acid, propionic acid, butyric acid, valericacid, and caproic acid), branched SCFA (iso-butyric acid, iso-valeric acid, and2-methylbutyric acid), ethanol, and other volatile compounds (diacetyl, acetalde-hyde, acetoin, indole, skatole, cresol, and phenol) were measured by gas chroma-tography-mass spectrometry as described before (66). Sourdough supernatant wastreated with Carrez A and B reagent as described above prior to injection.
Volatile compounds were determined by static headspace analysis on an Agi-lent 6890 gas chromatograph coupled to an Agilent 5973N mass spectrometer(Agilent Technologies, Palo Alto, CA). A capillary column (DB-WAXetr; Agi-lent Technologies) was used with a starting temperature of 40°C that increasedlinearly to 230°C over a period of 30 min, after which the temperature was keptat 230°C for 10 min. Data were acquired in scan mode at 5.2 spectra per s in themass range m/z of 2 to 300. For sample preparation, 200 mg of NaCl and 1 g ofsourdough supernatant were weighed in a 20-ml headspace vial and sealed witha crimp cap with a silicone rubber septum. Samples were shaken for 30 min at85°C prior to injection of the volatile fraction. Standard solutions of 57 volatilecompounds in total were used to determine their retention time, and 2-octanolwas used as IS. The AMDIS deconvolution software (NIST, http://www.nist.gov/), used in simple analysis mode and coupled to the NIST98 Mass SpectralDatabase (NIST), was used for analysis of the chromatograms. Identification oftarget compounds was performed by combining retention time and mass spectraldatabase information.
All samples were analyzed in triplicate, and the mean values � standard devia-tions are represented, except for the results of the headspace analysis, which wereexpressed as [100 � peak area compound (peak area IS � g sample)�1].
RESULTS
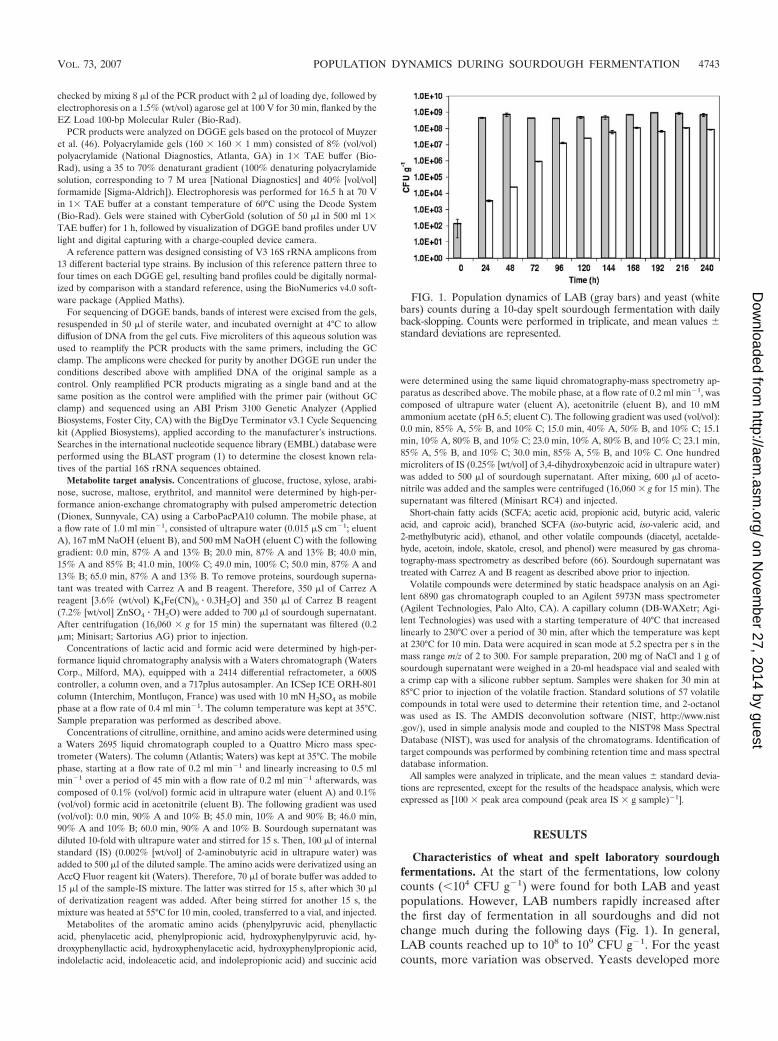
Characteristics of wheat and spelt laboratory sourdoughfermentations. At the start of the fermentations, low colonycounts (104 CFU g�1) were found for both LAB and yeastpopulations. However, LAB numbers rapidly increased afterthe first day of fermentation in all sourdoughs and did notchange much during the following days (Fig. 1). In general,LAB counts reached up to 108 to 109 CFU g�1. For the yeastcounts, more variation was observed. Yeasts developed more
FIG. 1. Population dynamics of LAB (gray bars) and yeast (whitebars) counts during a 10-day spelt sourdough fermentation with dailyback-slopping. Counts were performed in triplicate, and mean values �standard deviations are represented.
VOL. 73, 2007 POPULATION DYNAMICS DURING SOURDOUGH FERMENTATION 4743
on Novem
ber 27, 2014 by guesthttp://aem
.asm.org/
Dow
nloaded from
slowly than LAB and usually reached high amounts (107 CFUg�1) after 4 to 5 days of back-slopping (Fig. 1). However,during the wheat A sourdough fermentation, the yeast popu-lation started to develop only after 8 days of back-slopping,resulting in a low yeast population at the end of the 10-daycycle (Table 2).
The pH did not change during the first 12 h of fermentationfor all sourdoughs (Fig. 2). During the next 12 h, the pHstarted to drop slowly, ending at pH 4 to 5 after the first day offermentation. After the first back-slopping, an immediate de-crease of the pH was observed during fermentation. As thefresh dough was inoculated with ripe sourdough from the daybefore, the pH at the start was lower on day 2, and the final pHvalue was also lower. After day 2 a pH value below 4.0 wasreached during all sourdough fermentations. During the fol-lowing days (days 3 to 10), the pH profile was similar to that forday 2; only the pH at the start and at the end slightly decreased(Table 2). An inverse relation between pH and TTA values wasobserved. Final TTA values ranged between 9.0 and 9.5, exceptfor the wheat B sourdough, which showed a lower final TTAvalue (Table 2).
Bacterial population dynamics of back-slopped laboratorysourdoughs analyzed through a culture-dependent approach.Identification of presumptive LAB isolates based on (GTG)5-PCR analysis and/or taxonomic polyphasic characterization re-vealed several changes in the LAB populations (Table 3). Themajor changes occurred during the first 4 to 5 days of back-slopping. After the first day of fermentation, LAB atypical forsourdough, such as species belonging to the genera Enterococ-cus and Lactococcus, were detected. They usually decreasedbelow the detection limit after the first or second day of back-
slopping. One exception was the persistence of Lactococcuslactis in the wheat B sourdough; it was still retrieved after 4days of fermentation. From day 2 to day 4, other LAB speciesmainly belonging to Lactobacillus or Leuconostoc, and some-times Pediococcus or Weissella, became dominant in the sour-dough ecosystem. From day 5 on, only minor changes wereobserved in all sourdoughs, indicating achievement of a stablesourdough ecosystem. Lactobacillus plantarum was present inthe stable wheat B, spelt A, and spelt B sourdough ecosystems,
TABLE 2. Characteristics of the four laboratory sourdoughs after 10 days of back-slopping
Flour pH TTA LAB (CFU g�1) Yeast (CFU g�1)
Wheat A 3.34 � 0.01 9.1 � 0.1 1.0 � 109 � 0.2 � 109 9.1 � 105 � 1.6 � 105
Spelt A 3.34 � 0.01 9.0 � 0.1 6.9 � 108 � 1.3 � 108 8.5 � 107 � 0.7 � 107
Wheat B 3.33 � 0.02 7.7 � 0.1 3.8 � 108 � 1.2 � 108 3.4 � 107 � 0.2 � 107
Spelt B 3.35 � 0.02 9.6 � 0.2 1.5 � 109 � 0.2 � 109 2.7 � 107 � 0.7 � 107
FIG. 2. Changes in pH during a 10-day spelt sourdough fermenta-tion with daily back-slopping. Symbols: F, changes in pH during thefirst day of fermentation (0 to 24 h); f, changes in pH during thesecond day of fermentation (24 to 48 h); Œ, changes in pH duringthe last day of fermentation (216 to 240 h).
TABLE 3. Bacterial population dynamics during four laboratorysourdough fermentations, analyzed by a culture-dependent
approach (plating, isolation, and subsequentpolyphasic identification)
Flour and microorganism identifiedIdentification at time (h):
0 24 48 72 96 240
Spelt AEnterobacter cloacae XEnterococcus faecium XEscherichia coli XLactococcus lactis subsp. lactis XEnterococcus hirae X XLeuconostoc citreum X XLactobacillus curvatus X X XPediococcus pentosaceus X X XLactobacillus plantarum X XLactobacillus rossiae X
Wheat AAerococcus viridans XLactobacillus fermentum X X X XLeuconostoc citreum X X XLactobacillus curvatus X X X XLactococcus lactis XWeissella cibaria X X
Wheat BAerococcus viridans XLactococcus lactis X X X XLeuconostoc citreum X X X XLactobacillus curvatus X XPediococcus pentosaceus X XLactobacillus fermentum X X X XLactobacillus plantarum X X X
Spelt BEnterococcus mundtii XLeuconostoc pseudomesenteroides X X XLactobacillus curvatus X X X XLactococcus lactis subsp. lactis X XLeuconostoc citreum X X X XLactobacillus helveticus XPediococcus pentosaceus XLactobacillus brevis X XLactobacillus paraplantarum X XLactobacillus plantarum X X
4744 VAN DER MEULEN ET AL. APPL. ENVIRON. MICROBIOL.
on Novem
ber 27, 2014 by guesthttp://aem
.asm.org/
Dow
nloaded from
whereas Lactobacillus fermentum dominated the wheat A sour-dough ecosystem and was found in the stable wheat B sour-dough. Interestingly, L. fermentum was never retrieved in anyof the spelt sourdoughs. Finally, Lactobacillus rossiae wasfound in the stable spelt A sourdough, whereas Lactobacillusbrevis and Lactobacillus paraplantarum were found in the stablespelt B sourdough, in both cases together with L. plantarum.
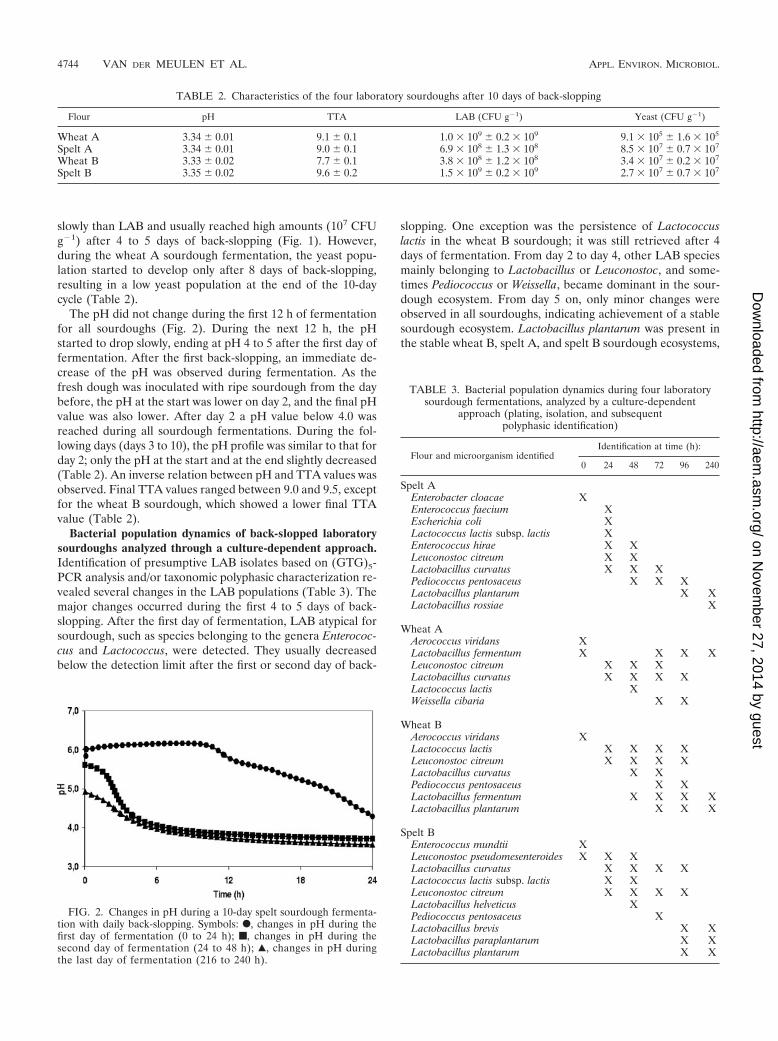
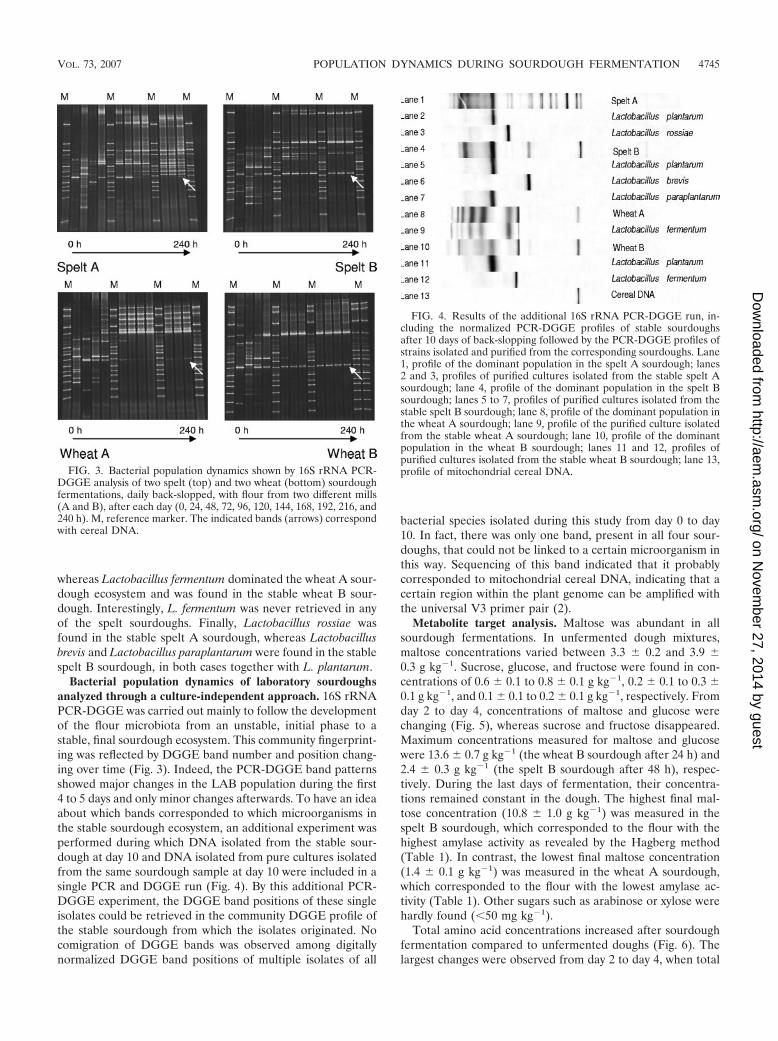
Bacterial population dynamics of laboratory sourdoughsanalyzed through a culture-independent approach. 16S rRNAPCR-DGGE was carried out mainly to follow the developmentof the flour microbiota from an unstable, initial phase to astable, final sourdough ecosystem. This community fingerprint-ing was reflected by DGGE band number and position chang-ing over time (Fig. 3). Indeed, the PCR-DGGE band patternsshowed major changes in the LAB population during the first4 to 5 days and only minor changes afterwards. To have an ideaabout which bands corresponded to which microorganisms inthe stable sourdough ecosystem, an additional experiment wasperformed during which DNA isolated from the stable sour-dough at day 10 and DNA isolated from pure cultures isolatedfrom the same sourdough sample at day 10 were included in asingle PCR and DGGE run (Fig. 4). By this additional PCR-DGGE experiment, the DGGE band positions of these singleisolates could be retrieved in the community DGGE profile ofthe stable sourdough from which the isolates originated. Nocomigration of DGGE bands was observed among digitallynormalized DGGE band positions of multiple isolates of all
bacterial species isolated during this study from day 0 to day10. In fact, there was only one band, present in all four sour-doughs, that could not be linked to a certain microorganism inthis way. Sequencing of this band indicated that it probablycorresponded to mitochondrial cereal DNA, indicating that acertain region within the plant genome can be amplified withthe universal V3 primer pair (2).
Metabolite target analysis. Maltose was abundant in allsourdough fermentations. In unfermented dough mixtures,maltose concentrations varied between 3.3 � 0.2 and 3.9 �0.3 g kg�1. Sucrose, glucose, and fructose were found in con-centrations of 0.6 � 0.1 to 0.8 � 0.1 g kg�1, 0.2 � 0.1 to 0.3 �0.1 g kg�1, and 0.1 � 0.1 to 0.2 � 0.1 g kg�1, respectively. Fromday 2 to day 4, concentrations of maltose and glucose werechanging (Fig. 5), whereas sucrose and fructose disappeared.Maximum concentrations measured for maltose and glucosewere 13.6 � 0.7 g kg�1 (the wheat B sourdough after 24 h) and2.4 � 0.3 g kg�1 (the spelt B sourdough after 48 h), respec-tively. During the last days of fermentation, their concentra-tions remained constant in the dough. The highest final mal-tose concentration (10.8 � 1.0 g kg�1) was measured in thespelt B sourdough, which corresponded to the flour with thehighest amylase activity as revealed by the Hagberg method(Table 1). In contrast, the lowest final maltose concentration(1.4 � 0.1 g kg�1) was measured in the wheat A sourdough,which corresponded to the flour with the lowest amylase ac-tivity (Table 1). Other sugars such as arabinose or xylose werehardly found (50 mg kg�1).
Total amino acid concentrations increased after sourdoughfermentation compared to unfermented doughs (Fig. 6). Thelargest changes were observed from day 2 to day 4, when total
FIG. 3. Bacterial population dynamics shown by 16S rRNA PCR-DGGE analysis of two spelt (top) and two wheat (bottom) sourdoughfermentations, daily back-slopped, with flour from two different mills(A and B), after each day (0, 24, 48, 72, 96, 120, 144, 168, 192, 216, and240 h). M, reference marker. The indicated bands (arrows) correspondwith cereal DNA.
FIG. 4. Results of the additional 16S rRNA PCR-DGGE run, in-cluding the normalized PCR-DGGE profiles of stable sourdoughsafter 10 days of back-slopping followed by the PCR-DGGE profiles ofstrains isolated and purified from the corresponding sourdoughs. Lane1, profile of the dominant population in the spelt A sourdough; lanes2 and 3, profiles of purified cultures isolated from the stable spelt Asourdough; lane 4, profile of the dominant population in the spelt Bsourdough; lanes 5 to 7, profiles of purified cultures isolated from thestable spelt B sourdough; lane 8, profile of the dominant population inthe wheat A sourdough; lane 9, profile of the purified culture isolatedfrom the stable wheat A sourdough; lane 10, profile of the dominantpopulation in the wheat B sourdough; lanes 11 and 12, profiles ofpurified cultures isolated from the stable wheat B sourdough; lane 13,profile of mitochondrial cereal DNA.
VOL. 73, 2007 POPULATION DYNAMICS DURING SOURDOUGH FERMENTATION 4745
on Novem
ber 27, 2014 by guesthttp://aem
.asm.org/
Dow
nloaded from
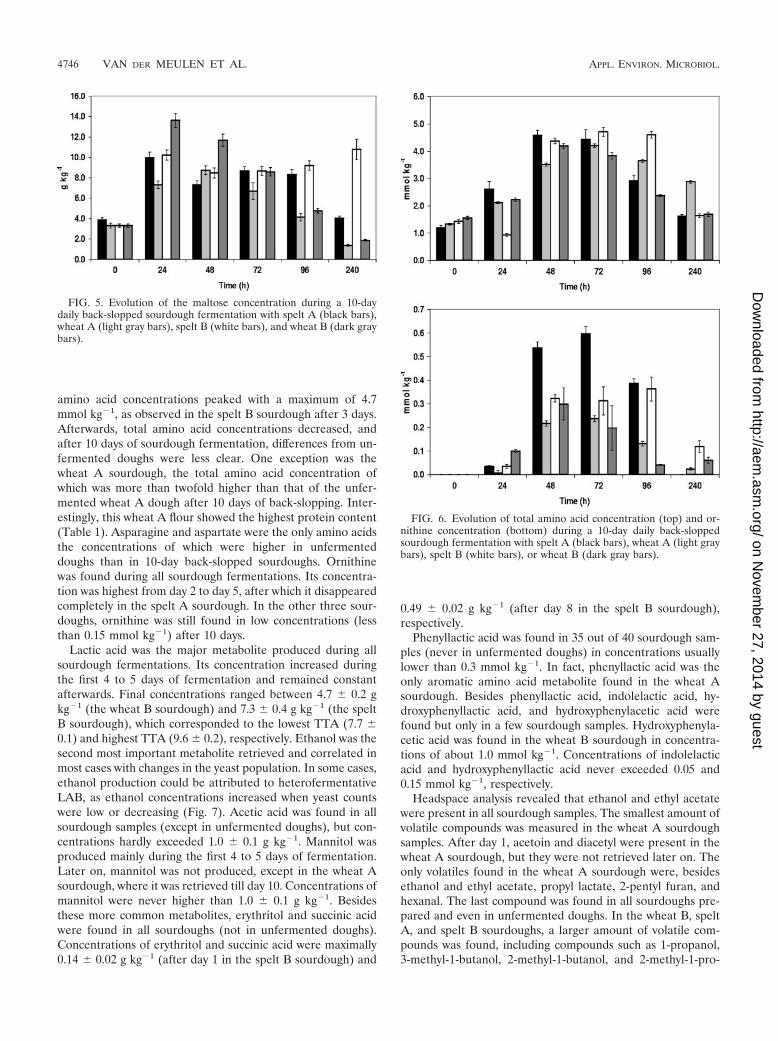
amino acid concentrations peaked with a maximum of 4.7mmol kg�1, as observed in the spelt B sourdough after 3 days.Afterwards, total amino acid concentrations decreased, andafter 10 days of sourdough fermentation, differences from un-fermented doughs were less clear. One exception was thewheat A sourdough, the total amino acid concentration ofwhich was more than twofold higher than that of the unfer-mented wheat A dough after 10 days of back-slopping. Inter-estingly, this wheat A flour showed the highest protein content(Table 1). Asparagine and aspartate were the only amino acidsthe concentrations of which were higher in unfermenteddoughs than in 10-day back-slopped sourdoughs. Ornithinewas found during all sourdough fermentations. Its concentra-tion was highest from day 2 to day 5, after which it disappearedcompletely in the spelt A sourdough. In the other three sour-doughs, ornithine was still found in low concentrations (lessthan 0.15 mmol kg�1) after 10 days.
Lactic acid was the major metabolite produced during allsourdough fermentations. Its concentration increased duringthe first 4 to 5 days of fermentation and remained constantafterwards. Final concentrations ranged between 4.7 � 0.2 gkg�1 (the wheat B sourdough) and 7.3 � 0.4 g kg�1 (the speltB sourdough), which corresponded to the lowest TTA (7.7 �0.1) and highest TTA (9.6 � 0.2), respectively. Ethanol was thesecond most important metabolite retrieved and correlated inmost cases with changes in the yeast population. In some cases,ethanol production could be attributed to heterofermentativeLAB, as ethanol concentrations increased when yeast countswere low or decreasing (Fig. 7). Acetic acid was found in allsourdough samples (except in unfermented doughs), but con-centrations hardly exceeded 1.0 � 0.1 g kg�1. Mannitol wasproduced mainly during the first 4 to 5 days of fermentation.Later on, mannitol was not produced, except in the wheat Asourdough, where it was retrieved till day 10. Concentrations ofmannitol were never higher than 1.0 � 0.1 g kg�1. Besidesthese more common metabolites, erythritol and succinic acidwere found in all sourdoughs (not in unfermented doughs).Concentrations of erythritol and succinic acid were maximally0.14 � 0.02 g kg�1 (after day 1 in the spelt B sourdough) and
0.49 � 0.02 g kg�1 (after day 8 in the spelt B sourdough),respectively.
Phenyllactic acid was found in 35 out of 40 sourdough sam-ples (never in unfermented doughs) in concentrations usuallylower than 0.3 mmol kg�1. In fact, phenyllactic acid was theonly aromatic amino acid metabolite found in the wheat Asourdough. Besides phenyllactic acid, indolelactic acid, hy-droxyphenyllactic acid, and hydroxyphenylacetic acid werefound but only in a few sourdough samples. Hydroxyphenyla-cetic acid was found in the wheat B sourdough in concentra-tions of about 1.0 mmol kg�1. Concentrations of indolelacticacid and hydroxyphenyllactic acid never exceeded 0.05 and0.15 mmol kg�1, respectively.
Headspace analysis revealed that ethanol and ethyl acetatewere present in all sourdough samples. The smallest amount ofvolatile compounds was measured in the wheat A sourdoughsamples. After day 1, acetoin and diacetyl were present in thewheat A sourdough, but they were not retrieved later on. Theonly volatiles found in the wheat A sourdough were, besidesethanol and ethyl acetate, propyl lactate, 2-pentyl furan, andhexanal. The last compound was found in all sourdoughs pre-pared and even in unfermented doughs. In the wheat B, speltA, and spelt B sourdoughs, a larger amount of volatile com-pounds was found, including compounds such as 1-propanol,3-methyl-1-butanol, 2-methyl-1-butanol, and 2-methyl-1-pro-
FIG. 5. Evolution of the maltose concentration during a 10-daydaily back-slopped sourdough fermentation with spelt A (black bars),wheat A (light gray bars), spelt B (white bars), and wheat B (dark graybars).
FIG. 6. Evolution of total amino acid concentration (top) and or-nithine concentration (bottom) during a 10-day daily back-sloppedsourdough fermentation with spelt A (black bars), wheat A (light graybars), spelt B (white bars), or wheat B (dark gray bars).
4746 VAN DER MEULEN ET AL. APPL. ENVIRON. MICROBIOL.
on Novem
ber 27, 2014 by guesthttp://aem
.asm.org/
Dow
nloaded from
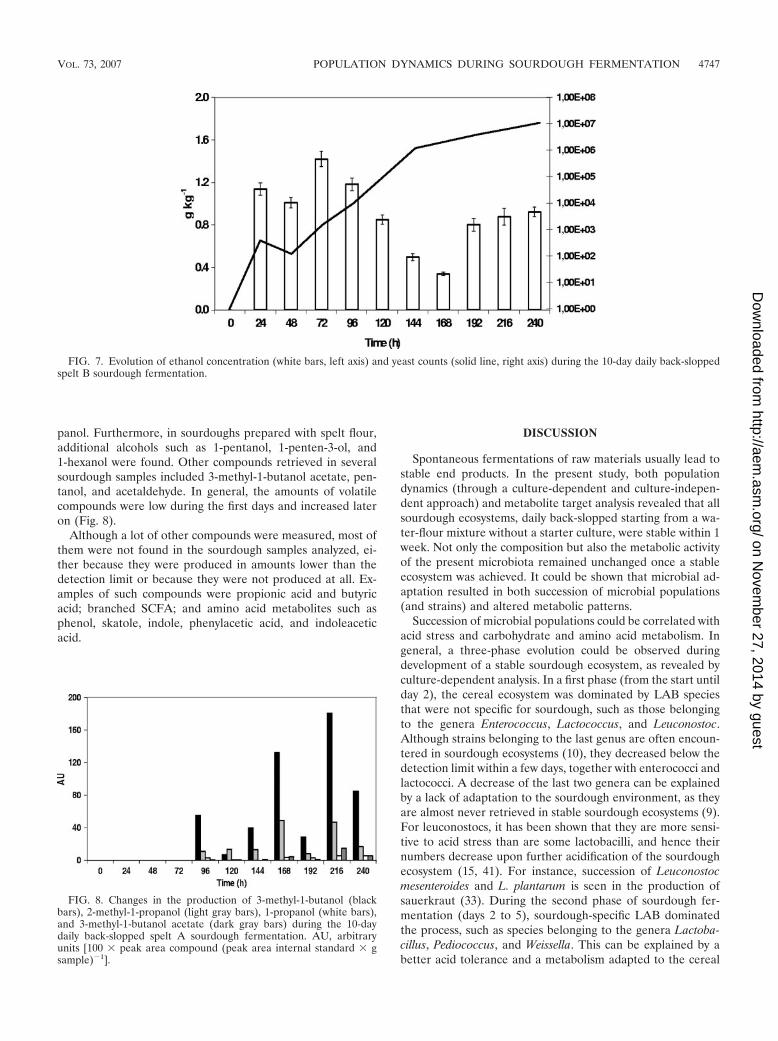
panol. Furthermore, in sourdoughs prepared with spelt flour,additional alcohols such as 1-pentanol, 1-penten-3-ol, and1-hexanol were found. Other compounds retrieved in severalsourdough samples included 3-methyl-1-butanol acetate, pen-tanol, and acetaldehyde. In general, the amounts of volatilecompounds were low during the first days and increased lateron (Fig. 8).
Although a lot of other compounds were measured, most ofthem were not found in the sourdough samples analyzed, ei-ther because they were produced in amounts lower than thedetection limit or because they were not produced at all. Ex-amples of such compounds were propionic acid and butyricacid; branched SCFA; and amino acid metabolites such asphenol, skatole, indole, phenylacetic acid, and indoleaceticacid.
DISCUSSION
Spontaneous fermentations of raw materials usually lead tostable end products. In the present study, both populationdynamics (through a culture-dependent and culture-indepen-dent approach) and metabolite target analysis revealed that allsourdough ecosystems, daily back-slopped starting from a wa-ter-flour mixture without a starter culture, were stable within 1week. Not only the composition but also the metabolic activityof the present microbiota remained unchanged once a stableecosystem was achieved. It could be shown that microbial ad-aptation resulted in both succession of microbial populations(and strains) and altered metabolic patterns.
Succession of microbial populations could be correlated withacid stress and carbohydrate and amino acid metabolism. Ingeneral, a three-phase evolution could be observed duringdevelopment of a stable sourdough ecosystem, as revealed byculture-dependent analysis. In a first phase (from the start untilday 2), the cereal ecosystem was dominated by LAB speciesthat were not specific for sourdough, such as those belongingto the genera Enterococcus, Lactococcus, and Leuconostoc.Although strains belonging to the last genus are often encoun-tered in sourdough ecosystems (10), they decreased below thedetection limit within a few days, together with enterococci andlactococci. A decrease of the last two genera can be explainedby a lack of adaptation to the sourdough environment, as theyare almost never retrieved in stable sourdough ecosystems (9).For leuconostocs, it has been shown that they are more sensi-tive to acid stress than are some lactobacilli, and hence theirnumbers decrease upon further acidification of the sourdoughecosystem (15, 41). For instance, succession of Leuconostocmesenteroides and L. plantarum is seen in the production ofsauerkraut (33). During the second phase of sourdough fer-mentation (days 2 to 5), sourdough-specific LAB dominatedthe process, such as species belonging to the genera Lactoba-cillus, Pediococcus, and Weissella. This can be explained by abetter acid tolerance and a metabolism adapted to the cereal
FIG. 7. Evolution of ethanol concentration (white bars, left axis) and yeast counts (solid line, right axis) during the 10-day daily back-sloppedspelt B sourdough fermentation.
FIG. 8. Changes in the production of 3-methyl-1-butanol (blackbars), 2-methyl-1-propanol (light gray bars), 1-propanol (white bars),and 3-methyl-1-butanol acetate (dark gray bars) during the 10-daydaily back-slopped spelt A sourdough fermentation. AU, arbitraryunits [100 � peak area compound (peak area internal standard � gsample)�1].
VOL. 73, 2007 POPULATION DYNAMICS DURING SOURDOUGH FERMENTATION 4747
on Novem
ber 27, 2014 by guesthttp://aem
.asm.org/
Dow
nloaded from
environment (16). As an example, the use of external electronacceptors, such as fructose present in the sourdough ecosys-tem, enhances their competitiveness (16). Finally, during athird and last phase (days 5 to 7), well-adapted sourdoughstrains, such as strains of L. plantarum and L. fermentum,became dominant under the applied laboratory conditions oftemperature, dough yield, etc. This observation was confirmedby 16S rRNA PCR-DGGE analysis, yielding stable band pat-terns upon prolonged fermentation. The three-phase establish-ment of a stable ecosystem has also been observed during othercereal fermentations such as traditional cassava flour fermen-tation (3). During the present study, a different ecosystem wasfound for the flours used, as revealed by both a culture-depen-dent and a culture-independent approach, indicating that thetype of flour has a certain effect on the establishing ecosystem.
In the present study, L. plantarum was found in three out ofthe four stable sourdoughs. L. plantarum is often encounteredin sourdough ecosystems (9), and its dominance in cereal fer-mentations is attributed to a highly adapted carbohydrate me-tabolism, possibly reflecting its natural habitat (35). Besides L.plantarum, L. fermentum was found in stable wheat sourdoughecosystems, which can be explained by the extreme acid toler-ance and adapted metabolism of the latter species (4, 5). More-over, L. fermentum dominated the stable wheat A sourdoughecosystem, as revealed by PCR-DGGE. The other three sour-dough ecosystems were always dominated by a consortium ofobligate and facultative heterofermentative LAB species,whereas obligate homofermentative LAB species were out-competed in the sourdough ecosystems studied. The observa-tion that L. fermentum was found in stable wheat sourdoughecosystems and was never encountered in spelt sourdoughs isinteresting but needs further investigation before valid conclu-sions can be drawn.
In general, maltose release (mediated by flour amylases andperhaps amylolytic sourdough LAB) and maltose consumption(by sourdough LAB) as well as proteolysis (mainly ascribed tothe action of flour proteinases enhanced by acidic conditions)occur during sourdough fermentation. This is reflected by theconsiderable levels of maltose retrieved after each fermenta-tion step and an increase of total amino acids upon fermenta-tion (27, 39, 40, 69). The present study showed that the com-petitiveness of sourdough LAB is enhanced by both the use ofthe arginine deiminase pathway (in an early stage) and the useof alternative electron acceptors.
The arginine deiminase pathway is considered to yield acompetitive advantage compared to strains lacking it (8, 16).However, in the present study, ornithine was found only in lowconcentrations (or not at all) after 10 days of back-slopping.Hence, the dominating strains in the present sourdough eco-systems hardly made use of this metabolic trait. In contrast, itseemed that the strains competing during the first days offermentation made more use of this specific metabolic capacityto compete in the sourdough ecosystem, which is shown herefor the first time, as ornithine concentrations were highestduring the first days of back-slopping. However, it appears thatcounteracting acid stress solely due to ornithine production isnot sufficient.
External electron acceptors such as fructose or citrate arepreferred (73). The production of mannitol from fructose,which may lead to an efficient equilibration of the redox bal-
ance, enhanced energy generation, and, therefore, increasedcompetitiveness (37, 72, 73), was observed during the presentstudy. However, mannitol was produced mainly during the first2 to 5 days of back-slopping and disappeared afterwards, indi-cating that the dominating species in the stable ecosystem didnot make full use of this metabolic trait. The only exceptionwas the wheat A sourdough, dominated by L. fermentum,where mannitol was also found after 10 days of back-slopping.This mannitol had to be produced by L. fermentum, as it wasthe only species detected through PCR-DGGE in the stablesourdough. Interestingly, mannitol was not found in the wheatB sourdough, in spite of the presence of L. fermentum. Anexplanation might be that the precursor, fructose, was notgenerated in one sourdough whereas it was in the other. Be-sides the production of lactic acid, ethanol, and mannitol, alsoother pathways to equilibrate the redox balance were observed.Two examples of this were the production of succinic acid andthat of erythritol during fermentation. Succinic acid can beproduced through metabolism of citrate, which is usuallypresent in flour in low concentrations (22, 29, 61). Erythritolproduction from glucose has previously been observed for purecultures of several LAB strains (59, 67). This study showed forthe first time the in situ production of these two compoundsduring sourdough fermentation. The need for other ways toregenerate NAD(P)� might be explained by a low activity ofthe acetaldehyde dehydrogenase enzyme (67, 73).
Besides the equilibration of the redox balance through sugarmetabolism, amino acid metabolism may contribute to this.The in situ production of phenyllactic acid, hydroxyphenyllac-tic acid, indolelactic acid, and hydroxyphenylacetic acid duringsourdough fermentation was shown during the present study. Itwas striking that the aromatic amino acids were mostly con-verted to their hydroxy acids and that besides hydroxypheny-lacetic acid, no other metabolite was found. The equilibrationof the redox balance through the conversion of the -keto acid(e.g., phenylpyruvic acid) to the corresponding hydroxy acid(e.g., phenyllactic acid) might explain this observation. There-fore, these fine-tuning reactions might give an extra competi-tive advantage to the strains possessing this capability. Thishypothesis is strengthened by the observation that these aro-matic amino acid metabolites increased towards the end inthree out of four sourdough fermentations and were at theirhighest concentrations in the stable sourdough ecosystems.
Other amino acid catabolic pathways probably contributedto the equilibration of the redox balance. Analysis of volatilecompounds revealed that, besides ethanol and ethyl acetate,degradation products of valine, leucine, and iso-leucine in theiralcohol form were the most important volatiles. In general, thelevels of volatiles increased upon fermentation and alcoholswere the most important compounds retrieved, confirming pre-vious results (30, 32). In a similar way, one can assume thatthey play a role in maintaining the redox balance. However, itis not easy to discriminate between volatiles produced by theLAB populations and those produced by the yeast populations.The importance of redox balance, not only for LAB metabo-lism but also concerning dough structure, has recently beenhighlighted by Vermeulen et al., who found an interactionbetween LAB-catalyzed redox reactions and the gluten struc-ture of the dough (68).
To conclude, it was shown that the establishment of a stable
4748 VAN DER MEULEN ET AL. APPL. ENVIRON. MICROBIOL.
on Novem
ber 27, 2014 by guesthttp://aem
.asm.org/
Dow
nloaded from
sourdough ecosystem, starting from a water-flour mixture, oc-curred through a three-phase evolution. LAB atypical for sour-dough were outcompeted by sourdough-specific LAB during afirst transition phase after 1 or 2 days of back-slopping. After4 to 5 days of back-slopping, these LAB are in turn outcom-peted by sourdough-specific LAB that were highly adapted tothe employed conditions of temperature, dough yield, etc. Fur-thermore, the in situ production of certain metabolites, such assuccinic acid and erythritol, during sourdough fermentationwas shown for the first time. The use of fructose as an externalelectron acceptor and arginine-to-ornithine conversion con-tribute to competitiveness during the first days of back-sloppedsourdough fermentation. Together with the production of sev-eral amino acid metabolites, especially metabolites of aromaticamino acids, such as phenyllactic acid, their production cancontribute to the equilibration of the redox balance to ensurefast growth of the dominating strains. An adapted metabolismand efficient redox balancing strengthen the stable existence ofspecific LAB strains in a sourdough ecosystem. Stable wheatand spelt sourdoughs did not differ significantly.
ACKNOWLEDGMENTS
This work was supported by the Research Council of the VrijeUniversiteit Brussel, the Fund for Scientific Research-Flanders, andthe Flemish Institute for the Encouragement of Scientific and Tech-nological Research in the Industry (SBO Project 030263). G.H. is apostdoctoral fellow of the Fund for Scientific Research-Flanders(F.W.O.-Vlaanderen, Belgium).
REFERENCES
1. Altschul, S. F., T. L. Madden, A. A. Schaffer, J. Zhang, Z. Zhang, W. Miller,and D. J. Lipman. 1997. Gapped BLAST and PSI-BLAST: a new generationof protein database search programs. Nucleic Acids Res. 25:3389–3402.
2. Ampe, F., N. Ben Omar, C. Moizan, C. Wacher, and J. P. Guyot. 1999.Polyphasic study of the spatial distribution of microorganisms in Mexicanpozol, a fermented maize dough, demonstrates the need for cultivation-independent methods to investigate traditional fermentations. Appl. Envi-ron. Microbiol. 65:5464–5473.
3. Brauman, A., S. Keleke, M. Malonga, E. Miambi, and F. Ampe. 1996.Microbiological and biochemical characterization of cassava retting, a tradi-tional lactic acid fermentation for foo-foo (cassava flour) production. Appl.Environ. Microbiol. 62:2854–2858.
4. Calderon-Santoyo, M., G. Loiseau, and J. P. Guyot. 2003. Fermentation byLactobacillus fermentum Ogi E1 of different combinations of carbohydratesoccurring naturally in cereals: consequences on growth energetics and-amylase production. Int. J. Food Microbiol. 80:161–169.
5. Calderon-Santoyo, M., G. Loiseau, R. R. Sanoja, and J. P. Guyot. 2003.Study of starch fermentation at low pH by Lactobacillus fermentum Ogi E1reveals uncoupling between growth and -amylase production at pH 4.0. Int.J. Food Microbiol. 80:77–87.
6. Catterall, P. 1998. Flour milling, p. 296–329. In S. P. Cauvain and L. S.Young (ed.), Technology of breadmaking. Blackie Academic and Profes-sional, London, United Kingdom.
7. Czerny, M., and P. Schieberle. 2002. Important aroma compounds in freshlyground wholemeal and white wheat flour—identification and quantitativechanges during sourdough fermentation. J. Agric. Food Chem. 50:6835–6840.
8. De Angelis, M., L. Mariotti, J. Rossi, M. Servili, P. F. Fox, G. Rollan, and M.Gobbetti. 2002. Arginine catabolism by sourdough lactic acid bacteria: pu-rification and characterization of the arginine deiminase pathway enzymesfrom Lactobacillus sanfranciscensis CB1. Appl. Environ. Microbiol. 68:6193–6201.
9. De Vuyst, L., and P. Neysens. 2005. The sourdough microflora: biodiversityand metabolic interactions. Trends Food Sci. Technol. 16:43–56.
10. De Vuyst, L., and M. Vancanneyt. 2007. Biodiversity and identification ofsourdough lactic acid bacteria. Food Microbiol. 24:120–127.
11. Ercolini, D. 2004. PCR-DGGE fingerprinting: novel strategies for detectionof microbes in food. J. Microbiol. Methods 56:297–314.
12. Fernie, A. R., R. N. Trethewey, A. J. Krotzky, and L. Willmitzer. 2004.Innovation—metabolite profiling: from diagnostics to systems biology. Nat.Rev. Mol. Cell Biol. 5:763–769.
13. Fiehn, O. 2002. Metabolomics—the link between genotypes and phenotypes.Plant Mol. Biol. 48:155–171.
14. Fiehn, O., J. Kopka, P. Dormann, T. Altmann, R. N. Trethewey, and L.Willmitzer. 2000. Metabolite profiling for plant functional genomics. Nat.Biotechnol. 18:1157–1161.
15. Gabriel, V., D. Lefebvre, Y. Vayssier, and C. Faucher. 1999. Characterizationof the microflora of natural sourdoughs. Microbiol. Aliment. Nutr. 17:171–179.
16. Ganzle, M. G., N. Vermeulen, and R. F. Vogel. 2007. Carbohydrate, peptideand lipid metabolism of lactic acid bacteria in sourdough. Food Microbiol.24:128–138.
17. Ganzle, M. G., and R. F. Vogel. 2003. Contribution of reutericyclin produc-tion to the stable persistence of Lactobacillus reuteri in an industrial sour-dough fermentation. Int. J. Food Microbiol. 80:31–45.
18. Gatto, V., and S. Torriani. 2004. Microbial population changes during sour-dough fermentation monitored by DGGE analysis of 16S and 26S rRNAgene fragments. Ann. Microbiol. 54:31–42.
19. Gevers, D., G. Huys, and J. Swings. 2001. Applicability of rep-PCR finger-printing for identification of Lactobacillus species. FEMS Microbiol. Lett.205:31–36.
20. Giraffa, G. 2004. Studying the dynamics of microbial populations during foodfermentation. FEMS Microbiol. Rev. 28:251–260.
21. Gobbetti, M. 1998. The sourdough microflora: interactions of lactic acidbacteria and yeasts. Trends Food Sci. Technol. 9:267–274.
22. Gobbetti, M., and A. Corsetti. 1996. Co-metabolism of citrate and maltose byLactobacillus brevis subsp lindneri CB1 citrate-negative strain: effect ongrowth, end-products and sourdough fermentation. Z. Lebensm. Unters.Forsch. 203:82–87.
23. Gobbetti, M., A. Corsetti, and J. Rossi. 1994. The sourdough microflora.Interactions between lactic acid bacteria and yeasts: metabolism of aminoacids. World J. Microbiol. Biotechnol. 10:275–279.
24. Gobbetti, M., A. Corsetti, and J. Rossi. 1994. The sourdough microflora.Interactions between lactic acid bacteria and yeasts: metabolism of carbo-hydrates. Appl. Microbiol. Biotechnol. 41:456–460.
25. Gobbetti, M., M. De Angelis, P. Arnaut, P. Tossut, A. Corsetti, and P.Lavermicocca. 1999. Added pentosans in breadmaking: fermentations ofderived pentoses by sourdough lactic acid bacteria. Food Microbiol. 16:409–418.
26. Gobbetti, M., M. De Angelis, A. Corsetti, and R. Di Cagno. 2005. Biochem-istry and physiology of sourdough lactic acid bacteria. Trends Food Sci.Technol. 16:57–69.
27. Gobbetti, M., M. S. Simonetti, J. Rossi, L. Cossignani, A. Corsetti, and P.Damiani. 1994. Free D-amino acid and L-amino acid evolution during sour-dough fermentation and baking. J. Food Sci. 59:881–884.
28. Hammes, W. P., and M. G. Ganzle. 1998. Sourdough breads and relatedproducts, p. 199–216. In B. J. B. Wood (ed.), Microbiology of fermentedfoods, 2nd ed. Blackie Academic and Professional, London, United King-dom.
29. Hammes, W. P., P. Stolz, and M. G. Ganzle. 1996. Metabolism of lactobacilliin traditional sourdoughs. Adv. Food Sci. 18:176–184.
30. Hansen, A., and B. Hansen. 1994. Influence of wheat flour type on theproduction of flavour compounds in wheat sourdoughs. J. Cereal Sci. 19:185–190.
31. Hansen, A., B. Lund, and M. J. Lewis. 1989. Flavour production and acidi-fication of sourdoughs in relation to starter culture and fermentation tem-perature. Food Sci. Technol. 22:145–149.
32. Hansen, A., and P. Schieberle. 2005. Generation of aroma compounds dur-ing sourdough fermentation: applied and fundamental aspects. Trends FoodSci. Technol. 16:85–94.
33. Harris, L. J. 1998. The microbiology of vegetable fermentations, p. 45–72. InB. J. B. Wood (ed.), Microbiology of fermented foods, 2nd ed. BlackieAcademic and Professional, London, United Kingdom.
34. Katina, K., K. Poutanen, and K. Autio. 2004. Influence and interactions ofprocessing conditions and starter culture on formation of acids, volatilecompounds, and amino acids in wheat sourdoughs. Cereal Chem. 81:598–610.
35. Kleerebezem, M., J. Boekhorst, R. van Kranenburg, D. Molenaar, O. P.Kuipers, R. Leer, R. Tarchini, S. A. Peters, H. M. Sandbrink, M. Fiers, W.Stiekema, R. M. K. Lankhorst, P. A. Bron, S. M. Hoffer, M. N. N. Groot, R.Kerkhoven, M. de Vries, B. Ursing, W. M. de Vos, and R. J. Siezen. 2003.Complete genome sequence of Lactobacillus plantarum WCFS1. Proc. Natl.Acad. Sci. USA 100:1990–1995.
36. Korakli, M., M. Pavlovic, M. G. Ganzle, and R. F. Vogel. 2003. Exopolysac-charide and kestose production by Lactobacillus sanfranciscensis LTH2590.Appl. Environ. Microbiol. 69:2073–2079.
37. Korakli, M., E. Schwarz, G. Wolf, and W. P. Hammes. 2000. Production ofmannitol by Lactobacillus sanfranciscensis. Adv. Food Sci. 22:1–4.
38. Lavermicocca, P., F. Valerio, A. Evidente, S. Lazzaroni, A. Corsetti, and M.Gobbetti. 2000. Purification and characterization of novel antifungal com-pounds from the sourdough Lactobacillus plantarum strain 21B. Appl. En-viron. Microbiol. 66:4084–4090.
39. Loponen, J., M. Mikola, K. Katina, T. Sontag-Strohm, and H. Salovaara.2004. Degradation of HMW glutenins during wheat sourdough fermenta-tions. Cereal Chem. 81:87–93.
VOL. 73, 2007 POPULATION DYNAMICS DURING SOURDOUGH FERMENTATION 4749
on Novem
ber 27, 2014 by guesthttp://aem
.asm.org/
Dow
nloaded from
40. Martinez-Anaya, M. A. 1996. Carbohydrate and nitrogen related compo-nents in wheat sourdough processes: a review. Adv. Food Sci. 18:185–200.
41. McDonald, L. C., H. P. Fleming, and H. M. Hassan. 1990. Acid tolerance ofLeuconostoc mesenteroides and Lactobacillus plantarum. Appl. Environ. Mi-crobiol. 56:2120–2124.
42. Meroth, C. B., W. P. Hammes, and C. Hertel. 2004. Characterisation of themicrobiota of rice sourdoughs and description of Lactobacillus spicheri sp.nov. Syst. Appl. Microbiol. 27:151–159.
43. Meroth, C. B., W. P. Hammes, and C. Hertel. 2003. Identification andpopulation dynamics of yeasts in sourdough fermentation processes by PCR-denaturing gradient gel electrophoresis. Appl. Environ. Microbiol. 69:7453–7461.
44. Meroth, C. B., J. Walter, C. Hertel, M. J. Brandt, and W. P. Hammes. 2003.Monitoring the bacterial population dynamics in sourdough fermentationprocesses by using PCR-denaturing gradient gel electrophoresis. Appl. En-viron. Microbiol. 69:475–482.
45. Messens, W., and L. De Vuyst. 2002. Inhibitory substances produced bylactobacilli isolated from sourdoughs—a review. Int. J. Food Microbiol.72:31–43.
46. Muyzer, G., E. C. Dewaal, and A. G. Uitterlinden. 1993. Profiling of complexmicrobial populations by denaturing gradient gel electrophoresis analysis ofpolymerase chain reaction-amplified genes coding for 16S ribosomal RNA.Appl. Environ. Microbiol. 59:695–700.
47. Naser, S. M., F. L. Thompson, B. Hoste, D. Gevers, P. Dawyndt, M. Van-canneyt, and J. Swings. 2005. Application of multilocus sequence analysis(MLSA) for rapid identification of Enterococcus species based on rpoA andpheS genes. Microbiology 151:2141–2150.
48. Nielsen, J., and S. Oliver. 2005. The next wave in metabolome analysis.Trends Biotechnol. 23:544–546.
49. Pitcher, D. G., N. A. Saunders, and R. J. Owen. 1989. Rapid extraction ofbacterial genomic DNA with guanidium thiocyanate. Lett. Appl. Microbiol.8:151–156.
50. Pot, B., P. Vandamme, and K. Kersters. 1994. Analysis of electrophoreticwhole-organism protein fingerprints, p. 493–521. In M. Goodfellow andA. G. O’Donnell (ed.), Chemical methods in prokaryotic systematics. J.Wiley & Sons, Chichester, United Kingdom.
51. Randazzo, C. L., H. Heilig, C. Restuccia, P. Giudici, and C. Caggia. 2005.Bacterial population in traditional sourdough evaluated by molecular meth-ods. J. Appl. Microbiol. 99:251–258.
52. Rocken, W. 1996. Applied aspects of sourdough fermentation. Adv. FoodSci. 18:212–216.
53. Rollan, G., G. L. Lorca, and G. F. de Valdez. 2003. Arginine catabolism andacid tolerance response in Lactobacillus reuteri isolated from sourdough.Food Microbiol. 20:313–319.
54. Rosenquist, H., and A. Hansen. 2000. The microbial stability of two bakerysourdoughs made from conventionally and organically grown rye. Food Mi-crobiol. 17:241–250.
55. Rossi, J. 1996. The yeasts in sourdough. Adv. Food Sci. 18:201–211.56. Scheirlinck, I., R. Van der Meulen, A. Van Schoor, I. Cleenwerck, G. Huys,
P. Vandamme, L. De Vuyst, and M. Vancanneyt. 2007. Lactobacillus namu-rensis sp. nov., isolated from a traditional Belgian sourdough. Int. J. Syst.Evol. Microbiol. 57:223–227.
57. Schnurer, J., and J. Magnusson. 2005. Antifungal lactic acid bacteria asbiopreservatives. Trends Food Sci. Technol. 16:70–78.
58. Spicher, G., and W. Nierle. 1988. Proteolytic activity of sourdough bacteria.Appl. Microbiol. Biotechnol. 28:487–492.
59. Stolz, P., G. Bocker, W. P. Hammes, and R. F. Vogel. 1995. Utilization ofelectron acceptors by lactobacilli isolated from sourdough. 1. Lactobacillussanfrancisco. Food Sci. Technol. 201:91–96.
60. Stolz, P., W. P. Hammes, and R. F. Vogel. 1996. Maltose-phosphorylase andhexokinase activity in lactobacilli from traditionally prepared sourdoughs.Adv. Food Sci. 18:1–6.
61. Stolz, P., R. F. Vogel, and W. P. Hammes. 1995. Utilization of electronacceptors by lactobacilli isolated from sourdough. 2. Lactobacillus pontis, L.reuteri, L. amylovorus, and L. fermentum. Z. Lebensm. Unters. Forsch. 201:402–410.
62. Thompson, F. L., B. Hoste, K. Vandemeulebroecke, and J. Swings. 2001.Genomic diversity amongst Vibrio isolates from different sources determinedby fluorescent amplified fragment length polymorphism. Syst. Appl. Micro-biol. 24:520–538.
63. Tieking, M., and M. G. Ganzle. 2005. Exopolysaccharides from cereal-asso-ciated lactobacilli. Trends Food Sci. Technol. 16:79–84.
64. Tieking, M., M. Korakli, M. A. Ehrmann, M. G. Ganzle, and R. F. Vogel.2003. In situ production of exopolysaccharides during sourdough fermenta-tion by cereal and intestinal isolates of lactic acid bacteria. Appl. Environ.Microbiol. 69:945–952.
65. Vancanneyt, M., S. M. Naser, K. Engelbeen, M. De Wachter, R. Van derMeulen, I. Cleenwerck, B. Hoste, L. De Vuyst, and J. Swings. 2006. Reclas-sification of Lactobacillus brevis strains LMG 11494 and LMG 11984 asLactobacillus parabrevis sp. nov. Int. J. Syst. Evol. Microbiol. 56:1553–1557.
66. Van der Meulen, R., T. Adriany, K. Verbrugghe, and L. De Vuyst. 2006.Kinetic analysis of bifidobacterial metabolism reveals a minor role for suc-cinic acid in the regeneration of NAD� through its growth-associated pro-duction. Appl. Environ. Microbiol. 72:5204–5210.
67. Veiga-da-Cunha, M., H. Santos, and E. Van Schaftingen. 1993. Pathway andregulation of erythritol formation in Leuconostoc oenos. J. Bacteriol. 175:3941–3948.
68. Vermeulen, N., J. Kretzer, H. Machalitza, R. F. Vogel, and M. G. Ganzle.2006. Influence of redox reactions catalysed by homo- and heterofermenta-tive lactobacilli on gluten in wheat sourdoughs. J. Cereal Sci. 43:137–143.
69. Vermeulen, N., M. Pavlovic, M. A. Ehrmann, M. G. Ganzle, and R. F. Vogel.2005. Functional characterization of the proteolytic system of Lactobacillussanfranciscensis DSM 20451T during growth in sourdough. Appl. Environ.Microbiol. 71:6260–6266.
70. Versalovic, J., M. Schneider, F. J. De Bruijn, and J. R. Lupski. 1994.Genomic fingerprinting of bacteria using repetitive sequence-based polymer-ase chain reaction. Methods Mol. Cell. Biol. 5:25–40.
71. Wick, M., P. Stolz, G. Bocker, and J. M. Lebault. 2003. Influence of severalprocess parameters on sourdough fermentation. Acta Biotechnol. 23:51–61.
72. Wisselink, H. W., R. A. Weusthuis, G. Eggink, J. Hugenholtz, and G. J.Grobben. 2002. Mannitol production by lactic acid bacteria: a review. Int.Dairy J. 12:151–161.
73. Zaunmuller, T., M. Eichert, H. Richter, and G. Unden. 2006. Variations inthe energy metabolism of biotechnologically relevant heterofermentativelactic acid bacteria during growth on sugars and organic acids. Appl. Micro-biol. Biotechnol. 72:421–429.
4750 VAN DER MEULEN ET AL. APPL. ENVIRON. MICROBIOL.
on Novem
ber 27, 2014 by guesthttp://aem
.asm.org/
Dow
nloaded from
Copyright © 2022 FDOKUMEN