SPECIAL EDUCATION: STRUCTURAL OVERVIEW AND STUDENT DEMOGRAPHICS
Upload
unitedstatesgeologicalsurveyCategory
view
2download
0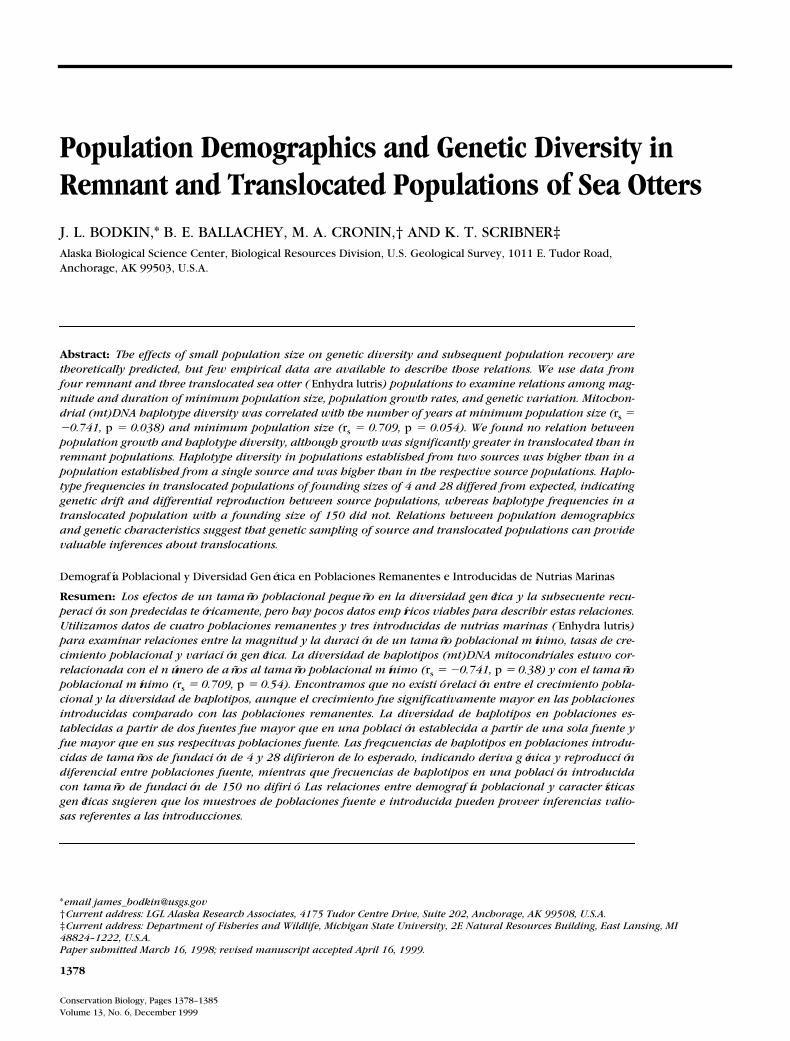
1378
Conservation Biology, Pages 1378–1385Volume 13, No. 6, December 1999
*
email [email protected]
†
Current address: LGL Alaska Research Associates, 4175 Tudor Centre Drive, Suite 202, Anchorage, AK 99508, U.S.A.
‡
Current address: Department of Fisheries and Wildlife, Michigan State University, 2E Natural Resources Building, East Lansing, MI48824–1222, U.S.A.Paper submitted March 16, 1998; revised manuscript accepted April 16, 1999.
Population Demographics and Genetic Diversity in Remnant and Translocated Populations of Sea Otters
J. L. BODKIN,* B. E. BALLACHEY, M. A. CRONIN,† AND K. T. SCRIBNER‡
Alaska Biological Science Center, Biological Resources Division, U.S. Geological Survey, 1011 E. Tudor Road, Anchorage, AK 99503, U.S.A.
Abstract:
The effects of small population size on genetic diversity and subsequent population recovery aretheoretically predicted, but few empirical data are available to describe those relations. We use data fromfour remnant and three translocated sea otter (
Enhydra lutris
) populations to examine relations among mag-nitude and duration of minimum population size, population growth rates, and genetic variation. Mitochon-drial (mt)DNA haplotype diversity was correlated with the number of years at minimum population size (
r
s
52
0.741,
p
5
0.038) and minimum population size (
r
s
5
0.709,
p
5
0.054). We found no relation betweenpopulation growth and haplotype diversity, although growth was significantly greater in translocated than inremnant populations. Haplotype diversity in populations established from two sources was higher than in apopulation established from a single source and was higher than in the respective source populations. Haplo-type frequencies in translocated populations of founding sizes of 4 and 28 differed from expected, indicatinggenetic drift and differential reproduction between source populations, whereas haplotype frequencies in atranslocated population with a founding size of 150 did not. Relations between population demographicsand genetic characteristics suggest that genetic sampling of source and translocated populations can providevaluable inferences about translocations.
Demografía Poblacional y Diversidad Genética en Poblaciones Remanentes e Introducidas de Nutrias Marinas
Resumen:
Los efectos de un tamaño poblacional pequeño en la diversidad genética y la subsecuente recu-peración son predecidas teóricamente, pero hay pocos datos empíricos viables para describir estas relaciones.Utilizamos datos de cuatro poblaciones remanentes y tres introducidas de nutrias marinas (
Enhydra lutris
)para examinar relaciones entre la magnitud y la duración de un tamaño poblacional mínimo, tasas de cre-cimiento poblacional y variación genética. La diversidad de haplotipos (mt)DNA mitocondriales estuvo cor-relacionada con el número de años al tamaño poblacional mínimo (
r
s
5 2
0.741,
p
5
0.38) y con el tamañopoblacional mínimo (
r
s
5
0.709,
p
5
0.54). Encontramos que no existió relación entre el crecimiento pobla-cional y la diversidad de haplotipos, aunque el crecimiento fue significativamente mayor en las poblacionesintroducidas comparado con las poblaciones remanentes. La diversidad de haplotipos en poblaciones es-tablecidas a partir de dos fuentes fue mayor que en una población establecida a partir de una sola fuente yfue mayor que en sus respecitvas poblaciones fuente. Las freqcuencias de haplotipos en poblaciones introdu-cidas de tamaños de fundación de 4 y 28 difirieron de lo esperado, indicando deriva génica y reproduccióndiferencial entre poblaciones fuente, mientras que frecuencias de haplotipos en una población introducidacon tamaño de fundación de 150 no difirió. Las relaciones entre demografía poblacional y característicasgenéticas sugieren que los muestroes de poblaciones fuente e introducida pueden proveer inferencias valio-
sas referentes a las introducciones.
Conservation BiologyVolume 13, No. 6, December 1999
Bodkin et al. Sea Otter Populations and Genetic Diversity
1379
Introduction
A fundamental concern in resource conservation andmanagement is the loss of biological diversity, expressedas species diversity at the ecosystem level or genetic di-versity at the species level (i.e., declines in genetic diver-sity or increasing interpopulation variance in gene fre-quencies; Shaffer 1981; Lande 1988; Leberg 1990). Acommon approach to conserving species diversity andmitigating declines in abundance is the establishment oraugmentation of populations through translocation (Grif-fith et al. 1989; Leberg 1993; Wolf et al. 1996).
Strategies regarding the selection of source popula-tions, numbers of individuals, and habitat requirementshave been suggested (Shaffer 1981; Leberg 1990; Wolfet al. 1996). But translocations frequently result in smallfounding population sizes (i.e., population bottlenecks;Griffith et al. 1989; Wolf et al. 1996), which, if sustainedover several generations, may result in reduced geneticvariation (Nei et al. 1975; Lande & Barrowclough 1987;Frankham 1996). The potential effects of reduced popu-lation size and subsequent inbreeding include reducedfecundity and survival, which have been observed incaptive (Ralls et al. 1979; Ballou & Ralls 1982; Ralls et al.1988) and wild (Westemeier et al. 1998) populations.
The ability of wild populations to recover from popu-lation bottlenecks may be impaired by the effects of re-duced genetic variation (Wayne 1995), although thisgenerality has been questioned (Caro & Laurenson1994). Westemeier et al. (1998) documented reduced fe-cundity and genetic diversity following a long-term pop-ulation decline in the Greater Prairie Chicken (
Tympa-nuchus cupido pinnatus
). Alternatively, high geneticdiversity was maintained during a brief bottleneck in the
greater one-horned rhinoceros (
Rhinocerous unicornis
;Dinerstein & McCracken 1990). Despite numerous theo-retical treatments of the effects of bottlenecks on ge-netic variation and fitness (e.g., Lande 1994; Mills &Smouse 1994; Frankham 1995), few empirical examplesfrom natural populations are available that have quanti-fied relations between genetic diversity and populationdemography or that have evaluated the effects of trans-locations on genetic diversity and drift.
Mitochondrial DNA (mtDNA) is a useful genetic markerbecause of its relatively high levels of variation among in-dividuals, both within and among populations. As such, ithas been particularly effective in elucidating patterns ofintraspecific population structuring (Avise et al. 1987;Moritz 1994; Avise 1995). Uniparental (matrilineal) andhaploid transmission mean that mitochondrial effectivepopulation size is considerably smaller than that expectedfor nuclear genes, increasing sensitivity to genetic drift(Moritz 1994). These characteristics make mtDNA partic-ularly appropriate for tracing recent evolutionary history,including colonization or translocation events and popu-lation bottlenecks (Wilson et al. 1985).
Sea otters (
Enhydra lutris
) provide an excellent oppor-tunity to study relations between population demographicsand genetics in a large, long-lived mammal. The near extir-pation of sea otters by fur hunters in the nineteenth cen-tury left 11 small, isolated populations that have persisted(Kenyon 1969). In addition, three translocations of sea ot-ters resulted in viable populations (Riedman & Estes 1990;Fig. 1). Because remnant and translocated populationshave remained reproductively isolated during recovery, wewere able to examine the effects of small populationsize, resulting from either overharvest or translocation,on genetic variation and population demographics. Ge-
Figure 1. Locations of remnant and translocated sea otter ( Enhydra lutris) populations sampled.
1380
Sea Otter Populations and Genetic Diversity Bodkin et al.
Conservation BiologyVolume 13, No. 6, December 1999
netic markers were further used to characterize the mag-nitude of potential founder events and genetic drift thatmay have resulted from differential survival or reproduc-tive success of females used in translocations from multi-ple sources.
Studies using allozymes (Rotterman 1992; Lidicker &McCollum 1997), mtDNA (Sanchez 1992; Cronin et al.1996), and multilocus minisatellites (Scribner et al. 1997)found geographically separate sea otter populations tobe differentiated genetically, although there was littleevidence of phylogeographic structuring (Scribner et al.1997). Large differences among remnant populations innuclear and mtDNA gene frequency reflect the lack ofgene flow since population reductions or drift in genefrequencies due to population bottlenecks. Remnantpopulations separated by large geographic distances fre-quently shared haplotypes, suggesting recent commonancestry and historic gene flow (Cronin et al. 1996). Lev-els of genetic diversity varied greatly among remnantpopulations but apparently were not related to contem-porary population sizes (Scribner et al. 1997).
The end of the sea otter fur trade was indicated by har-vests of
,
48 per year from 1906 to 1910 (Lensink 1962;Kenyon 1969). Although accurate estimates of size are not
available for all remnant populations, anecdotal informa-tion and surveys suggest that few (
,
100) individuals per lo-cation remained at the time they were legally protected in1911 (Lensink 1962; Kenyon 1969). Surveys of abundancewere not generally undertaken until populations becameconspicuous, usually consisting of several hundred or moreindividuals. Moreover, remnant populations displayed dif-ferent demographics during their recovery (Fig. 2).
In the 1960s and 1970s, translocations of otters fromAmchitka Island and Prince William Sound, Alaska(source populations), to unoccupied habitat in south-east Alaska, British Columbia, and Washington were con-ducted to aid the species’ recovery (Jameson et al. 1982;Fig. 3). Accurate data are available on numbers of ani-mals moved and on the timing and rates of recovery oftranslocated populations (Bigg & MacAskie 1978; Jame-son et al. 1982; MacAskie 1987; Estes et al. 1989; Estes1990; Bodkin et al. 1994; Agler & Kendall 1995).
Our objectives were to test for relations among ge-netic diversity and measures of population demographiccharacteristics: time at minimum population size, mini-mum population size, and population growth rates. Weused mtDNA haplotype frequencies to evaluate possiblegenetic drift and differential contributions by females of
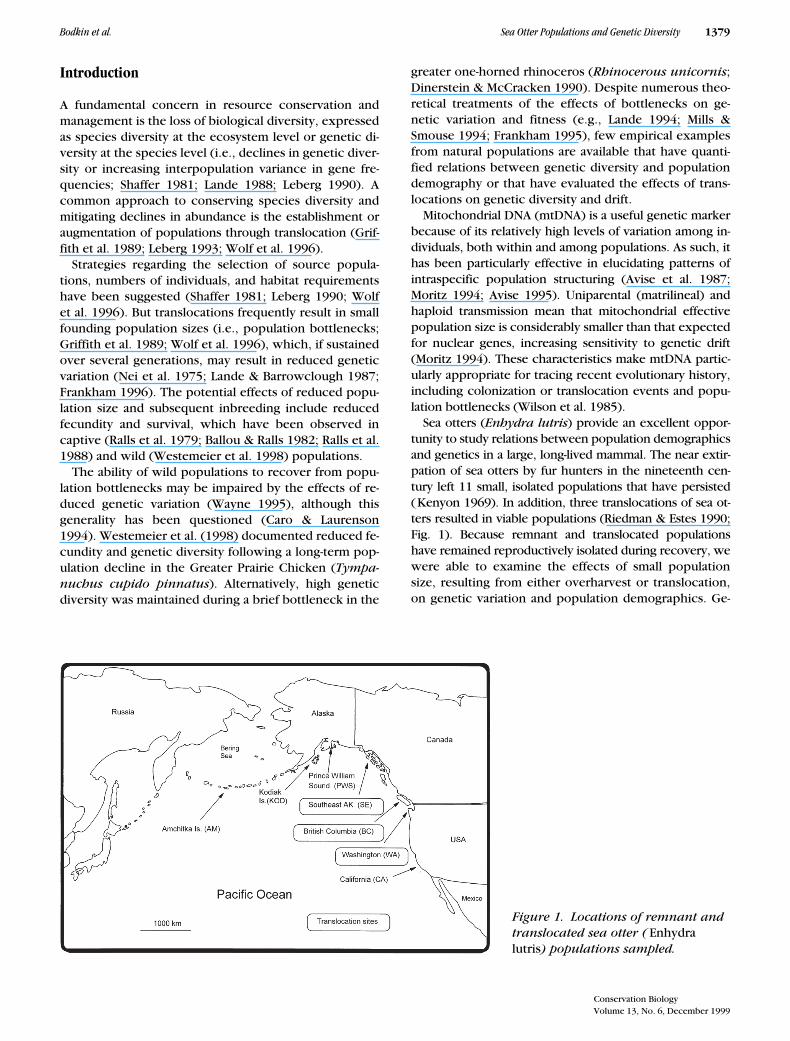
Figure 2. Growth curves and haplo-type (h9) diversities for four remnant sea otter populations, Amchitka (AM), California (CA), Kodiak (KOD), and Prince William Sound (PWS), and three translocated sea otter populations, British Columbia (BC), Southeast Alaska (SE), and Washington (WA), based on post-release surveys. Open symbols indi-cate data used in calculating growth rates. Sources for population data are AM: Dufresne (1931 Sea otter in Aleu-tian bird reservation Memorandum, Alaska Department of Fish and Game, Juneau), Kenyon (1969), Estes (1990); CA: Bryant (1915), Bool-ootian (1961), Estes and Jameson (1983), Wendell et al. (1986), Estes et al. (1994); KOD: Lensink (1962), Si-mon-Jackson et al. (1986), U.S. Fish and Wildlife Service (1011 E. Tudor Road, Anchorage, Alaska); PWS: Len-sink (1962), Pitcher (1975), Irons et al. (1988); BC: Bigg and MacAskie (1978), MacAskie (1987); SE: Jame-son et al. (1982), Agler and Kendall (1995); WA: Jameson et al. (1982), Bodkin et al. (1994).
Conservation BiologyVolume 13, No. 6, December 1999
Bodkin et al. Sea Otter Populations and Genetic Diversity
1381
different sources in translocations. We compared popu-lation growth rates between source and translocatedpopulations. We present our findings relative to conser-vation efforts for other species that may be undergoingdeclines and where translocations may be considered amanagement option.
Methods
Study Areas
We obtained tissue samples and population data fromremnant populations at Amchitka Island (AM), the Ko-diak (KOD) Archipelago, and Prince William Sound(PWS), Alaska, and California (CA), and from translo-cated populations in British Columbia (BC), Washington(WA), and southeast Alaska (SE) (Figs. 1 & 3). The 1969–1972 BC translocation consisted of 29 sea otters fromAM and 60 from PWS; the 1965–1969 SE translocationconsisted of 369 otters from AM and 43 from PWS; the1969–1970 WA translocation consisted of 43 otters fromAM ( Jameson et al. 1982). Founding sizes for translo-cated populations are from Estes et al. (1989) and werecalculated by extrapolating growth regressions back intime to 1 year after translocation.
Demographic Analyses
We used published and unpublished counts or estimatesto calculate contemporary growth rates for each remnantand translocated population. In calculating population-specific growth rates, we consistently used either actualcounts or estimates of abundance. Annual growth rates
(
r
) were calculated by regressing the natural logs of sur-vey counts or population size estimates (log
n
(
x
)) overtime. For the AM population we used survey data from1931 to 1943 for estimating the growth rate becausegrowth likely declined as carrying capacity was initiallyreached after 1943 (Estes 1990). Because of the anoma-lous growth characteristics after 1976 in CA, we usedonly abundance estimates from 1914 to 1976 to calculatea growth rate. From this, we extrapolated back from theearliest estimate or count of population size to a point intime when the population equaled 20 (assumed mini-mum population size) or to the year 1890 (assumedpoint in time of minimum population size, based on har-vest records; Lensink 1962). We assumed a minimumsize of 20 for all remnant populations based on data fromCA, where 32 animals were present in 1914.
We tested for relations of three population variables—years at minimum number, minimum number, and pop-ulation growth rate—to haplotype diversity among theseven populations we sampled with Spearman’s rankcorrelation. We examined the sensitivity of our correla-tions by varying the minimum population size from 10to 40 (holding year at minimum constant) and varyingthe assumed year at minimum from 1870 to 1910 (hold-ing minimum number constant) in a sensitivity analysis.Years at the minimum population size were the numberof years between 1890 and the year in which we esti-mated that population size equaled 20.
Genetic Analyses
Muscle or blood samples were obtained from the threetranslocated sea otter populations and the remnant(source) populations from which they were derived.
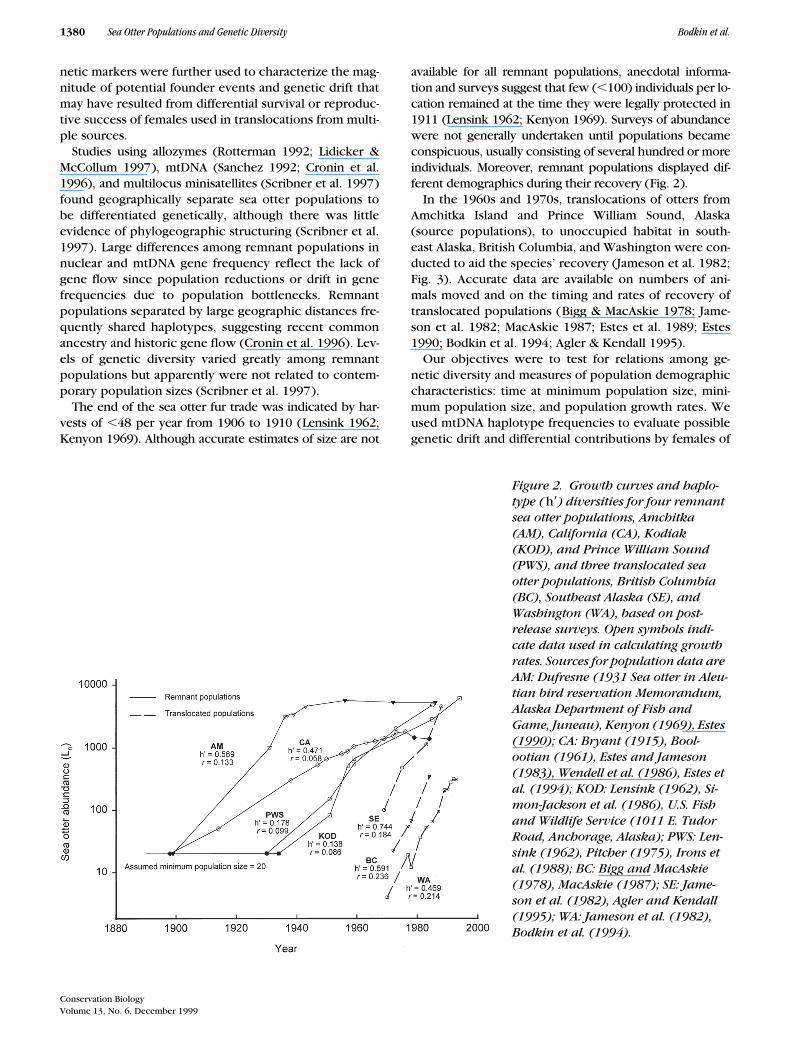
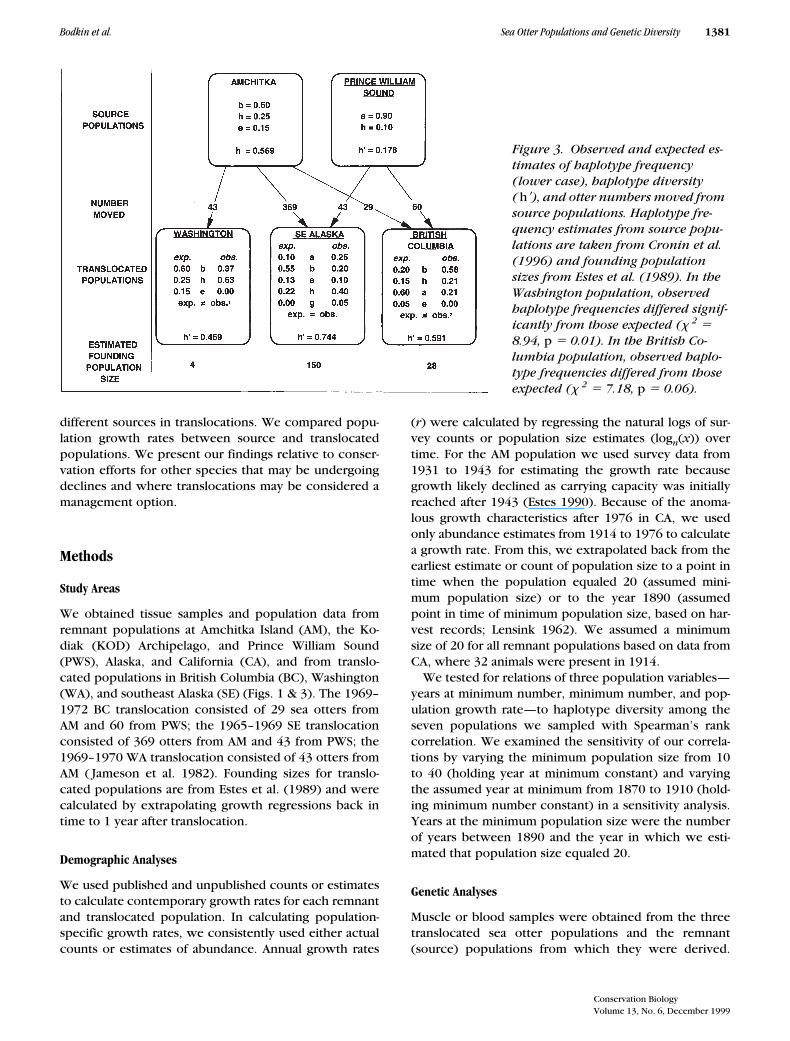
Figure 3. Observed and expected es-timates of haplotype frequency (lower case), haplotype diversity ( h9), and otter numbers moved from source populations. Haplotype fre-quency estimates from source popu-lations are taken from Cronin et al. (1996) and founding population sizes from Estes et al. (1989). In the Washington population, observed haplotype frequencies differed signif-icantly from those expected (x 2 5 8.94, p 5 0.01). In the British Co-lumbia population, observed haplo-type frequencies differed from those expected (x 2 5 7.18, p 5 0.06).
1382
Sea Otter Populations and Genetic Diversity Bodkin et al.
Conservation BiologyVolume 13, No. 6, December 1999
Source populations were AM (
n
5
20) and PWS (
n
5
31) (Fig. 3), and translocated populations were BC (
n
5
19), SE (
n
5
20), and WA (
n
5
24). We obtained tissuesfrom two additional remnant populations, CA (
n
5
20)and KOD (
n
5
14) (Fig. 1), for which historical surveydata are available.
Genomic DNA was extracted with standard methodsinvolving either SDS (sodium diodecyl sulfate), protein-ase-k digestion, and phenol-chloroform extraction (Sam-brook et al. 1989) for muscle, or phenol-chloroform-methylene chloride extraction for blood (Cronin et al.1994). Polymerase chain reaction (PCR) was used to am-plify four segments of mtDNA by methods described inCronin et al. (1996). To identify haplotypes, restrictionenzymes were used to digest each of the four segmentsof mtDNA (ND1, 19 enzymes; ND3/4, 18 enzymes; ND5/6,13 enzymes; 12S-16S, 10 enzymes) from each sampledpopulation (Cronin et al. 1996). Haplotypes were de-fined from composite restriction-fragment patterns forenzymes showing variable fragment patterns (Lansmanet al. 1981). Remnant population haplotypes are fromCronin et al. (1996).
We evaluated potential genetic drift and differential fe-male reproductive contributions between source popu-lations used in translocations by comparing observed toexpected haplotype frequencies. We estimated expectedfrequencies in translocated populations using propor-tional contributions of source populations from translo-cation records and current haplotype frequencies fromsource populations. Haplotype diversities (
h
9
) were cal-culated from the number of haplotypes and their fre-quency in each population (Nei 1987).
Results
Demographic Analyses
We used estimated founding population sizes for translo-cated sea otter populations of 28 (BC), 150 (SE), and 4(WA) from Estes et al. (1989; Fig. 2). Using contempo-rary growth rates (Fig. 2) and extrapolating back in timefrom the first survey date, we estimated that the fourremnant populations were at the assumed minimumpopulation size of 20 in 1898 (CA), 1899 (AM), 1930(PWS), and 1934 (KOD), respectively. Estimated popula-tion growth rates were significantly higher in translo-cated populations (
5
0.21, range
5
0.18 - 0.24) com-pared to remnant populations (
5
0.09, range
5
0.06 -0.13) (students
t
5
2
5.258,
p
5
0.003; Fig. 2).
Genetic Analyses
Haplotype frequencies in translocated populations dif-fered significantly from expected in WA (
x
2
5
8.94,
p
5
0.01) and were marginally significant in BC (
x
2
5
7.18,
x–
x–
p
5
0.06), but were not different in SE (
x
2
5
7.09,
p
5
0.13) (Fig. 3). One haplotype (
g
) found in SE was notidentified in the source populations (AM or PWS) or inany other sampled population. Because the WA popula-tion was established from a single source (AM) and esti-mated founding population size was low (4), changes inhaplotype frequency may be attributed to genetic drift.Discrepancies between observed and expected haplo-type frequencies in the translocated BC population arelikely due to disproportional contributions of the twosource populations. For example, although PWS contrib-uted twice the number of individuals to the BC popula-tion as did AM, the
b
haplotype, documented only in theAM source population, was observed in much greaterfrequency than expected, suggesting that AM femalescontributed disproportionally to population growth fol-lowing translocations.
Haplotype diversities in remnant populations rangedfrom 0.138 at KOD to 0.569 at AM (Fig. 2) and averaged0.338 (Cronin et al. 1996). Haplotype diversities in trans-located populations ranged from 0.469 at WA to 0.744 atSE (Fig. 3) and averaged 0.601. Haplotype diversity gen-erally was higher in translocated populations, althoughthe difference between mean values from remnant andtranslocated populations was not significant (
t
5
2.57,
p
5
0.12); however, power (0.24) of the test was low.The two translocated populations (SE and BC)
founded from multiple source populations had haplo-type diversities that exceeded those of both of theirsource populations (AM or PWS; Fig. 3). The higher hap-lotype diversities in populations with two sources andthe presence of haplotypes from each source indicatereproductive success by females from each source. Hap-lotype diversity in the WA population (0.469), foundingsize of four, was 18% lower than in the single-sourcepopulation (AM, 0.569) from which it was founded.Among the remnant sea otter populations, haplotype di-versity was relatively low at KOD and PWS, where popu-lations remained at minimum levels for many genera-tions (Fig. 4). Haplotype diversity was higher at AM andCA, where duration at minimum population size was es-timated at about one generation (8–9 years).
Correlation Analyses
Haplotype diversity was negatively correlated with theamount of time a population spent at the assumed mini-mum number (
r
s
5
2
0.741;
p
5
0.038) and positivelycorrelated with the minimum population size (
rs 50.709, p 5 0.054). There was no significant relation be-tween estimated population growth rates and haplotypediversity (rs 5 0.53, p 5 0.18).
In the sensitivity analysis, both variables remained sig-nificantly correlated with h9 at an assumed minimum pop-ulation size of 10 (years at minimum, rs 5 20.81, p 50.025; minimum number, rs 5 0.741, p 5 0.038). At an

Conservation BiologyVolume 13, No. 6, December 1999
Bodkin et al. Sea Otter Populations and Genetic Diversity 1383
assumed minimum population size of 40, only years atminimum remained correlated with h9 (rs 5 20.778,p 5 0.025). At an assumed year at minimum of 1870(minimum size of 20), both variables remained signifi-cantly correlated with h9 (years at minimum, rs 520.741, p 5 0.038; minimum number, rs 5 0.709, p 50.054). At an assumed year at minimum of 1910, bothvariables remained correlated with h9 (years at mini-mum, rs 5 20.802, p 5 0.025; minimum number, rs 50.775, p 5 0.025).
Discussion
The effects of small population sizes on genetic diversityand the subsequent effects of reduced genetic diversityon fitness in wild populations have been poorly docu-mented. Our empirical results provide support for theo-retical work that suggests that persistent population bot-tlenecks will result in reduced genetic variation. Althoughwe found reduced genetic variation to be correlatedwith both the time a population spends at minimumpopulation size and the minimum population size, wedetected no apparent relation between genetic diversityand population growth rates.
The lack of data on the history of remnant populationsrequired us to make assumptions about the year whenremnant populations reached their minimum numberand about the number of individuals at that time. Yearsat minimum remained negatively correlated with ge-netic diversity in all four sensitivity scenarios, whereasminimum number remained positively correlated withdiversity in three of the four scenarios. We acknowledgethat site-specific histories of exploitation and recovery
likely varied among remnant populations. Given our re-sults, however, haplotype diversity is correlated withand may be used in a comparative sense as an indicatorof population bottlenecks.
Our results support previous theoretical work regard-ing the relative effects of magnitude and duration of pop-ulation bottlenecks on genetic diversity (Nei et al. 1975;Ralls et al. 1983; Lande & Barrowclough 1987; Leberg1990; Leberg 1992). In two translocated sea otter popula-tions with estimated founding sizes of 28 (BC) and 4(WA), we observed high growth rates (r 5 0.232 and0.184, respectively), and high haplotype diversities (0.469and 0.591, respectively). Moreover, population growthappeared to occur within a few years following transloca-tion at all three sites. The two populations exhibiting theslowest growth rates (0.086, KOD and 0.099, PWS) arealso the populations that experienced the longest time atminimum population size and the lowest genetic diver-sity (h9 5 0.138 and 0.178, respectively). In contrast, AMand CA remained at minimum population sizes for briefperiods (,10 years) and displayed high genetic diversity(h9 5 0.569 and 0.467, respectively) but still demon-strated relatively slow growth rates (0.133 and 0.058).Because all remnant populations likely had small found-ing population sizes, but only KOD and PWS had long pe-riods at minimum population sizes, our results indicatethat reduced haplotype diversity is apparently relatedmost to bottleneck duration.
Monitoring gene frequencies may help identify repro-ductive contributions from translocations of more thanone source. Differences in observed haplotype frequen-cies can result from genetic drift, differential survival, orreproductive success among source populations. Ex-pected haplotype frequencies were estimated based on
Figure 4. Plot of years at estimated minimum population size (x-axis) and estimated minimum population size (z-axis) against haplotype diver-sity ( y-axis). Both minimum popula-tion size and years at minimum population size were significantly correlated with haplotype diversity (rs 5 0.709 and 20.741, respec-tively). Abbreviations are explained in Fig. 2 legend.
1384 Sea Otter Populations and Genetic Diversity Bodkin et al.
Conservation BiologyVolume 13, No. 6, December 1999
frequencies in source populations and the number ofsea otters from different sources. Observed haplotypefrequencies indicate that, in both multi-source transloca-tions, both sources contributed to the success of thetranslocation. When founding size was small (BC), how-ever, contributions were apparently disproportional,whereas when founding size was large (SE), contribu-tions appeared proportional (Fig. 3).
Haplotype diversity provides an additional measure ofthe success of translocations. We observed a lower hap-lotype diversity in the single-source translocation andhigher haplotype diversities in two-source transloca-tions. Although source populations were geographicallydisjunct, genetically distinct (Scribner et al. 1997), andpresumably reproductively isolated, we found no influ-ence of outbreeding depression on translocation successor population growth rates. Although we did not detecta relation between haplotype diversity and fitness, asmeasured by population growth, significant differencesin growth were detected between remnant and translo-cated populations.
Understanding factors affecting growth is important inconservation and management, particularly becausegrowth rates affect population bottlenecks. The cause(s)of the differences in growth rates between remnant andtranslocated populations are unknown. The high growthrates observed in translocated populations likely reflectabundant prey availability. In the absence of sea otters,many nearshore invertebrate prey species respondthrough increased abundance and size (Ebert 1968; Van-Blaricom & Estes 1988; Riedman & Estes 1990; Estes &Duggins 1995), providing conditions for optimum growthfollowing translocation. This supports conclusions ofothers (Griffith et al. 1989; Leberg 1993; Wolf et al.1996) who emphasized that appropriate habitat is an im-portant determinant of population growth rates follow-ing bottlenecks.
The cause(s) of the lower growth rates we observed inremnant populations are unclear. Kenyon (1969) foundmost reported harvests after 1911 to be from the KODto PWS region, and Lensink (1962) reports the illegaltake of sea otter pelts from KOD and PWS in the 1920sand 1930s. Assuming small remnant population sizes, ad-ditional harvest mortality would result in reduced recov-ery rates. The low growth rate in CA, particularly after1976 (Wendell et al. 1986; Estes et al. 1994), has been at-tributed to incidental mortality in net fisheries. It ap-pears likely that continued human-related mortality con-tributed to the reduced growth rates observed inremnant populations, despite the legal protection ex-tended to the sea otter in 1911, thereby extending boththe magnitude and duration of bottlenecks.
Translocations are a management tool to aid in recov-ery and restoration of reduced or extirpated popula-tions. Such efforts may be improved by concurrent mon-itoring of genetic markers and population growth
characteristics. Our results indicate that haplotype diver-sity in translocated populations may be maintained orenhanced through several mechanisms, including (1)minimizing the magnitude and duration of populationbottlenecks, (2) using large numbers of individuals frommultiple sources, (3) reducing post-translocation mortal-ity, and (4) selecting optimum habitat. Genetic datafrom source and translocated populations should allowfurther inferences about relations between genetic char-acterizations and population demographics.
Acknowledgments
This work was supported by the Alaska Biological Sci-ence Center, Biological Resources Division, the U.S.Geological Survey, the Exxon Valdez Oil Spill TrusteeCouncil, and LGL Alaska Research Associates. We thankG. Beck, D. L. Bruden, A. M. Doroff, J. A. Estes, M. E. Fe-dorko, R. J. Jameson, C. McCormick, K. D. Modla, D. H.Monson, T. Smith, J. Watson, and the Department ofFisheries and Oceans, Canada, for their contributions inobtaining samples. J. A. Estes, L. Holland-Bartels, P. L.Leberg, and K. Ralls provided critical reviews of themanuscript.
Literature Cited
Agler, B. A., and S. J. Kendall. 1995. Abundance and distribution of seaotters in southcentral and southeast Alaska. U.S. Fish and WildlifeService, Anchorage, Alaska.
Avise, J. C. 1995. Mitochondrial DNA polymorphism and a connectionbetween genetics and demography of relevance to conservation.Conservation Biology 9:686–690.
Avise, J. C., J. Arnold, R. M. Ball, E. Bermingham, T. Lamb, J. E. Neigel,C. A. Reeb, and N. C. Saunders. 1987. Intra-specific phylogeogra-phy: the mitochondrial DNA bridge between population geneticsand systematics. Annual Review of Ecology and Systematics 18:489–522.
Ballou, J., and K. Ralls. 1982. Inbreeding and juvenile mortality in smallpopulations of ungulates: a detailed analysis. Biological Conserva-tion 24:239–272.
Bigg, M. A., and I. B. MacAskie. 1978. Sea otters re-established in Brit-ish Columbia. Journal of Mammalogy 59:874–876.
Bodkin, J. L., R. J. Jameson, and J. A. Estes. 1994. Sea otters in theNorth Pacific Ocean. Pages 17–20 in E. T. LaRoe III, G. S. Farris, C.E. Puckett, and P. D. Doran, editors. Our living resources 1994: areport to the nation on the distribution, abundance and health ofU.S. plants, animals and ecosystems. National Biological Service,Washington, D.C.
Boolootian, R. A. 1961. The distribution of the California sea otter. Cal-ifornia Fish and Game 47:287–292.
Bryant, H. C. 1915. Sea otters near Point Sur. California Fish and Game1:134–135.
Caro, T. M., and K. M. Laurenson. 1994. Ecological and genetic factorsin conservation: a cautionary tale. Science 263:386–485.
Cronin, M. A., S. Hills, E. W. Born, and J. C. Patton. 1994. Mitochon-drial DNA variation in Atlantic and Pacific walruses. Canadian Jour-nal of Zoology 72:1035–1043.
Cronin, M. A., J. L. Bodkin, B. E. Ballachey, J. A. Estes, and J. C. Patton.1996. Mitochondrial DNA variation among subspecies and popula-

Conservation BiologyVolume 13, No. 6, December 1999
Bodkin et al. Sea Otter Populations and Genetic Diversity 1385
tions of sea otters (Enhydra lutris). Journal of Mammalogy 77:546–557.
Dinerstein, E., and G. F. McCracken. 1990. Endangered greater one-horned rhinoceros carry high levels of genetic variation. Conserva-tion Biology 4:417–422.
Ebert, E. E. 1968. A food habits study of the southern sea otter, Enhy-dra lutris nereis. California Fish and Game 54:33–42.
Estes, J. A. 1990. Growth and equilibrium in sea otter populations.Journal of Animal Ecology 59:385–401.
Estes, J. A., and D. O. Duggins. 1995. Sea otters and kelp forests inAlaska: generality and variation in a community ecological para-digm. Ecological Monographs 65:75–100.
Estes, J. A., and R. J. Jameson. 1983. Summary of available populationinformation on California sea otters. Technical paper 83–11. Miner-als Management Service, Pacific outer continental shelf region, LosAngeles.
Estes, J. A., D. O. Duggins, and G. B. Rathbun. 1989. The ecology of ex-tinctions in kelp forests. Conservation Biology 3:252–264.
Estes, J. A., R. J. Jameson, J. L. Bodkin, and D. R. Carlson. 1994. Statusand trends of the California sea otter population. Pages 110–112 inE. T. Large III, G. S. Farris, C. E. Puckett, and P. D. Doran, editors.Our living resources 1994: a report to the nation on the distribu-tion, abundance and health of U.S. plants, animals and ecosystems.National Biological Service, Washington, D.C.
Frankham, R. 1995. Inbreeding and extinction: a threshold effect. Con-servation Biology 9:792–799.
Frankham, R. 1996. Relationship of genetic variation to population sizein wildlife. Conservation Biology 10:1500–1508.
Griffith, B. J., J. M. Scott, J. W. Carpenter, and C. Reed. 1989. Translo-cation as a species conservation tool. Science 245:477–480.
Irons, D. B., D. R. Nysewander, and J. L. Trapp. 1988. Prince WilliamSound sea otter distribution in respect to population growth andhabitat type. U.S. Fish and Wildlife Service, Anchorage, Alaska.
Jameson, R. J., K. W. Kenyon, A. M. Johnson, and H. M. Wight. 1982.History and status of translocated sea otter populations in NorthAmerica. Wildlife Society Bulletin 10:100–107.
Kenyon, K. W. 1969. The sea otter in the north Pacific Ocean. NorthAmerican Fauna 68, U.S. Department of Interior, Washington, D.C.
Lande, R. 1988. Genetics and demography in biological conservation.Science 241:1455–1460.
Lande, R. 1994. Risk of population extinction from fixation of new del-eterious mutations. Evolution 48:1460–1469.
Lande, R., and G. F. Barrowclough. 1987. Effective population size, ge-netic variation, and their use in population management. Pages 87–124 in M. E. Soulé, editor. Viable populations for conservation.Cambridge University Press, Cambridge, United Kingdom.
Lansman, R. A., R. O. Shade, J. F. Shapira, and J. C. Avise. 1981. Theuse of restriction endonucleases to measure mitochondrial DNA se-quence relatedness in natural populations. Journal of MolecularEvolution 17:214–226.
Leberg, P. L. 1990. Genetic considerations in the design of introduc-tion programs. Transactions of the North American Wildlife andNatural Resource Conference 55:609–619.
Leberg, P. L. 1992. Effects of population bottlenecks on genetic diversityas measured by allozyme electrophoresis. Evolution 46:477–494.
Leberg, P. L. 1993. Strategies of population reintroduction: effects ofgenetic variability on population growth and size. Conservation Bi-ology 7:194–199.
Lensink, C. J. 1962. The history and status of sea otters in Alaska. Ph.D.dissertation. Purdue University, West Lafayette, Indiana.
Lidicker, W. Z., and F. C. McCollum. 1997. Genetic variation in Califor-nia sea otters. Journal of Mammalogy 78:417–425.
MacAskie, I. 1987. Updated status of the sea otter, Enhydra lutris, inCanada. Canadian Field Naturalist 101:279–283.
Mills, L. S., and P. E. Smouse. 1994. Demographic consequences ofinbreeding in remnant populations. American Naturalist 144:412–431.
Moritz, C. 1994. Applications of mitochondrial DNA analysis in conser-vation: a critical review. Molecular Ecology 3:401–411.
Nei, M. 1987. Molecular evolutionary genetics. Columbia UniversityPress, New York.
Nei, M., T. Maruyama, and R. Chakraborty. 1975. The bottleneck effectand genetic variability in populations. Evolution 29:1–10.
Pitcher, E. W. 1975. Distribution and abundance of sea otters, Stellersea lions and harbor seals in Prince William Sound, Alaska. AlaskaDepartment of Fish and Game, Anchorage.
Ralls, K., K. Brugger, and J. Ballou. 1979. Inbreeding and juvenile mor-tality in small populations of ungulates. Science 206:1101–1103.
Ralls, K., J. Ballou, and R. L. Brownell. 1983. Genetic diversity in Cali-fornia sea otters: theoretical considerations and management impli-cations. Biological Conservation 25:209–232.
Ralls, K., J. D. Ballou, and A. Templeton. 1988. Estimates of lethalequivalents and the cost of inbreeding in mammals. ConservationBiology 2:185–193.
Riedman, M. L., and J. A. Estes. 1990. The sea otter (Enhydra lutris):behavior, ecology and natural history. Biological report 90(14).U.S. Fish and Wildlife Service, Washington, D.C.
Rotterman, L. M. 1992. Patterns of genetic variability in sea otters aftersevere population subdivision and reduction. Ph.D. dissertation.University of Minnesota, Minneapolis.
Sambrook, J. E., E. Fritsch, and T. Maniatis. 1989. Molecular cloning, alaboratory manual. Cold Spring Harbor Laboratory Press, ColdSpring Harbor, New York.
Sanchez, M. S. 1992. Differentiation and variability of mitochondrialDNA in three sea otter, Enhydra lutris, populations. M.S. thesis.University of California, Santa Cruz.
Scribner, K. T., J. L. Bodkin, B. E. Ballachey, S. R. Fain, M. A. Cronin,and M. Sanchez. 1997. Population and genetic studies of sea otter(Enhydra lutris): a review and interpretation of available data.Pages 197–208 in A. E. Dizon, S. J. Chivers, and W. F. Perrin, edi-tors. Molecular genetics of marine mammals. Special publication 3.Society for Marine Mammalogy, Lawrence, Kansas.
Shaffer, M. L. 1981. Minimum population sizes for species conserva-tion. BioScience 31:131–134.
Simon-Jackson, T., M. Vivion, and D. Zwiefelhofer. 1986. Sea otter sur-vey, Kodiak archipelago, Alaska-1985. U.S. Fish and Wildlife Ser-vice, Anchorage, Alaska.
VanBlaricom, G. R., and J. A. Estes. 1988. The community ecology ofsea otters. Ecological studies 65. Springer-Verlag, Berlin.
Wayne, R. K. 1995. Conservation genetics in the Canidae. Pages 75–113 in J. C. Avise and J. L. Hamrick, editors. Conservation genetics.Chapman and Hall, New York.
Wendell, F. E., R. A. Hardy, and J. A. Ames. 1986. An assessment of theaccidental take of sea otters, Enhydra lutris, in gill and trammelnets. Marine resources technical report 54. California Departmentof Fish and Game, Long Beach.
Westemeier, R. L., J. D. Brawn, S. A. Simpson, T. L. Esker, R. W. Jansen,J. W. Walk, E. L. Kershner, J. L. Bouzat, and K. N. Paige. 1998.Tracking the long-term decline and recovery of an isolated popula-tion. Science 228:1695–1698.
Wilson, A. C., R. L. Cann, S. M. Carr, M. George, U. B. Gyllensten, K. M.Helm-Bychowski, R. G. Higuchi, S. R. Palumbi, E. M. Prager, R. D.Sage, and M. Stoneking. 1985. Mitochondrial DNA and two per-spectives on evolutionary genetics. Biological Journal of the Lin-nean Society 26:375–400.
Wolf, C. M., B. Griffith, C. Reed, and S. A. Temple. 1996. Avian andmammalian translocations: update and reanalysis of 1987 surveydata. Conservation Biology 10:1142–1154.
Copyright © 2022 FDOKUMEN