
Estimating Local and National Problem Drug Use Prevalence from Demographics
13
Addiction Research and Theory December 2003, Vol. 11, No. 6, pp. 401–413 ESTIMATING LOCAL AND NATIONAL PROBLEM DRUG USE PREVALENCE FROM DEMOGRAPHICS FILIP SMIT a, *, JAAP TOET b , HANS VAN OERS c and LUCAS WIESSING d a Trimbos Institute (Netherlands Institute of Mental Health and Addiction), P.O. Box 725, 3500 AS, Utrecht, The Netherlands; b Municipal Health Service Utrecht, P.O. Box 2423, 3500 GK, Utrecht, The Netherlands; c RIVM (National Institute of Public Health and the Environment), P.O. Box 1, 3720 BA, Bilthoven, The Netherlands; d EMCDDA (European Monitoring Centre for Drugs and Drug Addiction), Rua da Cruz de Santa Apolonia 23-25, 1149-045 Lisbon, Portugal Objective: To assess the applicability and validity of the Multiple Indicator Method for combining sparsely available local prevalence estimates of problem drug use into a national estimate. Method : Local estimates of problem drug use were available in seven out of the 27 addiction treatment regions in the Netherlands. Using demographic variables as predictors and under varying regression model specifications estimates were obtained for the remaining 20 regions and aggregated into national ones. These outcomes were com- pared with one obtained with the methodologically unrelated Treatment Multiplier Method. Results: All results point to a prevalence of 0.32% in the population of 15–55 years (or 0.27% in the population aged 15–64). Discussion: The applicability and validity of the Multiple Indicator Method – and adaptations thereof – for getting regional and national prevalence estimates from incomplete data remains subject of further research. However, the results found here and elsewhere more than justify an interest in future research efforts. Keywords: Substance misuse; Prevalence; Epidemiology; Regression models; Multiple indicator method INTRODUCTION Prevalence rates of drug use need to be monitored for a number of reasons. Health care managers and policy makers may want to know the number of drug users (and how these numbers change over time) to set their political agendas, allocate resources, moni- tor the performance of health care services and to evaluate the outcomes of preventive interventions. These information needs are likely to occur at both local and national levels. However, what is not quite evident is how the necessary statistics can be best obtained. The school survey offers an efficient vehicle for studying prevalence rates and changes therein, but is, of course, limited to the school-bound population and will miss truants and drop-outs (Smit et al., 2002). *Corresponding author. Tel.: þ 31 30 2971100. Fax: þ 31 30 297 1111. E-mail: [email protected] ISSN 1606-6359 print: ISSN 1476-7392 online/01/060401-13 ß 2003 Taylor & Francis Ltd DOI: 10.1080/1606635021000030061 Addict Res Theory Downloaded from informahealthcare.com by Emcdda Europea Monit Ctr on 10/30/14 For personal use only.
-
Upload
independent -
Category
Documents
-
view
1 -
download
0
Transcript of Estimating Local and National Problem Drug Use Prevalence from Demographics
Addiction Research and TheoryDecember 2003, Vol. 11, No. 6, pp. 401–413
ESTIMATING LOCAL AND NATIONAL PROBLEM
DRUG USE PREVALENCE FROM DEMOGRAPHICS
FILIP SMITa,*, JAAP TOETb,HANS VAN OERSc and LUCAS WIESSINGd
aTrimbos Institute (Netherlands Institute of Mental Health and Addiction), P.O. Box 725, 3500 AS,Utrecht, The Netherlands; bMunicipal Health Service Utrecht, P.O. Box 2423, 3500 GK, Utrecht,The Netherlands; cRIVM (National Institute of Public Health and the Environment), P.O. Box 1,3720 BA, Bilthoven, The Netherlands; dEMCDDA (European Monitoring Centre for Drugs and
Drug Addiction), Rua da Cruz de Santa Apolonia 23-25, 1149-045 Lisbon, Portugal
Objective: To assess the applicability and validity of the Multiple Indicator Method for combining sparselyavailable local prevalence estimates of problem drug use into a national estimate. Method : Local estimatesof problem drug use were available in seven out of the 27 addiction treatment regions in the Netherlands.Using demographic variables as predictors and under varying regression model specifications estimateswere obtained for the remaining 20 regions and aggregated into national ones. These outcomes were com-pared with one obtained with the methodologically unrelated Treatment Multiplier Method. Results: Allresults point to a prevalence of 0.32% in the population of 15–55 years (or 0.27% in the populationaged 15–64). Discussion: The applicability and validity of the Multiple Indicator Method – and adaptationsthereof – for getting regional and national prevalence estimates from incomplete data remains subject offurther research. However, the results found here and elsewhere more than justify an interest in futureresearch efforts.
Keywords: Substance misuse; Prevalence; Epidemiology; Regression models; Multiple indicator method
INTRODUCTION
Prevalence rates of drug use need to be monitored for a number of reasons. Health caremanagers and policy makers may want to know the number of drug users (and howthese numbers change over time) to set their political agendas, allocate resources, moni-tor the performance of health care services and to evaluate the outcomes of preventiveinterventions. These information needs are likely to occur at both local and nationallevels. However, what is not quite evident is how the necessary statistics can be bestobtained.
The school survey offers an efficient vehicle for studying prevalence rates andchanges therein, but is, of course, limited to the school-bound population and willmiss truants and drop-outs (Smit et al., 2002).
*Corresponding author. Tel.: þ 31 30 2971100. Fax: þ 31 30 297 1111. E-mail: [email protected]
ISSN 1606-6359 print: ISSN 1476-7392 online/01/060401-13 � 2003 Taylor & Francis Ltd
DOI: 10.1080/1606635021000030061
Add
ict R
es T
heor
y D
ownl
oade
d fr
om in
form
ahea
lthca
re.c
om b
y E
mcd
da E
urop
ea M
onit
Ctr
on
10/3
0/14
For
pers
onal
use
onl
y.
The household survey can help to obtain prevalence estimates of substance use in thegeneral population, but it is very expensive and likely to under-estimate the true preva-lence of problem drug use. Some causes that contribute to this under-estimation are:(a) failure to reach ‘hidden populations’ e.g., homeless people; (b) failure to contactpeople who engage in outdoor activities which may be positively correlated withdrug use; (c) upon contact, refusal rates that are much higher than in school surveys;and (d) during the interview, disclosure rates that are usually lower than in school sur-veys due to the inhibiting presence of family members (Gfroerer et al., 1997; Aquilinoet al., 2000; Smit et al., 2002).
Another alternative for estimating drug use prevalence is the 3-sample loglinearcapture–recapture analysis pioneered by Fienberg (1972), applied to drug use epidemi-ology by Woodward et al. (1984), Brecht and Wickens (1993), Wickens (1993) andothers, and further promoted by the International Working Group for DiseaseMonitoring and Forecasting (1995). Unlike the school and household survey capture–recapture experiments do not rely on complete sample frames and are suitable forestimating the size of partially hidden populations, thus offering a clear advantage inthe context of drug use prevalence studies.
Unfortunately, capture–recapture experiments also have some disadvantages as theyare often based on three or more, possibly incomplete, preferably independent registersof the population of interest with some identifiable overlap (cf. Hay and Smit, 2002). Inthe Netherlands, these conditions can sometimes be met at regional level, but not atnational. Thus researchers managed to obtain prevalence estimates of problem druguse using capture–recapture techniques in seven addiction treatment regions in theNetherlands (see below), but no estimates were available for the remaining 20 addictiontreatment regions and a national estimate was still missing.
In Italy, Mariani and colleagues found themselves in a similar position. It occurred tothem that available local prevalence estimates could be used as ‘anchor points’ in aregression model under which it would be possible to also obtain estimates for theremaining regions (Mariani et al., 1994). See for an early precursor of this methodWoodward et al. (1984). This method became known as the Multiple IndicatorMethod. Research in its applicability and validity has been promoted by theEuropean Monitoring Centre for Drugs and Drug Addiction (EMCDDA). TheEMCDDA launched a series of pilot studies that were carried out by national expertgroups in the European member-states. These efforts cumulated in a Study to ObtainComparable National Estimates for Problem Drug Use (EMCCDA, 1999) which wasfurther tested in the respective member-states (e.g., Stimson et al., 1997; Frischeret al., 2001; Godfrey et al., 2001).
Elsewhere similar methods were developed and tried (Wickens, 1993; Hser et al.,1998; Maxwell, 2000) and these variants of the method became known as SyntheticEstimation. Furthermore, researchers with a background in statistics are likely toperceive sparsely available regional data as a missing data problem (cf. Little andRubin, 1989) and tackle this problem with help of imputation techniques, such asregression imputation (i.e., predicting missing data using regression analysis). Thelatter could be seen as yet another name for the same methodology. In theDiscussion, we will return to the different formulations of the method.
The aim of this study is to assess the applicability and validity of the MultipleIndicator Method as stipulated by the EMCDDA (1999) in the Dutch context. Thuswe have two research questions:
402 F. SMIT et al.
Add
ict R
es T
heor
y D
ownl
oade
d fr
om in
form
ahea
lthca
re.c
om b
y E
mcd
da E
urop
ea M
onit
Ctr
on
10/3
0/14
For
pers
onal
use
onl
y.
1. Can the Multiple Indicator Method (or an adapted method) be applied in the Dutchcontext?
2. Can indications be obtained for the validity of this (or the adapted) method?
To answer these questions we will compare different specifications of the regressionmodel and compare these results with the outcome of a methodologically unrelatedtechnique (the Treatment Multiplier Method, to be explained below). In this waysome light might be shed on the applicability and validity of the Multiple IndicatorMethod.
Problem drug users are here defined as people dependent on opiates and cocaine,who have been in contact with the police or health care services for drug-related prob-lems. In addition, we define the target population as also including the ‘hidden’ seg-ments of the drug using population, i.e. drug users who have not yet been but couldpotentially come into contact with the police or health care services.
For the calculation of national prevalence rates of problem drug use two age rangesare used: the 15–54 age range (with a corresponding population size of N¼ 9 174 595 inthe Netherlands) and the 15–64 age range (with N¼ 10 713 380). The former age rangeis often chosen in drug use prevalence studies because one rarely encounters problemdrug users younger than 15 or older than 55. However, the EMCDDA promotes theuse of the age range of 15–64 to improve comparability of prevalence studies acrossthe member-states of the European Community.
In the remaining paragraphs the respective methods will be explained, their estimatespresented and compared. The article is concluded with some notes on possible direc-tions for future research.
MULTIPLE INDICATOR METHOD
‘Anchor Points’
The Netherlands are geographically divided into 27 addiction treatment regions, whichare sometimes named after the largest municipality in that region. Estimates of thenumber of problematic drug users are available for seven regions. The seven local esti-mates are based on a series of studies: Amsterdam (Buster et al., submitted), Groningen(Bieleman et al., 1995), Rijnmond (van Driel and Wierdsma, 1999; van de Mheen,2000), Stedendriehoek (Intraval, 2000a,b), Utrecht (de Graaf et al., 2000), den Haag(MORE Onderzoekscommissie, 1997), Zuid-Limburg (Coumans et al., 2000). Allthese studies covered a time span of one year, resulting in 1-year prevalence rates.
The estimates for the regions of Amsterdam and Rijnmond (i.e. Rotterdam andsurroundings) were based on the estimates of the respective cities. Since the regions arelarger than the cities, this may have resulted in an under-estimate. However, assumingthat problem drug users are by and large concentrated in the urban parts of these regions,we are willing to ignore this downward bias. The same assumption was made forGroningen and Zuid-Limburg. The estimate for the Utrecht region (a comparativelysmall city in a large region) was calculated using the estimate for Utrecht city (600)plus an estimate for the rest of the region (700). The latter estimate was obtained byapplying the in-treatment rate for the city of Utrecht to the known number of clients inthe rest of the region (see below for a description of this method). For the remaining 20
ESTIMATING PROBLEM DRUG USE 403
Add
ict R
es T
heor
y D
ownl
oade
d fr
om in
form
ahea
lthca
re.c
om b
y E
mcd
da E
urop
ea M
onit
Ctr
on
10/3
0/14
For
pers
onal
use
onl
y.
regions such local estimates were not available, but could, in principle, be obtained froma regression model in which the available local estimates function as ‘anchor points’.
Indicators of Problem Drug Use
It is recommended to use drug-related indicators as predictors in this regression model,i.e. drug related offences, drug-related deaths, clients in treatment, HIV cases related tointravenous drug use, imprisoned drug users (cf. EMCDDA, 1999). Unfortunately,however, these statistics are either not reliable, or not available in the Netherlands.Instead, we speculated that drug use prevalence could perhaps be expressed as a func-tion of demographics such as housing density and population density. FollowingKreiner et al. (2001) we also speculated that indicators of social disorganisation atregional level could be of use for predicting drug use prevalence. Therefore, we selectedregional crime rates, regional income differences and the number of settlements anddepartures in the region, i.e. residential mobility.
The above mentioned indicators are based on community-level statistics from thecentral bureau of statistics, Statistics Netherlands, (downloadable from www.cbs.nl)and were aggregated from the municipalities to the level of the addiction treatmentregions. The data from Statistics Netherlands are routinely collected and frequentlyupdated. It is, therefore, more than likely that this data source will be used for similarpurposes in the future.
First Model Specification
For the regression analysis the dependent variables (based on the available ‘anchorpoints’) were first transformed into prevalence rates per 100 000, i.e. Prevalence¼(Local Estimate/Local Population Size)� 100 000. Not knowing what indicators wouldbest predict prevalence, we carried out a regression analysis with the backward selectionmethod and only the two demographic indicators were retrained in the model: HousingDensity (HD, the number of houses per square kilometre) and Population Density (PD,the number of inhabitants per square kilometre/100). The model,
Prevalence ¼ 272:76� 74:92ðPDÞ þ 1:64ðHDÞ
fitted the data well, R2¼ 0.97, adjusted R2
¼ 0.96, and both indicators were significantat �<0.01. It should be noted that a high R2 is expected when using aggregated dataand only a few data-points. We have not attempted to interpret the regression coeffi-cients, because the aim is not the development of substantive theory, but prediction –and the model predicts well. We will return to this issue in ‘‘Discussion’’.
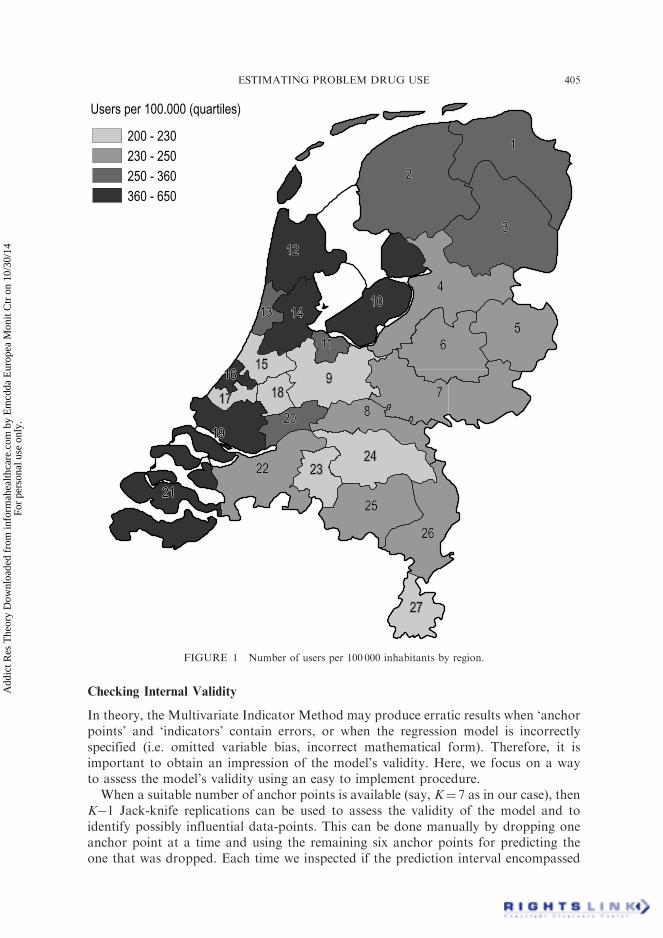
Under this model, predicted values of the prevalence rates were obtained for each ofthe regions (see Fig. 1). The prevalence rates were then back-converted into the numberof hard drug users in each region (see Table I). Summing these numbers over theregions we obtained a national estimate of 29 215 problem drug users (29 047 whenpredicted scores are only imputed for the missing values) for the year 1999. The1-year prevalence of problem drug use is therefore 29 215/9 174 595� 100%¼ 0.32%.
404 F. SMIT et al.
Add
ict R
es T
heor
y D
ownl
oade
d fr
om in
form
ahea
lthca
re.c
om b
y E
mcd
da E
urop
ea M
onit
Ctr
on
10/3
0/14
For
pers
onal
use
onl
y.
Checking Internal Validity
In theory, the Multivariate Indicator Method may produce erratic results when ‘anchorpoints’ and ‘indicators’ contain errors, or when the regression model is incorrectlyspecified (i.e. omitted variable bias, incorrect mathematical form). Therefore, it isimportant to obtain an impression of the model’s validity. Here, we focus on a wayto assess the model’s validity using an easy to implement procedure.
When a suitable number of anchor points is available (say, K¼ 7 as in our case), thenK�1 Jack-knife replications can be used to assess the validity of the model and toidentify possibly influential data-points. This can be done manually by dropping oneanchor point at a time and using the remaining six anchor points for predicting theone that was dropped. Each time we inspected if the prediction interval encompassed
Users per 100.000 (quartiles)
200 - 230
230 - 250
250 - 360
360 - 650
111
222
333
444
555666
777888
999
101010
111111
121212
131313 141414
151515161616
171717 181818
191919202020
212121
222222 232323242424
252525
262626
272727
FIGURE 1 Number of users per 100 000 inhabitants by region.
ESTIMATING PROBLEM DRUG USE 405
Add
ict R
es T
heor
y D
ownl
oade
d fr
om in
form
ahea
lthca
re.c
om b
y E
mcd
da E
urop
ea M
onit
Ctr
on
10/3
0/14
For
pers
onal
use
onl
y.
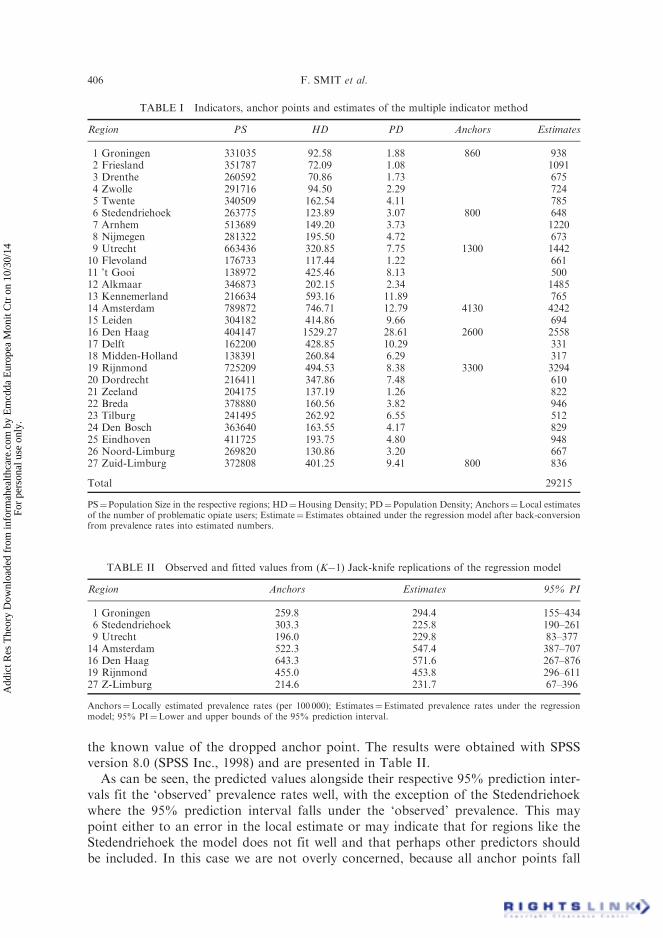
the known value of the dropped anchor point. The results were obtained with SPSSversion 8.0 (SPSS Inc., 1998) and are presented in Table II.
As can be seen, the predicted values alongside their respective 95% prediction inter-vals fit the ‘observed’ prevalence rates well, with the exception of the Stedendriehoekwhere the 95% prediction interval falls under the ‘observed’ prevalence. This maypoint either to an error in the local estimate or may indicate that for regions like theStedendriehoek the model does not fit well and that perhaps other predictors shouldbe included. In this case we are not overly concerned, because all anchor points fall
TABLE I Indicators, anchor points and estimates of the multiple indicator method
Region PS HD PD Anchors Estimates
1 Groningen 331035 92.58 1.88 860 9382 Friesland 351787 72.09 1.08 10913 Drenthe 260592 70.86 1.73 6754 Zwolle 291716 94.50 2.29 7245 Twente 340509 162.54 4.11 7856 Stedendriehoek 263775 123.89 3.07 800 6487 Arnhem 513689 149.20 3.73 12208 Nijmegen 281322 195.50 4.72 6739 Utrecht 663436 320.85 7.75 1300 144210 Flevoland 176733 117.44 1.22 66111 ’t Gooi 138972 425.46 8.13 50012 Alkmaar 346873 202.15 2.34 148513 Kennemerland 216634 593.16 11.89 76514 Amsterdam 789872 746.71 12.79 4130 424215 Leiden 304182 414.86 9.66 69416 Den Haag 404147 1529.27 28.61 2600 255817 Delft 162200 428.85 10.29 33118 Midden-Holland 138391 260.84 6.29 31719 Rijnmond 725209 494.53 8.38 3300 329420 Dordrecht 216411 347.86 7.48 61021 Zeeland 204175 137.19 1.26 82222 Breda 378880 160.56 3.82 94623 Tilburg 241495 262.92 6.55 51224 Den Bosch 363640 163.55 4.17 82925 Eindhoven 411725 193.75 4.80 94826 Noord-Limburg 269820 130.86 3.20 66727 Zuid-Limburg 372808 401.25 9.41 800 836
Total 29215
PS¼Population Size in the respective regions; HD¼Housing Density; PD¼Population Density; Anchors¼Local estimatesof the number of problematic opiate users; Estimate¼Estimates obtained under the regression model after back-conversionfrom prevalence rates into estimated numbers.
TABLE II Observed and fitted values from (K�1) Jack-knife replications of the regression model
Region Anchors Estimates 95% PI
1 Groningen 259.8 294.4 155–4346 Stedendriehoek 303.3 225.8 190–2619 Utrecht 196.0 229.8 83–37714 Amsterdam 522.3 547.4 387–70716 Den Haag 643.3 571.6 267–87619 Rijnmond 455.0 453.8 296–61127 Z-Limburg 214.6 231.7 67–396
Anchors¼Locally estimated prevalence rates (per 100 000); Estimates¼Estimated prevalence rates under the regressionmodel; 95% PI¼Lower and upper bounds of the 95% prediction interval.
406 F. SMIT et al.
Add
ict R
es T
heor
y D
ownl
oade
d fr
om in
form
ahea
lthca
re.c
om b
y E
mcd
da E
urop
ea M
onit
Ctr
on
10/3
0/14
For
pers
onal
use
onl
y.
well within the 95% prediction intervals when the model is based on all seven anchorpoints. Nevertheless, this type of validity check is easy to implement, can be used foridentifying outliers, may draw attention to possible model specification errors andmay otherwise add to the credibility of the model.
Alternative Model Specifications
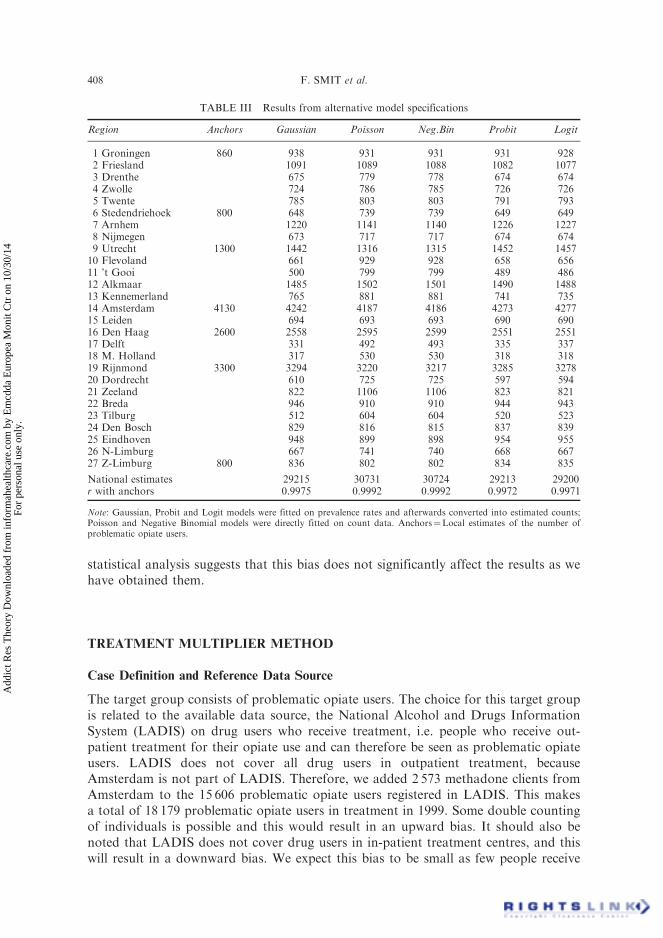
Gaussian regression may not be the best option for modelling prevalence rates, becauseprevalence rates are rarely normally distributed (Geary, 1947). For our data the exactKolmogorov–Smirnov test of the 0-hypothesis of normality has p¼ 0.056 (2-tailed) andwith only a few data points there is little power to detect non-normality. Therefore, thecautious approach is to assume a departure from normality. In the context of Gaussianregression analysis this is of some importance, because it may result in non-normally(possibly heteroskedastically) distributed residuals, thus violating one of the regressionassumptions. This, in turn, may result in incorrect p-values and may thus potentiallylead to model misspecification. In addition, the regression model is not constrainedto predict values within the allowed range (e.g. between 0 and 100%). Several general-ised linear models (cf. McCullagh and Nelder, 1989) avoid these problems and it may beworthwhile to compare results across a number of these models. Using Stata(StataCorp, 1999) we tried two approaches (see Table III).
In the first approach we modelled the regional counts of the number of problematicdrug users with models suitable for count data, i.e. Poisson and Negative Binomialregression models (cf. Long, 1997) with PD, HD and local Population Size (PS) as pre-dictors. Under both models similar national estimates of problematic drug users wereobtained, respectively: 30 731 (under the Poisson model) and 30 724 (under theNegative Binomial model). This compares well with the original estimate of 29 215(under the Gaussian model). It should be noted that the models for count data fitslightly better than the Gaussian model.
In the second approach, we used local prevalence rates per 100.000 people as thedependent variable and fitted these on the selected indicators PD and HD usingLogit and Probit models. The predicted prevalence rates were then back-convertedinto regional population sizes of the problem drug users and aggregated.
All models generated very similar outcomes: the lowest correlation coefficient,r, between predicted scores and ‘anchors’ was 0.9971 and national estimates rangedbetween 29 200 and 30 731.
Effect of Different Case Definitions Across Local Studies
The regional estimates relate to ‘heroin addicts’ (Amsterdam, Rotterdam and TheHague) and ‘hard drug users’ (Groningen, Utrecht, Stedendriehoek, Zuid-Limbury).In terms of their respective case definitions the former group is more narrowly definedthan the latter. Therefore, we assessed if the inclusion of a more narrowly defined group(the heroine addicts) in the regression model would in any appreciable way affect theoutcomes. To that end we carried out the same regression analysis, but this time wealso included a Type of Drug Users indicator (hard drug users¼ 0, heroin users¼ 1)in the model. The results suggested the presence of a statistically non-significant( p¼ 0.860) down-ward bias (b¼�19.71). Naturally, the downward bias was to beexpected when some anchor points refer to a more narrowly defined group, but the
ESTIMATING PROBLEM DRUG USE 407
Add
ict R
es T
heor
y D
ownl
oade
d fr
om in
form
ahea
lthca
re.c
om b
y E
mcd
da E
urop
ea M
onit
Ctr
on
10/3
0/14
For
pers
onal
use
onl
y.
statistical analysis suggests that this bias does not significantly affect the results as wehave obtained them.
TREATMENT MULTIPLIER METHOD
Case Definition and Reference Data Source
The target group consists of problematic opiate users. The choice for this target groupis related to the available data source, the National Alcohol and Drugs InformationSystem (LADIS) on drug users who receive treatment, i.e. people who receive out-patient treatment for their opiate use and can therefore be seen as problematic opiateusers. LADIS does not cover all drug users in outpatient treatment, becauseAmsterdam is not part of LADIS. Therefore, we added 2 573 methadone clients fromAmsterdam to the 15 606 problematic opiate users registered in LADIS. This makesa total of 18 179 problematic opiate users in treatment in 1999. Some double countingof individuals is possible and this would result in an upward bias. It should also benoted that LADIS does not cover drug users in in-patient treatment centres, and thiswill result in a downward bias. We expect this bias to be small as few people receive
TABLE III Results from alternative model specifications
Region Anchors Gaussian Poisson Neg.Bin Probit Logit
1 Groningen 860 938 931 931 931 9282 Friesland 1091 1089 1088 1082 10773 Drenthe 675 779 778 674 6744 Zwolle 724 786 785 726 7265 Twente 785 803 803 791 7936 Stedendriehoek 800 648 739 739 649 6497 Arnhem 1220 1141 1140 1226 12278 Nijmegen 673 717 717 674 6749 Utrecht 1300 1442 1316 1315 1452 145710 Flevoland 661 929 928 658 65611 ’t Gooi 500 799 799 489 48612 Alkmaar 1485 1502 1501 1490 148813 Kennemerland 765 881 881 741 73514 Amsterdam 4130 4242 4187 4186 4273 427715 Leiden 694 693 693 690 69016 Den Haag 2600 2558 2595 2599 2551 255117 Delft 331 492 493 335 33718 M. Holland 317 530 530 318 31819 Rijnmond 3300 3294 3220 3217 3285 327820 Dordrecht 610 725 725 597 59421 Zeeland 822 1106 1106 823 82122 Breda 946 910 910 944 94323 Tilburg 512 604 604 520 52324 Den Bosch 829 816 815 837 83925 Eindhoven 948 899 898 954 95526 N-Limburg 667 741 740 668 66727 Z-Limburg 800 836 802 802 834 835
National estimates 29215 30731 30724 29213 29200r with anchors 0.9975 0.9992 0.9992 0.9972 0.9971
Note: Gaussian, Probit and Logit models were fitted on prevalence rates and afterwards converted into estimated counts;Poisson and Negative Binomial models were directly fitted on count data. Anchors¼Local estimates of the number ofproblematic opiate users.
408 F. SMIT et al.
Add
ict R
es T
heor
y D
ownl
oade
d fr
om in
form
ahea
lthca
re.c
om b
y E
mcd
da E
urop
ea M
onit
Ctr
on
10/3
0/14
For
pers
onal
use
onl
y.
in-patient treatment, and most of these will also receive outpatient treatment and arethus registered in LADIS.
In-treatment Rate
The ‘in-treatment rate’ is defined as the number of problematic opiate users in treat-ment divided by the total number of problematic opiate users in a population in aspecified time period. The in-treatment rate was based on studies carried out inAmsterdam (Buster, personal communication) and Rotterdam (van Driel andWierdsma, 1999; van de Mheen, 2000). In Amsterdam, an annual in-treatment rateof 0.60 was found and in Rotterdam one of 0.70. It is not known whether these findingscan be safely generalised to the rest of the country and therefore we will use the range of0.60–0.70.
Results
For the multiplier method (cf. Taylor, 1997) we used the following formula,
estðN Þ ¼ A=B
where, est(N ) is the estimate of the total number of problem drug users; A is thenumber of problem drug users in treatment; B is the in-treatment rate.
Based on the above mentioned range of the in-treatment rate, the estimates of thetotal number of problematic opiate users are:
18 179=0:70 ¼ 25 970 and 18 179=0:60 ¼ 30 298:
Using the 9 174 595 people in the age range of 15–54 years as a denominator, we obtain25 970 / 9 174 595� 100%¼ 0.28% as a lower bound and 30 298 / 9 174 595� 100%¼
0.33% as an upper bound of the 1-year prevalence of problematic drug use in theNetherlands. This compares well with the estimates based on the regression models.
DISCUSSION
Research Questions
This article addresses two questions: can the Multiple Indicator Method be appliedin the Dutch context; and does the Multiple Indicator Method, or a related method,produce valid estimates of problem drug use prevalence? These questions can now beanswered as follows.
Applicability
The applicability of the Multiple Indicator Method as proposed by the EMCDDA(1999) was of limited use in the Dutch context for two reasons. First, a lack of ‘drug-related indicators’ forced us to make use of a set of ‘demographic indicators’. Second, itis recommended to use principal component analysis to reduce the number of indepen-dent variables, but for our data we found this approach less than optimal. Although aprincipal component analysis resulted in the extraction of a single component which
ESTIMATING PROBLEM DRUG USE 409
Add
ict R
es T
heor
y D
ownl
oade
d fr
om in
form
ahea
lthca
re.c
om b
y E
mcd
da E
urop
ea M
onit
Ctr
on
10/3
0/14
For
pers
onal
use
onl
y.
retrained 99% of the variance of both indicators, this component was not very helpfulin predicting the prevalence (67.95% ‘explained’ variance as compared to the 97.31%that was obtained on the regression model based on the two demographic indicators).This is not particularly surprising. In the regression equation the coefficient for popula-tion density, PD, has a negative sign (�74.92), but a positive sign for housing density,HD, (þ1.64). Thus, HD and PD have effects in opposite directions and this informationis lost in the single construct which is extracted by the principal component analysis.
To summarise, researchers are likely to encounter a number of practical obstacleswhen applying the Multiple Indicator Method and this will require some adaptation.It is worth noting that elsewhere regression models were successfully used at the levelof neighbourhoods in Chicago (Sherman et al., 1996), in Barcelona (Brugal et al.,1998) and across 185 US cities (Hser et al., 1998).
Validity
With regard to the validity of the regression imputation method, the following observa-tions can be made.
The estimates obtained in this study resemble each other closely. This is true not onlyfor the outcomes of the different regression imputation models, but these outcomes alsocompare well with the national estimate that was obtained by the methodologicallyunrelated Treatment Multiplier Method. It is also worth noting that the results inthis study are corroborated by previous national estimates from 1996 which were inthe range of 25 000–30 000 problem drug users (Toet, 1996) and were at that timeaccepted as the best official statistics on the national prevalence of problem drug usein the Netherlands.
All in all, this suggests a reasonable amount of external (criterion) validity. Also theinternal (construct) validity of the models appears to be well in order as is apparentfrom the close match between ‘observed’ and estimated numbers of problem drugusers in the different regions (cf. Tables II and III). Therefore, it appears that, in prin-ciple, the Multiple Indicator Method and related regression imputation techniques canbe validly applied to regional problem drug use data and used to obtain new estimatesfor previously unstudied regions and to also generate a national estimate.
Limitations and Possible Pitfalls
As indicated, there are a number of practical obstacles that can be encountered. Theabsence of drug-related indicators and the varying case definitions across the localcapture–recapture studies were already mentioned, but we must also mention thatone local estimate was for 1997 and may therefore not present the best prevalenceestimate for 1999. Thus, some judgement is required about the value of using datedlocal estimates as ‘anchor points’. If it could be assumed that trends do not changerapidly at the regional level, then a time-lag of one or two years is perhaps acceptable,otherwise one must first obtain a new regional estimate.
The seven ‘anchor points’ stemmed from geographically diverse regions (e.g., regionswith low and high level prevalence rates, see map) and thus it was fairly safe to general-ise from these regions to the rest of the Netherlands. Nevertheless, geographical diver-sity is an aspect that should be subject of critical scrutiny in this sort of studies because
410 F. SMIT et al.
Add
ict R
es T
heor
y D
ownl
oade
d fr
om in
form
ahea
lthca
re.c
om b
y E
mcd
da E
urop
ea M
onit
Ctr
on
10/3
0/14
For
pers
onal
use
onl
y.

it is likely that local drug use prevalence studies are initiated in areas where drug use ismore prominent.
Apart from the more or less practical obstacles which are related to data availabilitythere are two concerns of a methodological nature.
First, it could be argued that ‘content’ validity is part of internal validity. Thus, ourdiscussion would not be complete without addressing the substantive aspects of themodel as we have found it. At face value it seems plausible that regional and nationallevel drug use prevalence could be understood as a function of demographics, plus someother factors which seem to give little extra variance. This does not imply that regionaldrug use prevalence could be truly ‘explained’ by demographics alone. It certainly doesnot imply that at individual level drug use can be explained by just two predictors.However, for predicting regional and national prevalence rates this parsimoniousmodel appears to work well.
Second, regional estimates that serve as ‘anchor points’ are estimates themselves andare therefore subject to stochastic uncertainty. This should translate into broaderprediction intervals of the prevalence rates in all the regions and must eventually becaptured in a 95% prediction interval around the national estimate. Interval estimationcould perhaps be achieved through some form of sensitivity analysis or bootstrapmethod (cf. Mooney and Duval, 1993). Alternatively, one might employ multiple impu-tation (cf. Little and Rubin, 1989) to this missing data problem and to also deal withstochastic uncertainty. We have planned to work along these lines in the near future.
An Agenda for Future Research
The agenda for future research should contain a number of topics. We will outline thembriefly.
. To carry out further validation studies of the Multiple Indicator Method and relatedregression techniques. This can be done by using regional-level data-sets with com-plete data for all regions (e.g. the European ESPAD study in drug use prevalenceamong high-school students). Some data-points can be deleted on purpose and theperformance of the Multiple Indicator Method and related imputation techniquescan then be empirically assessed. Alternatively, simulation studies can be performedon synthetic data-sets with known covariance structures. These validation studiesmay facilitate learning processes about the validity of the methods and the conditionsunder which the methods perform well or brake down.
. To produce 95% prediction intervals for the national estimate.
. To explore publicly available community-level statistics to find better predictors ofproblem drug use, e.g. unemployment rates, crime rates, etc.
. To update local level prevalence estimates that could serve as ‘anchor points’ in theMultiple Indicator Method, preferably carried out in demographically diverse (i.e.low and high prevalence) regions as to ensure a solid foundation for generalising.
. To update in-treatment rates (could be done for all regions where local estimatesof the drug using population are available) in order to be better able to validatethe outcomes of one method with those of another.
To summarise, it would be worthwhile to corroborate the rising confidence inthe applicability and validity of the Multiple Indicator Method and related regression
ESTIMATING PROBLEM DRUG USE 411
Add
ict R
es T
heor
y D
ownl
oade
d fr
om in
form
ahea
lthca
re.c
om b
y E
mcd
da E
urop
ea M
onit
Ctr
on
10/3
0/14
For
pers
onal
use
onl
y.
techniques by other validation studies. It is also time to broaden the research agenda toimprove these methods.
Acknowledgements
The authors acknowledge, with many thanks, the contributions from the following per-sons: at the Netherlands Expert Group on Local and National Prevalence Estimation ofProblem Drug Use: Vincent van Alem (The Organisation Care Information Systems),Erik van Ameijden (Municipal Health Service, Utrecht), Bert Bieleman (Intraval),Marcel Buster (Municipal Health Service, Amsterdam), Peter van der Heijden(University of Utrecht), Dirk Korf (University of Amsterdam), Margriet van Laar(Focal Point, Trimbos Insitute), Marinus Spreen (University of Maastricht); at theEuropean Monitoring Centre for Drugs and Drug Addiction: Richard Hartnoll; at theInstitut fur Therapieforschung: Ludwig Kraus and Roland Simon. The work describedin this publication has benefited from the EMCDDA study to obtain comparablenational estimates of problem drug use prevalence for all EU member states(CT.97.EP.04) and the European Network to Develop Policy Relevant Models andSocio-Economic Analysis of Drug Use, Consequences and Interventions, fundedby the European Commission (TSER/DG-12, project ERB 4141 PL 980030). Theviews stated in this article are those of the authors and do not necessarily reflect theopinions and policies of the institutions where they work or of those mentioned inthe acknowledgements.
References
Aquilino, W.S., Wright, D.L. and Supple, A.J. (2000). Response effects due to bystander presence in CASIand paper-and-pencil surveys of drug use and alcohol use. Substance Use and Misuse, 35, 845–867.
Bieleman, B., Snippe, J. and de Bie, E. (1995).Drugs binnen de grenzen: harddrugs en criminaliteit in Nederland,schattingen van de omvang. Intraval, Groningen/Rotterdam.
Brecht, M.-L. and Wickens, T.D. (1993). Application of multiple capture methods for estimating drug useprevalence. Journal of Drug Issues, 23, 229–250.
Brugal, M.T., Domingo-Salvany, A., Maguire, A., Cayla, J.A., Villalbi, J.R. and Hartnoll, R. (1998). A smallarea analysis estimating the prevalence of addiction to opioids in Barcelona, 1993. Journal ofEpidemiology and Community Health, 53, 488–494.
Buster, M.C.A., van Brussel, G.H.A. and van de Brink, W. (2001). Estimating the number of opiate users inAmsterdam by capture recapture: the importance of case definition. European Journal of Epidemiology,17, 935–942.
Coumans, A.M., Neve, R.J.M. and van de Mheen, H. (2000). Monitor Alcohol en Drugs in Nederlandsegemeenten (7). Het proces van marginalisering en verharding in de drugsscene van Parkstad Limburg.IVO, Rotterdam.
De Graaf, I., Wildschut, J. and van de Mheen, D. (2000). Monitor Alcohol en Drugs in Nederlandse gemeenten(6). Utrechtse druggebruikers: een jachtig bestaan. IVO, Rotterdam.
European Monitoring Centre for Drugs and Drug Addiction. (1999). Study to obtain comparable Nationalestimate of problem drug use prevalence estimates for all EU member states. EMCDDA, Lisbon.[Available at http://www.emcdda.org/situation/themes/problem_drug_use.shtml]
Fienberg, S.E. (1972). The mutiple recapture census for closed populations and incomplete 2k contingencytables. Biometrika, 59, 591–603.
Frischer, M., Hickman, M., Kraus, L., Mariani, F. and Wiessing, L. (2001). A comparison of differentmethods for estimating the prevalence of problematic drug misuse in Great Britain. Addiction,96, 1465–1476.
Geary, R.C. (1947). Testing for normality. Biometrika, 24, 209–242.Gfroerer, J., Wright, D. and Kopstein, A. (1997). Prevalence of youth substance use: the impact of methodo-
logical differences between two national surveys. Drug and Alcohol Dependence, 47, 19–30.
412 F. SMIT et al.
Add
ict R
es T
heor
y D
ownl
oade
d fr
om in
form
ahea
lthca
re.c
om b
y E
mcd
da E
urop
ea M
onit
Ctr
on
10/3
0/14
For
pers
onal
use
onl
y.
Godfrey, C., Wiessing, L., Hartnoll, R., Sharp, F. and Neaham, R. (Eds.) (2001). Modelling Drug Use:Methods to Quantify and Understand Hidden Processes. EMCCDA Scientific Monograph Series (No. 6).Office for Offical Publications of the European Communities, Luxemburg.
Hay, G. and Smit, F. (2002). Estimating the number of drug injectors from needle exchange data. AddictionResearch and Theory, forthcoming.
Hser, Y.-I., Prendergast, M., Anglin, M.D., Chen, J.K. and Hsieh, S.-C. (1998). A regression analysis estimat-ing the number of drug-using arrestees in 185 US cities. American Journal of Public Health, 88, 487–490.
International Working Group for Disease Monitoring and Forecasting (1995). Capture-recapture andmultiple-record systems estimation I: history and theoretical development. American Journal ofEpidemiology, 142, 1047–1058.
Intraval (2000a). Doelgroepen in beeld. Doelgroepanalyse dak- en thuislozen en harddruggebriukers inApeldoorn. Intraval, Groningen/Rotterdam.
Intraval (2000b). Doelgroepen nader bekeken. Doelgroepanalyse dak- en thuislozen en harddruggebriukers inDeventer. Intraval, Grongen/Rotterdam.
Kreiner, P., Soldz, S., Berger, M., Eliott, E., Reynes, J., Willams, C. and Rodriguez-Howard, M. (2001).Social indicator-based measures of substance abuse consequences, risk and protection at the townlevel. The Journal of Primary Prevention, 21, 339–365.
Little, R.J.A. and Rubin, D.B. (1989). The analysis of social science data with missing values. SociologicalMethods and Research, 18, 292–326.
Long, J.S. (1997). Regression Models for Categorical and Limited Dependent Variables. Sage, Thousand Oaks.Mariani, F., Guaiana, R. and Di Flandri, T. (1994). An epidemiological overview of illicit drug abuse in Italy.
The Journal of Drug Issues, 24, 579–595.Maxwell, J.C. (2000). Methods for estimating the number of ‘‘hard-core’’ drug users. Substance Use & Misuse,
35, 399–420.McCullagh, P. and Nelder, J.A. (1989). Generalised Linear Models, 2nd Edn. Chapman & Hall, London.Mooney, C.Z. and Duval, R.D. (1993). Bootstrapping: A Non-Parametric Approach to Statistical Inference,
Sage, Newbury Park.MORE Onderzoekscommissie (1997). Eindrapportage: Haagse harddruggebruikers en het bereik van politie en
verslavingszorg. Gemeente Den Haag, Den Haag.Sherman, R.E., Gillespie, S. and Diaz, J.A. (1996). Use of social indicators in assessment of local community
alcohol and other drug dependence treatment needs within Chicago. Substance Use & Misuse,31, 691–728.
Smit, F., de Zwart, W., Spruit, I., Monshouwer, K. and van Ameijden, E. (2002). Monitoring substance use inadolescents: school or household survey? Drugs: Education, Prevention and Policy, 9, 267–274.
SPSS Inc., (1998). SPSS 8.0 for Windows. SPSS Inc., Chicago.StataCorp (1999). Stata Statistical Software (Release 6). College Station, Stata Corporation, Texas.Stimson, G.V., Hickman, M., Quirk, A., Frischer, M. and Taylor, C. (Eds.) (1997). Estimating the Prevalence
of Problem Drug use in Europe. EMCCDA Scientific Monograph Series (No. 1). Office for OfficalPublications of the European Communities, Luxemburg.
Taylor, C. (1997). Introduction to multiplier methods. In: Stimson, G., Hickman, M., Quirk, A. and Frischer,M. (Eds.), Estimating the Prevalence of Drug Misuse in Europe, pp. 111–112. Council of Europe,Strasbourg.
Toet, J. (1996). Country Report: The Netherlands. Trimbos-instituut, Utrecht.Van de Mheen, H. (2000). De Rotterdamse Drugsscene onder de loep. Resultaten van 5 jaar Drugs Monitoring
System in Rotterdam. IVO, Rotterdam.Van Driel, H. and Wierdsma, A.L. (1999). Tien jaar methadon in Rotterdam. GGD-Rotterdam e.o.,
Rotterdam.Wickens, Th.D. (1993). Quantitative methods for estimating the size of a drug-using population. The Journal
of Drug Issues, 23, 185–216.Woodward, J., Retka, R. and Ng, L. (1984). Construct validity of heroin abuse estimators. International
Journal of the Addictions, 19, 93–117.
ESTIMATING PROBLEM DRUG USE 413
Add
ict R
es T
heor
y D
ownl
oade
d fr
om in
form
ahea
lthca
re.c
om b
y E
mcd
da E
urop
ea M
onit
Ctr
on
10/3
0/14
For
pers
onal
use
onl
y.