Estimating the Prevalence of Injection Drug Use among Black and White Adults in Large U.S....
31
Journal of Urban Health: Bulletin of the New York Academy of Medicine, Vol. 85, No. 6 doi:10.1007/s11524-008-9304-9 * 2008 The New York Academy of Medicine Estimating the Prevalence of Injection Drug Use among Black and White Adults in Large U.S. Metropolitan Areas over Time (1992–2002): Estimation Methods and Prevalence Trends Hannah L. F. Cooper, Joanne E. Brady, Samuel R. Friedman, Barbara Tempalski, Karla Gostnell, and Peter L. Flom ABSTRACT No adequate data exist on patterns of injection drug use (IDU) prevalence over time within racial/ethnic groups in U.S. geographic areas. The absence of such prevalence data limits our understanding of the causes and consequences of IDU and hampers planning efforts for IDU-related interventions. Here, we (1) describe a method of estimating IDU prevalence among non-Hispanic Black and non-Hispanic White adult residents of 95 large U.S. metropolitan statistical areas (MSAs) annually over an 11-year period (1992–2002); (2) validate the resulting prevalence estimates; and (3) document temporal trends in these prevalence estimates. IDU prevalence estimates for Black adults were calculated in several steps: we (1) created estimates of the proportion of injectors who were Black in each MSA and year by analyzing databases documenting injectors’ encounters with the healthcare system; (2) multiplied the resulting proportions by previously calculated estimates of the total number of injectors in each MSA and year (Brady et al., 2008); (3) divided the result by the number of Black adults living in each MSA each year; and (4) validated the resulting estimates by correlating them cross-sectionally with theoretically related constructs (Black- and White- specific prevalences of drug-related mortality and of mortality from hepatitis C). We used parallel methods to estimate and validate White IDU prevalence. We analyzed trends in the resulting racial/ethnic-specific IDU prevalence estimates using measures of central tendency and hierarchical linear models (HLM). Black IDU prevalence declined from a median of 279 injectors per 10,000 adults in 1992 to 156 injectors per 10,000 adults in 2002. IDU prevalence for White adults remained relatively flat over time (median values ranged between 86 and 97 injectors per 10,000 adults). HLM analyses described similar trends and suggest that declines in Black IDU prevalence decelerated over time. Both sets of IDU estimates correlated cross-sectionally adequately with validators, suggesting that they have acceptable convergent validity (range for Black IDU prevalence validation: 0.27 G r G 0.61; range for White IDU prevalence: 0.38 G r G 0.80). These data give insight, for the first time, into IDU prevalence trends among Black adults and White adults in large U.S. MSAs. The decline seen here for Black adults may partially explain recent reductions in newly reported cases of IDU-related HIV evident in surveillance data on this population. Declining Black IDU prevalence may have been produced by (1) high AIDS-related mortality rates among Black injectors in the 1990s, rates lowered by the advent of HAART; (2) reduced IDU incidence Cooper is with the Department of Behavioral Sciences and Health Education, Rollins School of Public Health at Emory University, Atlanta, GA, USA. Brady, Friedman, Tempalski, Gostnell, and Flom are with the National Development and Research Institutes, Inc, New York, NY, USA; Friedman is with the Bloomberg School of Public Health, Johns Hopkins University, Baltimore, MD, USA; Flom is with the Brainscope, New York, NY, USA. Correspondence: Hannah L. Cooper, ScD, Rollins School of Public Health, Emory University, 1518 Clifton Road, NE-Room 568, Atlanta, GA 30322, USA. (E-mail: [email protected]) Electronic supplementary material The online version of this article (doi:10.1007/s11524-008-9304-9) contains supplementary material, which is available to authorized users. 826
Transcript of Estimating the Prevalence of Injection Drug Use among Black and White Adults in Large U.S....
Journal of Urban Health: Bulletin of the New York Academy of Medicine, Vol. 85, No. 6doi:10.1007/s11524-008-9304-9* 2008 The New York Academy of Medicine
Estimating the Prevalence of Injection DrugUse among Black and White Adults in Large U.S.Metropolitan Areas over Time (1992–2002):Estimation Methods and Prevalence Trends
Hannah L. F. Cooper, Joanne E. Brady, Samuel R. Friedman,Barbara Tempalski, Karla Gostnell, and Peter L. Flom
ABSTRACT No adequate data exist on patterns of injection drug use (IDU) prevalence overtimewithin racial/ethnic groups inU.S. geographic areas. The absence of such prevalence datalimits our understanding of the causes and consequences of IDU and hampers planningefforts for IDU-related interventions. Here, we (1) describe a method of estimating IDUprevalence among non-Hispanic Black and non-Hispanic White adult residents of 95 largeU.S. metropolitan statistical areas (MSAs) annually over an 11-year period (1992–2002); (2)validate the resulting prevalence estimates; and (3) document temporal trends in theseprevalence estimates. IDU prevalence estimates for Black adults were calculated in severalsteps: we (1) created estimates of the proportion of injectors whowere Black in eachMSA andyear by analyzing databases documenting injectors’ encounters with the healthcare system;(2) multiplied the resulting proportions by previously calculated estimates of the total numberof injectors in eachMSA and year (Brady et al., 2008); (3) divided the result by the number ofBlack adults living in each MSA each year; and (4) validated the resulting estimates bycorrelating them cross-sectionally with theoretically related constructs (Black- and White-specific prevalences of drug-related mortality and of mortality from hepatitis C). We usedparallel methods to estimate and validate White IDU prevalence. We analyzed trends in theresulting racial/ethnic-specific IDU prevalence estimates using measures of central tendencyand hierarchical linear models (HLM). Black IDU prevalence declined from a median of 279injectors per 10,000 adults in 1992 to 156 injectors per 10,000 adults in 2002. IDUprevalence forWhite adults remained relatively flat over time (median values ranged between86 and 97 injectors per 10,000 adults). HLM analyses described similar trends and suggestthat declines in Black IDU prevalence decelerated over time. Both sets of IDU estimatescorrelated cross-sectionally adequately with validators, suggesting that they have acceptableconvergent validity (range for Black IDU prevalence validation: 0.27 G r G 0.61; range forWhite IDU prevalence: 0.38 G r G 0.80). These data give insight, for the first time, into IDUprevalence trends among Black adults and White adults in large U.S. MSAs. The declineseen here for Black adults may partially explain recent reductions in newly reported cases ofIDU-related HIV evident in surveillance data on this population. Declining Black IDUprevalence may have been produced by (1) high AIDS-related mortality rates among Blackinjectors in the 1990s, rates lowered by the advent of HAART; (2) reduced IDU incidence
Cooper is with the Department of Behavioral Sciences and Health Education, Rollins School of PublicHealth at Emory University, Atlanta, GA, USA. Brady, Friedman, Tempalski, Gostnell, and Flom are withthe National Development and Research Institutes, Inc, New York, NY, USA; Friedman is with theBloomberg School of Public Health, Johns Hopkins University, Baltimore, MD, USA; Flom is with theBrainscope, New York, NY, USA.
Correspondence: Hannah L. Cooper, ScD, Rollins School of Public Health, Emory University, 1518Clifton Road, NE-Room 568, Atlanta, GA 30322, USA. (E-mail: [email protected])
Electronic supplementary material The online version of this article (doi:10.1007/s11524-008-9304-9)contains supplementary material, which is available to authorized users.
826
among Black drug users; and/or (3) MSA-level social processes (e.g., diminishing residentialsegregation). The stability of IDU prevalence among White adults between 1992 and 2002may be a function of lower AIDS-related mortality rates in this population; relative stability(and perhaps increases in some MSAs) in initiating IDU among White drug users; andsocial processes. Future research should investigate the extent to which these racial/ethnic-specific IDU prevalence trends (1) explain, and are explained by, recent trends in IDU-related health outcomes, and (2) are determined by MSA-level social processes.
KEYWORDS Injection drug use, Race/ethnicity, Metropolitan statistical areas,Epidemiology
INTRODUCTION
No adequate data exist with which to track patterns of injection drug use prevalenceover time among members of specific racial/ethnic groups in U.S. geographic areas.Given pronounced racial/ethnic differences in patterns of drug-related health out-comes,1–5 drug treatment needs,6–12 and determinants of illicit substance use,13 theabsence of such data hampers public health surveillance and planning efforts, andlimits research on the etiology and consequences of injection drug use (IDU). In thispaper, we (1) describe a method of estimating IDU prevalence among non-HispanicBlack and non-Hispanic White adult residents of large U.S. metropolitan statisticalareas (MSAs) annually over an 11-year period (1992–2002); (2) validate the resultingprevalence estimates; and (3) document temporal trends in these prevalence estimates.
Existing drug-related surveillance methods and estimation techniques are notdesigned to capture temporal trends in IDU in different racial/ethnic groups and U.S.geographic areas. The National Survey on Drug Use and Health (NSDUH), the primarysource of information on illicit drug use in the U.S., is poorly equipped to captureinjectors in the general population for four main reasons.14,15 First, IDU is a relativelyrare behavior, and thus, its prevalence is difficult to estimate with precision through thehousehold survey methods employed by NSDUH.16,17 Second, NSDUH cautionsagainst using data for longitudinal analyses, given changes in data collection methodsover time.18 Third, the NSDUH sampling frame excludes populations with high IDUprevalences (e.g., incarcerated individuals and non-sheltered homeless individu-als).14,15,19 Fourth, NSDUH study participants substantially underreport recent in-jecting.14,15 The latter two threats to validity may render NSDUH estimates of injectingwithin specific racial/ethnic groups particularly problematic. Populations that NSDUHexcludes tend to be disproportionately non-Hispanic Black and Hispanic/Latino,20,21
and the likelihood of underreporting illicit substance use in surveys may vary by race/ethnicity, with non-Hispanic White adults and adolescents most likely to accuratelyreport recent use.22,23
Capture/recapture methods, commonly applied to enumerate IDU populationsliving in a single city, are ill-suited to estimating IDU prevalence (both in the generalpopulation and within particular subgroups) in multiple geographic areas. Thesemethods enumerate “hidden” populations by cross-referencing personal identifiers(e.g., names or social security numbers) in two or more databases.24–26 Because ofconfidentiality policies and laws in the U.S., gaining access to personally identifyinginformation, particularly when linked to data on illegal behavior, becomes in-creasingly prohibitive as the number of geographic areas under study rises.
Here, we describe a method of calculating IDU prevalence among non-HispanicWhite and non-Hispanic Black (hereafter referred to as White and Black) residents of
ESTIMATING INJECTION DRUG USE AMONG BLACK AND WHITE ADULTS 827
large U.S. MSAs over time by analyzing three databases documenting injectors’ en-counters with the healthcare system between 1992 and 2002. These databases are theSubstance Abuse and Mental Health Service Administration’s (SAMHSA’s) TreatmentEntry Data System (TEDS);27 the Centers for Disease Control and Prevention’s (CDC’s)AIDS Public Information Data Set (APIDS);28 and the CDC’s HIV Counseling andTesting Services database (CTS).29 As discussed below, we analyzed these three data-bases because we posited that the biases inhering in each database would counter-balance those in the others. These methods extend methods originally developed toestimate racial/ethnic disparities in IDU in large U.S. MSAs in 1998.30
Developing a method to track racial/ethnic-specific IDU prevalence estimates overtime could advance public health research and planning efforts in key ways. Theresulting prevalence estimates could support interpretation of surveillance data onracial/ethnic-specific trends in injection-related health problems by providing, for thefirst time, estimates of trends in the size of the at-risk populations. Recent data on HIVinfection illustrate the need for such estimates: between 2001 and 2004, the number ofcases of newly diagnosed injection-related HIV in the 35 U.S. areas with name-basedreporting declined more steeply for Black adults and adolescents than for their Whitecounterparts, though the number of such cases for Black adults and adolescentssubstantially exceeded those for Whites throughout this period.5 Presently, it isimpossible to determine the extent to which these trends were produced by divergingtemporal trends in the size of the at-risk populations (i.e., Black injectors and Whiteinjectors). Clarifying the etiology of trends in injection-related HIV infection is vital toevaluating the effectiveness of past interventions and to developing strategies tofurther reduce HIV incidence.
These estimates may also lay the foundation for advancing research on thestructural determinants of injecting. This line of inquiry remains relatively underdevel-oped,31 despite resurging public health recognition that social processes shapedistributions of health and disease across populations.32–34 The few studies conductedto date on the structural determinants of substance use testify to the promise of thisline of inquiry, both for understanding patterns of injecting in the overall population,as well as within and across racial/ethnic groups.13,35–41 The estimates described hereare intended to support future analyses of the ways that MSA-level structural factorsshape temporal and spatial variations in IDU among Black adults and White adults.
Finally, because drug-related service needs vary by race/ethnicity,6–12 the racial/ethnic-specific IDU prevalence estimates presented here can help inform planningefforts for programs serving large numbers of injectors, such as methadonemaintenance programs and syringe exchange programs.
In the following sections, we describe our method of estimating IDU prevalenceamong Black adults andWhite adults living in large U.S.MSAs each year between 1992and 2002, validate these estimates, and report their trends.We closewith a discussion ofthe limitations of this IDU prevalence estimation method, and propose several possiblecauses and consequences of the observed racial/ethnic-specific IDU prevalence trendsthat merit investigation.
MATERIALS AND METHODS
OverviewWe created our racial/ethnic-specific IDU prevalence estimates in four stages. In stage 1,we estimated the proportion of all injectors in eachMSA and year who were Black and
COOPER ET AL.828
who were White by analyzing data documenting injectors’ encounters with the health-care system. In stage 2, we multiplied these racial/ethnic-specific proportions by ourprevious estimates of the total number of injectors (regardless of race/ethnicity) living ineach MSA each year (Brady et al., 2008) to produce estimates of the number of Blackand of White injectors living in each MSA each year of the study period. In stage 3, wedivided the resulting counts by the size of their respective “at risk” populations (i.e.,Black adults andWhite adults) to create racial/ethnic-specific IDU prevalence estimatesfor each MSA and year. In stage 4, we validated the resulting prevalence estimates. Werestricted our prevalence estimates to Black and White injectors because the databasesanalyzed had extensive missing data and small cell sizes, which would yield unstableestimates, for other racial/ethnic groups in many MSAs.
Descriptive statistics and hierarchical linear modeling (HLM) were then used todescribe trends in the resulting estimates. Before discussing our estimation methodsand their subsequent analysis, we describe our unit of analysis and study sample.
Unit of Analysis and SampleMSAs are defined by the Office of Management and Budget (OMB) as adjacentcounties that collectively form a single cohesive socioeconomic unit and include at leastone central city home to 50,000 people or more.42,43 We chose MSAs as our unit ofanalysis because they are salient epidemiologic units with which to study injecting:drug-related epidemics can migrate from central cities to the surrounding suburbs,and suburban injectors may travel to the central city to receive services and engage indrug-related activity.44,45 OMB altered MSA boundaries slightly during the studyperiod;46 throughout our analyses, we use 1993 MSA boundaries�.
MSAs were included in this sample if they had a population size of 500,000 ormore in 1992, the beginning of our study period. Ninety-six MSAs met this criterion;one MSA, San Juan-Bayamon, had to be dropped because of extensive missing data.The remaining 95 MSAs were located in 38 states and Washington, DC, and had amedian population in 2000 of 1.26 million (range: 546,061 to 9,545,829). Nearly twothirds of the U.S. population lived in these 95 MSAs in the year 2000.
Estimating IDU Prevalence for Black and for White adults
Stage 1: Estimating the proportion of injectors who were Black and who wereWhite in each MSA and year
To estimate the proportion of injectors in each of these MSAs who were Black andwho were White for each year of our study period, we analyzed data from threedatabases documenting injectors’ encounters with the healthcare system: TEDS, CTS,and APIDS. TEDS documents admissions to all private and public drug treatmentprograms receiving state funds, certificates, or licenses.47 The extent to which TEDSrepresents a census of admissions varies across states, depending on interstate dif-ferences in reporting practices, availability of publicly funded treatment, and
�While MSAs are constructed using counties in almost all U.S. regions, in New England, MSAs arebased on cities and towns. New England County Metropolitan Areas (NECMAs), however, are county-based areas. To ensure comparability across the sample, we used NECMAs in New England. For brevity’ssake, we refer to NECMAs as MSAs henceforth.
ESTIMATING INJECTION DRUG USE AMONG BLACK AND WHITE ADULTS 829
definitions of what constitutes “treatment admission”.47 CTS describes characteristicsof individuals tested at each of the HIV counseling and testing sites reporting to theCDC.4 APIDS is a census of individuals diagnosed with AIDS in the U.S.5 Coverage ofeligible cases in APIDS and TEDS is high (983%).48–50 No data are available oncoverage in the CTS database.
Cases in these databases were included in the analysis if they: (1) reported injectingdrugs and (2) lived or sought services in one of the 95 MSAs studied. Methods ofclassifying cases as injectors, and of linking them to MSAs, varied across databases.APIDS and CTS classified individuals as injectors if they reported injecting since1978;51 in TEDS, injectors were individuals who reported injecting any drug atadmission.52
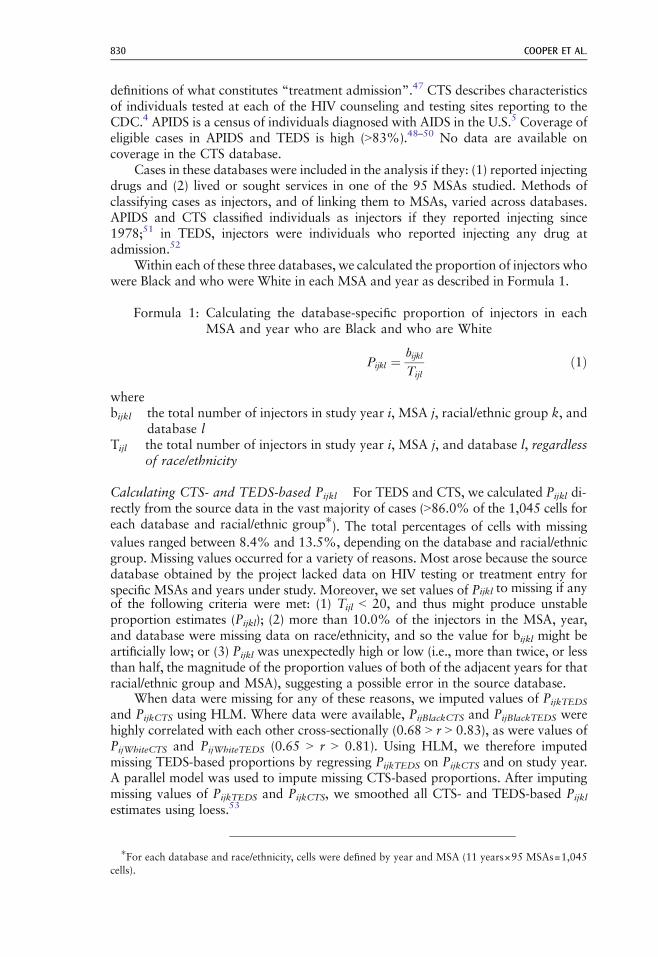
Within each of these three databases, we calculated the proportion of injectors whowere Black and who were White in each MSA and year as described in Formula 1.
Formula 1: Calculating the database-specific proportion of injectors in eachMSA and year who are Black and who are White
Pijkl ¼bijklTijl
ð1Þ
wherebijkl the total number of injectors in study year i, MSA j, racial/ethnic group k, and
database lTijl the total number of injectors in study year i, MSA j, and database l, regardless
of race/ethnicity
Calculating CTS- and TEDS-based Pijkl For TEDS and CTS, we calculated Pijkl di-rectly from the source data in the vast majority of cases (986.0% of the 1,045 cells foreach database and racial/ethnic group�). The total percentages of cells with missingvalues ranged between 8.4% and 13.5%, depending on the database and racial/ethnicgroup. Missing values occurred for a variety of reasons. Most arose because the sourcedatabase obtained by the project lacked data on HIV testing or treatment entry forspecific MSAs and years under study. Moreover, we set values of Pijkl to missing if anyof the following criteria were met: (1) Tijl G 20, and thus might produce unstableproportion estimates (Pijkl); (2) more than 10.0% of the injectors in the MSA, year,and database were missing data on race/ethnicity, and so the value for bijkl might beartificially low; or (3) Pijkl was unexpectedly high or low (i.e., more than twice, or lessthan half, the magnitude of the proportion values of both of the adjacent years for thatracial/ethnic group and MSA), suggesting a possible error in the source database.
When data were missing for any of these reasons, we imputed values of PijkTEDS
and PijkCTS using HLM. Where data were available, PijBlackCTS and PijBlackTEDS werehighly correlated with each other cross-sectionally (0.68 9 r 9 0.83), as were values ofPijWhiteCTS and PijWhiteTEDS (0.65 9 r 9 0.81). Using HLM, we therefore imputedmissing TEDS-based proportions by regressing PijkTEDS on PijkCTS and on study year.A parallel model was used to impute missing CTS-based proportions. After imputingmissing values of PijkTEDS and PijkCTS, we smoothed all CTS- and TEDS-based Pijklestimates using loess.53
�For each database and race/ethnicity, cells were defined by year and MSA (11 years×95 MSAs=1,045cells).
COOPER ET AL.830
Calculating APIDS-based Pijkl Past research indicates that White illicit drug usershave better access to drug treatment services than other illicit drug users54; a similarpattern may be evident for injectors who receive HIV testing and counseling ser-vices.55 Basing our estimates of the proportion of injectors who were Black and whowere White exclusively on TEDS and CTS data might thus produce IDU prevalenceestimates that were biased toward higher values for White adults and toward lowervalues for Black adults. Incorporating APIDS data into the estimation process isintended to counter this service bias: injectors diagnosed with AIDS are less likely tohave participated in nonemergency care services, such as drug treatment and HIVtesting, than other injectors56–59; they are also disproportionately likely to be Blackor Latino.60,61
Using APIDS data to capture the racial/ethnic-specific proportion of the injectingpopulation in a given MSA and year presents several challenges. The racial/ethniccomposition of injectors in the APIDS database is produced not only by the racial/ethniccomposition of the underlying population of injectors in that MSA and year (our targetdata), but also by (1) the uneven spread of HIV across racial/ethnic groups of injectorsand geographic areas over time;60 and (2) access to therapies delaying the onset of AIDSamong HIV-positive injectors, access which varies by race/ethnicity, place, andtime.62–65 To use APIDS data to capture the proportion of injectors who were Blackand White, we thus first had to adjust APIDS data for HIV seroprevalence and addressthe advent of highly active antiretroviral therapies (HAART) during the study period.As described in detail in “Appendix”, CTS data were used to adjust APIDS data forHIV seroprevalence, and we determined that the advent of HAART did not signifi-cantly impact the percent of injectors in the APIDS database who were Black or White.
The resulting CTS-based estimates, TEDS-based estimates, and APIDS-basedestimates (adjusted for HIV seroprevalence) of the proportion of injectors who wereBlack were then averaged across databases to create a single estimate for each yearand MSA (we call this single estimate, created by averaging the other three estimates,the “Index”); similar methods were used to estimate the proportion who wereWhite. In the interests of transparency, and to allow us to compare differentmethods of estimating IDU prevalence by race/ethnicity, we present all results usingIDU prevalence estimates based on the Index, and on each of the three databasesalone (“database-specific IDU prevalences”). Descriptive data on the Index anddatabase-specific proportions are available in the online appendix (Figs. 1 and 2 inthe Web Appendix).
Stage 2: Calculating the number of Black and White injectors in each MSA andyear
To calculate the number of Black and White injectors in each MSA and year, wemultiplied the proportions calculated in stage 1 by estimates of the total number ofinjectors (regardless of race/ethnicity) living in each MSA each year of the studyperiod. We applied multiplier/allocation methods to estimate the total number ofinjectors living in each MSA each year of the study period.66,67 These methods havebeen described in detail elsewhere68 and are reviewed in “Appendix”. Briefly, wefirst calculated the number of injectors living in the U.S. during each year of thestudy period and then allocated these national estimates to each MSA. Nationalestimates were calculated using existing data on the number of injectors living in theU.S. in 1992 and 1998,69,70 and annual data on injectors’ encounters with healthservices and with the criminal justice system. These national IDU population totals
ESTIMATING INJECTION DRUG USE AMONG BLACK AND WHITE ADULTS 831
were allocated to each of the 95 MSAs using (1) an estimate derived from publisheddata on the number of injectors living in each MSA in 1992 and in 1998,69,70 and (2)data on injectors’ service use and AIDS diagnoses. Descriptive data on the estimatednumber of injectors living in these MSAs over time are available in the onlineappendix (Fig. 3 of the Web appendix). Possible limitations of the resulting IDUestimates are described in the “Discussion” section.
Stage 3: Calculating racial/ethnic-specific prevalence estimates of injecting foreach MSA and year
To calculate racial/ethnic-specific IDU prevalence estimates, we divided ourestimates of numbers of Black and of White injectors living in each MSA each year ofthe study period (calculated in stage 2) by the total numbers of Black and of Whiteadults aged 15 to 64 years living in that MSA that year (the “at-risk” population).Population data were drawn from the Population Estimates Program (PEP).71 PEP,which is administered by the U.S. Census Bureau, calculates the total number of peopleliving in each U.S. county by race/ethnicity and age each year by analyzing U.S. decen-nial census data and data on births, deaths, migration, and military deployment.72 PEPdata are adjusted in response to successful challenges to the U.S. decennial Censuspopulation estimates.73 County-level PEP data were linked to MSAs to calculate thenumber of MSA residents aged 15–64 years who were Black and who were White foreach year of the study period.�
Stage 4: Validating the racial/ethnic-specific IDU prevalence estimates
We validated our estimates by correlating them cross-sectionally with measures oftheoretically related constructs: racial/ethnic-specific prevalences (per million) of (1)drug-relatedmortality and (2) hepatitis C virus (HCV)mortality. HCVwas selected as avalidator because it is a blood-borne infection most commonly transmitted in theUnited States via IDU.74
The number of people dying from either of these causes in each racial/ethnic group,MSA, and year was extracted from the National Center for Health Statistics’ MultipleCause of Death database, a census of all deaths in the U.S.75 This database used theICD-9 coding system to identify causes of death between 1992 and 1998; the ICD-10coding system was used thereafter.75
Identifying Drug-related Deaths To identify cases of drug-related mortality withinthe Multiple Cause of Death database, we adapted algorithms proposed by theEuropean Monitoring Centre for Drugs and Drug Addiction (EMCDDA) which useICD-9 and ICD-10 codes (depending on the year of interest) to capture “deathshappening shortly after consumption of one or more psychoactive drugs and directly
�Notably, between 2000 and 2002, PEP counted individuals who identified as belonging to multiple racial/ethnic groups as multiple people (e.g., a single individual who self-identifies as non-Hispanic Black and non-Hispanic White will appear in the PEP database during these years as two distinct people, one of each racial/ethnic group). In contrast, multiracial individuals appear only once in 1992–1999 PEP data, either in the singleracial/ethnic category they identify with most closely or in a “more than one race/other race” group. TEDS,APIDS, and CTS all used the latter classification method throughout the time period. Given that only about1% of residents of the MSAs in our sample identified themselves as belonging to more than one racial/ethnicgroup in the 2000 Census, this shift should have a negligible impact on our estimates.
COOPER ET AL.832
related to this consumption”.76� We adapted these algorithms to capture mortalitythat was related to the use of drugs that injectors commonly inject (i.e., opioids,cocaine, and psychostimulants/amphetamines). Neither the ICD-9 nor the ICD-10coding systems identify the mode of drug administration, so we could not limit casesto those that were IDU related.
Identifying HCV Deaths Codes used to identify HCV mortality were based on areview of published literature on acute and chronic HCV. e.g., 77,78 The recent advent ofHCV testing (1990 in the U.S.79) has two implications for the validation analysis. First,since dissemination of the HCV test across the U.S. may have taken time, we begin thisportion of the validation analysis in 1995. Second, HCV-specific codes appear in theICD-10 coding system, but not in the ICD-9 system. In the ICD-9 system, HCV wascoded as “Other specified viral hepatitis” (i.e., non-A, non-B hepatitis), a category thatmay have also included hepatitis D, E, and G. Our ICD-9-based measure of HCVmortality is thus less specific than the ICD-10-based measure, though the differenceshould be slight, given the rarity of mortality from hepatitis D-G in the U.S.80,81
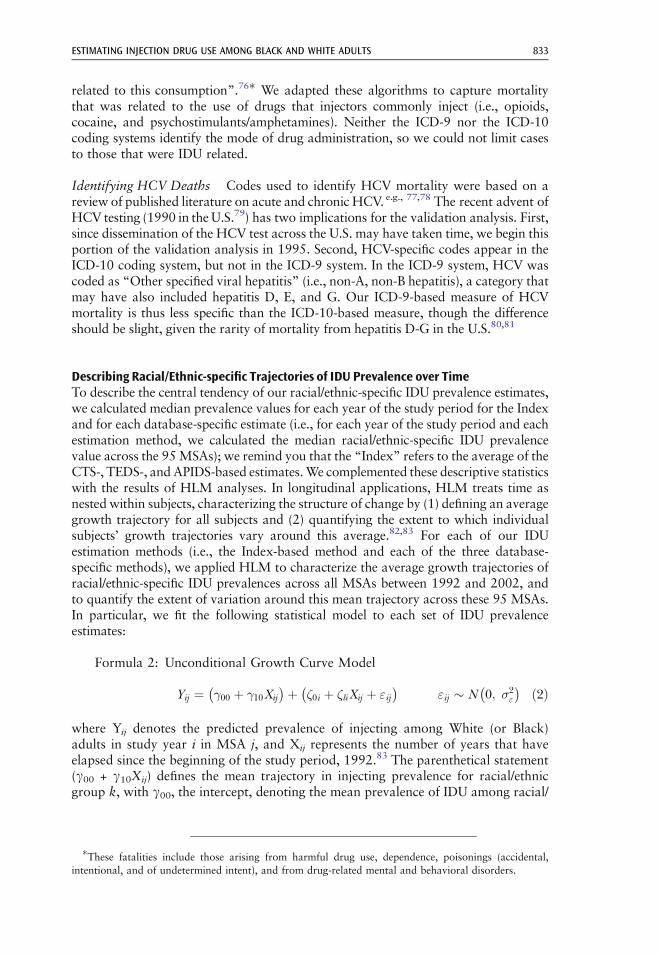
Describing Racial/Ethnic-specific Trajectories of IDU Prevalence over TimeTo describe the central tendency of our racial/ethnic-specific IDU prevalence estimates,we calculated median prevalence values for each year of the study period for the Indexand for each database-specific estimate (i.e., for each year of the study period and eachestimation method, we calculated the median racial/ethnic-specific IDU prevalencevalue across the 95MSAs); we remind you that the “Index” refers to the average of theCTS-, TEDS-, and APIDS-based estimates.We complemented these descriptive statisticswith the results of HLM analyses. In longitudinal applications, HLM treats time asnested within subjects, characterizing the structure of change by (1) defining an averagegrowth trajectory for all subjects and (2) quantifying the extent to which individualsubjects’ growth trajectories vary around this average.82,83 For each of our IDUestimation methods (i.e., the Index-based method and each of the three database-specific methods), we applied HLM to characterize the average growth trajectories ofracial/ethnic-specific IDU prevalences across all MSAs between 1992 and 2002, andto quantify the extent of variation around this mean trajectory across these 95 MSAs.In particular, we fit the following statistical model to each set of IDU prevalenceestimates:
Formula 2: Unconditional Growth Curve Model
Yij ¼ �00 þ �10Xij� �þ �0i þ �liXij þ "ij
� �"ij � N 0; �2
"
� � ð2Þ
where Yij denotes the predicted prevalence of injecting among White (or Black)adults in study year i in MSA j, and Xij represents the number of years that haveelapsed since the beginning of the study period, 1992.83 The parenthetical statement(γ00 + γ10Xij) defines the mean trajectory in injecting prevalence for racial/ethnicgroup k, with γ00, the intercept, denoting the mean prevalence of IDU among racial/
�These fatalities include those arising from harmful drug use, dependence, poisonings (accidental,intentional, and of undetermined intent), and from drug-related mental and behavioral disorders.
ESTIMATING INJECTION DRUG USE AMONG BLACK AND WHITE ADULTS 833
ethnic group k across MSAs in 1992 and γ10, the slope, denoting the mean rate ofchange in IDU prevalence for racial/ethnic group k over time across MSAs.83 Theparameters ζ0i + ζ1iXij describe inter-MSA variation around this mean trajectory: thevariances of ζ0i + ζ1i capture the extent of variation across MSAs in the intercept andslope, respectively.82 The parameter ɛij is the error term.
Formula 2 assumes that the rate of change in racial/ethnic-specific IDU prevalence isconstant over time and that ɛij has constant variance. We tested these assumptions bycomparing models that expressed study year in different ways (e.g., linear; linear andquadratic; logged), and by comparing nested error structures. Likelihood ratio tests(LRT) were used to select the optimal model when models were nested; otherwise, weselected the model with the optimal AIC. As a final model-building step, we testedHLM assumptions about the distribution of residuals and the extent to which themodel-based trajectories fitted the empirical data.83� All analyses were conductedusing SAS version 9.1.
84
RESULTS
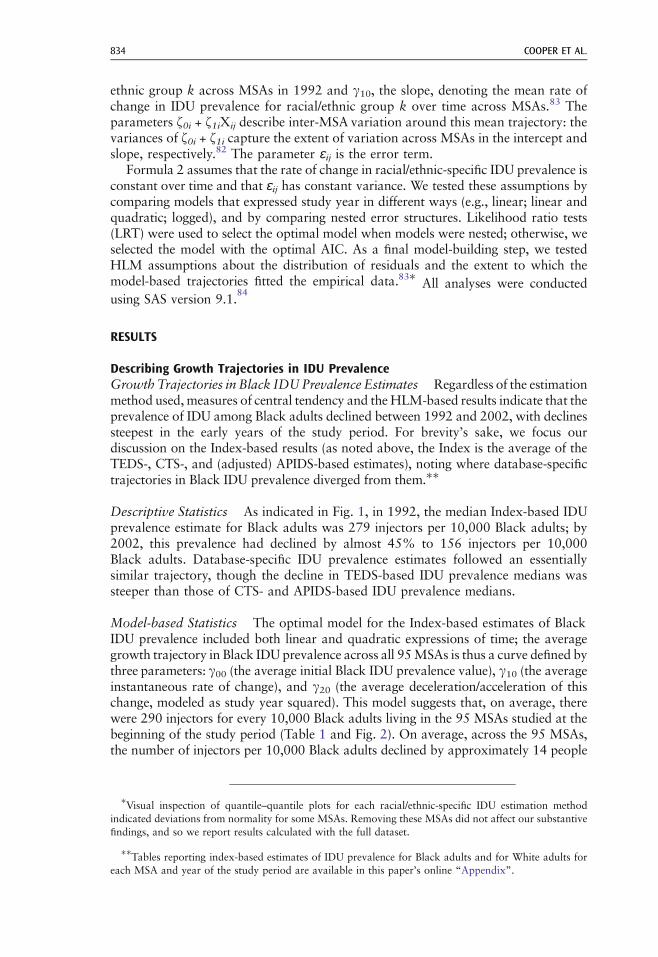
Describing Growth Trajectories in IDU PrevalenceGrowth Trajectories in Black IDUPrevalence Estimates Regardless of the estimationmethod used, measures of central tendency and the HLM-based results indicate that theprevalence of IDU among Black adults declined between 1992 and 2002, with declinessteepest in the early years of the study period. For brevity’s sake, we focus ourdiscussion on the Index-based results (as noted above, the Index is the average of theTEDS-, CTS-, and (adjusted) APIDS-based estimates), noting where database-specifictrajectories in Black IDU prevalence diverged from them.��
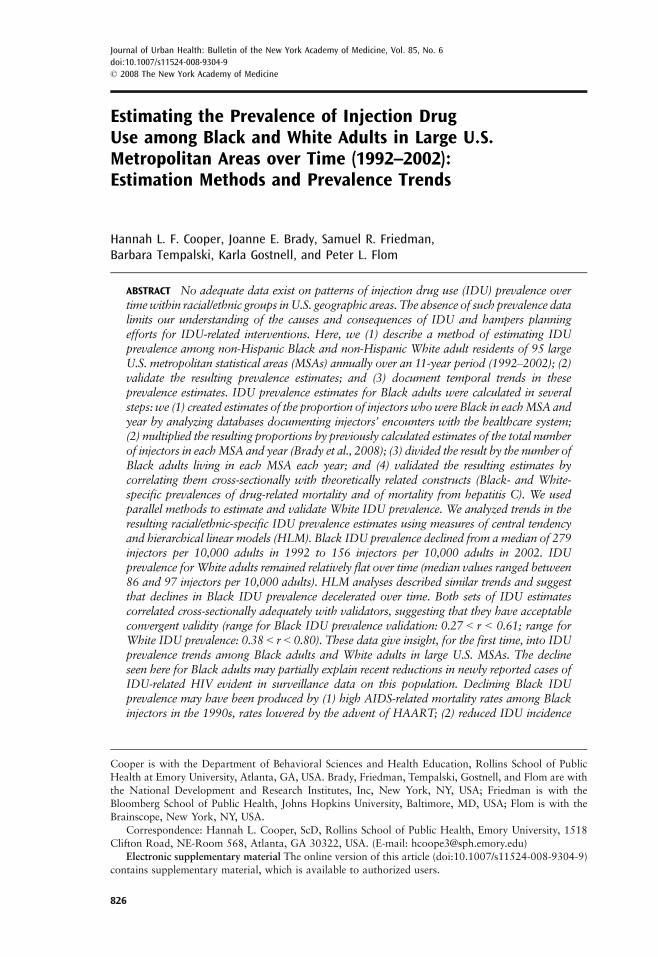
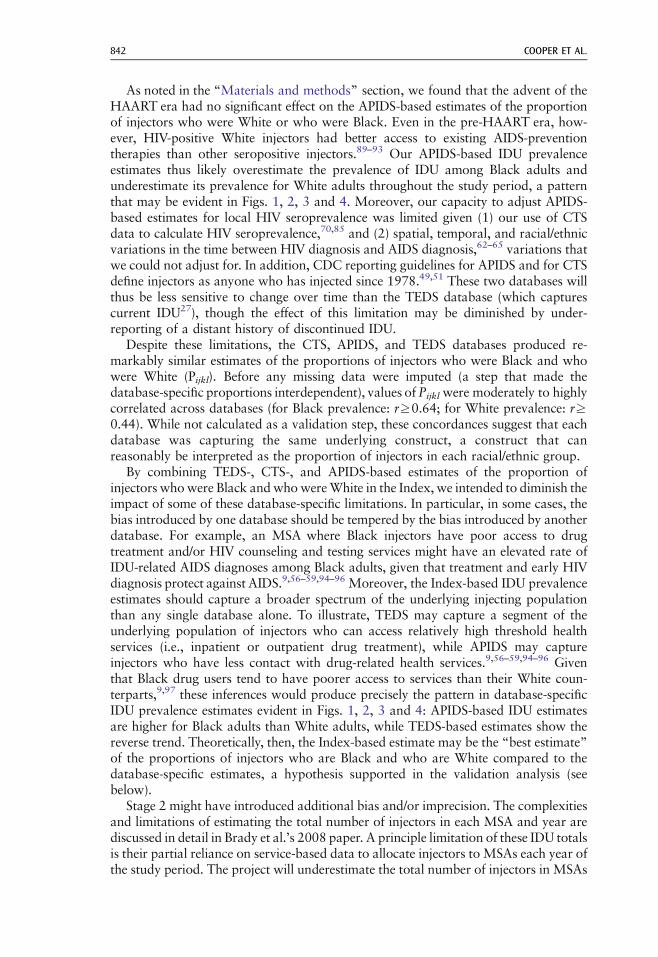
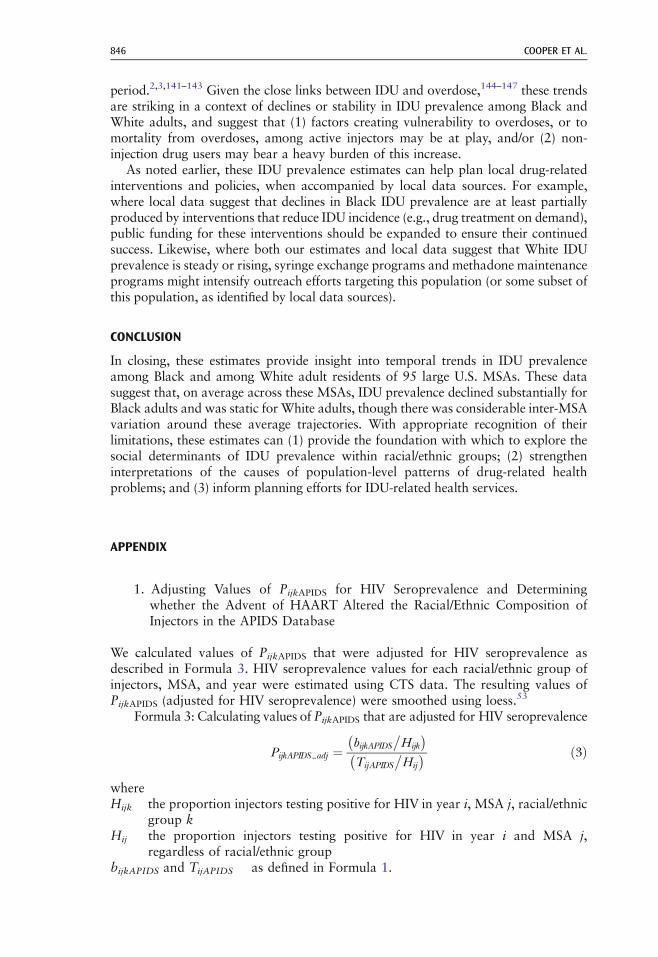
Descriptive Statistics As indicated in Fig. 1, in 1992, the median Index-based IDUprevalence estimate for Black adults was 279 injectors per 10,000 Black adults; by2002, this prevalence had declined by almost 45% to 156 injectors per 10,000Black adults. Database-specific IDU prevalence estimates followed an essentiallysimilar trajectory, though the decline in TEDS-based IDU prevalence medians wassteeper than those of CTS- and APIDS-based IDU prevalence medians.
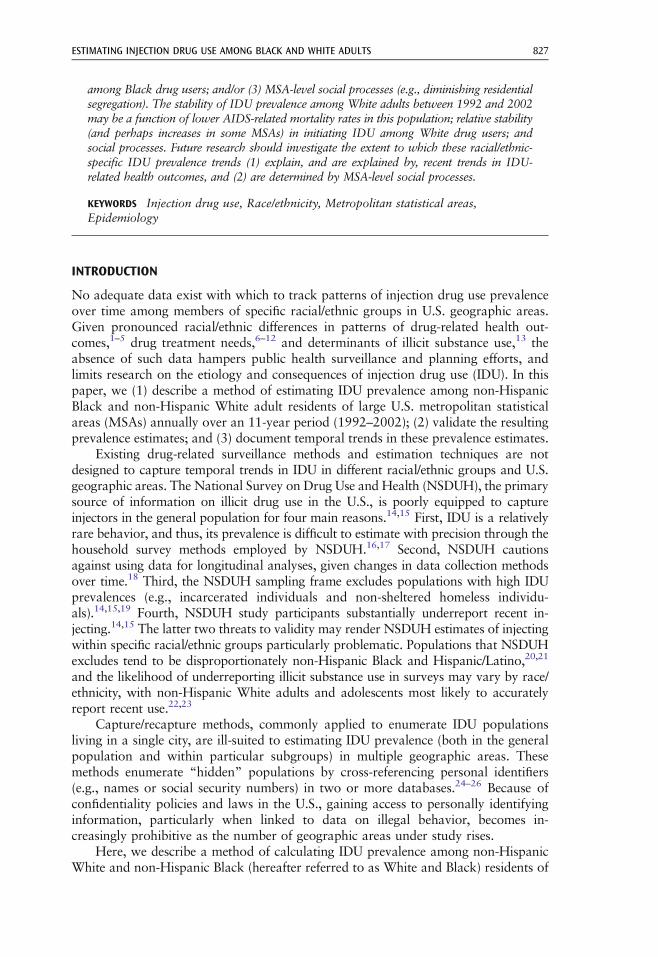
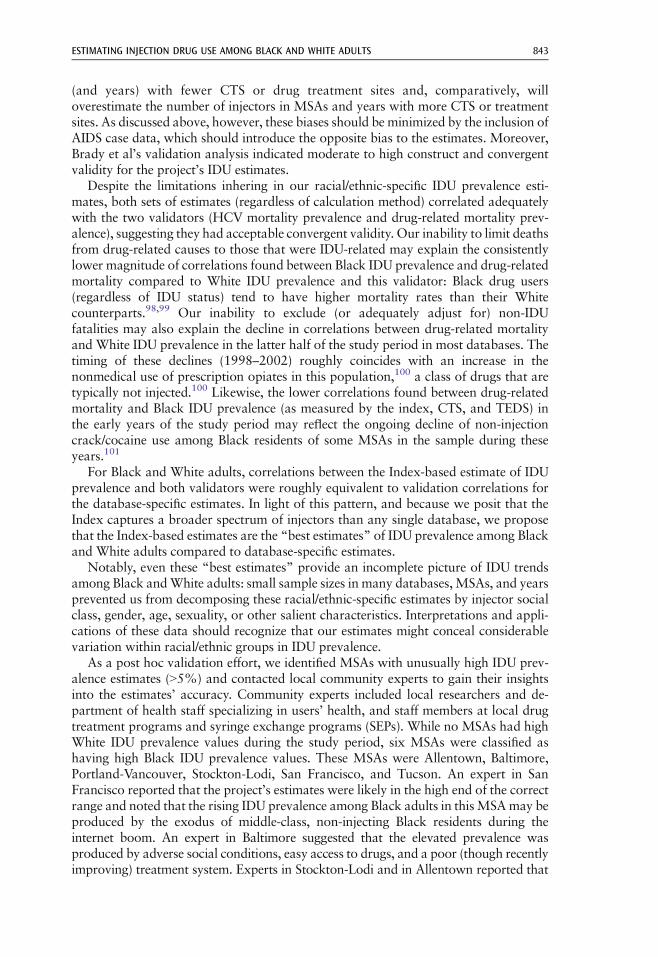
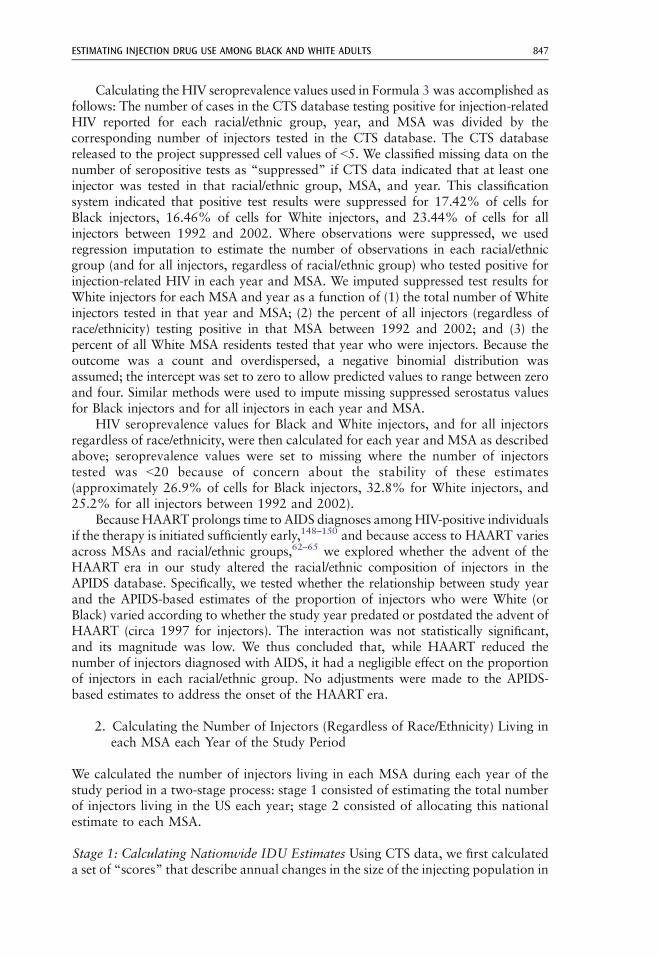
Model-based Statistics The optimal model for the Index-based estimates of BlackIDU prevalence included both linear and quadratic expressions of time; the averagegrowth trajectory in Black IDU prevalence across all 95MSAs is thus a curve defined bythree parameters: γ00 (the average initial Black IDU prevalence value), γ10 (the averageinstantaneous rate of change), and γ20 (the average deceleration/acceleration of thischange, modeled as study year squared). This model suggests that, on average, therewere 290 injectors for every 10,000 Black adults living in the 95 MSAs studied at thebeginning of the study period (Table 1 and Fig. 2). On average, across the 95 MSAs,the number of injectors per 10,000 Black adults declined by approximately 14 people
�Visual inspection of quantile–quantile plots for each racial/ethnic-specific IDU estimation methodindicated deviations from normality for some MSAs. Removing these MSAs did not affect our substantivefindings, and so we report results calculated with the full dataset.
��Tables reporting index-based estimates of IDU prevalence for Black adults and for White adults foreach MSA and year of the study period are available in this paper’s online “Appendix”.
COOPER ET AL.834
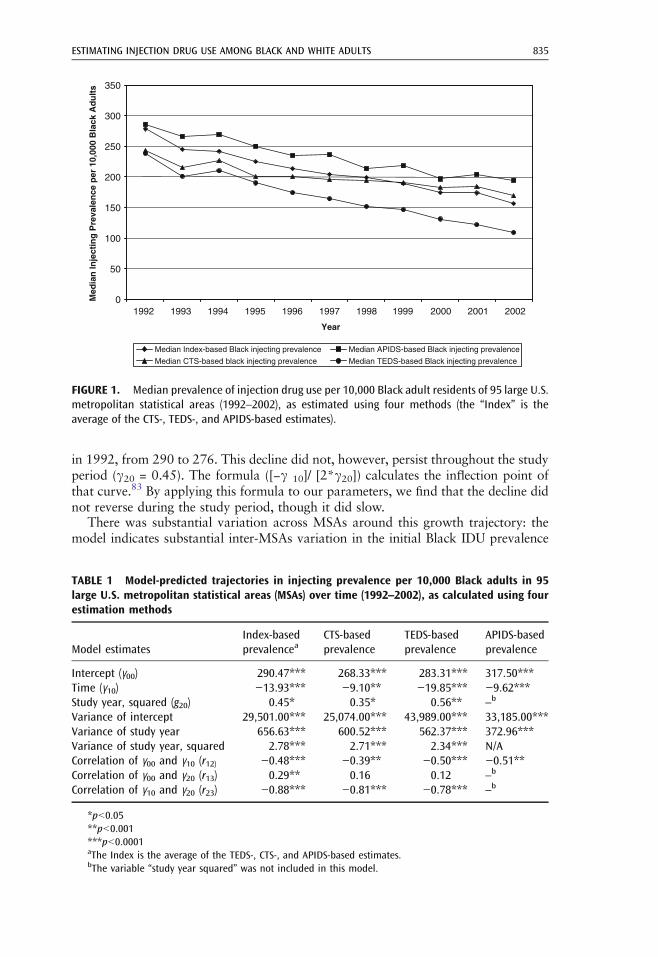
in 1992, from 290 to 276. This decline did not, however, persist throughout the studyperiod (γ20 = 0.45). The formula ([−γ 10]/ [2*γ20]) calculates the inflection point ofthat curve.83 By applying this formula to our parameters, we find that the decline didnot reverse during the study period, though it did slow.
There was substantial variation across MSAs around this growth trajectory: themodel indicates substantial inter-MSAs variation in the initial Black IDU prevalence
0
50
100
150
200
250
300
350
1992 1993 1994 1995 1996 1997 1998 1999 2000 2001 2002
Year
Med
ian
Inje
ctin
g P
reva
len
ce p
er 1
0,00
0 B
lack
Ad
ult
s
Median Index-based Black injecting prevalence Median APIDS-based Black injecting prevalence
Median CTS-based black injecting prevalence Median TEDS-based Black injecting prevalence
FIGURE 1. Median prevalence of injection drug use per 10,000 Black adult residents of 95 large U.S.metropolitan statistical areas (1992–2002), as estimated using four methods (the “Index” is theaverage of the CTS-, TEDS-, and APIDS-based estimates).
TABLE 1 Model-predicted trajectories in injecting prevalence per 10,000 Black adults in 95large U.S. metropolitan statistical areas (MSAs) over time (1992–2002), as calculated using fourestimation methods
Model estimatesIndex-basedprevalencea
CTS-basedprevalence
TEDS-basedprevalence
APIDS-basedprevalence
Intercept (γ00) 290.47*** 268.33*** 283.31*** 317.50***Time (γ10) −13.93*** −9.10** −19.85*** −9.62***Study year, squared (g20) 0.45* 0.35* 0.56** –b
Variance of intercept 29,501.00*** 25,074.00*** 43,989.00*** 33,185.00***Variance of study year 656.63*** 600.52*** 562.37*** 372.96***Variance of study year, squared 2.78*** 2.71*** 2.34*** N/ACorrelation of γ00 and γ10 (r12) −0.48*** −0.39** −0.50*** −0.51**Correlation of γ00 and γ20 (r13) 0.29** 0.16 0.12 –b
Correlation of γ10 and γ20 (r23) −0.88*** −0.81*** −0.78*** –b
*pG0.05**pG0.001***pG0.0001aThe Index is the average of the TEDS-, CTS-, and APIDS-based estimates.bThe variable “study year squared” was not included in this model.
ESTIMATING INJECTION DRUG USE AMONG BLACK AND WHITE ADULTS 835
value (γ00), in the instantaneous rate of change (γ10), and in whether and how muchthis rate changed over time (γ20; see Table 1). This variation had a particular struc-ture: MSAs with lower IDU prevalence values in 1992 had more modest instan-taneous declines (r: −0.48) than other MSAs; MSAs with steeper instantaneous declinessaw these declines decay more rapidly than MSAs with more gradual instantaneousdeclines (r: −0.88). Declines also decelerated more rapidly in MSAs with higher prev-alence values in 1992 (r: 0.29).
The model-based average trajectories of the CTS- and TEDS-based estimatesfollowed essentially similar trajectories to the Index-based trajectory: 1992 values were268 and 283 injectors per 10,000 residents, respectively, and declined thereafter, withdeclines decelerating over time. In contrast, the model-based average trajectory forAPIDS-based estimates was higher initially (γ00 = 318) than CTS- and TEDS-basedtrajectories, and the APIDS-based estimates declined steadily over time. As with theIndex-based trajectories, there was considerable variation around each of three meandatabase-specific IDU prevalence trajectories. In the main, this variation wasstructured similarly to that around the mean Index-based trajectory.
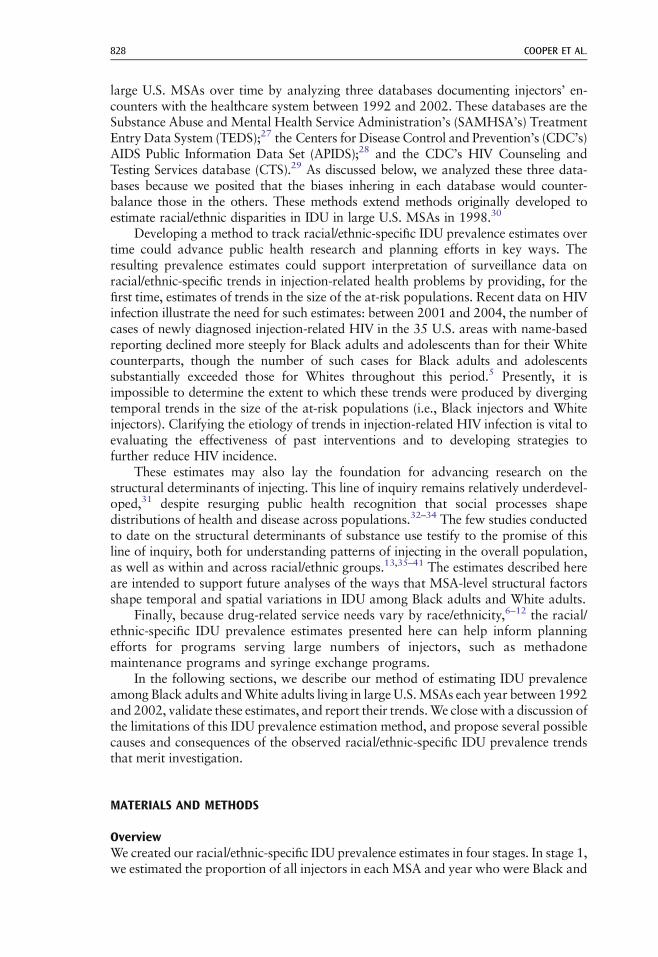
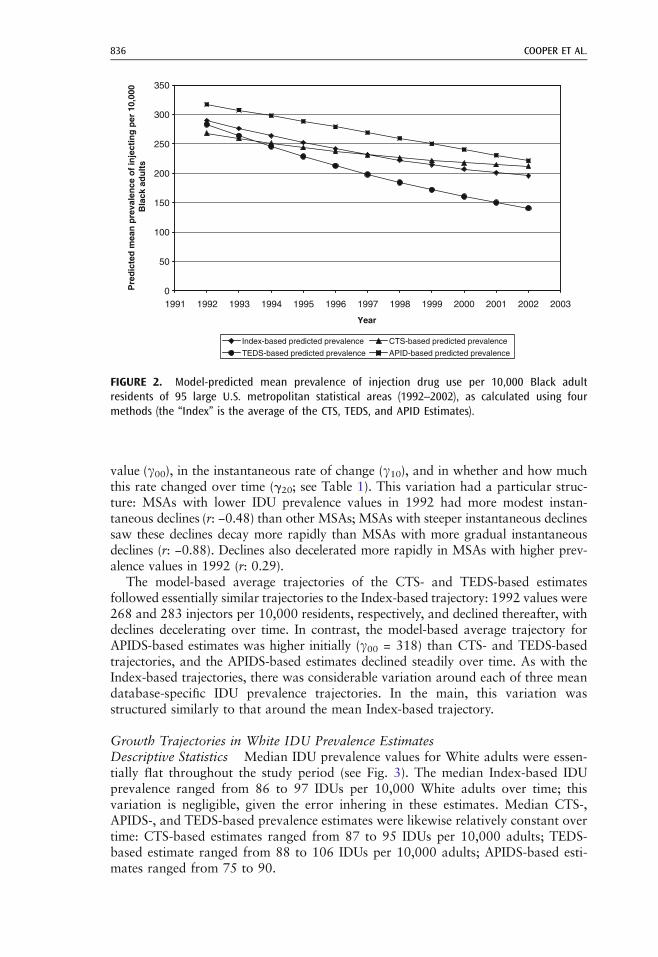
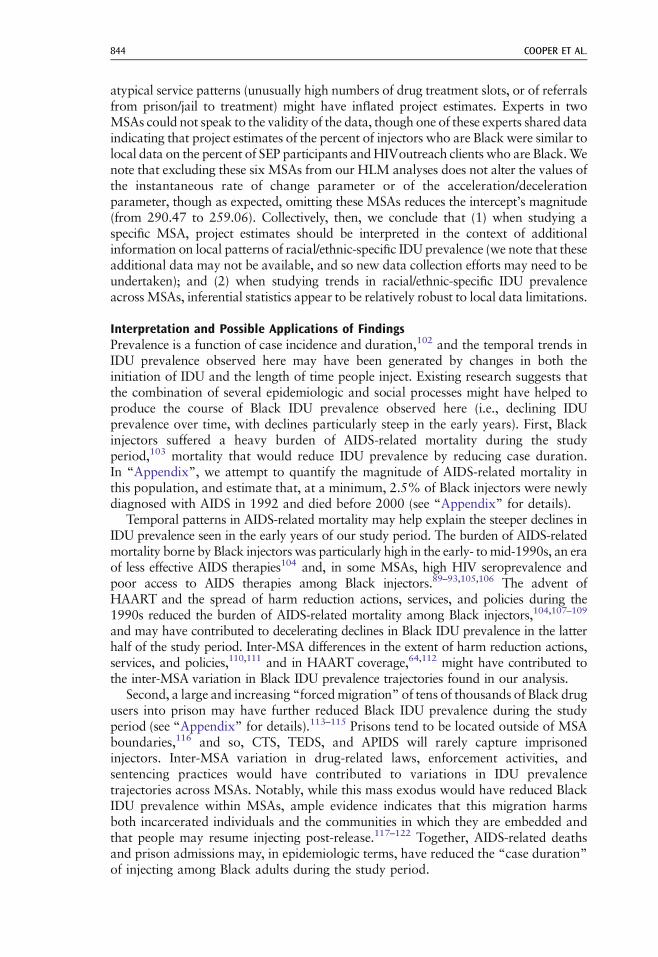
Growth Trajectories in White IDU Prevalence EstimatesDescriptive Statistics Median IDU prevalence values for White adults were essen-tially flat throughout the study period (see Fig. 3). The median Index-based IDUprevalence ranged from 86 to 97 IDUs per 10,000 White adults over time; thisvariation is negligible, given the error inhering in these estimates. Median CTS-,APIDS-, and TEDS-based prevalence estimates were likewise relatively constant overtime: CTS-based estimates ranged from 87 to 95 IDUs per 10,000 adults; TEDS-based estimate ranged from 88 to 106 IDUs per 10,000 adults; APIDS-based esti-mates ranged from 75 to 90.
0
50
100
150
200
250
300
350
1991 1992 1993 1994 1995 1996 1997 1998 1999 2000 2001 2002 2003
Year
Pre
dic
ted
mea
n p
reva
len
ce o
f in
ject
ing
per
10,
000
Bla
ck a
du
lts
Index-based predicted prevalence CTS-based predicted prevalence
TEDS-based predicted prevalence APID-based predicted prevalence
FIGURE 2. Model-predicted mean prevalence of injection drug use per 10,000 Black adultresidents of 95 large U.S. metropolitan statistical areas (1992–2002), as calculated using fourmethods (the “Index” is the average of the CTS, TEDS, and APID Estimates).
COOPER ET AL.836
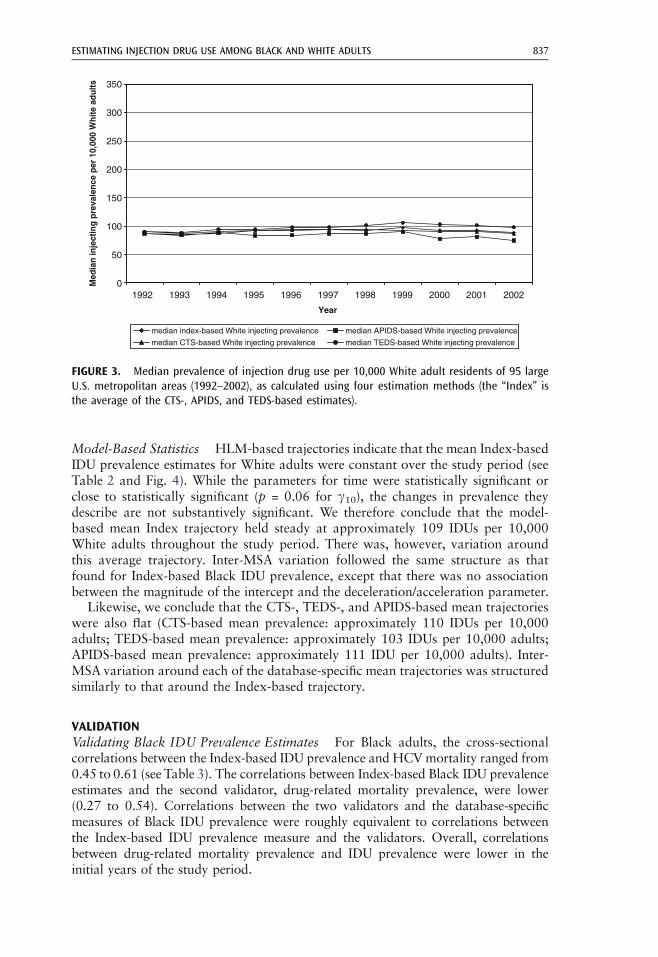
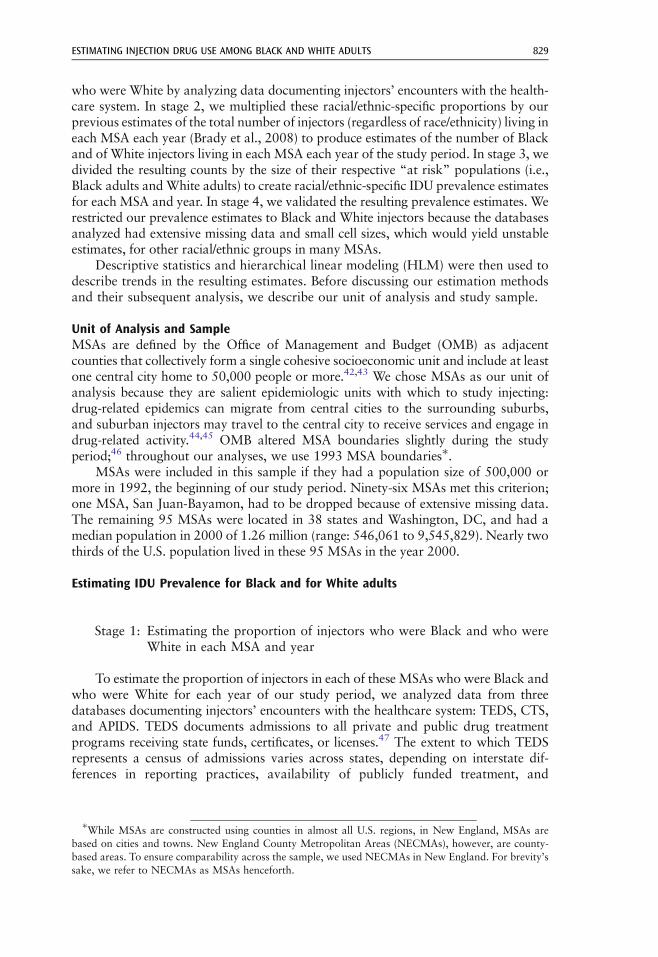
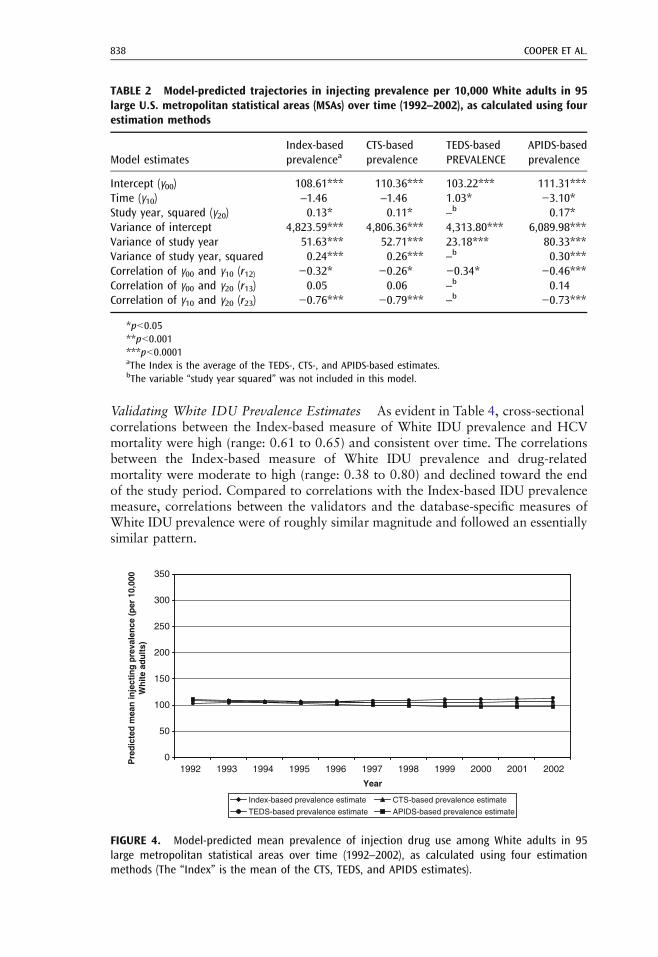
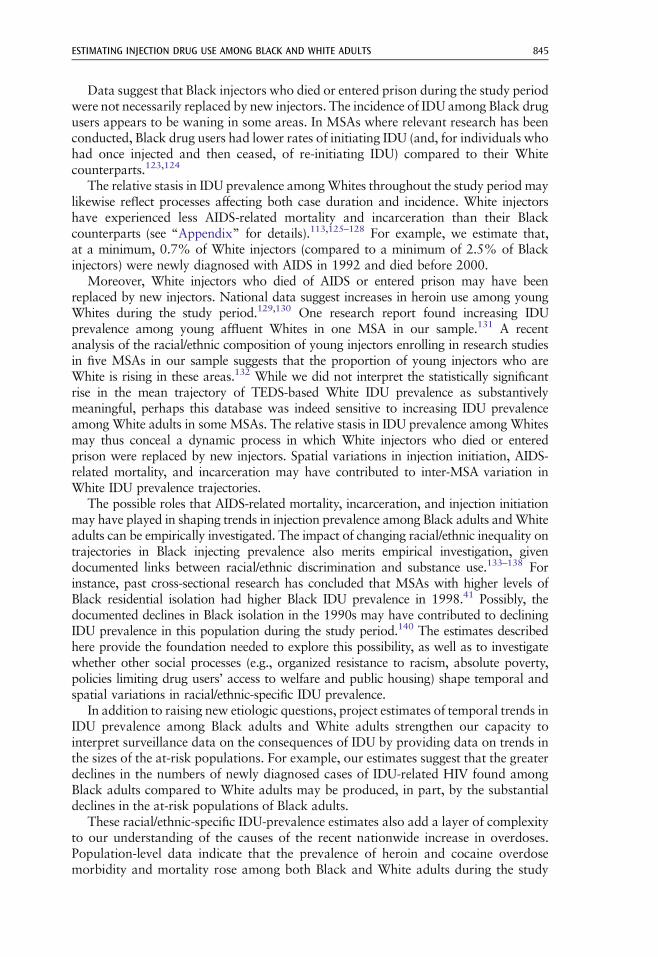
Model-Based Statistics HLM-based trajectories indicate that the mean Index-basedIDU prevalence estimates for White adults were constant over the study period (seeTable 2 and Fig. 4). While the parameters for time were statistically significant orclose to statistically significant (p = 0.06 for γ10), the changes in prevalence theydescribe are not substantively significant. We therefore conclude that the model-based mean Index trajectory held steady at approximately 109 IDUs per 10,000White adults throughout the study period. There was, however, variation aroundthis average trajectory. Inter-MSA variation followed the same structure as thatfound for Index-based Black IDU prevalence, except that there was no associationbetween the magnitude of the intercept and the deceleration/acceleration parameter.
Likewise, we conclude that the CTS-, TEDS-, and APIDS-based mean trajectorieswere also flat (CTS-based mean prevalence: approximately 110 IDUs per 10,000adults; TEDS-based mean prevalence: approximately 103 IDUs per 10,000 adults;APIDS-based mean prevalence: approximately 111 IDU per 10,000 adults). Inter-MSA variation around each of the database-specific mean trajectories was structuredsimilarly to that around the Index-based trajectory.
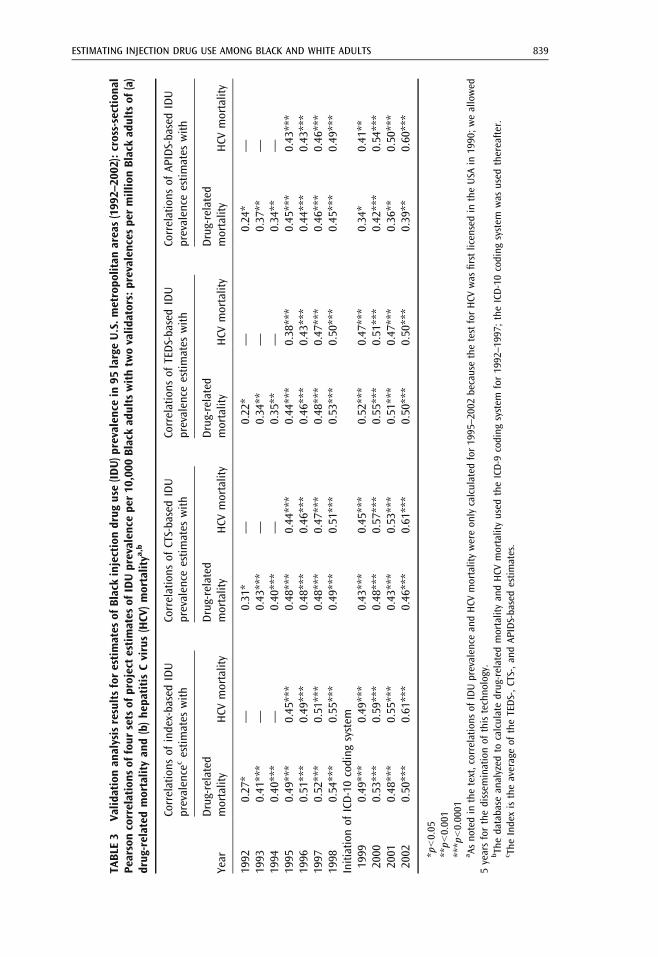
VALIDATIONValidating Black IDU Prevalence Estimates For Black adults, the cross-sectionalcorrelations between the Index-based IDU prevalence and HCVmortality ranged from0.45 to 0.61 (see Table 3). The correlations between Index-based Black IDU prevalenceestimates and the second validator, drug-related mortality prevalence, were lower(0.27 to 0.54). Correlations between the two validators and the database-specificmeasures of Black IDU prevalence were roughly equivalent to correlations betweenthe Index-based IDU prevalence measure and the validators. Overall, correlationsbetween drug-related mortality prevalence and IDU prevalence were lower in theinitial years of the study period.
0
50
100
150
200
250
300
350
1992 1993 1994 1995 1996 1997 1998 1999 2000 2001 2002
Year
Med
ian
inje
ctin
g pr
eval
ence
per
10,
000
Whi
te a
dults
median index-based White injecting prevalence median APIDS-based White injecting prevalence
median CTS-based White injecting prevalence median TEDS-based White injecting prevalence
FIGURE 3. Median prevalence of injection drug use per 10,000 White adult residents of 95 largeU.S. metropolitan areas (1992–2002), as calculated using four estimation methods (the “Index” isthe average of the CTS-, APIDS, and TEDS-based estimates).
ESTIMATING INJECTION DRUG USE AMONG BLACK AND WHITE ADULTS 837
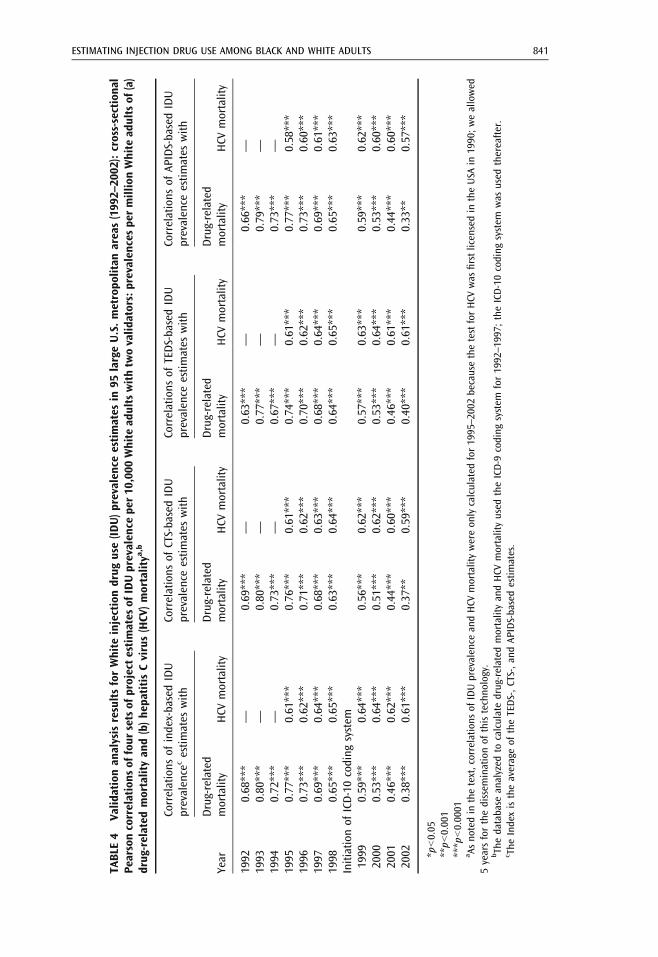
Validating White IDU Prevalence Estimates As evident in Table 4, cross-sectionalcorrelations between the Index-based measure of White IDU prevalence and HCVmortality were high (range: 0.61 to 0.65) and consistent over time. The correlationsbetween the Index-based measure of White IDU prevalence and drug-relatedmortality were moderate to high (range: 0.38 to 0.80) and declined toward the endof the study period. Compared to correlations with the Index-based IDU prevalencemeasure, correlations between the validators and the database-specific measures ofWhite IDU prevalence were of roughly similar magnitude and followed an essentiallysimilar pattern.
TABLE 2 Model-predicted trajectories in injecting prevalence per 10,000 White adults in 95large U.S. metropolitan statistical areas (MSAs) over time (1992–2002), as calculated using fourestimation methods
Model estimatesIndex-basedprevalencea
CTS-basedprevalence
TEDS-basedPREVALENCE
APIDS-basedprevalence
Intercept (γ00) 108.61*** 110.36*** 103.22*** 111.31***Time (γ10) –1.46 –1.46 1.03* −3.10*Study year, squared (γ20) 0.13* 0.11* –b 0.17*Variance of intercept 4,823.59*** 4,806.36*** 4,313.80*** 6,089.98***Variance of study year 51.63*** 52.71*** 23.18*** 80.33***Variance of study year, squared 0.24*** 0.26*** –b 0.30***Correlation of γ00 and γ10 (r12) −0.32* −0.26* −0.34* −0.46***Correlation of γ00 and γ20 (r13) 0.05 0.06 –b 0.14Correlation of γ10 and γ20 (r23) −0.76*** −0.79*** –b −0.73***
*pG0.05**pG0.001***pG0.0001aThe Index is the average of the TEDS-, CTS-, and APIDS-based estimates.bThe variable “study year squared” was not included in this model.
0
50
100
150
200
250
300
350
1992 1993 1994 1995 1996 1997 1998 1999 2000 2001 2002
Year
Pre
dict
ed m
ean
inje
ctin
g pr
eval
ence
(per
10,
000
Whi
te a
dults
)
Index-based prevalence estimate CTS-based prevalence estimate
TEDS-based prevalence estimate APIDS-based prevalence estimate
FIGURE 4. Model-predicted mean prevalence of injection drug use among White adults in 95large metropolitan statistical areas over time (1992–2002), as calculated using four estimationmethods (The “Index” is the mean of the CTS, TEDS, and APIDS estimates).
COOPER ET AL.838
TABLE
3Va
lidationan
alysisresultsforestimates
ofBlack
injectiondrug
use(ID
U)p
revalencein
95largeU.S.m
etropo
litan
areas(199
2–20
02):cross-sectiona
lPe
arsoncorrelations
offour
setsof
projectestimates
ofIDUprevalen
cepe
r10
,000
Black
adultswithtw
ovalid
ators:prevalen
cespe
rmillionBlack
adultsof
(a)
drug
-related
mortalityan
d(b)he
patitisCvirus(HCV
)mortalitya
,b
Year
Correlations
ofindex-basedIDU
prevalence
cestim
ates
with
Correlations
ofCTS-basedIDU
prevalence
estim
ates
with
Correlations
ofTEDS-basedIDU
prevalence
estim
ates
with
Correlations
ofAP
IDS-basedIDU
prevalence
estim
ates
with
Drug-related
mortality
HCV
mortality
Drug-related
mortality
HCV
mortality
Drug-related
mortality
HCV
mortality
Drug-related
mortality
HCV
mortality
1992
0.27*
—0.31*
—0.22*
—0.24*
—
1993
0.41***
—0.43***
—0.34**
—0.37**
—
1994
0.40***
—0.40***
—0.35**
—0.34**
—
1995
0.49***
0.45***
0.48***
0.44***
0.44***
0.38***
0.45***
0.43***
1996
0.51***
0.49***
0.48***
0.46***
0.46***
0.43***
0.44***
0.43***
1997
0.52***
0.51***
0.48***
0.47***
0.48***
0.47***
0.46***
0.46***
1998
0.54***
0.55***
0.49***
0.51***
0.53***
0.50***
0.45***
0.49***
Initiationof
ICD-10coding
system
1999
0.49***
0.49***
0.43***
0.45***
0.52***
0.47***
0.34*
0.41**
2000
0.53***
0.59***
0.48***
0.57***
0.55***
0.51***
0.42***
0.54***
2001
0.48***
0.55***
0.43***
0.53***
0.51***
0.47***
0.36**
0.50***
2002
0.50***
0.61***
0.46***
0.61***
0.50***
0.50***
0.39**
0.60***
*pG0.05
**pG0.001
***p
G0.0001
a Asno
tedin
thetext,correlatio
nsof
IDUprevalence
andHCV
mortalitywereon
lycalculated
for1995–2002
becausethetestforHCV
was
firstlicensedin
theUSA
in1990;weallowed
5yearsforthedissem
inationof
thistechno
logy.
bThedatabase
analyzed
tocalculatedrug-related
mortalityandHCV
mortalityused
theICD-9
coding
system
for1992–1997;theICD-10coding
system
was
used
thereafter.
c The
Indexistheaverageof
theTEDS-,CTS-,andAP
IDS-basedestim
ates.
ESTIMATING INJECTION DRUG USE AMONG BLACK AND WHITE ADULTS 839
Overall, correlations were higher forWhite IDU prevalence estimates than for BlackIDU prevalence estimates. We raise possible reasons for this—and for temporal trendsin some of the correlations—below.
DISCUSSION
To our knowledge, this analysis represents the first attempt to create racial/ethnic-specific IDU prevalence estimates over time in U.S. MSAs, or in any set of geographicareas. We found substantial racial/ethnic and temporal variation in IDU prevalence in95 large U.S. MSAs, MSAs that collectively are home to almost two thirds of the U.S.population. Regardless of the estimation method used, our data indicate that theprevalence of IDU among Black adults declined between 1992 and 2002; Index-,TEDS-, and CTS-based estimates indicate that these declines decelerated as timepassed. According to the Index, in 1992, the model-based mean IDU prevalenceamong Black adults was 290 injectors per 10,000 adults; by 2002, this meanprevalence had declined by almost one third, to 196 injectors per 10,000 adults. Incontrast, the model-based mean White IDU prevalence (as calculated by the Index)remained constant during the study period, at approximately 109 injectors per 10,000adults.
There was substantial variation across MSAs around these mean trajectories:MSAs with lower IDU prevalence values in 1992 experienced more gradualinstantaneous declines than other MSAs, andMSAs with steep instantaneous declinessaw those declines decay more rapidly than declines elsewhere. This variation isconsonant with both regression to the mean and with a floor effect (i.e., IDUprevalence cannot drop below zero). Inter-MSA variation in the structure of changemay also be a product of inter-MSA epidemiologic and social processes, as we discussbelow. Before discussing possible determinants and implications of this spatial andtemporal variation, we first review the limitations of our IDU prevalence estimates.
Limitations and Validation Limitations inhering in TEDS, CTS, and APIDS mayhave biased database-specific estimates of the proportion of injectors in each MSAand year who were Black and who were White as calculated in stage 1. Admissions,rather than individuals, are the units of analysis in the TEDS database; an individualwho enters drug treatment twice or more in a particular year is thus counted as twoor more independent cases. TEDS-based estimates of the proportion of injectors ineach racial/ethnic group may be systematically biased in MSAs where this limitationis coupled with racial/ethnic differences in patterns of re-admission to treatment in asingle year. CTS-based estimates may be affected by the extent to which the historyof the local HIV epidemic varies across racial/ethnic groups of injectors.85,86 Forinstance, in an MSA where HIV entered the local communities of Black injectorsbefore it entered communities of White injectors, CTS-based estimates of Black IDUprevalence may be artificially low, given that HIV-positive individuals are unlikely tobe retested. This bias, however, might be countered by frequent retests among HIV-negative Black injectors, who might be particularly concerned about HIVtransmission. Moreover, the racial/ethnic composition of injectors seeking drugtreatment or HIV counseling and testing may depend on the geographic location ofservice sites, given high levels of residential segregation in many U.S. MSAs.87 Giventhat predominately Black neighborhoods tend to be medically underserved,88 CTSand TEDS might underestimate the proportions of injectors who were Blackthroughout the study period in segregated MSAs.
COOPER ET AL.840
TABLE
4Va
lidationan
alysisresultsforWhite
injectiondrug
use(ID
U)p
revalenceestimates
in95
largeU.S.metropo
litan
areas(199
2–20
02):cross-sectiona
lPe
arsoncorrelations
offour
setsof
projectestimates
ofIDUprevalen
cepe
r10
,000
White
adultswithtw
ovalid
ators:prevalen
cespe
rmillionWhite
adultsof
(a)
drug
-related
mortalityan
d(b)h
epatitisCvirus(HCV
)mortalitya
,b
Year
Correlations
ofindex-basedIDU
prevalence
cestim
ates
with
Correlations
ofCTS-basedIDU
prevalence
estim
ates
with
Correlations
ofTEDS-basedIDU
prevalence
estim
ates
with
Correlations
ofAP
IDS-basedIDU
prevalence
estim
ates
with
Drug-related
mortality
HCV
mortality
Drug-related
mortality
HCV
mortality
Drug-related
mortality
HCV
mortality
Drug-related
mortality
HCV
mortality
1992
0.68***
—0.69***
—0.63***
—0.66***
—
1993
0.80***
—0.80***
—0.77***
—0.79***
—
1994
0.72***
—0.73***
—0.67***
—0.73***
—
1995
0.77***
0.61***
0.76***
0.61***
0.74***
0.61***
0.77***
0.58***
1996
0.73***
0.62***
0.71***
0.62***
0.70***
0.62***
0.73***
0.60***
1997
0.69***
0.64***
0.68***
0.63***
0.68***
0.64***
0.69***
0.61***
1998
0.65***
0.65***
0.63***
0.64***
0.64***
0.65***
0.65***
0.63***
Initiationof
ICD-10coding
system
1999
0.59***
0.64***
0.56***
0.62***
0.57***
0.63***
0.59***
0.62***
2000
0.53***
0.64***
0.51***
0.62***
0.53***
0.64***
0.53***
0.60***
2001
0.46***
0.62***
0.44***
0.60***
0.46***
0.61***
0.44***
0.60***
2002
0.38***
0.61***
0.37**
0.59***
0.40***
0.61***
0.33**
0.57***
*pG0.05
**pG0.001
***p
G0.0001
a Asno
tedin
thetext,correlatio
nsof
IDUprevalence
andHCV
mortalitywereon
lycalculated
for1995–2002
becausethetestforHCV
was
firstlicensedin
theUSA
in1990;weallowed
5yearsforthedissem
inationof
thistechno
logy.
bThedatabase
analyzed
tocalculatedrug-related
mortalityandHCV
mortalityused
theICD-9
coding
system
for1992–1997;theICD-10coding
system
was
used
thereafter.
c The
Indexistheaverageof
theTEDS-,CTS-,andAP
IDS-basedestim
ates.
ESTIMATING INJECTION DRUG USE AMONG BLACK AND WHITE ADULTS 841
As noted in the “Materials and methods” section, we found that the advent of theHAART era had no significant effect on the APIDS-based estimates of the proportionof injectors who were White or who were Black. Even in the pre-HAART era, how-ever, HIV-positive White injectors had better access to existing AIDS-preventiontherapies than other seropositive injectors.89–93 Our APIDS-based IDU prevalenceestimates thus likely overestimate the prevalence of IDU among Black adults andunderestimate its prevalence for White adults throughout the study period, a patternthat may be evident in Figs. 1, 2, 3 and 4. Moreover, our capacity to adjust APIDS-based estimates for local HIV seroprevalence was limited given (1) our use of CTSdata to calculate HIV seroprevalence,70,85 and (2) spatial, temporal, and racial/ethnicvariations in the time between HIV diagnosis and AIDS diagnosis,62–65 variations thatwe could not adjust for. In addition, CDC reporting guidelines for APIDS and for CTSdefine injectors as anyone who has injected since 1978.49,51 These two databases willthus be less sensitive to change over time than the TEDS database (which capturescurrent IDU27), though the effect of this limitation may be diminished by under-reporting of a distant history of discontinued IDU.
Despite these limitations, the CTS, APIDS, and TEDS databases produced re-markably similar estimates of the proportions of injectors who were Black and whowere White (Pijkl). Before any missing data were imputed (a step that made thedatabase-specific proportions interdependent), values ofPijkl were moderately to highlycorrelated across databases (for Black prevalence: r≥0.64; for White prevalence: r≥0.44). While not calculated as a validation step, these concordances suggest that eachdatabase was capturing the same underlying construct, a construct that canreasonably be interpreted as the proportion of injectors in each racial/ethnic group.
By combining TEDS-, CTS-, and APIDS-based estimates of the proportion ofinjectors whowere Black andwhowereWhite in the Index, we intended to diminish theimpact of some of these database-specific limitations. In particular, in some cases, thebias introduced by one database should be tempered by the bias introduced by anotherdatabase. For example, an MSA where Black injectors have poor access to drugtreatment and/or HIV counseling and testing services might have an elevated rate ofIDU-related AIDS diagnoses among Black adults, given that treatment and early HIVdiagnosis protect against AIDS.9,56–59,94–96 Moreover, the Index-based IDU prevalenceestimates should capture a broader spectrum of the underlying injecting populationthan any single database alone. To illustrate, TEDS may capture a segment of theunderlying population of injectors who can access relatively high threshold healthservices (i.e., inpatient or outpatient drug treatment), while APIDS may captureinjectors who have less contact with drug-related health services.9,56–59,94–96 Giventhat Black drug users tend to have poorer access to services than their White coun-terparts,9,97 these inferences would produce precisely the pattern in database-specificIDU prevalence estimates evident in Figs. 1, 2, 3 and 4: APIDS-based IDU estimatesare higher for Black adults than White adults, while TEDS-based estimates show thereverse trend. Theoretically, then, the Index-based estimate may be the “best estimate”of the proportions of injectors who are Black and who are White compared to thedatabase-specific estimates, a hypothesis supported in the validation analysis (seebelow).
Stage 2 might have introduced additional bias and/or imprecision. The complexitiesand limitations of estimating the total number of injectors in each MSA and year arediscussed in detail in Brady et al.’s 2008 paper. A principle limitation of these IDU totalsis their partial reliance on service-based data to allocate injectors to MSAs each year ofthe study period. The project will underestimate the total number of injectors in MSAs
COOPER ET AL.842
(and years) with fewer CTS or drug treatment sites and, comparatively, willoverestimate the number of injectors in MSAs and years with more CTS or treatmentsites. As discussed above, however, these biases should be minimized by the inclusion ofAIDS case data, which should introduce the opposite bias to the estimates. Moreover,Brady et al’s validation analysis indicated moderate to high construct and convergentvalidity for the project’s IDU estimates.
Despite the limitations inhering in our racial/ethnic-specific IDU prevalence esti-mates, both sets of estimates (regardless of calculation method) correlated adequatelywith the two validators (HCV mortality prevalence and drug-related mortality prev-alence), suggesting they had acceptable convergent validity. Our inability to limit deathsfrom drug-related causes to those that were IDU-related may explain the consistentlylower magnitude of correlations found between Black IDU prevalence and drug-relatedmortality compared to White IDU prevalence and this validator: Black drug users(regardless of IDU status) tend to have higher mortality rates than their Whitecounterparts.98,99 Our inability to exclude (or adequately adjust for) non-IDUfatalities may also explain the decline in correlations between drug-related mortalityand White IDU prevalence in the latter half of the study period in most databases. Thetiming of these declines (1998–2002) roughly coincides with an increase in thenonmedical use of prescription opiates in this population,100 a class of drugs that aretypically not injected.100 Likewise, the lower correlations found between drug-relatedmortality and Black IDU prevalence (as measured by the index, CTS, and TEDS) inthe early years of the study period may reflect the ongoing decline of non-injectioncrack/cocaine use among Black residents of some MSAs in the sample during theseyears.101
For Black and White adults, correlations between the Index-based estimate of IDUprevalence and both validators were roughly equivalent to validation correlations forthe database-specific estimates. In light of this pattern, and because we posit that theIndex captures a broader spectrum of injectors than any single database, we proposethat the Index-based estimates are the “best estimates” of IDU prevalence among Blackand White adults compared to database-specific estimates.
Notably, even these “best estimates” provide an incomplete picture of IDU trendsamong Black andWhite adults: small sample sizes in many databases,MSAs, and yearsprevented us from decomposing these racial/ethnic-specific estimates by injector socialclass, gender, age, sexuality, or other salient characteristics. Interpretations and appli-cations of these data should recognize that our estimates might conceal considerablevariation within racial/ethnic groups in IDU prevalence.
As a post hoc validation effort, we identified MSAs with unusually high IDU prev-alence estimates (95%) and contacted local community experts to gain their insightsinto the estimates’ accuracy. Community experts included local researchers and de-partment of health staff specializing in users’ health, and staff members at local drugtreatment programs and syringe exchange programs (SEPs). While no MSAs had highWhite IDU prevalence values during the study period, six MSAs were classified ashaving high Black IDU prevalence values. These MSAs were Allentown, Baltimore,Portland-Vancouver, Stockton-Lodi, San Francisco, and Tucson. An expert in SanFrancisco reported that the project’s estimates were likely in the high end of the correctrange and noted that the rising IDU prevalence among Black adults in thisMSAmay beproduced by the exodus of middle-class, non-injecting Black residents during theinternet boom. An expert in Baltimore suggested that the elevated prevalence wasproduced by adverse social conditions, easy access to drugs, and a poor (though recentlyimproving) treatment system. Experts in Stockton-Lodi and in Allentown reported that
ESTIMATING INJECTION DRUG USE AMONG BLACK AND WHITE ADULTS 843
atypical service patterns (unusually high numbers of drug treatment slots, or of referralsfrom prison/jail to treatment) might have inflated project estimates. Experts in twoMSAs could not speak to the validity of the data, though one of these experts shared dataindicating that project estimates of the percent of injectors who are Black were similar tolocal data on the percent of SEP participants andHIVoutreach clients who are Black.Wenote that excluding these six MSAs from our HLM analyses does not alter the values ofthe instantaneous rate of change parameter or of the acceleration/decelerationparameter, though as expected, omitting these MSAs reduces the intercept’s magnitude(from 290.47 to 259.06). Collectively, then, we conclude that (1) when studying aspecific MSA, project estimates should be interpreted in the context of additionalinformation on local patterns of racial/ethnic-specific IDU prevalence (we note that theseadditional data may not be available, and so new data collection efforts may need to beundertaken); and (2) when studying trends in racial/ethnic-specific IDU prevalenceacrossMSAs, inferential statistics appear to be relatively robust to local data limitations.
Interpretation and Possible Applications of FindingsPrevalence is a function of case incidence and duration,102 and the temporal trends inIDU prevalence observed here may have been generated by changes in both theinitiation of IDU and the length of time people inject. Existing research suggests thatthe combination of several epidemiologic and social processes might have helped toproduce the course of Black IDU prevalence observed here (i.e., declining IDUprevalence over time, with declines particularly steep in the early years). First, Blackinjectors suffered a heavy burden of AIDS-related mortality during the studyperiod,103 mortality that would reduce IDU prevalence by reducing case duration.In “Appendix”, we attempt to quantify the magnitude of AIDS-related mortality inthis population, and estimate that, at a minimum, 2.5% of Black injectors were newlydiagnosed with AIDS in 1992 and died before 2000 (see “Appendix” for details).
Temporal patterns in AIDS-related mortality may help explain the steeper declines inIDU prevalence seen in the early years of our study period. The burden of AIDS-relatedmortality borne by Black injectors was particularly high in the early- tomid-1990s, an eraof less effective AIDS therapies104 and, in some MSAs, high HIV seroprevalence andpoor access to AIDS therapies among Black injectors.89–93,105,106 The advent ofHAART and the spread of harm reduction actions, services, and policies during the1990s reduced the burden of AIDS-related mortality among Black injectors,104,107–109
and may have contributed to decelerating declines in Black IDU prevalence in the latterhalf of the study period. Inter-MSA differences in the extent of harm reduction actions,services, and policies,110,111 and in HAART coverage,64,112 might have contributed tothe inter-MSA variation in Black IDU prevalence trajectories found in our analysis.
Second, a large and increasing “forcedmigration” of tens of thousands of Black drugusers into prison may have further reduced Black IDU prevalence during the studyperiod (see “Appendix” for details).113–115 Prisons tend to be located outside of MSAboundaries,116 and so, CTS, TEDS, and APIDS will rarely capture imprisonedinjectors. Inter-MSA variation in drug-related laws, enforcement activities, andsentencing practices would have contributed to variations in IDU prevalencetrajectories across MSAs. Notably, while this mass exodus would have reduced BlackIDU prevalence within MSAs, ample evidence indicates that this migration harmsboth incarcerated individuals and the communities in which they are embedded andthat people may resume injecting post-release.117–122 Together, AIDS-related deathsand prison admissions may, in epidemiologic terms, have reduced the “case duration”of injecting among Black adults during the study period.
COOPER ET AL.844
Data suggest that Black injectors who died or entered prison during the study periodwere not necessarily replaced by new injectors. The incidence of IDU among Black drugusers appears to be waning in some areas. In MSAs where relevant research has beenconducted, Black drug users had lower rates of initiating IDU (and, for individuals whohad once injected and then ceased, of re-initiating IDU) compared to their Whitecounterparts.123,124
The relative stasis in IDU prevalence amongWhites throughout the study period maylikewise reflect processes affecting both case duration and incidence. White injectorshave experienced less AIDS-related mortality and incarceration than their Blackcounterparts (see “Appendix” for details).113,125–128 For example, we estimate that,at a minimum, 0.7% of White injectors (compared to a minimum of 2.5% of Blackinjectors) were newly diagnosed with AIDS in 1992 and died before 2000.
Moreover, White injectors who died of AIDS or entered prison may have beenreplaced by new injectors. National data suggest increases in heroin use among youngWhites during the study period.129,130 One research report found increasing IDUprevalence among young affluent Whites in one MSA in our sample.131 A recentanalysis of the racial/ethnic composition of young injectors enrolling in research studiesin five MSAs in our sample suggests that the proportion of young injectors who areWhite is rising in these areas.132 While we did not interpret the statistically significantrise in the mean trajectory of TEDS-based White IDU prevalence as substantivelymeaningful, perhaps this database was indeed sensitive to increasing IDU prevalenceamong White adults in some MSAs. The relative stasis in IDU prevalence among Whitesmay thus conceal a dynamic process in which White injectors who died or enteredprison were replaced by new injectors. Spatial variations in injection initiation, AIDS-related mortality, and incarceration may have contributed to inter-MSA variation inWhite IDU prevalence trajectories.
The possible roles that AIDS-related mortality, incarceration, and injection initiationmay have played in shaping trends in injection prevalence among Black adults andWhiteadults can be empirically investigated. The impact of changing racial/ethnic inequality ontrajectories in Black injecting prevalence also merits empirical investigation, givendocumented links between racial/ethnic discrimination and substance use.133–138 Forinstance, past cross-sectional research has concluded that MSAs with higher levels ofBlack residential isolation had higher Black IDU prevalence in 1998.41 Possibly, thedocumented declines in Black isolation in the 1990s may have contributed to decliningIDU prevalence in this population during the study period.140 The estimates describedhere provide the foundation needed to explore this possibility, as well as to investigatewhether other social processes (e.g., organized resistance to racism, absolute poverty,policies limiting drug users’ access to welfare and public housing) shape temporal andspatial variations in racial/ethnic-specific IDU prevalence.
In addition to raising new etiologic questions, project estimates of temporal trends inIDU prevalence among Black adults and White adults strengthen our capacity tointerpret surveillance data on the consequences of IDU by providing data on trends inthe sizes of the at-risk populations. For example, our estimates suggest that the greaterdeclines in the numbers of newly diagnosed cases of IDU-related HIV found amongBlack adults compared to White adults may be produced, in part, by the substantialdeclines in the at-risk populations of Black adults.
These racial/ethnic-specific IDU-prevalence estimates also add a layer of complexityto our understanding of the causes of the recent nationwide increase in overdoses.Population-level data indicate that the prevalence of heroin and cocaine overdosemorbidity and mortality rose among both Black and White adults during the study
ESTIMATING INJECTION DRUG USE AMONG BLACK AND WHITE ADULTS 845
period.2,3,141–143 Given the close links between IDU and overdose,144–147 these trendsare striking in a context of declines or stability in IDU prevalence among Black andWhite adults, and suggest that (1) factors creating vulnerability to overdoses, or tomortality from overdoses, among active injectors may be at play, and/or (2) non-injection drug users may bear a heavy burden of this increase.
As noted earlier, these IDU prevalence estimates can help plan local drug-relatedinterventions and policies, when accompanied by local data sources. For example,where local data suggest that declines in Black IDU prevalence are at least partiallyproduced by interventions that reduce IDU incidence (e.g., drug treatment on demand),public funding for these interventions should be expanded to ensure their continuedsuccess. Likewise, where both our estimates and local data suggest that White IDUprevalence is steady or rising, syringe exchange programs and methadone maintenanceprograms might intensify outreach efforts targeting this population (or some subset ofthis population, as identified by local data sources).
CONCLUSION
In closing, these estimates provide insight into temporal trends in IDU prevalenceamong Black and among White adult residents of 95 large U.S. MSAs. These datasuggest that, on average across these MSAs, IDU prevalence declined substantially forBlack adults and was static for White adults, though there was considerable inter-MSAvariation around these average trajectories. With appropriate recognition of theirlimitations, these estimates can (1) provide the foundation with which to explore thesocial determinants of IDU prevalence within racial/ethnic groups; (2) strengtheninterpretations of the causes of population-level patterns of drug-related healthproblems; and (3) inform planning efforts for IDU-related health services.
APPENDIX
1. Adjusting Values of PijkAPIDS for HIV Seroprevalence and Determiningwhether the Advent of HAART Altered the Racial/Ethnic Composition ofInjectors in the APIDS Database
We calculated values of PijkAPIDS that were adjusted for HIV seroprevalence asdescribed in Formula 3. HIV seroprevalence values for each racial/ethnic group ofinjectors, MSA, and year were estimated using CTS data. The resulting values ofPijkAPIDS (adjusted for HIV seroprevalence) were smoothed using loess.53
Formula 3: Calculating values of PijkAPIDS that are adjusted for HIV seroprevalence
PijkAPIDS adj ¼bijkAPIDS
�Hijk
� �
TijAPIDS�Hij
� � ð3Þ
whereHijk the proportion injectors testing positive for HIV in year i, MSA j, racial/ethnic
group kHij the proportion injectors testing positive for HIV in year i and MSA j,
regardless of racial/ethnic groupbijkAPIDS and TijAPIDS as defined in Formula 1.
COOPER ET AL.846
Calculating the HIV seroprevalence values used in Formula 3 was accomplished asfollows: The number of cases in the CTS database testing positive for injection-relatedHIV reported for each racial/ethnic group, year, and MSA was divided by thecorresponding number of injectors tested in the CTS database. The CTS databasereleased to the project suppressed cell values of G5. We classified missing data on thenumber of seropositive tests as “suppressed” if CTS data indicated that at least oneinjector was tested in that racial/ethnic group, MSA, and year. This classificationsystem indicated that positive test results were suppressed for 17.42% of cells forBlack injectors, 16.46% of cells for White injectors, and 23.44% of cells for allinjectors between 1992 and 2002. Where observations were suppressed, we usedregression imputation to estimate the number of observations in each racial/ethnicgroup (and for all injectors, regardless of racial/ethnic group) who tested positive forinjection-related HIV in each year and MSA. We imputed suppressed test results forWhite injectors for each MSA and year as a function of (1) the total number of Whiteinjectors tested in that year and MSA; (2) the percent of all injectors (regardless ofrace/ethnicity) testing positive in that MSA between 1992 and 2002; and (3) thepercent of all White MSA residents tested that year who were injectors. Because theoutcome was a count and overdispersed, a negative binomial distribution wasassumed; the intercept was set to zero to allow predicted values to range between zeroand four. Similar methods were used to impute missing suppressed serostatus valuesfor Black injectors and for all injectors in each year and MSA.
HIV seroprevalence values for Black and White injectors, and for all injectorsregardless of race/ethnicity, were then calculated for each year and MSA as describedabove; seroprevalence values were set to missing where the number of injectorstested was G20 because of concern about the stability of these estimates(approximately 26.9% of cells for Black injectors, 32.8% for White injectors, and25.2% for all injectors between 1992 and 2002).
Because HAART prolongs time to AIDS diagnoses amongHIV-positive individualsif the therapy is initiated sufficiently early,148–150 and because access to HAART variesacross MSAs and racial/ethnic groups,62–65 we explored whether the advent of theHAART era in our study altered the racial/ethnic composition of injectors in theAPIDS database. Specifically, we tested whether the relationship between study yearand the APIDS-based estimates of the proportion of injectors who were White (orBlack) varied according to whether the study year predated or postdated the advent ofHAART (circa 1997 for injectors). The interaction was not statistically significant,and its magnitude was low. We thus concluded that, while HAART reduced thenumber of injectors diagnosed with AIDS, it had a negligible effect on the proportionof injectors in each racial/ethnic group. No adjustments were made to the APIDS-based estimates to address the onset of the HAART era.
2. Calculating the Number of Injectors (Regardless of Race/Ethnicity) Living ineach MSA each Year of the Study Period
We calculated the number of injectors living in each MSA during each year of thestudy period in a two-stage process: stage 1 consisted of estimating the total numberof injectors living in the US each year; stage 2 consisted of allocating this nationalestimate to each MSA.
Stage 1: Calculating Nationwide IDU Estimates Using CTS data, we first calculateda set of “scores” that describe annual changes in the size of the injecting population in
ESTIMATING INJECTION DRUG USE AMONG BLACK AND WHITE ADULTS 847
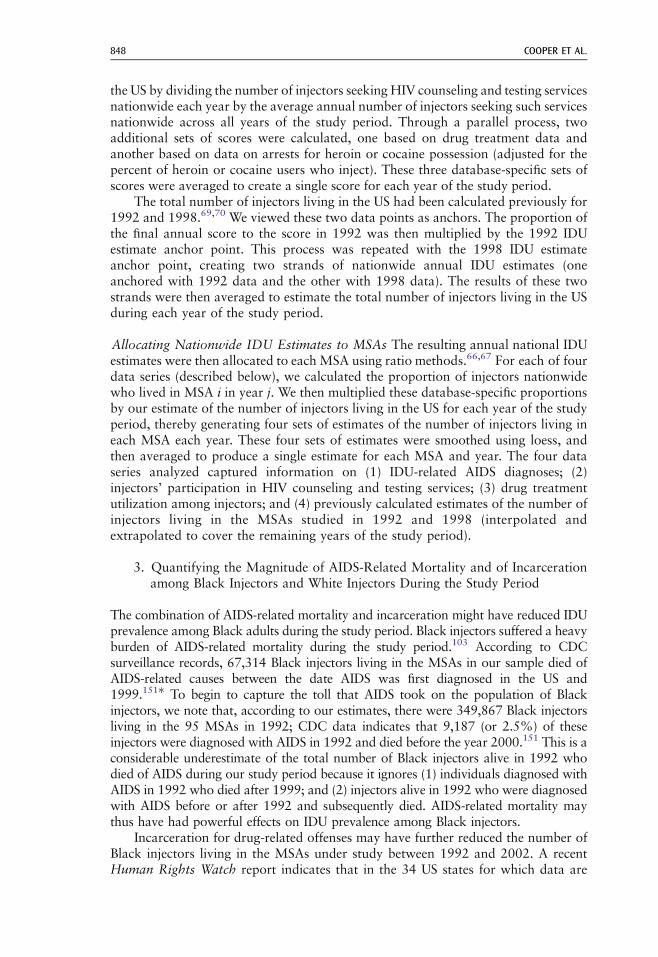
the US by dividing the number of injectors seeking HIV counseling and testing servicesnationwide each year by the average annual number of injectors seeking such servicesnationwide across all years of the study period. Through a parallel process, twoadditional sets of scores were calculated, one based on drug treatment data andanother based on data on arrests for heroin or cocaine possession (adjusted for thepercent of heroin or cocaine users who inject). These three database-specific sets ofscores were averaged to create a single score for each year of the study period.
The total number of injectors living in the US had been calculated previously for1992 and 1998.69,70 We viewed these two data points as anchors. The proportion ofthe final annual score to the score in 1992 was then multiplied by the 1992 IDUestimate anchor point. This process was repeated with the 1998 IDU estimateanchor point, creating two strands of nationwide annual IDU estimates (oneanchored with 1992 data and the other with 1998 data). The results of these twostrands were then averaged to estimate the total number of injectors living in the USduring each year of the study period.
Allocating Nationwide IDU Estimates to MSAs The resulting annual national IDUestimates were then allocated to each MSA using ratio methods.66,67 For each of fourdata series (described below), we calculated the proportion of injectors nationwidewho lived in MSA i in year j. We then multiplied these database-specific proportionsby our estimate of the number of injectors living in the US for each year of the studyperiod, thereby generating four sets of estimates of the number of injectors living ineach MSA each year. These four sets of estimates were smoothed using loess, andthen averaged to produce a single estimate for each MSA and year. The four dataseries analyzed captured information on (1) IDU-related AIDS diagnoses; (2)injectors’ participation in HIV counseling and testing services; (3) drug treatmentutilization among injectors; and (4) previously calculated estimates of the number ofinjectors living in the MSAs studied in 1992 and 1998 (interpolated andextrapolated to cover the remaining years of the study period).
3. Quantifying the Magnitude of AIDS-Related Mortality and of Incarcerationamong Black Injectors and White Injectors During the Study Period
The combination of AIDS-related mortality and incarceration might have reduced IDUprevalence among Black adults during the study period. Black injectors suffered a heavyburden of AIDS-related mortality during the study period.103 According to CDCsurveillance records, 67,314 Black injectors living in the MSAs in our sample died ofAIDS-related causes between the date AIDS was first diagnosed in the US and1999.151� To begin to capture the toll that AIDS took on the population of Blackinjectors, we note that, according to our estimates, there were 349,867 Black injectorsliving in the 95 MSAs in 1992; CDC data indicates that 9,187 (or 2.5%) of theseinjectors were diagnosed with AIDS in 1992 and died before the year 2000.151 This is aconsiderable underestimate of the total number of Black injectors alive in 1992 whodied of AIDS during our study period because it ignores (1) individuals diagnosed withAIDS in 1992 who died after 1999; and (2) injectors alive in 1992 who were diagnosedwith AIDS before or after 1992 and subsequently died. AIDS-related mortality maythus have had powerful effects on IDU prevalence among Black injectors.
Incarceration for drug-related offenses may have further reduced the number ofBlack injectors living in the MSAs under study between 1992 and 2002. A recentHuman Rights Watch report indicates that in the 34 US states for which data are
COOPER ET AL.848
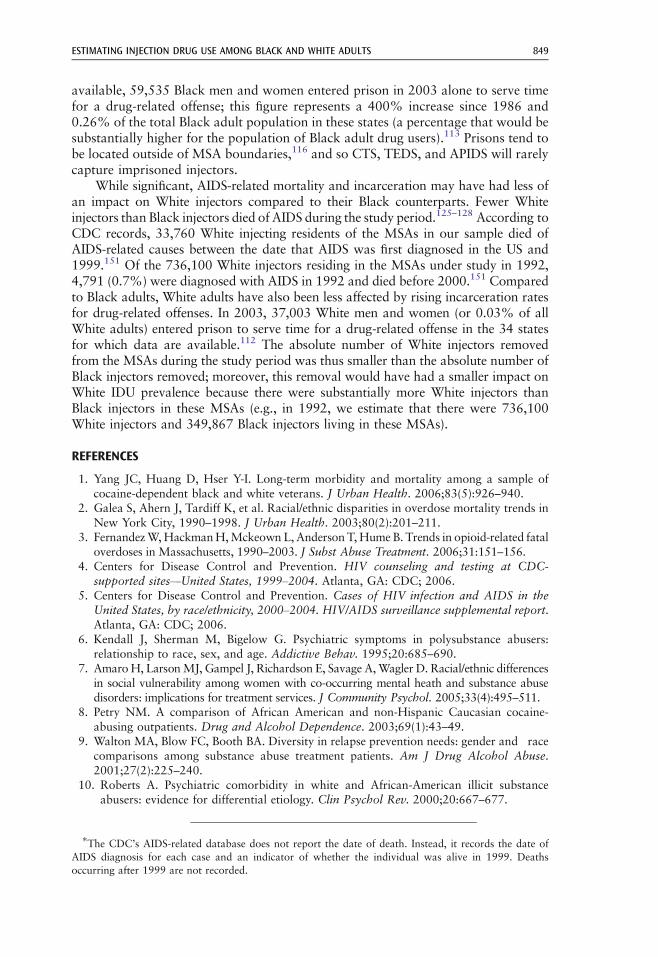
available, 59,535 Black men and women entered prison in 2003 alone to serve timefor a drug-related offense; this figure represents a 400% increase since 1986 and0.26% of the total Black adult population in these states (a percentage that would besubstantially higher for the population of Black adult drug users).113 Prisons tend tobe located outside of MSA boundaries,116 and so CTS, TEDS, and APIDS will rarelycapture imprisoned injectors.
While significant, AIDS-related mortality and incarceration may have had less ofan impact on White injectors compared to their Black counterparts. Fewer Whiteinjectors than Black injectors died of AIDS during the study period.125–128 According toCDC records, 33,760 White injecting residents of the MSAs in our sample died ofAIDS-related causes between the date that AIDS was first diagnosed in the US and1999.151 Of the 736,100 White injectors residing in the MSAs under study in 1992,4,791 (0.7%) were diagnosed with AIDS in 1992 and died before 2000.151 Comparedto Black adults, White adults have also been less affected by rising incarceration ratesfor drug-related offenses. In 2003, 37,003 White men and women (or 0.03% of allWhite adults) entered prison to serve time for a drug-related offense in the 34 statesfor which data are available.112 The absolute number of White injectors removedfrom the MSAs during the study period was thus smaller than the absolute number ofBlack injectors removed; moreover, this removal would have had a smaller impact onWhite IDU prevalence because there were substantially more White injectors thanBlack injectors in these MSAs (e.g., in 1992, we estimate that there were 736,100White injectors and 349,867 Black injectors living in these MSAs).
REFERENCES
1. Yang JC, Huang D, Hser Y-I. Long-term morbidity and mortality among a sample ofcocaine-dependent black and white veterans. J Urban Health. 2006;83(5):926–940.
2. Galea S, Ahern J, Tardiff K, et al. Racial/ethnic disparities in overdose mortality trends inNew York City, 1990–1998. J Urban Health. 2003;80(2):201–211.
3. FernandezW,HackmanH,Mckeown L, Anderson T, Hume B. Trends in opioid-related fataloverdoses in Massachusetts, 1990–2003. J Subst Abuse Treatment. 2006;31:151–156.
4. Centers for Disease Control and Prevention. HIV counseling and testing at CDC-supported sites—United States, 1999–2004. Atlanta, GA: CDC; 2006.
5. Centers for Disease Control and Prevention. Cases of HIV infection and AIDS in theUnited States, by race/ethnicity, 2000–2004. HIV/AIDS surveillance supplemental report.Atlanta, GA: CDC; 2006.
6. Kendall J, Sherman M, Bigelow G. Psychiatric symptoms in polysubstance abusers:relationship to race, sex, and age. Addictive Behav. 1995;20:685–690.
7. AmaroH, LarsonMJ, Gampel J, Richardson E, Savage A,Wagler D. Racial/ethnic differencesin social vulnerability among women with co-occurring mental heath and substance abusedisorders: implications for treatment services. J Community Psychol. 2005;33(4):495–511.
8. Petry NM. A comparison of African American and non-Hispanic Caucasian cocaine-abusing outpatients. Drug and Alcohol Dependence. 2003;69(1):43–49.
9. Walton MA, Blow FC, Booth BA. Diversity in relapse prevention needs: gender and racecomparisons among substance abuse treatment patients. Am J Drug Alcohol Abuse.2001;27(2):225–240.
10. Roberts A. Psychiatric comorbidity in white and African-American illicit substanceabusers: evidence for differential etiology. Clin Psychol Rev. 2000;20:667–677.
�The CDC’s AIDS-related database does not report the date of death. Instead, it records the date ofAIDS diagnosis for each case and an indicator of whether the individual was alive in 1999. Deathsoccurring after 1999 are not recorded.
ESTIMATING INJECTION DRUG USE AMONG BLACK AND WHITE ADULTS 849
11. Dembo R, Williams L, Schmeidler J. Psychosocial, alcohol/other drug use, anddelinquency differences between urban black and white male high risk youth. Int JAddict. 1994;29:461–483.
12. Ziedonis D, Rayford B, Bryant K, Rounsaville B. Psychiatric comorbidity in White andAfrican-American cocaine addicts seeking substance abuse treatment. Hosp CommunityPsychiatry. 1994;45:43–49.
13. Fuller CM, Borrell L, Latkin CA, et al. Effects of race, neighborhood, and social networkon age at initiation of injection drug use. Am J Public Health. 2005;95(4):689–695.
14. Wright D, Gfoerer J, Epstein J. The use of external data sources and ratio estimation toimprove estimates of hardcore drug use from the NHSDA. NIDA Research Monograph.Vol 167. Rockville, MD: Office of Applied Studies, Substance Abuse and Mental HealthServices Administration; 1997.
15. Wright D, Gfoerer J. Estimation of hardcore drug users. J Off Statistics. 1997;13:401–416.16. Archibald CP, Jayaraman GC, Major C, Patrick DM, Houston SM, Sutherland D.
Estimating the size of hard-to-reach populations: a novel method using HIV testing datacompared to other methods. AIDS. 2001;15(Suppl 3):S41–S48.
17. Korf D, Reijneveld S, Toet J. Estimating the number of heroin users: a review of methodsand empirical findings from the Netherlands. Int J Addict. 1994;29:1393–1417.
18. Substance Abuse and Mental Health Services Administration. Results from the 2005National survey on drug use and health: national findings. Rockville, MD: SAMHSA;2006.
19. Substance Abuse and Mental Health Services Administration, Office of Applied Studies.National Survey on Drug Use & Health Methodology Reports and Questionnaires;2007.
20. US Department of Justice Office of Justice Programs Bureau of Justice Statistics. AdditionalCorrections Facts at a Glance: Demographic Trends in Correctionals Populations. http://www.ojp.usdoj.gov/bjs/gcorpop.htm#CorrPopRace. Accessed January 19, 2007.
21. US Department of Housing and Urban Development. Homelessness: Programs and thePeople They Serve. Washington, DC: Department of Housing and Urban Development;1999.
22. Fendrich M, Johnson TP. Race/ethnicity differences in the validity of self-reported druguse: Results from a household survey. J Urban Health. 2005;82(Suppl 3):iii67–iii81.
23. Johnson T, Bowman P. Cross-cultural sources of measurement error in substance usesurveys. Subst Use Misuse. 2003;38:1447–1490.
24. Cox S, Shipley M. Counting the uncatchable? An epidemiological method for countingdrug misusers. Soc Psychiatry Psychiatr Epidemiol. 1997;32:19–23.
25. Hickman M, Cox S, Harvey J, et al. Estimating the prevalence of problem drug use ininner London: a discussion of three capture-recapture studies. Addict. 1999;94:1653–1662.
26. Larson A, Stevens A, Wardlaw G. Indirect estimates of ‘hidden’ populations: capture-recapture methods to estimate the numbers of heroin users in the Australian capitalterritory. Soc Sci Med. 1994;39(6):823–831.
27. Substance Abuse and Mental Health Administration. Treatment Episode Data Set(TEDS): SAMHSA; 2007.
28. US Department of Health and Human Services. AIDS Public Information Dataset(APID): US DHHS; 2007.
29. Centers for Disease Control and Prevention. HIV Counseling and Testing in PubliclyFunded Sites: CDC; 2006.
30. Cooper HL, Friedman SR, Tempalski B, Friedman R, KeemM. Racial/ethnic disparities ininjection drug use in large US metropolitan areas. Ann Epidemiol. 2005;15(5):326–334.
31. Galea S, Nandi A, Vlahov D. The social epidemiology of substance use. Epidemiol Rev.2004;26:36–52.
32. Diez-Roux A. Investigating neighborhood and area effects on health. Am J PublicHealth. 2001;91:1783–1789.
COOPER ET AL.850
33. Berkman LF, Kawachi I. Social Epidemiology. New York: Oxford University Press; 2000.34. Kawachi I, Berkman LF. Neighborhoods and Health. New York: Oxford University
Press; 2003.35. Nurco D, Shaffer J, Cisin I. An ecological analysis of the interrelationships among drug
abuse and other indices of social pathology. Int J Addict. 1984;19:441–451.36. Hunt L, Chambers C. The heroin epidemics: a study of heroin use in the United States,
1965–1975. New York: Spectrum; 1976.37. Boardman JD, Finch B, Ellison C, Williams DR, Jackson JS. Neighborhood disadvan-
tage, stress, and drug use among adults. J Health Soc Behav. 2001;42:151–165.38. Friedman SR, Tempalski B, Cooper HL, Keem M, Friedman R, Flom PL. Structural
factors to guide structural intervention: predictors of IDU population size, HIVPrevalence Among IDUs, and Prevention Program Coverage for IDUs. XV InternationalAIDS Conference. Bangkok Thailand; 2004.
39. Deborah W, Wallace R. A plague on your houses. New York: Verso; 1998.40. Lillie-Blanton M, Anthony J, Schuster C. Probing the meaning of racial/ethnic group
comparison in crack cocaine smoking. JAMA. 1993;269(8):993–997.41. Cooper HL, Friedman SR, Tempalski B, Friedman SR, Keem M. Residential segregation
and the prevalence of injection drug use among Black adult residents of US metropolitanareas. Am J Public Health. 2007;97(2):344–352.
42. Office of Management and Budget. Standards for defining metropolitan and micro-politan statistical areas. Federal Register. 2000;65:8228–82238.
43. U.S. Bureau of the Census. State and metropolitan area data book, 1997–1998.Washington, DC: US Bureau of the Census; 1998.
44. Pierce T. Gen-X Junkie: Ethnographic research with young white heroin users inWashington, DC. Subst Use Misuse. 1999;34:2095–2114.
45. Wallace R, Wallace D. Socioeconomic determinants of health: community margin-alisation and the diffusion of disease and disorder in the United States. BMJ.1997;314:1341–1345.
46. Census USBot. Historical metropolitan area definitions. Washington, DC: US Bureau ofthe Census; 2005.
47. Substance Abuse and Mental Health Services Administration, Office of Applied Studies.Treatment Episode Data Set (TEDS). Highlights—2005. National admissions tosubstance abuse treatment services. Rockville, MD: SAMHSA; 2006.
48. Interuniversity Consortium for Political and Social Research (ICPSR). TreatmentEpisode Data Set (TEDS) Series: Summary. http://webapp.icpsr.umich.edu/cocoon/SAMHDA-SERIES/00056.xml. Accessed June 4, 2007.
49. Centers for Disease Control & Prevention, National Center for HIV S, and TBPrevention, Divisions of HIV/AIDS Prevention, Statistics & Data Management Branch.AIDS Public Information Data Set—Manual, Data Through December 2002. Rockville,MD: Centers for Disease Control & Prevention; 2005:51.
50. Klevens RM, Fleming PL, Li J, et al. The completeness, validity, and timeliness of AIDSsurveillance data. Ann Epidemiol. 2001;11(7):443–449.
51. Centers for Disease Control and Prevention. CTS User's Guide, CTS Version 4.0.Rockville, MD: Centers for Disease Control and Prevention; 1999 March 1999.
52. US Department of Health and Human Services, Substance Abuse and Mental HealthServices Administration, Office of Applied Studies. Treatment Episode Data Set, 1992–2005 (Concatenated): Data Collection Description; 2007.
53. Cleveland W. Visualizing Data. Summitt, NJ: Hobart Press; 1993.54. Wells K, Klap R, Koike A, Sherbourne C. Ethnic disparities in unmet need for alcoholism,
drug abuse, and mental health care. Am J of Psychiatry. 2001;158:2027–2032.55. Johnson DF, Sorvillo FJ, Wohl AR, et al. Frequent failed early HIV detection in a high
prevalence area: implications for prevention. AIDS Patient Care. 2003;17(6):277–282.56. Metzger D, Navaline H. Human immunodeficiency virus prevention and the potential of
drug abuse treatment. Clin Infect Dis. 2003;37:S451–S456.
ESTIMATING INJECTION DRUG USE AMONG BLACK AND WHITE ADULTS 851
57. Hoffman J, Klein H, Clark D, Boyd F. The effect of entering drug treatment oninvolvement in HIV-related risk behaviors. Am J Drug Alcohol Abuse. 1998;24:259–284.
58. Hartel D, Schoenbaum E. Methadone treatment protects against HIV infection: twodecades of experience in the Bronx, New York City. Public Health Rep. 1998;113:105–115.
59. Janssen R, Holtgrave D, Valdisseri R, Shepherd M, Gayle H, De Cok K. The serostatusapproach to fighting the HIV epidemic: preventive strategies for infected individuals. AmJ Public Health. 2001;91:1019–1024.
60. Centers for Disease Control and Prevention. Cases of HIV infection and AIDS in theUnited States, by Race/Ethnicity, 1998–2002. Atlanta, Georgia: Centers for diseasecontrol and prevention; 2004.
61. Durant T, McDavid K, Hu X, Sullivan P, Janssen R, Fenton K. Racial/ethnic disparitiesin diagnoses of HIV/AIDS—33 States, 2001–2005. MMWR. 2007;56(9):189–193.
62. CohenM, Cook J, YoungM, et al. Medically eligible women who do not use HAART: theimportance of abuse, drug use, and race. Am J Public Health. 2004;94(7):1147–1151.
63. Fleishman JA, Hellinger FH. Recent trends in HIV-related inpatient admissions 1996–2000: a 7-state study. JAIDS. 2003;34(1):102–110.
64. Anderson RN, Bozzette S, Shapiro M, et al. Access of vulnerable groups to antiretroviraltherapy among persons in care for HIV disease in the United States. HSR: Health ServRes. 2000;35(2):389–416.
65. Ghani A, Donnelly C, Anderson R. Patterns of antiretroviral use in the United States ofAmerica: analysis of three observational databases. HIV Med. 2003;4:24–32.
66. Frischer M, Hickman M, Kraus L, Nariani F, Wiessing L. A comparison of differentmethods for estimating prevalence of problematic drug misuse in Great Britain. Addict.2001;96:1465–1476.
67. Hickman M, Hope V, Platt L. Estimating the prevalence of injecting drug use: acomparison of multiplier and capture-recapture methods in cities in England and Russia.Drug Alcohol Rev. 2006;25:131–140.
68. Brady JE, Friedman SR, Cooper HLF, Flom PL, Tempalski B, Gostnell K. Estimating theprevalence of injection drug users in the U.S. and in large U.S. Metropolitan areas from1992 to 2002. J Urban Health. 2008;8(3):323–351.
69. Friedman SR, Tempalski B, Cooper HL, et al. Estimating numbers of injecting drugusers in metropolitan areas for structural analyses of community vulnerability and forassessing relative degrees of service provision for injecting drug users. J Urban Health.2004;81(3):377–400.
70. Holmberg S. The estimated prevalence and incidence of HIV in 96 large US metropolitanareas. Am J Public Health. 1996;86(5):642–654.
71. Census USBot. Population Estimates Program Dataset: U.S. Bureau of the Census; 2007.72. U.S. Bureau of the Census, Population Division. Estimates and projections area
methodology county population estimates by age, sex, race, and hispanic origin forJuly 1, 2005. Washington, DC: US Bureau of the Census; 2006.
73. US Bureau of the Census. Estimates And Projections Area Methodology CountyPopulation Estimates By Age, Sex, Race, And Hispanic Origin For July 1, 2005. http://www.census.gov/popest/topics/methodology/2005_co_char_meth.html. Accessed May31, 2007.
74. National Institutes of Health, Hepatitis C Virus Concensus Development Panel.Management of Hepatitis C: 2002. Washington, DC: National Institute of Health; 2002.
75. U.S. Dept. of Health and Human Services, National Center for Health Statistics.Multiple Cause of Death File, 1992–2002 [Computer file]: U.S. Dept. of Health andHuman Services, National Center for Health Statistics; 2004.
76. European Monitoring Centre for Drugs and Drug Addiction. EMCDDA StatisticalBulletin 2005. http://stats05.emcdda.europa.eu/en/home-en.html. Accessed October 18,2006.
COOPER ET AL.852
77. Chen CM, Yoon Y-H, Yi H-Y, Lucas DL. Alcohol and hepatitis C mortality amongmales and females in the United States: a life table analysis. Alcoholism: Clin Exp Res.2007;31(2):285–292.
78. Gasiorowwicz M, Hurie M, Russell A, Hoxie N, Vergeront J. Epidemiologic trends ininfection, mortality, and transplants related to hepatitis C in Wisconsin. Wisconsin MedJ. 2006;105(1):34–39.
79. Alter MJ, Kuhnert WL, Finelli L. Guidelines for laboratory testing and result reportingof antibody to hepatitis C virus. MMWR. 2003;52(RR03):1–16.
80. Centers for Disease Control and Prevention. Viral Hepatitis E: Fact Sheet. Accessed May4 2007.
81. National Center for HIV/AIDS VH, STD, and TB Prevention at the Centers for DiseaseControl and Prevention. Slide set: Hepatitis D. Slide Set: Viral Hepatitis; 2006.
82. Raudenbush SW, Bryk AS. Hierarchical Linear Models: Applications and Data AnalysisMethods. 2nd edn. Thousand Oaks, CA: Sage Publications; 2002.
83. Singer JD, Willett JB. Applied longitudinal data analysis: modeling change and eventoccurrence. New York: Oxford University Press; 2003.
84. SAS/STAT® 9.1. Computer program. Version. Cary, NC: SAS Institute; 2004.85. Friedman SR, Lieb S, Tempalski B, et al. HIV among injection drug users in large US
metropolitan areas, 1998. J Urban Health. 2005;82(3):434–445.86. Holmberg S. The estimated prevalence and incidence of HIV in 96 large US metropolitan
areas. Am J Public Health. 1996;86:642–654.87. Massey D, Denton N. American apartheid: segregation and the making of the
underclass. Boston, MA: Harvard University Press; 1998.88. Smedley B, Smith A, Nelson A. Unequal treatment: confronting racial and ethnic
disparities in health care. Washington, DC: National Academies Press; 2003.89. Easterbrook P, Keruly J, Creagh-Kirk T, Richman D. Racial and ethnic differences in
outcome in zidovudine-treated patients with advanced HIV disease. JAMA. 1991;266(19):2713–2718.
90. Moore R, Hidalgo J, Sugland B, Chaisson R. Zidovudine and the natural history of theAcquired Immunodeficiency Syndrome. N Engl J Med. 1991;324(20):1412–1416.
91. Moore R, Stanton D, Gopalan R, Chaisson R. Racial differences in the use of drugtherapy for HIV disease in an urban community. N Engl J Med. 1994;330(11):763–768.
92. Rosenberg P, Gail M, Schrager L, et al. National AIDS incidence trends and the extent ofZidovudine therapy in selected demographic and transmission groups. JAIDS. 1991;4(4):392–401.
93. Stein M, Piette J, Mor V, et al. Difference in access to Zidovudine (AZT) amongsymptomatic HIV-infected persons. J Gen Intern Med. 1991;6:35–40. (January/February)
94. Woods W, Guydish J, Sorenson J, Coutts A, Bostrom A, Acampora A. Changes in HIV-related risk behaviors following drug abuse treatment. AIDS. 1999;13:2151–2155.
95. ThiedeH,HarrisN,McGough J, Roberts B, KhabbazR, Kaplan J. Prevalence ofHTLVTypesI and II Among Drug Users in King County, Washington.West J Med. 1994;160:540–544.
96. Kwiatkowski C, Booth R. Methadone maintenance as HIV risk reduction with street-recruited injecting drug users. JAIDS. 2001;26:483–489.
97. Wells K, Klap R, Koike A, Sherbourne C. Ethnic disparities in unmet need foralcoholism, drug abuse, and mental health care. Am J Psychiatry. 2001;158:2027–2032.
98. Bernstein KT, Bucciarelli A, Piper TM, Gross C, Tardiff K, Galea S. Cocaine- and opiate-related fatal overdose in New York City, 1990–2000. BMC Public Health. 2007;7:31.
99. Kallan JE. Drug abuse-related mortality in the United States: patterns and correlates.Am J Drug Alcohol Abuse. 1998;24(1):103–117.
100. Office of Applied Studies, Substance Abuse and Mental Health Services Administration.Treatment admissions in urban and rural areas involving abuse of narcotic pain-killers:2002 update. Washington, DC: SAMHSA; 2004.
101. U.S. Dept. of Health and Human Services, Substance Abuse and Mental Health ServicesAdministration, Office of Applied Studies. Treatment Episode Data Set (TEDS), 1992–
ESTIMATING INJECTION DRUG USE AMONG BLACK AND WHITE ADULTS 853
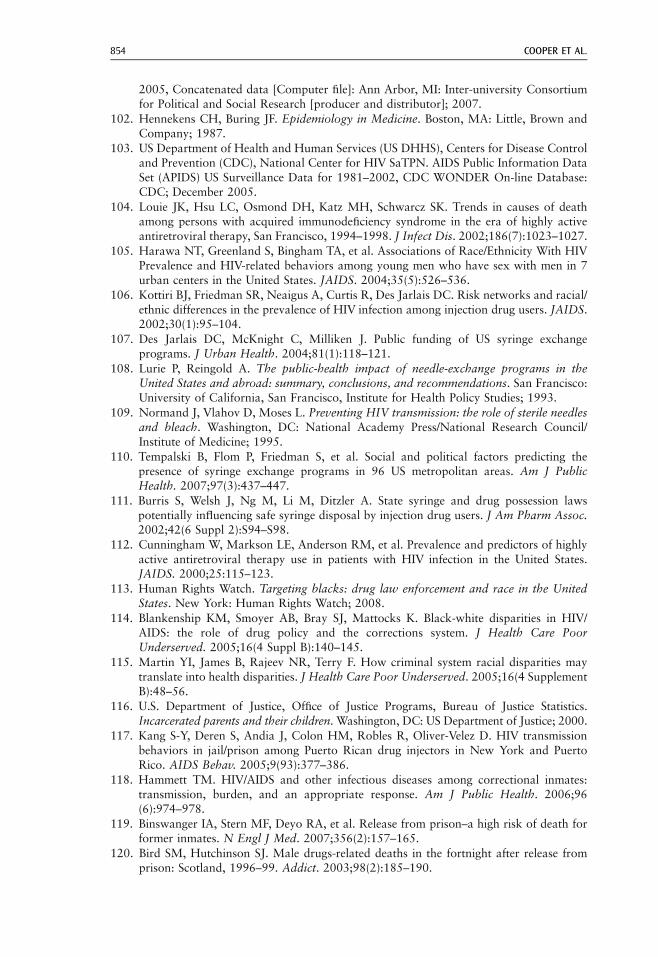
2005, Concatenated data [Computer file]: Ann Arbor, MI: Inter-university Consortiumfor Political and Social Research [producer and distributor]; 2007.
102. Hennekens CH, Buring JF. Epidemiology in Medicine. Boston, MA: Little, Brown andCompany; 1987.
103. US Department of Health and Human Services (US DHHS), Centers for Disease Controland Prevention (CDC), National Center for HIV SaTPN. AIDS Public Information DataSet (APIDS) US Surveillance Data for 1981–2002, CDC WONDER On-line Database:CDC; December 2005.
104. Louie JK, Hsu LC, Osmond DH, Katz MH, Schwarcz SK. Trends in causes of deathamong persons with acquired immunodeficiency syndrome in the era of highly activeantiretroviral therapy, San Francisco, 1994–1998. J Infect Dis. 2002;186(7):1023–1027.
105. Harawa NT, Greenland S, Bingham TA, et al. Associations of Race/Ethnicity With HIVPrevalence and HIV-related behaviors among young men who have sex with men in 7urban centers in the United States. JAIDS. 2004;35(5):526–536.
106. Kottiri BJ, Friedman SR, Neaigus A, Curtis R, Des Jarlais DC. Risk networks and racial/ethnic differences in the prevalence of HIV infection among injection drug users. JAIDS.2002;30(1):95–104.
107. Des Jarlais DC, McKnight C, Milliken J. Public funding of US syringe exchangeprograms. J Urban Health. 2004;81(1):118–121.
108. Lurie P, Reingold A. The public-health impact of needle-exchange programs in theUnited States and abroad: summary, conclusions, and recommendations. San Francisco:University of California, San Francisco, Institute for Health Policy Studies; 1993.
109. Normand J, Vlahov D, Moses L. Preventing HIV transmission: the role of sterile needlesand bleach. Washington, DC: National Academy Press/National Research Council/Institute of Medicine; 1995.
110. Tempalski B, Flom P, Friedman S, et al. Social and political factors predicting thepresence of syringe exchange programs in 96 US metropolitan areas. Am J PublicHealth. 2007;97(3):437–447.
111. Burris S, Welsh J, Ng M, Li M, Ditzler A. State syringe and drug possession lawspotentially influencing safe syringe disposal by injection drug users. J Am Pharm Assoc.2002;42(6 Suppl 2):S94–S98.
112. Cunningham W, Markson LE, Anderson RM, et al. Prevalence and predictors of highlyactive antiretroviral therapy use in patients with HIV infection in the United States.JAIDS. 2000;25:115–123.
113. Human Rights Watch. Targeting blacks: drug law enforcement and race in the UnitedStates. New York: Human Rights Watch; 2008.
114. Blankenship KM, Smoyer AB, Bray SJ, Mattocks K. Black-white disparities in HIV/AIDS: the role of drug policy and the corrections system. J Health Care PoorUnderserved. 2005;16(4 Suppl B):140–145.
115. Martin YI, James B, Rajeev NR, Terry F. How criminal system racial disparities maytranslate into health disparities. J Health Care Poor Underserved. 2005;16(4 SupplementB):48–56.
116. U.S. Department of Justice, Office of Justice Programs, Bureau of Justice Statistics.Incarcerated parents and their children. Washington, DC: US Department of Justice; 2000.
117. Kang S-Y, Deren S, Andia J, Colon HM, Robles R, Oliver-Velez D. HIV transmissionbehaviors in jail/prison among Puerto Rican drug injectors in New York and PuertoRico. AIDS Behav. 2005;9(93):377–386.
118. Hammett TM. HIV/AIDS and other infectious diseases among correctional inmates:transmission, burden, and an appropriate response. Am J Public Health. 2006;96(6):974–978.
119. Binswanger IA, Stern MF, Deyo RA, et al. Release from prison–a high risk of death forformer inmates. N Engl J Med. 2007;356(2):157–165.
120. Bird SM, Hutchinson SJ. Male drugs-related deaths in the fortnight after release fromprison: Scotland, 1996–99. Addict. 2003;98(2):185–190.
COOPER ET AL.854
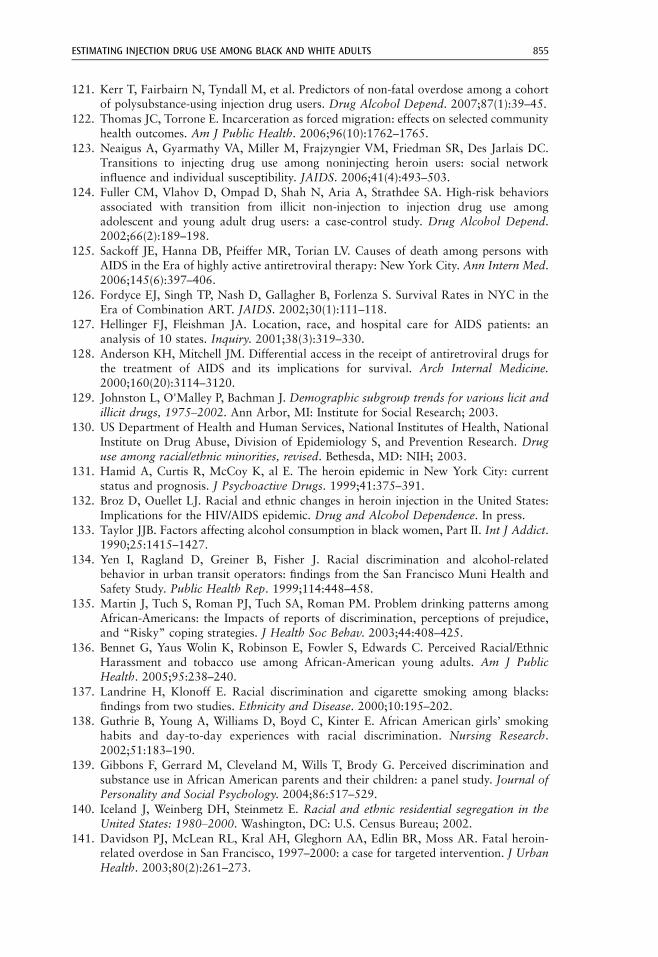
121. Kerr T, Fairbairn N, Tyndall M, et al. Predictors of non-fatal overdose among a cohortof polysubstance-using injection drug users. Drug Alcohol Depend. 2007;87(1):39–45.
122. Thomas JC, Torrone E. Incarceration as forced migration: effects on selected communityhealth outcomes. Am J Public Health. 2006;96(10):1762–1765.
123. Neaigus A, Gyarmathy VA, Miller M, Frajzyngier VM, Friedman SR, Des Jarlais DC.Transitions to injecting drug use among noninjecting heroin users: social networkinfluence and individual susceptibility. JAIDS. 2006;41(4):493–503.
124. Fuller CM, Vlahov D, Ompad D, Shah N, Aria A, Strathdee SA. High-risk behaviorsassociated with transition from illicit non-injection to injection drug use amongadolescent and young adult drug users: a case-control study. Drug Alcohol Depend.2002;66(2):189–198.
125. Sackoff JE, Hanna DB, Pfeiffer MR, Torian LV. Causes of death among persons withAIDS in the Era of highly active antiretroviral therapy: New York City. Ann Intern Med.2006;145(6):397–406.
126. Fordyce EJ, Singh TP, Nash D, Gallagher B, Forlenza S. Survival Rates in NYC in theEra of Combination ART. JAIDS. 2002;30(1):111–118.
127. Hellinger FJ, Fleishman JA. Location, race, and hospital care for AIDS patients: ananalysis of 10 states. Inquiry. 2001;38(3):319–330.
128. Anderson KH, Mitchell JM. Differential access in the receipt of antiretroviral drugs forthe treatment of AIDS and its implications for survival. Arch Internal Medicine.2000;160(20):3114–3120.
129. Johnston L, O'Malley P, Bachman J. Demographic subgroup trends for various licit andillicit drugs, 1975–2002. Ann Arbor, MI: Institute for Social Research; 2003.
130. US Department of Health and Human Services, National Institutes of Health, NationalInstitute on Drug Abuse, Division of Epidemiology S, and Prevention Research. Druguse among racial/ethnic minorities, revised. Bethesda, MD: NIH; 2003.
131. Hamid A, Curtis R, McCoy K, al E. The heroin epidemic in New York City: currentstatus and prognosis. J Psychoactive Drugs. 1999;41:375–391.
132. Broz D, Ouellet LJ. Racial and ethnic changes in heroin injection in the United States:Implications for the HIV/AIDS epidemic. Drug and Alcohol Dependence. In press.
133. Taylor JJB. Factors affecting alcohol consumption in black women, Part II. Int J Addict.1990;25:1415–1427.
134. Yen I, Ragland D, Greiner B, Fisher J. Racial discrimination and alcohol-relatedbehavior in urban transit operators: findings from the San Francisco Muni Health andSafety Study. Public Health Rep. 1999;114:448–458.
135. Martin J, Tuch S, Roman PJ, Tuch SA, Roman PM. Problem drinking patterns amongAfrican-Americans: the Impacts of reports of discrimination, perceptions of prejudice,and “Risky” coping strategies. J Health Soc Behav. 2003;44:408–425.
136. Bennet G, Yaus Wolin K, Robinson E, Fowler S, Edwards C. Perceived Racial/EthnicHarassment and tobacco use among African-American young adults. Am J PublicHealth. 2005;95:238–240.
137. Landrine H, Klonoff E. Racial discrimination and cigarette smoking among blacks:findings from two studies. Ethnicity and Disease. 2000;10:195–202.
138. Guthrie B, Young A, Williams D, Boyd C, Kinter E. African American girls’ smokinghabits and day-to-day experiences with racial discrimination. Nursing Research.2002;51:183–190.
139. Gibbons F, Gerrard M, Cleveland M, Wills T, Brody G. Perceived discrimination andsubstance use in African American parents and their children: a panel study. Journal ofPersonality and Social Psychology. 2004;86:517–529.
140. Iceland J, Weinberg DH, Steinmetz E. Racial and ethnic residential segregation in theUnited States: 1980–2000. Washington, DC: U.S. Census Bureau; 2002.
141. Davidson PJ, McLean RL, Kral AH, Gleghorn AA, Edlin BR, Moss AR. Fatal heroin-related overdose in San Francisco, 1997–2000: a case for targeted intervention. J UrbanHealth. 2003;80(2):261–273.
ESTIMATING INJECTION DRUG USE AMONG BLACK AND WHITE ADULTS 855
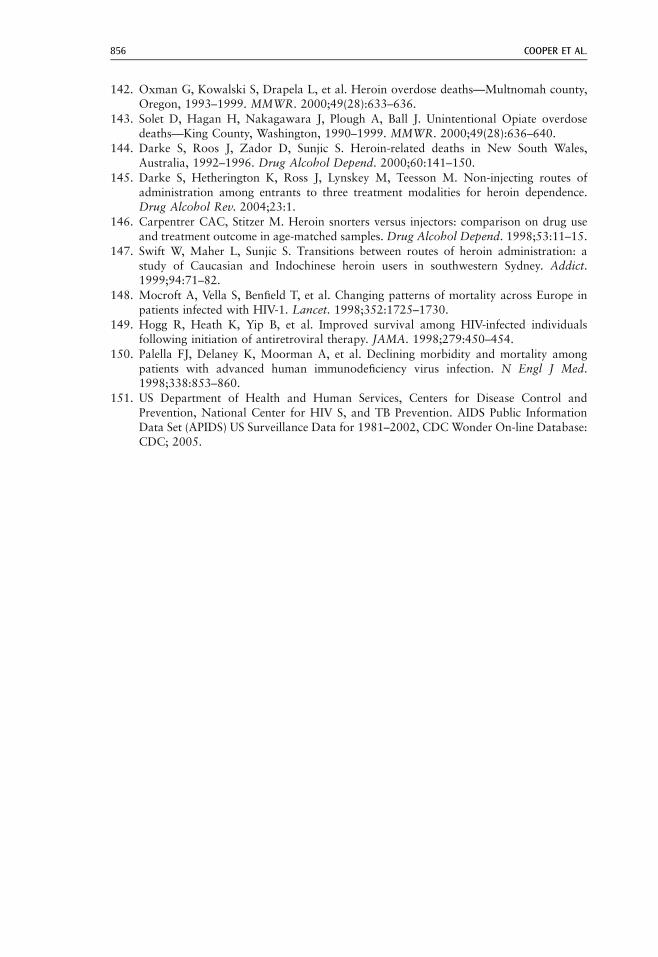
142. Oxman G, Kowalski S, Drapela L, et al. Heroin overdose deaths—Multnomah county,Oregon, 1993–1999. MMWR. 2000;49(28):633–636.
143. Solet D, Hagan H, Nakagawara J, Plough A, Ball J. Unintentional Opiate overdosedeaths—King County, Washington, 1990–1999. MMWR. 2000;49(28):636–640.
144. Darke S, Roos J, Zador D, Sunjic S. Heroin-related deaths in New South Wales,Australia, 1992–1996. Drug Alcohol Depend. 2000;60:141–150.
145. Darke S, Hetherington K, Ross J, Lynskey M, Teesson M. Non-injecting routes ofadministration among entrants to three treatment modalities for heroin dependence.Drug Alcohol Rev. 2004;23:1.
146. Carpentrer CAC, Stitzer M. Heroin snorters versus injectors: comparison on drug useand treatment outcome in age-matched samples. Drug Alcohol Depend. 1998;53:11–15.
147. Swift W, Maher L, Sunjic S. Transitions between routes of heroin administration: astudy of Caucasian and Indochinese heroin users in southwestern Sydney. Addict.1999;94:71–82.
148. Mocroft A, Vella S, Benfield T, et al. Changing patterns of mortality across Europe inpatients infected with HIV-1. Lancet. 1998;352:1725–1730.
149. Hogg R, Heath K, Yip B, et al. Improved survival among HIV-infected individualsfollowing initiation of antiretroviral therapy. JAMA. 1998;279:450–454.
150. Palella FJ, Delaney K, Moorman A, et al. Declining morbidity and mortality amongpatients with advanced human immunodeficiency virus infection. N Engl J Med.1998;338:853–860.
151. US Department of Health and Human Services, Centers for Disease Control andPrevention, National Center for HIV S, and TB Prevention. AIDS Public InformationData Set (APIDS) US Surveillance Data for 1981–2002, CDC Wonder On-line Database:CDC; 2005.
COOPER ET AL.856