Estimating the prevalence of inflammatory bowel disease in Portugal using a pharmaco-epidemiological...
12
ORIGINAL REPORT Estimating the prevalence of inflammatory bowel disease in Portugal using a pharmaco-epidemiological approach y L. F. Azevedo MD 1 * , ô , F. Magro MD, PhD 2,3z, ô , F. Portela MD 3z , P. Lago MD 3z , J. Deus MD 3z , J. Cotter MD 3z , I. Cremers MD 3z , A. Vieira MD 3z , P. Peixe MD 3z , P. Caldeira MD 3z , H. Lopes MD 3z , R. Gonc ¸alves MD 3z , J. Reis MD 3z , M. Cravo MD 3z , L. Barros MD 3z , P. Ministro MD 3z , M. Lurdes MD 3z , A. Duarte MD 3z , M. Campos MD 3z , L. Carvalho MD 3z and A. Costa-Pereira MD, PhD 1x 1 Department of Biostatistics and Medical Informatics and CINTESIS, Centre for Research in Health Technologies and Information Systems, Faculty of Medicine, Oporto University, Portugal 2 Faculty of Medicine, Institute of Pharmacology and Therapeutics, Oporto University and IBD Portuguese Study Group (GEDII), Portugal 3 IBD Portuguese Study Group (GEDII), Portugal SUMMARY Purpose To estimate inflammatory bowel disease (IBD) prevalence in Portugal from 2003 to 2007, and to obtain disease, sex and age specific estimates. Methods A pharmaco-epidemiological approach based on intestinal anti-inflammatory (IAI) drugs consumption was used. Proportion of patients taking IAI drugs and mean prescribed daily dose (PDD) were estimated from a sample of 513 IBD patients. Assumptions were made about unknown parameters and sensitivity analysis performed: drug compliance (80% in base case; range 70–85%) and proportion of sulphasalazine used in IBD (52%; range 40–80%). Sex and age specific estimates were based on a proposed methodological extension and results from a nationwide (n ¼ 5893) cross-sectional study. Results IBD prevalence increased from 86 patients per 100 000 in 2003 to 146 in 2007. Regions more affected were Lisboa and Porto (173 and 163 per 100 000 in 2007, respectively). Prevalence increased from 42 and 43 per 100 000 in 2003 to 71 and 73 in 2007, respectively for ulcerative colitis (UC) and Crohn’s disease (CD). In 2007, prevalence was higher in the 40–64 age stratum for UC (99 per 100 000) and in the 17–39 stratum for CD (121). Prevalence was consistently higher in females. Conclusions Portugal is half way between countries with the highest and lowest IBD prevalence, but is steeply making the road to the highest- level group. Despite limitations of the proposed methods, assumptions were reasonable and estimates seem to be valid. Feasibility and comparability of this methodology makes it an interesting tool for future studies on IBD epidemiology. Copyright # 2010 John Wiley & Sons, Ltd. key words — drug-consumption data; epidemiologic methods; inflammatory bowel disease; intestinal anti-inflammatory drugs; pharmacoepidemiology; prevalence Received 26 November 2008; Revised 8 November 2009; Accepted 8 January 2010 INTRODUCTION Inflammatory bowel disease (IBD) comprises two distinct pathologic entities, Crohn’s Disease (CD) and Ulcerative Colitis (UC), and is one of the most serious conditions of the gastrointestinal tract. Availability of adequate statistics allows proper planning and distribution of healthcare resources and a better understanding of diseases aetiology and prognosis. 1–3 In Portugal statistics on IBD epide- miology are scarce. Generally the estimation of epidemiological fre- quency measures comes from population surveys or disease registries. 1–3 Given the fact that IBD is not a particularly frequent occurrence, population studies are organizationally and financially difficult to implement and hard to update along time. Therefore, alternative and less demanding methods could have great importance in this context. pharmacoepidemiology and drug safety (2010) Published online in Wiley InterScience (www.interscience.wiley.com) DOI: 10.1002/pds.1930 *Correspondence to: Dr L. Azevedo, Faculdade de Medicina da Universi- dade do Porto, Servic ¸o de Bioestatı ´stica e Informa ´tica Me ´dica, Al. Prof. Herna ˆni Monteiro, 4200-319 Porto, Portugal. E-mail: [email protected] y Authors declared no conflict of interest. z Gastroenterologist. ôLFA and FM equally contributed to the original idea and definition of study research question. LFA was responsible for study design, statistical analysis and prevalence estimation model development and application. LFA and FM were responsible for writing the manuscript. All authors contributed in data collection, manuscript writing and manuscript reviewing. x Head of the Department. Copyright # 2010 John Wiley & Sons, Ltd.
-
Upload
independent -
Category
Documents
-
view
8 -
download
0
Transcript of Estimating the prevalence of inflammatory bowel disease in Portugal using a pharmaco-epidemiological...

pharmacoepidemiology and drug safety (2010)ley.com) DOI: 10.1002/pds.1930
Published online in Wiley InterScience (www.interscience.wiORIGINAL REPORT
Estimating the prevalence of inflammatory bowel disease in Portugalusing a pharmaco-epidemiological approachy
L. F. Azevedo MD1*,�, F. Magro MD, PhD2,3z,�, F. Portela MD3z, P. Lago MD3z, J. Deus MD3z,J. Cotter MD3z, I. Cremers MD3z, A. Vieira MD3z, P. Peixe MD3z, P. Caldeira MD3z, H. Lopes MD3z,R. Goncalves MD3z, J. Reis MD3z, M. Cravo MD3z, L. Barros MD3z, P. Ministro MD3z, M. Lurdes MD3z,A. Duarte MD3z, M. Campos MD3z, L. Carvalho MD3z and A. Costa-Pereira MD, PhD1x
1Department of Biostatistics and Medical Informatics and CINTESIS, Centre for Research in Health Technologies and Information Systems,Faculty of Medicine, Oporto University, Portugal2Faculty of Medicine, Institute of Pharmacology and Therapeutics, Oporto University and IBD Portuguese Study Group (GEDII), Portugal3IBD Portuguese Study Group (GEDII), Portugal
SUMMARY
Purpose To estimate inflammatory bowel disease (IBD) prevalence in Portugal from 2003 to 2007, and to obtain disease, sex and agespecific estimates.Methods A pharmaco-epidemiological approach based on intestinal anti-inflammatory (IAI) drugs consumption was used. Proportion ofpatients taking IAI drugs and mean prescribed daily dose (PDD) were estimated from a sample of 513 IBD patients. Assumptions were madeabout unknown parameters and sensitivity analysis performed: drug compliance (80% in base case; range 70–85%) and proportion ofsulphasalazine used in IBD (52%; range 40–80%). Sex and age specific estimates were based on a proposed methodological extension andresults from a nationwide (n¼ 5893) cross-sectional study.Results IBD prevalence increased from 86 patients per 100 000 in 2003 to 146 in 2007. Regions more affected were Lisboa and Porto (173and 163 per 100 000 in 2007, respectively). Prevalence increased from 42 and 43 per 100 000 in 2003 to 71 and 73 in 2007, respectively forulcerative colitis (UC) and Crohn’s disease (CD). In 2007, prevalence was higher in the 40–64 age stratum for UC (99 per 100 000) and in the17–39 stratum for CD (121). Prevalence was consistently higher in females.Conclusions Portugal is half way between countries with the highest and lowest IBD prevalence, but is steeplymaking the road to the highest-level group. Despite limitations of the proposed methods, assumptions were reasonable and estimates seem to be valid. Feasibility andcomparabilityof thismethodologymakes it an interesting tool for futurestudieson IBDepidemiology.Copyright#2010JohnWiley&Sons,Ltd.
key words—drug-consumption data; epidemiologic methods; inflammatory bowel disease; intestinal anti-inflammatory drugs;pharmacoepidemiology; prevalence
Received 26 November 2008; Revised 8 November 2009; Accepted 8 January 2010
INTRODUCTION serious conditions of the gastrointestinal tract.
Inflammatory bowel disease (IBD) comprises twodistinct pathologic entities, Crohn’s Disease (CD)and Ulcerative Colitis (UC), and is one of the most
*Correspondence to: Dr L. Azevedo, Faculdade de Medicina da Universi-dade do Porto, Servico de Bioestatıstica e Informatica Medica, Al. Prof.Hernani Monteiro, 4200-319 Porto, Portugal. E-mail: [email protected] declared no conflict of interest.zGastroenterologist.�LFA and FM equally contributed to the original idea and definition of studyresearch question. LFAwas responsible for study design, statistical analysisand prevalence estimation model development and application. LFA and FMwere responsible for writing the manuscript. All authors contributed in datacollection, manuscript writing and manuscript reviewing.xHead of the Department.
Copyright # 2010 John Wiley & Sons, Ltd.
Availability of adequate statistics allows properplanning and distribution of healthcare resourcesand a better understanding of diseases aetiology andprognosis.1–3 In Portugal statistics on IBD epide-miology are scarce.Generally the estimation of epidemiological fre-
quency measures comes from population surveys ordisease registries.1–3 Given the fact that IBD is not aparticularly frequent occurrence, population studiesare organizationally and financially difficult toimplement and hard to update along time. Therefore,alternative and less demanding methods could havegreat importance in this context.

l. f. azevedo ET AL.
Treatment and management of IBD (CD and UC)heavily depends on drugs. The most typically useddrugs for this indication are:4 intestinal anti-inflamma-tory (IAI) drugs, systemic corticosteroids, imunossu-pressors, biologic therapy and antibiotics. One of thesedrug groups—IAI drugs—is quite specific to IBD, andsince their consumption depends on the number ofaffected subjects in the population, relaying on someplausible assumptions it is possible to obtain goodestimates of IBD prevalence from drug consumptiondata.5–7 This methodology is of course much lessorganizationally and financially demanding, and givesestimates with acceptable precision and validity.5–8
The aim of this study was to estimate IBD prevalencein Portugal and to obtain disease (UC and CD), sex andage specific prevalence estimates, using a pharmaco-epidemiological approach based on IAI drugs con-sumption.
METHODS
In this study IBD prevalence in Portugal was estimatedaccording to the method proposed by Sartor andWalkiers.7 This method requires data on national drugsales of tracer drugs, estimates of daily drug consump-tion and demographic data. Tracer drugs should ideallybe taken only by patients suffering from the disease andregularly all year long.7 IAI drugs (sulphasalazine andmesalazine) are indicated for the treatment of IBD, andin Portugal nearly all patients in the country are currentlytaking one of these two drugs on a daily basis.9
IBD prevalence estimates
The method proposed by Sartor and Walkiers7 definesthe following estimator for the disease prevalence (P):
P ¼ ne
N¼
Pki¼1
ni � w
N¼
Pki¼1
Vi
ci� w
N
Where ne is the estimated number of patients with thedisease and taking drugs, ni is the estimated number ofpatients taking the ith class of drugs, Vi is the totalamount of the ith class of drugs sold in 1 year, ci is theestimated mean intake of the ith drug class by patientsin 1 year, N is the total population living in this regionand w is a weighting factor that corrects for theproportion of patients taking combinations of two ormore classes of drugs, avoiding double counting. Toestimate ci we should preferably have the mean intakeof the ith class of drugs in 1 year, given by a cross-sectional survey on patients with the disease.In this study, the IAI drugs sulphasalazine and
mesalazine were included in the analysis. Direct
Copyright # 2010 John Wiley & Sons, Ltd.
estimates of the proportion of IBD patients taking thesetwo drugs and their mean yearly intake (ci) were obtainedfrom a cross-sectional study on IBD patients. Based onthese direct estimates and the yearly national totalamount of IAI drugs consumed (Vi), it was possible toobtain an estimate of the disease prevalence (P).Sulphasalazine andmesalazine have the same therapeuticgoal and mechanism in IBD treatment and are not takenconcurrently. Thus the weighting factor w was assumedto be equal to 1, implicitly assuming that none of thepatients were taking combinations of the included drugs.In order to further correct the prevalence estimation
model and obtain more valid estimates, three additionaladjustment factors were considered important andincluded in the model.First, because some of the sulphasalazine sold is used
for other indications than IBD, an adjustment wasintroduced based on the proportion of the total amountof sulphasalazine sold specifically for IBD indication.In the Portuguese Formulary, mesalazine is only indica-ted for IBD treatment, whereas sulphasalazine is alsoindicated as a second line therapy for the treatment ofrheumatoid arthritis (RA). There are no records of otherindicationsoroff-labeluseof thesedrugs inPortugal. It isthen safe to assume that the total amount of mesalazinesold was used by IBD patients, but in contrast only acertain proportion of the total amount of sulphasalazinewas actually prescribed to IBD patients. Thus an adjust-ment was introduced in order to take into account theproportion of sulphasalazine for other indications thanIBD. The limited evidence about the proportion of IBDpatients among sulphasalazine users comes fromprescription-monitoring studies,10–12 and indicates esti-mates between 52 and 63%. In the base case scenario ofour prevalence estimation model a value of 52% wasassumed, but sensitivity analysis was performed andestimatesassumingproportionsof40,52,60,70and80%are presented.Second, because drug non-compliance could affect the
proposed prevalence estimation, as this is based on totalamount of drugs sold, an adjustment for drug non-compliancewas introduced. Non-compliers are not takeninto account when total drug sales are used to estimatedisease prevalence, thus a more adequate prevalenceestimate was obtained adjusting for the proportion ofpatients actually complying with the drug regimen.Estimates of IAI drugs compliance in IBD patients comefrom several clinical trials evaluating these drugs and isgenerally around 80%, but in some cases it may be as lowas 50%.13–15 In the base case scenario of our prevalenceestimation model a value of 80% was assumed, butsensitivity analysis was performed and estimates assum-ing proportions of 70, 75, 80 and 85% are presented.
Pharmacoepidemiology and Drug Safety, (2010)DOI: 10.1002/pds

PREVALENCE OF IBD IN PORTUGAL—A PHARMACO-EPIDEMIOLOGICAL APPROACH
Third, because some of the IBD patients may not beusing IAI drugs, proportions of UC and CD patientsactually using IAI drugs were estimated from anational cross-sectional study and adjustment factorswere introduced in the prevalence estimation model.This adjustment allowed us to account for some of theCD and UC patients that, for some reason, are nottaking IAI drugs (for example, some UC patients withisolated proctitis or some patients on immunosuppres-sant or biologic therapies).Sartor and Walkiers7 also defined an estimator for
the variance of P using the delta method:16–18
Var P� �
�Xki¼1
@P
@ci
� �2�Var cið Þ þ 2 �
Xi 6¼j
@P
@ci
� �� @P
@cj
� �
� Covðci; cjÞ þXkj¼2
@P
@pj
� �2�Var pj
� �
Where pj represents the estimate of the proportion ofpatients taking a combination of j ¼ 2; 3; . . . ; kf g drugclasses concurrently, used to calculate the weightingfactor w, and @P=@cið Þ, @P
�@cj
� �and @P
�@pj
� �are the
partial derivatives of P with respect to ci, cj and pj,evaluated at their expected values, and Covðci; cjÞ is thecovariance between ci and cj. The 95% confidenceinterval (95%CI) may be derived assuming theasymptotic normality of this estimator.17
In this case, values for ci were estimated in a cross-sectional study on a sample of IBD patients and wereused to calculate the variance of the prevalenceestimate and 95%CI.
Disease, sex and age specific prevalence estimates
IBD is a heterogeneous pathologic entity, therefore itwould be important to have prevalence estimatesspecific for CD and UC. Moreover, it would beimportant to have estimates specific for the differentsex and age strata. These may not be directly obtainedfrom the previous method. So we propose an extensionto Sartor and Walkiers’ approach based on the fact thatthe disease specific prevalence (Pi) for diseasei ¼ 1; 2; . . . ; pf g and the sex and age specificprevalence (Pijk) are calculated as:
Pi ¼ni
NPijk ¼
nijk
Njk
Where ni is the number affected by the disease i, N isthe total number of individuals in the population, nijk isthe number affected by the disease i and pertaining tostratum j ¼ 1; 2; . . . ; qf g of sex and k ¼ 1; 2; . . . ; rf gof age and Njk is the total number in the population
Copyright # 2010 John Wiley & Sons, Ltd.
pertaining to stratum j ¼ 1; 2; . . . ; qf g of sex andk ¼ 1; 2; . . . ; rf g of age.It is easy to see that, if there is a set of mutually
exclusive and jointly exhaustive disease, sex and agestrata, the total number of patients is equal to
ne ¼Xi;j;k
pijk � ne� �
Where pijk are the proportions of patients pertaining toeach stratum.Given that pijk are calculated as
pijk ¼nijk
ne
If there are adequate estimates of pijk available (forexample, from a representative sample, preferably large,of all national IBD patients in the considered timeperiod), it is possible to estimate nijk and Pijk as follows:
nijk ¼ pijk � ne and Pijk ¼nijk
Nijk
¼ pijk � neNijk
The Portuguese IBD Study Group (Grupo de Estudosde Doenca Inflamatoria Intestinal—GEDII—www.gedi.med.up.pt), performed, in 2006, a large nationalcross-sectional study on IBD patients (n¼ 5893).19,20
Using the results of this study we obtained estimatesfor the proportions of patients in each disease, sex andage specific stratum (pijk) in our country, and estimatesof nijk and Pijk.
To complement the inference procedure, the varianceof the prevalence estimators—Var Pijk
� �—may be
derived using the delta method:16–18
Var Pijk
� �� @Pijk
@ne
� �2�Var neð Þ þ @Pijk
@pijk
� �2�Var pijk
� �
Where @Pijk
�@ne
� �and @Pijk
�@pijk
� �are the partial
derivatives of Pijk with respect to ne and pijk, evaluatedat their expected values. Covariance terms weredropped because ne and pijk are independentlyestimated and assumed independent. The 95%CImay be derived assuming the asymptotic normalityof these estimators.17
Statistical analysis was performed using the softwareprogram SPSS1 15.0.
Sources of data
Drug sales data. Yearly total national sales, for alldrugs included in the ATC group A07E—IAIAgents—were obtained, from 2003 to 2007, fromIMS Health (an international consulting company inthe area of pharmaceutical marketing), correspondingto the total amount sold from wholesalers to
Pharmacoepidemiology and Drug Safety, (2010)DOI: 10.1002/pds

l. f. azevedo ET AL.
community pharmacies. Only formulations forsystemic use were considered in the analysis.
Drug use and dosage data and IBD epidemiologydata. The Portuguese IBD Study Group (GEDII- www.gedi.med.up.pt), as previously mentioned, perfor-med, between 2005 and 2006, a large national cross-sectional study on IBD patients, that included almost halfof the estimated number of patients nationally (n¼ 5893).This study has been previously described.19,20 In brief,from September 2005 until December 2006, all medicaldoctors in Portugal seeing IBD patients (gastroenterolo-gists, paediatricians, surgeons, and general practioners)were invited to include patients in a national IBD databaseregistry. In this initial cross-sectional study 77 PortugueseMDs coming from 33medical centres, distributed all overPortugal, from north to south, including the islandsof Madeira and Azores, participated in the study andrecruited 5893 IBD patients. Patient registration wascarried out through a Web-based system. The patientswere from quaternary and tertiary referral hospitals(48.6%) and regional hospitals plus private practice(50.7%). A small percentage (0.5%) was included bypaediatricians working in referral paediatric centres. Allparticipating MDs had at least three meetings per year todiscuss and review inclusion criteria. All patients wereincluded according to strict international diagnosticcriteria for IBD.21–23 Data on date of onset of symptomsand diagnosis, type of clinical onset, extent of disease,familial occurrence of IBD, presence of extra-intestinalmanifestations, type of colonic, anal and rectal involve-ment, previous history of abdominal abscesses and/orfistulas, clinical course, Montreal classification categories,response to steroids, immunosuppression and/or biologictreatment, as well as previous abdominal or anal surgerywere systematically collected for every recruited patient.In order to estimate the proportion of IBD patients
in Portugal taking IAI drugs and their mean yearly intake(ci) data from the national cross-sectional studywere used.A subsample of IBD patients, part of the large nationalcross-sectional study, were specifically asked about IAIdrug use, daily drug doses and consumption frequency.This subsample included patients, from the larger initialsample, willing and already recruited to participate in anongoing prospective follow-up study. Data were availableon IAI drugs use for 3587 IBD patients (1936 UC and1651 CD patients). Seventy five per cent of the patients(n¼ 2698) were using regularly IAI drugs—1460 (75%)of UC patients and 1238 (75%) of CD patients. For 513IBD patients, data on daily dose and drug use pattern wereavailable, allowing the estimation of mean yearly intake(ci) for mesalazine and sulphasalazine.
Copyright # 2010 John Wiley & Sons, Ltd.
Demographic data. Demographic data including totalnational population by age, sex and district of residencewere obtained from the national official statisticsagency.24
RESULTS
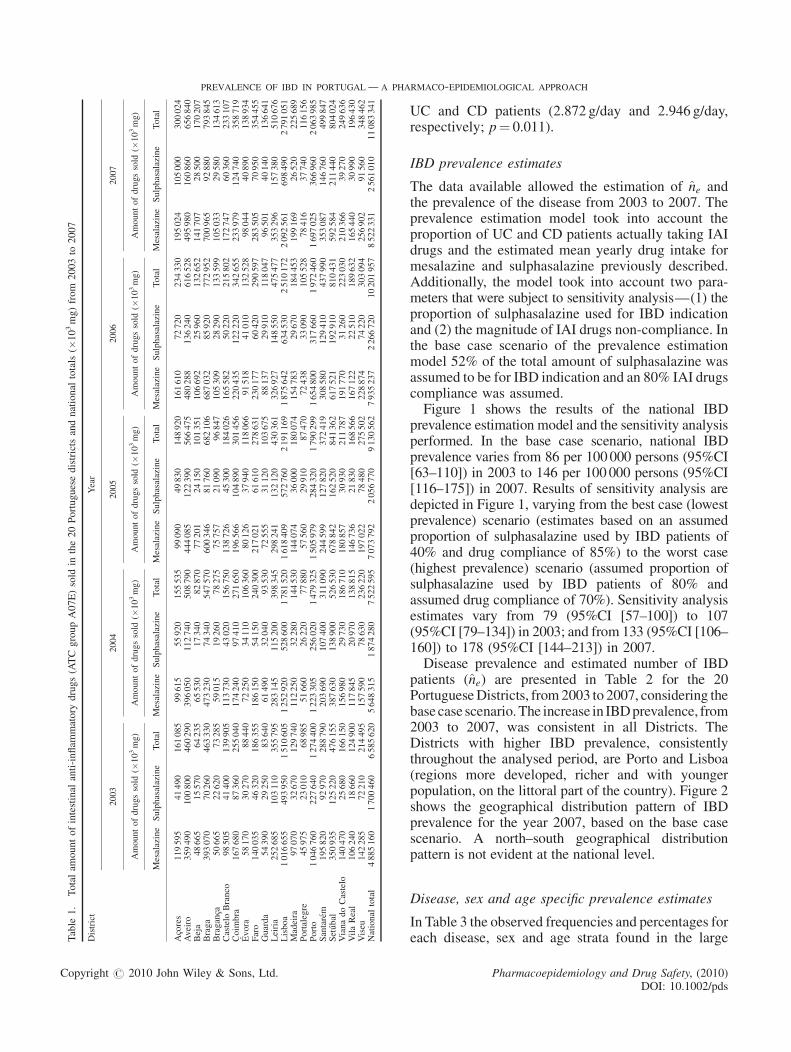
In Table 1 the total amount of IAI drugs sold in the 20Portuguese Districts and national totals are shown from2003 to 2007. An increase in the amount of drugs soldis evident in the period analysed.
Drug use and mean yearly drug intake
Data on IAI drugs consumption were available for3587 IBD patients. Seventy five per cent of the patients(n¼ 2698) reported regular use of systemic formu-lations of IAI drugs. There were 1936 UC patients and1651 CD patients in the sample and regular IAI druguse was reported by 74.6% (n¼ 1460) of UC patientsand 75.0% (n¼ 1238) of CD patients. These observedproportions of patients actually using IAI drugs amongUC and CD patients were introduced as adjustmentfactors in the prevalence estimation model, in order totake into account IBD patients that, for some reason,were not taking IAI drugs.In a sub-sample of 513 IBDpatients, data on IAI drugs
daily dose and drug use pattern were available, allowingthe estimation of mean yearly drug intake (ci). This sub-sample had 317 UC and 196 CD patients, 57% were offemalegender, hadmeanageof44years (SD¼ 15 years)and a median disease duration of 6 years (25thpercentile¼ 3 years and 75th percentile¼ 11 years).Mesalazine systemic formulations were taken by 469(91%)of thepatients and sulphasalazine formulationsby44 (9%) patients. None of the patients was takingconcurrently mesalazine and sulphasalazine systemicformulations. All patients reported taking the systemicIAI formulations on a daily basis, and the mean ofreported daily doses was 2.899 g/day (SD¼ 0.303 g) formesalazine and 2.946 g/day (SD¼ 0.329 g) for sulpha-salazine. Thus the estimated mean yearly drug intakeused in the prevalence estimation model was formesalazine 1058.199 g/year (SD¼ 110.699 g) and forsulphasalazine 1075.270 g/year (SD¼ 120.011 g).When comparing UC and CD patients, a signifi-
cantly more frequent use of sulphasalazine among CDpatients was observed (4.4% for UC and 15.3% forCD patients; p< 0.001). No statistically significantdifferences existed between means of reported dailydoses in UC and CD patients for sulphasalazine(2.833 g/day and 3.000 g/day, respectively; p¼ 0.205).However, a small but significant difference in meandaily dose of mesalazine was observed between
Pharmacoepidemiology and Drug Safety, (2010)DOI: 10.1002/pds
le1.
Totalam
ountofintestinal
anti-inflam
matory
drugs(ATCgroupA07E)sold
inthe20Portuguesedistrictsandnational
totals(�
103mg)from
2003to
2007
trict
Year
2003
2004
2005
2006
2007
Amountofdrugssold
(�103mg)
Amountofdrugssold
(�103mg)
Amountofdrugssold
(�103mg)
Amountofdrugssold
(�103mg)
Amountofdrugssold
(�103mg)
Mesalazine
Sulphasalazine
Total
Mesalazine
Sulphasalazine
Total
Mesalazine
Sulphasalazine
Total
Mesalazine
Sulphasalazine
Total
Mesalazine
Sulphasalazine
Total
res
119595
41490
161085
99615
55920
155535
99090
49830
148920
161610
72720
234330
195024
105000
300024
iro
359490
100800
460290
396050
112740
508790
444085
122390
566475
480288
136240
616528
495980
160860
656840
a48665
15570
64235
65530
17340
82870
77201
24150
101351
106692
25960
132652
141707
28500
170207
ga
393070
70260
463330
473230
74340
547570
600346
81760
682106
687032
85920
772952
700965
92880
793845
ganca
50665
22620
73285
59015
19260
78275
75757
21090
96847
105309
28290
133599
105033
29580
134613
telo
Branco
98505
41400
139905
113730
43020
156750
138726
45300
184026
165582
50220
215802
172747
60360
233107
mbra
167680
87360
255040
174240
97410
271650
196566
104890
301456
220435
122220
342655
233979
124740
358719
ra58170
30270
88440
72250
34110
106360
80126
37940
118066
91518
41010
132528
98044
40890
138934
o140035
46320
186355
186150
54150
240300
217021
61610
278631
230177
60420
290597
283505
70950
354455
rda
54390
29250
83640
61490
32040
93530
72555
31120
103675
88137
29910
118047
96501
40140
136641
ria
252685
103110
355795
283145
115200
398345
298241
132120
430361
326927
148550
475477
353296
157380
510676
oa
1016655
493950
1510605
1252920
528600
1781520
1618409
572760
2191169
1875642
634530
2510172
2092561
698490
2791051
deira
97070
32670
129740
112250
32280
144530
144074
36000
180074
154783
29670
184453
199169
26520
225689
talegre
45975
23010
68985
51660
26220
77880
57560
29910
87470
72438
33090
105528
78416
37740
116156
to1046760
227640
1274400
1223305
256020
1479325
1505979
284320
1790299
1654800
317660
1972460
1697025
366960
2063985
tarem
195820
92970
288790
203690
107400
311090
244599
127820
372419
308580
129410
437990
353087
146760
499847
´ bal
350935
125220
476155
387630
138900
526530
678842
162520
841362
617521
192910
810431
592584
211440
804024
nadoCastelo
140470
25680
166150
156980
29730
186710
180857
30930
211787
191770
31260
223030
210366
39270
249636
Real
106240
18660
124900
117845
20970
138815
146736
21830
168566
167122
22510
189632
165440
30990
196430
eu142285
72210
214495
157590
78630
236220
197022
78480
275502
228874
74220
303094
256902
91560
348462
ional
total
4885160
1700460
6585620
5648315
1874280
7522595
7073792
2056770
9130562
7935237
2266720
10201957
8522331
2561010
11083341
PREVALENCE OF IBD IN PORTUGAL—A PHARMACO-EPIDEMIOLOGICAL APPROACH
Tab
Dis
Aco
Ave
Bej
Bra
Bra
Cas
Coi
Evo
Far
Gua
Lei
Lisb
Ma
Por
Por
San
Setu
Via
Vila
Vis
Nat
Copyright # 2010 John Wiley & Sons, Ltd.
UC and CD patients (2.872 g/day and 2.946 g/day,respectively; p¼ 0.011).
IBD prevalence estimates
The data available allowed the estimation of ne andthe prevalence of the disease from 2003 to 2007. Theprevalence estimation model took into account theproportion of UC and CD patients actually taking IAIdrugs and the estimated mean yearly drug intake formesalazine and sulphasalazine previously described.Additionally, the model took into account two para-meters that were subject to sensitivity analysis—(1) theproportion of sulphasalazine used for IBD indicationand (2) the magnitude of IAI drugs non-compliance. Inthe base case scenario of the prevalence estimationmodel 52% of the total amount of sulphasalazine wasassumed to be for IBD indication and an 80% IAI drugscompliance was assumed.Figure 1 shows the results of the national IBD
prevalence estimation model and the sensitivity analysisperformed. In the base case scenario, national IBDprevalence varies from 86 per 100000 persons (95%CI[63–110]) in 2003 to 146 per 100 000 persons (95%CI[116–175]) in 2007. Results of sensitivity analysis aredepicted in Figure 1, varying from the best case (lowestprevalence) scenario (estimates based on an assumedproportion of sulphasalazine used by IBD patients of40% and drug compliance of 85%) to the worst case(highest prevalence) scenario (assumed proportion ofsulphasalazine used by IBD patients of 80% andassumed drug compliance of 70%). Sensitivity analysisestimates vary from 79 (95%CI [57–100]) to 107(95%CI [79–134]) in 2003; and from 133 (95%CI [106–160]) to 178 (95%CI [144–213]) in 2007.Disease prevalence and estimated number of IBD
patients (ne) are presented in Table 2 for the 20PortugueseDistricts, from2003 to 2007, considering thebasecase scenario.The increase in IBDprevalence, from2003 to 2007, was consistent in all Districts. TheDistricts with higher IBD prevalence, consistentlythroughout the analysed period, are Porto and Lisboa(regions more developed, richer and with youngerpopulation, on the littoral part of the country). Figure 2shows the geographical distribution pattern of IBDprevalence for the year 2007, based on the base casescenario. A north–south geographical distributionpattern is not evident at the national level.
Disease, sex and age specific prevalence estimates
In Table 3 the observed frequencies and percentages foreach disease, sex and age strata found in the large
Pharmacoepidemiology and Drug Safety, (2010)DOI: 10.1002/pds

Figure 1. Estimated prevalence of IBD in Portugal (per 100 000 persons) based on national intestinal anti-inflammatory drugs (ATC group A07E)consumption data, from 2003 to 2007. Point estimates and 95% confidence intervals for the base case model and point estimates and 95% CI for estimatesderived by sensitivity analysis taking into account five different levels for the proportion of Sulphasalazine prescribed for IBD and four different levels of drugcompliance (best case and worst case scenarios).Note: Prevalence estimates are derived from a model based on total national consumption of IAI drugs (sulphasalazine and mesalazine) and an estimate of the mean individualprescribed daily dose calculated from a sample of IBD patients. In the base case scenario (red circles and red thick line) we assume that 52% of sulphasalazine was taken by IBDpatients and the population drug compliance was 80%. 95% confidence intervals for the base case scenario are presented (red thick error bars). Sensitivity analysis was performedhaving into account two variables in the model: (1) proportion of sulphasalazine taken by IBD patients (five levels assumed: 40%, 52%, 60%, 70% and 80%) and (2) patientspopulation compliance with IAI drugs prescriptions (four levels of compliance assumed: 70%, 75%, 80% and 85%). The central dark blue area represent the intervals were pointestimates of the different sensitivity analysis scenarios are located, varying from the best case scenario (blue diamonds and thin blue line; estimates based on an assumed proportion ofsulphasalazine used by IBD patients of 40% and assumed drug compliance of 85%) to the worst case scenario (blue squares and thin blue line; assumed proportion of sulphasalazineused by IBD patients of 80% and assumed drug compliance of 70%). The upper and lower light blue areas represent the upper bound of 95% CI for the worst case scenario and thelower bound of 95% CI for the best case scenario. With this representation it is possible to fully evaluate the uncertainty in the prevalence estimation models (stochastic componentsand deterministic sensitivity analysis components).
l. f. azevedo ET AL.
national cross-sectional study on IBD patients,performed by the Portuguese IBD Study Group in2006 (n¼ 5893), are presented in the left columns foreach diagnosis category. Estimates of disease preva-lence (Pijk) for each sex and age strata, for 2007, basedon the base case scenario, are also presented in Table 3.Prevalence increased from 42 (95%CI [30–54]) and 43(95%CI [31–55]) per 100 000 in 2003 to 71 (95%CI[56–85]) and 73 (95%CI [58–87]) in 2007, respectivelyfor UC and CD. It is evident from Table 3 thatestimated prevalence of UC and CD are similar andfollow a similar age and sex distribution pattern.Prevalence is higher in the 40–64 age stratum for UCand in the 17–39 age stratum for CD. Prevalence ismoderately but consistently higher in female gender.
DISCUSSION
Despite the limitations of the prevalence estimationmethods presented and its proposed extension, it
Copyright # 2010 John Wiley & Sons, Ltd.
seems reasonable to draw four main conclusions.First, IBD prevalence in Portugal has increased from86 per 100 000 in 2003 to 146 in 2007. Second, thisincrease was consistent in all Portuguese districts, nonorth–south geographical distribution gradient wasdetected at the national level and the districts moreaffected by IBD were Lisboa and Porto, with aprevalence that reached 173 and 163 per 100 000 in2007, respectively. Third, the estimated prevalence ofUC increased from 42 per 100 000 in 2003 to 71 in2007; and the prevalence of CD increased from43 per 100 000 in 2003 to 73 in 2007. Fourth,prevalence of UC was higher in the 40–64 agestratum, prevalence of CD was higher in the 17–39age stratum and females had slightly higherprevalence than males.IBD prevalence estimates reported for European
countries are heterogeneous.1–3 The highest prevalencehas been found in the UK (from 122 to 144 per 100 000persons for UC and 214 to 243 for CD),25,26 Denmark27
Pharmacoepidemiology and Drug Safety, (2010)DOI: 10.1002/pds

Table
2.
Totalpopulation,estimated
number
ofIBD
patientsandestimated
IBD
prevalence
(per
100000persons)
forthe20Portuguesedistrictsfrom
2003to
2007
District
2003
2004
2005
2006
2007
Total
population�
Estim
ated
n8ofIBD
patientsy
Estim
ated
prevalence
IBDz
Total
population�
Estim
ated
n8ofIBD
patientsy
Estim
ated
prevalence
IBDz
Total
population�
Estim
ated
n8of
IBD
patientsy
Estim
ated
prevalence
IBDz
Total
population�
Estim
ated
n8of
IBD
patientsy
Estim
ated
prevalence
IBDz
Total
population�
Estim
ated
n8of
IBD
patientsy
Estim
ated
prevalence
IBDz
Acores
240024
222
92.3
241206
202
83.6
242241
196
80.9
243018
313
128.7
244006
391
160.4
Aveiro
722753
647
89.5
727041
714
98.2
730372
797
109.1
732867
865
118.0
734195
910
123.9
Beja
156664
89
56.9
156153
117
74.9
155254
141
90.7
154325
189
122.3
153091
246
160.6
Braga
845054
675
79.9
851337
804
94.5
856171
1010
118.0
859918
1150
133.7
862191
1177
136.5
Braganca
146103
98
67.0
145486
108
74.5
144467
136
94.2
143337
188
131.4
142049
189
133.1
Castelo
Branco
204013
188
92.3
203314
214
105.0
201983
255
126.1
200705
301
149.9
199094
320
160.9
Coim
bra
437838
334
76.3
437642
352
80.5
437086
394
90.1
436056
445
102.1
434311
468
107.9
Evora
170981
116
67.8
171130
141
82.5
170810
157
91.7
170535
177
103.8
169788
187
110.2
Faro
405380
258
63.5
411468
336
81.8
416847
391
93.8
421528
411
97.4
426386
503
118.0
Guarda
176731
109
61.7
176086
123
69.6
175090
139
79.5
173831
163
93.6
172304
184
106.8
Leiria
469159
480
102.4
472895
538
113.8
475662
575
121.0
477967
634
132.6
479499
682
142.3
Lisboa
2190197
1997
91.2
2203503
2396
108.7
2215319
3007
135.7
2224426
3461
155.6
2232700
3854
172.6
Madeira
243007
179
73.7
244286
203
82.9
245197
256
104.2
245806
267
108.8
246689
335
135.6
Portalegre
122386
91
74.2
121653
102
84.1
120581
115
95.0
119543
141
117.6
118141
154
130.1
Porto
1796573
1830
101.8
1805015
2130
118.0
1812325
2598
143.3
1817986
2859
157.2
1820752
2965
162.8
Santarem
461562
383
82.9
463676
407
87.7
464740
488
104.9
465599
590
126.6
466011
674
144.5
Setubal
819248
653
79.7
829007
722
87.0
837696
1199
143.1
845858
1127
133.2
853445
1102
129.2
VianadoCastelo
251014
242
96.3
251937
271
107.5
252272
309
122.6
252011
327
129.7
251676
362
144.0
VilaReal
221567
182
82.2
221218
202
91.4
220172
248
112.8
218935
281
128.3
217338
285
131.2
Viseu
394431
282
71.5
395202
311
78.7
395307
373
94.4
394844
420
106.3
393909
478
121.3
National
total
10474685
9053
86.4
10529255
10393
98.7
10569592
12782
120.9
10599095
14306
135.0
10617575
15466
145.7
� Totalpopulationforeach
districtbased
ondatafrom
thenational
statistics
authority
(Instituto
Nacional
deEstatıstica—
INE).
y Estim
ated
number
ofIBD
patientsforthebasecase
scenario
(52%
ofsulphasalazineusedbyIBD
patients
anddrugcompliance
of80%).
z Estim
ated
prevalence
(per
100000persons)
ofIBD
forthebasecase
scenario.
Copyright # 2010 John Wiley & Sons, Ltd. Pharmacoepidemiology and Drug Safety, (2010DOI: 10.1002/pd
PREVALENCE OF IBD IN PORTUGAL—A PHARMACO-EPIDEMIOLOGICAL APPROACH
)s
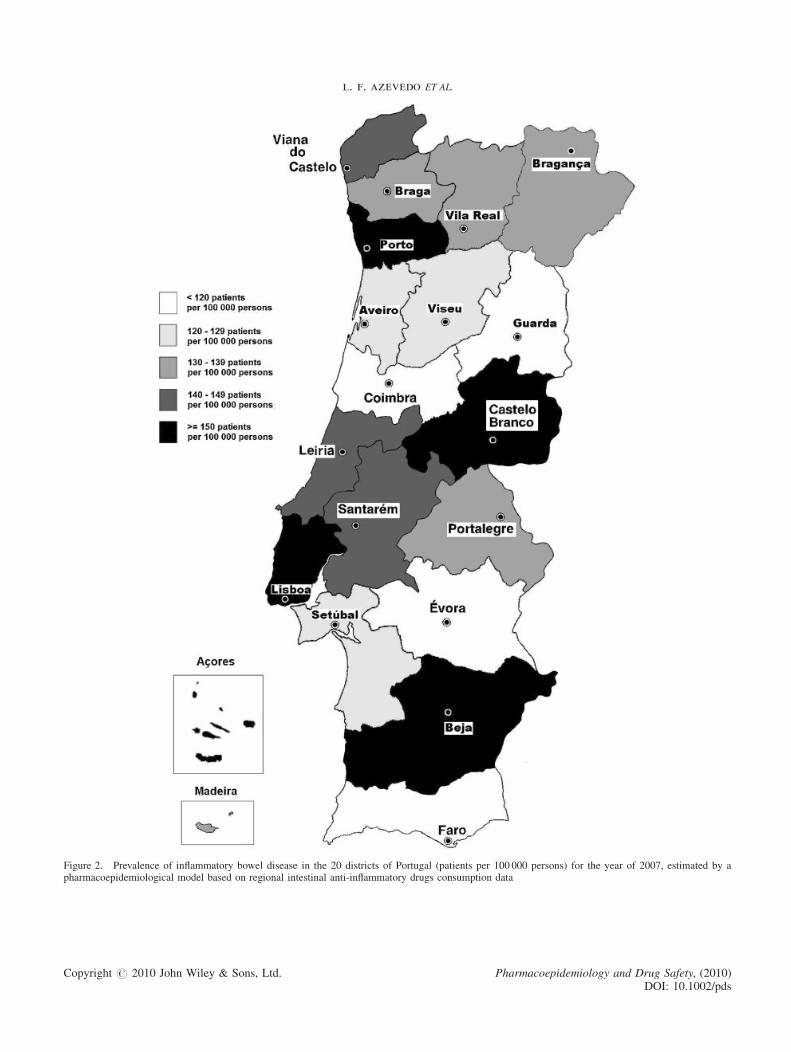
Figure 2. Prevalence of inflammatory bowel disease in the 20 districts of Portugal (patients per 100 000 persons) for the year of 2007, estimated by apharmacoepidemiological model based on regional intestinal anti-inflammatory drugs consumption data
Copyright # 2010 John Wiley & Sons, Ltd. Pharmacoepidemiology and Drug Safety, (2010)DOI: 10.1002/pds
l. f. azevedo ET AL.
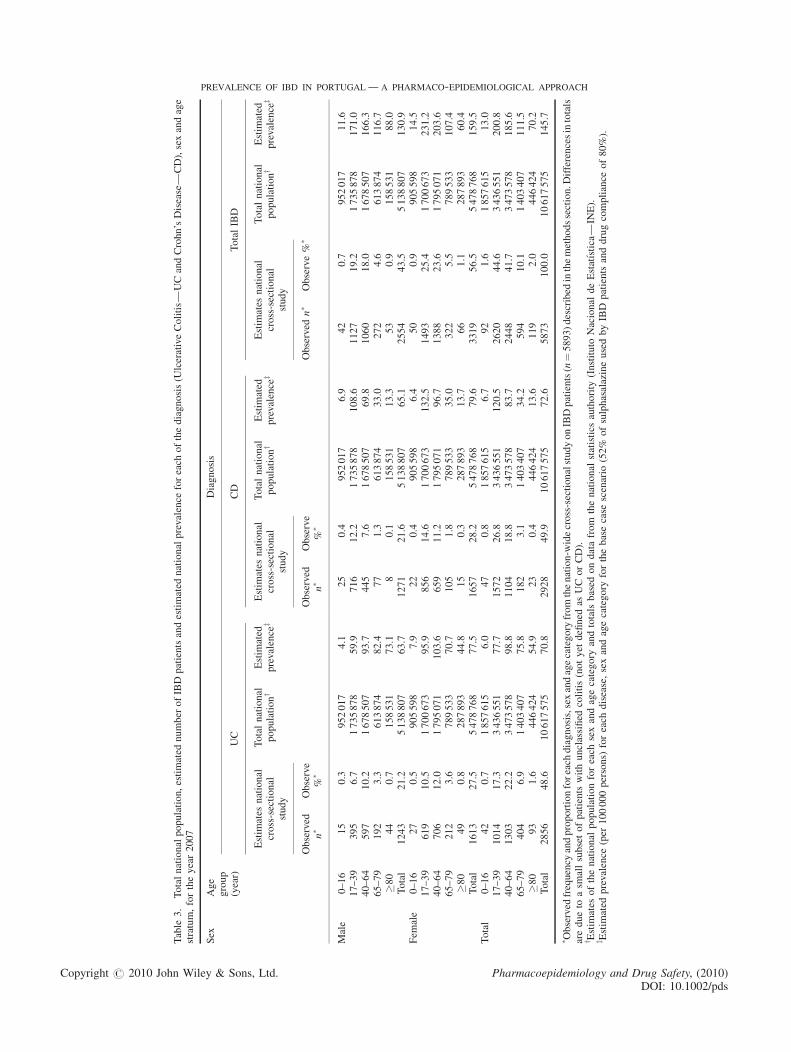
le3.
Totalnationalpopulation,estimated
number
ofIBDpatientsandestimated
nationalprevalence
foreach
ofthediagnosis(U
lcerativeColitis—
UCandCrohn’sDisease—
CD),sexandage
tum,fortheyear2007
Age
group
(year)
Diagnosis
UC
CD
TotalIBD
Estim
ates
national
cross-sectional
study
Totalnational
populationy
Estim
ated
prevalence
zEstim
ates
national
cross-sectional
study
Totalnational
populationy
Estim
ated
prevalence
zEstim
ates
national
cross-sectional
study
Totalnational
populationy
Estim
ated
prevalence
z
Observed
n�
Observe
%�
Observed
n�
Observe
%�
Observed
n�
Observe%
�
le0–16
15
0.3
952017
4.1
25
0.4
952017
6.9
42
0.7
952017
11.6
17–39
395
6.7
1735878
59.9
716
12.2
1735878
108.6
1127
19.2
1735878
171.0
40–64
597
10.2
1678507
93.7
445
7.6
1678507
69.8
1060
18.0
1678507
166.3
65–79
192
3.3
613874
82.4
77
1.3
613874
33.0
272
4.6
613874
116.7
�80
44
0.7
158531
73.1
80.1
158531
13.3
53
0.9
158531
88.0
Total
1243
21.2
5138807
63.7
1271
21.6
5138807
65.1
2554
43.5
5138807
130.9
ale
0–16
27
0.5
905598
7.9
22
0.4
905598
6.4
50
0.9
905598
14.5
17–39
619
10.5
1700673
95.9
856
14.6
1700673
132.5
1493
25.4
1700673
231.2
40–64
706
12.0
1795071
103.6
659
11.2
1795071
96.7
1388
23.6
1795071
203.6
65–79
212
3.6
789533
70.7
105
1.8
789533
35.0
322
5.5
789533
107.4
�80
49
0.8
287893
44.8
15
0.3
287893
13.7
66
1.1
287893
60.4
Total
1613
27.5
5478768
77.5
1657
28.2
5478768
79.6
3319
56.5
5478768
159.5
al0–16
42
0.7
1857615
6.0
47
0.8
1857615
6.7
92
1.6
1857615
13.0
17–39
1014
17.3
3436551
77.7
1572
26.8
3436551
120.5
2620
44.6
3436551
200.8
40–64
1303
22.2
3473578
98.8
1104
18.8
3473578
83.7
2448
41.7
3473578
185.6
65–79
404
6.9
1403407
75.8
182
3.1
1403407
34.2
594
10.1
1403407
111.5
�80
93
1.6
446424
54.9
23
0.4
446424
13.6
119
2.0
446424
70.2
Total
2856
48.6
10617575
70.8
2928
49.9
10617575
72.6
5873
100.0
10617575
145.7
served
frequency
andproportionforeach
diagnosis,sexandagecategory
fromthenation-w
idecross-sectionalstudyonIBDpatients(n¼5893)described
inthemethodssection.D
ifferencesintotals
dueto
asm
allsubsetofpatientswithunclassified
colitis(notyet
defined
asUCorCD).
timates
ofthenational
populationforeach
sexandagecategory
andtotals
based
ondatafrom
thenational
statistics
authority
(Instituto
Nacional
deEstatıstica—
INE).
timated
prevalence
(per
100000persons)
foreach
disease,sexandagecategory
forthebasecase
scenario
(52%
ofsulphasalazineusedbyIBD
patientsanddrugcompliance
of80%).
PREVALENCE OF IBD IN PORTUGAL—A PHARMACO-EPIDEMIOLOGICAL APPROACH
Tab
stra
Sex
Ma
Fem
Tot
� Ob
are
y Es
z Es
Copyright # 2010 John Wiley & Sons, Ltd. Pharmacoepidemiology and Drug Safety, (2010DOI: 10.1002/pd
)s

l. f. azevedo ET AL.
and Italy.28 Lower estimates have been found inGermany (25 and 55 per 100 000 for UC and CDrespectively29), Spain30 and Croatia.31,32 The estimatesavailable for North American countries are similar tothe highest level group in Europe2,3 and the estimatesfor Asian countries are smaller than the lowest levelgroup in Europe.2,3
Based on presented estimates, Portugal is half waybetween countries with the highest prevalence esti-mates and those with the lowest, but seems to bemaking the road to the highest level group. Thecomparison is nonetheless difficult given the widetemporal gap between reported estimates.There is an interesting discussion in the literature
about the hypothesized ‘north–south gradient’1–3,33–36
in IBD epidemiology. The present study contradictsthis hypothesis because in Portugal, a southernEuropean country, a lower prevalence would even-tually be expected and because a geographical north–south gradient at a national level was not evident.Some methodological aspects of this work have
limitations and deserve further comment. First, werelied on the assumption that 75% of IBD patients aretaking IAI drugs. Although this assumption seemsreasonable in Portugal, and it is an estimate derivedfrom a large national cross-sectional study on IBDpatients, it is possible that the proportion couldeventually be lower in the general population, wheresome less severe or long-term remission patients maybe found.Second, a mean yearly intake of IAI drugs (ci) had to
be estimated from a sub-sample (n¼ 513) of a nationalcross-sectional study. This was not a random samplefrom the IBD population, but instead a sample ofpatients willing to participate in a follow-up study andfor whom data were available on IAI drugs use.Although it does not seem probable that factorsinvolved in patient recruitment could have biased theestimates, existence of selection bias is impossible toexclude.Third, another important parameter in the prevalence
estimation model was the proportion of sulphasalazineused for IBD indication. The choice of a proportion of52% for the base case scenario was based on the bestavailable evidence, although it was limited in thiscase.10–12,37–39 Sensitivity analysis was performed, buta small effect on the estimates was found for thisparameter.Fourth, IAI drugs compliance could importantly
affect the prevalence estimates presented. The bestavailable evidence regarding this parameter wasused13,14 and sensitivity analysis was performed. Inthe absence of a better estimate, sensitivity analysis as
Copyright # 2010 John Wiley & Sons, Ltd.
performed is the best method to incorporate theuncertainty related to this parameter in the model.Fourth, the disease, age and sex specific prevalence
estimates presented depend on the proportions ofpatients pertaining to each stratum in our country, andthese were estimated based on the results of a largenational cross-sectional study.19,20 If some selectionbias is present in this study, it would affect the qualityof the estimates. However, in the cross-sectional studyalmost half of the predicted IBD patients in our countrywere included and there is an adequate representationof all the spectrum of disease severity.19,20 We believethat no major selection bias is present, but age and sexspecific estimates must be interpreted with caution andare most valuable for comparative purposes.Fifth, the methods proposed for estimation of the
variance of prevalence estimates are new in this contextand were based on the delta method.16–18 Although thisis an adequate method, there are other approaches thatcould have been implemented. A Bayesian approach,for example in the context of the multiparameterevidence synthesis methodology, could have been veryinteresting to implement.40–43
Sixth, although the prevalence estimates presentedalong the study period might be interpreted asrepresenting an extreme increase in the number ofIBD patients in our country, the fact is that, in the basecase analysis, the mean annual incidence resultingfrom these prevalence estimates would be around 15per 100 000 person-years; and such an incidence is inaccordance with the estimates presented for southernEuropean countries in the European CollaborativeStudy on IBD, the biggest study undertaken on IBDepidemiology in Europe.1,35
Seventh, regional prevalence estimates for eachPortuguese district are based on local IAI drugsconsumption, thus it is possible that some over-estimation of drug consumption, and consequentlydisease prevalence, could exist around large referencetreatment centres (for example, Lisboa and Porto).However, this fact does not affect national estimatesand it does not explain the high prevalence observed insome inland districts. Although some bias may exist, itseems reasonable to believe that most patients, most ofthe time, buy their regular prescription drugs inpharmacies close to their residencies.Finally, no changes in diagnostic tools and disease
awareness existed in Portugal in the last decade; thediagnosis and treatment strategies of IBD have beenconstant over the studied period; no differences existbetween maintenance and active disease IAI drugsdoses in Portugal (in accordance with internationalguidelines44,45); and no changes in prescription habits
Pharmacoepidemiology and Drug Safety, (2010)DOI: 10.1002/pds

KEY POINTS
� IBD prevalence in Portugal increased from 86patients per 100 000 persons in 2003 to 146 in2007, using estimates derived from a pharmaco-epidemiological approach based on intestinalanti-inflammatory drugs consumption.
� Prevalence increased from 42 and 43 per 100 000in 2003 to 71 and 73 in 2007, respectively forUlcerative Colitis and Crohn’s Disease.
� The districts more affected by IBD were Lisboaand Porto, with prevalence reaching 173 and 163per 100 000 in 2007, respectively, and a north–south gradient was not evident at the nationallevel.
� Portugal is half way between the group ofEuropean countries with the highest and thegroup with the lowest IBD prevalence estimates,but is steeply making the road to the highest levelgroup.
� The feasibility and comparability of the proposedpharmaco-epidemiological approach makes it aninteresting tool for future studies on IBDepidemiology.
PREVALENCE OF IBD IN PORTUGAL—A PHARMACO-EPIDEMIOLOGICAL APPROACH
of 5-ASA existed in Portugal in the last 10 years. ThePortuguese IBD study group has analysed this questionand concluded that, although there was an importantchange in 5-ASA prescription dose habits in the 1990’sdecade, in the last 10 years these have remainedconstant. Thus, these factors do not seem to account forthe increase in IBD prevalence reported in the presentstudy.Despite the limitations discussed, the assumptions
and parameters used in the base case analysis seem tobe the most reasonable and we believe the prevalenceestimates are acceptable. If some bias exists, it shouldcertainly be the assumed risk of some degree ofunderestimation. The feasibility and low financial andorganizational demand of this methodology, and theseemingly valid and reasonably precise estimates thatit allows to obtain, makes it a very interesting tool tostudy IBD epidemiology.
ACKNOWLEDGEMENTS
The authors thank GEDII: Amadeu Corte Real Nunes; AnaIsabel Valente; Ana Isabel Vieira; Antonia Duarte; AntonioMarques; Antonio Queiroz; Bernardino Ribeiro; CarolinaDuesca; Celeste Fatima Viveiros; Cidalina Caetano; Claudia
Copyright # 2010 John Wiley & Sons, Ltd.
Sequeira;Cristina Chagas; David Horta; Edgar Gencsi;Estela Monteiro; Fernando Magro; Filipe Gomes Silva;Francisco Portela; Gloria Marinho; Helder Cardoso; HelenaVasconcelos; Helena Sousa; Henrique Morna; HoracioLopes; Isabel Bastos; Isabel Medeiros; Isabel Seves; IsadoraRosa; Joao Baranda; Joao Ramos de Deus; Jorge Amil Dias;J Godinho Lopes; Joao Freitas; J. Pinto de Matos; JorgeReis; Jorge Vieira; Jose Cotter; Jose Estevens; J M Ribeiro;Laura Carvalho; Leopoldo Matos; Luıs Correia; Luıs Jas-mins; Luis Lebre; Luısa Barros; Luısa Gloria; LurdesTavares; Marılia Cravo; Margarida Marques; Marie IsabelleCremers; Maria do Rosario Maldonado; Manuel Correia;Maria de Lurdes Goncalves; Mario Cesar; Miguel Areia;Manuela Ferreira; Mario Dinis Ribeiro; Mario Julio Cam-pos; Marta Salgado; Nuno Almeida; Paulo Andrade; PaulaLago; Paula Ministro; Paula Moura Santos; Paula Peixe;Paulo Caldeira; Paulo Freire; Pedro Martins; RaquelGoncalves; Ricardo Ferreira; Ricardo Freire; Rui Loureiro;Rui Sousa; Rute Cerqueira; L. Salazar Sousa; Salome CostaLima; Sara Folgado Alberto; Silvia Leite; Sofia Mendes;Sonia Barroso; Sandra Lopes; Sonia Nobre; Tiago Bana eCosta; Vıtor Fernandes for their support.
REFERENCES
1. Binder V. Epidemiology of IBD during the twentieth century: anintegrated view. Best Pract Res Clin Gastroenterol 2004; 18: 463–479.
2. Loftus EV, Jr. Clinical epidemiology of inflammatory bowel disease:incidence, prevalence, and environmental influences. Gastroenterology2004; 126: 1504–1517.
3. Loftus EV, Jr, Sandborn WJ. Epidemiology of inflammatory boweldisease. Gastroenterol Clin North Am 2002; 31: 1–20.
4. Kozuch PL, Hanauer SB. Treatment of inflammatory bowel disease: areview of medical therapy. World J Gastroenterol 2008; 14: 354–377.
5. Tebano MT, Traversa G, Da Cas R, Loizzo A. Prescriptions formesalazine and sulphasalazine: a prevalence estimate of patientstreated for inflammatory bowel disease in Rome. Aliment PharmacolTher 1996; 10: 659–663.
6. Walckiers D, Sartor F. Results of an epidemiological study on drug-treated intraocular hypertension in Belgium. J Clin Epidemiol 1996; 49:489–493.
7. Sartor F, Walckiers D. Estimate of disease prevalence using drugconsumption data. Am J Epidemiol 1995; 141: 782–787.
8. Duarte-Ramos F, Cabrita J. Using a pharmaco-epidemiologicalapproach to estimate diabetes type 2 prevalence in Portugal. Pharma-coepidemiol Drug Saf 2006; 15: 269–274.
9. Magro F, Portela F, Lago P, et al. Inflammatory bowel disease: apatient’s and caregiver’s perspective.Dig Dis Sci 2009; 54: 2671–2679.
10. Jick H, Myers MW, Dean AD. The risk of sulfasalazine- and mesa-lazine-associated blood disorders. Pharmacotherapy 1995; 15: 176–181.
11. KeisuM, Ekman E. Sulfasalazine associated agranulocytosis in Sweden1972–1989. Clinical features, and estimation of its incidence. Eur JClin Pharmacol 1992; 43: 215–218.
12. Ransford RA, Langman MJ. Sulphasalazine and mesalazine: seriousadverse reactions re-evaluated on the basis of suspected adverse reac-tion reports to the Committee on Safety of Medicines. Gut 2002; 51:536–539.
13. Akobeng AK, Gardener E. Oral 5-aminosalicylic acid for mainte-nance of medically-induced remission in Crohn’s disease. CochraneDatabase of Systematic Reviews 2005. Available at: http://mrw.interscience.wiley.com/cochrane/clsysrev/articles/CD003715/frame.html[accessed on March 2008].
Pharmacoepidemiology and Drug Safety, (2010)DOI: 10.1002/pds
l. f. azevedo ET AL.
14. Bergman R, Parkes M. Systematic review: the use of mesalazine ininflammatory bowel disease. Aliment Pharmacol Ther 2006; 23: 841–855.
15. Sutherland LR, MacDonald JK. Oral 5-aminosalicylic acid for main-tenance of remission in ulcerative colitis. Cochrane Database ofSystematic Reviews 2006. Available at: http://www.mrw.interscience.wiley.com/cochrane/clsysrev/articles/CD000544/frame.html [AccessedMarch 2008].
16. Armitage P, Berry G, Matthews JNS. Statistical Methods inMedical Research (4th edn). Blackwell Science: Oxford, Malden,MA, 2002.
17. Casella GC, Berger RL. Statistical Inference (2nd edn). Duxbury:California, USA, 2001.
18. Kleinbaum DG, Kupper LL, Morgenstern H. Epidemiologic research:principles and quantitative methods. Van Nostrand Reinhold Company:New York, 1982.
19. Magro F, Portela F, Lago P, et al. Crohn’s disease in a southernEuropean country:Montreal classification and clinical activity. InflammBowel Dis 2009; 15: 1343–1350.
20. Portela F, Magro F, Lago P, et al. Ulcerative colitis in a southernEuropean country: a national perspective. Inflamm Bowel Dis 2009.Available at: http://www3.interscience.wiley.com/journal/122648656/abstract [Accessed on October 2009].
21. Lennard-Jones JE. Classification of inflammatory bowel disease. ScandJ Gastroenterol Suppl 1989; 170: 2–6.
22. Munkholm P. Crohn’s disease–occurrence, course and prognosis. Anepidemiologic cohort-study. Dan Med Bull 1997; 44: 287–302.
23. Satsangi J, Silverberg MS, Vermeire S, Colombel JF. The Montrealclassification of inflammatory bowel disease: controversies, consensus,and implications. Gut 2006; 55: 749–753.
24. INE. Instituto Nacional de Estatıstica—Statistics Portugal: DadosEstatısticos—Estatısticas Territoriais. Instituto Nacional de Estatıstica,Lisboa, Portugal. 2008. Available at: http://www.ine.pt/ [Accessed on15 March 2008].
25. Montgomery SM, Morris DL, Thompson NP, Subhani J, Pounder RE,Wakefield AJ. Prevalence of inflammatory bowel disease in British 26year olds: national longitudinal birth cohort.BrMed J 1998; 316: 1058–1059.
26. Rubin GP, Hungin AP, Kelly PJ, Ling J. Inflammatory bowel disease:epidemiology and management in an English general practice popu-lation. Aliment Pharmacol Ther 2000; 14: 1553–1559.
27. Langholz E, Munkholm P, Nielsen OH, Kreiner S, Binder V. Incidenceand prevalence of ulcerative colitis in Copenhagen county from 1962 to1987. Scand J Gastroenterol 1991; 26: 1247–1256.
28. Trallori G, Palli D, Saieva C, et al. A population-based study ofinflammatory bowel disease in Florence over 15 years (1978–1992).Scand J Gastroenterol 1996; 31: 892–899.
29. Daiss W, Scheurlen M, Malchow H. Epidemiology of inflammatorybowel disease in the county of Tubingen (west Germany). Scand JGastroenterol Suppl 1989; 170: 39–43 discussion 50-5
30. Mate-Jimenez J, Munoz S, Vicent D, Pajares JM. Incidence andprevalence of ulcerative colitis and Crohn’s disease in urban and rural
Copyright # 2010 John Wiley & Sons, Ltd.
areas of Spain from 1981 to 1988. J Clin Gastroenterol 1994; 18: 27–31.
31. Vucelic B, Korac B, SenticM, et al. Epidemiology of Crohn’s disease inZagreb, Yugoslavia: a ten-year prospective study. Int J Epidemiol 1991;20: 216–220.
32. Vucelic B, Korac B, Sentic M, et al. Ulcerative colitis in Zagreb,Yugoslavia: incidence and prevalence 1980–1989. Int J Epidemiol1991; 20: 1043–1047.
33. Lakatos L, Lakatos PL. Is the incidence and prevalence of inflammatorybowel diseases increasing in Eastern Europe? PostgradMed J 2006; 82:332–337.
34. Lakatos PL. Recent trends in the epidemiology of inflammatory boweldiseases: up or down? World J Gastroenterol 2006; 12: 6102–6108.
35. Shivananda S, Lennard-Jones J, Logan R, et al. Incidence of inflam-matory bowel disease across Europe: is there a difference between northand south? Results of the European Collaborative Study on Inflamma-tory Bowel Disease (EC-IBD). Gut 1996; 39: 690–697.
36. Sonnenberg A, McCarty DJ, Jacobsen SJ. Geographic variation ofinflammatory bowel disease within the United States.Gastroenterology1991; 100: 143–149.
37. Caprilli R, Andreoli A, Capurso L, et al. Oral mesalazine (5-amino-salicylic acid; Asacol) for the prevention of post-operative recurrenceof Crohn’s disease. Gruppo Italiano per lo Studio del Colon e del Retto(GISC). Aliment Pharmacol Ther 1994; 8: 35–43.
38. Gendre JP, Mary JY, Florent C, et al. Oral mesalamine (Pentasa) asmaintenance treatment in Crohn’s disease: a multicenter placebo-con-trolled study. The Groupe d’Etudes Therapeutiques des AffectionsInflammatoires Digestives (GETAID). Gastroenterology 1993; 104:435–439.
39. Prantera C, Pallone F, Brunetti G, Cottone M.Miglioli M. Oral 5-amino-salicylic acid (Asacol) in the maintenance treatment of Crohn’s disease.The Italian IBD Study Group. Gastroenterology 1992; 103: 363–368.
40. Ades AE, Sutton AJ. Multiparameter evidence synthesis in epidemiol-ogy and medical decision-making: current approaches. J R Stat SocSer A 2006; 169: 5–35.
41. Goubar A, Ades AE, De Angelis D, et al. Estimates of humanimmunodeficiency virus prevalence and proportion diagnosed basedon Bayesian multiparameter synthesis of surveillance data. J R Stat SocSer A 2008; 171: 541–580.
42. Sweeting MJ, De Angelis D, Hickman M, Ades AE. Estimatinghepatitis C prevalence in England and Wales by synthesizing evidencefrom multiple data sources. Assessing data conflict and model fit.Biostatistics 2008; 9(4): 715–734.
43. Welton NJ, Ades AE. A model of toxoplasmosis incidence in the UK:evidence synthesis and consistency of evidence. J R Stat Soc Ser C2005; 54: 385–404.
44. Travis SP, Stange EF, Lemann M, et al. European evidence basedconsensus on the diagnosis andmanagement of Crohn’s disease: currentmanagement. Gut 2006; 55 (Suppl 1): i16–i35.
45. Travis SPL, Stange EF, Lemann M, et al. European evidence-basedconsensus on the management of ulcerative colitis: current manage-ment. J Crohn Colitis 2008; 2: 24–62.
Pharmacoepidemiology and Drug Safety, (2010)DOI: 10.1002/pds