Molecular and Epidemiological Studies of Trichoderma ...
210
Molecular and Epidemiological Studies of Trichoderma aggressivum f. europaeum Ollscoil na h ´ Eireann M´a Nuad Matthew O’Brien Thesis submitted for the degree of doctor of Philosophy in the National University of Ireland, Maynooth Supervisors: Dr. Kevin Kavanagh Dr. Helen M. Grogan Head of Department : Prof. Paul Moynagh October 2012
-
Upload
khangminh22 -
Category
Documents
-
view
2 -
download
0
Transcript of Molecular and Epidemiological Studies of Trichoderma ...

Molecular and Epidemiological Studies ofTrichoderma aggressivum f. europaeum
Ollscoil na hEireann Ma Nuad
Matthew O’Brien
Thesis submitted for the degree of doctor of Philosophy in the National
University of Ireland, Maynooth
Supervisors:
Dr. Kevin Kavanagh
Dr. Helen M. Grogan
Head of Department:
Prof. Paul Moynagh
October 2012

CONTENTS
Table of Contents . . . . . . . . . . . . . . . . . . . . . . . . . . . . . . i
Abstract . . . . . . . . . . . . . . . . . . . . . . . . . . . . . . . . . . . vii
Presentations and Publications . . . . . . . . . . . . . . . . . . . . . . ix
Acknowledgements . . . . . . . . . . . . . . . . . . . . . . . . . . . . . xi
Declaration . . . . . . . . . . . . . . . . . . . . . . . . . . . . . . . . . xii
List of Figures . . . . . . . . . . . . . . . . . . . . . . . . . . . . . . . . xiii
List of Tables . . . . . . . . . . . . . . . . . . . . . . . . . . . . . . . . xvi
List of Abbreviations . . . . . . . . . . . . . . . . . . . . . . . . . . . . xvii
1. Introduction . . . . . . . . . . . . . . . . . . . . . . . . . . . . . . . . . 1
1.1 Kingdom: Fungi . . . . . . . . . . . . . . . . . . . . . . . . . . . . 1
1.2 Genus: Trichoderma . . . . . . . . . . . . . . . . . . . . . . . . . 2
1.2.1 Anamorphs and Teleomorphs . . . . . . . . . . . . . . . . 7
1.2.2 Taxonomy of the Trichoderma harzianum group . . . . . . 7
1.3 Trichoderma aggressivum . . . . . . . . . . . . . . . . . . . . . . . 8
1.3.1 Early identification . . . . . . . . . . . . . . . . . . . . . . 10
1.3.2 Species assignment . . . . . . . . . . . . . . . . . . . . . . 10
1.3.3 Cultural and morphological characteristics . . . . . . . . . 14
1.4 Cultivation of Agaricus bisporus . . . . . . . . . . . . . . . . . . . 15
1.4.1 Mushroom cultivation systems . . . . . . . . . . . . . . . . 16
1.4.2 The Bulk Phase III system . . . . . . . . . . . . . . . . . . 22
1.5 Trichoderma aggressivum in the mushroom industry . . . . . . . . 23
1.5.1 Symptoms and identification . . . . . . . . . . . . . . . . . 23
1.5.2 Impact on crops . . . . . . . . . . . . . . . . . . . . . . . . 26
1.5.3 Mechanism of action . . . . . . . . . . . . . . . . . . . . . 26
1.5.4 Epidemiology and spread . . . . . . . . . . . . . . . . . . . 31
1.5.5 Points of entry . . . . . . . . . . . . . . . . . . . . . . . . 32

Contents ii
1.5.6 Treatment and control . . . . . . . . . . . . . . . . . . . . 34
1.6 Aims and Objectives of this Study . . . . . . . . . . . . . . . . . 35
2. Materials and Methods . . . . . . . . . . . . . . . . . . . . . . . . . . . 36
2.1 Fungal cell culture . . . . . . . . . . . . . . . . . . . . . . . . . . 36
2.1.1 Culture media . . . . . . . . . . . . . . . . . . . . . . . . . 36
2.1.2 Sterile water . . . . . . . . . . . . . . . . . . . . . . . . . . 38
2.1.3 Strain maintenance and reference isolates . . . . . . . . . . 38
2.1.4 Long term strain storage . . . . . . . . . . . . . . . . . . . 38
2.1.5 Liquid culture of Trichoderma isolates . . . . . . . . . . . 39
2.1.6 Liquid culture of Trichoderma aggressivum with Agaricus
bisporus tissue and Bulk Phase III mushroom substrate . . 40
2.1.7 Colony counting methods . . . . . . . . . . . . . . . . . . 40
2.1.8 Culture waste disposal . . . . . . . . . . . . . . . . . . . . 42
2.2 Proteomic reagents . . . . . . . . . . . . . . . . . . . . . . . . . . 42
2.2.1 Protein extraction buffer . . . . . . . . . . . . . . . . . . . 42
2.2.2 10X sample buffer . . . . . . . . . . . . . . . . . . . . . . . 42
2.2.3 10 % w/v APS solution . . . . . . . . . . . . . . . . . . . 43
2.2.4 10 % w/v SDS solution . . . . . . . . . . . . . . . . . . . . 43
2.2.5 SDS-PAGE running buffer . . . . . . . . . . . . . . . . . . 43
2.2.6 Iso-electric focusing (IEF) buffer . . . . . . . . . . . . . . . 43
2.2.7 IEF equilibration buffer . . . . . . . . . . . . . . . . . . . 43
2.2.8 Polyacrylamide gels . . . . . . . . . . . . . . . . . . . . . . 44
2.2.9 Agarose sealing solution . . . . . . . . . . . . . . . . . . . 44
2.2.10 Staining solutions . . . . . . . . . . . . . . . . . . . . . . . 45
2.3 Proteomic methods . . . . . . . . . . . . . . . . . . . . . . . . . . 45
2.3.1 Cellular protein extraction . . . . . . . . . . . . . . . . . . 45
2.3.2 Protein quantification by Bradford assay . . . . . . . . . . 46
2.3.3 Acetone precipitation of proteins . . . . . . . . . . . . . . 46
2.3.4 2-Dimensional SDS-PAGE . . . . . . . . . . . . . . . . . . 46
2.3.5 Image acquisition and analysis . . . . . . . . . . . . . . . . 48
2.4 Mass spectrometry . . . . . . . . . . . . . . . . . . . . . . . . . . 48
2.4.1 Reagents . . . . . . . . . . . . . . . . . . . . . . . . . . . . 48

Contents iii
2.4.2 Sample preparation for mass spectrometry . . . . . . . . . 49
2.4.3 LC-MS analysis of trypsin digested proteins . . . . . . . . 50
2.5 Mushroom cropping experiments . . . . . . . . . . . . . . . . . . 50
2.5.1 Statistical analysis . . . . . . . . . . . . . . . . . . . . . . 51
2.6 Molecular biology methods . . . . . . . . . . . . . . . . . . . . . . 51
2.6.1 DNA extraction methods . . . . . . . . . . . . . . . . . . . 51
2.6.2 Cell homogenisation buffer . . . . . . . . . . . . . . . . . . 53
2.6.3 TAE buffer . . . . . . . . . . . . . . . . . . . . . . . . . . 53
2.6.4 Determination of DNA concentration by UV absorbance . 54
2.6.5 DNA gel electrophoresis and visualisation . . . . . . . . . 54
2.6.6 Endpoint PCR using Sigma Accutaq . . . . . . . . . . . . 54
2.6.7 Endpoint PCR using Bioline 2X Mastermix . . . . . . . . 55
2.6.8 Quantitative real-time PCR (qPCR) . . . . . . . . . . . . 55
2.6.9 Primers . . . . . . . . . . . . . . . . . . . . . . . . . . . . 56
2.7 HPLC . . . . . . . . . . . . . . . . . . . . . . . . . . . . . . . . . 57
2.7.1 HPLC extraction buffer . . . . . . . . . . . . . . . . . . . 57
2.7.2 HPLC Buffer A . . . . . . . . . . . . . . . . . . . . . . . . 57
2.7.3 HPLC Buffer B . . . . . . . . . . . . . . . . . . . . . . . . 57
2.7.4 Organic extraction of fungal metabolites for analysis by
HPLC . . . . . . . . . . . . . . . . . . . . . . . . . . . . . 58
2.7.5 Reverse phase HPLC analysis of fungal metabolites . . . . 58
2.7.6 Comparison of metabolite profiles . . . . . . . . . . . . . . 60
3. Cellular proteomics of Trichoderma aggressivum . . . . . . . . . . . . . 61
3.1 Introduction . . . . . . . . . . . . . . . . . . . . . . . . . . . . . . 61
3.2 2-D electrophoretic profile of Trichoderma aggressivum across a
pH 4-7 range . . . . . . . . . . . . . . . . . . . . . . . . . . . . . 63
3.3 Identification of protein homologs in Trichoderma aggressivum strain
CBS 433.95 by LC/MS analysis of tryptic digests . . . . . . . . . 63
3.4 Identification of protein homologs in Trichoderma aggressivum strain
CBS 100526 by LC/MS analysis of tryptic digests . . . . . . . . . 72

Contents iv
3.5 2-D electrophoretic analysis of Trichoderma aggressivum strain
CBS 100526 grown in the presence of mushroom substrate and
mushroom tissue. . . . . . . . . . . . . . . . . . . . . . . . . . . . 80
3.6 Differential protein expression in Trichoderma aggressivum strain
CBS 100526 grown in the presence of Bulk Phase III mushroom
substrate and mushroom tissue. . . . . . . . . . . . . . . . . . . . 82
3.7 Discussion . . . . . . . . . . . . . . . . . . . . . . . . . . . . . . . 89
3.7.1 Protein homologies . . . . . . . . . . . . . . . . . . . . . . 89
3.7.2 Differentially expressed proteins and the virulence of Tri-
choderma aggressivum . . . . . . . . . . . . . . . . . . . . 94
4. Trichoderma aggressivum in Bulk Phase III mushroom substrate . . . . 99
4.1 Introduction . . . . . . . . . . . . . . . . . . . . . . . . . . . . . . 99
4.1.1 Epidemiology of Trichoderma aggressivum in Bulk Phase
III mushroom substrate . . . . . . . . . . . . . . . . . . . 99
4.1.2 Methods for the detection of Trichoderma aggressivum in
mushroom substrate . . . . . . . . . . . . . . . . . . . . . 100
4.1.3 Aim of the study . . . . . . . . . . . . . . . . . . . . . . . 102
4.2 Experimental . . . . . . . . . . . . . . . . . . . . . . . . . . . . . 103
4.2.1 Fungal strains . . . . . . . . . . . . . . . . . . . . . . . . . 103
4.2.2 Preparation of inoculum . . . . . . . . . . . . . . . . . . . 103
4.2.3 Infection of Bulk Phase III substrate . . . . . . . . . . . . 105
4.2.4 Cropping experiment 1 . . . . . . . . . . . . . . . . . . . . 106
4.2.5 Cropping experiment 2 . . . . . . . . . . . . . . . . . . . . 106
4.2.6 Cropping experiment 3 . . . . . . . . . . . . . . . . . . . . 107
4.2.7 Quantification and detection of Trichoderma aggressivum
infection in inoculated Bulk Phase III mushroom substrate 107
4.3 Results . . . . . . . . . . . . . . . . . . . . . . . . . . . . . . . . . 108
4.3.1 Cropping experiment 1 . . . . . . . . . . . . . . . . . . . . 108
4.3.2 Cropping experiment 2 . . . . . . . . . . . . . . . . . . . . 109
4.3.3 Cropping experiment 3 . . . . . . . . . . . . . . . . . . . . 110

Contents v
4.3.4 Comparison of microbiological and molecular methods for
quantifying Trichoderma aggressivum infection level in Bulk
Phase III mushroom substrate . . . . . . . . . . . . . . . . 112
4.4 Discussion . . . . . . . . . . . . . . . . . . . . . . . . . . . . . . . 115
4.4.1 The effect of substrate infection rate, supplementation and
mixing on mushroom yield in Trichoderma aggressivum in-
fected crops . . . . . . . . . . . . . . . . . . . . . . . . . . 115
4.4.2 Detection of Trichoderma aggressivum in Bulk Phase III
mushroom substrate . . . . . . . . . . . . . . . . . . . . . 116
5. Interspecific Molecular and Chemical Variation in Trichoderma Isolates 120
5.1 Identification of fungi using PCR . . . . . . . . . . . . . . . . . . 120
5.1.1 Differentiation of fungi based on secondary metabolite profiles121
5.2 Evaluation of DNA extraction methods for the purification of PCR
amplifiable DNA from Trichoderma cultures . . . . . . . . . . . . 123
5.2.1 Manual DNA extraction by salt precipitation . . . . . . . . 123
5.2.2 DNA extraction with Qiagen Plant DNeasy spin kit ® . . 124
5.2.3 DNA extraction with Sigma Plant Genomic DNA extrac-
tion kit ® . . . . . . . . . . . . . . . . . . . . . . . . . . . 125
5.2.4 DNA extraction with Promega Wizard Magnetic Food DNA
extraction kit . . . . . . . . . . . . . . . . . . . . . . . . . 126
5.2.5 DNA extraction with Chemagen Chemagic Food DNA ex-
traction kit . . . . . . . . . . . . . . . . . . . . . . . . . . 127
5.2.6 DNA extraction with ZR Fungal/ Bacterial DNA extrac-
tion kit . . . . . . . . . . . . . . . . . . . . . . . . . . . . 128
5.2.7 Summary . . . . . . . . . . . . . . . . . . . . . . . . . . . 129
5.3 Sequence analysis and novel selective primers . . . . . . . . . . . . 130
5.3.1 Primer efficiency and standard curves . . . . . . . . . . . . 133
5.3.2 Melt curve analysis . . . . . . . . . . . . . . . . . . . . . . 136
5.3.3 Comparison of novel and existing primers for differentiating
Trichoderma isolates . . . . . . . . . . . . . . . . . . . . . 139
5.4 Differentiation of Trichoderma isolates using HPLC metabolite
profiling . . . . . . . . . . . . . . . . . . . . . . . . . . . . . . . . 142

Contents vi
5.4.1 Optimisation of elution protocol . . . . . . . . . . . . . . . 142
5.4.2 Metabolite profiles of Trichoderma isolates grown on dif-
ferent media . . . . . . . . . . . . . . . . . . . . . . . . . . 142
5.4.3 Comparison of Trichoderma metabolite profiles to a Tri-
choderma aggressivum reference profile . . . . . . . . . . . 145
5.5 Discussion . . . . . . . . . . . . . . . . . . . . . . . . . . . . . . . 147
5.5.1 DNA extraction methods . . . . . . . . . . . . . . . . . . . 147
5.5.2 Identification of Trichoderma aggressivum by real-time PCR149
5.5.3 HPLC metabolite profiling . . . . . . . . . . . . . . . . . . 151
6. General Discussion . . . . . . . . . . . . . . . . . . . . . . . . . . . . . 153
Bibliography 160

ABSTRACT
Trichoderma aggressivum is the causal agent of severe green mould disease in the
cultivated mushroom Agaricus bisporus (Samuels et al., 2002). This fungus was
first isolated in Ireland in 1987 during an epidemic of green mould disease and
has subsequently been isolated from mushroom farms across Europe and North
America (Largeteau et al., 2010). There are two subspecies T. aggressivum f.
aggressivum and T. aggressivum f. europaeum which are found in North America
and Europe respectively, the latter is the subject of this work.
The purpose of this study was to investigate the interaction of T. aggressivum
with A. bisporus and mushroom substrate, to study the epidemiology of T. ag-
gressivum in Bulk Phase III mushroom systems and to develop methods for the
detection of T. aggressivum. A separate results chapter is presented for each area
of research.
T. aggressivum has specific attributes which allow it to grow better in mush-
room substrate than other Trichoderma species, resist inhibition by A. bisporus
metabolites and ultimately cause more severe reductions in mushroom yield
(Largeteau et al., 2000b; Mumpuni et al., 1998). A proteomic method was em-
ployed to study the effect of mushroom substrate and A. bisporus tissue on T.
aggressivum in vitro. Proteins involved in the oxidative stress response were up-
regulated in T. aggressivum in both treatments. In vivo the production of oxida-
tive stress response proteins may be part of the ability of T. aggressivum to resist
inhibition by the microbial population of mushroom substrate and by A. bisporus,
thereby colonising the substrate and reducing mushroom yields (Largeteau et al.,
2000b; Savoie et al., 2001a; Williams et al., 2003a).
Much of the research on the epidemiology of T. aggressivum in mushroom
production was performed in in situ spawn run systems. The Bulk Phase III
system has become more common in Europe in recent years but there is little

Abstract viii
information about T. aggressivum in this system. Cropping experiments were
carried out to investigate the epidemiology of T. aggressivum in Bulk Phase III
with particular emphasis on the effect of bulk handling of spawn-run substrate on
infection. Infection of Bulk Phase III substrate during bulk handling was shwon
to be possible. The severity of infection depended on T. aggressivum load and
on the amount of mixing performed during bulk handling.
Identification of T. aggressivum can be problematic due to morphological sim-
ilarities with Trichoderma harzianum and other Trichoderma species found on
mushroom farms (Seaby, 1996a). The most common method for differentiating
T. aggressivum from other species is the of PCR (Chen et al., 1999a) with se-
lectve primers. In this study a real-time PCR method for identification of T.
aggressivum was developed, novel selective primers were designed and compared
to existing T. aggressivum selective primers and HPLC analysis of secondary
metabolite profiles was assessed as an alternative method for the identification of
T. aggressivum.
Keywords: Agaricus bisporus, Bulk Phase III, green mould disease, pro-
teomics, real-time PCR, Trichoderma aggressivum

PRESENTATIONS AND PUBLICATIONS
• O’ Brien, M., Grogan H. and Kavanagh K. 2010. Epidemiology and detec-
tion of Trichoderma aggressivum in bulk phase 3 mushroom systems. Biol-
ogy Departmental Research Day, National University of Ireland Maynooth.
Oral presentation.
• O’ Brien, M., Grogan H. and Kavanagh K. 2011. Protein profiling of Tri-
choderma aggressivum f. europaeum, fungal pathogen of the button mush-
room. Society for General Microbiology Spring Meeting, Queens University
Belfast. Oral presentation.
• Grogan, H. and Noble, R. and Dobrovin-Pennington A, and Lane, C. and
Nixon, T. and O’Brien, M. and Gaze, R. 2011. Trichoderma aggressivum
f. europaeum (Th2): Epidemiology in bulk Phase III systems. Horticultural
Development Company Report M50. Technical report.
• O’ Brien, M., Grogan H. and Kavanagh K. 2011. Molecular and epi-
demiological studies of Trichoderma aggressivum. Biology Departmental
Research Day, National University of Ireland Maynooth. Oral presenta-
tion.
• O’ Brien, M., Grogan H. and Kavanagh K. 2011 Pathogenesis of Tricho-
derma aggressivum. Irish Fungal Society Meeting, Trinity College, Dublin.
Oral presentation.
• O’ Brien, M., Kavanagh K and Grogan H. 2011. Characterisation of Tri-
choderma aggressivum infection in Bulk Phase III mushroom systems. 7th
International Conference on Mushroom Biology and Mushroom Products,
Arcachon, France. Poster presentation, conference proceedings p 225.

0. x
• O’ Brien, M., Kavanagh K and Grogan H. 2011. Green mould in bulk
Phase III. Irish Mushroom Conference and Trade Show, Monaghan. Poster
presentation, winner of best poster award.
• Grogan, H., O’ Brien, M., Kavanagh, K., Dobrovin-Pennington, A., Nixon,
T. and Lane, C. 2012. Epidemiology of Trichoderma aggreesivum in Bulk
Phase III compost for Agaricus bisporus production. Proceedings of the
18th Congress of the International Society for Mushroom Science p 336-
342. Conference proceedings.

ADMHALACHA - ACKNOWLEDGEMENTS
Ar dtus ba mhaith liom buıochas a gabhail le Helen Grogan agus Kevin Kavanagh
as ucht stiuir agus comhairle a thabhart dom le trı bliana anuas. Ta me faoi
chomaion agaibh.
Chabhraigh Brian McGuinness, Pat Rafferty agus Eugene O’ Gorman liom
agus me ag sathru beacan, ta me an bhuıoch as sin. Thug mic lein foirgnimh
Challan ar fad cabhair dom le turgnaimh agus nıos mo, is docha go dtuigeann
sibh fein an tabhacht a baineann le sin.
Is iad na cairde a bhı liom le linn na hoibre seo a rinne easca e. Gach einne
a chonaigh liom i dTeach Maigh Eo, beidh cuimhne agam oraibh le fada an la.
A fhoireann cic-dornalaıochta, bhı sibh mar leigheas ar mo chuid frustrachais.
Mo seanchairde, thug me neamhaird oraibh ach rinne sibh a mhalairt. Agus
Muireann, le fath ata follasach ann fein.
Ar deireadh, caithfidh me an buıochas is mo a ghabhail le mo chlann. Murach
sibhse nı bheinn anseo chor ar bith. Ta gra agam daoibh uilig.
-Matt

DECLARATION
This thesis has not been submitted in whole or in part to this or any other
university for any degree and is the original work of the author except where
otherwise stated.
Signature:
Date:

LIST OF FIGURES
1.1 Genome sequencing projects for Trichoderma species. Accessed
from GenBank September 2012. . . . . . . . . . . . . . . . . . . . 6
1.2 Phylogenetic tree of Trichoderma harzianum sensu lato based on
rDNA sequencing and RFLP analysis. . . . . . . . . . . . . . . . . 9
1.3 Phylogenetic relationship of mushroom associated Trichoderma
harzianum biotypes. . . . . . . . . . . . . . . . . . . . . . . . . . 13
1.4 Conidiophores of Trichoderma aggressivum f. europaeum (Left)
and Trichoderma aggressivum f. aggressivum (Right). . . . . . . . 14
1.5 Annual output of top 10 mushroom producing nations from 1990-
2010 . . . . . . . . . . . . . . . . . . . . . . . . . . . . . . . . . . 15
1.6 Outline of mushroom production process. . . . . . . . . . . . . . . 19
1.7 Symptoms of Trichoderma aggressivum infection at different stages
of the cropping cycle . . . . . . . . . . . . . . . . . . . . . . . . . 25
1.8 Spent mushroom substrate colonised by Trichoderma aggressivum
and Agaricus bisporus. . . . . . . . . . . . . . . . . . . . . . . . . 29
2.1 Example of results of most probable number assay . . . . . . . . . 41
2.2 Example of results of a direct plating assay. . . . . . . . . . . . . 42
2.3 HPLC gradient profiles. . . . . . . . . . . . . . . . . . . . . . . . 59
3.1 2-D electrophoretic profile of Trichoderma aggressivum strain CBS
433.95. . . . . . . . . . . . . . . . . . . . . . . . . . . . . . . . . . 64
3.2 2-D electrophoretic profile of Trichoderma aggressivum strain CBS
100526. . . . . . . . . . . . . . . . . . . . . . . . . . . . . . . . . . 65
3.3 Protein spots analysed by LC/MS from Trichoderma aggressivum
strain CBS 433.95. . . . . . . . . . . . . . . . . . . . . . . . . . . 67

List of Figures xiv
3.4 Protein spots analysed by LC/MS from Trichoderma aggressivum
strain CBS 100526. . . . . . . . . . . . . . . . . . . . . . . . . . . 74
3.5 2-Dimensional protein profile of Trichoderma aggressivum strain
CBS 100526 grown in different media. . . . . . . . . . . . . . . . . 81
3.6 Differentially expressed protein in Trichoderma aggressivum strain
CBS 100526 with exposure to Agaricus bisporus tissue and/or Bulk
Phase III mushroom substrate. . . . . . . . . . . . . . . . . . . . 83
3.7 Relative expression levels of differentially expressed proteins in Tri-
choderma aggressivum strain CBS 100526 when exposed to Agar-
icus bisporus tissue and Bulk Phase III mushroom substrate. . . . 90
4.1 Production of Trichoderma aggressivum infected Phase 3 compost. 104
4.2 Effect of infection level and supplement on mushroom yield - ex-
periment 1. . . . . . . . . . . . . . . . . . . . . . . . . . . . . . . 108
4.3 Effect of infection rate and supplement on mushroom yield - ex-
periment 2. . . . . . . . . . . . . . . . . . . . . . . . . . . . . . . 109
4.4 Effect of infection level and supplement on mushroom yield - ex-
periment 3. . . . . . . . . . . . . . . . . . . . . . . . . . . . . . . 110
4.5 Composite image of mushroom growth - experiment 3 . . . . . . . 111
5.1 EtBr gel of genomic DNA extracted by Aljanabi & Martinez (1997)
method. . . . . . . . . . . . . . . . . . . . . . . . . . . . . . . . . 123
5.2 DNA extract by Qiagen Plant Genomic method from T. aggres-
sivum mycelium (A) and colonised Bulk Phase III mushroom sub-
strate (B). . . . . . . . . . . . . . . . . . . . . . . . . . . . . . . . 124
5.3 DNA extract by Sigma Plant Genomic method from T. aggres-
sivum mycelium (A), colonised Bulk Phase III mushroom substrate
(B) and PCR product of mushroom substrate extract (C). . . . . 125
5.4 DNA extract by Promega Magnetic method from T. aggressivum
mycelium (A) and spore suspension (B) . . . . . . . . . . . . . . . 126
5.5 DNA extract by Chemagen Magnetic method from T. aggressivum
spore suspension (Left) and colonised Bulk Phase III mushroom
substrate (Right). . . . . . . . . . . . . . . . . . . . . . . . . . . . 127

List of Figures xv
5.6 EtBr gel of Genomic DNA extracted with ZR Fungal/ Bacterial
DNA extraction kit . . . . . . . . . . . . . . . . . . . . . . . . . . 128
5.7 MegaBlast search sequence alignment of genes homologous with
T. aggressivum tef1. . . . . . . . . . . . . . . . . . . . . . . . . . 131
5.8 Sequences aligning with T. aggressivum tef1 query sequence. . . . 132
5.9 Standard curves of T. aggressivum DNA amplified with novel and
existing primers . . . . . . . . . . . . . . . . . . . . . . . . . . . . 135
5.10 Melt curve analysis of products from primer standard curves . . . 138
5.11 Reactivity of novel and existing primers with Trichoderma isolates. 141
5.12 HPLC chromatogram of Trichoderma metabolites using standard
HPLC Method (Abs 254 nm). . . . . . . . . . . . . . . . . . . . . 143
5.13 HPLC chromatogram of Trichoderma metabolites using modified
HPLC Method (Abs 254 nm). . . . . . . . . . . . . . . . . . . . . 143
5.14 Reference metabolite profile for Trichoderma aggressivum. . . . . 146

LIST OF TABLES
2.1 Trichoderma isolates used in this work. . . . . . . . . . . . . . . . 39
2.2 Iso-electric focusing protocol for pH 4-7 IPG strips . . . . . . . . 47
2.3 Search parameters for Mascot searches . . . . . . . . . . . . . . . 50
2.4 PCR amplification protocol using Sigma AccuTaq . . . . . . . . . 55
2.5 PCR amplification protocol using Bioline Mastermix . . . . . . . 55
2.6 Real-time PCR cycling parameters . . . . . . . . . . . . . . . . . 56
2.7 Primers used in this study . . . . . . . . . . . . . . . . . . . . . . 57
2.8 HPLC elution methods. . . . . . . . . . . . . . . . . . . . . . . . 59
3.1 Proteins displaying homology with LC/MS analysed T. aggres-
sivum strain CBS 433.95 proteins. . . . . . . . . . . . . . . . . . . 68
3.2 Accession number, Mascot score and additional information for
proteins analysed from Trichoderma aggressivum strain CBS 433.95. 71
3.3 Proteins displaying homology with LC/MS analysed Trichoderma
aggressivum strain CBS 100526 proteins. . . . . . . . . . . . . . . 75
3.4 Accession number, Mascot score and additional information for
proteins analysed from Trichoderma aggressivum strain CBS 100526. 78
3.5 Normalised expression levels and relative fold changes of spots
differentially expressed in Trichoderma aggressivum strain CBS
100526 in response to Agaricus bisporus tissue or Bulk Phase III
mushroom substrate. . . . . . . . . . . . . . . . . . . . . . . . . . 85
3.6 Mascot search results for analysed peptides from differentially ex-
pressed Trichoderma aggressivum strain CBS 100526 proteins. . . 87
4.1 Generalised treatment composition for cropping experiments . . . 105
4.2 Two way ANOVA of mushroom yield - experiment 1. . . . . . . . 108
4.3 Two way ANOVA of mushroom yield - experiment 2. . . . . . . . 109

List of Tables xvii
4.4 Two way ANOVA of mushroom yield - experiment 3. . . . . . . . 110
4.5 Detection of Trichoderma aggressivum in Bulk Phase III mush-
room substrate by qPCR, MPN and DPA - experiment 2. . . . . . 113
4.6 Detection of Trichoderma aggressivum in Bulk Phase III mush-
room substrate by qPCR, MPN and DPA - experiment 3. . . . . . 114
4.7 Correlation analysis of methods used for the detection of T. ag-
gressivum. . . . . . . . . . . . . . . . . . . . . . . . . . . . . . . . 114
5.1 Nucleotide sequence of tef1 gene from T. aggressivum strain CBS
100526 . . . . . . . . . . . . . . . . . . . . . . . . . . . . . . . . . 130
5.2 In silico analysis of primer specificity. . . . . . . . . . . . . . . . . 134
5.3 Validation of novel and existing primers for identification of T.
aggressivum isolates using real-time PCR. . . . . . . . . . . . . . 140
5.4 Cophenetic correlation of metabolite profiles from Trichoderma
isolates. . . . . . . . . . . . . . . . . . . . . . . . . . . . . . . . . 144

LIST OF ABBREVIATIONS
Abs Absorbance
APS Ammonium persulfate
bp Base pair
BSA Bovine serum albumin
℃ Degrees celsius
cfu/g Colony forming units per gram fresh weight
CHAPS 3-[(3-cholamidopropyl)dimethylammonio]-1-propanesulfonate
cm Centimeter
Cp Crossing point
CT Cycle-threshold
CV Co-efficient of variability
DMSO Dimethyl sulfoxide
DNA Deoxyribonucleic acid
dNTP Deoxynucleotide 5’-triphosphate
DPA Direct plating assay
DTT Dithiothreitol
EDTA Ethylenediamine tetra-acetic acid
FA Formic acid
Fig. Figure
g Gram
GC Guanine-cytosine
GC/MS Gas chromatography-mass spectrometry
HPLC High performance liquid chromatography
hr Hour
IAA Iodoacetamide
IEF Isoelectric focusing

0. xix
IPG Immobilised pH gradient
KCl Potassium chloride
K2HPO4 Di-potassium hydrogen phosphate
kDa Kilodalton
kg Kilogram
L Litres
LC/MS Liquid chromatography-mass spectrometry
M Molar
m Meter
MEA Malt extract agar
MEAS Malt extract, streptomycin sulphate agar
min Minutes
mg Milligramms
MgSO4 Magnesium sulphate
ml Millilitre
mM Millimolar
MPN Most probable number
n/a Not applicable
nd No data
ng Nanogram
nm nanometer
PAGE Polyacrylamide gel electrophoresis
PCR Polymerase chain reaction
pg Picogram
pI Isoelectric point
PPE Personal protective equipment
ppm Parts per million
qPCR Quantitative real-time PCR
Q-TOF-MS Quadrupole time-of-flight mass spectrometry
RAPD Random amplified polymorphic DNA
rcf Relative centrifugal force
RFLP Restriction fragment length polymorphism
rpm Revolutions per minute

0. xx
RNA Ribonucleic acid
rDNA Ribosomal DNA
rRNA Ribosomal RNA
sec Second
SEM Standard error of mean
SDS Sodium dodecyl sufate
sp. Species (singular)
spp. Species (plural)
Tab Table
TAE Tris acetate buffer
TEMED N,N,N,N-Tetramethyl-ethane-1,2-diamine
TFA Trifluoracetic acid
TLCK Nα-Tosyl-L-lysine chloromethyl ketone hydrochloride
Tm Melting temperature
UPLC Ultra performance liquid chromatography
UV Ultra violet light
V Volt
v/v Volume per volume
WMA Weed mould analysis
w/v Weight per volume
µl Microlitre
µM Micromolar

1. INTRODUCTION
1.1 Kingdom: Fungi
Fungi are heterotrophic eukaryotes previously classified as plants which were sub-
sequently assigned their own kingdom (Whittaker, 1969) and can be shown to
be more closely related to animals in evolutionary terms (Nikoh et al., 1994), al-
though some authors have suggested that fungi are divergent from both animals
and plants (Veuthey & Bittar, 1998). The largest subdivision within the fungal
kingdom is the subkingdom Dikarya which contains ∼ 98% of all described species
and is further divided into the phyla Ascomycota and Basidiomycota (Hibbett
et al., 2007; Stajich et al., 2009).
Phylum Ascomycota includes yeasts, filamentous fungi and some macrofungi.
Ascomycetes are primarily haploid but during sexual reproduction form diploid
offspring within an ascus which generally rapidly return to the haploid form.
Asexual reproduction in the phylum is achieved through the production of coni-
dia, which are thought to be the sole method of reproduction of those species
with no known sexual stage. The majority of fungi known to cause disease in
plants, animals and other fungi are members of phylum Ascomycota but others
are known for their beneficial applications in areas such as brewing, biotechnology
and biocontrol (Stajich et al., 2009).
Phylum Basidiomycota includes rusts, smuts and mushrooms in their own sub-
phyla (Pucciniomycotina, Ustilagomycotina and Agaricomycotina, respectively)
and accounts for most macro-fungi, other than Morels. Members of the phy-
lum include plant pathogens, insect pathogens, mycorhizal fungi, wood degrad-
ing fungi, the human pathogen Cryptococcus (Nguyen et al., 2010) and edible
mushrooms, the most important in relation to this work being Agaricus bisporus
(Hibbett et al., 2007).

1. Introduction 2
1.2 Genus: Trichoderma
Ascomycete fungi of the genus Trichoderma are ubiquitously distributed in nature
and commonly account for the majority of fungi cultured from soil samples from a
variety of habitats (Harman et al., 2004) including arid near-desert, subtropical,
tropical, temperate, sub-arctic and urban environments (Johnson et al., 1987;
Druzhinina et al., 2005; Idress et al., 2012). However, the diversity of Trichoderma
species observed in soil is poor (Hagn et al., 2007) and it has been suggested that
these fungi adapted to the soil environment relatively late in their evolutionary
history (Friedl & Druzhinina, 2012). Morphological characteristics common to
most Trichoderma species include rapid growth and the production of abundant
conidia (often green in colour) in vitro. Conidia are most commonly dry, small
(<5 µm) and round or oval but are sometimes surrounded by a liquid droplet
(Gliocladium like conidia) and may be smooth or rough. Chlamydospores are
larger than conidia and are formed within the hyphae, or terminally, or not at
all (Samuels, 1996).
Morphological methods for distinguishing Trichoderma are of limited useful-
ness as there is a high degree of similarity between species. Morphology may also
vary within a population of a given species and with environmental factors. The
lack of a sexual stage further complicates matters, as mating type identification is
not possible for all species. These factors often lead to morphological taxonomy
of Trichoderma species being limited to the identification of ’species-aggregates’
which may contain a number of distinct species sharing common morphological
characteristics (Samuels, 1996).
Molecular analysis of Trichoderma species can differentiate between species
at a higher level of resolution than morphological methods because molecular
characteristics vary more readily in Trichoderma than morphological ones (Tay-
lor et al., 2006). Molecular methods for distinguishing Trichoderma species in-
clude RAPD, selective PCR, DNA hybridisation, RFLP and comparative se-
quence analysis (Ospina-Giraldo et al., 1998; Chen et al., 1999a; Lu et al., 2000;
Staniaszek et al., 2010). All of these methods can distinguish between morpho-
logically identical Trichoderma species because divergent fungal populations can
develop significant differences on a genetic level before any observable phenotypic
1. Introduction 3
changes occur (Taylor et al., 2006; Meincke et al., 2010).
Non-DNA based molecular methods for species differentiation have also been
applied to Trichoderma taxonomy. These methods rely on chemical analyses to
describe phenotypes of Trichoderma species and classify them accordingly. This
method of classification is described as chemotaxonomy and involves techniques
such as HPLC (Thrane et al., 2001) and LC/MS (Kang et al., 2011) analysis
of secondary metabolites, and the characterisation of specific enzymes and gene
products which vary between species (Schickler et al., 1998).
Species assignment based on a single product of metabolism can be subjective
and careful attention must be given to assess the distribution of the compound in
nature, but it is useful for analytical purposes when the production of the com-
pound is the most relevant phenotypic characteristic exhibited by the fungus, as
is the cases with compounds such as mycotoxins (Keller et al., 2005). Chemo-
taxonomy based on a range of metabolites is more reliable and is referred to
as metabolite profiling. Reference profiles can be generated from known species
and directly compared to unknown isolates (Thrane et al., 2001). This can al-
low species assignment as well as construction of phylogenetic trees based on
profile similarity (Kang et al., 2011). The presence and relative abundance of
certain metabolites can be affected by culture conditions and age so standardis-
ation is of utmost importance (Smedsgaard, 1997; Nielsen & Smedsgaard, 2003;
Polizzi et al., 2011). A chemical approach to taxonomy is an attractive com-
promise between morphological and molecular methods because it combines the
advantage of grouping fungi displaying similar phenotypic characteristics and the
ability to differentiate between similar species at a high level of resolution (Kang
et al., 2011). However chemotaxonomy is a relatively unexplored area of fungal
taxonomy, with the overwhelming amount of research focusing on comparative
sequence analysis (Mukherjee et al., 2012).
Comparative sequence analysis is an expensive and time consuming method
for species identification but from a taxonomic perspective it is the most useful
because it allows direct comparison of data published by different authors. This
means that classifications can be reviewed more easily in the light of new infor-
mation. The principle of comparative sequence analysis is that genes common to
related species differ somewhat in sequence due to mutations accumulated over

1. Introduction 4
time. The degree of sequence divergence gives an indication of the evolutionary
relatedness of the species. The most common application of comparative sequence
analysis in Trichoderma taxonomy is ribotyping, in which conserved genes from
the rDNA region of the genome are amplified by PCR and then sequenced (Dodd
et al., 2000). Conserved genes are desirable for this type of analysis because they
are certain to be present in all specimens studied, however, a high degree of con-
servation limits the level of species resolution based on these genes (Druzhinina
& Kubicek, 2005). The internally transcribed spacer regions (ITS 1 and ITS
2) are particularly popular targets for this type of analysis, but the validity of
these genes as a criterion for species differentiation has been called into question
based on the high degree of sequence similarity between closely related species
and observation of paralogous copies of the genes in the same organism (Dodd
et al., 2000).
An inherent problem with comparative sequence analysis is that different
genes evolve at different rates, either randomly, or due to selective pressure. So,
it is possible for two species to be quite far removed in evolutionary terms, but to
still share genes with identical sequences. Increasingly, molecular characterisa-
tions of microbes employ a multi-gene approach (Kullnig-Gradinger et al., 2002;
Chaverri et al., 2003; B laszczyk et al., 2011). Each gene, when analysed sepa-
rately, may produce a different clustering pattern for closely related species, by
combining multiple genes a better overall picture is obtained, with species seg-
regation being improved the more genes are analysed (Druzhinina & Kubicek,
2005).
The most powerful tool for the study of fungi on a molecular level is genomics.
To date, full genome sequences have been produced for three Trichoderma (Figure
1.1); Trichoderma reesei, Trichoderm atroviride and Trichoderma viride (Mar-
tinez et al., 2008; Kubicek et al., 2011). Based on comparison of these genomes
Kubicek et al. (2011) proposed mycoparasitism as the ancestral life-style of all
Trichoderma. They found that T. viride and T. reesei are derived relative to
T. atroviride but that T. atroviride and T. viride both shared a significant por-
tion of mycoparasitism related genes. Kubicek et al. (2011) proposed that the
most recent ancestor of the three species was a mycoparasite, but T. reesei (a
plant necrotroph) subsequently lost many of the genes associated with this niche.

1. Introduction 5
Martinez et al. (2008) found that while T. reesei has a considerably reduced my-
coparasitic repertoire, it still maintains a significantly higher number of fungal
cell wall degrading enzymes and non-ribosomal peptide synthetases than might
be expected for a fungus which lives off decaying plant matter. T. reesei also
possesses a surprisingly poor number of genes coding for plant cell wall degrading
enzymes, to the point that it is incapable of fully degrading woody plant tissues.
Authors have proposed that many Trichoderma species are mycoparasite de-
rived opportunists which are adapted to a wider range of ecological niches primar-
ily due to their ability to suppress and antagonise other microbes which would
otherwise out-compete them (Harman et al., 2004; Druzhinina et al., 2011). The
presence of prey fungi in association with plant material and in the soil may
have enticed ancestral Trichoderma species into new environments in which they
gained a competitive edge by antagonising their competitors using the same mech-
anisms previously employed to parasitise host fungi. Kubicek et al. (2011) sug-
gested that T. reesei is more suited to growth in wood that has been partially
degraded by other microbes and that the nitrate reductase gene that is one of
its adaptations to this niche (and which was obtained by horizontal gene transfer
(Slot & Hibbett, 2007)) may even have even been co-opted from its ancestral
Basidiomycete prey.

1. Introduction 6
Fig
.1.
1:G
enom
ese
qu
enci
ng
pro
ject
sfo
rTrichoderma
spec
ies.
Acc
esse
dfr
omG
enB
ank
Sep
tem
ber
2012.

1. Introduction 7
1.2.1 Anamorphs and Teleomorphs
Fungi from the genus Trichoderma are pleiomorphic, the asexual (anamorphic)
and sexual (teleomorphic) life-cycle stages display distinct morphologies and
ecologies. Teleomorphs of Trichoderma are found in the genus Hypocrea, a
group of fungi first described in 1825 (Fries, 1825). Morphologically identical
Trichoderma species may be distinguishable based on the morphology of their
Hypocrea teleomorphs, however, some morphologically identical Hypocrea may
have anamorphs classified as distinct Trichoderma species and vice versa (Dodd
et al., 2003). Not all Trichoderma have a teleomorph, some (like Trichoderma
aggressivum) have only been described in the asexual state (Chaverri & Samuels,
2003). Classification of Trichoderma with no known teleomorphs is complicated
by the reduced variety of morphological features and because the production
of viable offspring through sexual reproduction is at the core of the biological
concept of species.
At the time of writing the standard for naming of Trichoderma/Hypocrea
species for which the entire lifecycle has been described is to assign the Hypocrea
name to the species. Due to the genetic identity of anamorph and teleomorph
there is an increase in the use of Trichoderma as the species name for Hypocrea
with Trichoderma anamorphs. This will be the standard convention as of January
2013 (Druzhinina et al., 2011).
1.2.2 Taxonomy of the Trichoderma harzianum group
Trichoderma harzianum as described by Rifai (1969) is one of the largest sub-
groups of Trichoderma. It can be divided into T. harzianum sensu stricto, the
species T. harzianum, and T. harzianum sensu lato, a range of morphologically
similar and related species (Druzhinina & Kubicek, 2005).
Gams & Meyer (1998) described the type specimen of T. harzianum sensu
stricto (CBS 226.95) by analysis of rDNA sequence and RFLP. The species clus-
ters with other T. harzianum and Trichoderma inhamatum strains and is more
closely related to specimens which went on to be renamed Trichoderma aggres-
sivum than to Trichoderma atroviride or Trichoderma viride (Figure 1.2). Fur-
ther work by Dodd et al. (2000), Samuels et al. (2002), Kullnig-Gradinger et al.
1. Introduction 8
(2002) and Chaverri et al. (2003) showed similar findings, and went some way
to describing the diversity of species within the T. harzianum cluster as well as
showing T. harzanium sensu stricto to be the asexual stage of Hypocrea lixii.
Reliable species assignment within the T. harzianum group has been an im-
portant topic of research because they are used in industry for the production of
enzymes and as biological control agents for plant pathogenic fungi. At the same
time related species are the cause of major economic losses within the mushroom
industry (Ospina-Giraldo et al., 1999). In order for safe application in the ar-
eas of biotechnology and biocontrol strict species identifications are absolutely
necessary for safety evaluation. Patenting of products containing, or produced
from T. harzianum also calls for accurate species description. In spite of this,
phylogeny within the T. harzianum cluster is still poorly described and there are
strains described as T. harzianum which may be distinct species or subspecies
(Druzhinina & Kubicek, 2005). Some of the strains used in industry are described
as T. harzianum, in spite of them differing significantly from T. harzianum sensu
stricto (Mach et al., 1999). Since the degree of genetic and phenotypic difference
required to define new subspecies is poorly defined this is likely to remain the
case for some time.
1.3 Trichoderma aggressivum
Trichoderma aggressivum is a Trichoderma harzianum-like species found exclu-
sively in association with the cultivation of the edible mushroom Agaricus bis-
porus. It is the most significant causative agent of green mould disease in A.
bisporus cultivation. Green mould disease describes the growth of Trichoderma
species in the substrate and casing used for mushroom production. This causes
reduced mushroom formation and damage to A. bisporus fruiting bodies, result-
ing in economic losses in the mushroom industry. The condition can be caused by
many Trichoderma species but in the cultivation of A. bisporus, T. aggressivum
is the only species known to cause total crop failure.

1. Introduction 9
Fig. 1.2: Phylogenetic tree of Trichoderma harzianum sensu lato based on rDNA se-
quencing and RFLP analysis.
Reproduced from Gams & Meyer (1998).

1. Introduction 10
1.3.1 Early identification
Trichoderma aggressivum was originally identified in Ireland during an outbreak
of severe green mould disease in the late 1980s (Seaby, 1987; Staunton, 1987;
Seaby, 1989). Seaby (1987) identified three subgroups of Trichoderma harzianum
involved in the outbreak which were distinct from each other but all exhibited
morphology typical of T. harzianum (Rifai). These subgroups were assigned
the names Th1, Th2 and Th3. The Th2 subgroup was found to be the most
significant group involved in the outbreak and the one causing the most severe
damage to mushroom crops.
Subsequent outbreaks of severe green mould diseasee were reported in Britain
(Muthumeenakshi et al., 1994), the US (de la Fuente et al., 1998), Canada (Royse
et al., 1999), Spain (Hermosa et al., 1999), France (Largeteau et al., 2000a) and
across Northern Europe (Kredics et al., 2010; Sobieralski et al., 2010). The Th2
group was found to be the cause of the outbreaks in A. bisporus crops in Europe,
while phylogenetically distinct but related species are responsible for severe green
mould disease of A. bisporus in North America (Th4) and in the production of
other edible mushrooms worldwide (Trichoderma pleurotum, Trichoderma pleu-
roticola and others) (Muthumeenakshi et al., 1998; Hatvani et al., 2007; Komon-
Zelazowska et al., 2007; Kredics et al., 2009).
1.3.2 Species assignment
Most of the literature published regarding Trichoderma in mushroom production
during the 1990s uses the biotype nomenclature, classifying the most relevant
Trichoderma strains as Trichoderma harzianum biotypes Th1, Th2, Th3 and
Th4. These biotypes were distinguishable based on morphology and growth rates,
but due to the continuum of morphologies and growth types observed within
T. harzianum sensu lato identification and comparison based on these traits is
problematic. During the fifteen years following the first description of the biotypes
there was an increasing amount of molecular data pointing towards evolutionary
divisions between the biotypes.
Muthumeenakshi et al. (1994) described intraspecific polymorphisms between
81 Trichoderma isolates using RFLP of the mitochondrial DNA and PCR am-

1. Introduction 11
plified rDNA as well as ITS 1 sequence and RAPD. Their results distinguished
aggressive Th2 strains from the non-aggressive Th1 and Th3 biotypes as well as
showing that strains exhibiting the aggressive phenotype which had been previ-
ously classified as Th1 or Th3 based on morphology clustered better with the
Th2 strains based on molecular similarities.
Seaby (1996a) differentiated the biotypes based on extensive microbiological
methods. The growth characteristics of each biotype and several other Tricho-
derma species were assessed at a range of temperatures and they were examined
microscopically on different growth media. Using different growth conditions a
wider range of morphologies was observed which can allow better differentiation
of species which exhibit very similar morphologies and growth rates under the
same culture conditions.
Muthumeenakshi et al. (1998) compared Th2 strains and aggressive strains
isolated from mushroom farms in North America to assess whether they were
the same biotype, which might indicate that they had spread to North America
from Europe. Their findings reinforced the genetic segregation of the Th1, Th2
and Th3 biotypes and showed that aggressive North America isolates were ge-
netically distinct from Th2. They proposed that the North American mushroom
competitors was not imported from Europe, but was a closely related indigenous
strain exploiting the same niche as Th2. They continued the use of the term Th4
to describe this North American biotype, as had already been done by Seaby
(1996a).
Castle et al. (1998) used a similar approach to Muthumeenakshi et al. (1994)
to study Trichoderma strains isolated from mushroom farms across North Amer-
ica. In this study a subgroup of 40 % of isolates which exhibited the same RAPD
character were identified as being those most commonly associated with severe
green mould disease. This study also confirmed that these Th4 isolates were
similar to Th2 isolates from Europe but that the two were genetically distinct.
Ospina-Giraldo et al. (1998) used sequence analysis of the ITS-1, ITS-2 and
5.8S rDNA genes to delineate the biotypes Th1, Th2 and Th4 from Th3, which
was shown to display more genetic identity with Trichoderma atroviride. Their
analysis showed that the biotypes Th1, Th2 and Th4 showed a small number of
nucleotide differences in the sequenced regions relative to one and other and that

1. Introduction 12
they grouped together, with Th2 and Th4 being more similar to each other than
to Th1. Th3 by contrast was highly divergent and did not group with any of
the other T. harzianum biotypes (Figure 1.3). The term T. harzianum Th3 was
subsequently abandoned, in favour of T. atroviride to describe these strains.
Several papers published in 1999 showed that the Th2 and Th4 biotypes were
divergent from other Trichoderma strains that are used in biocontrol (Ospina-
Giraldo et al., 1999), and that the Th4 biotype was not the primary variety
associated with green mould disease in the United States prior to the epidemic of
the early 1990s (Chen et al., 1999b). A PCR based test which could distinguish
the Th2 and Th4 biotypes from non-aggressive strains was developed based on
a RAPD fragment unique to those biotypes (Chen et al., 1999a). These results
again emphasised that there is more genetic similarity between the Th2 and Th4
biotypes than there is between those biotypes and other Trichoderma varieties.
Dodd et al. (2000) used multiple gene sequences from the rDNA region to
describe the relationship between Trichoderma strains. This data supports that
of Ospina-Giraldo et al. (1998) in classifying biotype Th3 as T. atroviride and
grouping the other biotypes together but, depending on which gene was used for
tree construction four different evolutionary relationships between biotypes Th1,
Th2 and Th4 were supported with no consensus tree and low bootstrap values in
all cases. This is likely as a reult of the low-level of rDNA polymorphism between
these biotypes observed by Ospina-Giraldo et al. (1998).
In 2002 the three remaining mushroom associated Trichoderma biotypes were
reclassified. Based on available sequence data as well as novel sequences for the
tef-1 gene Samuels et al. (2002) reclassified Th1 isolates as T. harzianum sensu
stricto while the European and North American mushroom competitors Th2 and
Th4 were reclassified as Trichoderma aggressivum f. europaeum and Tricho-
derma aggressivum f. aggressivum, respectively. Further multi-gene sequencing
analyses supported this assessment, with both T. aggressivum subspecies being
closely related but distinctly divergent from T. harzianum sensu stricto (Kullnig-
Gradinger et al., 2002; Chaverri et al., 2003).

1. Introduction 13
Fig
.1.
3:P
hylo
gen
etic
rela
tion
ship
ofm
ush
room
asso
ciat
edTrichodermaharzianum
bio
typ
es.
Rep
roduce
dfr
omO
spin
a-G
iral
do
etal
.(1
998)
.T
ree
obta
ined
from
com
par
ativ
ese
quen
cean
alysi
sof
rDN
Are
gion
.
Mush
room
asso
ciat
edsp
ecim
ens
indic
ated
wit
hsi
deb
ars.

1. Introduction 14
1.3.3 Cultural and morphological characteristics
Trichoderma aggressivum is fast growing, MEA cultures typically grow ∼ 1mm/
hr at 27 ℃ and half that rate at 17 ℃ (Seaby, 1996a). Optimum growth tem-
perature is in the 25-30 ℃ range on PDA, growth is significantly reduced at 35
℃ (Samuels et al., 2012). Conidia are smooth, green, obovoid and ∼ 3.4 µm in
diameter. Conidiation is typically observed at the colony edge and in central pus-
tules within ∼ 96 hours in the dark (Seaby, 1996a). Early conidiation is enhanced
by growth under a light source but formation of conidia is not light dependent
(O’ Brien, unpublished data).
Phialides are flask shaped and held in branched conidiophores. Conidiophore
branching may be paired or unpaired. Long ’internode’ regions are frequently
observed between clusters of conidiophores. Chlamydospores are formed rarely or
not at all. The European and North American subspecies are not distinguishable
at a microscopic level (Samuels et al., 2012).
Fig. 1.4: Conidiophores of Trichoderma aggressivum f. europaeum (Left) and Tricho-
derma aggressivum f. aggressivum (Right).
Images reproduced from Samuels et al. (2012)
1. Introduction 15
1.4 Cultivation of Agaricus bisporus
Mushrooms of the genus Agaricus have been cultivated for consumption since
the 18th century (Abercrombie, 1779). Today Agaricus bisporus, the white but-
ton mushroom is the most commonly cultivated mushroom in Europe and North
America. Other Agaricus varieties such as Agaricus subrufescens and Agari-
cus bitorquis are popular in warm climates such as Brazil due to their ability
to produce fruiting bodies at higher ambient temperatures (Hernandez et al.,
2011). Most A. bisporus strains cultivated worldwide are hybrids, valued for their
smooth, white sporophores and high yields of good quality mushrooms (Diaman-
topoulou & Philippoussis, 2001).
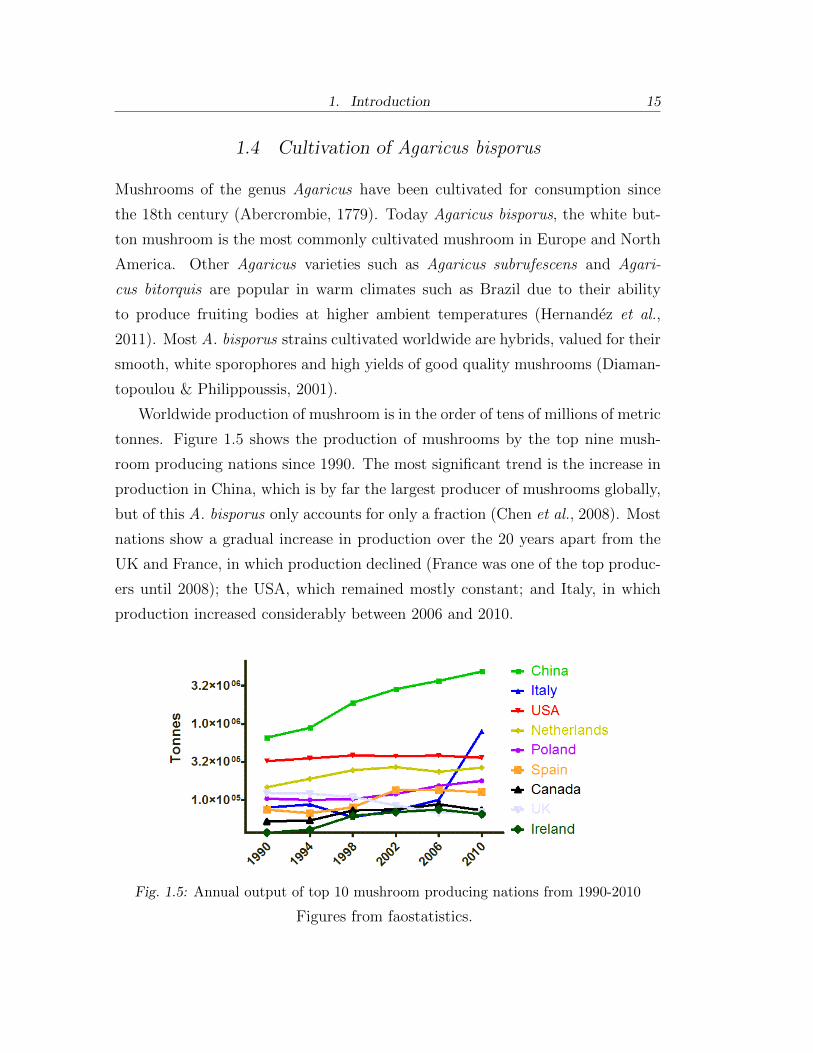
Worldwide production of mushroom is in the order of tens of millions of metric
tonnes. Figure 1.5 shows the production of mushrooms by the top nine mush-
room producing nations since 1990. The most significant trend is the increase in
production in China, which is by far the largest producer of mushrooms globally,
but of this A. bisporus only accounts for only a fraction (Chen et al., 2008). Most
nations show a gradual increase in production over the 20 years apart from the
UK and France, in which production declined (France was one of the top produc-
ers until 2008); the USA, which remained mostly constant; and Italy, in which
production increased considerably between 2006 and 2010.
Fig. 1.5: Annual output of top 10 mushroom producing nations from 1990-2010
Figures from faostatistics.
1. Introduction 16
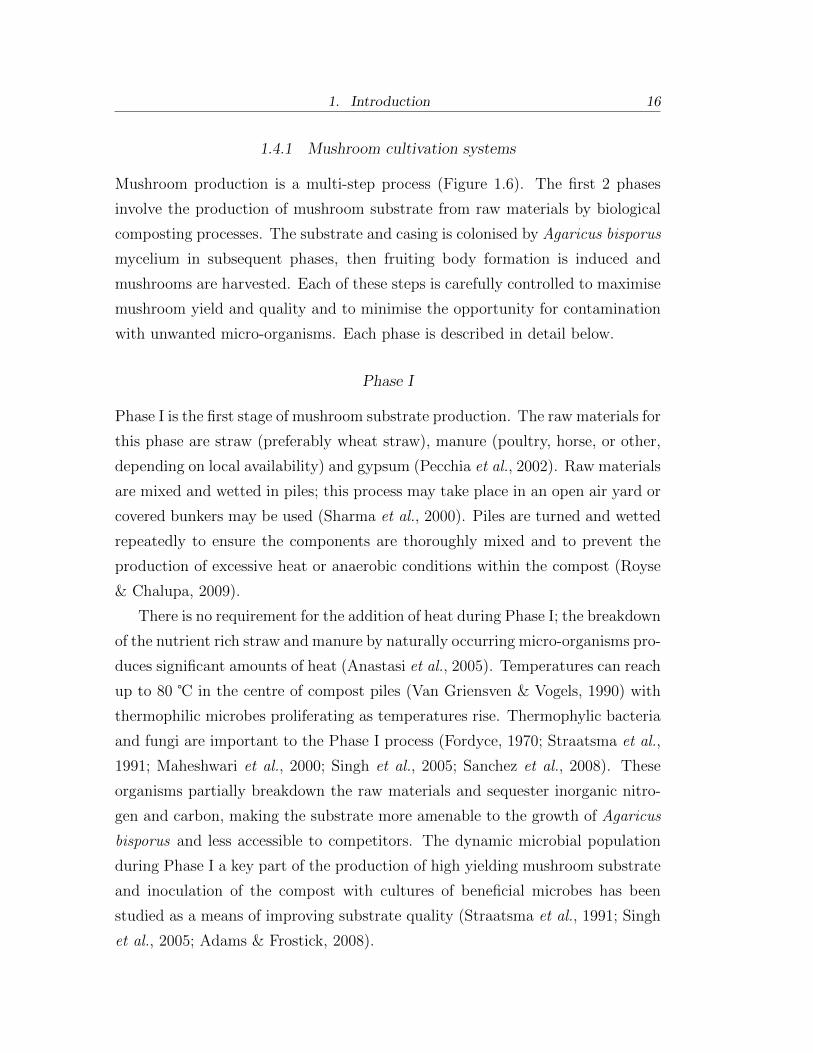
1.4.1 Mushroom cultivation systems
Mushroom production is a multi-step process (Figure 1.6). The first 2 phases
involve the production of mushroom substrate from raw materials by biological
composting processes. The substrate and casing is colonised by Agaricus bisporus
mycelium in subsequent phases, then fruiting body formation is induced and
mushrooms are harvested. Each of these steps is carefully controlled to maximise
mushroom yield and quality and to minimise the opportunity for contamination
with unwanted micro-organisms. Each phase is described in detail below.
Phase I
Phase I is the first stage of mushroom substrate production. The raw materials for
this phase are straw (preferably wheat straw), manure (poultry, horse, or other,
depending on local availability) and gypsum (Pecchia et al., 2002). Raw materials
are mixed and wetted in piles; this process may take place in an open air yard or
covered bunkers may be used (Sharma et al., 2000). Piles are turned and wetted
repeatedly to ensure the components are thoroughly mixed and to prevent the
production of excessive heat or anaerobic conditions within the compost (Royse
& Chalupa, 2009).
There is no requirement for the addition of heat during Phase I; the breakdown
of the nutrient rich straw and manure by naturally occurring micro-organisms pro-
duces significant amounts of heat (Anastasi et al., 2005). Temperatures can reach
up to 80 ℃ in the centre of compost piles (Van Griensven & Vogels, 1990) with
thermophilic microbes proliferating as temperatures rise. Thermophylic bacteria
and fungi are important to the Phase I process (Fordyce, 1970; Straatsma et al.,
1991; Maheshwari et al., 2000; Singh et al., 2005; Sanchez et al., 2008). These
organisms partially breakdown the raw materials and sequester inorganic nitro-
gen and carbon, making the substrate more amenable to the growth of Agaricus
bisporus and less accessible to competitors. The dynamic microbial population
during Phase I a key part of the production of high yielding mushroom substrate
and inoculation of the compost with cultures of beneficial microbes has been
studied as a means of improving substrate quality (Straatsma et al., 1991; Singh
et al., 2005; Adams & Frostick, 2008).

1. Introduction 17
There is increasing interest in the use of by-products from food, agriculture
and other industries in the production of mushroom substrate (Kurbanoglu et al.,
2004; Stoknes et al., 2008; Parati et al., 2011; Philippoussis & Diamantopoulou,
2011; Savoie et al., 2011). The primary materials used in the production of
substrates for the cultivation of A. bisporus and other mushrooms are by-products
of the production of cereals and livestock. Bioconversion of agricultural and other
waste products into edible mushrooms improves food production efficiency and
promotes sustainability (Savoie et al., 2011). In addition, as both wheat straw
and chicken manure are in demand for other uses and contribute significantly
to the cost of producing mushroom substrate, so the utilisation of other raw
materials can reduce the cost of mushroom production (Martin, 2008).
Phase II
The next stage of composting takes place in aerated bunkers. Compost temper-
ature is raised to 60 ℃ for 8 hr to pasteurise the compost with the intention
of killing any unwanted microbes which may be present in the raw materials
of Phase I. Modern composting facilities typically make use of forced aeration
through channels in the bunker floor to ensure that the process is fully aerobic as
well as for temperature control (Noble & Gaze, 1994). After pasteurisation the
temperature is reduced to 45 ℃ and composting proceeds until all ammonia and
other readily available nitrogen sources in the compost have been re-assimilated
by compost micro-flora (Noble & Gaze, 1996).
Inefficient aeration and temperature control during Phase II can lead to the
production of unwanted gases such as H2S and ammonia vapour and can result
in the production of substrate which produces low yields of mushrooms and is
susceptible to infection with other micro-organisms (Noble & Gaze, 1996). After
Phase II the compost is a uniform brown colour with softened straws of short
length and no odour. At this point the substrate is ready for inoculation with
Agaricus bisporus.
The objective of Phase II is to produce a substrate which is free from mi-
crobes which are pathogens or competitors of A. bisporus and which has a low
concentration of readily available nitrogen and carbohydrate. Low abundance
of easily acquired nutrition favours the growth of A. bisporus over undesired

1. Introduction 18
organisms in the later stages of production. A. bisporus is a secondary decom-
poser of plant matter which is able to degrade difficult-to-digest components of
plant cells such as lignin (Patyshakuliyeva & De Vries, 2011). The degradation
of lignin in mushroom compost and also increases the availability cellulose and
hemi-cellulose, which in turn can be broken down into high energy molecules such
as glucose and 5-carbon sugars (ten Have et al., 2003). Well prepared Phase II
compost acts as a semi-selective medium for the growth of A. bisporus as it does
not contain carbon or nitrogen sources which are readily available to organisms
which do not have the enzyme complement necessary to break down this complex
substrate (Durrant et al., 1990).
Phase III
Phase III is the first stage in the growth of Agaricus bisporus but is also described
as one of the stages of compost production. Mushroom spawn is added to the
Phase II compost, ambient temperature is adjusted to 25 ℃ and air humidity is
raised to 90 %, this process is commonly referred to as spawn-run. After Phase
III the substrate is fully colonised with A. bisporus mycelium and mottled white
in appearance.
Mushroom spawn is a pure culture of A. bisporus mycelium grown on grains
such as barley or rye which is used to inoculate the Phase II compost (Sanchez,
2004). A. bisporus strains are produced through selective breeding (Sonnenberg
et al., 2011), mycelium is used as inoculum instead of spores to prevent sexual
recombination which might alter the properties of the strain and because spores
have a low germination rate and may transfer viral diseases. Measures are usually
taken by the producer to prevent the exposure of substrate or casing material
to spores from mature mushrooms on-site to prevent the transmission of viral
diseases and crossing between spores and mycelium (Callac et al., 2006).
The most important microbe during Phase III is A. bisporus. Pains are taken
to exclude any other organisms from the substrate at this point and the mush-
room spawn is produced under high levels of sanitation to produce culturally and
genetically pure spawn (Scrase, 1995; Sharma et al., 2008).
1. Introduction 19
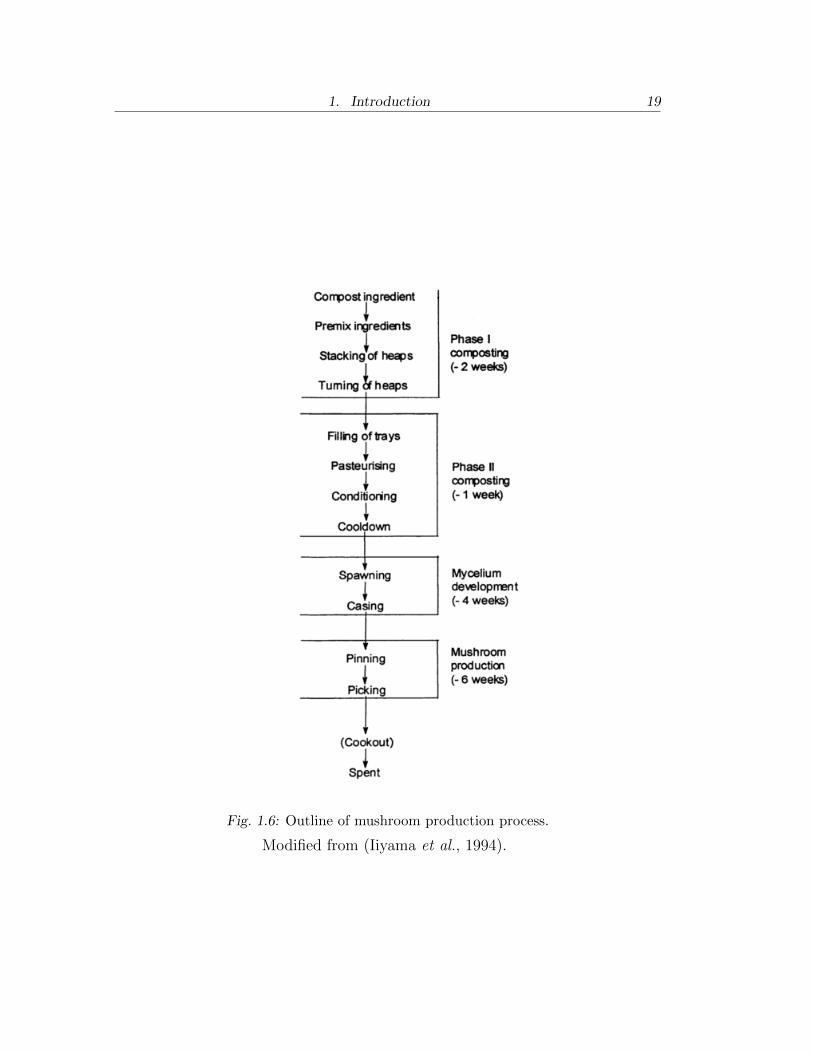
Fig. 1.6: Outline of mushroom production process.
Modified from (Iiyama et al., 1994).

1. Introduction 20
Phase IV
Phase IV of mushroom production begins with the addition of a layer of casing
soil to the top of the Agaricus bisporus colonised substrate. The casing layer is
typically made up of a blend of peat, sphagnum moss and lime (Barry et al.,
2008). Mushroom compost may be commercially available as Phase IV, pre-
cased substrate but it is more common for the casing to be added by the grower
in-house.
After the addition of casing a period of time is assigned to allow the A.
bisporus to fully colonise the casing layer, casing inoculum matching the strain
used in Phase III may be added to speed the colonisation process. Substrate
temperature is reduced to ∼ 20 ℃, humidity is maintained at 95-100 % and the
crop is watered on a regular basis until the formation of fruiting body primordia
(pins) becomes visible on the casing surface (Royse & Chalupa, 2009). Water is
essential to the formation of fruiting bodies as fruiting body tissue has a high
water content, however application of water directly on fruiting bodies impedes
their growth (Noble & Spurdens, 2000) and may cause damage or discolouration,
so water is typically withheld from the onset of pinning till the end of each flush
of cropping.
After mushrooms have been harvested from the substrate undersized pins and
residual fruiting body tissue are removed and watering begins again. In this way
a new flush of mushrooms is induced to form. Five or more flushes of mushrooms
may be obtained from a single batch of substrate but with each successive flush
the yield per unit area is reduced and the likelihood of pests and diseases occurring
increases (Staunton & Dunne, 1997). For this reason most commercial mushroom
producers harvest mushrooms in 3 flushes or less (Van Griensven & Van Roestel,
2004).
Casing soil is a vital component of the mushroom production system, fruiting
bodies cannot be induced to form without the addition of casing (Noble et al.,
2003). The role of the casing layer is three-fold, it must: absorb and hold mois-
ture, increasing the level of water available for the formation of fruiting bodies
and preventing damage cause by drying out of the substrate; have a consistency
which facilitates penetration of mycelial strands which supply nutrients and water

1. Introduction 21
to fruiting bodies from the substrate; and contain the microbial content necessary
to induce the formation of fruiting bodies (Vernooij, 2008).
The exact mechanism by which casing induces fruiting body formation is
unknown. The activities of Pseudomonas putida is known to stimulate fruiting
body formation, but whether the stimulation is caused by secreted factor from the
bacterium or an indirect result of the growth of P. putida is not clear (Zarenejad
et al., 2012). Fruiting body formation has been observed in casing substitutes
devoid of P. putida, so it has been suggested that the interaction may involve the
removal of an endogenous suppressor of fruiting body formation produced by A.
bisporus (Noble et al., 2003).
Post harvest and spent mushroom substrate
After the cropping cycle mushroom substrate, casing and facilities are treated
with high temperature steam. This process kills pests which may have been
present in the crop, prevents cross contamination between crops and cleans the
facilities for the next batch of substrate.The spent mushroom substrate (SMS) is
then disposed of.
After the growth of A. bisporus SMS still contains a significant organic matter
content as well as essential nutrients (Jordan et al., 2008). SMS has been used
for a long time as a soil supplement. It increases the porosity of heavy clay soils
and the water holding capacity of light sandy soils as well as adding nitrogen
and phosphorus which are available for uptake by plants; however, it often has
a high electrolyte content as well as a heterogenous composition which must be
assessed for effective use as a fertiliser (Rao et al., 2007; Jordan et al., 2008;
Paredes & Medina, 2009; Danai et al., 2011). SMS has a complex and variable
microbial content, even after steam treatment, however the absence of potential
human pathogens such as Campylobacter and Salmonella which are commonly
associated with manure based soil amendments makes it more suitable for use on
agricultural soils (Watabe et al., 2004; Rao et al., 2007).
Spent mushroom substrate is also biologically active and has been used in such
applications as bioremediation of contaminated soils (Chiu et al., 2009), detoxi-
fication of textile effluents (Ahlawat & Singh, 2009), as a source of raw enzymes
(Singh et al., 2003), a supplement for animal feed (Ayala et al., 2011) and as a

1. Introduction 22
replacement for casing soil in the production of further mushroom crops (Barry
et al., 2008). These add to the potential of mushroom cultivation in promoting
sustainable agriculture as it allows waste organic material from other industries
to be transformed into a food-source, while the by-products of mushroom pro-
duction themselves can be recycled into other useful materials.
1.4.2 The Bulk Phase III system
The Bulk Phase III mushroom system involves the production of mushroom sub-
strate up until the end of spawn-run in large batches by the compost producer
before it is transferred to the mushroom producer for Phase IV and the cropping
cycle. This system is different to older in situ spawn-run systems where Phase
III is carried out in-house by the mushroom grower.
Bulk Phase III production is advantageous to the grower because it allows
for a faster cropping cycle and therefore more crops per year (Van Griensven &
Van Roestel, 2004). The Phase III substrate is already colonised by Agaricus
bisporus mycelium and the grower need only apply the casing layer and allow it
to become colonised before the cropping cycle can begin. The faster turn-around
of crops generally leads to a more productive mushroom farm which offsets the
higher cost of Phase III substrate over Phase II substrate.
The production of Bulk Phase III substrate is more technologically advanced
than older production systems. Facilities are purpose built with environmental
control and sanitation in mind and there is a high level of automation. This
means that Bulk Phase III substrate is usually more consistent, more productive
and less susceptible to pests.
Bulk Phase III produced substrate is transported from the producer to the
grower in large volumes. Unlike older production systems the substrate is not
typically dispensed into bags during shipping and spawn run in situ. Instead it is
emptied directly into trucks and transported to the grower where it is filled into
trays or shelves and cased. This process is referred to as bulk handling.
While this system is less prone to contamination with unwanted micro-organisms
the nature of bulk substrate production raises concern over the impact that con-
tamination at such a facility could have. Many mushroom producers may source
substrate from the same supplier so contamination of a single batch of Bulk Phase

1. Introduction 23
III substrate could have more serious knock-on effects than the smaller volumes
produced in Phase II systems. The division of substrate into bags in Phase II
production systems may also present a barrier to the spread of infected material
within a batch of substrate (Seaby, 1996b). Bulk handling at the end of Phase
III can cause substrate from different parts of the Phase III tunnel to be mixed
together, which may spread infection throughout the substrate if it escaped de-
tection during the Phase III process.
The Bulk Phase III is becoming more common in Europe but there is still
relatively little information on the transmission and propagation of various mush-
room pests and diseases within the system. While outbreaks of Trichoderma ag-
gressivum green mould disease are less common with the use of Bulk Phase III
substrate they still occur (Lemmers, 2010).
1.5 Trichoderma aggressivum in the mushroom industry
1.5.1 Symptoms and identification
The point at which Trichoderma green mould infection is identified in a mush-
room crop varies with the severity and stage of infection as well as the Tricho-
derma species responsible. Trichoderma aggressivum is the species most com-
monly found growing within the mushroom substrate (Largeteau et al., 2000a),
it may become evident to visual inspection after Phase III (Figure 1.7 A) but
depending on the severity of infection the onset of symptoms may be delayed.
T. aggressivum infection is often identified during the cropping cycle when
green-sporulating patches of mycelium become visible on the casing surface (Fig-
ure 1.7 B). Growers may be aware of a problem before the first appearance of
spores due to a restricted pattern in pinning or colonisation of casing layer by
Agaricus bisporus mycelium or by an inability to control compost temperature
during room venting caused by increased biological activity in infected compost.
At this stage the damage is already done to the crop as T. aggressivum colonises
the mushroom substrate below the casing layer first and becomes highly antago-
nistic towards A. bisporus upon sporulation (Largeteau et al., 2000b).
Other species of Trichoderma which occasionally grow on mushroom substrate
or casing are difficult to distinguish from T. aggressivum visually (Seaby, 1996a).

1. Introduction 24
A positive identification of species requires a PCR test, usually after culturing
the fungus in vitro (Chen et al., 1999a; Williams et al., 2003b). If a Trichoderma
species other than T. aggressivum is the cause of the green mould then the damage
will likely be limited, but if T. aggressivum is present then there is a higher
likelihood of widespread contamination; it may be advisable to terminate the crop
early and proceed immediately to steam cook-out (Staunton & Dunne, 1997).
Early detection of infection is crucial when T. aggressivum is involved. Cul-
ture based screening of compost and raw materials is a method for monitoring
Trichoderma levels on a farm or composting facility, however species assignment
in such cases is usually presumptive, so this method is most useful for producers
who have experienced problems with T. aggressivum previously. A direct PCR
method can be used to detect T. aggressivum from mushroom substrate, which
may be useful for monitoring purposes (Grogan et al., 2012), but this cannot be
employed in stages of the cropping process from which personnel are excluded
(i.e. bunker stages of Phases 2 and 3). Baars et al. (2011) developed a method
for detecting specific volatiles emitted by T. aggressivum growing in mushroom
substrate in vitro using GC/MS which is further developed in Baars et al. (2012).
This presents an attractive potential method for the detection of T. agressivum
by sampling head-space gases from sealed tunnels, identifying Trichoderma infec-
tion on a species specific level while eliminating the requirement for access and
sampling problems associated with other methods.

1. Introduction 25
Fig. 1.7: Symptoms of Trichoderma aggressivum infection at different stages of the
cropping cycle
A - T. aggressivum colonisation of Phase III compost visible as dark patch with
low-levels of green-sporulation. B - Heavy sporulation of T. aggressivum on
casing surface during cropping first flush. C - Discolouration of Agaricus bisporus
sporocarps during second flush caused by contact with T. aggressivum.

1. Introduction 26
1.5.2 Impact on crops
Trichoderma aggressivum grows in mushroom substrate below the casing layer,
the same area occupied by the bulk of Agaricus bisporus mycelium and the pri-
mary source of nutrients for the formation of fruiting bodies. The general effect
of T. aggressivum is observed as the presence of bare areas on the casing surface
from which no mushrooms form, caused by the activities of T. aggressivum be-
neath the surface which may then grow through the casing layer producing visible
green spoulation. The presence of T. aggressivum may also cause cap spotting
(Figure 1.7 C) and deformation of fruiting bodies (Sharma et al., 1999). This is
a secondary effect of infection but also contributes to loss of saleable mushrooms.
Yield losses have been recorded in the region of 5-100 % (Sobieralski et al.,
2010; Rinker, 1997; Sharma et al., 1999; Danesh et al., 2000; Grogan et al., 2012),
considerably higher than with other species of Trichoderma (Sharma et al., 1999;
Grogan et al., 2000). The economic impact of T. aggressivum on the mushroom
industry has been estimated in the millions of euro (Seaby, 1996a; Kredics et al.,
2010).
Recovery of crops after the initial outbreak of green mould has been observed
(Guthrie & Castle, 2006). Fruiting bodies may form in areas that were previously
colonised by T. aggressivum, but due to the delay and reduction in yield this is
usually not enough to allow for the grower to recover the costs of substrate, staff
and power.
1.5.3 Mechanism of action
The exact mechanisms by which Trichoderma aggressivum interacts with Agari-
cus bisporus and impedes fruiting body formation are unknown. There are two
main hypotheses, the first is that T. aggressivum exhibits a parasitic activity to-
wards A. bisporus, the second is that competition for space and nutrients in the
mushroom substrate is the primary cause of fruiting inhibition, there is evidence
for both.
Parasitism of A. bisporus by T. aggressivum is plausible given the ecological
niche occupied by many Trichoderma species. Most Trichoderma species are
either mycoparasites (many of which primarily prey upon Basidiomycetes) or
1. Introduction 27
are derived from species with this lifestyle (Kubicek et al., 2011; Druzhinina
et al., 2011). The species most closely related to T. aggressivum is Trichoderma
harzianum, which is a hyperparasite used in the biological control of several plant
pathogenic fungi (Druzhinina & Kubicek, 2005; Thornton & Dewey, 1996).
Mycoparasitic Trichoderma species possess a variety of adaptations which
allow them to feed directly on living fungal tissues. These adaptations include
sensory faculties which allow the detection of other fungi (Inbar & Chet, 1995;
Seidl et al., 2009); a range of antifungal secreted metabolites which are induced
in the presence of prey fungi (Rubio et al., 2009; Montero-Barrientos et al., 2011),
including cell wall degrading enzymes (Carsolio et al., 1999; Sanz et al., 2005; da
Silva Aires et al., 2012); the ability to detoxify suppressive metabolites secreted by
other fungi (Seidl et al., 2009); and the formation of specialised hyphal structures
which allow penetration of host hyphae and the direct absorbtion of nutrients
from the intercellular space (Harman et al., 2004). Several, but not all of these
characteristics have been observed during interaction between T. aggressivum
and A. bisporus (Williams et al., 2003b).
T. aggressivum is described as the Trichoderma species most commonly found
growing in areas of mushroom substrate colonised by A. bisporus (Seaby, 1996a)
and while T. aggressivum is capable of growing in mushroom substrate in the ab-
sence of A. bisporus it does not sporulate as heavily in such a situation (Largeteau
et al., 2000b). Other species of Trichoderma occurring in compost are more of-
ten found in areas devoid of A. bisporus with a clear divide between the areas
occupied by the two fungi (Sharma et al., 1999). Observed co-localisation in vivo
as well as studies showing that the growth of T. aggressivum is promoted by
metabolites produced by A. bisporus in vitro, while other Trichoderma species
are impaired (Mumpuni et al., 1998) support the hypothesis that T. aggressivum
may grow toward A. bisporus in a directed fashion.
Several metabolites secreted by T. aggressivum have been shown to hamper
the growth of A. bisporus (Mumpuni et al., 1998; Krupke et al., 2003). These in-
clude enzymes which degrade components of the fungal cell wall (Williams et al.,
2003a; Guthrie & Castle, 2006). However metabolites secreted by T. harzianum
have a more severe impact on the growth of A. bisporus in vitro (Mumpuni
et al., 1998). T. harzianum is known for its highly antagonistic activity towards

1. Introduction 28
a range of fungal species, it is used industrially for the production of chitinase
(Nampoothiri et al., 2004) as well as in the biological control of several fungal dis-
eases of plants (Otieno et al., 2003; Verma et al., 2007; Montero-Barrientos et al.,
2011). While T. harzianum is a highly successful, opportunistic mycoparasite
and often found on mushroom farms it is a relatively minor problem compared
to T. aggressivum.
The ability of T. aggressivum to overcome inhibition by A. bisporus has been
displayed in vitro by its ability to overgrow ’brown-rings’ formed by the secretion
of laccase and other enzymes which are part of the response of A. bisporus to
the growth of competitors (Savoie et al., 2001b; Savoie & Mata, 2003). The
ability to overcome inhibition by substrate micro-flora other than A. bisporus is
also considered key to the activity of T. aggressivum (Savoie et al., 2001a). The
biological conditioning during Phases I and II of substrate production produce a
complex diversity of microbes in the substrate which inhibit the growth of many
competitor moulds, but not T. aggressivum (Largeteau et al., 2000b).
Hyphal coiling and the formation of appressoria like structures is usually
associated with mycoparasitism in Trichoderma species (Harman et al., 2004).
Despite attempts to induce this kind of interaction between T. aggressivum and
A. bisporus it has rarely been observed (Williams et al., 2003b), whereas with
other Trichoderma species found on mushroom farms it occurs readily in vitro
(Goltapeh & Danesh, 2000). The absence of hyphal coiling and the ability of T.
aggressivum to grow in mushroom substrate in the absence of A. bisporus have
led some researchers to suggest that antagonism of A. bisporus by T. aggressivum
is an example of aggressive competition, rather than true parasitism.
Mushroom substrate contains a limited amount of available nutrients and the
objective of mushroom cultivation is to convert as much of these nutrients into A.
bisporus fruiting bodies as possible. The growth of any microbes which cannot
subsequently be digested by A. bisporus sequesters some nutrients, reducing the
biological efficiency of mushroom production. In biocontrol strains of Tricho-
derma parasitism of plant pathogenic fungi has been described as opportunistic,
competitive antagonism (Harman et al., 2004). These species exhibit parasitic
behaviour towards a range of fungi but typically obtain most of their nutrition
from other sources, suggesting that they use mycoparasitism to maintain their

1. Introduction 29
Fig. 1.8: Spent mushroom substrate colonised by Trichoderma aggressivum and Agar-
icus bisporus.

1. Introduction 30
place in the rhizosphere free of competitors.
The ability of T. aggressivum to grow in mushroom substrate has been at-
tributed to its resistance to inhibition by a greater number of substrate micro-flora
(including A. bisporus) than T. harzianum or Trichoderma atroviride, rather than
a greater ability to obtain nutrition from the substrate (Largeteau et al., 2000b;
Savoie et al., 2001a). Both of T. atroviride and T. harzianum are facultative
mycoparasites and produce metabolites which are more detrimental to A. bis-
porus than those of T. aggressivum (Mumpuni et al., 1998). However when T.
harzianum or T. atroviride grow in mushroom substrate colonised by A. bisporus
the fungi exhibit a level of mutual antagonism towards each other; they do not
grow in the same space. This response is typical of many fungi in co-culture, hy-
phae at the point of contact accumulate toxic metabolites to prevent the growth
of the competitor but cannot grow themselves, resulting in a kind of deadlock
scenario (Silar, 2005; Verma et al., 2007).
T. aggressivum can colonise a large areas of substrate which also contain A.
bisporus mycelium before any apparent antagonism becomes evident (Figure 1.8).
This situation does not last indefinitely, T. aggressivum eventually supplants the
A. bisporus mycelium although some A. bisporus may remain and replace T. ag-
gressivum subsequently (Guthrie & Castle, 2006). During interactions between
biocontrol strains of T. atroviride and fungal plant pathogens the majority of
genes upregulated in T. atroviride are involved in the cellular stress response,
more so than those involved in attacking the host (Seidl et al., 2009). T. ag-
gressivum produces metabolites less toxic towards A. bisporus than T. atroviride
but it may have a similar system for detoxifying metabolites of A. bisporus which
allows the two fungi to grow in the same area without inhibiting each other.
During vegetative growth A. bisporus degrades lignin in the substrate, this
increases the bioavailability of holocellulose (ten Have et al., 2003). During fruit-
ing body formation the metabolism of cellulose and hemi-cellulose by A. bisporus
is increased (Durrant et al., 1990). Trichoderma reesei is known for its ability
to degrade ligno-cellulosic substrates but obtains most of its nutrition from cel-
lulose derivatives liberated by the breakdown of lignin than from the lignin itself
(Kubicek et al., 2011; Martinez et al., 2008). If T. aggressivum exhibits a similar
preference for cellulose as a nutrient source, then the secretion of lignin degrading

1. Introduction 31
enzymes by A. bisporus may provide a food-source for T. aggressivum. The two
fungi may occupy different ecological niches in the substrate environment, one
primarily decomposing lignin and the other utilising more easily available carbon
sources, with limited interaction. Nutrient limitation may then induce the op-
portunistic antagonistic side of T. aggressivum, causing it to become antagonistic
toward A. bisporus.
Chitinase production has been linked to the antagonistic effect of T. aggres-
sivum on A. bisporus (Guthrie & Castle, 2006) and chitinase production in other
Trichoderma species is linked to starvation. Under nutrient limiting conditions
T. aggressivum may produce chitinase and other metabolites which harm A.
bisporus in order to remove competition or to obtain additional nutrition. With-
out the ability to obtain nutrients from the more recalcitrant components of the
substrate such as lignin T. aggressivum may then lose its selective edge and be
displaced by A. bisporus mycelium moving in from unaffected areas of substrate.
1.5.4 Epidemiology and spread
The epidemiology of Trichoderma aggressivum is a complex, multifactorial prob-
lem. Researchers have described the activities of T. aggressivum in laboratory
and farm scale experiments and in industry (Grogan et al., 1996; Seaby, 1996b;
Chen et al., 1999b; Royse et al., 1999; Rinker & Alm, 2000; Beyer et al., 2000).
Results sometimes vary between researchers as the conditions and materials used
in mushroom production worldwide vary considerably and T. aggressivum infec-
tion can progress differently in vitro than in a larger scale.
In the mushroom industry there is usually a delay between the time of in-
fection and the first observation of symptoms, which can make pin-pointing the
point of entry difficult. The severity of infection can depend upon the point at
which T. aggressivum is introduced, the type of spawn used, compost quality and
probably the subspecies and strain of T. aggressivum in question, all of which
vary between producers and over time. These factors can complicate investiga-
tions into the epidemiology of T. aggressivum.

1. Introduction 32
1.5.5 Points of entry
The presence of T. aggressivum on the raw materials for Phase I of substrate
production and ineffective pasteurisation during Phase II has been proposed as
one avenue of entry for the microbe (Seaby, 1996b). The incidence of Tricho-
derma green mould is generally higher in crops grown on unpasteurised substrate
(Danesh et al., 2000). Reports vary on the susceptibility of T. aggressivum to
heat treatment; in vitro test have shown that 60 ℃ for 9 hr is sufficient to kill T.
aggressivum (Morris et al., 2000), other researchers state that T. aggressivum can
often survive industry standard pasteurisation to some extent (Beyer et al., 2000;
Rinker & Alm, 2000). A recent report showed that while standard pasteurisation
at 60 ℃ for 12 hr will reduce T. aggressivum to undetectable levels, but reduction
in the temperature to 57 ℃ and time to 8 hr makes pasteurisation considerably
less effective (Grogan et al., 2012). Local temperature fluctuations in the order
of a few degrees within a large mass of substrate are conceivable, so it may be
the case that sub-optimal pasteurisation could lead to a reduction, rather than
removal of T. aggressivum from the substrate which may not become apparent
until the later stages of production, when T. aggressivum proliferates.
Spawning has been described as a prime point for infection of substrate by
T. aggressivum. The spawning process necessitates access to the substrate which
may allow transmission of T. aggressivum on workers and equipment (Rinker
& Alm, 2000). The spawn itself may present a source of easily available car-
bohydrate to give T. aggressivum a foothold in the substrate (Fletcher, 1997)
and colonisation of the spawn grains before the outgrowth of Agaricus bisporus
is likely to have severe impact on the crop. Infection of substrate at spawn-
ing has been shown to reduce yields considerably more than after the substrate
is colonised by A. bisporus (Rinker, 1997; Beyer et al., 2000) so the exclusion
of T. aggressivum from this process is a high priority for mushroom producers.
Contamination of the spawn itself with T. aggressivum has been blamed for the
introduction of the fungus, although considering the level of sanitation used in
the production of spawn this seems unlikely.
In in situ spawn run systems the possibility of introducing T. aggressivum
after spawn run is minimal (Seaby, 1996b). Contamination of the casing or

1. Introduction 33
upper layer of compost can lead to superficial infections which reduce yield by
a relatively small amount. Emergence of severe green mould symptoms after
casing may occur as a result of infection at spawning with low levels of visible
sporulation. In the Bulk Phase III system bulk handling of substrate during
the emptying of Phase III tunnels, transport to the grower and filling offer an
additional opportunity for T. aggressivum to gain access to the substrate. There
is currently little information regarding infection of crops at this point and it is
assessed in part in Chapter 4 of this work.
On farms where T. aggressivum is a problem it tends to persist. Seaby (1996b)
described lagoon water, dust debris and equipment as prime sources of T. ag-
gressivum infection. Infected material can be spread on workers clothing and
equipment (Royse et al., 1999) so separation of workers from areas where spore
loads are high (such as emptying of SMS) and areas susceptible to infection (such
as spawning) is crucial (Rinker & Alm, 2000).
Insect and arthropod pests have been linked to the spread of Trichoderma ag-
gressivum (Seaby, 1996a). Mites of the genus Pygmephorus are sometimes asso-
ciated with T. aggressivum infection and can become vectors for the transmission
of infection (Seaby, 1996b). Sciarid and phorid flies are associated with mush-
room production (Jess et al., 2007). They are a problem in and of themselves and
transmit disease-causing fungi such as Verticillium fungicola (Shamshad et al.,
2009) so they may also transmit Trichoderma spores. The Bulk Phase III sys-
tem reduces the risk of Trichoderma spread on arthropod vectors in general as
spawn-run is separated from later stages of production, where flies and mites are
more common.
Contamination during the cropping cycle typically leads to less severe infec-
tion than at spawning. However, as T. aggressivum is capable of colonising sub-
strate and casing previously colonised by A. bisporus (Largeteau et al., 2000b)
infection early in the cropping cycle will become increasingly severe with each
flush. Spent mushroom substrate can contain very high levels of disease-causing
organisms and special considerations must be taken in its disposal.

1. Introduction 34
1.5.6 Treatment and control
Fungicides can be used to control the growth of Trichoderma aggressivum. Direct
application of carbendazim to mushroom spawn reduces the risk of infection at
spawning (Grogan et al., 1996). Prochloraz, carbendazim, benomyl and thiaben-
dazol reduce the level of substrate colonisation by T. aggressivum (Abosriwil &
Clancy, 2004). Benomyl, chlorothalonil, thiabendazole and thiophanate methyl
reduce the level of casing colonisation (Rinker & Alm, 2008).
The number of fungicides approved for use in mushroom production varies
between countries, in the EU the number is becoming increasingly small. There
have also been reports of T. aggressivum strains resistant to fungicides (Romaine
et al., 2008). These factors have prompted research into alternatives to fungicides
for the control of T. aggressivum such as spawn strain resistance (Anderson et al.,
2000), plant essential oils (Regnier et al., 2012) and biological control (Gyorfi &
Geosel, 2008).
Currently, rigorous hygiene is considered the best method for prevention of T.
aggressivum infection. Steam cook-out after every crop and use of disinfectant
on surfaces and equipment are now standard practice for reducing spread of
all mushroom diseases. Physical separation of the different stages of production
reduces the chance of material being transferred from the latter stages of cropping
(where disease levels may be high) and those in the earlier stages (which are
more vulnerable to infection) (Rinker & Alm, 2000; den Ouden, 2012). The use
of any chemical agent to deal with T. aggressivum adds to the cost of mushroom
production as well as raising food safety and resistance issues. A rigorously
applied hygiene management system can reduce the occurrence of all mushroom
diseases, not just T. aggressivum.

1. Introduction 35
1.6 Aims and Objectives of this Study
The overall objectives of this study were:
• To investigate the reaction of Trichoderma aggressivum to Agaricus bisporus
tissue and to mushroom substrate using a proteomic approach.
• To study the effect of bulk handling on T. aggressivum infected mushroom
substrate and its epidemiology in the Bulk Phase III mushroom system.
• To compare and evaluate methods for the detection and quantification of
T. aggressivum in Bulk Phase III mushroom substrate.
• To develop a method for the identification of T. aggressivum using real-time
PCR with novel selective primers.
• To assess HPLC profiling of secondary metabolites as a method of differen-
tiating T. aggressivum from other Trichoderma species.

2. MATERIALS AND METHODS
All chemicals apart from enzymes were purchased from Sigma-Aldrich Limited
unless otherwise noted. Enzymes were purchased from Promega unless otherwise
noted.
2.1 Fungal cell culture
2.1.1 Culture media
Malt extract agar (MEA)
Malt extract agar (25 g) or 10 g each of malt extract and agar (technical grade)
were added to 500 ml of distilled water and autoclaved at 115 ℃ for 10 min. The
liquid agar was allowed to cool to ∼55 ℃ and aseptically transferred into sterile
plastic Petri dishes (∼20 ml agar per dish) in a laminar flow hood. The medium
was allowed to cool for 1 hr and either stored at 4 ℃ or used immediately.
Trichoderma minimal medium (TMM)
Ammonium tartrate (0.5 g), MgSO4 (0.1 g), K2HPO4, KCl (0.08 g) and glucose
(5 g) were dissolved in distilled water (500 ml). Agar (7.5 g) was added and the
medium was sterilised by autoclaving at 121 ℃ for 15 minutes. The liquid agar
was allowed to cool to ∼55 ℃ and aseptically transferred into sterile plastic Petri
dishes (∼20 ml agar per dish) in a laminar flow hood. The medium was allowed
to cool for 1 hr and either stored at 4 ℃ or used immediately. Adapted from
(Williams et al., 2003a).

2. Materials and Methods 37
Malt extract agar/ streptomycin sulphate (MEAS)
Malt extract agar was prepared as above. After cooling the sterile agar to ∼55 ℃and prior to dispensation into Petri dishes streptomycin sulphate stock solution
(1 ml per 100 ml) was added. The final concentration of streptomycin sulphate
in the medium was 10 ppm.
Ohio agricultural experimental station medium (OAES)
Glucose (5 g), yeast extract (2 g), sodium nitrate (1 g), magnesium sulphate (0.5
g), potassium phosphate monobasic (1 g), dessicated ox bile (1 g) and sodium
propionate (1 g) were dissolved in 1 L distilled water. Agar (15 g) was added and
the medium was sterilised by autoclaving at 121 ℃ for 15 minutes. The molten
agar was kept at 55 ℃ until use and streptomycin sulphate stock solution (1 ml
per 100 ml) was added. Adapted from (Kaufman et al., 1963).
Streptomycin sulphate stock solution
Streptomycin sulphate was dissolved as a 1 % w/v solution in autoclave sterilised
water in a sterile container under aseptic conditions. The solution was stored at
4 ℃ for up to 1 month.
Malt extract broth
Malt extract was dissolved in distilled water as a 1% or 2 % w/v solution. The
solution was transferred to 250 ml conical flasks in 100 ml volumes and sealed
with cotton-wool and tinfoil prior to autoclaving at 115 ℃ for 10 min. Sterile
broth was stored in the autoclaved containers at room temperature for up to 4
days.
Malt extract broth with Bulk Phase III mushroom substrate
Bulk Phase III mushroom substrate was obtained from Carbury compost Ltd at
end of spawn run and lyophilised. Lyophilised bulk Phase III mushroom substrate
(1 g) was added to malt extract (1 g) and 100 ml distilled water in a 250 ml conical

2. Materials and Methods 38
flask, sealed with cotton wool and covered with tinfoil. The medium was sterilised
by autoclaving at 115 ℃ for 10 minutes and stored at room temperature.
Malt extract broth with Agaricus bisporus cap tissue
Closed sporocarps of Agaricus bisporus were obtained from Barretstown Farm
Ltd. Caps were finely chopped and the tissue (1 g) was added to malt extract (1
g) and 100 ml distilled water in a 250 ml conical flask, sealed with cotton wool
and covered with tinfoil. The medium was sterilised by autoclaving at 115 ℃ for
10 minutes and stored at room temperature.
2.1.2 Sterile water
Distilled water was autoclaved at 121 ℃ for 15 min, sealed tightly and stored at
room temperature.
2.1.3 Strain maintenance and reference isolates
Trichoderma aggressivum reference isolates were acquired from Centraalbureau
voor Schimmelcultures (CBS, Royal Netherlands Academy of Arts and Sciences,
Ultrecht, the Netherlands) and were added to the National University of Ire-
land, Maynooth culture collection under liquid nitrogen. Additional Trichoderma
strains were retrieved from long term storage at -70 ℃ in the Teagasc Kinsealy
culture collection. A list of Trichoderma isolates used in this work is given in
Table 2.1.
Primary cultures were inoculated onto MEA from long term storage and grown
for three days at 20 ℃ before being used to inoculate secondary cultures for ex-
perimental work. Subcultures were performed every 6-8 weeks but no more than
three secondary subcultures were performed before retrieving a fresh primary
culture from storage.
2.1.4 Long term strain storage
Trichoderma isolates were cultured on MEA at 20-25 ℃ with periodic illumina-
tion for 5 days to promote of sporulation. Plugs (5 mm diameter) were excised
from the growing edge of the culture and added to cryotubes containing 1 ml 60

2. Materials and Methods 39
Tab. 2.1: Trichoderma isolates used in this work.
Code Classification Source
100526 T. aggressivum f. europaeum CBS
433.95 T. aggressivum f. europaeum CBS
K417 Trichoderma aggressivum biotype Th2 AFBI Loughall
FM 2 Trichoderma harzianum biotype Th1 FERA
FM 5 Trichoderma harzianum biotype Th1 FERA
FM 10 T. aggressivum f. europaeum FERA
FM 11 T. aggressivum f. europaeum FERA
FM 18 T. aggressivum f. europaeum FERA
K387 Trichoderma aggressivum biotype Th2 Teagasc Kinsealy
K363 Trichoderma sp. Teagasc Kinsealy
355 Trichoderma atroviride Teagasc Kinsealy
T. atro Trichoderma atroviride Teagasc Kinsealy
413 Trichoderma sp. Teagasc Kinsealy
433 Trichoderma sp. Teagasc Kinsealy
430 Trichoderma harzianum Teagasc Kinsealy
K517 Non-aggressive Trichoderma sp. Poland
K516 Non-aggressive Trichoderma sp. Poland
% (v/v) autoclave sterilised glycerol (3 plugs per tube). Cryotubes were stored
at -70 ℃ and/or in liquid nitrogen.
2.1.5 Liquid culture of Trichoderma isolates
Plugs (5 mm diameter) were cut from the growing edge of Trichoderma mycelium
cultured on malt extract agar for 3 days at 25 ℃. Plugs were aseptically trans-
ferred to 100 ml of sterile liquid growth medium and incubated in the dark at 25
℃ on a shaking incubator at 100 rpm.

2. Materials and Methods 40
2.1.6 Liquid culture of Trichoderma aggressivum with Agaricus bisporus tissue
and Bulk Phase III mushroom substrate
Malt extract broth (1 %, control), malt extract broth with Bulk Phase III mush-
room substrate and malt extract broth with Agaricus bisporus cap tissue were
inoculated with Trichoderma aggressivum strain CBS 100526 as per section 2.1.5
and cultured for 7 days.
2.1.7 Colony counting methods
All colony counting procedures were carried out in a class 2 biological safety cab-
inet under aseptic conditions. All incubations were carried out at 25 ℃ in the
dark. For full weed mould analysis and most probable number analysis one plate
per sample showing growth of Trichoderma was retained and the species was con-
firmed as Trichoderma aggressivum by PCR. In some experiments where counts
were performed on T. aggressivum infected mushroom substrate corresponding
mushroom substrate subsamples were sent to FERA, UK for q-PCR testing.
Full weed mould analysis
Mushroom substrate subsamples (20 g) were mixed with sterile water (200 ml) in
a polythene bag using a BagMixer 400 R (Interscience) stomacher at 100 cycles
per minute for 1 minute, left stand for 5 minutes and mixed for a further 1
minute. The homogenised compost extract was then serially diluted from 10−1-
10−9 in sterile water and 1 ml subsamples were added to plastic Petri dishes
in duplicate. Molten OAES medium (∼20 ml) which had been cooled to ∼55
℃ was added to the Petri dishes. The extract was mixed with the agar by
gentle swirling and allowed to set. OAES plates were incubated for 2 days and
Trichoderma colonies were counted on plates showing 20-200 colonies. The count
was repeated 1 day later. The initial fungal load in the compost was calculated in
terms of cfu/g fresh weight by multiplying the mean number of colonies observed
by the dilution factor of the extract used (the neat extract had a dilution factor
of 10).

2. Materials and Methods 41
Most probable number (MPN) analysis
Homogenized compost extract was prepared as per full weed mould analysis and a
dilution series was prepared in the range of 10−1-10−6. Five 10 µl drops of diluted
compost extract were spotted onto MEAS plates, distributed evenly. Plates were
incubated for 3 days and each plate was scored for the number of drops showing
growth of Trichoderma aggressivum. The count was repeated after a further 2
days incubation. The total score was measured for each dilution level and the
initial fungal load in the compost was estimated in terms of cfu/g fresh weight by
using the MPN method (Halvorson & Ziegler, 1933; Briones et al., 1999; Herigstad
et al., 2001).
Fig. 2.1: Example of results of most probable number assay
Test performed on a single substrate subsample serially diluted 5 times and
plated.
Direct plating assessment
Individual straws of mushroom substrate were removed from a thoroughly mixed
subsample of mushroom compost and cut to approximately 3 cm in length using
sterilised forceps and scissors. Cut straw pieces (10 per sample) were placed
aseptically onto 140 mm diameter MEAS plates and incubated for 2-4 days. The
amount of T. aggressivum in the substrate was scored based on the number of
compost pieces from which growth of Trichoderma was observed. The plates were
re-incubated and recounted after a total of 7 days.

2. Materials and Methods 42
Fig. 2.2: Example of results of a direct plating assay.
Trichoderma aggressivum mycelium is visible growing from more straws in sub-
strate infected at higher levels. No growth is observed from the control substrate.
2.1.8 Culture waste disposal
Used agar plates, liquid media and all gloves and other non-sharp materials which
were used in microbial culture were autoclave sterilised at 130 ℃ for 30 minutes.
Contaminated sharps were disposed of in a contaminated sharps bin and de-
stroyed by incineration.
2.2 Proteomic reagents
2.2.1 Protein extraction buffer
Protein extraction buffer was prepared by adding 1 µl/ ml of a 10 mg/ ml solution
of the protease inhibitors pepstatin A, TLCK, leupeptin and aprotinin to cell
homogenisation buffer (Section 2.6.2).
2.2.2 10X sample buffer
SDS (2 g), DTT (1.54 g), Bromophenol Blue (2 ml), 50 % (w/v) sucrose solution
(2 ml), 3 M Tris-HCl (2.1 ml, pH 6.7) and 200 mM EDTA (0.5 ml, pH 7.0) were
added to a disposable 15 ml falcon tube and the volume was adjusted to 10 ml
with Milli-Q water (3.4 ml). The buffer was stored at -20 ℃ as 500 µl aliquots.

2. Materials and Methods 43
2.2.3 10 % w/v APS solution
APS (1 g) was added to Milli-Q water (10 ml) in a sterile 15 ml Falcon tube and
allowed to dissolve at room temperature. The solution was stored at -20 ℃ as 1
ml aliquots.
2.2.4 10 % w/v SDS solution
SDS (10 g) was added to Milli-Q water (100 ml) and dissolved at room tempera-
ture with constant stirring. The solution was stored at room temperature. Note:
as SDS is highly irritating to the eyes and respiratory tract it must be weighed
in a fume cabinet or appropriate PPE must be worn to prevent exposure to dust.
2.2.5 SDS-PAGE running buffer
10X SDS-PAGE running buffer was prepared by dissolving Tris-base (30.2 g/L),
SDS (10 g/L) and glycine (144 g/L) in Milli-Q water with constant stirring. The
pH of the buffer was adjusted to 8.9 if necessary. Prior to use the buffer was
diluted 10:1 for a final concentration of 25 mM Tris, 0.1 % (w/v) SDS and 192
mM glycine.
2.2.6 Iso-electric focusing (IEF) buffer
Urea (48 g), Triton X100 (1 ml), CHAPS (4 g), Tris-HCL (0.158 g) and Thiourea
(15.22 g) were added gradually to an initial volume 20 ml Milli-Q water with
constant stirring. After all solutes had dissolved the final volume was adjusted to
100 ml with Milli-Q water for a final concentration of 8 M Urea, 1 % (v/v) Triton
X100, 4 % (w/v) CHAPS, 10 mM Tris-HCL and 2 M Thiourea. It is necessary
to start with a small initial volume of water as the urea increases the volume of
the solution as it dissolves. The IEF buffer was stored at -20 ℃ in 2 ml aliquots.
2.2.7 IEF equilibration buffer
Glycerol (150 ml), SDS (10 g), Urea (180.18 g) and Tris-base (3.94 g) were added
to 350 ml Milli-Q water with constant stirring. The pH of the solution was

2. Materials and Methods 44
adjusted to pH 6.8 prior to adjusting the volume to 500 ml with Milli-Q water.
The buffer was stored at -20 ℃ as 40 ml aliquots.
2.2.8 Polyacrylamide gels
1-D Separating gel (12.5 %)
Sufficient separating gel to cast two 1-D gels was prepared by adding Protogel
(5 ml), 1.5 M Tris-Base (3 ml, pH 8.8), 10 % SDS (120 µl), 10% APS (75 µl)
and TEMED (3 µl) to Milli-Q water (3.8 ml). APS solution and TEMED were
added immediately before mixing and pouring the gel as they cause the mixture
to begin to set.
1-D Stacking gel (5 %)
Sufficient stacking gel to cast two 1-D gels was prepared by adding Protogel (830
µl), 0.5 M Tris-HCL (630 µl, pH 6.8), 10 % w/v SDS (50 µl, 10 % APS (50 µl)
and TEMED (5 µl) to Milli-Q water (3.4 ml). APS solution and TEMED were
added immediately before mixing and pouring the gel as they cause the mixture
to begin to set.
2-D Separating gel
To prepare 4 gels Protogel (100 ml), 1.5 M Tris (60 ml, pH 8.8), 10 % SDS (2.4
ml), 10 % APS (1.5 ml) and TEMED (60 µl) were added to Milli-Q water (76
ml). APS solution and TEMED must be added immediately before mixing and
pouring the gel.
2.2.9 Agarose sealing solution
Molecular biology grade Agarose (1 g) and bromophenol blue (∼0.01 g) were
added to 1X SDS-PAGE running buffer (100 ml) and heated in a microwave oven
until the agarose dissolved. The solution was prepared on the day of use and
allowed to cool to ∼50 ℃ before application.

2. Materials and Methods 45
2.2.10 Staining solutions
Coomassie stain
Brilliant blue (2 g) was added to Methanol (450 ml), acetic acid (100 ml) and
Milli-Q water (450 ml). The stain was stored at room temperature in a flammables
cabinet.
Coomassie destain buffer
Acetic acid (100 ml) and ethanol (200 ml) were added to Milli-Q water (700 ml).
The solution was stored at room temperature
Protein fixing solution
Ethanol (500 ml) and phosphoric acid (30 ml) were added to Milli-Q water (470
ml). The solution was stored at room temperature.
Pre-incubation buffer
Ethanol (340 ml), ammonium sulphate (170 g) and phosphoric acid (30 ml) were
added to Milli-Q water (630 ml). The solution was stored at room temperature
in a flammables cabinet.
2.3 Proteomic methods
2.3.1 Cellular protein extraction
Protein was extracted from Trichoderma mycelium grown in liquid culture for
7 days. The whole mycelial mass was filtered through a double layer of auto-
claved Miracloth and washed twice with sterile water to remove residual culture
medium. The mycelium was then press dried and flash frozen in liquid nitrogen.
To lyze cells mycelium (4 g fresh weight) was ground to a fine powder using an au-
toclaved mortar and pestle which had been cooled with liquid nitrogen. Protein
extraction buffer (4 ml) was added to the powder and allowed to freeze (addi-
tional liquid nitrogen was added at this point if the buffer did not freeze readily).
The mycelium was then ground further until the homogenisation buffer had fully
2. Materials and Methods 46
thawed. Using a wide-bore pipette tip the cell lysate was transferred to 1.5 ml
Eppendorf tubes in 1 ml aliquots and centrifuged at 1,000 rcf for 5 minutes at 4
℃. The supernatant containing the protein was transferred to a fresh Eppendorf
tube and the pellet discarded.
2.3.2 Protein quantification by Bradford assay
Protein extract (20 µl) prepared as per Section 2.3.1 was added to pre-diluted
(1/5) Biorad protein assay reagent to (980 µl) in a 1 ml plastic cuvette. Ab-
sorbance at 595 nm was measured using an Eppendorf Biophotometer and pro-
tein concentration was determined using standard curve of range of 100 µg/ml to
1,500 µg/ml calibrated using BSA standard (M.M., 1976).
2.3.3 Acetone precipitation of proteins
A volume of protein extract containing the desired quantity of protein was added
to 3 volumes of ice cold acetone and incubated at -20 ℃ for at least one hour.
The protein was pelleted by centrifugation at 16,000 rcf for 30 min at 4 ℃. The
supernatant was discarded and the pellet retained and dried.
2.3.4 2-Dimensional SDS-PAGE
Iso-electric focusing
Protein samples were acetone precipitated to give a pellet of 350 µg protein. The
protein was resuspended in IEF buffer (250 µl) amended with pH 4-7 ampholytes
(2 µl) and DeStreak reagent (1 µl). When fully dissolved the sample was trans-
ferred to a porcelain coffin at the negative end and an IPG strip (pH 4-7, 14
cm) was placed on top of it (gel side down) so that the sample became evenly
distributed across the length of the strip. Any air bubbles between the strip and
the base of the coffin were removed and IPG cover fluid was layered on top of the
strip. Iso-electric focusing was carried out according to the protocol in Table 2.2.

2. Materials and Methods 47
Tab. 2.2: Iso-electric focusing protocol for pH 4-7 IPG strips
Cycle Stage Step Type Voltage (V) Time (hr)
1 Step 50 10
2 Step 250 0.25
3 Gradient 8000 5
4 Step 8000 8
Immobiline Drystrip equilibration
After focusing, Immobiline Drystrips were carefully removed from coffins and
transferred to clean 20 ml test-tubes. Strips were incubated on a rocker at room
temperature in IEF equilibration buffer containing DTT (0.01 g/ml) for 20 min-
utes and IAA (0.0125 g/ml) for a further 20 minutes. Excess equilibration buffer
was removed by dipping the strips in 1X SDS-PAGE running buffer prior to the
second dimension of focusing.
Protein separation in the second dimension
Slab gels (12.5 %, 1.5 cm thickness) for 2-D electrophoresis were cast in bulk in
a Biorad Protean II multi-gel casting chamber to minimise gel to gel variation.
Focused and equilibrated IEF strips were laid on top of the gel and sealed with
agarose sealing solution. Gels were run in triplicate for 18 hr at a constant
wattage of 1.5 Watts per gel in a Biorad Protean Plus Dodeca-Cell system using
1X SDS-PAGE running buffer at 10 ℃.
Colloidal coomassie staining
Gels were carefully removed from between glass plates and incubated in fixing
solution (200 ml/ gel) in a sealed plastic container for a minimum of 3 hours
on an orbital shaker at 40 rpm at room temperature. Gels were washed 3 times
in Milli-Q water and transferred to pre-incubation buffer for 20 min under the
same conditions as above. Serva blue powder (0.5 g/100 ml) was added to the
pre-incubation buffer and the gels were left to stain for 7 days. After this period

2. Materials and Methods 48
the gels were transferred to a clean plastic container and destained by rinsing
with Milli-Q water until no colloidal Serva remained.
2.3.5 Image acquisition and analysis
Stained proteins were visualised on an Epson ImageScanner III (Epson (UK)
Ltd., Westside London Road, Hemel Hempstead, Hertfordshire, UK) and scanned
as transparencies at 16 bit, 600 dpi, greyscale. This method was determined
empirically to be the optimum on the basis of maximising bit depth and resolution
without introducing saturation or producing files of unmanageable size.
Images were analysed using Progenesis same spots software version 3.3 (Non-
linear Dynamics). All experimental gels were aligned to a reference gel and
spots were detected and filtered. Images were then separated into treatment
groups, with 3 replicate gels per group and spots were analysed to determine
significant changes between treatments by densitometry and one-way ANOVA
analysis. Spots with p value scores lower than 0.05 were taken to have changed
significantly in expression and were analysed by LC/MS.
2.4 Mass spectrometry
2.4.1 Reagents
All solutions used in these procedures made up in HPLC grade solvents and were
prepared on the day of use unless otherwise noted.
Ammonium bicarbonate solution (100 mM)
Ammonium bicarbonate (0.3953 g) was dissolved in water (50 ml).
Spot destain buffer
Ammonium bicarbonate solution (5 ml,100 mM) was added to HPLC grade water
(5 ml).
Formic acid solution (5 % v/v)
Formic acid (1 ml) was added to water (19 ml).

2. Materials and Methods 49
Peptide extraction buffer
Formic acid solution (3 ml, 5 % v/v) was added to acetonitrile (6 ml).
Peptide resuspension buffer
Formic acid solution (0.1 ml, 5 % v/v) was added to water (4.9 ml).
Trypsin reconstitution buffer
Acetonitrile (1 ml) was added to 10 mM ammonium bicarbonate (1 ml) and water
(8 ml).
Trypsin solution
Sequencing grade trypsin (Promega) was reconstituted in trypsin reconstitution
buffer (1 ml) and stored at -20 ℃. The final concentration of trypsin was 13
ng/µl.
LC-MS buffer A
Formic acid (1 ml) was added to water (1 L) and stored at room temperature.
LC-MS buffer B
Formic acid (1 ml) was added to acetonitrile (900 ml) and water (100 ml). The
solution was stored at room temperature.
2.4.2 Sample preparation for mass spectrometry
Individual protein spots were manually excised, transferred to sterile Eppendorf
tubes (1.5 ml) and destained with spot destain buffer (100 µl) by incubation at
room temperature for 30 minutes. Spot destain buffer was removed, acetonitrile
(500 µl) was added and the plugs were incubated at room temperature until
they had become dehydrated (up to 30 min). The acetonitrile was removed
and reconstituted trypsin (50 µl) was added to the plug followed by overnight
incubation at 37 ℃. Peptide extraction buffer (100 µl) was added and the samples
were incubated at 37 ℃ for 10 minutes. The supernatant was removed and

2. Materials and Methods 50
lyophilised in a vacuum centrifuge. Lyophilised peptides were stored at -20 ℃until the day of analysis. Peptide resuspension buffer (20 µl) was added and
samples were sonicated for 10 min. Resuspended peptides were passed through
a 0.22 µm filter and transferred to autosampler vials (Shevchenko et al., 2006).
2.4.3 LC-MS analysis of trypsin digested proteins
Trypsin digested peptides were separated on an Agilent 1200 series nanoflow
liquid chromatograph and analysed with an Agilent 6340 series ion trap mass
spectrometer. Capillary voltage was set to 1800 V with a constant capillary flow
rate of 2 µl/ min. The mobile phase consisted of water and 90 % acetonitrile both
containing 0.1 % v/v formic acid. Sample injection size was 5 µl. Compounds
were generated from the obtained spectra using Agilent software and exported
as Mascot generic (.mgf) files. Protein homologies were obtained by performing
Mascot MS/MS Ion Search (Matrix Science, London, UK) of the NCBInr and
SwissProt databases under the parameters listed in Table 2.3.
Tab. 2.3: Search parameters for Mascot searches
Enzyme Trypsin
Missed cleavages Up to two
Fixed modifications Carboxymethyl (C)
Variable modifications Oxidation (M)
Peptide tolerance 2 Da
MS/MS tolerance 1 Da
Peptide charge 1+, 2+ and 3+
Precursor m/z n/a
Instrument ESI-TRAP
2.5 Mushroom cropping experiments
Cropping experiments were performed at the Teagasc Kinsealy mushroom re-
search unit under standard mushroom growing conditions. Bulk Phase III and

2. Materials and Methods 51
pre-spawned Phase II mushroom substrate were purchased from Carbury Com-
post Ltd. (Kildare, Ireland) or Kaybeyun compost Ltd. (Monaghan, Ireland).
Mushroom substrate supplement (Nutrigain ®) was obtained from Carbury
Compost Ltd. The details of the methods are closely related to the experi-
mental design and so are described in a separate experimental section in Chapter
4 (Section 4.2).
2.5.1 Statistical analysis
Statistical analysis was carried out using GraphPad Prism 5. Data were checked
for normality using Lilliefor’s test prior to applying parametic analysis. Mush-
room yield data was analysed by 2 way ANOVA. Colony count and qPCR data
was tested using Pearson’s correlation test with 2 tailed P values and a confidence
interval of 95 %.
2.6 Molecular biology methods
Filtered pipette tips were used in all DNA e xtraction and manipulation pro-
cedures to prevent cross-contamination between samples. Set-up for PCR and
real-time PCR were carried out in a laminar flow hood. All procedures involving
ethidium bromide were carried out with extreme care on a designated ethidium
bromide workbench and all waste generated was disposed of in an ethidium bro-
mide waste bin.
2.6.1 DNA extraction methods
Manual DNA extraction by salt precipitation
DNA was extracted from Trichoderma aggressivum mycelium grown in liquid
culture (Section 2.1) according to the method of Aljanabi & Martinez (1997). In
brief: Trichoderma aggressivum mycelium was removed from liquid culture and
filtered through 2 layers of autoclaved Miracloth. The mycelial mass was washed
with sterile water and snap frozen in liquid nitrogen. Frozen mycelium (4 g)
was added to liquid nitrogen in a sterile mortar and ground into a fine powder.
Cell homogenisation buffer was added and the frozen mixture was ground until

2. Materials and Methods 52
it thawed. Aliquots (0.4 ml) were removed from the mortar, transferred to 1.5
ml Eppendorf tubes. Proteinase K (8 µl; 20 mg/ml) and 20% SDS (40 µl) were
added and tubes were incubated at 55 ℃ for 1 hr, if RNA contamination was
expected RNAse A (10 µl) was added at this point. Saturated sodium chloride
(300 µl) was added and samples were vortexed, then centrifuged at 10,000 rcf for
30 min. The supernatant was transferred to a fresh tube with an equal volume
of ice cold isopropanol and incubated at -20 ℃ for 1 hr. DNA was pelleted by
centrifugation at 10,000 rcf for 20 min (4 ℃), washed with 70 % ethanol (1 ml),
resuspended in nuclease free water (100 µl) and stored at -20 ℃.
Qiagen Plant Dneasy spin kit
DNA was extracted from Trichoderma mycelium grown in liquid culture (Section
2.1) according the manufacturer’s protocol. The whole mycelial mass was filtered
through 2 layers of autoclaved Miracloth, washed with sterile water and ground
in liquid nitrogen. A ∼200 mg subsample of ground mycelium was transferred
to 1.5 ml Eppendorf tube for DNA extraction. All buffers and reagents were
supplied with the kit, apart from molecular grade ethanol.
Sigma Plant genomic DNA extraction kit
DNA was extracted from Trichoderma mycelium grown in liquid or solid culture
(Section 2.1) according to the manufacturers protocol. For liquid cultures the
whole mycelial mass was filtered through 2 layers of autoclaved Miracloth, washed
with sterile water and ground in liquid nitrogen. For solid cultures mycelium was
removed from a 3 day culture of T. aggressivum with a sterile scalpel, trans-
ferred to a 2 ml Eppendorf tube and freeze thawed repeatedly in liquid nitrogen.
All buffers and reagents were supplied with the kit, apart from RNAse A and
molecular grade ethanol.
Promega Wizard Magnetic Food DNA extraction kit
DNA was extracted from Trichoderma mycelium grown in liquid culture (Section
2.1) or from liquid spore suspensions of T. aggressivum (106 spore/ ml) according
to the manufacturers protocol. Mycelium was ground in liquid nitrogen before

2. Materials and Methods 53
extraction, spore suspensions were added directly to lysis buffer. All buffers and
reagents were supplied with the kit, apart from molecular grade ethanol.
Chemagen Chemagic Food DNA extraction kit
DNA was extracted from Trichoderma aggressivum mycelium grown in liquid
culture (Section 2.1), from T. aggressivum spore suspensions (106 spore/ ml) and
from lyophilised Bulk Phase III mushroom substrate. The manufacturer’s proto-
col was followed in each case, except that brief vortexing was used for mixing in
place of repeated pipetting. Prior to extraction lyophilised mushroom substrate
was ground in liquid nitrogen and mixed with a T. aggressivum spore suspen-
sion (106 spore/ g substrate). Mycelium was ground in liquid nitrogen before
extraction, spore suspensions were added directly to lysis buffer. All buffers and
reagents were supplied with the kit, apart from molecular grade ethanol.
ZR Fungal/ Bacterial DNA extraction kit
DNA was extracted from Trichoderma aggressivum mycelium grown in liquid
culture (Section 2.1) according to the manufacturer’s protocol. All buffers and
reagents were supplied with the kit.
2.6.2 Cell homogenisation buffer
NaCl, Tris-base and EDTA were dissolved in nuclease free water to concentrations
of 1 M, 0.1 M and 0.1 M respectively in separate sterile 50 ml falcon tubes. Tris-
Base and EDTA solutions were both adjusted to pH 8. Cell homogenisation
buffer was prepared by adding 20 ml, 5 ml and 1 ml respectively of these stocks
to 24 ml nuclease free water. The final concentration of reagents in the solution
was 0.4 M NaCl, 10 mM Tris and 2 mM EDTA.
2.6.3 TAE buffer
A 50X solution of TAE was prepared by adding Tris-base (242 g), to acetic acid
(57 ml) and of 0.5 M EDTA (100 ml, pH 8.0) and filling to 1 L with Milli-Q water.
The solution was autoclaved and stored at room temperature. Prior to use 50X

2. Materials and Methods 54
TAE was diluted to 50:1 with Milli-Q water for a final working concentration of
40 mM Tris, 20 mM acetic acid and 1 mM EDTA.
2.6.4 Determination of DNA concentration by UV absorbance
DNA concentration was measured using a NanoDrop 1000 spectrophotometer.
Samples were kept on ice and 2 µl aliquots were removed, placed on the pedestal
of the spectrophotometer and absorbance was measured. Blank measurements
were performed using either nuclease free water or elution buffer in place of
sample, depending on the extraction protocol. The concentration of DNA in the
sample was calculated automatically by the NanoDrop software and samples with
an A 260/280 value of 1.8 were taken to contain pure DNA (A 260/280 is the
ratio of absorbance at 260 nm to 280 nm).
2.6.5 DNA gel electrophoresis and visualisation
Agarose (1.5 g) was added to 1X TAE (100 ml) and heated in a microwave oven
until the agarose dissolved. The solution was allowed to cool to a handleable
temperature before adding ethidium bromide solution (1 µl, 100 mg/ml) and
casting gels with 20 µl wells. Genomic DNA or PCR product were mixed with 6X
gel loading dye and 10-20 µl was loaded into the wells of the gel. Electrophoresis
was carried out in a using 1X TAE buffer at 60 V for 10 minutes followed by 80 V
for 20 minutes. The DNA was visualised and images were captured on a G-box
using UV transillumination and an ethidium bromide lens filter.
2.6.6 Endpoint PCR using Sigma Accutaq
Reactions were carried out in 200 µl PCR tube (nuclease and nucleic acid free)
with a reaction volume of 20 µl containing 10X LAB Buffer (2 µl), 10 mM dNTP
mix (1 µl), DMSO (0.4 µl), 20 µM forward primer (0.5 µl), 20 µM reverse primer
(0.5 µl), nuclease free water (14.4 µl), template DNA (1 µl) and Sigma Accutaq
DNA polymerase (0.2 µl). An Eppendorf Mastercycler was used for temperature
control under the parameters listed in Table 2.4 with a lid temperature of 96 ℃.

2. Materials and Methods 55
Tab. 2.4: PCR amplification protocol using Sigma AccuTaq
Step Temperature (℃) Time (min:sec) Cycles
Initial separation 94 5:00 1
Amplification 94 0:30
55-60 0:30
68 0:45 35
Final amplification 68 7:00 1
Cooling 4 ℃ Indefinite 1
2.6.7 Endpoint PCR using Bioline 2X Mastermix
Reactions were carried out in a 20 µl volume containing Bioline 2X mastermix (10
µl), template DNA (4 µl), 20 µM forward primer (0.5 µl), 20 µM reverse primer
(0.5 µl) and nuclease free water (5 µl). Bioline 2X master mix contains gel loading
dye so the product can be run on a gel immediately after the completion of the
reaction. An Eppendorf Mastercycler was used for temperature control under the
parameters listed in Table 2.5 with a lid temperature of 105 ℃.
Tab. 2.5: PCR amplification protocol using Bioline Mastermix
Step Temperature (℃) Time (min:sec) Cycles
Initial separation 94 0:30 1
Amplification 94 0:30
55-60 0:30
72 0:30 30
Cooling 4 Indefinite 1
2.6.8 Quantitative real-time PCR (qPCR)
Real-time quantitative PCR was carried out on a Lightcycler 480 machine (Roche)
using SyBr green as the fluorophore. Reactions consisted of template DNA (1
µl), Bioline SyBr Green 2X Mastermix (5 µl), forward primer (0.25 µl), reverse

2. Materials and Methods 56
primer (0.25 µl) and nuclease free water (3.5 µl) and were carried out in opaque,
white 96 well plates (Roche). PCR was carried out for 35 cycles according to
Table 2.6. Quantitation was performed once per cycle and melt curve analysis
was performed at the end of the run. Standard curves, efficiency and melt curves
were generated using the Roche Lightcycler software version 1.5.0 SP3.
Quantitative PCR instrumentation was funded by Science Foundation Ireland
Grant no.: SFI/07/RFP/GEN/571/EC07.
Tab. 2.6: Real-time PCR cycling parameters
Step Temperature Time Ramp rate Cycles Quantitation
(℃) (min:sec)
Activation 94 10:00 4.4 1 None
Amplification 94 00:20 4.4 45 None
55-60 00:15 2.2 None
72 00:15 4.4 Single
Melt Curve 95 00:05 4.4 1 None
70 1:00 2.2 None
95 n/a 0.11 5/℃Cooling 40 5:00 2.2 1 None
2.6.9 Primers
Details of primers used for real-time PCR are shown in Table 2.7. Primers were
purchased from Integrated DNA technologies (Belgium). Existing Trichoderma
aggressivum selective primers were designed by Chen et al. (1999a) (THF+THR)
and Warwick HRI (18SInt+THI Int rev). Novel selective primer sets (41+180,
43+199 and 44+199) were designed as described in Section 5.3.

2. Materials and Methods 57
Tab. 2.7: Primers used in this study
Name Primer sequence Orientation Tm (℃)
THF1 CGGTGACATCTGAAAAGTCGTG Forward 56.1
THR1 TGTCACCCGTTCGGATCATTCG Reverse 59.4
18S Int2 TAACAACACGCCTGCTTAAGA Forward 54.4
ThI Int rev2 GAGAAGGCTCAGATAGTAAAAAT Reverse 50.2
413 TTCGAGAAGGTAAGCGCCAACTGA Forward 60.1
1803 AATCTTGTGTCGCTGCAAAGGAGG Reverse 59.6
433 AGAAGGTAAGCGCCAACTGA Forward 56.5
1993 GCACAAGGAACCCCACTAAA Reverse 55.3
443 GAGAAGGTAAGCGCCAACTG Forward 56.01 Trichoderma aggressivum selective primers published by Chen et al. (1999a)2 T. aggressivum f. europaeum selective primers developed by Warwick HRI
(Grogan, pers. comm. )3 Novel selective primers designed targeting the tef1 gene
2.7 HPLC
All reagents used were of HPLC grade unless otherwise noted.
2.7.1 HPLC extraction buffer
Ethyl acetate, dichloromethane and methanol were mixed in a 3:2:1 ratio. This
buffer was stored at room temperature in a flammables cabinet. Formic acid was
added to a concentration of 1 % (v/v) immediately prior to use.
2.7.2 HPLC Buffer A
Trifluoroacetic acid (1 ml) was added to water (1 L) in a dark glass container.
The solution was prepared on the day of use and stored at room temperature
2.7.3 HPLC Buffer B
Trifluoroacetic acid (1 ml) was added to acetonitrile (1 L) in a dark glass con-
tainer. The solution was prepared on the day of use and stored at room temper-

2. Materials and Methods 58
ature
2.7.4 Organic extraction of fungal metabolites for analysis by HPLC
For the extraction of fungal secondary metabolites Trichoderma cultures were
grown on MEA or Trichoderma minimal medium at 20 ℃ for 16 days in the
dark. Plugs (5 mm diameter) were then excised from the media at 2.5 mm, 22.5
mm and 42.5 mm from the centre of the dish and transferred to a sterile 1.5
ml Eppendorf tube. HPLC extraction buffer (500 µl) was added to each sample
followed by sonication for three 20 minute cycles. The water in the sonication
bath being replaced between cycles to prevent excessive heating. The buffer was
then removed and transferred to a fresh tube. Plugs were discarded and the buffer
containing the extracted metabolites was evaporated overnight in a fume cabinet.
The extract was redissolved by sonication for 10 minutes in 90 % methanol, 10
% water (20 µl) and transferred to an autosampler vial for reverse phase HPLC
analysis (Smedsgaard, 1997).
2.7.5 Reverse phase HPLC analysis of fungal metabolites
Organic extracts from Trichoderma cultures were analysed by reverse phase
HPLC (RP-HPLC) on an Agilent 1200 series system with a C-18 RP-HPLC
column using diode array detection with multiple wavelengths (210, 230, 254 and
280 nm). Prior to use any gas in the machine was purged by opening the column
bypass valve and running 95 % HPLC Buffer A, 5 % HPLC Buffer B through
the system at a rate of 5 ml/ min for 5 minutes. The flow rate was reduced to
1 ml/min prior to closing the bypass valve. Blank samples were run through the
column prior to loading sample to ensure that any previous samples had been
fully eluted. Two HPLC methods were used in this study and a wash step was
performed at the end of each run to ensure that there was no crossover of samples
between experiments. For all methods column flow rate was constant at 1 ml/min
and maximum and minimum pressure tolerances of 400 and 0 bar respectively,
standard automated sample injection was performed with a sample size of 10 µl.
Table 2.8 and Figure 2.3 show the gradients for each of the methods and the wash
step.
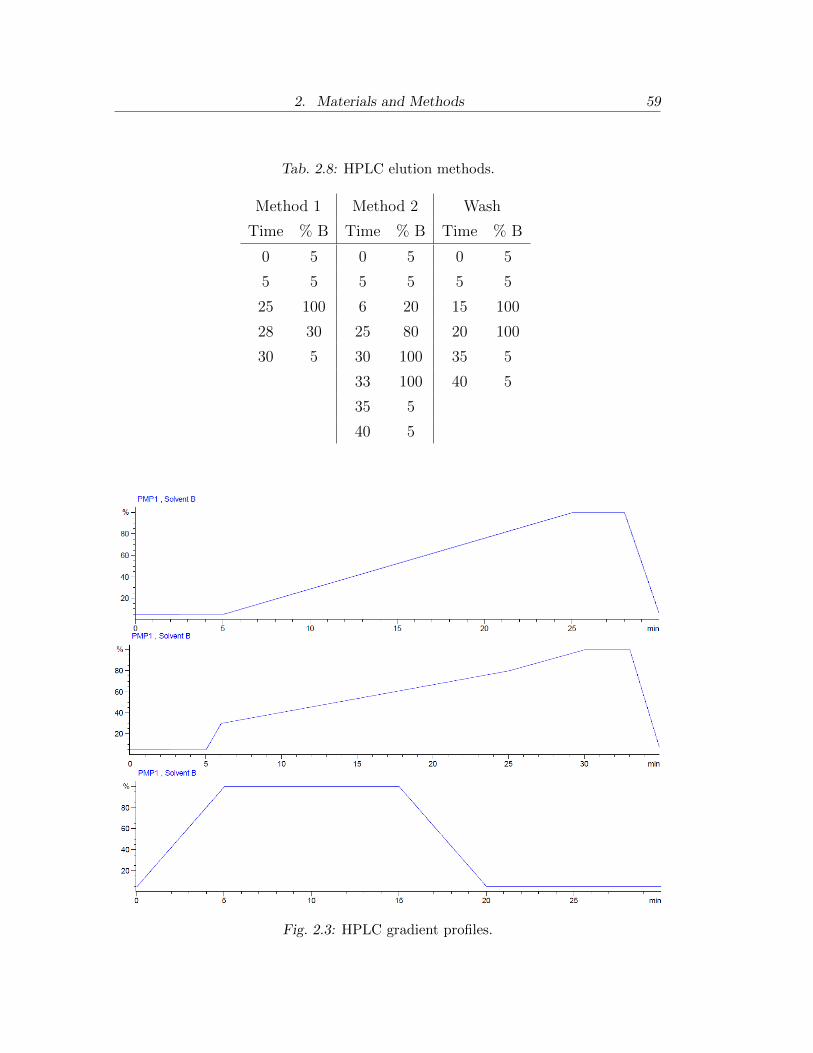
2. Materials and Methods 59
Tab. 2.8: HPLC elution methods.
Method 1 Method 2 Wash
Time % B Time % B Time % B
0 5 0 5 0 5
5 5 5 5 5 5
25 100 6 20 15 100
28 30 25 80 20 100
30 5 30 100 35 5
33 100 40 5
35 5
40 5
Fig. 2.3: HPLC gradient profiles.

2. Materials and Methods 60
2.7.6 Comparison of metabolite profiles
Metabolite profiles of Trichoderma isolate obtained by HPLC were analysed with
COWtool (Nielsen et al., 1998). Full unintegrated results for each detector were
exported from Agilent Chemstation as .CSV files. For each sample signals from
each detector were collated into columns using Microsoft Excel, then transferred
to Notepad++. Tabs between signals for each datapoint were replaced with
spaces and the spectra were saved as ASCII plain text files. Spectra were opened
in COWtool, baseline corrected, log normalised and compared by co-phenetic
correlation using the similarity function of COWtool. Reference spectra were
prepared from base-line corrected, log normalised spectra using the averaging
function of COWtool.

3. CELLULAR PROTEOMICS OF TRICHODERMA
AGGRESSIVUM
3.1 Introduction
Green mould disease of Agaricus bisporus is caused by fungi of the genus Tri-
choderma growing in the mushroom substrate and later casing. Green mould
disease caused by Trichoderma aggressivum causes severe loss of yield whereas
other Trichoderma species are less harmful.
T. aggressivum was previously classified as a Trichoderma harzianum biotype
(Samuels et al., 2002). T. harzianum is commonly isolated from soil and leaf
litter and occasionally occurs in mushroom substrate. T. aggressivum has only
been reported on mushroom farms, and it has several adaptations which allow
it to grow uninhibited in mushroom substrate (Largeteau et al., 2000b; Savoie
et al., 2001a)
The activities of T. aggressivum in mushroom substrate are poorly under-
stood. It produces metabolites which inhibit the growth of A. bisporus (Mumpuni
et al., 1998; Krupke et al., 2003; Guthrie & Castle, 2006) and it is able to overgrow
A. bisporus mycelium (Savoie et al., 2001b) but metabolites produced by other
Trichoderma are more toxic to A. bisporus and T. aggressivum is able to grow in
mushroom substrate in the absence of A. bisporus (Largeteau et al., 2000b). The
ability to better colonise mushroom substrate is considered to be a key difference
between T. aggressivum and other, less harful Trichoderma species, but it also
produces enzymes capable of degrading A. bisporus cell walls (Williams et al.,
2003a; Guthrie & Castle, 2006).
Whether T. aggressivum primarily reduces mushroom yields by mycopara-
sitism of A. bisporus or by competing for nutrients in the substrate is unknown,
but as Trichoderma species are known for opportunistically antagonising and par-

3. Cellular proteomics of Trichoderma aggressivum 62
asitising competitors the true relationship is likely a mixture of the two (Kredics
et al., 2010; Druzhinina et al., 2011).
Comparative proteomics is a powerful tool used to study disease (Pasini et al.,
2010) and host-pathogen interactions (Reales-Calderon et al., 2012) as well as
symbiotic and commensal interactions between organisms (Marra et al., 2006;
Mathesius, 2009) and the action of antibiotics and fungicides in vitro (Wenzel &
Bandow, 2011; Seneviratne et al., 2010). In a comparative proteomic study the
organism of interest is exposed to different conditions and changes in its protein
expression profile are measured, commonly by 2-dimensional gel electrophoresis.
Knowing what proteins are increased or decreased in expression under different
conditions gives insight into the response of the organism to those conditions.
In this study T.aggressivum was exposed to mushroom substrate and A. bis-
porus tissue. Whole cell protein was then extracted, separated and visualised by
2-D SDS-PAGE. Individual proteins were isolated from the gels and tryptic digest
of these proteins were analysed by mass spectrometry. This allows the identifica-
tion of homologous proteins from other fungi from which a an be inferred without
requiring sequence data from T. aggressivum.
In addition, using densitometric analysis it is possible to determine the relative
expression level of proteins in each condition. If a protein is up-regulated or down-
regulated when the fungus is grown in the presence of mushroom substrate or
A. bisporus tissue it can be inferred that the protein in question may play a role
in the survival of T. aggressivum in mushroom substrate and/or its capacity for
reducing mushroom yields.
Better understanding of how T. aggressivum operates in mushroom substrate
may lead to better treatments or preventative methods for green mould disease.
Knowing how T. aggressivum resists inhibition by substrate micro-flora and A.
bisporus may allow for the production of substrate which is selective against T.
aggressivum growth and understanding the mechanisms by which T. aggressivum
antagonises A. bisporus may aid in the breeding of strains more resistant to green
mould disease.

3. Cellular proteomics of Trichoderma aggressivum 63
3.2 2-D electrophoretic profile of Trichoderma aggressivum across
a pH 4-7 range
Whole cellular protein was obtained from 5 day liquid cultures of two reference
isolates of Trichoderma aggressivum f. europaeum, CBS 433.95 and CBS 100526
(Sections 2.1.5, 2.3.1). Iso-electric focusing was performed across a pH range
of 4-7, proteins were separated by mass using 2-D SDS-PAGE (12.5 % gel) and
visualised with colloidal coomassie staining (Section 2.3.4). Figure 3.1 and Fig-
ure 3.2 show the electrophoretic profile of strain CBS 433.95 and CBS 100526
respectively.
3.3 Identification of protein homologs in Trichoderma
aggressivum strain CBS 433.95 by LC/MS analysis of tryptic
digests
Trichoderma aggressivum strain CBS 433.95 was grown in liquid culture for 5
days and protein was extracted, focused, separated and stained as described
previously (Section 2.1.5, 2.3.1, 2.3.4). Figure 3.3 shows each protein spot which
was excised, digested and analysed by LC/MS (Section 2.4). Spots were selected
for analysis based on good separation, definition and intensity.
Table 3.1 shows results of Mascot searches using the compounds generated
from the mass spectra of each protein (Section 2.4), searches were performed
against all genera of fungi in the NCBInr database.
Table 3.2 shows the Uniprot accession number (www.uniprot.org/uniprot) for
each homologous protein as well as the Mascot score, coverage, pI (pIhom)and
molecular weight. Mascot scores greater than 57 indicate significant homology.
The pI of the T. aggressivum proteins (pInat) can be estimated from the gel and
are also included for reference.
Of the 41 spots which were processed 37 returned positive hits from the
database searches of which 32 have known or inferred functions. The largest
portion of the matches were proteins from Trichoderma species (8/38 results)
with the rest being from various different fungi, Fusarium solani being the most
commonly occurring (5/38 matches).
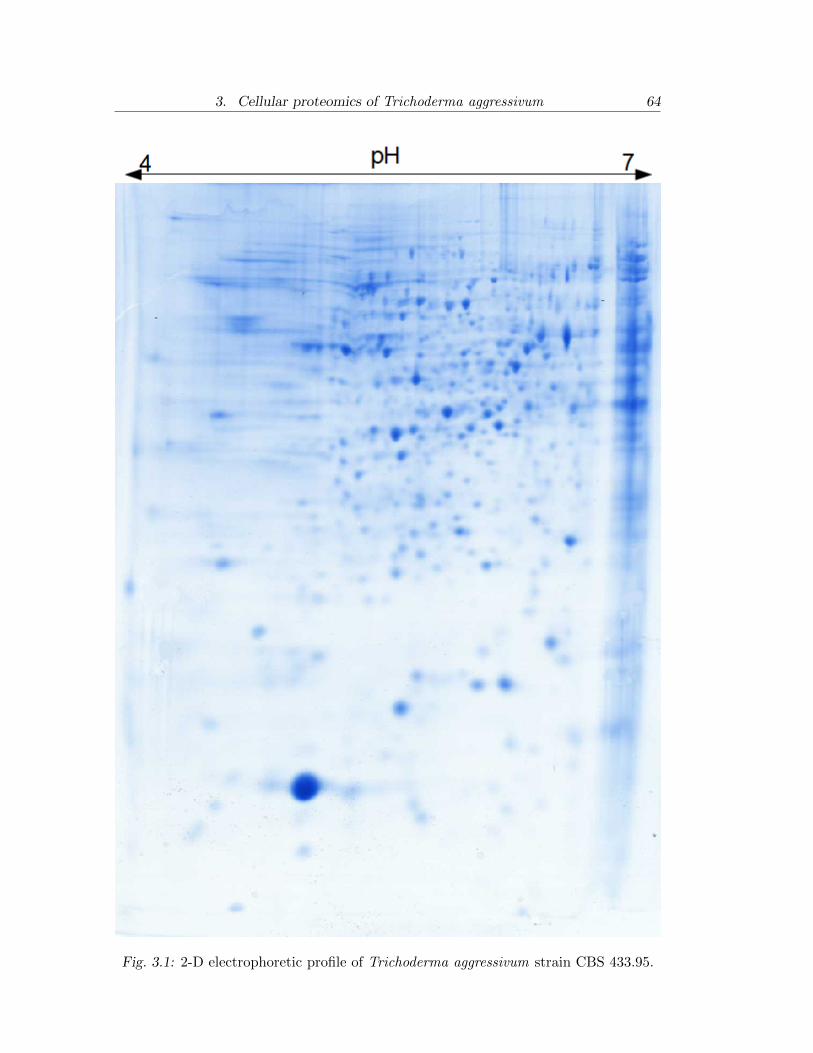
3. Cellular proteomics of Trichoderma aggressivum 64
Fig. 3.1: 2-D electrophoretic profile of Trichoderma aggressivum strain CBS 433.95.
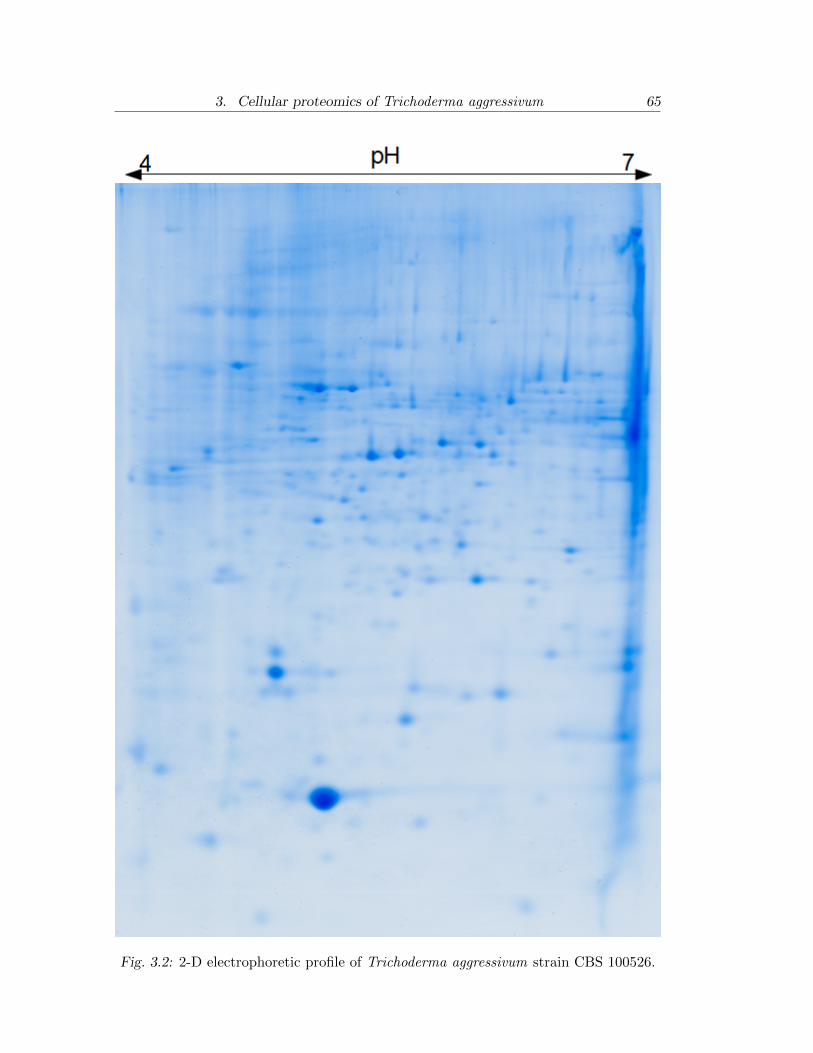
3. Cellular proteomics of Trichoderma aggressivum 65
Fig. 3.2: 2-D electrophoretic profile of Trichoderma aggressivum strain CBS 100526.

3. Cellular proteomics of Trichoderma aggressivum 66
Mascot scores ranged from 58-876 and % coverage ranged from 2-71%. The
best matches in terms of Mascot score were for ATP dependent RNA helicase
eIF4A from Botryotinia fuckeliana, Hsp70-like protein from Glomerella gramini-
cola and 14-3-3 like protein from Metarhizium anisopliae (Mascot scores 876, 720
and 621, respectively). Three out of four of the highest coverage matches returned
were proteins from Trichoderma harzianum; protein Hex 1 returned 2 hits with
coverages of 52 and 50 % while Copper-Zinc Superoxide dismutase matched to
spot 40 with 71% coverage.
The inferred function of the analysed proteins based on the known functions
of their homologs covers a broad range of cellular activities. They can be broken
down into 7 areas: cell metabolism (8/32), protein processing (7/32), translation
(4/32), homeostasis (2/32), oxidation-reduction (2/32), stress response (2/32)
and other (7/32).
The pI of the matched proteins were generally close to that measured from the
gel for high Mascot score and/or % coverage matches. Matches with low Mascot
scores and coverages, on the other hand, diverged widely from their expected
pI, including 4 which fell outside of the isoelectric range used (spots 13, 19, 31,
38). Since these analyses were performed using tryptic digests rather than whole
proteins it is possible to match one or more small sequences from a larger protein
which may have different characteristics from the one which was digested. While
it is possible that homologous proteins from 2 different species can have somewhat
different pI and retain the same function if the differences occur outside the active
site, it seems unlikely that a protein with a pI outside the 4-7 range could be a
true homolog of those analysed in this study.

3. Cellular proteomics of Trichoderma aggressivum 67
Fig. 3.3: Protein spots analysed by LC/MS from Trichoderma aggressivum strain CBS
433.95.

3. Cellular proteomics of Trichoderma aggressivum 68
Tab
.3.
1:P
rote
ins
dis
pla
yin
gh
omol
ogy
wit
hL
C/M
San
alyse
dT.aggressivum
stra
inC
BS
433.
95p
rote
ins.
Sp
otH
omol
ognam
eSou
rce
Funct
ion
1H
sp70
-lik
epro
tein
Glo
mer
ella
gram
inic
ola
Hsp
70like
pro
tein
2P
rote
indis
ulfi
de
isom
eras
eT
rich
oder
ma
rees
eiR
edox
hom
eost
asis
3N
one
found
-U
nknow
n
4E
nol
ase
Bot
ryot
inia
fuck
elia
na
Gly
coly
sis
5A
TP
synth
ase
subunit
bet
aA
sper
gill
us
nid
ula
ns
AT
Psy
nth
esis
6A
TP
-dep
enden
tR
NA
hel
icas
eeI
F4A
Bot
ryot
inia
fuck
elia
na
Tra
nsl
atio
nin
itia
tion
fact
or
740
Sri
bos
omal
pro
tein
S0
Pod
ospo
raan
seri
na
40S
rib
osom
alsu
bunit
814
-3-3
-lik
epro
tein
Tri
chod
erm
are
esei
Pro
tein
secr
etio
n
9T
H14
-3-3
Met
arhi
ziu
man
isop
liae
Pro
tein
secr
etio
n
10Ser
ine/
thre
onin
e-pro
tein
phos
phat
ase
PP
1N
euro
spor
acr
assa
Pro
tein
dep
hos
phor
yla
tion
11Sim
ilar
tob
eta
subunit
ofT
EF
EF
1BP
odos
pora
anse
rin
aE
longa
tion
fact
or
12P
redic
ted
pro
tein
Can
dida
trop
ical
isU
nknow
n
13P
uta
tive
unch
arac
teri
zed
pro
tein
Asp
ergi
llu
sfu
mig
atu
sU
nknow
n
14T
ransa
ldol
ase
Fu
sari
um
sola
ni
Car
boh
ydra
tedeg
radat
ion
15G
TP
-bin
din
gpro
tein
ypt3
Ver
tici
lliu
mal
bo-a
tru
mP
rote
inbin
din
g
16P
uta
tive
unch
arac
teri
zed
pro
tein
Scl
erot
inia
scle
roti
oru
mU
nknow
n
17Y
AL
I0B
0700
7pC
andi
dali
poly
tica
Oxid
ored
uct
ase
regu
lato
r
18Subti
lisi
n-l
ike
pro
tein
ase
Spm
1M
agn
apor
the
oryz
aeP
rote
olysi
s

3. Cellular proteomics of Trichoderma aggressivum 69
Tab.
3.1:
Con
tinu
ed
Sp
otH
omol
ognam
eSou
rce
Funct
ion
19Jen
2K
luyv
erom
yces
lact
isT
ransm
embra
ne
tran
spor
t
20N
one
found
--
21P
redic
ted
pro
tein
Fu
sari
um
sola
ni
Car
box
y-l
yase
22R
abG
DP
-dis
soci
atio
nin
hib
itor
Neu
rosp
ora
cras
saP
rote
intr
ansp
ort
23P
redic
ted
pro
tein
Fu
sari
um
sola
ni
Oxid
ored
uct
ase
24A
TP
synth
ase
subunit
bet
aA
sper
gill
us
nid
ula
ns
AT
Psy
nth
ase
256-
phos
phog
luco
nat
edeh
ydro
genas
e,dec
arb
oxyla
ting
Fu
sari
um
sola
ni
Car
boh
ydra
tedeg
radat
ion
26P
hos
phog
lyce
rate
kin
ase
Tri
chod
erm
avi
ride
Car
boh
ydra
tedeg
radat
ion
27P
c21g
1868
0pro
tein
Pen
icil
liu
mn
otat
um
Unknow
n
28SW
IRM
dom
ain-c
onta
inin
gpro
tein
Glo
mer
ella
gram
inic
ola
DN
Abin
din
g
29A
ctin
Art
hrod
erm
agy
pseu
mA
ctin
30G
ST
UM
0000
1447
001
Tu
ber
mel
anos
poru
mG
lyco
lysi
s
31P
uta
tive
acet
ohydro
xy-a
cid
isom
eror
educt
ase
Gib
erel
liu
mfu
jiku
roi
Am
ino-
acid
synth
esis
32E
pl1
pro
tein
Tri
chod
erm
avi
ride
Pla
nt
imm
unos
tim
ula
nt
33N
one
found
-U
nknow
n
34L
-xylu
lose
reduct
ase
Tri
chod
erm
are
esei
Xylo
se/
arab
inos
em
etab
olis
m
35P
redic
ted
pro
tein
Fu
sari
um
sola
ni
Red
oxhom
eost
asis
36H
ex1
Tri
chod
erm
aha
rzia
nu
mE
longa
tion
fact
or

3. Cellular proteomics of Trichoderma aggressivum 70
Tab.
3.1:
Con
tinu
ed
Sp
otH
omol
ognam
eSou
rce
Funct
ion
37P
uta
tive
unch
arac
teri
zed
pro
tein
Ver
tici
lliu
mal
bo-a
tru
mU
nknow
n
38H
ex1
Tri
chod
erm
aha
rzia
nu
mE
longa
tion
fact
or
39Sup
erox
ide
dis
muta
se[C
u-Z
n]
Tri
chod
erm
aha
rzia
nu
mSup
erox
ide
dis
muta
se(C
u-Z
n)
40E
pl1
pro
tein
Tri
chod
erm
avi
ride
Pla
nt
imm
unos
tim
ula
nt
41N
one
found
-U
nknow
n

3. Cellular proteomics of Trichoderma aggressivum 71
Tab. 3.2: Accession number, Mascot score and additional information for proteins anal-
ysed from Trichoderma aggressivum strain CBS 433.95.
Spot Accession Mascot score Coverage MW (kDa) pIhom pInat
1 E3QX97 740 23% 72.671 4.95 4.82
2 O74568 239 12% 54.669 4.83 4.65
3 None found - - - 5.00
4 A6RIS9 338 12% 47.168 5.26 5.20
5 Q5BAW5 143 6% 54.852 5.17 4.80
6 A6RJ45 876 53% 44.875 5.13 5.00
7 B2B1Z3 183 22% 31.439 4.81 5.00
8 Q9HEM9 449 37% 3.0432 4.89 4.95
9 Q27JQ9 621 47% 29.865 4.85 4.80
10 Q9UW86 72 5% 35.568 5.29 5.00
11 Q875E8 89 4% 26.102 4.37 4.20
12 C5M3J4 61 2% 69.790 4.7 5.35
13 Q4WC61 59 13% 9.288 9.97 4.65
14 C7YMG7 202 12% 35.468 5.04 5.50
15 C9SGP9 306 30% 23.251 5.46 5.60
16 A7ECN3 164 25% 18.621 4.84 4.80
17 Q6CFH1 67 12% 21.818 5.94 5.55
18 P58371 67 2% 57.170 6.44 4.55
19 Q6RFG1 82 2% 59.997 8.89 5.45
20 None found - - - - 5.45
21 C7YP39 185 9% 63.140 5.01 5.55
22 Q7S909 446 24% 51.403 5.31 5.40
23 C7YI26 391 16% 53.799 5.55 6.25
24 Q5BAW5 65 3% 54.852 5.17 6.40
25 C7YKL6 573 21% 57.753 5.99 6.20
26 P24590 210 12% 44.381 6.16 6.15
27 B6HI68 95 8% 45.645 5.55 5.80
28 E3Q9L4 58 3% 75.456 4.85 5.60

3. Cellular proteomics of Trichoderma aggressivum 72
Tab.: 3.2: Continued
Spot Accession Mascot score Coverage MW (kDa) pIhom pInat
29 E4UZI4 383 26% 41.661 5.45 5.80
30 D5G5R4 283 14% 46.827 5.97 5.75
31 C1L3C1 277 15% 44.883 8.21 5.50
32 A0PCX8 71 12% 14.356 6.23 6.55
33 None found - - - - 6.55
34 Q8NK50 157 20% 28.478 5.76 6.40
35 C7ZD60 103 8% 25.220 5.87 5.55
36 E0YRV9 429 52% 24.334 6.75 5.30
37 C9SFN3 65 11% 16.214 9.24 4.90
38 E0YRV9 475 50% 24.334 6.75 5.20
39 A8BA83 321 71% 15.767 5.58 5.60
40 A0PCX8 81 12% 14.356 6.23 5.80
41 None found - - - - 5.00
3.4 Identification of protein homologs in Trichoderma
aggressivum strain CBS 100526 by LC/MS analysis of tryptic
digests
Two dimensional SDS-PAGE followed by LC/MS analysis of protein spots was
performed for Trichoderma aggressivum strain CBS 100526 as described previ-
ously (Section 2.1.5, 2.3.1, 2.3.4, 2.4).
Figure 3.4 shows the 49 individual protein were excised for LC/MS analysis
(Section 2.4). Spot selection criteria were the same as in Section 3.3. Table 3.3
shows results of Mascot searches using the compounds generated from the mass
spectra of each protein (Section 2.4.3). Table 3.4 shows the accession number for
each homologous protein as well as the Mascot score, coverage, pI (pIhom) and
molecular weight (MW) of the homologous proteins and the estimated pI (pinat)
of the T.aggressivum protein measured from the gel.
Of the 49 spots analysed in this section 44 returned matches from the NCBInr
database, 33 of those were matched with significant homology (Mascot score >57)
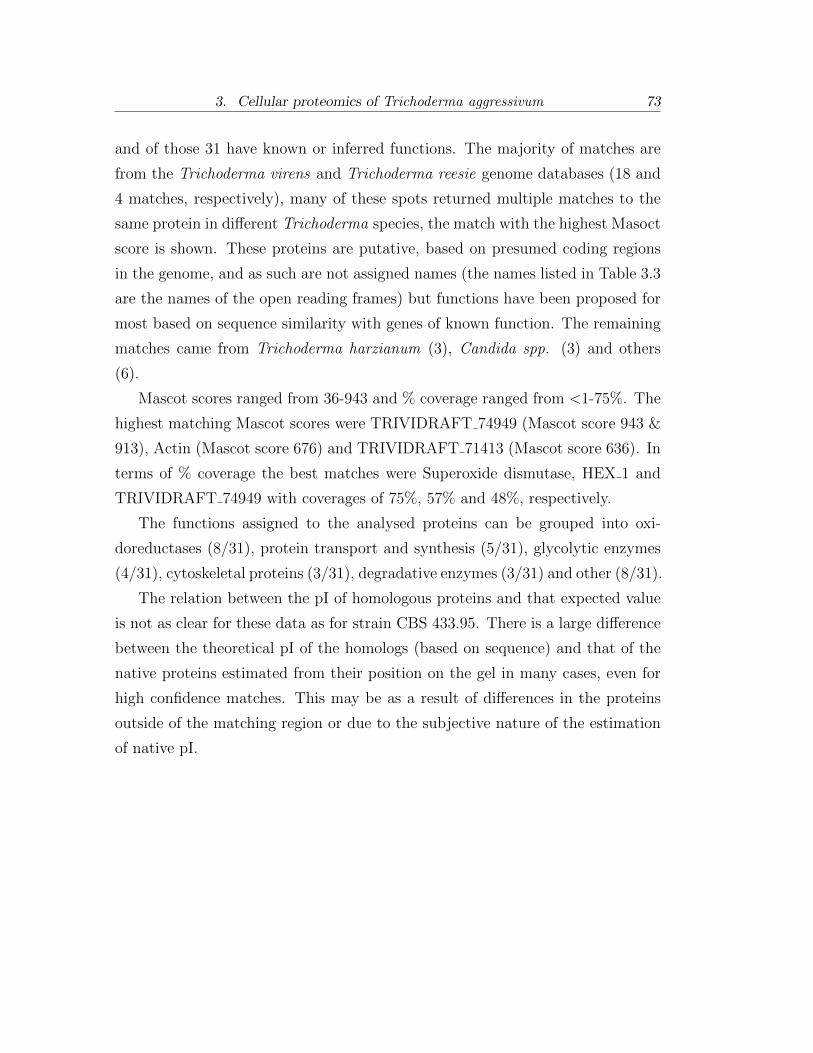
3. Cellular proteomics of Trichoderma aggressivum 73
and of those 31 have known or inferred functions. The majority of matches are
from the Trichoderma virens and Trichoderma reesie genome databases (18 and
4 matches, respectively), many of these spots returned multiple matches to the
same protein in different Trichoderma species, the match with the highest Masoct
score is shown. These proteins are putative, based on presumed coding regions
in the genome, and as such are not assigned names (the names listed in Table 3.3
are the names of the open reading frames) but functions have been proposed for
most based on sequence similarity with genes of known function. The remaining
matches came from Trichoderma harzianum (3), Candida spp. (3) and others
(6).
Mascot scores ranged from 36-943 and % coverage ranged from <1-75%. The
highest matching Mascot scores were TRIVIDRAFT 74949 (Mascot score 943 &
913), Actin (Mascot score 676) and TRIVIDRAFT 71413 (Mascot score 636). In
terms of % coverage the best matches were Superoxide dismutase, HEX 1 and
TRIVIDRAFT 74949 with coverages of 75%, 57% and 48%, respectively.
The functions assigned to the analysed proteins can be grouped into oxi-
doreductases (8/31), protein transport and synthesis (5/31), glycolytic enzymes
(4/31), cytoskeletal proteins (3/31), degradative enzymes (3/31) and other (8/31).
The relation between the pI of homologous proteins and that expected value
is not as clear for these data as for strain CBS 433.95. There is a large difference
between the theoretical pI of the homologs (based on sequence) and that of the
native proteins estimated from their position on the gel in many cases, even for
high confidence matches. This may be as a result of differences in the proteins
outside of the matching region or due to the subjective nature of the estimation
of native pI.

3. Cellular proteomics of Trichoderma aggressivum 74
Fig. 3.4: Protein spots analysed by LC/MS from Trichoderma aggressivum strain CBS
100526.

3. Cellular proteomics of Trichoderma aggressivum 75
Tab
.3.
3:P
rote
ins
dis
pla
yin
gh
omol
ogy
wit
hL
C/M
San
alyse
dTrichodermaaggressivum
stra
inC
BS
1005
26
pro
tein
s.
Sp
otH
omol
ognam
eSou
rce
Funct
ion
1C
hro
modom
ain
hel
icas
ehrp
3S
chiz
osac
char
omyc
espo
mbe
Chro
mat
inre
model
ing
2T
RIV
IDR
AF
T74
949
Tri
chod
erm
avi
ren
sA
ldeh
yde
deh
ydro
genas
e
3L
yso
phos
phol
ipas
eN
TE
1S
cheff
erso
myc
esst
ipit
isL
ipid
hom
eost
asis
4T
RIV
IDR
AF
T71
413
Tri
chod
erm
avi
ren
sP
rote
intr
ansp
ort
5T
RIV
IDR
AF
T71
413
Tri
chod
erm
avi
ren
sP
rote
intr
ansp
ort
6A
ldeh
yde
deh
ydro
genas
eM
etar
hizi
um
acri
dum
Oxid
ored
uct
ase
7A
ctin
Cle
isto
gen
esso
ngo
rica
Cyto
skel
eton
8T
RIV
IDR
AF
T21
6692
Tri
chod
erm
avi
ren
sP
rote
inbio
synth
esis
9P
redic
ted
pro
tein
Tri
chod
erm
are
esei
Acy
ltra
nsf
eras
e
10N
one
found
--
11N
one
found
--
12P
yru
vate
deh
ydro
genas
ee1
subunit
Gro
sman
nia
clav
iger
aP
yru
vate
deh
ydro
genat
ion
13T
RIV
IDR
AF
T23
0681
Tri
chod
erm
avi
ren
sU
nknow
n
14N
one
found
--
15H
sp90
co-c
hap
eron
eA
HA
1S
acch
arom
yces
cere
visi
aeStr
ess
resp
onse
16T
RIV
IDR
AF
T74
949
Tri
chod
erm
avi
ren
sA
ldeh
yde
deh
ydro
genas
e
17N
one
found
--
18C
AG
L0H
0331
1gC
andi
dagl
abra
taU
nknow
n

3. Cellular proteomics of Trichoderma aggressivum 76
Tab.
:3.
3:C
onti
nu
ed
Sp
otH
omol
ognam
eSou
rce
Funct
ion
19A
TP
-dep
enden
tR
NA
hel
icas
eD
ED
1C
andi
daal
bica
ns
RN
Atr
ansl
atio
n
20P
rote
asom
esu
bunit
alpha
typ
eT
rich
oder
ma
vire
ns
Pro
tein
cata
bol
ism
21T
RIV
IDR
AF
T71
356
Tri
chod
erm
avi
ren
sO
xid
ored
uct
ase
22P
uta
tive
unch
arac
teri
zed
pro
tein
Tri
chod
erm
avi
ren
sU
nknow
n
23P
robab
lezi
nc
met
allo
pro
teas
eC
lavi
spor
alu
sita
nia
eP
rote
olysi
s
24H
ex1
Tri
chod
erm
aha
rzia
nu
mE
longa
tion
fact
or
25T
RIR
ED
RA
FT
7396
7T
rich
oder
ma
rees
eiA
ctin
bin
din
g
26N
one
found
--
27C
hro
modom
ain
hel
icas
ehrp
3S
chiz
osac
char
omyc
espo
mbe
Chro
mat
inre
model
ing
28T
RIV
IDR
AF
T88
883
Tri
chod
erm
avi
ren
sC
hol
ine
deh
ydro
genas
e
29Sor
ting
nex
inM
VP
1C
andi
dagl
abra
taV
acuol
arpro
tein
tran
spor
t
30T
RIV
IDR
AF
T16
9516
Tri
chod
erm
avi
ren
sL
ipid
deg
radat
ion
31H
ex1
Tri
chod
erm
aha
rzia
nu
mE
longa
tion
fact
or
32T
RIV
IDR
AF
T87
974
Tri
chod
erm
avi
ren
sT
ransk
etol
ase
33D
ehydra
tase
Tri
chod
erm
are
esei
Di-
hydro
xy
deh
ydra
tase
34T
RIV
IDR
AF
T18
6586
Tri
chod
erm
avi
ren
sP
ento
se-p
hos
phat
esh
unt
35T
RIV
IDR
AF
T74
949
Tri
chod
erm
avi
ren
sA
ldeh
yde
deh
ydro
genas
e
36T
RIV
IDR
AF
T74
949
Tri
chod
erm
avi
ren
sA
ldeh
yde
deh
ydro
genas
e

3. Cellular proteomics of Trichoderma aggressivum 77
Tab.
:3.
3:C
onti
nu
ed
Sp
otH
omol
ognam
eSou
rce
Funct
ion
37N
orso
lori
nic
acid
reduct
ase
Tri
chod
erm
aat
rovi
ride
Oxid
ored
uct
ase
38T
RIV
IDR
AF
T53
536
Tri
chod
erm
avi
ren
sE
ndon
ucl
ease
39T
RIV
IDR
AF
T74
949
Tri
chod
erm
avi
ren
sA
ldeh
yde
deh
ydro
genas
e
40A
ctin
Cle
isto
gen
esso
ngo
rica
Cyto
skel
eton
41G
lyce
rald
ehyde-
3-phos
phat
edeh
ydro
genas
eE
rysi
phe
gram
inis
Gly
coly
sis
42T
RIV
IDR
AF
T33
817
Tri
chod
erm
avi
ren
sG
lyco
lysi
s
43N
one
found
-
44Sec
reto
rylipas
e,puta
tive
Neo
sart
orya
fisc
heri
Lip
iddeg
radat
ion
45N
one
found
--
46N
one
found
--
47T
RIR
ED
RA
FT
5555
2T
rich
oder
ma
rees
eiU
nknow
n
48Sup
erox
ide
dis
muta
se[C
u-Z
n]
Tri
chod
erm
aha
rzia
nu
mSup
erox
ide
deg
radat
ion
49N
one
found
--

3. Cellular proteomics of Trichoderma aggressivum 78
Tab. 3.4: Accession number, Mascot score and additional information for proteins anal-
ysed from Trichoderma aggressivum strain CBS 100526.
Spot Accession number Mascot score % Coverage MW (kDa) pIhom pInat
1 O14139 46 0 159744 6.32 5.00
2 G9NAQ0 122 12 54165 5.88 5.00
3 A3LYZ4 31 1 172492 8.86 5.15
4 G9MTN9 561 37 51591 5.33 5.50
5 G9MTN9 636 41 51591 5.33 5.45
6 E9DS21 97 7 54461 6.06 5.15
7 D6C5B7 586 39 41827 5.45 5.45
8 G9N455 216 28 24963 4.33 4.50
9 G0RNE6 357 29 41183 5.86 5.10
10 None found - - - - 4.40
11 None found - - - 5.00
12 F0XBV7 178 9 42053 6.97 5.00
13 G9MRQ8 518 29 41416 5.95 5.10
14 None found - - - - 4.50
15 Q12449 44 5 39585 7.03 4.60
16 G9NAQ0 206 10 54165 5.88 4.25
17 None found - - - - 5.00
18 Q6FS57 61 3 27258 9.98 5.00
19 P06634 32 0 73026 8.41 4.75
20 G9N428 415 41 30119 5.43 4.75
21 G9MQT2 114 18 17852 5.16 5.00
22 G9N2A8 151 18 21480 5.35 5.40
23 C4Y9H0 27 0 114603 6.43 5.50
24 E0YRV9 623 57 24334 6.75 5.25
25 G0R881 132 17 17414 5.66 5.50
26 None found - - - - 4.80
27 O14139 48 0 159744 6.32 5.25
28 G9N370 598 22 65088 5.4 5.80

3. Cellular proteomics of Trichoderma aggressivum 79
Tab.: 3.4: Continued
Spot Accession number Mascot score % Coverage MW (kDa) pIhom pInat
29 Q6FNH2 48 3 59242 5.8 6.00
30 A3LYZ4 71 2 81530 5.73 6.10
31 E0YRV9 293 38 24334 6.75 7.00
32 G9N9F6 72 3 75548 5.84 6.45
33 G0RFA6 352 19 65175 6.04 6.40
34 G9MVH9 370 16 54459 5.72 6.30
35 G9NAQ0 913 38 54165 5.88 6.45
36 G9NAQ0 378 23 54165 5.88 6.25
37 G9NMQ9 154 7 42580 6.15 6.40
38 G9MU97 98 3 28630 5.12 6.25
39 G9NAQ0 943 48 54165 5.88 5.55
40 D6C5B7 676 46 41827 5.45 6.00
41 Q00640 115 6 36751 6.02 6.10
42 G9MEX6 99 2 39234 5.51 6.20
43 None found - - - - 6.00
44 A1D8L8 60 4 47956 5.44 5.80
45 None found - - - - 5.75
46 None found - - - 5.50
47 G0RAL0 219 39 16717 5.80 5.75
48 A8BA83 478 75 15874 5.58 5.80
49 None found - - - - 6.15

3. Cellular proteomics of Trichoderma aggressivum 80
3.5 2-D electrophoretic analysis of Trichoderma aggressivum
strain CBS 100526 grown in the presence of mushroom
substrate and mushroom tissue.
Malt extract broth, malt extract broth with Bulk Phase III mushroom substrate
and malt extract broth with Agaricus bisporus tissue were inoculated with Tri-
choderma aggressivum strain CBS 100526 in duplicate (Section 2.1.6). Cellular
protein was extracted from T. aggressivum mycelium as per Section 2.3.1 and
pooled between the replicates in each treatment. Strain 100526 was selected for
this analysis as it gave more significant response to both treatments than strain
433.95 during preliminary analysis.
Protein was separated in 2 dimensions and visualised as per Section 2.3.4. For
each treatment 2-D PAGE was performed in triplicate. Figure 3.5 shows one gel
from each treatment.

3. Cellular proteomics of Trichoderma aggressivum 81
Fig
.3.
5:2-
Dim
ensi
onal
pro
tein
pro
file
ofTrichodermaaggressivum
stra
inC
BS
1005
26gr
own
ind
iffer
ent
med
ia.
A-
1%
mal
tex
trac
tbro
th,
B-
1%
mal
tex
trac
tbro
th,
1%B
ulk
Phas
eII
Im
ush
room
subst
rate
,C
-1
%(w
/v)
mal
t
extr
act
1%
mush
room
cap
tiss
ue.

3. Cellular proteomics of Trichoderma aggressivum 82
3.6 Differential protein expression in Trichoderma aggressivum
strain CBS 100526 grown in the presence of Bulk Phase III
mushroom substrate and mushroom tissue.
Stained proteins spot pattern and density was analysed using Progenesis Samespots
software (section 2.3.5). Each gel was aligned to a reference gel so that the spots
could be matched between treatments and normalised. Relative expression level
was calculated automatically.
Statistically significant differential expression was observed for 23 protein
spots of which 19 were analysed by LC/MS. Differential spots which were anal-
ysed by LC/MS (section 2.4) are shown in Figure 3.6. The relative expression
levels for each treatment are shown in Table 3.5 and Figure 3.7.
Mascot searches were performed using the NCBInr and SwissProt databases
returning 14 matches of which 7 displayed significant homology, no matches were
obtained for spots 8-13. Table 3.6 shows the matches found for each spot, sig-
nificant homology is indicated by Mascot scores in excess of 57 and 42 for the
NCBInr and SwissProt databases, respectively.
Spot 1 was upregulated slightly in the presence of Agaricus bisporus tissue and
downregulated in the presence of mushroom substrate. This spot was matched
with a probable Xaa-Pro aminopeptidase from Unicocarpus reesei, albeit with
low confidence. Xaa-Pro amino peptidases are Manganese dependent proteases
which cleave any peptide on the N-terminal side of proline residues.
Spot 2 was down-regulated in the presence of mushroom substrate and was
matched with oligosaccharyl transferase subunit stt3 from Schizosaccharomyces
pombe although the Mascot score was too low to ensure significant homology.
This is a transmembrane protein which is thought to catalyse the site specific
N-glycosylation of proteins in the endoplasmic reticulum. Glycosylation is an
important post-translational modification which can significantly alter protein
function and localisation.
Spot 3 was upregulated in the presence of both mushroom tissue and sub-
strate. Three results were obtained from the analysis of this spot, all displaying
significant homology. The first hit is an un-named protein from Trichoderma
viride which displays sequence motifs which suggest an RNA binding function.

3. Cellular proteomics of Trichoderma aggressivum 83
Fig. 3.6: Differentially expressed protein in Trichoderma aggressivum strain CBS
100526 with exposure to Agaricus bisporus tissue and/or Bulk Phase III mush-
room substrate.

3. Cellular proteomics of Trichoderma aggressivum 84
The second and third hits were for a 60S acidic ribosomal protein from Tricho-
derma reesei and Neurospora crassa, respectively. Both of these proteins are
constituents of the ribosome and may be analogs of the T. viride protein.
Spot 4 was upregulated in the presence of mushroom substrate. The highest
ranking hit for this spot (and the only one with a characterised function) was iron-
manganese superoxide dismutase from T. viride. Superoxide dismutase detoxifies
superoxide free radical, producing hydrogen peroxide in the process. It is an
important part of the cell’s ability to resist harm by oxidative stress.
Spot 5 was down-regulated in both treatments relative to the control. Analysis
of this protein yielded 4 Mascot results of which the three significant matches were
proteins in the spermidine/spermine synthase family. Spermidine is a growth fac-
tor for many micro-organisms and may play a role in macromolecular stabilisation
and cellular longevity in eukaryotes.
Spot 6 was downregulated in both treatments and displayed homology with
maintenance of telomere capping protein 2 from Zygosaccharomyces rouxii. Telom-
eres are repetitive DNA sequences at the ends of chromosomes which protect them
from degradation and improve the fidelity of chromosome duplication. Telomere
shortening also plays a role in cell senescence, so effective telomere capping may
promote cell longevity.
Spot 7 was upregulated slightly (1.25 fold) in the A. bisporus tissue treatment
and downregulated in the Phase III substrate treatment. This spot was matched
to orotidine 5’ phosphate decarboxylase from Paracoccoides brasiliensis but not
with significant homology. Orotidine 5’ phosphate decarboxylase is involved in
the biosynthesis of pyrimidines, including 3 which are components of RNA and/or
DNA. It is worth noting that this was also analysed in Section 3.4 (spot label 19)
without any significant matches, in spite of it being a relatively abundant protein
in both cases. It is also not immediately apparent in the 2-D electrophoretic
profile of T. aggressivum strain CBS 433.95 3.1.
Spots 8-13 were downregulated in both treatments but returned no matches
after LC/MS and Mascot analysis. Whether this is a result of the low relative
abundance of the proteins or because of poor matching in the databases searched
is unknown. Spot 8 was also analysed in Section 3.4 (spot label 26) and returned
no significant hits in either case.

3. Cellular proteomics of Trichoderma aggressivum 85
Tab. 3.5: Normalised expression levels and relative fold changes of spots differentially
expressed in Trichoderma aggressivum strain CBS 100526 in response to
Agaricus bisporus tissue or Bulk Phase III mushroom substrate.
Expression level Fold change
Spot Control Tissue Compost Tissue Compost P value
1 8.05E+6 8.72E+6 4.85E+6 +1.08 -1.66 5.0E-2
2 1.12E+8 1.20E+8 5.76E+7 +1.07 -1.95 3.4E-2
3 3.50E+7 6.69E+7 6.18E+7 +1.91 +1.76 5.0E-3
4 6.81E+6 7.82E+6 1.97E+7 +1.15 +2.89 1.0E-3
5 7.70E+6 5.86E+6 4.87E+6 -1.31 -1.58 3.4E-2
6 4.26E+7 2.21E+7 2.33E+7 -1.93 -1.82 3.2E-2
7 1.47E+8 1.84E+8 5.59E+7 +1.25 -2.62 5.5E-5
8 1.48E+8 2.02E+8 3.51E+8 +1.36 +2.37 7.0E-3
9 1.77E+7 1.68E+7 8.08E+6 -1.06 -2.19 3.2E-2
10 2.41E+7 1.55E+7 8.67E+6 -1.55 -2.78 3.4E-2
11 9.46E+6 5.38E+6 5.10E+6 -1.76 -1.85 3.1E-2
12 4.29E+6 2.63E+6 2.13E+6 -1.63 -2.01 7.0E-3
13 5.06E+6 2.41E+6 3.51E+6 -2.10 -1.44 4.0E-3
14 4.66E+6 1.00E+7 2.29E+6 +2.15 -2.03 2.0E-3
15 1.66E+7 7.44E+6 9.29E+6 -2.23 -1.78 4.0E-3
16 9.62E+7 2.68E+7 1.47E+7 -3.59 -6.54 1.7E-4
17 4.78E+7 9.24E+7 1.45E+8 +1.93 +3.04 4.9E-4
18 1.69E+7 2.17E+7 4.44E+7 +1.28 +2.63 3.8E-4
19 1.39E+7 2.26E+7 3.18E+7 +1.62 +2.29 4.0E-3

3. Cellular proteomics of Trichoderma aggressivum 86
Spot 14 displayed 2-fold upregulation in the A. bisporus tissue treatment and
2-fold down regulation in the substrate treatment. The best matching protein
for this spot was guanylate kinase from Grosmannia clavigera. This protein may
be involved in purine biosynthesis and the production of nucleic acids.
Spot 15 was down regulated in both treatments. The spot was matched to
a putative cytochrome DASH, but not with significant homology. This protein
is a light induced enzyme that repairs DNA strand breaks which are caused by
exposure to UV radiation.
Spot 16 was the most strongly downregulated protein observed in the experi-
ment. It was downregulated 3.6 fold in the A. bisporus tissue treatment and 6.5 in
the mushroom substrate treatment. This protein displayed homology with NAD-
specific glutamate dehydrogenase from Saccharomyces cerevisiae, although the
score was just below the significance threshold. This protein produces ammonia
from glutamate and is involved in the metabolism of various nitrogen containing
compounds.
Spots 17-19 did not return any significant hits in this study, but they can be
shown to be the same as spots 48, 23 and 25 respectively from Figure 3.4 by gel
alignment.
Spot 17 was upregulated 1.9 and 3.0 fold in the A. bisporus tissue and mush-
room substrate treatments, respectively. When analysed in section 3.4 this spot
showed extensive homology with copper-zinc superoxide dismutase. This protein
detoxifies superoxides in the same manner as iron-manganese superoxide dismu-
tase, but has a different cellular location and metal co-factor.
Spot 18 was upregulated in both treatments and was matched with a probable
zinc metalloprotease in Clavispora lusitaniae, but without significant homology.
This protein is a glycosylated transmembrane peptidase. It does not induce site-
specific cleavage but instead is involved in general proteolysis.
Spot 19 was upregulated in both treatments. It was matched to a putative
protein from Trichoderma reesei of unknown function.

3. Cellular proteomics of Trichoderma aggressivum 87
Tab
.3.
6:M
asco
tse
arch
resu
lts
for
anal
yse
dp
epti
des
from
diff
eren
tial
lyex
pre
ssed
Trichodermaaggressivum
stra
inC
BS
100526
pro
tein
s.
Sp
otH
omol
ognam
eSp
ecie
sA
cces
sion
Sco
reD
atab
ase
1P
robab
leX
aa-P
roam
inop
epti
das
eU
nci
noc
arpu
sre
esii
C4J
Y72
34Sw
issp
rot
2O
ligo
sacc
har
yl
tran
sfer
ase
subunit
stt3
Sch
izos
acch
arom
yces
pom
beO
9433
528
Sw
issp
rot
3T
RIV
IDR
AF
T92
231
Tri
chod
erm
avi
ride
G9N
D76
242
NC
BIn
r
60S
acid
icri
bos
omal
pro
tein
P0
Tri
chod
erm
are
esei
G0R
FG
120
0N
CB
Inr
60S
acid
icri
bos
omal
pro
tein
Neu
rosp
ora
cras
saQ
96T
J5
64Sw
issp
rot
4Sup
erox
ide
dis
muta
se[F
e-M
n]
Tri
chod
erm
avi
ride
G9N
1G1
146
NC
BIn
r
TR
IAT
DR
AF
T82
820
Tri
chod
erm
aat
rovi
ride
G9N
IJ0
102
NC
BIn
r
MY
CG
RD
RA
FT
1038
41M
ycos
phae
rell
agr
amin
icol
aF
9X7C
566
NC
BIn
r
Unch
arac
teri
zed
pro
tein
yae1
Asp
ergi
llu
ste
rreu
sQ
0CX
4538
Sw
issp
rot
5T
RIV
IDR
AF
T18
7417
Tri
chod
erm
avi
ren
sG
9N9E
115
7N
CB
Inr
TP
HA
0A01
420
Tet
rapi
sisp
ora
phaffi
iG
8BM
U7
74N
CB
Inr
Sp
erm
idin
esy
nth
ase
Neu
rosp
ora
cras
saQ
9Y8H
774
Sw
issp
rot
Ket
ol-a
cid
reduct
oiso
mer
ase
Neu
rosp
ora
cras
saP
3867
435
Sw
issp
rot
6M
ainte
nan
ceof
telo
mer
eca
ppin
gpro
tein
2Z
ygos
acch
arom
yces
rou
xii
C5E
1C0
64N
CB
Inr
Mai
nte
nan
ceof
telo
mer
eca
ppin
gpro
tein
2Z
ygos
acch
arom
yces
rou
xii
C5E
1C0
38Sw
issp
rot
7O
roti
din
e5’
-phos
phat
edec
arb
oxyla
seP
arac
occi
dioi
des
bras
ilie
nsi
sQ
9C13
131
Sw
issp
rot
8-13
Non
efo
und
--
--
14G
uan
yla
tekin
ase
Gro
sman
nia
clav
iger
aF
0X7L
280
NC
BIn
r

3. Cellular proteomics of Trichoderma aggressivum 88
Tab.
:3.
6:C
onti
nu
ed
Sp
otH
omol
ognam
eSp
ecie
sA
cces
sion
Sco
reD
atab
ase
14A
OL
s000
76g6
7A
rthr
obot
rys
olig
ospo
raG
1X8W
068
NC
BIn
r
NE
CH
AD
RA
FT
6970
1N
ectr
iaha
emat
ococ
caC
7YSP
166
NC
BIn
r
15P
uta
tive
crypto
chro
me
DA
SH
Gib
bere
lla
zeae
Q4I
1Q6
31Sw
issp
rot
16N
AD
-sp
ecifi
cgl
uta
mat
edeh
ydro
genas
eS
acch
arom
yces
cere
visi
aeP
3332
741
Sw
issp
rot
17Sup
erox
ide
dis
muta
se[C
u-Z
n]
Tri
chod
erm
aha
rzia
nu
mA
8BA
8347
8N
CB
Inr
Sup
erox
ide
dis
muta
se[C
u-Z
n]
Neu
rosp
ora
cras
saP
0750
988
Sw
issp
rot
18P
robab
lezi
nc
met
allo
pro
teas
eC
lavi
spor
alu
sita
nia
eC
4Y9H
027
Sw
issp
rot
19T
RIR
ED
RA
FT
7396
7T
rich
oder
ma
rees
eiG
0R88
113
2N
CB
Inr

3. Cellular proteomics of Trichoderma aggressivum 89
3.7 Discussion
3.7.1 Protein homologies
Trichoderma aggressivum is unique among Trichoderma species in the damage it
causes in the mushroom industry. It is also a recently characterised species and
there is still much to be learned about its ecology, genetics and propagation.
Two dimensional SDS-PAGE coupled with LC/MS is a powerful tool for the
isolation and identification of proteins. In the absence of a genome sequence
for T. aggressivum comparative proteomics can provide unique insights into the
biology of the fungus by identifying protein homologs in other fungi and thereby
assigning functions to the T. aggressivum proteins.
In this study 75 protein homologs were identified for Trichoderma aggressivum
proteins with functions having been assigned to 69 of them. These homologs were
drawn from a wide range of species, the recently annotated Trichoderma reesei,
Trichoderma harzianum and Trichoderma atroviride genome databases provided
the majority of homologs with many others coming from yeasts, probably be-
cause the proteomes of those organisms are well studied and there are several
complete genome sequences for them. Protein functions can be broadly described
as metabolic, informational, structural and other.
Metabolic proteins are involved in the uptake of nutrition and production
of energy. Unsurprisingly for such a fast growing fungus, metabolic proteins
account for a large proportion of the identified proteins from T. aggressivum.
Thirty of the identified proteins had functions such as carbohydrate degradation,
the glycolytic pathway, ATP synthesis and protein degradation. Some of the
more interesting functions were those involved in the metabolism of xylose and
arabinose (Spot 34, Tab 3.1) as these sugars are present in the hemicellulose
component of mushroom substrate and the pentose phosphate shunt, which is an
alternative to the glycolytic pathway where pyruvate is converted into a 5-carbon
sugar so that it can be processed similarly to xylose and arabinose. None of the
identified proteins showed any evidence of being involved in the degradation of
fungal cell wall components, which would be a good indicator of the mycoparasitic
potential of the fungus (Williams et al., 2003a; Guthrie & Castle, 2006). However,
these types of enzymes are generally secreted from the cell so that is not to

3. Cellular proteomics of Trichoderma aggressivum 90
Fig. 3.7: Relative expression levels of differentially expressed proteins in Trichoderma
aggressivum strain CBS 100526 when exposed to Agaricus bisporus tissue and
Bulk Phase III mushroom substrate.
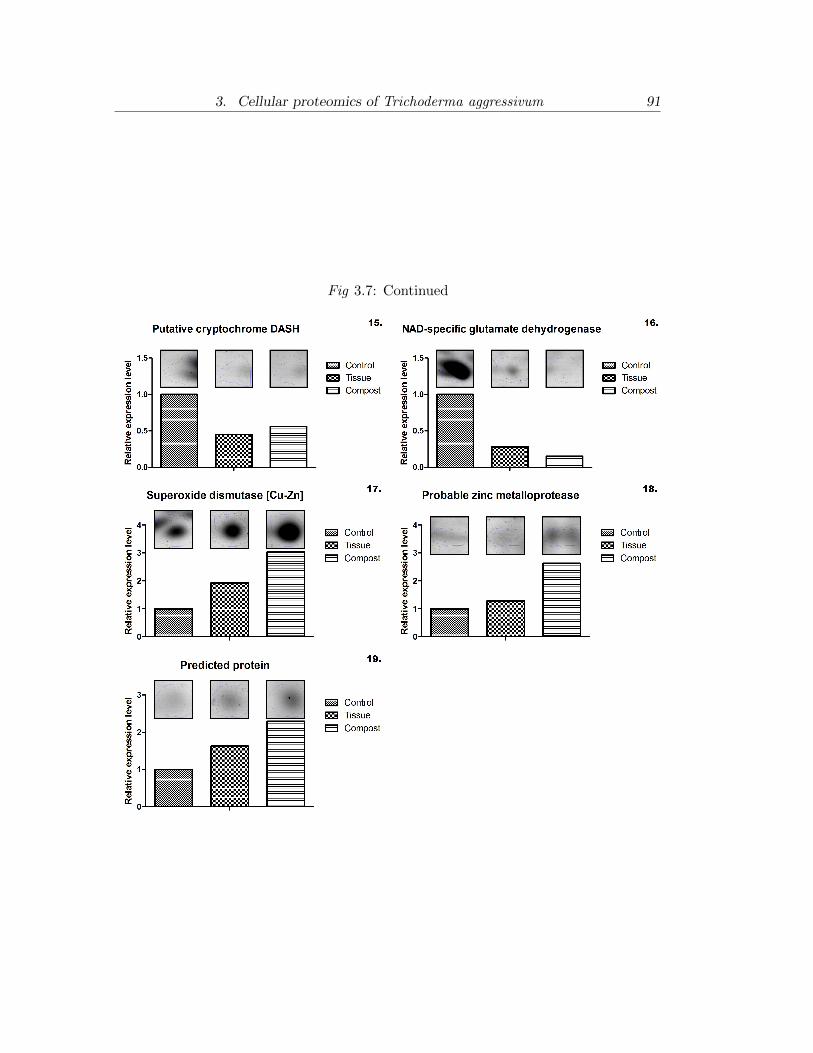
3. Cellular proteomics of Trichoderma aggressivum 91
Fig 3.7: Continued

3. Cellular proteomics of Trichoderma aggressivum 92
say that they were not being produced during the experiments. Further studies
involving the secreted protein fraction obtained from the culture supernatant
might yield more information on the production of chitinase and other cell wall
degrading enzymes by T. aggressivum.
Informational proteins are those that are involved in DNA duplication, tran-
scription and translation. These proteins are generally more conserved between
organisms than proteins involved in metabolism as their purpose is largely in-
dependent of the ecological niche of the organism. Ten of the analysed proteins
have functions in this category, including transcription factors, ribosome com-
ponent proteins and other proteins which interact with nucleic acids. Without
knowing the exact nature of these proteins, whether they are linked to specific
genes or cell division it is difficult to assess their significance. The only elonga-
tion factor with known function identified was Hex 1, which has homologs in all
Trichoderma species. Hex 1 is a major component of the woronin body complex
as well as a transcription factor. Woronin bodies are present at the periphery of
fungal hyphae where they prevent cellular leakage by blocking septal pores when
hyphae are sheared (Lew, 2011). Hex1 has been implicated in the response of
T. atroviride to plant pathogenic fungi (Marra et al., 2006). This protein was
identified 4 times in this study, possibly because it accounts for a large proportion
of total protein in the cell envelope of Trichoderma spp. and because it forms
complexes which may be visualised at different positions in a 2 dimensional gel
(Curach et al., 2004).
Structural proteins are core components of the cell which allow it to main-
tain integrity and segregate other molecules into cellular partitions. Ten of the
analysed proteins had structural or homeostatic roles including cytoskeletal com-
ponents such as actin and actin binding proteins, transmembrane transporter
proteins and redox enzymes. Cytoskeletal proteins have an important role in
the physical shape of the cell. Actin is often constitutively expressed by cells
as it forms the cellular “backbone”, it can also be mobilised to cause the cell to
grow or move in a specific direction (chemokinesis) and so can be important in
saprotropism. The maintenance of homeostasis is important for any organism,
particularly those in harsh environments. Transmembrane proteins allow com-
munication between the intracellular and extracellular environment. Two classes

3. Cellular proteomics of Trichoderma aggressivum 93
of transmembrane proteins were observed in this study, 14-3-3 like proteins and
membrane transport channels. 14-3-3 like proteins are a large class of proteins
conserved in all Eukarya, they have a variety of functions but are predominantly
involved in the induction of signals across cell membranes. This signal transduc-
tion allows cells to adapt to their external environment and allows intercellular
communication. Membrane transport channels are involved in the movement of
molecules across membranes, they may be involved in the uptake of nutrient from
the environment, the secretion of molecules such as digestive enzymes into the
environment and the movement of molecules between internal cell compartments,
such as in the Golgi apparatus (Klemsdal et al., 1996).
Other proteins did not fall into any of the above 3 categories. Epl1 protein
is a protein first isolated from Trichoderma atroviride which has been described
as the most commonly secreted protein in that species (Seidl et al., 2006). Epl1
belongs to a class of proteins which ellicit an immune response in plants, but it has
been described as an important aspect of the biocontrol faculty of Trichoderma
spp. which are used for controlling plant pathogenic fungi.
Superoxide dismutase and Hsp70/90 like proteins are proteins involved in cel-
lular stress response, the former is discussed in Section 3.7.2. Hsps, or heat shock
proteins are stress inducible chaperone proteins. They are induced in response
to a variety of stresses, not just heat, which are characterised by changes in free
energy levels within the cell. Hsps ensure correct folding of proteins so that
non-functional proteins are not produced, which would result in cellular damage.
The last subset of proteins identified are those with unknown functions. Some
of these proteins are putative, based on open reading frames which do not have
a function assigned to them as yet, others returned Mascot scores below the
significance threshold. If there was no match found for a protein there are two
possible explanations. The initial concentration may have been below the limit
of detection of the mass spectrometer used, this is likely the case for many of the
unknown proteins which are either faint or very small spots on the gel. There were
a number of proteins for which no database match was found which were clearly
in high abundance, however, and it is possible that these are novel T. aggressivum
proteins for which no homolog exists in the databases. In the future it would be
ideal to re-analyse these spots using de novo sequencing to determine the amino

3. Cellular proteomics of Trichoderma aggressivum 94
acid sequence of the protein and possibly assign functions to them. Novel proteins
would give particular insight into the specific adaptations for T. aggressivum as
they are not present in other Trichoderma which have been sequenced. Unique
T. aggressivum proteins could also be useful diagnostic markers for species/strain
differentiation and may also be virulence markers.
3.7.2 Differentially expressed proteins and the virulence of Trichoderma
aggressivum
Densitometric analysis also allows the relative expression levels of each protein to
be compared under different conditions. By challenging Trichoderma aggressivum
with different environments it is possible to measure the up, or down-regulation
of proteins in response to the environment.
In this study homologs for 7 proteins were which changed in expression in the
presence of mushroom substrate or Agaricus bisporus tissue were identified with
high confidence by LC/ MS. A further 5 returned database hits, but the quality
of the sequence match (based on Mascot score) was not statistically significant.
Proteins which were upregulated in the presence of A. bisporus tissue included
a 60S acidic ribosomal protein P0, guanylate kinase, copper zinc superoxide dis-
mutase and a protein of unknown function. Each of these proteins was also
up-regulated in the presence of Phase III mushroom substrate apart from guany-
late kinase, which was down-regulated. In the Phase III substrate treatment iron
manganese superoxide dismutase was also up-regulated.
60S acidic ribosomal protein P0 is a protein conserved in all eukaryotes which
is the ortholog of the Escherichia coli protein L10 (Rich & Steitz, 1987). This
protein has a specific conserved protein binding C-terminus which allows it to
form a complex with 2 other proteins and an RNA binding N-terminus region
which attaches the complex to the ribosomal RNA where it is involved in protein
elongation (Hagiya et al., 2005); similar proteins are virulence factors in the
human parasite Plasmodium (Arevalo-Pinzon et al., 2010), they are expressed on
the organism’s cell surface and interfere with the host immune response. The
human P0 protein has been implicated as a target for the autoimmune condition
lupus erythematosus (Frampton et al., 2000). Different forms of this protein
can infer resistance to the sordarin class of fungicides (Santos & Ballesta, 2002;

3. Cellular proteomics of Trichoderma aggressivum 95
Santos et al., 2004). As a component of the ribosome 60S ribosomal protein P0
can affect the translation of other proteins and has been linked with the cellular
response to stress and toxins (Abramczyk et al., 2003; Maniratanachote et al.,
2006). P0 is a phosphoprotein, with several phosphorylation sites, protein kinase
60S is one of the enzymes that phosphorylates P0 in Saccharomyces cerevisiae.
This protein is inactivated by superoxide dismutase (Abramczyk et al., 2003), the
resultant dephosphorylation of P0 may play a role in changing protein expression
under oxidative stress conditions.
Superoxide dismutase is an important part of the oxidative stress response and
is vital to growth in aerobic environments (Peskin, 1997). All aerobic organisms
produce superoxide radicals during respiration, so production of these enzymes
is vital to minimise damage due to oxidative stress from within the cell and from
the external environment (Bai et al., 2001). Superoxide dismutase is also involved
in other stress responses such as temperature dependant stress and certain toxins
(Giles et al., 2005; Hwang et al., 2003).
Superoxide is commonly produced by organisms as a non-specific anti-microbial
agent. Mammalian and insect immune cells produce superoxide, among other re-
active oxygen species, to destroy internalised or adjacent pathogens (Condliffe
et al., 1998; Bergin et al., 2005; Munoz, 2007). In the yeasts Candida albicans
and Cryptococcus neoformans production of superoxide dismutase is a virulence
factor, because it allows them resist attack by host immune cells (Hwang et al.,
2002; Cox et al., 2003).
The immune response of plants involves the accumulation and release of su-
peroxide radicals in oxidative bursts (Lamb & Dixon, 1997). In Phythoptora and
Botrytis it has been shown that challenging a host plant with a non pathogenic
fungal strain results in an initial oxidative burst, followed later by a more intense
production of reactive oxygen species and other antimicrobials which prevents the
fungus from colonising the host plant (Perrone et al., 2003; Unger et al., 2005).
Pathogenic varieties of these fungi prevent the occurrence of this secondary oxida-
tive burst. In Phythoptora this evasion of the immune response can be directly
attributed to the enzymatic removal of superoxide (Able et al., 1998) and in
Botrytis a higher concentration of hydrogen peroxide associated with virulent
strains points to a possible similar mode of action.

3. Cellular proteomics of Trichoderma aggressivum 96
Many fungi produce exogenous superoxide using cell wall bound NADPH
oxidases as a deterrent to competing microbes in co-culture (Silar, 2005). Pro-
duction of superoxide is thought to be part of the response of A. bisporus to stress
(Largeteau et al., 2010). Plant matter decomposing basidiomycetes like Agari-
cus also produce superoxide to degrade lignin (Hammel et al., 2002; Tornberg &
Olsson, 2002; Guillen et al., 1997) and there is a link between the production of
laccase and other polyphenol oxidases which depolymerise lignin and superoxide
production (Munoz et al., 1997). Laccase production is promoted in A. bis-
porus confronted with antagonists (Flores et al., 2009; Savoie & Mata, 1998) and
pathogens (Largeteau et al., 2000b). Enhanced secretion of extracellular laccase
is associated the formation of brown-rings of depolymerised phenolic compound
at the border between competing fungi and a cessation of growth (Tsujiyama &
Minami, 2005). In co-cultures between A. bisporus and T. aggressivum brown
line formation occurs but the growth of T. aggressivum is not inhibited and it
proceeds to overgrow the mycelium of susceptible A. bisporus varieties (Savoie
et al., 2001b). It is possible that the ability of T. aggressivum to overgrow brown-
rings produced by A. bisporus may be as a result of tolerance to oxidative stress
provided by the induction of superoxide dismutase and other stress tolerance
proteins.
There is also a correlation between the ability of a T. aggressivum strain to
colonise unpasteurised mushroom substrate and its ability to overgrow brown-
lines produced by A. bisporus (Savoie et al., 2001b). The microbial flora of
mushroom substrate is one of the factors which is thought to ensure that it is
selective for the growth of A. bisporus and inhibit the growth of non-aggressive
Trichoderma species (Savoie et al., 2001a). The upregulation of the two identified
superoxide dismutase proteins suggest that T. aggressivum was also under oxida-
tive stress in the mushroom substrate treatment, so the oxidative stress response
of T. aggressivum may have a dual role in its ability of to resist growth inhibition
by substrate micro-flora and by A. bisporus.
Guanylate kinases are enzymes which catalyse the phosphorylation of guano-
sine monophosphate to guanosine diphosphate using ATP as the donor molecule
requiring magnesium ions as a metal co-factor (Berger et al., 1989; Blaszczyk
et al., 2001). They are essential to the production of deoxyguanosine triphos-

3. Cellular proteomics of Trichoderma aggressivum 97
phate, the monomeric form of the purine base guanine. Loss of function of the
gene coding for this protein is lethal in Saccharomyces cerevisiae (Konrad, 1992).
Guanosine diphosphate is also one of the intermediaries in the cyclic guanosine
monophosphate pathway. Cyclic GMP is a key signalling molecule in a variety
of organisms and in fungi is known to be involved in such processes as conidi-
ation (Li et al., 2010), cell division (Eckstein, 1988) and hyphal extension and
branching (Robson et al., 1991). Whether it is producing guanosine di-phosphate
for the synthesis of DNA or signalling molecules guanylate kinase is likely asso-
ciated with cell growth. This protein was upregulated in T. aggressivum in the
presence of A. bisporus tissue and down regulated in the presence of mushroom
substrate. Other researchers have found that the presence of A. bisporus enhances
the growth of T. aggressivum (Mumpuni et al., 1998; Largeteau et al., 2010), and
T. aggressivum suffers some degree of growth inhibition in mushroom substrate
(Largeteau et al., 2000b), which may be related to this differential expression of
guanylate kinase.
Proteins homologous with spermidine synthase and maintenance of telomere
capping protein 2 (MTCP2) were downregulated in the presence of mushroom
substrate and mushroom tissue, with spermidine synthase being more strongly
reduced in expression in the substrate treatment. Spermidine synthase is an
aminopropyltransferase which catalyses the production of the polyamine sperim-
idine from putrecine (Pegg, 1986). Spermidine is the precursor of spermine and
hypusine, an essential amino acid in eukaryotes (Chattopadhyay et al., 2003).
Spermidine is involved in many other biological processes, such as the response
to thermal and oxidative stresses (Kuznetsov et al., 2006; Tkachenko & Fedotova,
2007) and specific toxins (Qin & Lan, 2004) and pathogens (Fu et al., 2011). The
number of pathways and regulatory mechanisms involving spermidine, as well as
the sometimes contrary effects of polyamines in these processes makes it diffi-
cult to suggest an explanation for the reduction of the expression of spermidine
synthase in both the A. bisporus tissue and Bulk Phase III compost treatment,
or the possible outcome of such downregulation. Perhaps the most reasonable
explanation is based on experiments with spermidine-synthase-deficient S. cere-
visiae, in which the addition of exogenous spermidine induced a reduction in the
expression of several oxidative stress response genes, including glutathione per-

3. Cellular proteomics of Trichoderma aggressivum 98
oxidase and cytosolic catalase (Chattopadhyay et al., 2009). Both these enzymes
protect the cell from peroxide induced damage. With an increase in the levels of
superoxide dismutase in the cell there would be an increase in cellular hydrogen
peroxide which may be removed by proteins induced by a reduction in spermidine
concentration.
Maintenance of telomere capping protein 2 (MTCP2) belongs to a class of
proteins which have been shown to exacerbate telomere-shortening-induced cell
cycle arrests in S. cerevisiae (Addinall et al., 2008) which were previously unchar-
acterised open reading frames. Without knowing the mechanism by which these
proteins improve the viability of telomere deficient mutant yeast it is difficult to
suggest what role MTCP2 might serve in T. aggressivum. Many telomere associ-
ated proteins are also involved in DNA repair outside of telomeres and might be
expected to be upregulated in an oxidative stress response but MTCP2 has no
assigned catalytic function or DNA binding domains so is unlikely to be directly
responsible for the ligation of double stranded DNA breaks. Further study of this
protein in T. aggressivum might reveal that it has a different function than in S.
cerevisiae.
The overall impression given by the identified differentially expressed proteins
is of T. aggressivum reacting with an oxidative stress response to A. bisporus tis-
sue and, more strongly, to mushroom substrate. There is an alteration in gene
expression, as evidenced by an increase in ribosomal protein production and there
are changes to metabolic pathways involved in the biosynthesis of spermidine and
guanine, both of which are important signalling molecules and growth factors.
These changes in protein expression may be due to components of the Agaricus
tissue and mushroom substrate which cause oxidative damage to the T. aggres-
sivum cell, or which induce changes in the metabolism of T. aggressivum leading
to increased production of reactive oxygen species. This oxidative stress response
may be part of the reason for the enhanced aggressiveness of T. aggressivum,
its ability to grow uninhibited in mushroom substrate and to out-compete and
displace A. bisporus, ultimately resulting in reduced mushroom yields.
4. TRICHODERMA AGGRESSIVUM IN BULK PHASE III
MUSHROOM SUBSTRATE
4.1 Introduction
4.1.1 Epidemiology of Trichoderma aggressivum in Bulk Phase III mushroom
substrate
In the Bulk Phase III systems pasteurised Phase II substrate is mixed with Agari-
cus bisporus spawn and incubated in large tunnels under stringent environmental
controls to ensure that it is thoroughly s colonised by A. bisporus mycelium and
free from unwanted micro-organisms; this incubation period is called spawn-run.
These systems are generally considered less susceptible to Trichoderma aggres-
sivum infection than in situ spawn run systems because of the more advanced
exclusionary measures, stricter hygiene and greater level of automation involved
and because substrate fully colonised by A. bisporus has been shown relatively
resistant to infection by T. aggressivum (Fletcher, 1997; Rinker & Alm, 2000).
With the increase in the popularity of the Bulk Phase III system there was
an observed decrease in the incidences of T. aggressivum infection in Europe.
However, T. aggressivum infections have appeared in Bulk Phase III produced
substrate subsequently (Lemmers, 2010).
Research into T. aggressivum infection of fully spawn-run substrate was car-
ried out on in situ spawn run substrate, which is different from Bulk Phase III
substrate in that it is not bulk handled after spawn-run is complete. In the Bulk
Phase III system the substrate is bulk handled at the end of spawn-run when the
Phase III tunnel is emptied, the substrate is filled into trucks, transported to the
grower and filled into shelves. This raises the question of whether fully spawn
run substrate retains its resistance is to T. aggressivum when bulk handled.
A further question is whether the addition of nutritional supplements to Bulk

4. Trichoderma aggressivum in Bulk Phase III mushroom substrate 100
Phase III substrate after spawn run can promote the growth of T. aggressivum.
The high level of susceptibility of substrate to infection at spawning gas has been
linked to the easily available carbohydrate present in the spawn grains, which
may provide a foothold for T. aggresivum to grow in the relatively inhospitable
environment (Seaby, 1996b). This source of carbohydrate is depleted by Phase
III, which has been described as a possible reason for the relative resistance of
fully spawn run substrate to T. aggressivum infection (Rinker, 1997). However,
the addition of nutritional supplements to substrate after spawn-run has become
a common method of increasing mushroom yield and quality. These supplements
contain additional nutrients, including carbohydrates, which may promote the
growth of T. aggressivum, but there is currently no information available on this
subject.
This study involved 3 medium scale cropping experiments where healthy Bulk
Phase III substrate was inoculated with T. aggressivum inoculum at the bulk
handling stage. T. aggressivum inoculum was produced from Phase II substrate
which was infected with T. aggressivum at spawning and then spawn-run to pro-
duce a Phase III compost with a high T. aggressivum load. This inoculum was
then diluted into healthy Bulk Phase III substrate, cased and cropped. This
mimics a Bulk Phase III process in which a localised infection occurs during
spawn-run and is diluted into the whole mass of substrate during bulk handling.
In the first two experiments replicate plots were prepared using substrate sup-
plemented with Nutrigain (a commercially available mushroom supplement) and
unsupplemented substrate to assess whether the addition of a nutritional supple-
ment after spawn-run has an effect on T. aggressivum infection.
4.1.2 Methods for the detection of Trichoderma aggressivum in mushroom
substrate
It is desirable to be able to quantify the level of Trichoderma aggressivum in
mushroom substrate for monitoring purposes and in order to assess factors which
may improve or impede the growth of the fungus.
Microbiological methods for enumeration of T. aggressivum propagules are
relatively simple and inexpensive but can be time consuming and do not allow
an immediate species identification (Hagn et al., 2007). Molecular methods have

4. Trichoderma aggressivum in Bulk Phase III mushroom substrate 101
the ability to selectively detect and identify T. aggressivum in a one step process
but they are technically more complex and considerably more expensive than
microbiological methods.
In this study T. aggressivum infected Phase III substrate was screened using
microbiological and molecular detection methods. The objective was to assess
the relative efficacy of these methods in terms of precision, accuracy, sensitivity,
speed and ease of use. These attributes are important for the detection of T.
aggressivum on both an experimental and industrial scale.

4. Trichoderma aggressivum in Bulk Phase III mushroom substrate 102
4.1.3 Aim of the study
• To assess the potential for Trichoderma aggressivum infected mushroom
substrate to infect Bulk Phase III substrate.
• To assess the effect of bulk handling on the impact of T. aggressivum in-
fection in Bulk Phase III mushroom substrate.
• To determine the effect of adding substrate supplements during bulk han-
dling on T. aggressivum in Bulk Phase III mushroom substrate.
• To assess the efficacy of molecular and microbiological detection methods
for the detection and enumeration of T. aggressivum propagules in Bulk
Phase III mushroom substrate.

4. Trichoderma aggressivum in Bulk Phase III mushroom substrate 103
4.2 Experimental
4.2.1 Fungal strains
In each cropping experiment the Agaricus bisporus strain used was Sylvan A15
and the Trichoderma aggressivum isolate used was FM10.
4.2.2 Preparation of inoculum
Phase II mushroom substrate was inoculated with Trichoderma aggressivum spores
on spawn grains at spawning. Six grains were coated with ∼ 106 T. aggressivum
spores per grain and added to 18 kg Phase II mushroom substrate. The sub-
strate was covered and incubated under standard spawn-run conditions to pro-
duce Phase III substrate which was heavily colonised by T. aggressivum (Figure
4.1 B, C and D); this infected substrate was used as inoculum in subsequent ex-
periments. At the end of spawn-run inoculum was thoroughly mixed by hand to
ensure an even distribution of T. aggressivum and samples were taken to quantify
the initial level of T. aggressivum colonisation in terms of propagules per gram
inoculum. Inoculum was prepared separately for each cropping experiment.

4. Trichoderma aggressivum in Bulk Phase III mushroom substrate 104
Fig. 4.1: Production of Trichoderma aggressivum infected Phase 3 compost.
Control (A) and infected (B,C,D) compost spawn running 14 (1) and 25 (2)
days post infection.

4. Trichoderma aggressivum in Bulk Phase III mushroom substrate 105
4.2.3 Infection of Bulk Phase III substrate
Inoculum prepared in Section 4.2.2 was added to uninfected Bulk Phase III mush-
room substrate to produce 4 infection levels, 100 g/kg, 10 g/kg, 1 g/kg and
0.1 g/kg (weight inoculum/weight healthy substrate), equivalent to a dilution of
10−1, 10−2, 10−3, 10−4 infected substrate by weight. A control group of uninfected
Phase III substrate was also prepared.
Each experiment included 5 infection levels (including uninfected) exposed
to two treatments, with each combination of infection level and treatment being
replicated 4 times, for a total of 40 experimental plots per experiment (Table
4.1). Plot dimensions were 52 cm × 40 cm × 25cm and contained 18 kg (fresh
weight) of mushroom substrate for experiments 1 and 2, and 16 kg (fresh weight)
of substrate for experiment 3. Experimental plots were laid out in a random
block design with a space of 1 cm (Experiment 1) or 5 cm (Experiments 2 and 3)
between plots and were incubated under standard mushroom growing conditions.
Mushrooms were harvested in 1-3 flushes and weighed.
Sampling of substrate for T. aggressivum quantification was carried out prior
to plot filling during Experiments 2 and 3. For each plot the full mass of substrate
was laid out on a work surface after infection and 2 × 100 g samples were taken by
pooling multiple smaller volumes of substrate from 10 points distributed evenly
across the total mass of substrate. One of the 100 g subsamples was sent to
FERA (York) for qPCR analysis and the other was mixed a further time prior
to analysis by WMA, MPN and DPA (Section 2.1.7).
Tab. 4.1: Generalised treatment composition for cropping experiments
No. of plots
Infection level Treatment A Treatment B Total
Control 4 4 8
10−4 4 4 8
10−3 4 4 8
10−2 4 4 8
10−1 4 4 8
Total 20 20 40

4. Trichoderma aggressivum in Bulk Phase III mushroom substrate 106
4.2.4 Cropping experiment 1
The factors studied in this experiment were the effect of dilution of Trichoderma
aggressivum infected Phase III substrate (inoculum) into healthy Bulk Phase III
substrate and the effect of supplement of T. aggressivum. The two treatments
in this experiment were supplemented (Phase III substrate supplemented with
0.75 % w/w Nutrigain supplement added at casing) and unsupplemented (no
additional supplements added to the substrate).
The level of substrate mixing during the preparation of experimental units in
this experiment was low, simulating a low level of mixing during bulk handling.
Infected substrate was added to the bottom of crate in which cropping was to be
performed and mixed with approximately 25 % of the total volume of substrate.
The remainder of the substrate was filled into the crate on top.
The number of T. aggressivum propagules per gram inoculum was determined
to be 2.62E+8 cfu/g by MPN analysis (Section 2.1.7).
4.2.5 Cropping experiment 2
The experimental treatments in this experiment were the same as in Section
4.2.4 but with more mixing of inoculum and substrate, simulating a higher level
of mixing during bulk handling.
Prior to filling into crates the healthy Bulk Phase III substrate was weighed
into polyethylene bags to which the infected substrate and supplement (Nutrigain
0.75% w/w) were added. The substrate was then emptied onto a clean plastic
sheet and mixed manually before filling into crates.
The number of T. aggressivum propagules per gram inoculum was determined
to be 1.76E+09 cfu/g by MPN analysis (Section 2.1.7).
4. Trichoderma aggressivum in Bulk Phase III mushroom substrate 107
4.2.6 Cropping experiment 3
In this experiment the factors studied were Trichoderma aggressivum infection
level and type of mixing. The same dilution (by weight) of infected Phase III sub-
strate into healthy substrate was performed as previously but in one half of the
experimental units mixing was performed as in section 4.2.4 (light mixed treat-
ment) while the other half was mixed as in section 4.2.5 (heavy mix treatment).
No supplement was used in this experiment.
The number of T aggressivum propagules per gram in the inoculum was de-
termined to be 1.42E+08 cfu/g by MPN analysis (Section 2.1.7).
4.2.7 Quantification and detection of Trichoderma aggressivum infection in
inoculated Bulk Phase III mushroom substrate
Samples (100 g) of Phase III mushroom substrate were taken from each treatment
in cropping experiment 2 and the heavy mix treatment of cropping experiment 3
after inoculation with infected substrate. Trichoderma aggressivum levels in each
sample were measured by most probable number analysis (MPN), weed mould
analysis (WMA) and direct plating assay (DPA) (Section 2.1.7). An additional
subsample (100 g) of substrate was sent to FERA UK for q-PCR analysis.

4. Trichoderma aggressivum in Bulk Phase III mushroom substrate 108
4.3 Results
4.3.1 Cropping experiment 1
Figure 4.2 shows the first flush mushroom yield from each treatment and infection
level. Table 4.2 shows the results of 2 way ANOVA performed on the yield data.
Infection level had a highly significant effect on mushroom yield (P<0.0001)
with reductions in yield of up to 60 % at the highest level of infection. Supplemen-
tation was not shown to have a significant impact on mushroom yield (P=0.8533).
No significant interaction was observed between these factors (P=0.4874), mean-
ing that the addition of supplement did not tend to enhance the growth of Tri-
choderma aggressivum regardless of infection level.
Fig. 4.2: Effect of infection level and supplement on first flush mushroom yield - ex-
periment 1. Mean and standard error for 4 replicates.
Tab. 4.2: Two way ANOVA of mushroom yield - experiment 1.
Source of variation % of total variation P value Df F
Infection level 74.41 <0.0001 4 24.39
Supplementation 0.03 0.8533 1 0.035
Interaction 2.69 0.4874 4 0.880
Residual 30
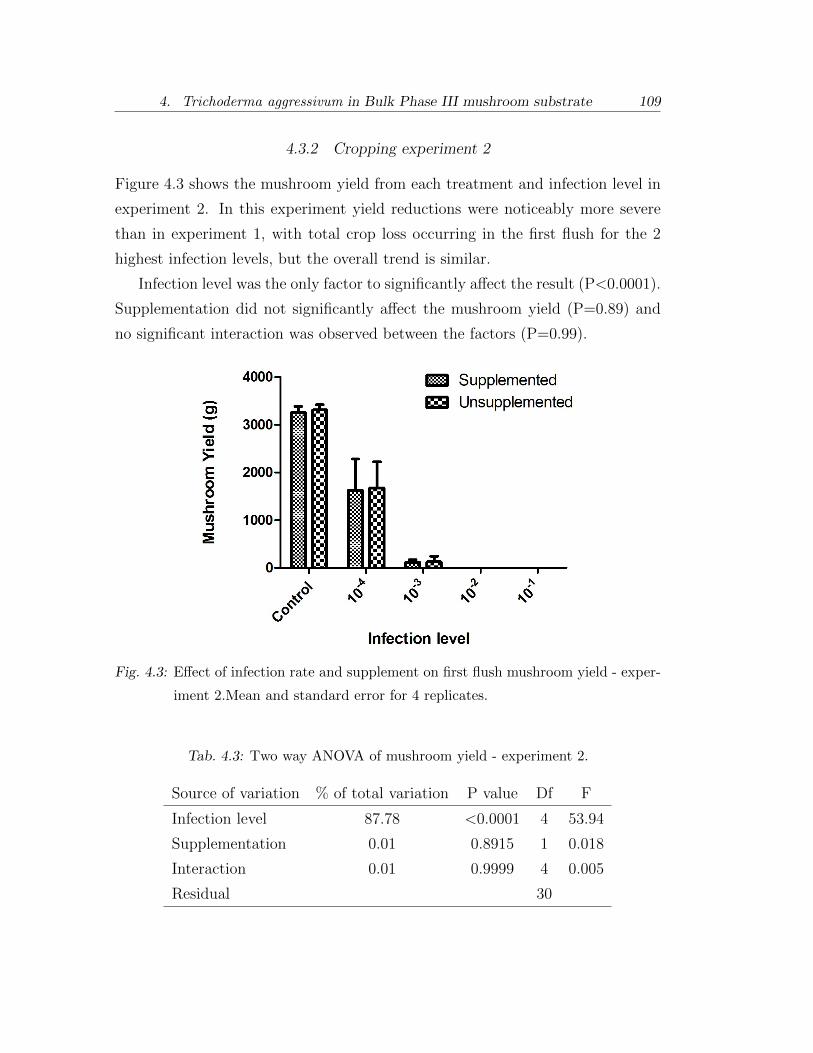
4. Trichoderma aggressivum in Bulk Phase III mushroom substrate 109
4.3.2 Cropping experiment 2
Figure 4.3 shows the mushroom yield from each treatment and infection level in
experiment 2. In this experiment yield reductions were noticeably more severe
than in experiment 1, with total crop loss occurring in the first flush for the 2
highest infection levels, but the overall trend is similar.
Infection level was the only factor to significantly affect the result (P<0.0001).
Supplementation did not significantly affect the mushroom yield (P=0.89) and
no significant interaction was observed between the factors (P=0.99).
Fig. 4.3: Effect of infection rate and supplement on first flush mushroom yield - exper-
iment 2.Mean and standard error for 4 replicates.
Tab. 4.3: Two way ANOVA of mushroom yield - experiment 2.
Source of variation % of total variation P value Df F
Infection level 87.78 <0.0001 4 53.94
Supplementation 0.01 0.8915 1 0.018
Interaction 0.01 0.9999 4 0.005
Residual 30

4. Trichoderma aggressivum in Bulk Phase III mushroom substrate 110
4.3.3 Cropping experiment 3
The first flush mushroom yield from each treatment and infection level are given
in Figure 4.4. Two way ANOVA was performed on the yield data, results are
given in Table 4.4.
In this experiment both factors significantly affected the mushroom yield
(P<0.0001) and there was also a significant interaction between the factors (P=0.0090).
This indicates that the heavy mix treatment had an increasingly more severe im-
pact on yield as the infection level increased.
Figure 4.5 is a composite image of photographs taken of each plot at the
beginning of the third flush of the crop, it also illustrates that the green mould
symptoms and crop reduction are exacerbated in the heavy mix treatment.
Fig. 4.4: Effect of infection level and supplement on first flush mushroom yield - ex-
periment 3. Mean and standard error for 4 replicates.
Tab. 4.4: Two way ANOVA of mushroom yield - experiment 3.
Source of variation % of total variation P value Df F
Infection level 77.21 <0.0001 4 54.46
Mixing 8.92 <0.0001 1 34.48
Interaction 4.91 0.0090 4 8.314
Residual 30

4. Trichoderma aggressivum in Bulk Phase III mushroom substrate 111
Fig. 4.5: Composite image of mushroom growth - experiment 3

4. Trichoderma aggressivum in Bulk Phase III mushroom substrate 112
4.3.4 Comparison of microbiological and molecular methods for quantifying
Trichoderma aggressivum infection level in Bulk Phase III mushroom
substrate
Four methods for the quantification and detection of Trichoderma aggressivum
in Bulk Phase III substrate were compared. The effect of the addition of sup-
plement on the detection methods was not considered, so the results from both
sample sets from experiment 2 were combined. Samples from the unmixed treat-
ment of experiment 3 were not tested, as it was assumed samples would not be
representative.
Tables 4.5 and 4.6 show the qPCR, MPN and DPA results for substrate
samples from cropping experiment 2 and cropping experiment 3, respectively.
Due to the time consuming nature of weed mould analysis this method was only
performed on the 10−2 and 10−4 dilution levels in experiment 2, results are shown
in Table 4.5. DNA extraction and qPCR analysis were carried out by FERA
(York) using SyBr fluorescence detection and primers targeting the TEF-1 gene
sequence, the exact sequence of these primers is not disclosed.
The units for MPN and WMA counts are cfu/g and are log (base 10) trans-
formed. Zero values were given a nominal value of 1 prior to transformation.
Results for qPCR analysis are given in terms of crossing point (Cp), the num-
ber of cycles at which the signal intensity becomes greater than the background.
Co-efficient of variation (CV) for all data was calculated by dividing the sample
mean by the sample standard deviation. Co-efficient of variation for sample sets
with a mean count of zero is denoted with nd because the CV is not defined.
Results were analysed by Pearson’s correlation test. The WMA results were
excluded because there were not enough data points for this type of analysis
but ANOVA analysis showed them to be not significantly different to the MPN
results (P=0.11). Significant correlation was observed between the results of
each detection method and the infection level in both experiments. A negative
correlation was observed for the qPCR analysis and a positive correlation was
observed for the microbiological methods. This is because Cp in qPCR analysis
is inversely proportional to the amount of T. aggressivum target DNA present
in the sample, while microbiological counts are proportional to the amount of T.

4. Trichoderma aggressivum in Bulk Phase III mushroom substrate 113
aggressivum cells present.
A correlation matrix was generated to test the similarity of the response
of each detection method and is shown in Table 4.7. The WMA results were
again excluded due to lack of data points. For samples from experiment 2 qPCR
and DPA results correlated significantly but the results for MPN analysis did
not correlate well with either. This may be as a result of a larger number of
negative results for this method at the 10−3 and 10−4 infection levels, which
was not expected and did not correspond with the results for qPCR or DPA
analysis in this experiment. When samples from experiment 3 were analysed each
detection method gave results which were correlated significantly, indicating that
each detection method responded similarly to T. aggressivum infection level.
Tab. 4.5: Detection of Trichoderma aggressivum in Bulk Phase III mushroom substrate
by qPCR, MPN and DPA - experiment 2.
qPCR MPN DPA WMA
Treatment Mean1 CV Mean2 CV Mean3 CV Mean4 CV
10−1 24 0.04 6.2 0.03 9.4 0.14 - -
10−2 27 0.03 4.8 0.15 6.8 0.42 4.3 0.28
10−3 29 0.04 0.8 0.58 6.8 0.22 - -
10−4 35 0.02 0.0 n/a 1.7 0.61 0.1 0.58
Control 40 0.00 0.0 n/a 0.0 n/a - -
Pearson R -0.98 0.94 0.96 -
R2 0.97 0.88 0.92 -
P value 0.002 0.018 0.009 -
1 Cp, 2 logcfu/g, 3 pieces positive of ten, 4 logcfu/g

4. Trichoderma aggressivum in Bulk Phase III mushroom substrate 114
Tab. 4.6: Detection of Trichoderma aggressivum in Bulk Phase III mushroom substrate
by qPCR, MPN and DPA - experiment 3.
qPCR MPN DPA
Treatment Mean1 CV Mean2 CV Mean3 CV
10−1 28 0.06 6.52 0.11 9.50 0.06
10−2 32 0.05 3.04 0.75 7.50 0.44
10−3 37 0.09 2.55 0.20 2.50 0.52
10−4 40 0.00 0.00 n/a 0.25 2.00
Control 40 0.00 0.00 n/a 0.00 n/a
Pearson R -0.95 0.95 0.96
R2 0.90 0.89 0.92
P value 0.014 0.015 0.009
1 Cp, 2 logcfu/g, 3 pieces positive of ten
Tab. 4.7: Correlation analysis of methods used for the detection of T. aggressivum.
Pearson R P value
qPCR MPN DPA qPCR MPN DPA
qPCR - -0.87 -0.98 - 0.055 0.003
Experiment 2 MPN -0.87 - 0.82 0.055 - 0.092
DPA -0.98 0.82 - 0.003 0.092 -
qPCR - -0.96 -0.99 - 0.010 0.002
Experiment 3 MPN -0.96 - 0.93 0.010 - 0.023
DPA -0.99 0.93 0.002 0.023 -

4. Trichoderma aggressivum in Bulk Phase III mushroom substrate 115
4.4 Discussion
4.4.1 The effect of substrate infection rate, supplementation and mixing on
mushroom yield in Trichoderma aggressivum infected crops
The aim of the presented work was to increase our understanding of how Tricho-
derma aggressivum affects Bulk Phase III production systems if a small volume
of substrate becomes infected at spawning, colonised by T. aggressivum and then
get mixed throughout a larger volume of uninfected Phase III substrate during
bulk handling. It was shown that healthy Bulk Phase III substrate is vulnerable
to infection by T. aggressivum during the bulk handling stage. The severity of
subsequent crop losses is proportional to the quantity of substrate which is in-
fected as well as the T. aggressivum fungal load in the infected substrate and the
degree of mixing. The addition of a supplement at bulk handling was not shown
to affect the severity of T. aggressivum infection.
The more severe impact of T. aggressivum infection in experiment 2 was un-
expected. While the number of T. aggressivum propagules in the inoculum was
higher than in experiment 1 the reduction in mushroom yield was not propor-
tional, in fact the mushroom yield from the least infected plots in this experiment
was on average less than that from the highest infection level in experiment 1.
It was hypothesised that the manner in which the substrate was mixed may
have had a role in exacerbating the action of T. aggressivum. Experiment 3 was
designed to test this hypothesis.
The results of experiment 3 show that a more thorough mixing of infected
and uninfected Phase III substrate results in greater reductions in yield with the
same inoculum. An interaction between the effects of infection level and mixing
on yield was observed. This suggests that mixing exacerbates the effect of T.
aggressivum more significantly the higher the initial infection level.
One hypothetical explanation for these results is that mixing of spawn-run
Bulk Phase III substrate puts Agaricus bisporus under stress, making it more
susceptible to T. aggressivum. Fully spawn run substrate is generally considered
to be less susceptible to diseases, including Trichoderma green mould, due to the
strong presence of A. bisporus mycelium (Seaby, 1987; Rinker, 1997). At the
end of the Phase III process the substrate is very thoroughly colonised by A.

4. Trichoderma aggressivum in Bulk Phase III mushroom substrate 116
bisporus which makes access more difficult for other microbes. However when
Bulk Phase III substrate is bulk handled during tunnel emptying and transport
this may present an opportunity for T. aggressivum to infect the substrate which
does not occur when the substrate is spawn-run in situ. If the ability of A.
bisporus to exclude competitors from the substrate is linked to the integrity of
its mycelium then it is likely that bulk handling and the disruption of the A.
bisporus mycelium might facilitate colonisation by T. aggressivum. It has been
shown that metabolites produced by A. bisporus have a stimulatory effect on
the growth of T. aggressivum (Mumpuni et al., 1998). Breaking the A. bisporus
hyphae in Bulk Phase III substrate may also cause the release of more of these
metabolites, thus stimulating the T. aggressivum to grow, but further study in
this area is required to test this hypothesis.
Another hypothetical explanation is that the transfer of T. aggressivum spores
or mycelium from infected substrate to uninfected substrate due to mixing re-
sults in more rapid colonisation of the substrate by T. aggressivum. Fully infected
substrate exhibits a high load of T. aggressivum propagules per gram, in the or-
der of 108-109, with the majority of these colony-forming-units almost certainly
being conidia rather than hyphae, based on the visible green colouration of the
infected substrate. Spores of T. aggressivum are known to be able to germinate
in mushroom substrate colonised by A. bisporus, but the growth of T. aggres-
sivum is relatively slow in non-sterilised substrate (Largeteau et al., 2000b). It
is possible that mixing results in a lower level of infection across a larger area of
substrate which is then colonised by germinating T. aggressivum spores, resulting
in more severe crop losses. Further study is required to test this hypothesis as
the relative importance of spore germination and mycelial growth in this type of
T. aggressivum infection is not known.
4.4.2 Detection of Trichoderma aggressivum in Bulk Phase III mushroom
substrate
Four methods for the detection and/or enumeration of Trichoderma aggressivum
in mushroom substrate were tested and compared. Three of the methods were
microbiological in nature and culture dependent, one method was a culture inde-
pendent qPCR method.
4. Trichoderma aggressivum in Bulk Phase III mushroom substrate 117
Of the two microbiological counting methods (MPN and WMA) it was de-
termined that there was no significant difference in their ability to enumerate T.
aggressivum in substrate (P=0.11). The MPN method is widely used as an al-
ternative to traditional colony counting methods (Garthright & Blodgett, 2003)
and based on these data is a time-saving alternative to full weed mould anal-
ysis. Both methods returned false negative results at lower infection rates and
displayed increases in the co-efficient of variation as the concentration of infected
substrate decreased. This is likely due to the heterogeneous nature of mushroom
substrate and is discussed below.
The direct plating assay (DPA) is a very simple method of determining
the presence or absence of T. aggressivum in bulk handled Phase III substrate
and also gives an indication of the severity of infection. The number of pieces
of substrate showing growth of T. aggressivum is related to the infection rate
(P<0.0001). However, the co-efficient of variation for this test also increased in
the more dilute the infection levels, similar to the other two growth dependent de-
tection methods. This method had the lowest number of false negative results of
those tested and was the only method to detect T. aggressivum at the lowest level
of infection in Experiment 3 although, only in one sample four. Considering these
factors the direct plating assay represents a surprisingly attractive option for the
detection of Trichoderma in bulk handled Phase III substrate when enumeration
is not essential.
Quantitative PCR was the most technologically advanced method used to enu-
merate T. aggressivum infection in this study. In these experiments this method
was more sensitive than the two microbiological counting methods and could
detect T. aggressivum at the 10−4 level in experiment 2, but returned negative
results at this dilution in experiment 3, where the amount of T. aggressivum in
the inoculum was an order of magnitude lower. The problem of increasing vari-
ation between samples was not observed with qPCR, the co-efficient of variation
remained largely constant, regardless of the dilution level. Quantitative PCR is
the fastest method, results can be obtained on the day of processing, and it allows
direct measurement of T. aggressivum, whereas the other methods are dependent
on subsequent PCR testing for species identification. However, unlike culture
dependent methods this method does not distinguish between living and dead

4. Trichoderma aggressivum in Bulk Phase III mushroom substrate 118
cells and this should be taken into account when interpreting results.
The most significant challenge to the accurate enumeration of T. aggressivum
in Bulk Phase III substrate may be sampling. Each method of T. aggressivum
enumeration other than qPCR showed increasing variability with reduced infec-
tion level, which suggests that the T. aggressivum is not evenly distributed in
the substrate after mixing. Results from the direct plating assay show that there
is a transfer of T. aggressivum between infected and uninfected substrate straws,
but that it is much less efficient than dispersal would be in a liquid medium, for
example. The higher reliability of the qPCR method at low infection levels may
be in part due to the larger sample size processed. The total 100 g of substrate
was tested by qPCR whereas 20 g was used for MPN and WMA and individual
straws are tested using DPA.
Although it was the most sensitive technique using qPCR did not reliably
detect T aggressivum in the lowest infection level in experiment 3, even though
the mean spore load in the substrate was in the order of 104 cfu/g. This is likely
a result of non-homogenous distribution of T. aggressivum infected substrate and
T. aggressivum propagules within the total volume of substrate.
In order to determine the average concentration of cells in a volume of sub-
strate it is necessary to assume that the cells are evenly distributed and equally
likely to be present in any subsample selected randomly from the whole (Gy,
2004a,b,c). It is clear from these results that are inherent problems in obtaining
a representative sample of Bulk Phase III substrate through mixing alone. In the
Bulk Phase III system mixing of spawn-run substrate is undesirable as it damages
the Agaricus bisporus mycelium, so samples taken from an industrial facility are
likely to be of a similarly heterogenous nature to those tested in this work.
Representative sampling is key to the determination of the concentration of a
given species within a population without sampling the entire population. That
is to say, if a sample is taken from any mass of material and subjected to a test
the measurement thereby obtained is only true for the sample tested, and in order
to extrapolate the measurement to the whole mass it is necessary to assume that
the sample contains the exact same constituent as the whole mass, in the same
proportions (Petersen et al., 2004). This assumption is key to any destructive
sampling technique, like those used above, because it is not possible to sample

4. Trichoderma aggressivum in Bulk Phase III mushroom substrate 119
the whole population.
The assumption that a sample is representative is usually valid for liquids since
they can be mixed effectively to produce homogeneous solutions, for many biolog-
ical assays the contribution of sampling error to total error is minimal because the
material tested is naturally homogenous (Esbensen & Heydorn, 2004). Mushroom
substrate is a solid made of large, irregularly shaped particles which makes attain-
ing a representative sample by mixing much more difficult (Petersen et al., 2005).
There is an additional barrier to the sampling of Phase III mushroom substrate,
in that most methods for accurate mass reduction would completely destroy the
A. bisporus mycelium (Thy et al., 2009; Petersen et al., 2005). It is possible
to deal with this sort of problem statistically but it would first be necessary to
estimate the level of heterogeneity in the substrate empirically (Minkkinen, 2004;
Tønning et al., 2006).

5. INTERSPECIFIC MOLECULAR AND CHEMICAL
VARIATION IN TRICHODERMA ISOLATES
5.1 Identification of fungi using PCR
Polymerase chain reaction has become a core process in molecular biology since
it was first described in the 1980s (Mullis et al., 1986), to the extent that the
two terms are practically synonymous. PCR dependent molecular analyses such
as AFLP, RAPD-PCR and comparative sequence analysis are increasingly the
standard methods for differentiating micro-organisms with similar morphological
characteristics (Domig et al., 2003). Comparative sequence analysis of the inter-
nally transcribed spacer region of the rDNA (ITS ribotyping) is a particularly
common tool in the classification of fungi and other microbes (Blanc et al., 1999;
Chen et al., 1999b). The ribosomal DNA is conserved at a genus or higher level,
but the ITS region is relatively variable. This means that the region can be am-
plified using the same set of primers for multiple species and then sequenced to
identify small differences between them (Ospina-Giraldo et al., 1999; Lu et al.,
2000).
If the sequence for the ITS region (or any other gene) displays specific se-
quences which are conserved at species level, but not higher, then PCR using
primers complimentary to those sequences can be used to identify fungal species
directly. Species specific PCR is a rapid and effective method for the detection
and identification of fungal species. Chen et al. (1999a) developed a set of selec-
tive primers for T. aggressivum based on a RAPD product which was observed
in T. aggressivum but not other Trichoderma strains. These primers amplify the
same region of both T. aggressivum subspecies which can be distinguished from
each other by restriction digest of the product, due to a small amount of polymor-
phism within the amplified sequence (Staniaszek et al., 2010). An additional set

5. Interspecific Molecular and Chemical Variation in Trichoderma Isolates 121
of primers for the identification of both T. aggressivum subspecies was developed
at Warwick HRI based on the ITS region (Grogan, pers. comms).
Quantitative real-time PCR allows not only for the detection and identifica-
tion of fungal species, but also estimation of the amount of that species within
a population or sample. In this study, a quantitative real-time PCR assay spe-
cific for T. aggressivum was developed. Different DNA extraction methods were
compared for their suitability for the purification of PCR amplifiable DNA from
Trichoderma cultures and mushroom substrate. Existing species specific primers
were tested for their suitability in qPCR, and novel primer sets were designed
based on sequence analysis of published T. aggressivum genes. The efficiency and
specificity of published and novel T. aggressivum specific primers were compared
using a panel of Trichoderma specimens containing aggressive and non-aggressive
isolates (Table 2.1).
5.1.1 Differentiation of fungi based on secondary metabolite profiles
Secondary metabolites are gene products not directly associated with cell growth
or metabolism, many of which are bioactive molecules such as antibiotics and
toxins (Mukherjee et al., 2012). Fungal species differ in the type, number, and
relative quantity of secondary metabolites they produce (Keller et al., 2005). The
study of secondary metabolite production is described as metabolite profiling, or
metabolomics.
The degree to which the production of secondary metabolites varies between
two fungal species depends on the taxonomic relatedness of the species (Keller
et al., 2005), as a result metabolite profiling can be used as an alternative method
for species classification, this is called chemotaxonomy. Chemotaxonomy has been
applied to Trichoderma classification previously (Kang et al., 2011), producing
similar phylogenetic groupings as molecular analyses. Thrane et al. (2001) and
Kang et al. (2011) showed that Trichoderma agressivum was taxonomically dis-
tinct from Trichoderma harzianum and other related species by LC/MS, GC/MS
and UPLC/Q-TOF-MS. Thrane et al. (2001) described the identification of Tri-
choderma species by comparative analysis of HPLC metabolite profiles, but T.
aggressivum was not included in their study.
In this study comparative analysis of HPLC metabolite profiles was assessed
5. Interspecific Molecular and Chemical Variation in Trichoderma Isolates 122
as a method for the identification T. aggressivum and differentiation of T. aggres-
sivum from non-aggressive Trichoderma species. The use of secondary metabolite
production to identify T. aggressivum is attractive because secondary metabolites
produced by T. aggressivum are known be antagonistic towardf Agaricus bisporus
(Krupke et al., 2003) and as such metabolite profile may be a good indicator of
the mushroom-aggressive phenotype.
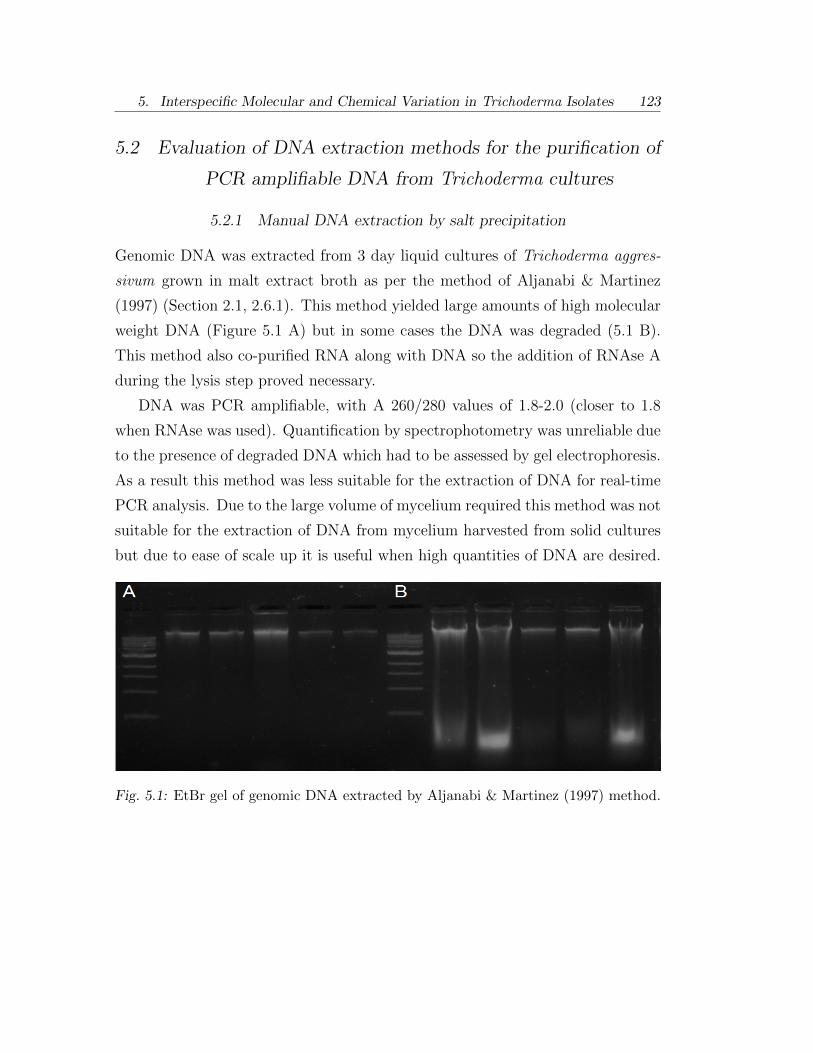
5. Interspecific Molecular and Chemical Variation in Trichoderma Isolates 123
5.2 Evaluation of DNA extraction methods for the purification of
PCR amplifiable DNA from Trichoderma cultures
5.2.1 Manual DNA extraction by salt precipitation
Genomic DNA was extracted from 3 day liquid cultures of Trichoderma aggres-
sivum grown in malt extract broth as per the method of Aljanabi & Martinez
(1997) (Section 2.1, 2.6.1). This method yielded large amounts of high molecular
weight DNA (Figure 5.1 A) but in some cases the DNA was degraded (5.1 B).
This method also co-purified RNA along with DNA so the addition of RNAse A
during the lysis step proved necessary.
DNA was PCR amplifiable, with A 260/280 values of 1.8-2.0 (closer to 1.8
when RNAse was used). Quantification by spectrophotometry was unreliable due
to the presence of degraded DNA which had to be assessed by gel electrophoresis.
As a result this method was less suitable for the extraction of DNA for real-time
PCR analysis. Due to the large volume of mycelium required this method was not
suitable for the extraction of DNA from mycelium harvested from solid cultures
but due to ease of scale up it is useful when high quantities of DNA are desired.
Fig. 5.1: EtBr gel of genomic DNA extracted by Aljanabi & Martinez (1997) method.

5. Interspecific Molecular and Chemical Variation in Trichoderma Isolates 124
5.2.2 DNA extraction with Qiagen Plant DNeasy spin kit ®
DNA was extracted from 3 day liquid cultures of Trichoderma aggressivum grown
in malt extract broth (Section 2.1, 2.6.1). This method yielded high molecular
weight DNA with little break-down visible by gel electrophoresis (Figure 5.2 A).
DNA concentration and purity, as determined by NanoDrop spectrophotometry,
were high although the A 260/230 ratio was variable due to impurities absorbing
at 230 nm. Carbohydrate based contaminants are the most common which absorb
at this wavelength and they do not interfere with PCR.
This method was also used for the extraction of DNA from lyophilised Bulk
Phase III mushroom substrate but yielded no DNA (Figure 5.2 B).
Fig. 5.2: DNA extract by Qiagen Plant Genomic method from T. aggressivum
mycelium (A) and colonised Bulk Phase III mushroom substrate (B).

5. Interspecific Molecular and Chemical Variation in Trichoderma Isolates 125
5.2.3 DNA extraction with Sigma Plant Genomic DNA extraction kit ®
DNA was extracted from 3 day liquid cultures of T.aggressivum grown in malt
extract broth and 3 day solid cultures grown on malt extract agar using meth-
ods described in Sections 2.1 and 2.6.1. This method produced high molecular
weight DNA with no visible degradation (Figure 5.3 A). DNA concentration was
generally lower for solid cultures than liquid cultures but was still acceptable.
RNA contamination was rare but the addition of RNAse A to the lysis buffer
removed RNA completely. NanoDrop spectrophotometry showed the DNA to
have an A 260/280 ratio within the range of pure DNA (1.8-1.9). Carbohydrate
contamination was present as for the Qiagen kit but it did not interfere with
PCR.
This method was also used for the extraction of DNA from lyophilised Bulk
Phase III mushroom substrate. A small amount of DNA was obtained (Figure
5.3 B) which was amplified by standard PCR using T. aggressivum selective
primers. No product was observed after amplification suggesting that template
concentration was too low or PCR inhibitors were co-purified with the DNA
(Figure 5.3 C).
Fig. 5.3: DNA extract by Sigma Plant Genomic method from T. aggressivum mycelium
(A), colonised Bulk Phase III mushroom substrate (B) and PCR product of
mushroom substrate extract (C).

5. Interspecific Molecular and Chemical Variation in Trichoderma Isolates 126
5.2.4 DNA extraction with Promega Wizard Magnetic Food DNA extraction
kit
DNA was extracted from Trichoderma mycelium and spore suspensions of T.
aggressivum using methods described in Sections 2.1 and 2.6.1. Extraction from
mycelium yielded high molecular weight DNA with little to or break-down prod-
uct. The A 260/280 ratio was high in some cases but this can occur due to the
presence of a small number of magnetic beads in the purified sample. No RNA
contamination was observed on gel electrophoresis (Figure 5.4 A). Extraction
from spore suspension yielded no DNA (Figure 5.4 B).
Fig. 5.4: DNA extract by Promega Magnetic method from T. aggressivum mycelium
(A) and spore suspension (B)
.

5. Interspecific Molecular and Chemical Variation in Trichoderma Isolates 127
5.2.5 DNA extraction with Chemagen Chemagic Food DNA extraction kit
DNA was extracted from Trichoderma aggressivum mycelium, spore suspensions
and lyophilised Bulk Phase III mushroom substrate. Extraction from mycelium
yielded high molecular weight DNA with a small amount of breakdown product.
Extraction from a spore suspension yielded no DNA. Extraction from Bulk Phase
III mushroom substrate yielded DNA which was heavily degraded and contained
a high level of impurities (Figure 5.5).
Fig. 5.5: DNA extract by Chemagen Magnetic method from T. aggressivum spore sus-
pension (Left) and colonised Bulk Phase III mushroom substrate (Right).

5. Interspecific Molecular and Chemical Variation in Trichoderma Isolates 128
5.2.6 DNA extraction with ZR Fungal/ Bacterial DNA extraction kit
DNA was extracted from Trichoderma aggressivum mycelium grown in liquid
culture and ground in liquid nitrogen. This method yielded high concentrations
of high molecular weight DNA with no visible breakdown or RNA contamination
(Figure 5.6). The purity of DNA obtained with this method was high (A260/280
∼ 1.80) and no carbohydrate contamination was observed by spectrophotometry.
Fig. 5.6: EtBr gel of Genomic DNA extracted with ZR Fungal/ Bacterial DNA extrac-
tion kit

5. Interspecific Molecular and Chemical Variation in Trichoderma Isolates 129
5.2.7 Summary
DNA extraction procedures were assessed for their suitability for use with T.
aggressivum. They included one manual method, 3 column based commercial
kits and 2 magnetic-bead based commercial kits.
The manual method had the advantage of being able to process a large amount
of material but it was the most time consuming method and produced DNA which
was sheared in some cases. This method is suitable when a large quantity of DNA
is required and integrity is not essential.
The three column based kits were less time-consuming and yielded higher
integrity DNA. The Sigma and ZR kits produced DNA of higher integrity than
the Qiagen kit. The Sigma extraction kit allowed extraction of DNA from solid
cultures, which was the most convenient method for rapid species identification.
The ZR kit was the fastest column based method and produced the highest
concentration of DNA, making it more suitable for DNA intensive down-stream
processes.
The magnetic-bead based extraction methods were the least time consum-
ing, with the Promega kit allowing slightly faster sample processing than the
Chemagen kit. When DNA was extracted from mycelium grown in liquid culture
both methods yielded decent quantities of DNA, but the Chemagen kit produced
DNA which was degraded to some extent. Since the lysis step for neither kit re-
lies on mechanical disruption they were tested from their ability to extract DNA
from liquid suspensions of T. aggressivum spores, but neither yielded workable
amounts of DNA from this sample type.
Three methods were tested for their suitability in extracting DNA from Bulk
Phase III mushroom substrate, but none was successful. The Qiagen kit yielded
no quantifiable amount of DNA from this sample type. The Sigma kit yielded
a very small quantity of DNA which was of high molecular weight, but also
co-purified PCR inhibitors from the substrate which prevented down-stream pro-
cessing of the DNA. The Chemagen kit successfully extracted some DNA from
the substrate but it was heavily degraded and contained a high level of impurities,
rendering it unsuitable for PCR.

5. Interspecific Molecular and Chemical Variation in Trichoderma Isolates 130
5.3 Sequence analysis and novel selective primers
All available gene sequences for T. aggressivum were retrieved from GenBank
(http://www.ncbi.nlm.nih.gov/genbank/). A nucleotide BLAST search was per-
formed for each of these genes to determine the degree of sequence conservation
with other species. The translation elongation factor 1 alpha (tef1) gene was se-
lected based on its greater degree of sequence divergence with other Trichoderma
species and published material (Samuels et al., 2002; Komon-Zelazowska et al.,
2007; Kredics et al., 2009; B laszczyk et al., 2011). Other genes considered for
primer design were ITS-1, ITS-2, RNA polymerase II subunit and calmodulin.
A high similarity MegaBLAST search of the GenBank Nucleotide (nr/nt)
database using the tef 1 gene as the query sequence reveals varying degrees
of sequence homology with other Trichoderma isolates (Figure 5.8, 5.7). The
most similar sequences are those from other T. aggressivum f. europaeum strains
followed by T. aggressivum f. aggressivum, Trichoderma harzianum and other
related species.
Blast alignment of the tef1 gene from Trichoderma aggressivum f. europaeum
strains CBS 100526 and CBS 433.95 (accession numbers AF348096.1 and AF348097.1,
respectively) showed them to be identical sequences. Primers were designed using
the tef1 sequence from CBS 100526 (Fig 5.1).
Tab. 5.1: Nucleotide sequence of tef1 gene from T. aggressivum strain CBS 100526
CBS 100526 tef1
1 ctaccagtgc ggtggtatcg acaagcgtac catcgagaag ttcgagaagg taagcgccaa
61 ctgactttcg cctcgattct ccctccacat ccaattgtgc tcgatcattc tgaagagaat
121 tgtcgacaat ttttcatcac cccgctttcc attacccctc ctttgcagcg acacaagatt
181 ttttttgctg tcgtttggtt ttagtggggt tccttgtgca cccccactag ctcactgctt
241 tttttttgtg cttcactatc actacccagc cgtcgttcaa cgtgctctgt ctctcgtcat
301 ccagtgatgc taaccacttt ttccatcaat aggaagccgc cgaactcggc aagggttcct
361 tcaagtacgc ttgggttctt gacaagctca aggccgagcg tgagcgtggt atcaccatcg
421 acattgccct ctggaagttc gagactccca agtactatgt caccgtcatt ggtatgtctc
481 cttcatcacc ccgatgcagc aattacaagc cagtgctaac aggcaattca cagacgctcc
541 cggccaccgt gattttatca agaacatgat cactggtact tcccaggccg attgcgctat
601 cctcatcatt gccgccggta ctggtgag
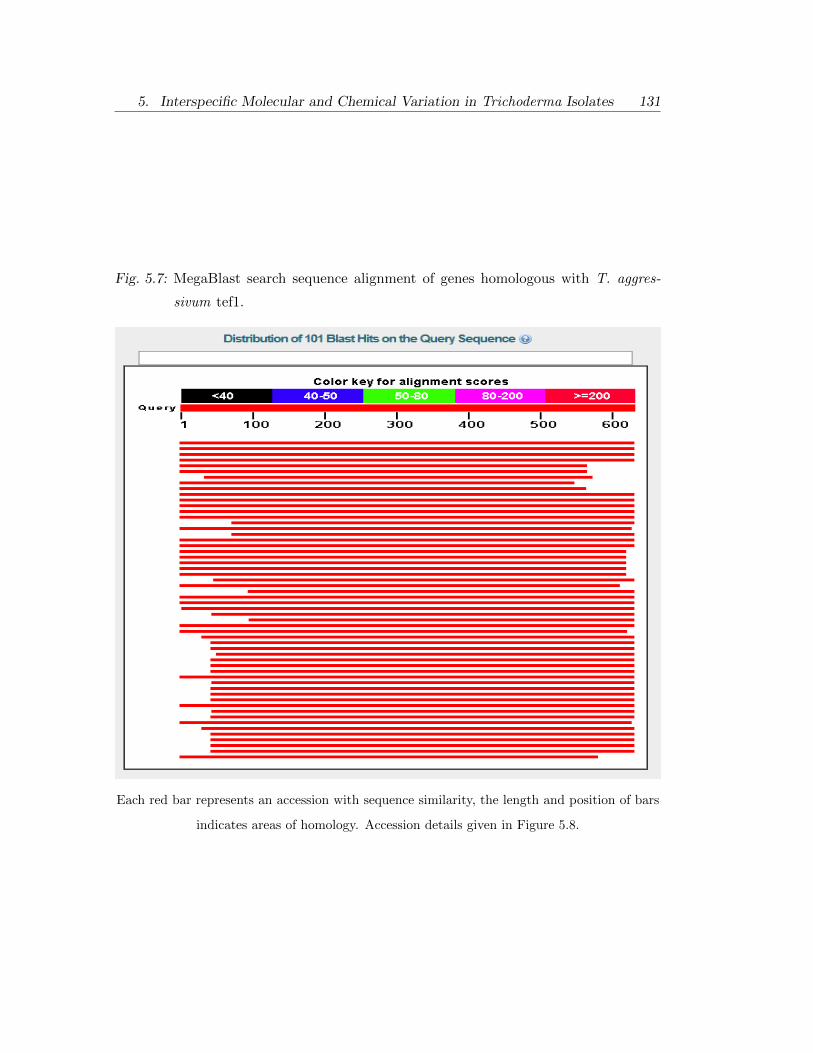
5. Interspecific Molecular and Chemical Variation in Trichoderma Isolates 131
Fig. 5.7: MegaBlast search sequence alignment of genes homologous with T. aggres-
sivum tef1.
Each red bar represents an accession with sequence similarity, the length and position of bars
indicates areas of homology. Accession details given in Figure 5.8.

5. Interspecific Molecular and Chemical Variation in Trichoderma Isolates 132
Fig. 5.8: Sequences aligning with T. aggressivum tef1 query sequence.
Figure shows 33 most similar sequences (of 101). Alignment shown in Figure 5.7.

5. Interspecific Molecular and Chemical Variation in Trichoderma Isolates 133
PrimerQuest software (http://eu.idtdna.com/Scitools/Applications/Primerquest)
was used to design specific primers based on the tef1 sequence. Primers were
designed with the desired parameters of amplicon length 100-150 bp, primer
length 20-25 bp, melting temperature 55-60 ℃, no secondary structure, no self-
complementary regions and primer pair melting temperatures not to differ by
more than 1.5 ℃. The designed primers were named according to the first com-
plementary base in the target sequence and are listed in Table 2.7.
Primer specificity was assessed in silico by performing a BLAST search using
the primer base sequence as the query sequence. The first five results for each
primer, their coverage and identity are summarised in Table 5.2.
The specificity of these primers for T. aggressivum according to in silico anal-
ysis is good, apart from reverse primer 199, which shows a high degree of speci-
ficity for Trichoderma harzianum also. The relative discriminatory ability of the
primers is tested in vitro in Section 5.3.3.
5.3.1 Primer efficiency and standard curves
Genomic DNA was extracted from T. aggressivum strain CBS 100526 using the
Promega Wizard Magnetic kit and DNA concentration was calculated by spec-
trophotometry using methods described in Sections 2.6.1 and 2.6.4. A four-fold
dilution series was prepared from 4.00 ng/ µl to 9.76 fg/ µl and qPCR was carried
out in triplicate as per (Section 2.6.8).
Crossing point (Cp) values for each concentration with each set of primers
was determined using the 2nd derivative max method. Standard curves and
efficiencies were calculated automatically using the Roche Lightcycler software
and are presented in Figure 5.9.
Amplifications efficiencies were 2.19, 1.97, 2.17, 1.93 and 2.00 for primer sets
41+180, 43+199, 44+199, THF+THR and 18SInt+THI Int rev, respectively.
Each standard curve had an error value below the accepted 0.2.
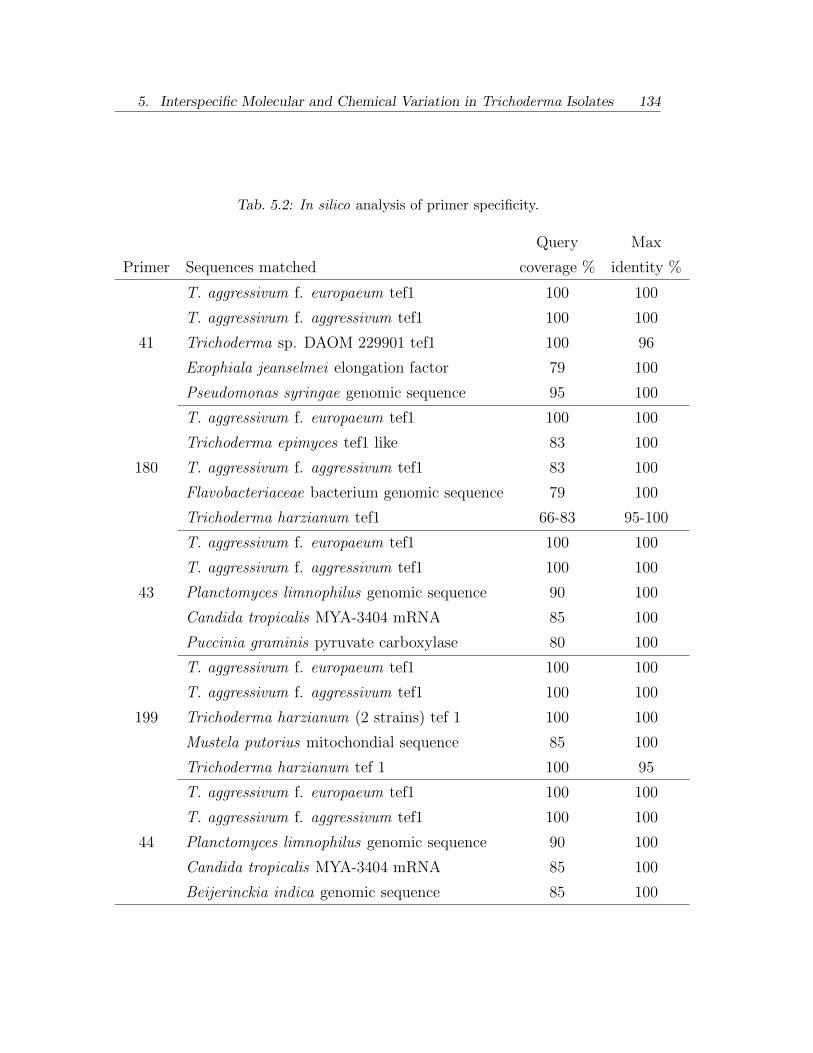
5. Interspecific Molecular and Chemical Variation in Trichoderma Isolates 134
Tab. 5.2: In silico analysis of primer specificity.
Query Max
Primer Sequences matched coverage % identity %
T. aggressivum f. europaeum tef1 100 100
T. aggressivum f. aggressivum tef1 100 100
41 Trichoderma sp. DAOM 229901 tef1 100 96
Exophiala jeanselmei elongation factor 79 100
Pseudomonas syringae genomic sequence 95 100
T. aggressivum f. europaeum tef1 100 100
Trichoderma epimyces tef1 like 83 100
180 T. aggressivum f. aggressivum tef1 83 100
Flavobacteriaceae bacterium genomic sequence 79 100
Trichoderma harzianum tef1 66-83 95-100
T. aggressivum f. europaeum tef1 100 100
T. aggressivum f. aggressivum tef1 100 100
43 Planctomyces limnophilus genomic sequence 90 100
Candida tropicalis MYA-3404 mRNA 85 100
Puccinia graminis pyruvate carboxylase 80 100
T. aggressivum f. europaeum tef1 100 100
T. aggressivum f. aggressivum tef1 100 100
199 Trichoderma harzianum (2 strains) tef 1 100 100
Mustela putorius mitochondial sequence 85 100
Trichoderma harzianum tef 1 100 95
T. aggressivum f. europaeum tef1 100 100
T. aggressivum f. aggressivum tef1 100 100
44 Planctomyces limnophilus genomic sequence 90 100
Candida tropicalis MYA-3404 mRNA 85 100
Beijerinckia indica genomic sequence 85 100

5. Interspecific Molecular and Chemical Variation in Trichoderma Isolates 135
Fig
.5.
9:S
tan
dar
dcu
rves
ofT.aggressivum
DN
Aam
pli
fied
wit
hn
ovel
and
exis
tin
gp
rim
ers

5. Interspecific Molecular and Chemical Variation in Trichoderma Isolates 136
5.3.2 Melt curve analysis
After amplification, melt curve analysis was performed on PCR products from
Section 5.3.1 to assess the specificity of the PCR reaction. This analysis works by
heating the PCR product until it becomes fully single stranded and SyBr fluores-
cence is removed. Non-specific PCR products can be discriminated from specific
products on the basis of melting temperature, since the melting temperature of
an oligonucleotide depends on base sequence.
Melt curves were transformed by differentiation to produce melting peaks,
which displays a peak at the temperature at which half of the DNA molecules in
the sample have become single stranded (Tm). Melting peaks for the products
of each primer set are shown in Figure 5.10.
Primer set 18SInt+THI Int rev shows an irregular melt curve. DNA elec-
trophoresis of this product did not show multiple bands so the unusual melt
curve was attributed to the large size of the amplicon generated (∼ 800 bp).
Amplicon sizes greater than 200 bp are generally considered unsuitable for real-
time PCR, partially because a large amplicon does not become single stranded
rapidly across a narrow temperature range, instead regions of the amplicon can
become single stranded at a range of different temperatures according to local CG
content. Melt curve analysis cannot be reliably performed on primers with large
amplicon size and the reaction specificity cannot be determined directly from the
results of real-time PCR. Because of the large amplicon size produced by primer
set 18SInt+ThI Int rev they were excluded from further real-time PCR analysis.
Primer set ThF+ThR amplify an arbitrary 444 bp section of the T. aggres-
sivum genome. The melting peaks for these primers show the PCR product
melting in two stages. The majority of the DNA becomes single stranded at ∼85 ℃ with a smaller overlapping melt peak at ∼ 83 ℃. This makes these primers
unsuitable for more advanced melt curve analysis, such as Melt-Curve genotyp-
ing or sequence differentiation by Tm calling, but the melt curve is probably
characteristic enough to allow these primers to be used for basic real-time PCR.
The novel primers used in this study were designed specifically for real-time
PCR and produce amplicons <150 bp in length for effective melt-curve analysis.
No non-specific melt peaks were observed for any of the of the novel primer sets

5. Interspecific Molecular and Chemical Variation in Trichoderma Isolates 137
and the melting curves were all of the expected shape. There was a slight increase
in amplicon melting temperature with decreasing DNA template concentration,
but this may occur ordinarily when this type of analysis is performed on serially
diluted template (Filion et al., 2003).
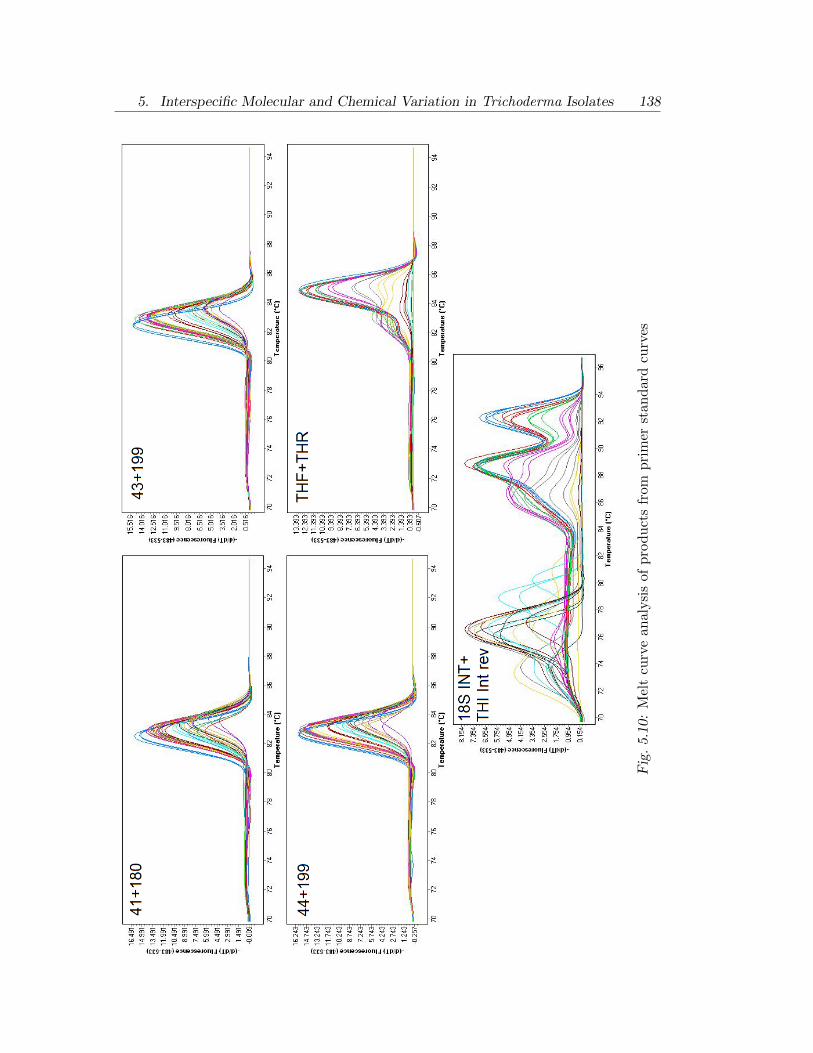
5. Interspecific Molecular and Chemical Variation in Trichoderma Isolates 138
Fig
.5.
10:
Mel
tcu
rve
anal
ysi
sof
pro
du
cts
from
pri
mer
stan
dar
dcu
rves

5. Interspecific Molecular and Chemical Variation in Trichoderma Isolates 139
5.3.3 Comparison of novel and existing primers for differentiating Trichoderma
isolates
DNA was extracted from 15 Trichoderma isolates using the Promega Wizard
magnetic kit (Section 2.6.1) and DNA concentration was adjusted to 1 ng/ µl.
Each of these isolates is a Trichoderma harzianum-like strain which was found
growing on or near mushroom substrate and which were identified based on mor-
phology and/or PCR. Species are listed in Table 2.1. For each isolate 4 µl was
used as template for real-time PCR analysis (Section 2.6.8). PCR was carried
out in duplicate for 4 sets of primers with the annealing temperature adjusted
to the optimum for each primer set. Following amplification Melt curve and Tm
calling analysis were carried out on the PCR product.
The Cp values for each combination of primer set and isolate were calculated
by the second derivative max method and are listed in Table 5.3. Average Cp
values were subtracted from 30 (the total cycle number) to give a measure of the
reactivity of each primer with each template (Cp’) shown in Figure 5.11.
Each primer set positively identified all of the Trichoderma aggressivum iso-
lates in the reference group except for isolate FM 11, which was only amplified by
the primer set 41+180. Novel primers gave faster reactivity than those of Chen
et al. (1999a), possibly because the copy number of the tef1 gene is higher in T.
aggressivum than the arbitrary sequence targeted with these primers.
Primers ThF+ThR were the most selective and displayed no reactivity with
any non-aggressive isolates. Primers 41+180 showed additional reactivity with
two Trichoderma harzianum isolates and two Trichoderma sp. isolates, although
reactivity with isolate 433 was weak. Primers 43+199 were strongly reactive
with one Trichoderma atroviride isolate tested and weakly reactive with one T.
harzianum and one Trichoderma sp. isolate. Of the novel primers set 44+199
gave results most similar to those of Chen et al. (1999a). These primers were
reactive with the same isolates as primers ThF+ThR but also showed a very low
level of reactivity with one T. harzianum isolate.

5. Interspecific Molecular and Chemical Variation in Trichoderma Isolates 140
Tab. 5.3: Validation of novel and existing primers for identification of T. aggressivum
isolates using real-time PCR.
Cycle crossing point (Cp)
Isolate* 41+180 43+199 44+199 ThF+ThR
10052619.31 18.67 18.58 24.26
19.20 18.88 18.59 24.29
FM 219.79 27.48 29.08 30.00
19.60 27.33 29.43 30.00
FM 530.00 30.00 30.00 30.00
30.00 30.00 30.00 30.00
FM 1119.20 30.00 30.00 30.00
19.15 30.00 30.00 30.00
FM 1820.51 20.33 19.87 24.31
20.63 20.18 20.28 25.20
K36330.00 30.00 30.00 30.00
30.00 30.00 30.00 30.00
K38718.83 19.17 19.16 23.70
20.18 19.04 19.00 25.20
K41720.47 19.77 19.69 23.12
20.67 19.85 19.69 23.87
K51630.00 30.00 30.00 30.00
30.00 30.00 30.00 30.00
K51730.00 30.00 30.00 30.00
30.00 30.00 30.00 30.00
T. atro30.00 19.77 30.00 30.00
30.00 19.85 30.00 30.00
35530.00 30.00 30.00 30.00
30.00 30.00 30.00 30.00
41321.05 28.03 30.00 30.00
21.26 28.25 30.00 30.00
43327.13 30.00 30.00 30.00
26.88 30.00 30.00 30.00
43018.87 30.00 30.00 30.00
17.86 30.00 30.00 30.00
Blank30.00 30.00 30.00 30.00
30.00 30.00 30.00 30.00
*Species listed in Table 2.1.

5. Interspecific Molecular and Chemical Variation in Trichoderma Isolates 141
Fig. 5.11: Reactivity of novel and existing primers with Trichoderma isolates.

5. Interspecific Molecular and Chemical Variation in Trichoderma Isolates 142
5.4 Differentiation of Trichoderma isolates using HPLC
metabolite profiling
5.4.1 Optimisation of elution protocol
The initial HPLC elution protocol was based on a standard 30 minute cycle with
an equilibration period using 5 % acetonitrile in the mobile phase followed by
a linear gradient increasing from 5 % to 100 % acetonitrile with a hold step at
100 % to fully rinse the column and 10 minutes post run re-equilibration with 5
% acetonitrile. After running several Trichoderma extracts it was observed that
there was a lag-phase after all the water soluble components were eluted followed
by a large number of peaks with poor resolution between 5 and 10 minutes as
the acetonitrile concentration increased from 20 % to 80 % (Figure 5.12). Few
peaks were observed eluting at between 80 % and 100 % acetonitrile or during
the ramp down period back to 5 % acetonitrile.
Gradients were modified for use with Trichoderma extracts by reducing the
time between 5 % and 20 % to one minute. The gradient between 20 % and 80
% was prolonged to 19 minutes. The post run re-equilibration step was replaced
with a 5 minute in-run re-equilibration step with detection on. Optimisation
led to improved peak resolution in the busy areas of the chromatogram and the
detection of more hydrophobic products in the latter stages of elution (Figure
5.13).
5.4.2 Metabolite profiles of Trichoderma isolates grown on different media
HPLC analysis was performed on plugs taken from Trichoderma isolates grown
on MEA (Section 2.7.4, 2.7.5). Metabolite profiles of each isolate were compared
to that of CBS 100526 as per Section 2.7.6, results are presented in Table 5.4
(Column A).
The correlation of the profiles of CBS 100526 and CBS 433.95 was good (0.96)
but a high degree of correlation was observed with each other isolate tested. Other
than isolate 355 (a Trichoderma atroviride isolate) every profile obtained from
Trichoderma isolates grown on MEA showed a correlation co-efficient of 0.9 or
greater with that of CBS 100526.

5. Interspecific Molecular and Chemical Variation in Trichoderma Isolates 143
Fig. 5.12: HPLC chromatogram of Trichoderma metabolites using standard HPLC
Method (Abs 254 nm).
Fig. 5.13: HPLC chromatogram of Trichoderma metabolites using modified HPLC
Method (Abs 254 nm).
It was decided to replace the standard malt extract media with a synthetic
medium using 1 % glucose as carbon source (Section 2.1.1). Extracts were pre-
pared and analysed by HPLC and spectra were prepared as before. Results are
presented in Table 5.4 (Column B). A better differentiation of isolates was ob-
served using synthetic medium compared to malt extract. The similarity of each
profile to that of CBS 100526 was reduced, representing a greater variety in the
secondary metabolites being observed from isolates grown in this medium. The
similarity of other T. aggressivum isolates tested was decreased, but to a less
extent than for other isolates.

5. Interspecific Molecular and Chemical Variation in Trichoderma Isolates 144
Tab. 5.4: Cophenetic correlation of metabolite profiles from Trichoderma isolates.
Correlation
Strain Classification A B C
100526 Trichoderma aggressivum - - 0.98
433.95 Trichoderma aggressivum 0.97 0.94 0.97
FM18 Trichoderma aggressivum 0.97 0.93 0.92
K387 Trichoderma aggressivum 0.96 0.92 0.93
FM2 Trichoderma harzianum 0.95 0.85 0.69
FM5 Trichoderma harzianum 0.98 0.88 0.84
430 Trichoderma harzianum 0.94 0.90 0.91
355 Trichoderma atroviride 0.88 0.68 0.66
K363 Trichoderma sp 0.97 0.72 0.73
K516 Trichoderma sp 0.97 0.90 0.84
K517 Trichoderma sp 0.97 0.89 0.84
A - Correlation of metabolite profile of isolates grown on MEA with CBS 100526
metabolite profile. B - Correlation of metabolite profile of isolates grown on
TMM with CBS 100526 metabolite profile. C - Correlation of metabolite profile
of isolates grown on TMM with composite profile of CBS 100526 and CBS 433.95.

5. Interspecific Molecular and Chemical Variation in Trichoderma Isolates 145
5.4.3 Comparison of Trichoderma metabolite profiles to a Trichoderma
aggressivum reference profile
A reference chromatogram for Trichoderma aggressivum was prepared by com-
bining the profiles of CBS 100526 and CBS 433.95 grown in TMM using COWtool
software. This profile was then compared with that of other Trichoderma iso-
lates as a means of determining their similarity to T. aggressivum. Results are
presented in Table 5.4 (Column C).
This method gave the best resolution of isolates. The similarity of each Tri-
choderma isolate other than Trichoderma harzianum 430 dropped below 0.90.
The correlation of metabolite profiles of T. aggressivum with the reference chro-
matogram was in the range 0.92-0.98.

5. Interspecific Molecular and Chemical Variation in Trichoderma Isolates 146
Fig
.5.
14:
Ref
eren
cem
etab
olit
ep
rofi
lefo
rTrichodermaaggressivum
.

5. Interspecific Molecular and Chemical Variation in Trichoderma Isolates 147
5.5 Discussion
5.5.1 DNA extraction methods
Species specific PCR amplification is the current standard method for the iden-
tification of Trichoderma aggressivum. Accurate PCR identification depends on
effective DNA extraction methods and selective primers.
In this study methods for the isolation and purification of T. aggressivum
DNA from a variety of sample types were assessed. For cultured T. aggressivum
mycelium DNA extraction is relatively simple and several methods proved satis-
factory. Of the methods which yielded good quality DNA from mycelial samples
the Promega Wizard Magnetic DNA extraction kit was the least, while the ZR
fungal/bacterial extraction kit provided highest concentration of DNA. Either of
these methods is ideally suited for the purification of DNA from Trichoderma
cultures to test by PCR.
Obtaining DNA from T. aggressivum spores and colonised mushroom sub-
strate proved to be more difficult. Most of the methods tested relied on mechani-
cal disruption with liquid nitrogen for complete cell lysis, this is not possible with
liquid spore suspensions. Two methods were tested which used chemical lysis but
neither produced quantifiable amounts of DNA from T. aggressivum spore. This
may be because the conidia were too resilient to chemical lysis or the amount
of DNA released from spores was too low to yield a useful concentration after
extraction.
None of the DNA extraction methods tested proved suitable for the extraction
of DNA from Bulk Phase III mushroom substrate. Obtaining PCR quality DNA
from Bulk Phase III mushroom substrate poses several unique problems. In
mushroom substrate T. aggressivum may be present in low abundance or as
spores which are difficult to lyse. The fibrous nature of mushroom substrate
creates difficulties with several common methods of mechanical disruption, and
may trap DNA, reducing yields. During lysis the substrate tends to remain
particulate, which interferes with filtration and centrifugation steps. The final
barrier to the extraction of PCR amplifiable DNA from mushroom substrate is
the presence of PCR inhibitors, such as humic acid.
Humic acids are breakdown product of organic matter, produced by Maillard

5. Interspecific Molecular and Chemical Variation in Trichoderma Isolates 148
reaction (Jokic et al., 2001). Due to their chemical similarity and binding affinity
for each-other DNA and humic acids are co-purified by most DNA extraction
methods (Crecchio & Stotzky, 1998; Allard, 2006). The presence of humic acids
in a DNA sample prevent accurate quantification by spectrometry (Zipper, 2003)
and may cause DNA degradation (Alaeddini, 2012). They are potent inhibitors
of PCR and many other DNA manipulation procedures, concentrations as low as
8 pg/µl can prevent PCR (Tebbe & Vahjen, 1993). Humic acid contamination is
a common problem in soil molecular biology (Ma & Michailides, 2007). Organic
composts contain a significantly higher amount of humic substances than most
soils (Howeler et al., 2003), spent mushroom substrate can contain humic acid
concentrations accounting for up to 35 % of all organic carbon (Paredes & Medina,
2009) as well as a high level of phenolic substances (Iiyama et al., 1994), which
also interfere with PCR (Ma & Michailides, 2007).
An effective extraction method for the purification of PCR amplifiable DNA
from Bulk Phase III mushroom substrate is desirable for the direct quantification
of T. aggressivum by PCR, but at present none has been published. There are
several complicating factors unique to this type of extraction and a successful
DNA extraction method must eliminate all of them, without over-manipulating
or diluting the DNA to the extent that it becomes unusable. A reasonably short
sample preparation time would also be advantageous, so that large sample sets
can be analysed. There are several commercially available kits for the purification
of DNA from soil, stool samples, and other humic acid rich sources and several
published methods make use of these kits for the extraction of DNA from soil
(Filion et al., 2003; Hagn et al., 2007) and compost (Reuter et al., 2009) but
without any information on their use with mushroom substrate it is difficult
to assess how they would perform. Chemical and physical variation between
different soil types and green compost is commonly enough to warrant adjustment
of DNA extraction procedures, and mushroom substrate is considerably different
from either.
There are several published methods for the extraction of DNA from com-
post and soil which make use of two stage extractions to purify DNA and elimi-
nate PCR inhibitors separately. Such techniques as pre-lysis washing (He et al.,
2005; Hagn et al., 2007), cell separation by differential centrifugation (Ma &

5. Interspecific Molecular and Chemical Variation in Trichoderma Isolates 149
Michailides, 2007), agarose gel electrophoresis (LaMontagne et al., 2002) and re-
peated purification steps in C-TAB (Blanc et al., 1999) or chloroform-isoamyl
alcohol (Howeler et al., 2003), which may be useful in the extraction of DNA
from mushroom substrate.
5.5.2 Identification of Trichoderma aggressivum by real-time PCR
A method for the identification of Trichoderma aggressivum with real-time PCR
was developed. Real-time PCR has several advantages over end-point PCR such
as speed, sensitivity, reduced risk of cross-contamination, high through-put, and
quantitation (Klein, 2002). In real-time PCR analysis the point at which the
fluorescence of the amplicon crosses the noise baseline (Cp) is calculated, this
gives an indication of the copy number of the target DNA present which can be
used to directly estimate the biomass of the organism from which the DNA was
amplified (Lopez-Mondejar et al., 2010).
The use of PCR with species specific primers is the most common method
for the identification of T. aggressivum. There is no published information on
the use of real-time PCR for this procedure. Primers used for real-time must
meet certain criteria which are not necessary for standard PCR. Real-time PCR
primers are recommended to have a GC content of 40-60 %, amplicon length of
100-200 bp and annealing temperatures for forward and reverse primers which are
within 1 ℃. Existing species selective primers for T. aggressivum did not meet
all of these criteria so novel primers were designed.
To select a suitable target gene for primer design all available sequence in-
formation for T. aggressivum in GenBank was surveyed. Based on a BLAST
similarity search the tef1 gene was determined to be the least conserved among
closely related Trichoderma species and therefore the most suitable target for
selective primers. Due to the 99 % sequence similarity between the tef1 gene in
T. aggressivum f. europaeum and T. aggressivum f. aggressivum it was not pos-
sible to create primers which would differentiate the two subspecies. At present
both subspecies are geographically isolated and so subspecies can be assigned
presumptively, based on origin, but for future epidemiological studies it may be
desirable to develop subspecies selective primers, to assess whether there is any
overlap between the two populations.
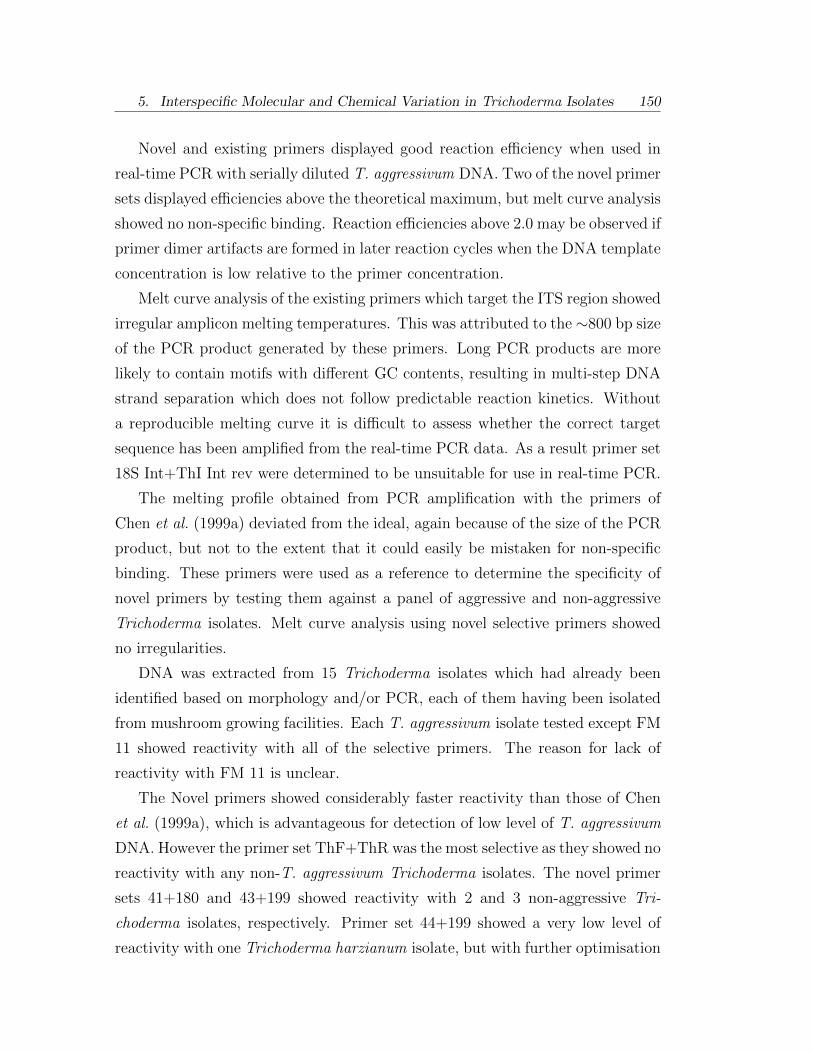
5. Interspecific Molecular and Chemical Variation in Trichoderma Isolates 150
Novel and existing primers displayed good reaction efficiency when used in
real-time PCR with serially diluted T. aggressivum DNA. Two of the novel primer
sets displayed efficiencies above the theoretical maximum, but melt curve analysis
showed no non-specific binding. Reaction efficiencies above 2.0 may be observed if
primer dimer artifacts are formed in later reaction cycles when the DNA template
concentration is low relative to the primer concentration.
Melt curve analysis of the existing primers which target the ITS region showed
irregular amplicon melting temperatures. This was attributed to the ∼800 bp size
of the PCR product generated by these primers. Long PCR products are more
likely to contain motifs with different GC contents, resulting in multi-step DNA
strand separation which does not follow predictable reaction kinetics. Without
a reproducible melting curve it is difficult to assess whether the correct target
sequence has been amplified from the real-time PCR data. As a result primer set
18S Int+ThI Int rev were determined to be unsuitable for use in real-time PCR.
The melting profile obtained from PCR amplification with the primers of
Chen et al. (1999a) deviated from the ideal, again because of the size of the PCR
product, but not to the extent that it could easily be mistaken for non-specific
binding. These primers were used as a reference to determine the specificity of
novel primers by testing them against a panel of aggressive and non-aggressive
Trichoderma isolates. Melt curve analysis using novel selective primers showed
no irregularities.
DNA was extracted from 15 Trichoderma isolates which had already been
identified based on morphology and/or PCR, each of them having been isolated
from mushroom growing facilities. Each T. aggressivum isolate tested except FM
11 showed reactivity with all of the selective primers. The reason for lack of
reactivity with FM 11 is unclear.
The Novel primers showed considerably faster reactivity than those of Chen
et al. (1999a), which is advantageous for detection of low level of T. aggressivum
DNA. However the primer set ThF+ThR was the most selective as they showed no
reactivity with any non-T. aggressivum Trichoderma isolates. The novel primer
sets 41+180 and 43+199 showed reactivity with 2 and 3 non-aggressive Tri-
choderma isolates, respectively. Primer set 44+199 showed a very low level of
reactivity with one Trichoderma harzianum isolate, but with further optimisation

5. Interspecific Molecular and Chemical Variation in Trichoderma Isolates 151
these primers may prove to be as selective as the published primers.
Real-time PCR quantitation adds an extra dimension to the identification of
T. aggressivum by PCR because it allows for simultaneous species assignment
and quantification. In the future this method may allow for more rapid screening
of mushroom farms and substrates for T. aggressivum contamination by elimi-
nating the requirement for a two step quantification and identification process.
This could be implemented in conjunction with cultural methods to quantify
the amount of T. aggressivum growing in a mixed culture of fungi or, with the
proper DNA extraction method and sampling regime, the direct quantification
of T. aggressivum in mushroom substrate.
5.5.3 HPLC metabolite profiling
HPLC profiling of secondary metabolites was assessed as a means for differentiat-
ing Trichoderma aggressivum isolates from non-aggressive Trichoderma isolates.
Optimisation of HPLC elution gradients allowed for better separation of Tricho-
derma metabolites, which showed a conserved pattern of elution with regards to
time and acetonitrile concentration.
The degree of difference between metabolite profiles was shown to be depen-
dant on the growth medium used. Trichoderma isolates grown on malt extract
agar had highly similar metabolite profiles. More diverse profiles were observed
when isolates were grown on a synthetic, defined medium.
A reference chromatogram was produced for T. aggressivum by combining
chromatograms of two reference isolates. By comparing profiles of other Tricho-
derma isolates to this reference chromatogram it was possible to distinguish T.
aggressivum isolates from non-aggressive isolates. The exact level of correlation
between profiles required for positive species identification cannot be accurately
defined, as it is impossible to estimate intraspecies variation in the production of
secondary metabolites (Thrane et al., 2001). However, a correlation of 0.92-0.98
was observed between the reference chromatogram and that obtained from two
other T. aggressivum isolates while the profiles of all other Trichoderma isolates
tested was in the 0.66-0.91 range, with highest correlation being observed for a
Trichoderma harzianum isolate.
This technique offers a new method for the identification and characterisa-

5. Interspecific Molecular and Chemical Variation in Trichoderma Isolates 152
tion of T. aggressivum. Metabolite profiling may be a more practical method
for species identification than PCR because it differentiates species based on
expressed phenotypes, rather than molecular sequence. The identification of
metabolites unique to T. aggressivum could allow for highly effective species
identification and provide information on the unique traits which make T. ag-
gressivum a much more serious problem in the mushroom industry than other
Trichoderma species.
6. GENERAL DISCUSSION
The fungus Trichoderma aggressivum is an economically significant pathogen of
the cultivated mushroom Agaricus bisporus (Samuels et al., 2002). It was first de-
scribed in 1987 as a novel Trichoderma harzianum biotype (Seaby, 1987). Unlike
other Trichoderma which are sometimes found growing in mushroom substrate
this new variety caused massive crop losses and an epidemic affecting A. bis-
porus cultivation worldwide (Kredics et al., 2010). Subsequent molecular anal-
yses showed T. aggressivum to be a separate species from T. harzianum with
two subspecies Trichoderma aggressivum f. aggressivum and Trichoderma ag-
gressivum f. europaeum, responsible for the green mould outbreaks in North
America and Europe, respectively (Muthumeenakshi et al., 1994; Castle et al.,
1998; Chen et al., 1999a,b; Samuels et al., 2002). Technological advances in
mushroom cultivation, particularly the introduction of the Bulk Phase III sys-
tem reduced the incidence of T. aggressivum in Europe, but in the last decade
reports of T. aggressivum infection of Bulk Phase III mushroom substrate began
to surface (Lemmers, 2010). This raised questions about how well we understand
the epidemiology of T. aggressivum and its interaction with A. bisporus, as well
as prompting renewed interest in methods for detection of the fungus and to
differentiate it from related, non-aggressive species.
While there has been research into the activities of T. aggressivum toward A.
bisporus the exact mechanisms by which it reduces mushroom yields are poorly
understood. Secreted metabolites from T. aggressivum have been shown to sup-
press the growth of A. bisporus in vitro, but to a lesser extent than other, non-
aggressive species (Mumpuni et al., 1998). The ability of T. aggressivum to
colonise mushroom substrate and resist inhibition by substrate microflora bet-
ter than other Trichoderma species has been linked to its virulence (Largeteau
et al., 2000b; Savoie et al., 2001b), but T. aggressivum grows better in ster-

6. General Discussion 154
ilised substrate, and there are conflicting reports on how necessary A. bisporus is
to substrate colonisation by T. aggressivum (Largeteau et al., 2000b; Mumpuni
et al., 1998). T. aggressivum has been shown to produce compounds harm-
ful to A. bisporus in vitro and in vivo, including cell wall degrading enzymes
(Mumpuni et al., 1998; Krupke et al., 2003; Williams et al., 2003a; Guthrie &
Castle, 2006) but coiling of T. aggressivum hyphae around those of A. bisporus
is not frequently observed (Williams et al., 2003a) so it is not clear whether
T. aggressivum parasitises A. bisporus mycelium or impedes its growth through
antibiosis and competition for nutrients.
In the first part of this work a proteomic analysis of T. aggressivum was
performed. By studying the proteins of T. aggressivum we can obtain information
about its biochemistry and lifestyle (Kim et al., 2007). By using comparative
proteomics it is possible to measure the change in expression of proteins in relation
to stimuli and thereby identify proteins which are important to the response of T.
aggressivum to those stimuli. Comparative proteomics has been used previously
to study the interaction of Trichoderma species with plants and plant-pathogenic
fungi (Sanz et al., 2005; Marra et al., 2006; da Silva Aires et al., 2012) and has
been used to study the relationship of T. aggressivum with A. bisporus (Williams
et al., 2003a; Guthrie & Castle, 2006).
In this study T. aggressivum was grown in the presence of mushroom substrate
and A. bisporus cap tissue and proteins changing in expression were identified.
None of the upregulated proteins observed were enzymes that might be involved
the degradation of fungal cell walls such as laminarase or chitinase, which would
indicate a mycoparasitic or antagonistic response. However as these proteins are
secreted from the cell in vivo it is possible that they were not observed because
this study focused on the cellular proteome, rather than the secretome. A stress
response was observed in T. aggressivum induced by both treatments, but more
strongly by the mushroom substrate treatment.
There was an upregulation in the expression of superoxide dismutase, which
is an enzyme that detoxifies superoxide and one of the key components of the
oxidative stress response (Bai et al., 2001). There was also a change in the
expression of spermidine synthase and ribosomal protein P60, both of which
are indirectly involved in the oxidative stress response (Abramczyk et al., 2003;

6. General Discussion 155
Maniratanachote et al., 2006; Chattopadhyay et al., 2009). The production of
superoxide and other reactive oxygen species is a common method by which
micro-organisms inhibit the growth of competitors and defend themselves against
pathogens (Silar, 2005). The oxidative stress response of T. aggressivum may
have a role in its ability to resist growth inhibition by mushroom substrate micro-
flora and A. bisporus.
Expression of the protein guanylate kinase by T. aggressivum was upregu-
lated in the mushroom tissue treatment and down-regulated in the presence of
mushroom substrate. This protein is involved in DNA synthesis and cell sig-
nalling (Berger et al., 1989; Robson et al., 1991; Blaszczyk et al., 2001; Li et al.,
2010), its differential expression may be related to the enhanced growth of T.
aggressivum in the presence of A. bisporus and the inhibition of the growth of T.
aggressivum caused by substrate micro-flora.
For several of the proteins analysed in this study homologs were not found in
on-line databases. A number of these proteins were present in high abundance
and were analysed repeatedly but still returned no match. This raises the ques-
tion of whether the lack of a homolog was due to technical limitations or whether
these proteins may not have a homolog in the databases searched. In the future
de novo sequencing of these proteins might yield further insight into the unique
characteristics of T. aggressivum which make it more harmful to mushroom culti-
vation than other Trichoderma species. Other research carrying on from this work
could look at the protein expression of non-aggressive Trichoderma species under
the same conditions to see if they behave differently from T. aggressivum, repeat
of the differential expression experiment using live A. bisporus and mushroom
substrate to stimulate T. aggressivum and, in light of the observed importance
of the oxidative stress response of T. aggressivum analysis of the activities of
enzymes relating to oxidative stress in T. aggressivum under different conditions
and in strains exhibiting varying degrees of aggressive behaviour.
Chapter 4 of this work assessed the epidemiology of T. aggressivum in Bulk
Phase III mushroom systems. In these systems substrate is spawn-run in bulk un-
der strict hygiene and environmental controls to produce a high quality substrate,
free from disease. Fully spawn-run mushroom substrate is known to be relatively
resistant to colonisation by T. aggressivum (Fletcher, 1997; Rinker & Alm, 2000),
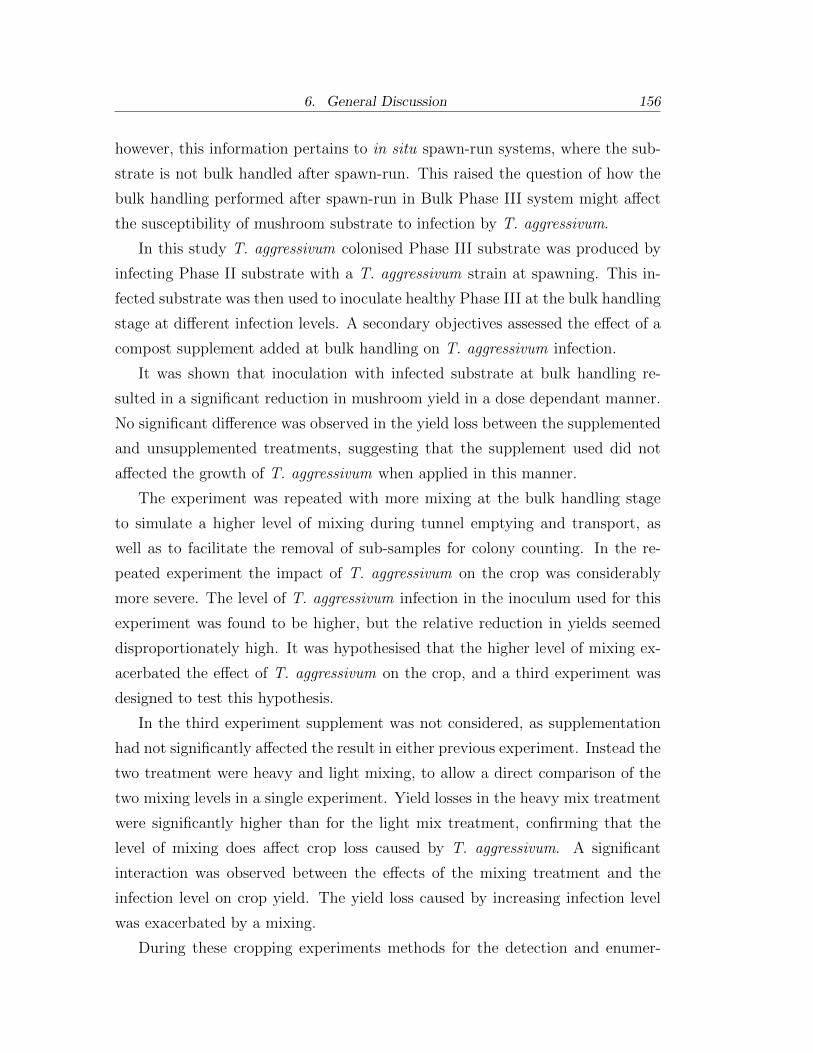
6. General Discussion 156
however, this information pertains to in situ spawn-run systems, where the sub-
strate is not bulk handled after spawn-run. This raised the question of how the
bulk handling performed after spawn-run in Bulk Phase III system might affect
the susceptibility of mushroom substrate to infection by T. aggressivum.
In this study T. aggressivum colonised Phase III substrate was produced by
infecting Phase II substrate with a T. aggressivum strain at spawning. This in-
fected substrate was then used to inoculate healthy Phase III at the bulk handling
stage at different infection levels. A secondary objectives assessed the effect of a
compost supplement added at bulk handling on T. aggressivum infection.
It was shown that inoculation with infected substrate at bulk handling re-
sulted in a significant reduction in mushroom yield in a dose dependant manner.
No significant difference was observed in the yield loss between the supplemented
and unsupplemented treatments, suggesting that the supplement used did not
affected the growth of T. aggressivum when applied in this manner.
The experiment was repeated with more mixing at the bulk handling stage
to simulate a higher level of mixing during tunnel emptying and transport, as
well as to facilitate the removal of sub-samples for colony counting. In the re-
peated experiment the impact of T. aggressivum on the crop was considerably
more severe. The level of T. aggressivum infection in the inoculum used for this
experiment was found to be higher, but the relative reduction in yields seemed
disproportionately high. It was hypothesised that the higher level of mixing ex-
acerbated the effect of T. aggressivum on the crop, and a third experiment was
designed to test this hypothesis.
In the third experiment supplement was not considered, as supplementation
had not significantly affected the result in either previous experiment. Instead the
two treatment were heavy and light mixing, to allow a direct comparison of the
two mixing levels in a single experiment. Yield losses in the heavy mix treatment
were significantly higher than for the light mix treatment, confirming that the
level of mixing does affect crop loss caused by T. aggressivum. A significant
interaction was observed between the effects of the mixing treatment and the
infection level on crop yield. The yield loss caused by increasing infection level
was exacerbated by a mixing.
During these cropping experiments methods for the detection and enumer-

6. General Discussion 157
ation of T. aggressivum in Bulk Phase III mushroom substrate were assessed.
Quantitative PCR (qPCR) (Lane, 2010), weed mould analysis (WMA) (Kauf-
man et al., 1963), most probable number analysis (MPN) (Halvorson & Ziegler,
1933; Briones et al., 1999) and a direct plating assay (DPA) were compared.
There was an increasing trend in the variability of results obtained from each
method other than qPCR with decreasing infection levels. The qPCR method is
more technically advanced than the others and made use of a larger sample size,
which may account for its greater precision at low infection levels. The two micro-
biological counting methods gave comparable results, but the WMA method was
more time-consuming, so the MPN method was deemed superior. DPA proved
to be a simple method for the detection of T. aggressivum with a good level of
sensitivity, but it is semi-quantitative, so only gives a rough indication of the
level of infection.
With each method the experimental results were correlated with infection
level, but they differed from the values expected based on the dilution levels used.
It was observed that some transfer of T. aggressivum occurred between infected
substrate and uninfected, but that this did not result in an even distribution of
T. aggressivum particles throughout the substrate. The heterogeneous distribu-
tion of T. aggressivum in mushroom substrate makes obtaining a representative
sample difficult, particularly at low infection, which is something that must be
taken into consideration when sampling Bulk Phase III substrate in industry.
Future work following from this study could assess a wider range of supple-
ments for their effect on T. aggressivum. The biochemical characteristics of Bulk
Phase III substrate before and after bulk handling could be studied to determine
what factors influence susceptibility to T. aggressivum infection at this point. Re-
peat experiments using different methods of inoculation at bulk handling could
be performed, it is unknown whether spores or hyphae are more important for
infection of substrate at this point, or whether other factors associated with in-
fected substrate might also be important. With regards to detection methods,
industrial scale experiments could be used to develop an effective sampling system
that addresses the level of heterogeneity in Bulk Phase III mushroom substrates.
In the final section of this study molecular and chemical methods for the
detection and identification of T. aggressivum were studied. DNA extraction
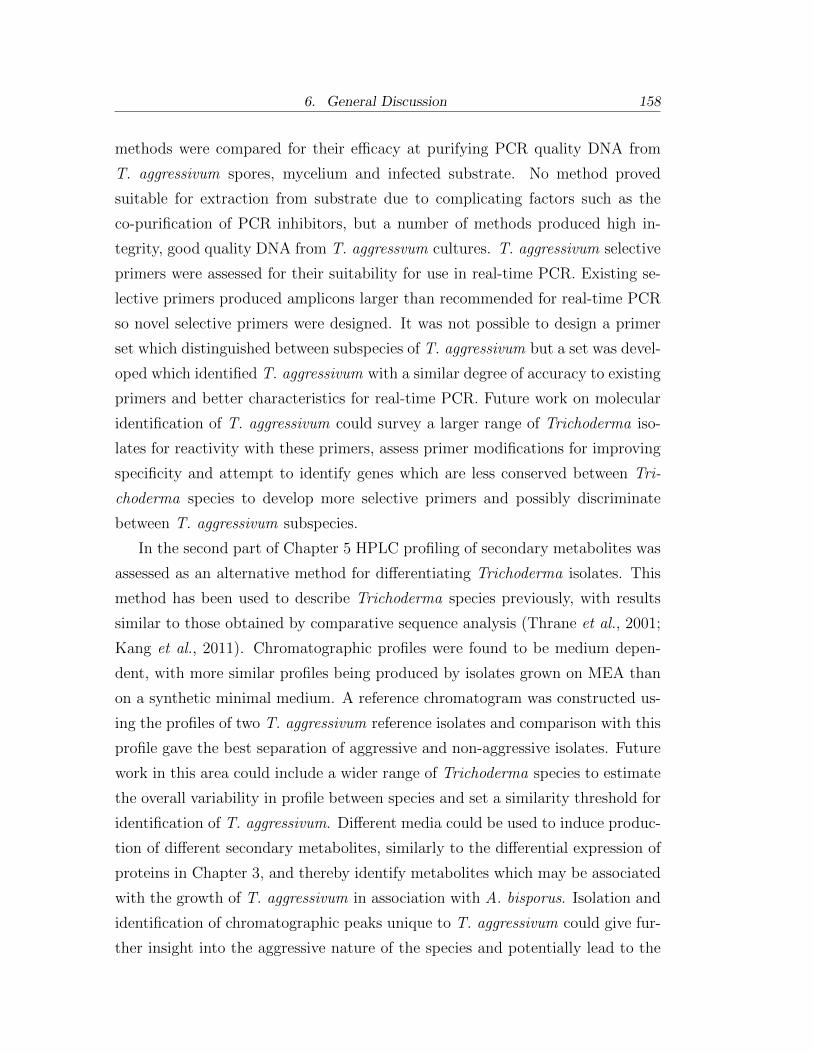
6. General Discussion 158
methods were compared for their efficacy at purifying PCR quality DNA from
T. aggressivum spores, mycelium and infected substrate. No method proved
suitable for extraction from substrate due to complicating factors such as the
co-purification of PCR inhibitors, but a number of methods produced high in-
tegrity, good quality DNA from T. aggressvum cultures. T. aggressivum selective
primers were assessed for their suitability for use in real-time PCR. Existing se-
lective primers produced amplicons larger than recommended for real-time PCR
so novel selective primers were designed. It was not possible to design a primer
set which distinguished between subspecies of T. aggressivum but a set was devel-
oped which identified T. aggressivum with a similar degree of accuracy to existing
primers and better characteristics for real-time PCR. Future work on molecular
identification of T. aggressivum could survey a larger range of Trichoderma iso-
lates for reactivity with these primers, assess primer modifications for improving
specificity and attempt to identify genes which are less conserved between Tri-
choderma species to develop more selective primers and possibly discriminate
between T. aggressivum subspecies.
In the second part of Chapter 5 HPLC profiling of secondary metabolites was
assessed as an alternative method for differentiating Trichoderma isolates. This
method has been used to describe Trichoderma species previously, with results
similar to those obtained by comparative sequence analysis (Thrane et al., 2001;
Kang et al., 2011). Chromatographic profiles were found to be medium depen-
dent, with more similar profiles being produced by isolates grown on MEA than
on a synthetic minimal medium. A reference chromatogram was constructed us-
ing the profiles of two T. aggressivum reference isolates and comparison with this
profile gave the best separation of aggressive and non-aggressive isolates. Future
work in this area could include a wider range of Trichoderma species to estimate
the overall variability in profile between species and set a similarity threshold for
identification of T. aggressivum. Different media could be used to induce produc-
tion of different secondary metabolites, similarly to the differential expression of
proteins in Chapter 3, and thereby identify metabolites which may be associated
with the growth of T. aggressivum in association with A. bisporus. Isolation and
identification of chromatographic peaks unique to T. aggressivum could give fur-
ther insight into the aggressive nature of the species and potentially lead to the

6. General Discussion 159
development of new diagnostic measures for the detection of T. aggressivum in
vivo.
In conclusion, the work described in this thesis has shown:
• The activity of the proteomic stress response of Trichoderma aggressivum
in response to Agaricus bisporus and mushroom substrate.
• That T. aggressivum infected mushroom substrate can spread infection to
healthy Bulk Phase III substrate during bulk handling.
• That a higher level of mixing during bulk handling increases the severity of
a T. aggressivum infection.
• A new real-time PCR method for the identification of T. aggressivum.
• The potential for use of HPLC metabolite profiling to identify T. aggres-
sivum isolates.

BIBLIOGRAPHY
Abercrombie, J. 1779. The garden mushroom: its nature and cultivation. A
treatise, exhibitingl full and plain directions, for producing this desireable plant
in Perfection and Plenty, according to the true successful Practice of the London
Gardeners.
Able, A.J., Guest, D.I., & Sutherland, M.W. 1998. Use of a new tetrazolium-based
assay to study the production of superoxide radicals by tobacco cell cultures
challenged with avirulent zoospores of Phytophthora parasitica var nicotianae.
Plant Physiology, 117(2), 491–9.
Abosriwil, S.O., & Clancy, K.J. 2004. A mini-bag technique for evaluation of
fungicide effects on Trichoderma spp in mushroom compost. Pest management
science, 60(4), 350–8.
Abramczyk, O., Zien, P., Zielinski, R., Pilecki, M., Hellman, U., & Szyszka, R.
2003. The protein kinase 60S is a free catalytic CK2α subunit and forms an in-
active complex with superoxide dismutase SOD1. Biochemical and Biophysical
Research Communications, 307(1), 31–40.
Adams, J.D.W., & Frostick, L.E. 2008. Investigating microbial activities in com-
post using mushroom Agaricus bisporus cultivation as an experimental system.
Bioresource technology, 99(5), 1097–102.
Addinall, S.G., Downey, M., Yu, M., Zubko, M.K., Dewar, J., Leake, A., Hallinan,
J., Shaw, O., James, K., Wilkinson, D.J., Wipat, A., Durocher, D., & Lydall, D.
2008. A genomewide suppressor and enhancer analysis of cdc13-1 reveals varied
cellular processes influencing telomere capping in Saccharomyces cerevisiae.
Genetics, 180(4), 2251–66.
BIBLIOGRAPHY 161
Ahlawat, O.P., & Singh, R. 2009. Influence of pH , temperature and cultural
media on decolorization of synthetic dyes through spent substrate of differ-
ent mushrooms. Journal of Scientific and Industrial Research, 68(December),
1068–1074.
Alaeddini, R. 2012. Forensic implications of PCR inhibition–A review. Forensic
science international. Genetics, 6(3), 297–305.
Aljanabi, S.M., & Martinez, I. 1997. Universal and rapid salt-extraction of high
quality genomic DNA for PCR-based techniques. Nucleic Acids Research,
25(22), 4692–4693.
Allard, B. 2006. A comparative study on the chemical composition of humic acids
from forest soil, agricultural soil and lignite deposit. Geoderma, 130(1-2), 77–
96.
Anastasi, A., Varese, G. Cristina, & Marchisio, V.P. 2005. Isolation and identifi-
cation of fungal communities in compost and vermicompost. Mycologia, 97(1),
33–44.
Anderson, M.G., Beyer, D.M., & Wuest, P.J. 2000. Using spawn strain resistance
to manage Trichoderma gree mold. Pages 641–643 of: Mushroom Science XV:
Science and Cultivation of Edible Fungi.
Arevalo-Pinzon, G., Curtidor, H., Reyes, C., Pinto, M., Vizcaıno, C., Patar-
royo, M., & Patarroyo, M.E. 2010. Fine mapping of Plasmodium falciparum
ribosomal phosphoprotein PfP0 revealed sequences with highly specific bind-
ing activity to human red blood cells. Journal of Molecular Medicine (Berlin,
Germany), 88(1), 61–74.
Ayala, M., Vazquez, C., Meneses, M., Loera, O., & Mendoza, G.D. 2011. Fi-
brolytic potential of spent compost of the mushroom Agaricus bisporus to
degrade forages for ruminants. Journal of Microbiology, 5(3), 241–249.
Baars, J., Rutjens, J., & Roland, M. 2011. Can volatiles emitted by compost
during spawn run be used to detect green mould infection early? Proceed-

BIBLIOGRAPHY 162
ings of the 7th international Conference on Mushroom Biology and Mushroom
Products, 1.
Baars, J., Rutjens, J., & Roland, M. 2012. Detection of Trichoderma aggressivum
green mould during spawn-run. Pages 343–349 of: Proceedings of the 18th
international congress on mushroom biology an mushroom science: Mushroom
Science XVIII.
Bai, Z., Harvey, L.M., & McNeil, B. 2001. Use of the chemiluminescent probe
lucigenin to monitor the production of the superoxide anion radical in a re-
combinant Aspergillus niger (B1-D). Biotechnology and Bioengineering, 75(2),
204–11.
Barry, J., Grant, J., Doyle, O., & Grogan, H. 2008. Partial substitution of peat
with spent mushroom substrate in peat-based casing blends. Pages 288–309
of: Science and cultivation of edible and medicinal fungi: Mushroom Science
XVII.
Berger, Albin, Schiltz, Emile, & Georg, E. 1989. Guanylate kinase from Saccha-
romyces cerevisiae. European Journal of Biochemistry, 184, 433–444.
Bergin, D., Reeves, E.P., Renwick, J., Frans, B., Kavanagh, K., & Wientjes, F.B.
2005. Superoxide production in Galleria mellonella hemocytes : identification
of proteins homologous to the NADPH oxidase complex of human neutrophils.
Infection and Immunity, 73(7), 4161–4170.
Beyer, D.M., Wuest, P.J., & Kremser, J.J. 2000. Evaluation of epidemiological
factors and mushroom substrate characteristics influencing the occurrence and
development of Trichoderma green mold. Pages 633–640 of: Mushroom Science
XV: Science and Cultivation of Edible Fungi.
Blanc, M., Marilley, L., Be, T., & Aragno, M. 1999. Thermophilic bacterial
communities in hot composts as revealed by most probable number counts and
molecular ( 16S rDNA ) methods. Microbial Ecology, 28, 141–149.

BIBLIOGRAPHY 163
Blaszczyk, J., Li, Y., Yan, H., & Ji, X. 2001. Crystal structure of unligated guany-
late kinase from yeast reveals GMP-induced conformational changes. Journal
of Molecular Biology, 307, 247–257.
B laszczyk, L., Popiel, D., Che lkowski, J., Koczyk, G., Samuels, G.J., Sobieralski,
K., & Siwulski, M. 2011. Species diversity of Trichoderma in Poland. Journal
of Applied Genetics, 52(2), 233–243.
Briones, M., Aurelio, Jr., & Reichardt, Wolfgang. 1999. Estimating microbial
population counts by most probable number using Microsoft Excel ®. Journal
of Microbiological Methods, 35, 157–161.
Callac, P., Spataro, C., Caille, A., & Imbernon, M. 2006. Evidence for outcrossing
via the Buller phenomenon in a substrate simultaneously inoculated with spores
and mycelium of Agaricus bisporus . Applied and environmental microbiology,
72(4), 2366–2372.
Carsolio, C., Benhamou, N., Haran, S., Cortes, C., Gutierrez, A., Chet, I., &
Corte, C. 1999. Role of the Trichoderma harzianum endochitinase gene, ech42,
in Mycoparasitism. Applied and Environmental Microbiology, 65(3), 9292–935.
Castle, A., Speranzini, D., Rghei, N., Alm, G., Rinker, D., & Bissett, J. 1998.
Morphological and molecular identification of Trichoderma isolates on North
American mushroom farms. Applied and environmental microbiology, 64(1),
133–7.
Chattopadhyay, M.K., Tabor, C.W., & Tabor, H. 2003. Spermidine but not
spermine is essential for hypusine biosynthesis and growth in Saccharomyces
cerevisiae: spermine is converted to spermidine in vivo by the FMS1-amine
oxidase. Proceedings of the National Academy of Sciences of the United States
of America, 100(24), 13869–13874.
Chattopadhyay, M.K., Chen, W., Poy, G., Cam, M., Stiles, D., & Tabor, H.
2009. Microarray studies on the genes responsive to the addition of spermidine
or spermine to a Saccharomyces cerevisiae spermidine synthase mutant. Yeast,
29(August), 531–544.

BIBLIOGRAPHY 164
Chaverri, P., & Samuels, G.J. 2003. Hypocrea/Trichoderma (Ascomycota,
Hypocreales, Hypocreaceae): species with green ascospores. Studies in My-
cology, 48, 116–152.
Chaverri, P., Castlebury, L.A., Samuels, G.J., & Geiser, D.M. 2003. Multilo-
cus phylogenetic structure within the Trichoderma harzianum/Hypocrea lixii
complex . Molecular Phylogenetics and Evolution, 27(2), 302–313.
Chen, L., Xie, B., & Wach, M.P. 2008. A general review of the Chinese mushroom
industry. Pages 70–80 of: Science and cultivation of edible and medicinal fungi:
Mushroom Science XVII.
Chen, X., Romaine, C.P., Ospina-Giraldo, M.D., & Royse, D.J. 1999a. A
polymerase chain reaction-based test for the identification of Trichoderma
harzianum biotypes 2 and 4, responsible for the worldwide green mold epi-
demic in cultivated Agaricus bisporus. Applied Microbiology and Biotechnology,
52(2), 246–250.
Chen, X., Romaine, C.P., Tan, Q., Schlagnhaufer, B., Royse, D.J., & Huff, D.R.
1999b. PCR-Based genotyping of epidemic and preepidemic Trichoderma iso-
lates associated with green mold of Agaricus bisporus . Applied and Environ-
mental Microbiology, 65(6), 2674–2678.
Chiu, S.-W., Gao, T., Chan, C.S.-S., & Ho, C.K.-M. 2009. Removal of spilled
petroleum in industrial soils by spent compost of mushroom Pleurotus pul-
monarius. Chemosphere, 75(6), 837–42.
Condliffe, A.M., Kitchen, E., & Chilvers, E.R. 1998. Neutrophil priming: patho-
physiological consequences. Cellular & Molecular Biology (Oxford), 471, 461–
471.
Cox, G.M., Harrison, T.S., Mcdade, H.C., Taborda, P., Heinrich, G., Casadevall,
A., John, R., Taborda, C.P., & Perfect, J.R. 2003. Superoxide dismutase
influences the virulence of Cryptococcus neoformans by affecting growth within
macrophages. Infection and Immunity, 71(1), 137–180.

BIBLIOGRAPHY 165
Crecchio, C., & Stotzky, G. 1998. Binding of DNA on humic acids: effect on
transformation of Bacillus subtilis and resistance to DNAse. Science, 30(8),
1061–1067.
Curach, N.C., Teo, V.S.J., Gibbs, M.D., Bergquist, P.L., & Nevalainen, K.M.H.
2004. Isolation, characterization and expression of the hex1 gene from Tricho-
derma reesei. Gene, 331(Apr.), 133–40.
da Silva Aires, R., Steindorff, A.S., Ramada, M.H.S., de Siqueira, S.J.L., & Ulhoa,
C.J. 2012. Biochemical characterization of a 27kDa 1,3-β-d-glucanase from Tri-
choderma asperellum induced by cell wall of Rhizoctonia solani . Carbohydrate
Polymers, 87(2), 1219–1223.
Danai, O., Cohen, H., Esov, N., Yehieli, N., & Levanon, D. 2011. Recycling
spent mushroom substrate in avocado orchards. In: Proceeding of the 7th
International Conference on Mushroom Biology and Mushroom Products, vol.
1.
Danesh, Y.R., Goltapeh, E.R., & Rohani, H. 2000. Identification of Trichoderma
species causing green mould in button mushroom farms, distribution and their
relative abundance. Pages 653–660 of: Mushroom Science XV: Science and
Cultivation of Edible Fungi.
de la Fuente, M.E., Beyer, D.M., & Rinker, D.L. 1998. First report of Trichoderma
harzianum biotype Th4 on commercial button mushrooms in California. Plant
Pathology, 82(12), 1404.
den Ouden, M.C.M.B. 2012. Hygiene-Cultivating mushrooms without the use
of chemical agents. Pages 377–383 of: Proceedings of the 18th international
congress on mushroom biology an mushroom science: Mushroom Science XVIII.
Diamantopoulou, P., & Philippoussis, A. 2001. Production attributes of Agaricus
bisporus white and off-white strains and the effect of calcium chloride irrigation
on productivity and quality. Scientia Horticulturae, 91, 379–391.

BIBLIOGRAPHY 166
Dodd, S.L., Crownhurst, R.N., Rodrigo, A.G., Samuels, G.J., Hill, R.A., & Stew-
art, A. 2000. Examination of Trichoderma phylogenies derived from ribosomal
DNA sequence data. Mycological Research, 104(1), 23–34.
Dodd, S.L., Lieckfeldt, E., & Samuels, G.J. 2003. Hypocrea atroviridis sp . nov
., the teleomorph of Trichoderma atroviride. Mycologia, 95(1), 27–40.
Domig, K.J., Mayer, H.K., & Kneifel, W. 2003. Methods used for the isolation,
enumeration, characterisation and identification of Enterococcus spp. Interna-
tional Journal of Food Microbiology, 88(2-3), 165–188.
Druzhinina, I., & Kubicek, C.P. 2005. Species concepts and biodiversity in Tri-
choderma and Hypocrea: from aggregate species to species clusters? Journal
of Zhejiang University Science., 6(2), 100–112.
Druzhinina, I.S., Kopchinskiy, A.G., Komoj, M., Bissett, J., Szakacs, G., & Ku-
bicek, C.P. 2005. An oligonucleotide barcode for species identification in Tri-
choderma and Hypocrea. Fungal Genetics and Biology, 42, 813–828.
Druzhinina, I.S., Seidl-Seiboth, V., Herrera-Estrella, A., Horwitz, B.A., Kenerley,
C.M., Monte, E., Mukherjee, P.K., Zeilinger, S., Grigoriev, I.V., & Kubicek,
C.P. 2011. Trichoderma: the genomics of opportunistic success. Nature reviews.
Microbiology, 9(10), 749–59.
Durrant, J.A., Wood, D.A., & Cain, R.B. 1990. Lignocellulose biodegradation
by Agaricus bisporus during solid substrate fermentation. Journal of General
Microbiology, 137, 751–755.
Eckstein, H. 1988. Evidence for cyclic GMP in the yeast Saccharomyces cerevisiae,
and studies on its possible role in growth. Journal of Biosciences, 13(5-6), 386–
396.
Esbensen, K.H., & Heydorn, K. 2004. Metrology in samplinga first foray (bio-
logical materials). Chemometrics and Intelligent Laboratory Systems, 74(1),
115–120.
BIBLIOGRAPHY 167
Filion, M., St-Arnaud, M., & Jabaji-Hare, S.H. 2003. Direct quantification of
fungal DNA from soil substrate using real-time PCR. Journal of microbiological
methods, 53(1), 67–76.
Fletcher, J.T. 1997. Mushroom spawn and the development of Trichoderma
harzianum compost mold. Mushroom News, 45(8), 6–8.
Flores, C., Vidal, C., Trejo-Hernandez, M.R., Galindo, E., & Serrano-Carreon, L.
2009. Selection of Trichoderma strains capable of increasing laccase production
by Pleurotus ostreatus and Agaricus bisporus in dual cultures. Journal of
Applied Microbiology, 106(1), 249–57.
Fordyce, C. 1970. Relative numbers of certain microbial groups present in com-
post used for mushroom (Agaricus bisporus) propagation. Applied microbiology,
20(2), 196–9.
Frampton, G., Moriya, S., Pearson, J.D., Isenberg, D.A., Ward, F.J., Smith,
T.A., Panayiotou, A., Staines, N.A., & Murphy, J.J. 2000. Identification of
candidate endothelial cell autoantigens in systemic lupus erythematosus using
a molecular cloning strategy: a role for ribosomal P protein P0 as an endothelial
cell autoantigen. Rheumatology (Oxford, England), 39(10), 1114–20.
Friedl, M.A, & Druzhinina, I.S. 2012. Taxon-specific metagenomics of Tricho-
derma reveals a narrow community of opportunistic species that regulate each
other’s development. Microbiology, 158(1), 69–83.
Fries, E. 1825. Systema Orbis Vegetabilis.
Fu, X.-Z., Chen, C.-W.and Wang, Y., Liu, J.-H., & Moriguchi, T. 2011. Ec-
topic expression of MdSPDS1 in sweet orange (Citrus sinensis Osbeck) reduces
canker susceptibility: involvement of H2O2 production and transcriptional al-
teration. BMC Plant Biology, 11(1), 55.
Gams, W., & Meyer, W. 1998. What exactly is Trichoderma harzianum? My-
cologia, 90(5), 904.
BIBLIOGRAPHY 168
Garthright, W.E., & Blodgett, R.J. 2003. FDAs preferred MPN methods for
standard, large or unusual tests, with a spreadsheet. Food Microbiology, 20,
439–445.
Giles, S.S., Batinic-haberle, I., Perfect, J.R., Cox, G.M., & Batinic, I. 2005.
Cryptococcus neoformans mitochondrial superoxide dismutase : an essential
link between antioxidant function and high-temperature growth. Eukaryotic
Cell, 4(1), 46–54.
Goltapeh, E.N., & Danesh, Y.R. 2000. Studies on interaction between Tricho-
derma species and Agaricus bisporus mycelium. Pages 661–666 of: Mushroom
Science XV: Science and Cultivation of Edible Fungi.
Grogan, H.M., Noble, R., Gaze, R.H., & Fletcher, J.T. 1996. Control of Tricho-
derma harzianum - a weed mould of the cultivated mushroom. Brighton Crop
Protection - Pests & Diseases, 4(B-3), 337–343.
Grogan, H.M., Scruby, A., & Harvey, L. 2000. Moulds in spawn-run compost
and their effect on mushroom production. Mushroom Science XV: Science and
Cultivation of Edible Fungi, 15(2), 609–616.
Grogan, H.M., O’ Brien, M., Kavanagh, K., Dobrovin-Penington, A., Lane, C.,
& Noble, R. 2012. Epidemiology of Trichoderma aggressivum in Bulk Phase 3
compost for Agaricus bisporus production. In: Proceedings of the 18th Congress
of the International Society for Mushroom Biology and Mushroom Products.
Guillen, F., Martınez, M.J., Munoz, C., & Martınez, A.T. 1997. Quinone redox
cycling in the ligninolytic fungus Pleurotus eryngii leading to extracellular pro-
duction of superoxide anion radical. Archives of Biochemistry and Biophysics,
339(1), 190–9.
Guthrie, J.L., & Castle, A.J. 2006. Chitinase production during interaction of
Trichoderma aggressivum and Agaricus bisporus . Canadian Journal of Micro-
biology, 52, 961–967.
Gy, P. 2004a. Chemometrics and Intelligent Laboratory Systems, 74(1), 7–24.
BIBLIOGRAPHY 169
Gy, P. 2004b. Sampling of discrete materials II. Quantitative approach-sampling
zero-dimensional objects. Chemometrics and Intelligent Laboratory Systems,
74(1), 25–38.
Gy, P. 2004c. Sampling of discrete materials III. Quantitative approach-sampling
one-dimensional objects. Chemometrics and Intelligent Laboratory Systems,
74(1), 39–47.
Gyorfi, J., & Geosel, A. 2008. Biological against Trichoderma species in Agaricus
cultivation. Pages 158–164 of: Proceedings of the 6th International Conference
on Mushroom Biology and Mushroom products.
Hagiya, A., Naganuma, T., Maki, Y., Ohta, J., Tohkairin, Y., Shimizu, T., No-
mura, T., Hachimori, A., & Uchiumi, T. 2005. A mode of assembly of P0, P1,
and P2 proteins at the GTPase-associated center in animal ribosome: in vitro
analyses with P0 truncation mutants. The Journal of Biological Chemistry,
280(47), 391–393.
Hagn, A., Wallisch, S., Radl, V., Charles Munch, J., & Schloter, M. 2007. A new
cultivation independent approach to detect and monitor common Trichoderma
species in soils. Journal of Microbiological Methods, 69(1), 86–92.
Halvorson, H.O., & Ziegler, N.R. 1933. Application of statistics to probelms in
bacteriology I. A means of determining bacterial population by the dilution
method. Journal of Bacteriology, 25(2), 101–121.
Hammel, K.E., Kapich, A.N., Jr, Kenneth A.J., & Ryan, Z.C. 2002. Reactive
oxygen species as agents of wood decay by fungi. Enzyme and Microbial Tech-
nology, 30, 445–453.
Harman, G.E., Howell, C.R., Viterbo, A., Chet, I., & Lorito, M. 2004. Tri-
choderma species–opportunistic, avirulent plant symbionts. Nature reviews.
Microbiology, 2(1), 43–56.
Hatvani, L., Antal, Z., Manczinger, L., Szekeres, A., Druzhinina, I.S., Kubicek,
C.P., Nagy, A., Nagy, E., Vagvolgyi, C., & Kredics, L. 2007. Green mold dis-

BIBLIOGRAPHY 170
eases of Agaricus and Pleurotus spp . are caused by related but phylogenetically
different Trichoderma species. Phytopathology, 97(4), 532–537.
He, J., Xu, Z., & Hughes, J. 2005. Pre-lysis washing improves DNA extraction
from a forest soil. Soil Biology and Biochemistry, 37(12), 2337–2341.
Herigstad, B., Hamilton, M., & Heersink, J. 2001. How to optimize the drop
plate method for enumerating bacteria. Journal of Microbiological Methods,
44(2), 121–9.
Hermosa, M.R., Grondola, I., & Monte, E. 1999. Isolation of Trichoderma
harzianum Th2 from commercial mushroom compost in Spain. Plant Disease,
83(6), 591.
Hernandez, R.C.L., Largeteau, M., Farnet, A.-M. nad Minvielle, N., Regnault-
Roger, C., & Savoie, J.-M. 2011. Phenotypic variability in cultivars and wild
strains of Agaricus brailiensis and Agaricus subrufescens. Pages 38–49 of: Pro-
ceedings of the 7th International Conference on Mushroom Biology and Mush-
room Products, vol. 2.
Hibbett, D.S, Binder, M., Bischoff, J.F., Blackwell, M., Cannon, P.F., Eriksson,
O.E., Huhndorf, S., James, T., Kirk, P.M., Lucking, R., Thorsten Lumbsch,
H., Lutzoni, F., Matheny, P.B., McLaughlin, David J., Powell, M.J., Red-
head, S., Schoch, C.L., Spatafora, J.W., Stalpers, J.A., Vilgalys, R., Aime,
M.C., Aptroot, A., Bauer, R., Begerow, D., Benny, G.L., Castlebury, L.A.,
Crous, P.W., Dai, Y.-C., Gams, W., Geiser, D.M., Griffith, G.W., Guei-
dan, C., Hawksworth, D.L., Hestmark, G., Hosaka, K., Humber, R.A., Hyde,
K.D., Ironside, J.E., Koljalg, U., Kurtzman, C.P., Larsson, K.-H., Lichtwardt,
R., Longcore, J., Miadlikowska, Jolanta, Miller, Andrew, Moncalvo, Jean-
Marc, Mozley-Standridge, Sharon, Oberwinkler, Franz, Parmasto, E., Reeb,
V., Rogers, J.D., Roux, C., Ryvarden, L., Sampaio, J. Paulo, Schussler, A.,
Sugiyama, J., Thorn, R.G., Tibell, L., Untereiner, W.A., Walker, C., Wang, Z.,
Weir, A., Weiss, M., White, M.M., Winka, K., Yao, Y.-J., & Zhang, N. 2007.
A higher-level phylogenetic classification of the Fungi. Mycological Research,
111(Pt 5), 509–547.

BIBLIOGRAPHY 171
Howeler, M., Ghiorse, W.C., & Walker, L.P. 2003. A quantitative analysis of
DNA extraction and purification from compost. Journal of Microbiological
Methods, 54, 37–45.
Hwang, C.-S., Baek, Y.-U., Yim, H.-S., & Kang, S.-O. 2003. Protective roles
of mitochondrial manganese-containing superoxide dismutase against various
stresses in Candida albicans. Yeast, 20(11), 929–941.
Hwang, C.-S.and Rhie, G., Oh, J.-H., Huh, W.-K., Yim, H.-S., & Kang, S.-
O. 2002. Copper- and zinc-containing superoxide dismutase (Cu/ZnSOD) is
required for the protection of Candida albicans against oxidative stresses and
the expression of its full virulence. Microbiology (Reading, England), 148(Pt
11), 3705–13.
Idress, H.A., Suliman, S.A., Omar, K.S., El-Komy, H.M.A, & Sarwar, M. 2012.
Occurrence and Microbiological Characteristics of Trichoderma in Al-Jabal Al-
Akhdar Region, Libya. Journal of Biological Sciences, 12, 209–217.
Iiyama, K., Stone, B.A., & Macauley, B.J. 1994. Compositional changes in com-
post during composting and growth of Agaricus bisporus. Applied and envi-
ronmental microbiology, 60(5), 1538–46.
Inbar, J., & Chet, I. 1995. The role of recognition in the induction of specific
chitinases during mycoparasitism by Trichoderma harzianum. Microbiology,
141(1), 2823–9.
Jess, S., Murchie, A.K., & Bingham, J.F.W. 2007. Potential sources of sciarid and
phorid infestations and implications for centralised phases I and II in mushroom
compost production. Crop protection, 26(4), 455–464.
Johnson, L.F., Bernard, E.C., & Qian, P. 1987. Isolation of Trichoderma spp.
at low temperatures from Tennessee and Alaska soils. Plant Disease, 71(2),
137–140.
Jokic, A., A., Frenkel, Vairavamurthy, M.A., & Huang, P.M. 2001. Birnessite
acalysis of the Maillard reactions: its signficance in natural humification. Geo-
physical research letters, 28(20), 2899–2902.

BIBLIOGRAPHY 172
Jordan, S.N., Mullen, G.J., & Murphy, M.C. 2008. Composition variability of
spent mushroom compost in Ireland. Bioresource technology, 99(2), 411–8.
Kang, D., Kim, J, Choi, N.J., Kwang-Hyeon, L., & Lee, C.H. 2011. Chemotaxon-
omy of Trichoderma spp. using mass spectrometry-based metabolite profiling.
Journal of Microbiology and Biotechnology, 21(1), 5–13.
Kaufman, D.D., Williams, L.E., & Sumner, C.B. 1963. Effect of plating medium
and incubation temperature on growth of fungi in soil-dilution plates. Canadian
Journal of Microbiology, 9(6), 741–751.
Keller, N.P., Turner, G., & Bennett, J.W. 2005. Fungal secondary metabolism -
from biochemistry to genomics. Nature reviews Microbiology, 3(12), 937–947.
Kim, Y., Nandakumar, M.P., & Marten, M.R. 2007. Proteomics of filamentous
fungi. Trends in Biotechnology, 25(9), 395–400.
Klein, D. 2002. Quantification using real-time PCR technology: applications and
limitations. Trends in Molecular Medicine, 8(6), 257–260.
Klemsdal, S.S., Hayes, C.K., Hjeljord, L., Lorito, M., Harman, G.E., & Tron-
smo, A. 1996. Isolation and characterization of a cDNA from Trichoderma
harzianum P1 encoding a 14-3-3 protein homolog. Gene, 171(1), 123–127.
Komon-Zelazowska, M., Bissett, J., Zafari, D., Hatvani, L., Manczinger, L., Woo,
S., Lorito, M., Kredics, L., Kubicek, C.P., & Druzhinina, I.S. 2007. Genetically
closely related but phenotypically divergent Trichoderma species cause green
mold disease in oyster mushroom farms worldwide. Applied and Environmental
Microbiology, 73(22), 7415–7426.
Konrad, M. 1992. Cloning and expression of the essential gene for guanylate
kinase from yeast. The Journal of Biological Chemistry, 267(36), 25652–5.
Kredics, L., Kocsube, S., Nagy, L., Komo-Zelazowska, M., Manczinger, L.,
Sajben, E., Nagy, A., Vagvolgyi, C., Kubicek, C.P., Druzhinina, I.S., & Hat-
vani, L. 2009. Molecular identification of Trichoderma species associated with
Pleurotus ostreatus and natural substrates of the oyster mushroom. FEMS
Microbiology Letters, 300(1), 58–67.

BIBLIOGRAPHY 173
Kredics, L., Jimenez, L.G., Naeimi, S., Czifra, D., Urban, P., Manczinger, L., &
Vagvolgyi, C. 2010. A challenge to mushroom growers : the green mould disease
of cultivated champignons. Pages 295–305 of: Current Research, Technology
and Education topics in Applied Microbiology and Microbial Biotechnology.
Krupke, O.A.t, Castle, A.J., & Rinker, D.L. 2003. The North American mush-
room competitor, Trichoderma aggressivum f. aggressivum, produces antifungal
compounds in mushroom compost that inhibit mycelial growth of the commer-
cial mushroom Agaricus bisporus . Mycological Research, 107(12), 1467–1475.
Kubicek, C.P., Herrera-Estrella, A., Seidl-Seiboth, V., Martinez, D.A., Druzhin-
ina, I.S., Thon, M., Zeilinger, S., Casas-Flores, S., Horwitz, B.A., Mukher-
jee, P.K., Mukherjee, M., Kredics, L., Alcaraz, L.D., Aerts, A., Antal, Z.,
Atanasova, L., Cervantes-Badillo, M.G., Challacombe, J., Chertkov, O., Mc-
Cluskey, K., Coulpier, F., Deshpande, N., von Dohren, H., Ebbole, D.J.,
Esquivel-Naranjo, E.U., Fekete, E., Flipphi, M., Glaser, F., Gomez-Rodrıguez,
E.Y., Gruber, S., Han, C., Henrissat, B., Hermosa, R., Hernandez-Onate, M,
Karaffa, L., Kosti, I., Le Crom, S., Lindquist, E., Lucas, S., Lubeck, M.,
Lubeck, P.S., Margeot, A., Metz, B., Misra, M., Nevalainen, H., Omann,
M., Packer, N., Perrone, G., Uresti-Rivera, E.E., Salamov, A., Schmoll, M.,
Seiboth, B., Shapiro, H., Sukno, S., Tamayo-Ramos, J.A., Tisch, D., Wiest,
A., Wilkinson, H.H., Zhang, M., Coutinho, P.M., Kenerley, C.M., Monte, E.,
Baker, S.E., & Grigoriev, I.V. 2011. Comparative genome sequence analysis
underscores mycoparasitism as the ancestral life style of Trichoderma. Genome
Biology, 12(4), R40.
Kullnig-Gradinger, C.M., Szakacs, G., & Kubicek, C.P. 2002. Phylogeny and evo-
lution of the genusTrichoderma : a multigene approach. Mycological Research,
106(7), 757–767.
Kurbanoglu, E.B., Algur, O.F., & Zulkadir, A. 2004. Submerged production of
edible mushroom Agaricus bisporus mycelium in ram horn hydrolysate. Indus-
trial Crops and Products, 19(3), 225–230.
Kuznetsov, V.V., Radyukina, N.L., & Shevyakova, N.I. 2006. Polyamines and
BIBLIOGRAPHY 174
stress: Biological role, metabolism, and regulation. Russian Journal of Plant
Physiology, 53(5), 583–604.
Lamb, C., & Dixon, R.A. 1997. The oxidative burst in plant disease resistance.
Annual Review of Plant Physiology and Plant Molecular Biology, 48(June),
251–275.
LaMontagne, M.G., Michel, F.C., Holden, P.A., & Reddy, C.A. 2002. Evaluation
of extraction and purification methods for obtaining PCR-amplifiable DNA
from compost for microbial community analysis. Journal of microbiological
methods, 49(3), 255–264.
Lane, C. 2010. Trichoderma green mould-diagnostic assays for improved disease
control. Tech. rept. Horticultural Development Company.
Largeteau, M.L., Iapicco, R., Savoie, J.-M., & Olivier, J.-M. 2000a. Green mould
disease in France: Trichoderma harzianum Th2 and other species causing dam-
age on mushroom farms. Mushroom Science XV: Science and Cultivation of
Edible Fungi, 15(2), 625–632.
Largeteau, M.L., Savoie, J.-M., & Olivier, J.-M. 2000b. Interactions between the
pathogen Trichoderma harzianum Th2 and Agaricus bisporus in mushroom
compost. Mycologia, 92(2), 233–240.
Largeteau, M.L., Latapy, C., Minvielle, N., Regnault-Roger, C., & Savoie, J.-M.
2010. Expression of phenol oxidase and heat-shock genes during the develop-
ment of Agaricus bisporus fruiting bodies, healthy and infected by Lecanicillium
fungicola. Applied Microbiology and Biotechnology, 85(5), 1499–507.
Lemmers, Geert. 2010. Trichoderma in Bulk Phase III (Part 1). Mushroom
Business, 40, 10–13.
Lew, R.R. 2011. How does a hypha grow? The biophysics of pressurized growth
in fungi. Nature reviews. Microbiology, 9(7), 509–18.
Li, B., Fu, Y., Jiang, D., Xie, J., Cheng, J., Li, G., Hamid, M.I., & Yi, X.
2010. Cyclic GMP as a second messenger in the nitric oxide-mediated conidia-
BIBLIOGRAPHY 175
tion of the mycoparasite Coniothyrium minitans. Applied and Environmental
Microbiology, 76(9), 2830–6.
Lopez-Mondejar, R., Anton, A., Raidl, S., Ros, M., & Pascual, J.A. 2010. Quan-
tification of the biocontrol agent Trichoderma harzianum with real-time Taq-
Man PCR and its potential extrapolation to the hyphal biomass. Bioresource
Technology, 101(8), 2888–2891.
Lu, M., Poulsen, S.K., Lu, P.S., Jensen, D.F., & Thrane, U. 2000. Identification
of Trichoderma strains from building materials by ITS1 ribotyping, UP-PCR
fingerprinting and UP-PCR cross hybridization. FEMS Microbiology Letters,
185, 129–134.
Ma, Z., & Michailides, T. 2007. Approaches for eliminating PCR inhibitors
and designing PCR primers for the detection of phytopathogenic fungi. Crop
Protection, 26(2), 145–161.
Mach, R.L., Peterbauer, C.K., Payer, K., Jaksits, S., Woo, S.L., Zeilinger, S.,
Kullnig, C.M., Lorito, M., & Kubicek, C.P. 1999. Expression of two major
chitinase genes of Trichoderma atroviride ( T . harzianum P1 ) is triggered by
different regulatory signals. Applied and Environmental Microbiology, 65(5),
1858–1863.
Maheshwari, R., Bharadwaj, G., & Bhat, M.K. 2000. Thermophilic Fungi : Their
Physiology and Enzymes. Society, 64(3).
Maniratanachote, R., Minami, K., Katoh, M., Nakajima, M., & Yokoi, T. 2006.
Dephosphorylation of ribosomal protein P0 in response to troglitazone-induced
cytotoxicity. Toxicology Letters, 166(3), 189–99.
Marra, R., Ambrosino, P., Carbone, V., Vinale, F., Woo, S.L., Ruocco, M.,
Ciliento, R., Lanzuise, S., Ferraioli, S., Soriente, I., Gigante, S., Turra, D.,
Fogliano, V., Scala, F., & Lorito, M. 2006. Study of the three-way interac-
tion between Trichoderma atroviride, plant and fungal pathogens by using a
proteomic approach. Current Genetics, 50(5), 307–21.

BIBLIOGRAPHY 176
Martin, G.R. 2008. Phase 1 issues today: a composter’s perspective. Pages
858–866 of: Science and cultivation of edible and medicinal fungi: Mushroom
Science XVII.
Martinez, D., Berka, R.M., Henrissat, B., Saloheimo, M., Arvas, M., Baker, S.E.,
Chapman, J., Chertkov, O., Coutinho, P.M., Cullen, D, Danchin, E.G.J., Grig-
oriev, I.V., Harris, P., Jackson, M., Kubicek, C.P., Han, C.S., Ho, I., Larrondo,
L.F., de Leon, A.L., Magnuson, J.K., Merino, S., Misra, M., Nelson, B., Put-
nam, N., Robbertse, B., Salamov, A.A., Schmoll, M., Terry, A., Thayer, N.,
Westerholm-Parvinen, A., Schoch, C.L., Yao, J., Barabote, R., Barbote, R.,
Nelson, M.A., Detter, C., Bruce, D., Kuske, C.R., Xie, G., Richardson, P.,
Rokhsar, D.S., Lucas, S.M., Rubin, E.M., Dunn-Coleman, N., Ward, M., &
Brettin, T.S. 2008. Genome sequencing and analysis of the biomass-degrading
fungus Trichoderma reesei (syn. Hypocrea jecorina). Nature biotechnology,
26(5), 553–560.
Mathesius, U. 2009. Comparative proteomic studies of root-microbe interactions.
Journal of Proteomics, 72(3), 353–66.
Meincke, R., Weinert, N., Radl, V., Schloter, M., Smalla, K., & Berg, G. 2010.
Development of a molecular approach to describe the composition of Tricho-
derma communities. Journal of Microbiological Methods, 80(1), 63–69.
Minkkinen, P. 2004. Practical applications of sampling theory. Chemometrics
and Intelligent Laboratory Systems, 74(1), 85–94.
M.M., Bradford. 1976. A rapid and sensitive method for the quantitation of
microgram quantities of protein utilizing the principle of protein-dye binding.
Analytical Biochemistry, 72(12), 248 – 254.
Montero-Barrientos, M., Hermosa, R., Cardoza, R.E., Gutierrez, S., & Monte, E.
2011. Functional analysis of the Trichoderma harzianum nox1 gene, encoding
an NADPH oxidase, relates production of reactive oxygen species to specific
biocontrol activity against Pythium ultimum. Applied and environmental mi-
crobiology, 77(9), 3009–16.

BIBLIOGRAPHY 177
Morris, E., Harrington, O., Doyle, O.P.E., & Clancy, K.J.C. 2000. Green mould
disease - The study of survival and dispersal characteristics of the weed mould
Trichoderma, in the Irish mushroom industry. Pages 645–652 of: Mushroom
Science XV: Science and Cultivation of Edible Fungi.
Munoz, C., Guillen, F., Martınez, A. T., & Martınez, M.J. 1997. Laccase isoen-
zymes of Pleurotus eryngii : characterization , catalytic properties , and par-
ticipation in activation of molecular oxygen and Mn2 + oxidation. Applied and
Environmental Microbiology, 63(6), 2166–2174.
Munoz, F. Garcıa-gil D. 2007. Free radical generation uring the activation of
hemolymph prepared from the homopteran Dactylopius coccus. Archives of
Insect Biochemistry and Physiology, 28(May), 20–28.
Mukherjee, P.K., Horwitz, B.A., & Kenerley, C.M. 2012. Secondary metabolism
in Trichoderma–a genomic perspective. Microbiology (Reading, England),
158(1), 35–45.
Mullis, K., Faloona, F., Scharf, S., Saiki, R., Horn, G., & Erlich, H. 1986. Specific
enzmatic amplification of DNA in vitro: the polymerase chain reaction. Cold
Spring Harbor Symposia on Quantitative Biology, 51(1), 263–273.
Mumpuni, A., Sharma, H.S.S., & Brown, A.E. 1998. Effect of metabolites pro-
duced by Trichoderma harzianum biotypes and Agaricus bisporus on their
respective growth radii in culture. Applied and Environmental Microbiology,
64(12), 5053–6.
Muthumeenakshi, S., Mills, P.R., Brown, A.E., & Seaby, D.A. 1994. Intraspecific
molecular variation among Trichoderma harzianum isolates colonizing mush-
room compost in the British Isles. Microbiology (Reading, England), 140(4),
769–777.
Muthumeenakshi, S., Brown, A.E., & Mills, P.R. 1998. Genetic comparison of
the aggressive weed mould strains of Trichoderma harzianum from mushroom
compost in North America and the British Isles. Plant Pathology, 102(4),
385–390.

BIBLIOGRAPHY 178
Nampoothiri, K.M., Baiju, T.V., Sandhya, C., Sabu, A., Szakacs, G., & Pandey,
A. 2004. Process optimization for antifungal chitinase production by Tricho-
derma harzianum. Process Biochemistry, 39(11), 1583–1590.
Nguyen, M.H., Husain, S.and Clancy, C.J., Peacock, J.E., Hung, C.-C., Kon-
toyiannis, D.P., Morris, A.J., Heath, C.H., Wagener, M., & Yu, V.L. 2010.
Outcomes of central nervous system cryptococcosis vary with host immune
function: results from a multi-center, prospective study. The Journal of Infec-
tion, 61(5), 419–426.
Nielsen, K.F., & Smedsgaard, J. 2003. Fungal metabolite screening : database of
474 mycotoxins and fungal metabolites for dereplication by standardised liquid
chromatography UV mass spectrometry methodology. Journal of Chromatog-
raphy A, 1002, 111–136.
Nielsen, N.-P.V., Carstensen, J.M., & Smedsgaard, J. 1998. Aligning of single and
multiple wavelength chromatographic profiles for chemometric data analysis
using correlation optimised warping. Journal of Chromatography A, 805(1-2),
17–35.
Nikoh, N., Hayase, N., Iwabe, N., Kuma, K., & Miyata, T. 1994. Phylogenetic
relationship of the kingdoms Animalia, Plantae, and Fungi, inferred from 23
different protein species. Molecular Biology and Evolution, 11(5), 762–768.
Noble, R.and Dobrovin-Pennington, A., & Spurdens, D. 2000. M 35:Determin-
ing the causes of mushroom water stress symptoms. Tech. rept. Horticultural
Development Company.
Noble, R., & Gaze, R.H. 1994. Controlled environment composting for mushroom
cultivation: substrates based on wheat and barley straw and deep litter poultry
manure. The Journal of Agricultural Science, 123, 71–79.
Noble, R., & Gaze, R.H. 1996. Preparation of mushroom (Agaricus bisporus)
composts in controlled environments: Factors influencing compost bulk density
and productivity. International Biodeterioration & Biodegradation, 37(1-2),
93–100.

BIBLIOGRAPHY 179
Noble, R., Fermor, T.R., Lincoln, S., Evered, C., Mead, A., & Li, R. 2003.
Primordia initiation of mushroom (Agaricus bisporus) strains on axenic casing
materials. Mycologia, 95(4), 620–629.
Ospina-Giraldo, M.D., Royse, D.J., Thon, M.R., Chen, X., & Romaine, C.P.
1998. Phylogenetic relationships of Trichoderma harzianum causing mushroom
green mold in Europe and North America to other species of Trichoderma
sources from world-wide. Mycologia, 90(1), 76–81.
Ospina-Giraldo, M.D., Royse, D.J., Chen, X., & Romaine, C.P. 1999. Molecular
phylogenetic analyses of biological control strains of Trichoderma harzianum
and other biotypes of Trichoderma spp. associated with mushroom green mold.
Phytopathology, 89(4), 308–13.
Otieno, W., Jeger, M., & Termorshuizen, A. 2003. Effect of infesting soil with
Trichoderma harzianum and amendment with coffee pulp on survival of Armil-
laria. Biological Control, 26(3), 293–301.
Parati, F., Altieri, R., Esposito, A., Lobianco, A., Pepi, M., Montesi, L., & Nair,
T. 2011. Validation of thermal composting process using olive mill solid waste
for industrial scale cultivation of Agaricus bisporus . International Biodeterio-
ration & Biodegradation, 65(1), 160–163.
Paredes, C., & Medina, E. 2009. Characterization of the Different Organic Matter
Fractions of Spent Mushroom Substrate. Communications in Soil Science and
Plant Analysis, 40, 150–161.
Pasini, E.M., Lutz, H.U., Mann, M., & Thomas, A.W. 2010. Red blood
cell (RBC) membrane proteomics–Part II: Comparative proteomics and RBC
patho-physiology. Journal of Proteomics, 73(3), 421–35.
Patyshakuliyeva, A., & De Vries, R.P. 2011. Biodegradation of carbohydrates
during the formation of Agaricus bisporus compost. Pages 197–202 of: Proceed-
ings of the 7th International Conference on Mushroom Biology and Mushroom
Products, vol. 1.

BIBLIOGRAPHY 180
Pecchia, J.A., Beyer, D.M., & Wuest, P.J. 2002. The effect of poultry manure
based formulations on odor generation during phase I mushroom composting.
Compost Science and Utilisation, 10(3), 186–196.
Pegg, A.E. 1986. Recent advances in the biochemistry of polyamines in eukary-
otes. The Biochemical Journal, 234(2), 249–262.
Perrone, S.T., McDonald, K.L., Sutherland, M.W., & Guest, D.I. 2003. Super-
oxide release is necessary for phytoalexin accumulation in Nicotiana tabacum
cells during the expression of cultivar-race and non-host resistance towards
Phytophthora spp. Physiological and Molecular Plant Pathology, 62(3), 127–
135.
Peskin, A.V. 1997. Cu,Zn-superoxide dismutase gene dosage and cell resistance
to oxidative stress: a review. Bioscience Reports, 17(1), 85–9.
Petersen, L., Dahl, C.K., & Esbensen, K.H. 2004. Representative mass reduction
in samplinga critical survey of techniques and hardware. Chemometrics and
Intelligent Laboratory Systems, 74(1), 95–114.
Petersen, L., Minkkinen, P., & Esbensen, K.H. 2005. Representative sampling
for reliable data analysis: Theory of Sampling. Chemometrics and Intelligent
Laboratory Systems, 77(1-2), 261–277.
Philippoussis, A., & Diamantopoulou, P. 2011. Agro-food industry and agricul-
tural residues conversion into high value products by mushroom cultivation.
Pages 339–351 of: Proceedings of the 7th International Conference on Mush-
room Biology and Mushroom Products, vol. 1.
Polizzi, V., Adams, A.N., Picco, A.M., Adriaens, E., Lenoir, J., Van Peteghem,
C., De Saeger, S., & De Kimpe, N. 2011. Influence of environmental conditions
on production of volatiles by Trichoderma atroviride in relation with the sick
building syndrome. Building and Environment, 46(4), 945–954.
Qin, W.M., & Lan, W.Z. 2004. Fungal elicitor-induced cell death in Taxus chi-
nensis suspension cells is mediated by ethylene and polyamines. Plant Science,
166(4), 989–995.

BIBLIOGRAPHY 181
Rao, J.R., Watabe, M., Stewart, T.A., Millar, B.C., & Moore, J.E. 2007. Pelleted
organo-mineral fertilisers from composted pig slurry solids, animal wastes and
spent mushroom compost for amenity grasslands. Waste management (New
York, N.Y.), 27(9), 1117–28.
Reales-Calderon, J.A., Martınez-Solano, L., Martınez-Gomariz, M., Nombela, C.,
Molero, G., & Gil, C. 2012. Sub-proteomic study on macrophage response to
Candida albicans unravels new proteins involved in the host defense against
the fungus. Journal of Proteomics, 75(15), 4734–4746.
Regnier, T., Combrick, S., Paley, K., & Beyer, D. 2012. Application regime for
disease control using thyme oil. Pages 384–389 of: Proceedings of the 18th
international congress on mushroom biology an mushroom science: Mushroom
Science XVIII.
Reuter, T., Xu, W., Alexander, T.W., Stanford, K., Xu, Y., & McAllister, T.A.
2009. Purification of polymerase chain reaction (PCR)-amplifiable DNA from
compost piles containing bovine mortalities. Bioresource technology, 100(13),
3343–3349.
Rich, B.E., & Steitz, J.A. 1987. Human acidic ribosomal phosphoproteins PO, P1,
and P2: analysis of cDNA clones , in vitro synthesis, and assembly. Molecular
and Cellular Biology, 7(11), 4065–4074.
Rifai, M.A. 1969. A revision of the genus Trichoderma. Mycology Papers, 116,
1–56.
Rinker, D.L. 1997. Sensitivity of spawn-run compost or casing to green mould
infection. Mushroom World.
Rinker, D.L., & Alm, G. 2000. Management of green mould disease in Canada.
Mushroom Science XV: Science and Cultivation of Edible Fungi.
Rinker, D.L., & Alm, G. 2008. Management of casing Trichoderma using fungi-
cides. Pages 496–509 of: Science and cultivation of edible and medicinal fungi:
Mushroom Science XVII.

BIBLIOGRAPHY 182
Robson, G.D., Wiebe, M.G., & Trinci, A.P. 1991. Exogenous cAMP and cGMP
modulate branching in Fusarium graminearum. Journal of General Microbiol-
ogy, 137(4), 963–9.
Romaine, C.P., Royse, D.J., & Schlagnhaufer, C. 2008. Emergence of
benzimidazole-resistant green mould, Trichoderma aggressivum, on cultivated
Agaricus bisporus in North America. Pages 510–523 of: Science and cultivation
of edible and medicinal fungi: Mushroom Science XVII.
Royse, D.J., & Chalupa, W. 2009. Effects of spawn, supplement and phase II com-
post additions and time of re-casing second break compost on mushroom (Agar-
icus bisporus) yield and biological efficiency. Bioresource technology, 100(21),
5277–82.
Royse, D.J., Boomer, K., Du, Y., Handckock, M., Coles, P.S., & Romaine, C.P.
1999. Spatial distribution of green mold foci in 30 commercial mushroom crops.
Plant Disease, 83(1), 71–76.
Rubio, M.B., Hermosa, R., Reino, J.L., Collado, I.G., & Monte, E. 2009. Thctf1
transcription factor of Trichoderma harzianum is involved in 6-pentyl-2H-
pyran-2-one production and antifungal activity. Fungal genetics and biology
: FG & B, 46(1), 17–27.
Samuels, G.J. 1996. Trichoderma: a review of biology and systematics of the
genus. Mycological Research, 100(8), 923–935.
Samuels, G.J., Dodd, S.L., Gams, W., Castlebury, L.A., & Petrini, O. 2002.
Trichoderma species associated with the green mold epidemic of commercially
grown Agaricus bisporus. Mycologia, 94(1), 146–170.
Samuels, G.J., Chaverri, P., Farr, D.F., & McCray, E.B. 2012. Trichoderma
Online. Systematic Mycology and Microbiology Laboratory, ARS, USDA, Re-
trieved October 9.
Sanchez, C. 2004. Modern aspects of mushroom culture technology. Applied
microbiology and biotechnology, 64(6), 756–62.

BIBLIOGRAPHY 183
Sanchez, J.E., Mejia, L., & Royse, D.J. 2008. Pangola grass colonized with
Scytalidium thermophilum for production of Agaricus bisporus . Bioresource
technology, 99(3), 655–62.
Santos, C., & Ballesta, J.P.G. 2002. Role of the ribosomal stalk components in
the resistance of Aspergillus fumigatus to the sordarin antifungals. Molecular
Microbiology, 43(1), 227–37.
Santos, C., Remacha, M., Ballesta, G., & Ballesta, J.P.G. 2004. Ribosomal
P0 protein domain involved in selectivity of antifungal sordarin derivatives.
Antimicrobial Agents and Chemotherapy, 48(8), 2930–2936.
Sanz, L., Chamorro, M.I., Rey, M., Bele, M., Llobell, A., Monte, E., &
Gonza, F.J. 2005. Proteomic analysis of secreted proteins from Trichoderma
harzianum. Identification of a fungal cell wall-induced aspartic protease. Fungal
Genetics and Biology, 42, 924–934.
Savoie, J.-M., & Mata, G. 1998. Extracellular laccase production during hyphal
interactions between Trichoderma sp . and Shiitake , Lentinula edodes. Applied
and Environmental Microbiology, 49, 589–593.
Savoie, J.-M., & Mata, G. 2003. Trichoderma harzianum metabolites pre-adapt
mushrooms to Trichoderma aggressivum antagonism. Mycologia, 95(2), 191–
199.
Savoie, J.-M., Iapicco, R., & Largeteau-Mamoun, M. 2001a. Factors influencing
the competitive saprophytic ability of Trichoderma harzianum Th2 in mush-
room (Agaricus bisporus ) compost. Mycological Research, 105(11), 1348–1356.
Savoie, J.-M., Mata, G., & Mamoun, M. 2001b. Variability in brown line forma-
tion and extracellular laccase production during interaction between white-rot
basidiomycetes and Trichoderma harzianum biotype Th2. Mycologia, 93(2),
243–248.
Savoie, J.-M., Vedie, R., Blanc, F., Minvielle, N., Rousseau, T., & Delegnes,
J.-P. 2011. Biomethane digestate from horse manure, a new waste usable in
compost for growing the button mushroom Agaricus bisporus? Pages 179–181

BIBLIOGRAPHY 184
of: Proceedings of the 7th International Conference on Mushroom Biology and
Mushroom Products, vol. 2.
Schickler, H., C.B., Danin-Gehald, Haran, S., & Chet, I. 1998. Electrophoretic
characterization of chitinases as a tool for the identification of Trichoderma
harzianum strains. Mycological Research, 102(3), 373–377.
Scrase, R. 1995. Cultivating mushrooms From pure culture to spawn production.
Mycologist, 9(2), 53–56.
Seaby, D.A. 1987. Infection of mushroom compost by Trichoderma species. Mush-
room Journal, 179, 355–361.
Seaby, D.A. 1989. Further observations on Trichoderma species. Mushroom
Journal, 197, 147–151.
Seaby, D.A. 1996a. Differentiation of Trichoderma taxa associated with mush-
room production. Plant Pathology, 45(5), 905–912.
Seaby, D.A. 1996b. Investigation of the epidemiology of green mould of mush-
room (Agaricus bisporus) compost caused by Trichoderma harzianum. Plant
Pathology, 45(5), 913–923.
Seidl, V., Marchetti, M., Schandl, R., Allmaier, G., & Kubicek, C.P. 2006. Epl1,
the major secreted protein of Hypocrea atroviridis on glucose, is a member of a
strongly conserved protein family comprising plant defense response elicitors.
The FEBS Journal, 273(18), 4346–59.
Seidl, V., Song, L., Lindquist, E., Gruber, S., Koptchinskiy, A., Zeilinger, S.,
Schmoll, M., Martınez, P., Sun, J., Grigoriev, I., Herrera-Estrella, A., Baker,
S.E., & Kubicek, C.P. 2009. Transcriptomic response of the mycoparasitic
fungus Trichoderma atroviride to the presence of a fungal prey. BMC genomics,
10(Jan.), 567.
Seneviratne, C.J., Wang, Y., Jin, L., Abiko, Y., & Samaranayake, L.P. 2010.
Proteomics of drug resistance in Candida glabrata biofilms. Proteomics, 10(7),
1444–54.

BIBLIOGRAPHY 185
Shamshad, A., Clift, A.D., & Mansfield, S. 2009. The effect of tibia morphology
on vector competency of mushroom sciarid flies. Journal of Applied Entomol-
ogy, 133(6), 484–490.
Sharma, H.S.S and, Cunha-B., Kilpatrick, M., Lyons, G., Wichers, H., & Hoozee,
J. 2008. Quality evaluation of gamma-irradiated cereal grains for spawn pro-
duction. Pages 413–436 of: Science and cultivation of edible and medicinal
fungi: Mushroom Science XVII.
Sharma, H.S.S., Kilpatrick, M., Lyons, G., & Burns, L. 1999. Colonisation of
phase II compost by biotypes of Trichoderma harzianum and their effect on
mushroom yield and quality. Applied Microbiology and Biotechnology, 51, 572–
578.
Sharma, H.S.S., Lyons, G, & Chambers, J. 2000. Comparison of the changes in
mushroom (Agaricus bisporus) compost during windrow and bunker stages of
phase I and II. Annals of Applied Biology, 136, 59–68.
Shevchenko, A., Tomas, H., Havlis, J., Olsen, J.V., & Mann, M. 2006. In-gel
digestion for mass spectrometric characterization of proteins and proteomes.
Nature Protocols, 1(6), 2856–60.
Silar, P. 2005. Peroxide accumulation and cell death in filamentous fungi induced
by contact with a contestant. Mycological Research, 109(2), 137–149.
Singh, A.D., Abdullah, N., & Vikineswary, S. 2003. Optimization of extraction of
bulk enzymes from spent mushroom compost. Journal of Chemical Technology
& Biotechnology, 78(7), 743–752.
Singh, S.K., Vijay, B., Mediratta, V., Ahlawat, O.P., & Kamal, S. 2005. Molecular
characterization of Humicola grisea isolates associated with Agaricus bisporus
compost. Current Science, 59(10), 1745–1748.
Slot, J.C., & Hibbett, D.S. 2007. Horizontal transfer of a nitrate assimilation
gene cluster and ecological transitions in fungi: a phylogenetic study. PloS
one, 2(10), e1097.

BIBLIOGRAPHY 186
Smedsgaard, J. 1997. Micro-scale extraction procedure for standardized screening
of fungal metabolite production in cultures. Journal of Chromatography A,
760(2), 264–70.
Sobieralski, K., Siwulski, M., Fruyska-Jozwiak, D., B laszczyk, L., Sas-Golak, I,
& Jasiska, A. 2010. Impact of infections with two Trichoderma aggressivum f.
europaeum isolates on the yielding of some wild strains of Agaricus bisporus
(Lange) Imbach. Journal of Plant Protection Research, 50(4), 501–504.
Sonnenberg, A.S.M., Baars, J.J.P., Hendrickx, P.M., Lavrijssen, B., Gao, W.,
Weijn, A., & Mes, J.J. 2011. Breeding and strain protection in the button
mushroom Agaricus bisporus. Pages 7–15 of: Proceedings of the 7th Interna-
tional Conference on Mushroom Biology and Mushroom Products, vol. 1.
Stajich, J.E., Berbee, M.L., Blackwell, M., Hibbett, D.S., Timothy, Y., Spatafora,
J.W., & Taylor, J.W. 2009. The Fungi. Current Biology, 19(18), 840–845.
Staniaszek, S., Szajko, K., Ulinski, Z., Szczech, M., & Marczewski, W. 2010.
BseGI restriction of the polymerase chain reaction amplicon Th444 is required
to distinguish biotypes of Trichoderma aggressivum causing serious losses in
mushroom (Agaricus bisporus) production. HortScience, 45(12), 1910–1911.
Staunton, L. 1987. Trichoderma green mould in mushroom compost. Mushroom
Journal, 179, 362–363.
Staunton, L., & Dunne, R. 1997. Integrated disease and pest control in Irish
mushroom tunnels. Tech. rept. Teagasc.
Stoknes, K., Høiland, K., Norgaard, E., & Hammer, P.J. 2008. From food to
waste to food - a high yield of mushrooms from food waste compost. Pages
272–285 of: Science and cultivation of edible and medicinal fungi: Mushroom
Science XVII.
Straatsma, G., Gerrits, J.P.G., Gerrits, T.M., op den Camp, H.J.M., & van
Griensven, L.J.L.D. 1991. Growth kinetics of Agaricus bisporus mycelium on
solid substrate (mushroom compost). Journal of General Microbiology, 137(7),
1471–1477.

BIBLIOGRAPHY 187
Taylor, J.W., Turner, E., Townsend, J.P., Dettman, J.R., & Jacobson, D. 2006.
Eukaryotic microbes, species recognition and the geographic limits of species:
examples from the kingdom Fungi. Philosophical transactions of the Royal
Society of London. Series B, Biological sciences, 361(1475), 1947–1963.
Tebbe, C.C., & Vahjen, W. 1993. Interference of humic acids and DNA extracted
directly from soil in detection and transformation of recombinant DNA from
bacteria and a yeast. Applied and Environmental Microbiology, 59(8), 2659–
2665.
ten Have, R., Wijngaard, H., Aries-Kronenburg, N. A. E., Straatsma, G., &
Schaap, P. J. 2003. Lignin degradation by Agaricus bisporus accounts for a 30%
increase in bioavailable holocellulose during cultivation on compost. Journal
of agricultural and food chemistry, 51(8), 2242–5.
Thornton, C.R., & Dewey, F.M. 1996. Detection of phialoconidia of Tricho-
derma harzianum in peat-bran by monoclonal antibody-based enzyme-linked
immunosorbent assay. Mycological Research, 100(2), 217–222.
Thrane, U., Poulsen, S.B., Nirenberg, H.I., & Lieckfeldt, E. 2001. Identification
of Trichoderma strains by image analysis of HPLC chromatograms. FEMS
Microbiology Letters, 203(2), 249–255.
Thy, P., Esbensen, K.H., & Jenkins, B.M. 2009. On representative sampling
and reliable chemical characterization in thermal biomass conversion studies.
Biomass and Bioenergy, 33(11), 1513–1519.
Tkachenko, A.G., & Fedotova, M.V. 2007. Dependence of protective functions of
Escherichia coli polyamines on strength of stress caused by superoxide radicals.
Biochemistry (Moscow), 72(1), 109–116.
Tønning, E., Nørgaard, L., Engelsen, S.B., Pedersen, L., & Esbensen, K.H. 2006.
Protein heterogeneity in wheat lots using single-seed NIT A Theory of Sam-
pling (TOS) breakdown of all sampling and analytical errors. Chemometrics
and Intelligent Laboratory Systems, 84(1-2), 142–152.

BIBLIOGRAPHY 188
Tornberg, K., & Olsson, S. 2002. Detection of hydroxyl radicals produced by
wood-decomposing fungi. FEMS Microbiology Ecology, 40(1), 13–20.
Tsujiyama, S., & Minami, M. 2005. Production of phenol-oxidizing enzymes in
the interaction between white-rot fungi. Mycoscience, 46(4), 268–271.
Unger, C., Kleta, S., Jandl, G., & Tiedemann, A. 2005. Suppression of the
defence-related oxidative burst in bean leaf tissue and bean suspension cells by
the necrotrophic pathogen Botrytis cinerea. Journal of Phytopathology, 26,
15–26.
Van Griensven, L.J.L.D., & Van Roestel, A.J.J. 2004. The cultivation of the but-
ton mushroom, Agaricus bisporus, in The Netherlands : a successful industry.
Revista Mexicana de Micologia, 19(12), 95–102.
Van Griensven, L.J.L.D., & Vogels, G. D. 1990. Biomass and biological activity
during the production of compost used as a substrate in mushroom cultivation.
Applied and environmental microbiology, 56(10), 3029–3034.
Verma, M., Brar, S.K., Tyagi, R.D., Surampalli, R.Y., & Valero, J.R. 2007. An-
tagonistic fungi, Trichoderma spp.: Panoply of biological control. Biochemical
Engineering Journal, 37(1), 1–20.
Vernooij, E.M.M. 2008. Casing, ’the skin of the substrate’: preparation and
management of the casing layer. Pages 875–898 of: Science and cultivation of
edible and medicinal fungi: Mushroom Science XVII.
Veuthey, A.-L., & Bittar, G. 1998. Phylogenetic relationships of fungi, plan-
tae, and animalia inferred from homologous comparison of ribosomal proteins.
Journal of Molecular Evolution, 47(1), 81–92.
Watabe, M., Rao, J.R., Xu, J., Millar, B.C., Ward, R.F., & Moore, J.E. 2004.
Identification of novel eubacteria from spent mushroom compost (SMC) waste
by DNA sequence typing: ecological considerations of disposal on agricultural
land. Waste management (New York, N.Y.), 24(1), 81–6.
Wenzel, M., & Bandow, J.E. 2011. Proteomic signatures in antibiotic research.
Proteomics, 11(15), 3256–68.

BIBLIOGRAPHY 189
Whittaker, R.H. 1969. New Concepts of Kingdoms of Organisms. Science,
163(3863), 150–160.
Williams, J., Clarkson, J.M., Mills, P.R., & Cooper, R.M. 2003a. A selective
medium for quantitative reisolation of Trichoderma harzianum from Agaricus
bisporus compost. Applied and Environmental Microbiology, 69(7), 4190–4191.
Williams, J., Clarkson, J.M., Mills, P.R., & Cooper, R.M. 2003b. Saprotrophic
and mycoparasitic components of aggressiveness of Trichoderma harzianum
groups toward the commercial mushroom Agaricus bisporus . Applied and En-
vironmental Microbiology, 69(7), 4192–4199.
Zarenejad, F., Yakhchali, B., & Rasooli, I. 2012. Evaluation of indigenous potent
mushroom growth promoting bacteria (MGPB) on Agaricus bisporus produc-
tion. World journal of microbiology & biotechnology, 28(1), 99–104.
Zipper, H. 2003. Mechanisms underlying the impact of humic acids on DNA
quantification by SYBR Green I and consequences for the analysis of soils and
aquatic sediments. Nucleic Acids Research, 31(7), 39e–39.