Molecular epidemiological studies in 1,3-butadiene exposed Czech workers: Female–male comparisons
15
Chemico-Biological Interactions 166 (2007) 63–77 Molecular epidemiological studies in 1,3-butadiene exposed Czech workers: Female–male comparisons Richard J. Albertini a,∗ , Radim J. Sram b , Pamela M. Vacek c , Jeremiah Lynch d, , Pavel Rossner b , Janice A. Nicklas a , Jake D. McDonald e , Gunnar Boysen f , Nadia Georgieva f , James A. Swenberg f a BioMosaics, Inc., 665 Spear Street, Burlington, VT 05401, United States b Laboratory of Genetic Ecotoxicology, Prague, Czech Republic c University of Vermont, Burlington, VT 05401, United States d Rumson NJ, United States e Lovelace Respiratory Research Institute, Albuquerque, MN, United States f University of North Carolina, Chapel Hill, NC, United States Available online 26 July 2006 The investigators dedicate this report to Jerry Lynch who was responsible for the exposure assessment design for both Czech studies. Jerry passed away during the conduct of this second study; he is greatly missed. Abstract Results of a recent molecular epidemiological study of 1,3-butadiene (BD) exposed Czech workers, conducted to compare female to male responses, have confirmed and extended the findings of a previously reported males only study (HEI Research Report 116, 2003). The initial study found that urine concentrations of the metabolites 1,2-dihydroxy-4-(acetyl) butane (M1) and 1-dihydroxy- 2-(N-acetylcysteinyl)-3-butene (M2) and blood concentrations of the hemoglobin adducts N-[2-hydroxy-3-butenyl] valine (HB-Val) and N-[2,3,4-trihydroxy-butyl] valine (THB-Val) constitute excellent biomarkers of exposure, both being highly correlated with BD exposure levels, and that GST genotypes modulate at least one metabolic pathway, but that irreversible genotoxic effects such as chromosome aberrations and HPRT gene mutations are neither associated with BD exposure levels nor with worker genotypes (GST [glutathione-S-transferase]-M1, GSTT1, CYP2E1 (5 promoter), CYP2E1 (intron 6), EH [epoxide hydrolase] 113, EH139, ADH [alcohol dehydrogenase]2 and ADH3). The no observed adverse effect level (NOAEL) for chromosome aberrations and HPRT mutations was 1.794 mg/m 3 (0.812ppm)—the mean exposure level for the highest exposed worker group in this initial study. The second Czech study, reported here, initiated in 2003, included 26 female control workers, 23 female BD exposed workers, 25 male control workers and 30 male BD exposed workers (some repeats from the first study). Multiple external exposure measurements (10 full 8-h shift measures by personal monitoring per worker) over a 4-month period before biological sample collections showed that BD workplace levels were lower than in the first study. Mean 8-h TWA exposure levels were 0.008mg/m 3 (0.0035 ppm) and 0.397 mg/m 3 (0.180 ppm) for female controls and exposed, respectively, but with individual single 8-h TWA values up to 9.793 mg/m 3 (4.45 ppm) in the exposed group. Mean male 8-h TWA exposure levels were 0.007 mg/m 3 (0.0032 ppm) and 0.808 mg/m 3 (0.370 ppm) for controls and exposed, respectively; however, the individual single 8-h TWA values up to 12.583 mg/m 3 (5.72 ppm) in the exposed group. While the urine metabolite concentrations for both M1 and M2 were elevated in exposed compared to control females, the ∗ Corresponding author. Tel.: +1 802 656 8346; fax: +1 802 656 5446. E-mail addresses: [email protected], [email protected] (R.J. Albertini). Deceased. 0009-2797/$ – see front matter © 2006 Elsevier Ireland Ltd. All rights reserved. doi:10.1016/j.cbi.2006.07.004
-
Upload
independent -
Category
Documents
-
view
1 -
download
0
Transcript of Molecular epidemiological studies in 1,3-butadiene exposed Czech workers: Female–male comparisons
A
t22aBa(Am
m(t0(fg
0
Chemico-Biological Interactions 166 (2007) 63–77
Molecular epidemiological studies in 1,3-butadiene exposedCzech workers: Female–male comparisons
Richard J. Albertini a,∗, Radim J. Sram b, Pamela M. Vacek c, Jeremiah Lynch d,�,Pavel Rossner b, Janice A. Nicklas a, Jake D. McDonald e,Gunnar Boysen f, Nadia Georgieva f, James A. Swenberg f
a BioMosaics, Inc., 665 Spear Street, Burlington, VT 05401, United Statesb Laboratory of Genetic Ecotoxicology, Prague, Czech Republic
c University of Vermont, Burlington, VT 05401, United Statesd Rumson NJ, United States
e Lovelace Respiratory Research Institute, Albuquerque, MN, United Statesf University of North Carolina, Chapel Hill, NC, United States
Available online 26 July 2006
The investigators dedicate this report to Jerry Lynch who was responsible for the exposure assessment design for both Czech studies.Jerry passed away during the conduct of this second study; he is greatly missed.
bstract
Results of a recent molecular epidemiological study of 1,3-butadiene (BD) exposed Czech workers, conducted to compare femaleo male responses, have confirmed and extended the findings of a previously reported males only study (HEI Research Report 116,003). The initial study found that urine concentrations of the metabolites 1,2-dihydroxy-4-(acetyl) butane (M1) and 1-dihydroxy--(N-acetylcysteinyl)-3-butene (M2) and blood concentrations of the hemoglobin adducts N-[2-hydroxy-3-butenyl] valine (HB-Val)nd N-[2,3,4-trihydroxy-butyl] valine (THB-Val) constitute excellent biomarkers of exposure, both being highly correlated withD exposure levels, and that GST genotypes modulate at least one metabolic pathway, but that irreversible genotoxic effects suchs chromosome aberrations and HPRT gene mutations are neither associated with BD exposure levels nor with worker genotypesGST [glutathione-S-transferase]-M1, GSTT1, CYP2E1 (5′ promoter), CYP2E1 (intron 6), EH [epoxide hydrolase] 113, EH139,DH [alcohol dehydrogenase]2 and ADH3). The no observed adverse effect level (NOAEL) for chromosome aberrations and HPRTutations was 1.794 mg/m3 (0.812 ppm)—the mean exposure level for the highest exposed worker group in this initial study.The second Czech study, reported here, initiated in 2003, included 26 female control workers, 23 female BD exposed workers, 25
ale control workers and 30 male BD exposed workers (some repeats from the first study). Multiple external exposure measurements10 full 8-h shift measures by personal monitoring per worker) over a 4-month period before biological sample collections showedhat BD workplace levels were lower than in the first study. Mean 8-h TWA exposure levels were 0.008 mg/m3 (0.0035 ppm) and
3
3 .397 mg/m (0.180 ppm) for female controls and exposed, respectively, but with individual single 8-h TWA values up to 9.793 mg/m4.45 ppm) in the exposed group. Mean male 8-h TWA exposure levels were 0.007 mg/m3 (0.0032 ppm) and 0.808 mg/m3 (0.370 ppm)or controls and exposed, respectively; however, the individual single 8-h TWA values up to 12.583 mg/m3 (5.72 ppm) in the exposedroup. While the urine metabolite concentrations for both M1 and M2 were elevated in exposed compared to control females, the∗ Corresponding author. Tel.: +1 802 656 8346; fax: +1 802 656 5446.E-mail addresses: [email protected], [email protected] (R.J. Albertini).
� Deceased.
009-2797/$ – see front matter © 2006 Elsevier Ireland Ltd. All rights reserved.doi:10.1016/j.cbi.2006.07.004
64 R.J. Albertini et al. / Chemico-Biological Interactions 166 (2007) 63–77
differences were not significant, possibly due to the relatively low BD exposure levels. For males, with greater BD exposures, theconcentrations of both metabolites were significantly elevated in urine from exposed compared to control workers. As in the firststudy, urine metabolite excretion patterns in both sexes revealed conjugation to be the minor detoxification pathway (yielding theM2 metabolite) but both M1 and M2 concentration values were lower in males in this second study compared to their concentrationsin the first, reflecting the lower external exposures of males in this second study compared to the first. Of note, females showedlower concentrations of both M1 and M2 metabolites in the urine per unit of BD exposure than did males while exhibiting the sameM1/(M1 + M2) ratio, reflecting the same relative utilization of the hydrolytic (producing M1) and the conjugation (producing M2)detoxification pathways as males. Assays for the N,N-(2,3-dihydroxy-1,4-butadyl) valine (pyr-Val) hemoglobin (Hb) adduct, whichis specific for the highly genotoxic 1,2,3,4-diepoxybutane (DEB) metabolite of BD, have been conducted on blood samples from allparticipants in this second Czech study. Any adduct that may have been present was below the limits of quantitation (LOQ) for thisassay for all samples, indicating that production of this important BD metabolite in humans is below levels produced in both miceand rats exposed to as little as 1.0 ppm BD by inhalation (J.A. Swenberg, M.G. Bird, R.J. Lewis, Future directions in butadiene riskassessment, Chem. Biol. Int. (2006), this issue). Results of assays for the HB-Val and THB-Val hemoglobin adducts are pending.HPRT mutations, determined by cloning assays, and multiple measures of chromosome level changes (sister-chromatid exchanges[SCE], aberrations determined by conventional methods and FISH) again showed no associations with BD exposures, confirmingthe findings of the initial study that these irreversible genotoxic changes do not arise in humans occupationally exposed to low levelsof BD. Except for lower production of both urine metabolites in females, no female–male differences in response to BD exposureswere detected in this study. As in the initial study, there were no significant genotype associations with the irreversible genotoxicendpoints. However, as in the first, differences in the metabolic detoxification of BD as reflected in relative amounts of the M1 andM2 urinary metabolites were associated with genotypes, this time both GST and EH.© 2006 Elsevier Ireland Ltd. All rights reserved.
2 met
Keywords: 1,3-Butadiene; Molecular epidemiology; M1 metabolite; MGenotypes; Risk assessment1. Introduction and background
Biomarker responses in humans can reflect toxico-logical mechanisms as well as internal exposures, sus-ceptibility or effects. Several studies describing suchresponses in 1,3-butadiene (BD) exposed workers havebeen reported over the past 15 years [reviewed in 1–3].Study design has evolved over that period. Originallysmall and focused on one or two biomarkers, theseinvestigations have become more comprehensive. How-ever, most have still suffered from a lack of exten-sive BD exposure assessments and/or identification ofpotential confounding agents. Not surprisingly, resultshave been conflicting. Although urinary metabolites andhemoglobin (Hb) adducts have emerged as potentiallyuseful biomarkers of exposure, it is not clear from theweight of evidence if irreversible genotoxic effects suchas chromosome aberrations or somatic gene mutationshave been associated with BD exposures. Investigationsof susceptibility, as reflected by metabolic genotypes,have also produced mixed results.
In an attempt to resolve inconsistencies in past stud-ies, a large-scale international, multi-institution molec-ular epidemiological study of BD exposed Czech BD
workers was initiated in 1998 and reported in 2003 [1,2].The Czech population investigated was the same as thatinvestigated in several earlier smaller studies; investiga-tors who had previously reported either negative or posi-abolite; pyr-Val adducts; HPRT mutations; Chromosome aberrations;
tive results were collaborators, as were additional inves-tigators who measured the same or additional endpoints.
Prior to initiating this first Czech study, an elabo-rate blinding scheme was developed whereby individualworkers were assigned random numbers. Different frac-tions of the same urine or blood sample also received dif-ferent numbers, each referenced to the individual worker,with the key to the overall blinding scheme known onlyto the central study office. Blinding codes were brokenfor individual investigators only after all samples in anylaboratory had been analyzed and the report filed.
BD exposures were assessed by 10 independent8-h personal monitoring measurements (on average)conducted over a 2-month period for each potentiallyexposed worker. Ambient air BD levels and co-exposuresto toluene, styrene and benzene (by personal monitorsand air samples) were also measured. Blood and urinesamples were collected, the latter on three occasions atthe end of the exposure assessment period. Samples werefractionated, blinded, cryo-preserved and subsequentlysent to collaborating laboratories.
This first Czech study included a total of 83 sub-jects: 24 BD monomer production workers (meanBD exposure = 0.642 mg/m3 [0.290 ppm]), 34 poly-
merization workers (mean BD exposure = 1.794 mg/m3[0.812 ppm]) and 25 controls (mean BD expo-sure = 0.023 mg/m3 [0.010 ppm]). Mean exposures forindividual workers (approximately 10 full 8-h shift
ologica
mm9attta[cwem
[scMSc(tb3dtaHaiE
aantsai(reRistawm(pt
R.J. Albertini et al. / Chemico-Bi
easurements per worker over an approximately 2-onth period) ranged up to 3.51 mg/m3 (1.60 ppm) and
.24 mg/m3 (4.20 ppm) BD in the monomer productionnd polymerization facilities, respectively. Comparedo controls, group mean 1,2-dihydroxy-4-[N-acetylcys-einyl]-butane (M1) and 1-dihydroxy-2-[N-acetylcys-einyl]-3-butene (M2) urine metabolite concentrationsnd N-[2-hydroxy-3-butenyl] valine (HB-Val) and N-2,3,4-trihydroxy-butyl] valine (THB-Val) adduct con-entrations were all elevated in the exposed groups andere significantly correlated with workers’ mean BD
xposure levels. The Hb adduct concentrations were theost precise biomarkers of exposure.The ratio of urinary metabolite concentrations
M1/(M1 + M2)] was approximately 0.99 in this initialtudy. As M1 is a product of the hydrolytic detoxifi-ation pathway (mediated by epoxide hydrolase) and2 derives from conjugation (mediated by glutathione-
-transferase), this finding confirmed that BD detoxifi-ation in humans relies almost entirely on the former[2,4] and references therein). Hb adduct concentra-ions also reflect internal BD metabolism, with HB-Valeing derived from oxidation of BD to 1,2-dihydroxy--butene (EB) and THB-Val being formed from 1,2-ihydroxy-3,4-epoxybutane (EBD), itself a product ofhe hydrolytic detoxification pathway [2,5]. THB-Valdduct concentrations were 300–400-fold higher thanB-Val adduct concentrations in the first Czech study,
lso reflecting the dominance of the hydrolytic pathwayn producing greater in vivo accumulations of EBD thanB in humans.
Despite the well documented external BD exposures,nd the urinary metabolites and Hb adducts revealingppreciable internal doses in exposed workers, there waso evidence of irreversible DNA genotoxicity (muta-ions or chromosome aberrations) related to BD expo-ure (determined by either the direct measurements ors reflected by the urinary metabolite or adduct levels)n this initial study. Neither sister chromatid exchangeSCE) frequencies nor high frequency cells (HFC) wereelated to the BD exposures themselves or to theirstimates, using the surrogate biomarkers of exposure.egression analyses showed no relationships between
ndividual BD exposures (means of the multiple mea-urements per worker over 2 months) and HPRT muta-ions, chromosome aberrations or SCEs, regardless ofssay methods employed. Several metabolic genotypesere determined: GSTM1, GSTT1, CYP2E1 (5′ pro-
oter region), CYP2E1 (intron 6), EH113, EH139, ADHalcohol dehydrogenase)2 and ADH3. GST polymor-hisms did influence BD metabolism as reflected by rela-ive M1 and M2 metabolite concentrations in urine, with
l Interactions 166 (2007) 63–77 65
the null genotypes being associated with lower activityin the conjugation detoxification pathway. However, noother endpoints were affected by genotype. Specifically,combinations of the EH polymorphisms specifying low,intermediate or high enzyme activity were unrelated toany of the endpoints measured.
Only male workers were included in this initialCzech study. The no observed adverse level (NOAEL)of 1.794 mg/m3 (0.812 ppm) for irreversible genotoxiceffects (HPRT mutations or chromosome aberrations)was based on the group mean BD exposure level of thehighest exposed group, i.e. the polymerization work-ers. In order to evaluate the possibility that femalesmay be more susceptible to BD genotoxicity thanmales, a second similar study including females wasinitiated in 2003. The second study differed from thefirst in that a longer exposure assessment period wasemployed (4 months) to include the entire life-span ofhuman red blood cells (RBCs). The autographic assay,as a second measure of HPRT mutations, was elim-inated and additional genotype polymorphisms weredetermined. Importantly, a recently developed assay forthe N,N-[2,3-dihydroxy-1,4-butadyl] valine (pyr-Val)adduct, which is specific for the highly genotoxic 1,2,3,4-dihydroxybutane (DEB) metabolite of BD, was added[6]. Results are reported here.
2. Study design and methods
Study design and methods were largely as reportedfor the first study with the subtractions and additionsnoted above [1,2]. Exposure assessment measurements,questionnaire administrations and biological sample col-lections were conducted at the industrial facility inthe Czech Republic. Chemical analyses of exposurebadges were performed by the EcoChem Company inPrague. Biological samples were processed, fraction-ated, labeled, cryo-preserved and subsequently sent byAir Express to collaborating laboratories by the Labora-tory of Genetic Toxicology in Prague. Cytogenetic anal-yses were also conducted at this facility. Urine metabolitedeterminations were made at the Lovelace RespiratoryResearch Institute in Albuquerque. Hb adduct assayswere conducted at the University of North Carolina.HPRT gene mutations were measured in Burlington,as were worker genotype determinations. All data wereanalyzed by the Central Study Office in Burlington.
2.1. Blinding
Random numbers generated in the Central StudyOffice (Burlington) were sent to Prague for assignment

ologica
66 R.J. Albertini et al. / Chemico-Bito workers at the beginning of the exposure assessmentperiod and to fractions of biological samples after theirprocessing.
2.2. Study subjects
One hundred and four workers from the same indus-trial facility that took part in the first study volunteeredfor the current study: 49 females and 55 males. Twenty-six of the female subjects were administrative controlsand 23 worked in a laboratory setting. Twenty-five ofthe male subjects were administrative controls and 30were drawn from a polymerization unit. All partici-pants completed questionnaires, as in the first study, withmodifications to include female-specific questions. Allparticipants signed informed consent forms approved byboth the Institutional Review Board of the University ofVermont and the Bohemian Institute of Hygiene. Theresearch conformed to the Helsinki Principles.
2.3. Exposure assessment
BD exposures were measured by personal monitoringusing diffusive solid sorbent tubes for 8-h work shifts on10 separate occasions over a 4-month interval for eachof the 104 study subjects. Ambient air samples werealso analyzed for BD concentrations. Co-exposures totoluene, styrene, and benzene were measured by per-sonal monitoring on a single occasion and by ambient airsampling. All tubes were collected at the work facilityby representatives of the EcoChem Company of Prague,where chemical analyses were performed.
2.4. Genotyping
Genotyping was performed in Burlington using asmall portion of samples sent for HPRT mutation stud-ies. The same metabolic genes analyzed in the first studywere again analyzed with the addition of a PCR-basedmethod to detect GST heterozygosity. Methods wereessentially as described for the first study, i.e. PCR forGST null genotypes and PCR followed by digestion withappropriate restriction enzymes for the others.
2.5. Sample acquisition, processing and blinding
Spot urine samples were collected before and aftershifts on the last 3 days of the exposure assessment
period. Blood samples were collected only on the lastday. All samples were obtained in the medical unit ofthe work facility and transported on ice to the Labo-ratory of Genetic EcoToxicology in Prague where theyl Interactions 166 (2007) 63–77
were immediately processed. Processing included frac-tionating the blood samples into components and cryo-preserving in the vapor phase of liquid nitrogen. Wholeblood cultures for cytogenetic analyses were establishedat that time. Urine samples were frozen at −70 ◦C. Allworkers and sample aliquots were labeled with uniquecode numbers. Coded cryo-preserved aliquots of appro-priate samples were later shipped (by air express) in “dryshippers” (liquid nitrogen vapor) or on ice (urine sam-ples) to participating laboratories performing the variousbiomarker assays. All assays were conducted blindly,with results electronically transmitted to the BiometryFacility of the University of Vermont for statistical anal-yses. Codes were broken only after all assays from thecollaborating laboratory had been completed. (Codes didnot have to be broken for interpretation of the pyr-Valadduct determinations as all samples were below thelimit of quantitation (LOQ) for the method (see below).Therefore, RBC samples remain blinded for the subse-quent HB-Val and THB-Val adduct determinations.)
2.6. Biomarker assays
The different biomarkers in blood or urine wereassayed using the following methods. The investigatorsresponsible for the different biomarker assays or statis-tical analyses are indicated.
2.6.1. Urine metabolites (JCM)Urine concentrations of the M1 and M2 metabolite
concentrations were determined in coded samplesusing high-pressure liquid chromatographic separationand triple quadruple mass spectrometry (LC/MS)after isolation by solid phase extraction, as describedpreviously [7].
2.6.2. pyr-Val Hb adducts (JAS)The newly developed immunoaffinity LC-MS/MS
assay for the pyr-Val adduct was used to analyze 50 mgglobin from each of the 104 RBC samples collected inthis study exactly as described elsewhere [6]. RBCs havebeen cryo-preserved for HB-Val and THB-Val assaysdeterminations, but results are not yet available.
2.6.3. HPRT gene mutations (RJA)HPRT mutations in T-cells were measured by cloning
assays performed as described elsewhere [8]. After thaw-ing, cells were plated in limiting dilutions with or without
thioguanine selection and were scored for colony forma-tion. Cloning efficiencies (CE) were calculated by use ofthe Poisson relationship, P0 = e−x, where P0 is the frac-tion of wells without colony growth and x is the average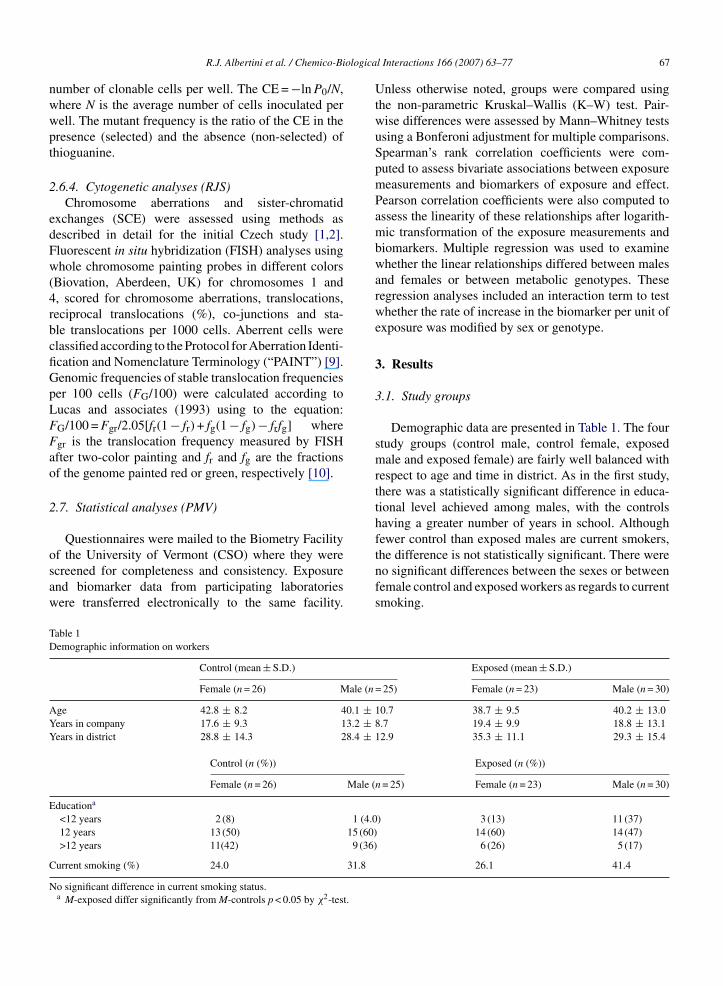
ologica
nwwpt
2
edFw(4rbcfiGpLFFao
2
osaw
fewer control than exposed males are current smokers,
TD
AYY
E
C
N
R.J. Albertini et al. / Chemico-Bi
umber of clonable cells per well. The CE = −ln P0/N,here N is the average number of cells inoculated perell. The mutant frequency is the ratio of the CE in theresence (selected) and the absence (non-selected) ofhioguanine.
.6.4. Cytogenetic analyses (RJS)Chromosome aberrations and sister-chromatid
xchanges (SCE) were assessed using methods asescribed in detail for the initial Czech study [1,2].luorescent in situ hybridization (FISH) analyses usinghole chromosome painting probes in different colors
Biovation, Aberdeen, UK) for chromosomes 1 and, scored for chromosome aberrations, translocations,eciprocal translocations (%), co-junctions and sta-le translocations per 1000 cells. Aberrent cells werelassified according to the Protocol for Aberration Identi-cation and Nomenclature Terminology (“PAINT”) [9].enomic frequencies of stable translocation frequencieser 100 cells (FG/100) were calculated according toucas and associates (1993) using to the equation:G/100 = Fgr/2.05[fr(1 − fr) + fg(1 − fg) − frfg] wheregr is the translocation frequency measured by FISHfter two-color painting and fr and fg are the fractionsf the genome painted red or green, respectively [10].
.7. Statistical analyses (PMV)
Questionnaires were mailed to the Biometry Facility
f the University of Vermont (CSO) where they werecreened for completeness and consistency. Exposurend biomarker data from participating laboratoriesere transferred electronically to the same facility.able 1emographic information on workers
Control (mean ± S.D.)
Female (n = 26) Male (n
ge 42.8 ± 8.2 40.1 ± 1ears in company 17.6 ± 9.3 13.2 ± 8ears in district 28.8 ± 14.3 28.4 ± 1
Control (n (%))
Female (n = 26) Male (
ducationa
<12 years 2 (8) 1 (4.012 years 13 (50) 15 (60)>12 years 11(42) 9 (36)
urrent smoking (%) 24.0 31.8
o significant difference in current smoking status.a M-exposed differ significantly from M-controls p < 0.05 by χ2-test.
l Interactions 166 (2007) 63–77 67
Unless otherwise noted, groups were compared usingthe non-parametric Kruskal–Wallis (K–W) test. Pair-wise differences were assessed by Mann–Whitney testsusing a Bonferoni adjustment for multiple comparisons.Spearman’s rank correlation coefficients were com-puted to assess bivariate associations between exposuremeasurements and biomarkers of exposure and effect.Pearson correlation coefficients were also computed toassess the linearity of these relationships after logarith-mic transformation of the exposure measurements andbiomarkers. Multiple regression was used to examinewhether the linear relationships differed between malesand females or between metabolic genotypes. Theseregression analyses included an interaction term to testwhether the rate of increase in the biomarker per unit ofexposure was modified by sex or genotype.
3. Results
3.1. Study groups
Demographic data are presented in Table 1. The fourstudy groups (control male, control female, exposedmale and exposed female) are fairly well balanced withrespect to age and time in district. As in the first study,there was a statistically significant difference in educa-tional level achieved among males, with the controlshaving a greater number of years in school. Although
the difference is not statistically significant. There wereno significant differences between the sexes or betweenfemale control and exposed workers as regards to currentsmoking.
Exposed (mean ± S.D.)
= 25) Female (n = 23) Male (n = 30)
0.7 38.7 ± 9.5 40.2 ± 13.0.7 19.4 ± 9.9 18.8 ± 13.12.9 35.3 ± 11.1 29.3 ± 15.4
Exposed (n (%))
n = 25) Female (n = 23) Male (n = 30)
) 3 (13) 11 (37)14 (60) 14 (47)
6 (26) 5 (17)
26.1 41.4
68 R.J. Albertini et al. / Chemico-Biological Interactions 166 (2007) 63–77
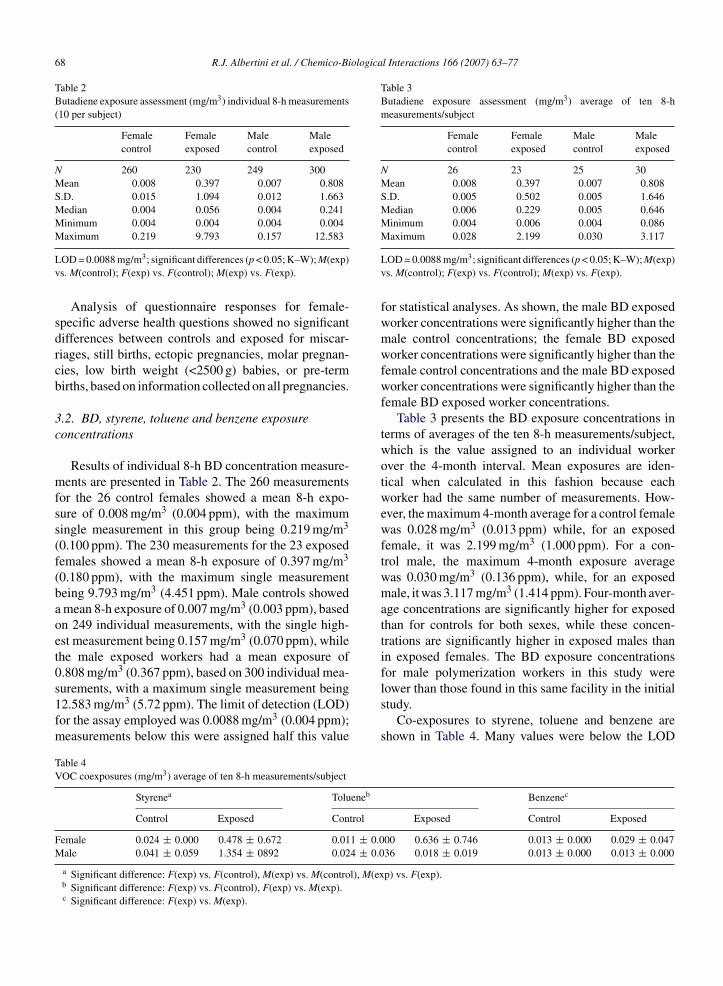
Table 2Butadiene exposure assessment (mg/m3) individual 8-h measurements(10 per subject)
Femalecontrol
Femaleexposed
Malecontrol
Maleexposed
N 260 230 249 300Mean 0.008 0.397 0.007 0.808S.D. 0.015 1.094 0.012 1.663Median 0.004 0.056 0.004 0.241Minimum 0.004 0.004 0.004 0.004
Table 3Butadiene exposure assessment (mg/m3) average of ten 8-hmeasurements/subject
Femalecontrol
Femaleexposed
Malecontrol
Maleexposed
N 26 23 25 30Mean 0.008 0.397 0.007 0.808S.D. 0.005 0.502 0.005 1.646Median 0.006 0.229 0.005 0.646Minimum 0.004 0.006 0.004 0.086Maximum 0.028 2.199 0.030 3.117
Maximum 0.219 9.793 0.157 12.583LOD = 0.0088 mg/m3; significant differences (p < 0.05; K–W); M(exp)vs. M(control); F(exp) vs. F(control); M(exp) vs. F(exp).
Analysis of questionnaire responses for female-specific adverse health questions showed no significantdifferences between controls and exposed for miscar-riages, still births, ectopic pregnancies, molar pregnan-cies, low birth weight (<2500 g) babies, or pre-termbirths, based on information collected on all pregnancies.
3.2. BD, styrene, toluene and benzene exposureconcentrations
Results of individual 8-h BD concentration measure-ments are presented in Table 2. The 260 measurementsfor the 26 control females showed a mean 8-h expo-sure of 0.008 mg/m3 (0.004 ppm), with the maximumsingle measurement in this group being 0.219 mg/m3
(0.100 ppm). The 230 measurements for the 23 exposedfemales showed a mean 8-h exposure of 0.397 mg/m3
(0.180 ppm), with the maximum single measurementbeing 9.793 mg/m3 (4.451 ppm). Male controls showeda mean 8-h exposure of 0.007 mg/m3 (0.003 ppm), basedon 249 individual measurements, with the single high-est measurement being 0.157 mg/m3 (0.070 ppm), whilethe male exposed workers had a mean exposure of0.808 mg/m3 (0.367 ppm), based on 300 individual mea-
surements, with a maximum single measurement being12.583 mg/m3 (5.72 ppm). The limit of detection (LOD)for the assay employed was 0.0088 mg/m3 (0.004 ppm);measurements below this were assigned half this valueTable 4VOC coexposures (mg/m3) average of ten 8-h measurements/subject
Styrenea Tolueneb
Control Exposed Control
Female 0.024 ± 0.000 0.478 ± 0.672 0.011 ± 0.0Male 0.041 ± 0.059 1.354 ± 0892 0.024 ± 0.0
a Significant difference: F(exp) vs. F(control), M(exp) vs. M(control), M(exb Significant difference: F(exp) vs. F(control), F(exp) vs. M(exp).c Significant difference: F(exp) vs. M(exp).
LOD = 0.0088 mg/m3; significant differences (p < 0.05; K–W); M(exp)vs. M(control); F(exp) vs. F(control); M(exp) vs. F(exp).
for statistical analyses. As shown, the male BD exposedworker concentrations were significantly higher than themale control concentrations; the female BD exposedworker concentrations were significantly higher than thefemale control concentrations and the male BD exposedworker concentrations were significantly higher than thefemale BD exposed worker concentrations.
Table 3 presents the BD exposure concentrations interms of averages of the ten 8-h measurements/subject,which is the value assigned to an individual workerover the 4-month interval. Mean exposures are iden-tical when calculated in this fashion because eachworker had the same number of measurements. How-ever, the maximum 4-month average for a control femalewas 0.028 mg/m3 (0.013 ppm) while, for an exposedfemale, it was 2.199 mg/m3 (1.000 ppm). For a con-trol male, the maximum 4-month exposure averagewas 0.030 mg/m3 (0.136 ppm), while, for an exposedmale, it was 3.117 mg/m3 (1.414 ppm). Four-month aver-age concentrations are significantly higher for exposedthan for controls for both sexes, while these concen-trations are significantly higher in exposed males thanin exposed females. The BD exposure concentrationsfor male polymerization workers in this study were
lower than those found in this same facility in the initialstudy.Co-exposures to styrene, toluene and benzene areshown in Table 4. Many values were below the LOD
Benzenec
Exposed Control Exposed
00 0.636 ± 0.746 0.013 ± 0.000 0.029 ± 0.04736 0.018 ± 0.019 0.013 ± 0.000 0.013 ± 0.000
p) vs. F(exp).
ological Interactions 166 (2007) 63–77 69
apLtLfsewcsawtce
3
dspomfsdswHvloTc
s
TM
F
M
Mper
Table 6M2 after work urine concentrations by group and sex (�g/L)
N Mean S.D.
FemaleControl 26 8.3 10.1Exposed 23 19.2 27.5
MaleControl 25 14.9 10.3Exposed 30 47.9 44.3
Male exposed significantly greater than male control (K–W test;
R.J. Albertini et al. / Chemico-Bi
nd were assigned half the LOD for statistical pur-oses. Forty-six workers had styrene levels above theOD; 22 had toluene levels above the LOD while only
hree (all exposed females) had benzene levels above theOD. All female controls had levels below the LOD
or all three volatile organic chemicals (VOCs) mea-ured. There were some significant differences in thesexposure levels between study groups: male BD exposedorker styrene concentrations were higher than male
ontrols; female BD exposed worker concentrations oftyrene and toluene were higher than female controls;nd male BD exposed worker styrene concentrationsere higher than female BD exposed worker concen-
rations, while female BD exposed workers had higheroncentrations of toluene and benzene than male BDxposed workers.
.3. Urine M1 and M2 metabolites
M1 and M2 metabolite concentrations in urine wereetermined for all study subjects before and after workhifts on a day of BD exposure measurement. Urine sam-les were obtained from all workers on the last three daysf the BD exposure assessment period. To date, urineetabolite concentrations have been determined only
or the first of these samples from each worker. Beforehift concentrations, after shift concentrations, and theirifference, were analyzed, and all analyses led to theame overall conclusions. Analyses were also done bothith and without correction for creatinine concentration.owever, adjustment for creatinine did not reduce theariability of the metabolite measurements and is prob-ematic for comparison of males and females becausef sex differences in creatinine excretion (see below).
herefore, only after work shift values uncorrected forreatinine are presented here.Table 5 shows after work M1 concentrations by expo-ure group and sex. The mean concentration for control
able 51 after work urine concentrations by group and sex (�g/L)
N Mean S.D.
emaleControl 26 331.6 284.9Exposed 23 508.1 597.4
aleControl 25 512.8 272.1Exposed 30 854.1 567.0
ale exposed significantly greater than male control (K–W test;< 0.05). Female exposed vs. female control: NS. Male control andxposed significantly different from female control and exposed,espectively (p < 0.05).
p < 0.05). Male control and exposed significantly greater than femalecontrol and exposed, respectively (p < 0.05).
females was 331.6 ± 284.9 �g/L while, for BD exposedfemales, it was 508.1 ± 597.4 �g/L. While the meanvalue was elevated in the exposed group, the differ-ence is not statistically significant. Control males hada group mean M1 concentration of 512.8 ± 272.1 �g/Lwhile BD exposed males had a group mean concentrationof 854.1 ± 567.0 �g/L. This mean difference is statisti-cally significant, as are the mean higher values for malecontrols and BD exposed workers as compared to femalecontrols and BD exposed workers, respectively.
After work M2 concentrations for these groups areshown in Table 6. These values are much lower thanthe M1 values, with female controls having a mean of8.3 ± 10.1 �g/L compared to female BD exposed work-ers having a mean of 19.2 ± 27.5 �g/L. While elevated inthe exposed group, this difference is not statistically sig-nificant. Male controls had a mean M2 concentration of14.9 ± 10.3 �g/L compared to male BD exposed work-ers with a mean concentration of 47.9 ± 44.3 �g/L. Thehigher mean concentration in the exposed, compared tothe control group, is significantly different, as are themale control and BD exposed worker values comparedto the female control and BD exposed worker values,respectively.
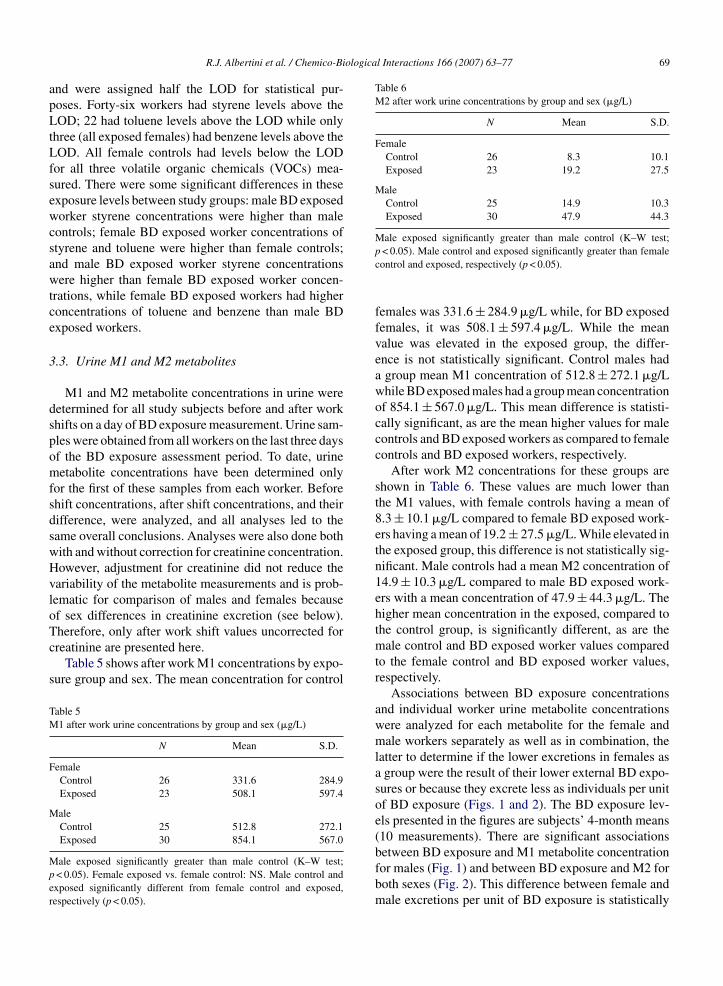
Associations between BD exposure concentrationsand individual worker urine metabolite concentrationswere analyzed for each metabolite for the female andmale workers separately as well as in combination, thelatter to determine if the lower excretions in females asa group were the result of their lower external BD expo-sures or because they excrete less as individuals per unitof BD exposure (Figs. 1 and 2). The BD exposure lev-els presented in the figures are subjects’ 4-month means(10 measurements). There are significant associations
between BD exposure and M1 metabolite concentrationfor males (Fig. 1) and between BD exposure and M2 forboth sexes (Fig. 2). This difference between female andmale excretions per unit of BD exposure is statistically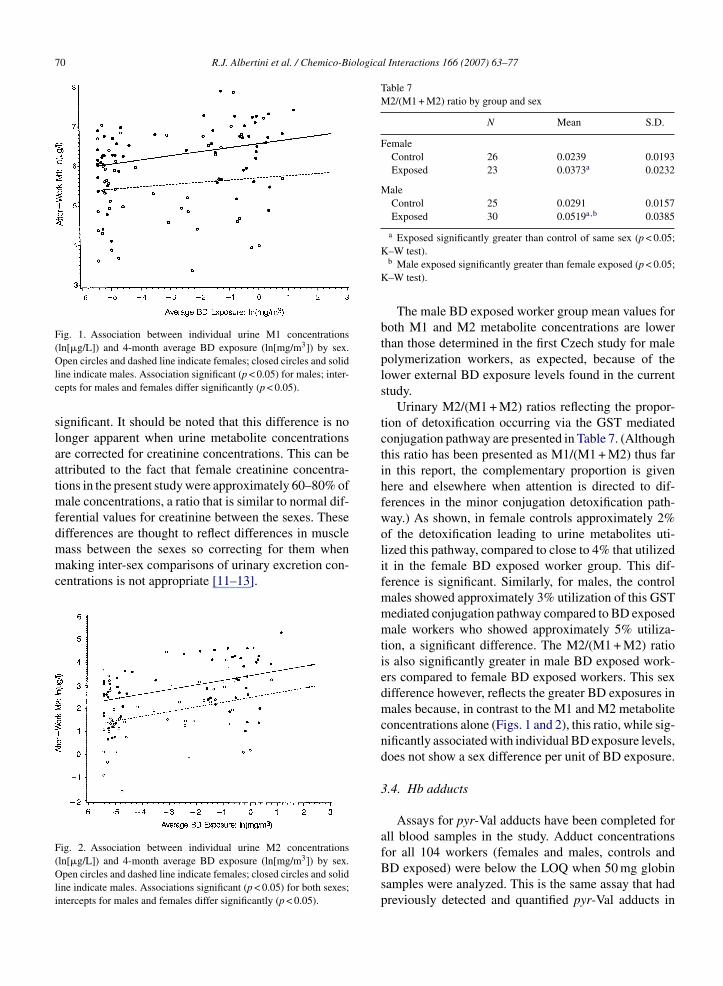
70 R.J. Albertini et al. / Chemico-Biological Interactions 166 (2007) 63–77
Fig. 1. Association between individual urine M1 concentrations(ln[�g/L]) and 4-month average BD exposure (ln[mg/m3]) by sex.
Table 7M2/(M1 + M2) ratio by group and sex
N Mean S.D.
FemaleControl 26 0.0239 0.0193Exposed 23 0.0373a 0.0232
MaleControl 25 0.0291 0.0157Exposed 30 0.0519a,b 0.0385
a Exposed significantly greater than control of same sex (p < 0.05;
Open circles and dashed line indicate females; closed circles and solidline indicate males. Association significant (p < 0.05) for males; inter-cepts for males and females differ significantly (p < 0.05).
significant. It should be noted that this difference is nolonger apparent when urine metabolite concentrationsare corrected for creatinine concentrations. This can beattributed to the fact that female creatinine concentra-tions in the present study were approximately 60–80% ofmale concentrations, a ratio that is similar to normal dif-ferential values for creatinine between the sexes. Thesedifferences are thought to reflect differences in muscle
mass between the sexes so correcting for them whenmaking inter-sex comparisons of urinary excretion con-centrations is not appropriate [11–13].Fig. 2. Association between individual urine M2 concentrations(ln[�g/L]) and 4-month average BD exposure (ln[mg/m3]) by sex.Open circles and dashed line indicate females; closed circles and solidline indicate males. Associations significant (p < 0.05) for both sexes;intercepts for males and females differ significantly (p < 0.05).
K–W test).b Male exposed significantly greater than female exposed (p < 0.05;
K–W test).
The male BD exposed worker group mean values forboth M1 and M2 metabolite concentrations are lowerthan those determined in the first Czech study for malepolymerization workers, as expected, because of thelower external BD exposure levels found in the currentstudy.
Urinary M2/(M1 + M2) ratios reflecting the propor-tion of detoxification occurring via the GST mediatedconjugation pathway are presented in Table 7. (Althoughthis ratio has been presented as M1/(M1 + M2) thus farin this report, the complementary proportion is givenhere and elsewhere when attention is directed to dif-ferences in the minor conjugation detoxification path-way.) As shown, in female controls approximately 2%of the detoxification leading to urine metabolites uti-lized this pathway, compared to close to 4% that utilizedit in the female BD exposed worker group. This dif-ference is significant. Similarly, for males, the controlmales showed approximately 3% utilization of this GSTmediated conjugation pathway compared to BD exposedmale workers who showed approximately 5% utiliza-tion, a significant difference. The M2/(M1 + M2) ratiois also significantly greater in male BD exposed work-ers compared to female BD exposed workers. This sexdifference however, reflects the greater BD exposures inmales because, in contrast to the M1 and M2 metaboliteconcentrations alone (Figs. 1 and 2), this ratio, while sig-nificantly associated with individual BD exposure levels,does not show a sex difference per unit of BD exposure.
3.4. Hb adducts
Assays for pyr-Val adducts have been completed forall blood samples in the study. Adduct concentrations
for all 104 workers (females and males, controls andBD exposed) were below the LOQ when 50 mg globinsamples were analyzed. This is the same assay that hadpreviously detected and quantified pyr-Val adducts in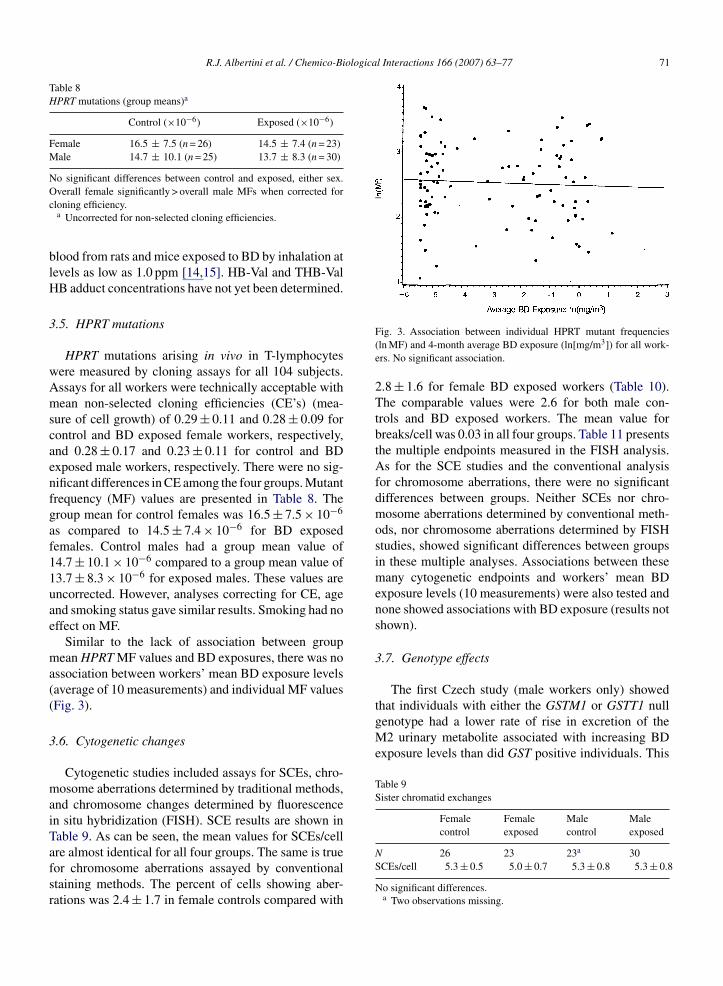
R.J. Albertini et al. / Chemico-Biological Interactions 166 (2007) 63–77 71
Table 8HPRT mutations (group means)a
Control (×10−6) Exposed (×10−6)
Female 16.5 ± 7.5 (n = 26) 14.5 ± 7.4 (n = 23)Male 14.7 ± 10.1 (n = 25) 13.7 ± 8.3 (n = 30)
No significant differences between control and exposed, either sex.Oc
blH
3
wAmscaenfgaf11uae
ma((
3
maiTafsr
that individuals with either the GSTM1 or GSTT1 nullgenotype had a lower rate of rise in excretion of theM2 urinary metabolite associated with increasing BDexposure levels than did GST positive individuals. This
Table 9Sister chromatid exchanges
Femalecontrol
Femaleexposed
Malecontrol
Maleexposed
verall female significantly > overall male MFs when corrected forloning efficiency.a Uncorrected for non-selected cloning efficiencies.
lood from rats and mice exposed to BD by inhalation atevels as low as 1.0 ppm [14,15]. HB-Val and THB-ValB adduct concentrations have not yet been determined.
.5. HPRT mutations
HPRT mutations arising in vivo in T-lymphocytesere measured by cloning assays for all 104 subjects.ssays for all workers were technically acceptable withean non-selected cloning efficiencies (CE’s) (mea-
ure of cell growth) of 0.29 ± 0.11 and 0.28 ± 0.09 forontrol and BD exposed female workers, respectively,nd 0.28 ± 0.17 and 0.23 ± 0.11 for control and BDxposed male workers, respectively. There were no sig-ificant differences in CE among the four groups. Mutantrequency (MF) values are presented in Table 8. Theroup mean for control females was 16.5 ± 7.5 × 10⁻⁶
s compared to 14.5 ± 7.4 × 10⁻⁶ for BD exposedemales. Control males had a group mean value of4.7 ± 10.1 × 10⁻⁶ compared to a group mean value of3.7 ± 8.3 × 10⁻⁶ for exposed males. These values arencorrected. However, analyses correcting for CE, agend smoking status gave similar results. Smoking had noffect on MF.
Similar to the lack of association between groupean HPRT MF values and BD exposures, there was no
ssociation between workers’ mean BD exposure levelsaverage of 10 measurements) and individual MF valuesFig. 3).
.6. Cytogenetic changes
Cytogenetic studies included assays for SCEs, chro-osome aberrations determined by traditional methods,
nd chromosome changes determined by fluorescencen situ hybridization (FISH). SCE results are shown inable 9. As can be seen, the mean values for SCEs/cell
re almost identical for all four groups. The same is trueor chromosome aberrations assayed by conventionaltaining methods. The percent of cells showing aber-ations was 2.4 ± 1.7 in female controls compared withFig. 3. Association between individual HPRT mutant frequencies(ln MF) and 4-month average BD exposure (ln[mg/m3]) for all work-ers. No significant association.
2.8 ± 1.6 for female BD exposed workers (Table 10).The comparable values were 2.6 for both male con-trols and BD exposed workers. The mean value forbreaks/cell was 0.03 in all four groups. Table 11 presentsthe multiple endpoints measured in the FISH analysis.As for the SCE studies and the conventional analysisfor chromosome aberrations, there were no significantdifferences between groups. Neither SCEs nor chro-mosome aberrations determined by conventional meth-ods, nor chromosome aberrations determined by FISHstudies, showed significant differences between groupsin these multiple analyses. Associations between thesemany cytogenetic endpoints and workers’ mean BDexposure levels (10 measurements) were also tested andnone showed associations with BD exposure (results notshown).
3.7. Genotype effects
The first Czech study (male workers only) showed
N 26 23 23a 30SCEs/cell 5.3 ± 0.5 5.0 ± 0.7 5.3 ± 0.8 5.3 ± 0.8
No significant differences.a Two observations missing.

72 R.J. Albertini et al. / Chemico-Biological Interactions 166 (2007) 63–77
Table 10Chromosome aberrations (conventional analysis)
Female control Female exposed Male control Male exposed
N 26 23 25 30% cells with aberrations 2.4 ± 1.7 2.8 ± 1.6 2.6 ± 1.8 2.6 ± 2.0Breaks/cell 0.03 ± 0.03 0.03
No significant differences.
Fig. 4. Association between individual urinary M2/(M1 + M2) ratiosand 4-month average BD exposure (ln[mg/m3]) by GSTT1 genotype.
Open circles and dashed line indicate null genotype individuals; closedcircles and solid line indicate individuals with GSTT1+/+ or ± geno-types. Slopes are significantly different (p < 0.05) when a commonintercept is assumed.lower rate of rise was statistically significant only for
the GSTM1 null individuals. The same phenomenonwas observed in the current study, although here it isthe GSTT1 null genotype that showed statistical signifi-cance. Fig. 4 shows the relationship between after workTable 11Chromosome aberrations (FISH)
Female control Fem
N 26 23Aberrant chromosomesb 2.7 ± 1.6 2.9Translocationsb 4.2 ± 3.0 4.0Reciprocal translocationsb 1.4 ± 1.3 1.3Insertionsb 0.04 ± 0.20 0.2Dicentricsb 0.08 ± 0.27 0.0Acentricsb 0.19 ± 0.49 0.4Co-junctionsb 4.3 ± 3.0 4.5FGt/100 1.6 ± 1.1 1.5
FGt/100 = Fgr/2.5[fr(1 − fr) + fg(1 − fg) − frfg] where Fgr is the translocation fthe fractions of the genome painted red and green, respectively.
a Two missing observations.b 0/00 denotes per 1000 metaphases.
± 0.02 0.03 ± 0.02 0.03 ± 0.03
M2/(M1 + M2) as a function of GSTT1 genotype. Thereis a much steeper rise in this ratio with increasing BDexposure in the GSTT1 positive individuals.
Analysis of EH effects using combined genotypes(different combinations of EH113 and EH139) speci-fying high, intermediate, and low activity phenotypesshowed no associations with any endpoint in the firstCzech study. In the current study however, an effecton urinary metabolite excretion was observed. In thiscase, the rate of rise in M2 excretion was significantlyhigher for individuals (males and females combined,with M2 values for females adjusted for the genderdifference) with low activity genotype combinationscompared to individuals with high activity genotypecombinations (Fig. 5). This is reflected in the rate ofrise in the M2/(M1 + M2) ratio with increasing BD expo-sure levels, being significantly higher for individualswith the genotype combinations specifying low activitycompared with individuals with genotype combinationsspecifying high or intermediate activity (Fig. 6). Theseobservations are the mirrors of what occurs with GSTnull genotypes and are consistent with the activities of
the different detoxification pathways for BD [reviewedin 4]. Small differences in M1 excretion would be diffi-cult to see because of the greater baseline activity in thehydrolytic detoxification pathway.ale exposed Male control Male exposed
25 28a
± 2.3 28. ± 2.8 2.5 ± 2.1± 4.0 4.0 ± 3.9 4.0 ± 3.2± 1.3 1.5 ± 1.6 1.6 ± 1.46 ± 0.54 0.12 ± 0.33 0.07 ± 0.260 ± 0.00 0.04 ± 0.20 0.00 ± 0.003 ± 0.79 0.56 ± 0.96 0.29 ± 0.60± 4.7 4.3 ± 4.5 4.1 ± 3.4± 1.5 1.5 ± 1.4 1.5 ± 1.2
requency measured by FISH after two color painting and fr and fg are
R.J. Albertini et al. / Chemico-Biologica
Fig. 5. Association between individual urine M2 concentrations(ln[�g/L]) and BD exposures (ln[mg/m3]) by combination EH geno-types indicating high (triangles and long dashes), low (filled circle andsolid line) and intermediate (open circle and short dashes) activity. M2values for females have been adjusted for the sex difference. Slopes forlow and high activity genotypes are significantly different (p < 0.05)when a common intercept is assumed.
Fig. 6. Association between individual urine M2/M1 + M2 ratios andBD exposures (ln[mg/m3]) by combination EH genotypes indicatinghiig
4
ldrral
igh (triangles and long dashes), low (filled circle and solid line) andntermediate (open circle and short dashes) activity. Slope for low activ-ty genotype is significantly different (p < 0.05) from the other twoenotypes when a common intercept is assumed.
. Discussion
This second comprehensive molecular epidemio-ogical study of BD exposed workers, undertaken toetermine if there were any differences in biomarker
esponses between BD exposed females and males,evealed that there might be gender differences, but inn unanticipated direction. Females excrete significantlyower concentrations of both measured urine metabo-l Interactions 166 (2007) 63–77 73
lites (M1 and M2 together reflect both detoxificationpathways) per unit of BD exposure. These results arefrom measurements made in after-work urine samplesuncorrected for creatinine concentration. This correc-tion, however, would have been inappropriate as thesexes have intrinsically different urine creatinine concen-trations related to body mass rather than urine dilution orconcentration [11–13]. The BD exposures used in theseanalyses is the 4-month (10 measurements) TWA meanfor each subject rather than the individual same daymeasurement because, as seen in both the first Czechstudy and in the current one, results are similar regard-less of which BD exposure value is used. The 4-monthmean, however, contains less variability. We have con-cluded that, although BD exposures show day-to-dayvariability, the mean TWA concentration can be usedfor all analyses because it has the strongest correlationwith the urinary metabolites as well as the hemoglobinadducts. Furthermore, our initial Czech study showeda greater than expected carry-over in urine metaboliteconcentrations from day to day, indicating that wash-out intervals are not as rapid as previously thought [2].Using each worker’s overall mean TWA BD exposurevalue also minimizes this source of variability. Our ten-tative conclusion from these female–male differences inurine metabolite excretion levels is that females absorbLESS BD per unit of exposure than do males. The pend-ing HB-Val and THB-Val Hb adduct determinations willeither refute or confirm this conclusion.
Overall, the BD exposure levels measured in this sec-ond Czech study are lower than those measured in thefirst. The male workers in this second study were drawnfrom the same polymerization population as in the firststudy, so there truly might have been a decline in BDexposure levels with time. However, BD measurementbadges were analyzed by a different laboratory in thesecond study (EcoChem Company in Prague) than inthe first (Health and Safety Laboratory, UK), so the dif-ference may, in part, be technical as LODs appeared tobe higher in the second study than in the first. Also, theBD exposure assessment period in the current study tookplace in mid-winter, compared to assessment during thespring in the first study. Time of year could conceiv-ably be a factor in the lower measured BD exposurelevels. Again, the results of THB-Val adduct concen-trations, being determined by the same technique in thesame laboratory in this study as in the first, with the addi-tion of repeat determinations in cryo-preserved red blood
cells maintained from the first study, should resolvethis issue.In this second study, as in the first, the M1 and M2urine metabolite concentrations reflected external BD

ologica
74 R.J. Albertini et al. / Chemico-Biexposures. Metabolite concentrations were lower in thissecond study than in the first mirroring the lower BDexposure levels. Although both M1 and M2 concentra-tions were higher in the BD exposed females than inthe control females, the differences were not significant.The exposed females had relatively low BD exposures.The higher M1 and M2 concentrations in exposed malescompared to control males, however, were significant,as were the higher metabolite concentrations in malescompared to females. Two factors appear to be responsi-ble for this latter observation. Exposed male workers hadsignificantly greater BD exposures than did the exposedfemale workers and females excreted less of both urinemetabolites per unit of BD exposure than did males.
The dominance of hydrolytic detoxification of BDin humans was again clearly demonstrated by theM1/(M1 + M2) ratios for both females and males. Asin the first study, however, utilization of the conjuga-tion pathway appeared to be stimulated by BD exposure.The complementary proportion, M2/(M1 + M2) (used toemphasize differences in the minor conjugation detox-ification pathway) is greater in BD exposed males thanin BD exposed females, again reflecting the greater BDexposures of the males. It is important to note that therewas no difference in this ratio between females and malesper unit of BD exposure, indicating that the relative useof the two detoxification pathways is similar in the twosexes.
An extremely important finding in the current studywas the lack of quantifiable pyr-Val adduct in any of the104 samples tested. The method used was sufficientlysensitive, however, to detect and quantify this adduct inmice and rats exposed to BD concentrations as low as1.0 ppm [14,15]. As noted by Swenberg (in this issue),although the TWA BD exposures in the current studyare below 1.0 ppm for both females and males, the dura-tion of exposure was much greater for the humans thanfor the rodents, making the cumulative exposures quitecomparable [15]. The pyr-Val adduct is specific for thehighly genotoxic (and carcinogenic) DEB metabolite ofBD. Comparing the results of the current study withthose of the rodent studies suggests that humans form atleast 3 and 10 times less pyr-Val than similarly exposedrats or mice, respectively [15]. Current efforts are beingdirected at developing a more sensitive assay for this crit-ical adduct. When developed, it will be used to restudyall blood samples from this second Czech study, as wellas all samples from the first.
This second study again found absolutely no associ-ations between HPRT gene mutations or chromosomeaberrations (or SCEs) and BD exposures in any of theexposed workers. This finding is quite consistent with
l Interactions 166 (2007) 63–77
and to be expected from the non-detectable pyr-Valadducts. The NOAEL of 1.794 mg/m3 for these irre-versible genotoxic effects, determined in the first study,remains the no effect level for these genotoxic endpoints.Females were NOT shown to be more susceptible tothese genotoxic effects than males although, as noted,their BD exposures were less. Our new results for malesagree with those of the first Czech study, and are con-sistent, for both sexes, with those from a large, com-prehensive Chinese molecular epidemiological studythat found no association between BD exposures andmutations or chromosome changes in either females ormales [16].
This current study also included a comprehensiveevaluation of genotype effects in BD exposed work-ers. Genotypes did not significantly affect irreversiblegenotoxicity, as was shown in the first study. However,the influence of GST genotypes on metabolic detoxifica-tion was again seen in the present study where GSTT1null individuals showed a significantly slower rise inthe rate of M2 excretion (and presumably production)than did individuals with the other genotypes. In the firststudy, the significant association was with the GSTM1null genotype, but both showed the rate alteration. Incontrast to the first study, EH genotype combinationsspecifying high, intermediate, and low activity in thehydrolytic detoxification pathway also influenced urinemetabolite excretion patterns in this second study. ForEH, individuals with the genotype combinations spec-ifying low activity showed a significantly faster rise inM2 excretion, reflected in a faster rise in M2/(M1 + M2)ratios with increasing BD exposure levels, than did indi-viduals with the genotype combinations specifying highactivity. This finding mirrors what was seen for the GSTnull individuals and presumably reflects greater detoxi-fication via the conjugation pathway in individuals whohave slower hydrolytic pathways. Again, the hemoglobinadduct concentrations will be very informative.
All biomarkers studied in experimental systems usingBD exposed animals have now been measured in humanobservational studies. It is, therefore, possible to com-pare the BD metabolic and genotoxicity profiles forrodents (mice and rats) with those for humans as abasis for developing a mechanistically based cancer riskassessment procedure. Such comparisons were not pre-viously possible because of a paucity of human data –primarily for exposure – that could be related to keyevents in carcinogenesis, as reflected by biomarkers.
The exposure, metabolic and genotoxicity results ofthe human Czech studies have been described. Analo-gous data sets are available from studies of BD exposedmice and rats [14,17–21, reviewed in 22]. While vastly

ological Interactions 166 (2007) 63–77 75
deaamo
pdihaoiarmcmanByfo
hMsatCbimipt
cs(iscgetlt2s
mpa
riso
nof
met
abol
ican
dge
noto
xici
typr
ofile
sfo
rB
Dfo
llow
ing
inha
latio
nex
posu
renc
entr
atio
n/n
HB
-Val
(pm
ol/g
addu
cts/
ppm
)py
r-V
al(p
mol
/gad
duct
s/pp
m)
TH
B-V
al(p
mol
/gad
duct
s/pp
m)
Uri
nem
etab
olite
excr
etio
nM
1(M
1+
M2)
Hpr
tor
HP
RT
mut
atio
nsin
rode
nts
orhu
man
s
Chr
omA
bsM
N(s
omat
ic)
Can
cer
outc
ome
/4w
eeks
[14]
,/1
0da
ys[6
],m
/10
days
[6]
53±
7.6
[6],
137
±12
2[6
]17
.7,1
.630
.8±
1.6
(M)
[14]
,23.
5±
5.1
(F),
48.7
±3.
23[6
],13
0.4
±64
[6]
16.2
,2.1
452
±38
[6],
3410
±17
7[6
]15
0.0,
54.6
0.23
[23]
+[2
1],L
OA
EL
3.0
ppm
×2
wee
ks+
(MN
)[2
4],L
OA
EL
62.5
ppm
×13
wee
ks+
[25]
,LO
AE
L6.
25pp
m×
2ye
ars
/4w
eeks
[14]
,/1
0da
ys[6
],m
/10
days
[1]
13±
2.4
[6],
87±
7.6
[6]
4.3,
1.4
0.4
±0.
1(M
)[1
4],0
.7±
0.1
(F),
3.9
±0.
8[6
],38
.3±
1.2
[6]
1.3,
0.6
339
±41
[6],
3202
±30
2[6
]11
3.0,
51.2
0.51
[23]
+[2
1],L
OA
EL
62.5
ppm
×2
wee
ksa
0(M
N)
[24]
,NO
AE
L50
0pp
m+
[26]
,LO
AE
L10
00pp
m×
2ye
ars
)/pr
esum
ably
for
2]
2.23
±1.
40[2
]b
716.
7±
425.
72[2
]0.
99[2
]0
[2],
NO
AE
L0.
8pp
m(T
WA
)0
[2],
NO
AE
L0.
8pp
m(T
WA
)N
otde
term
ined
OA
EL
(rat
sfo
rM
N;h
uman
sfo
rH
PR
Tm
utat
ions
and
chro
mos
ome
aber
ratio
ns);
HB
-Val
:2-h
ydro
xy-3
-but
anyl
-val
ine
(EB
-der
ived
);py
r-V
al:N
,N-(
2,3-
dihy
drox
y-1,
4-bu
tady
l)-v
alin
e(D
EB
-der
ived
);T
HB
-Val
:1,2
,3-t
rihy
drox
ybut
yl-v
alin
e1,
2-di
hydr
oxy-
4-(N
-ace
tylc
yste
inyl
)-bu
tane
;M2:
1-hy
drox
y-2-
(N-a
cety
lcys
tein
yl)-
3-bu
tene
and
2-hy
drox
y-1-
(N-a
cety
lcys
tein
yl)-
3-bu
tene
(iso
mer
icm
ix);
MN
:mic
ronu
clei
(sur
roga
tefo
rch
rom
osom
eab
erra
tions
);F:
fem
ale;
M:m
ale.
ppm
×2
wee
ks(s
eete
xt)
[21]
.
dete
rmin
atio
nspe
ndin
gfo
rC
zech
stud
yI,
show
nin
tabl
e.py
r-V
alco
ncen
trat
ions
wer
ebe
low
the
LO
Qin
curr
entC
zech
stud
yII
.
R.J. Albertini et al. / Chemico-Bi
ifferent over their entire ranges, the BD exposure lev-ls in the rodent and human studies are comparablet the lowest concentrations. Results of these studiesllow a preliminary estimate of the degree to which theechanisms by which BD induces cancer in rodents are
perative in humans (Table 12).HB-Val and THB-Val adduct concentrations have
rovided measures of biologically effective internaloses of BD in all three species and have reflected themportant inter-species differences in metabolism. Miceave shown higher HB-Val concentrations than rats atll external exposure doses, reflecting their predominantxidative metabolism of BD. It is important to note that,n recent studies, the HB-Val and DEB specific pyr-Valdduct concentrations were highly correlated in mice andats, with concentrations of both being much higher inice [6,14]. In the human Czech studies, HB-Val adduct
oncentrations were considerably lower than in eitherice or rats while, with current methods, the pyr-Val
dducts were non-detectable (Table 12, pyr-Val adductsot yet determined in Czech study 1 shown in the table).y contrast, the THB-Val adduct concentrations (hydrol-sis) were much higher in humans than had been shownor the rodents, reflecting the dominance of hydrolysisver oxidation in human BD metabolism.
The dominance of hydrolytic detoxification inumans has also been revealed by ratios for1/(M1 + M2) metabolite concentrations in urine that
how 23% hydrolysis in mice, 51% hydrolysis in ratsnd 99% hydrolysis in humans (based on the data fromhe first Czech study as shown in Table 12; the secondzech study results showed hydrolytic detoxification toe approximately 95% of the total) [2,23]. The dom-nance of hydrolysis in humans helps to explain why
uch less of the critical DEB metabolite is formed thann either of these rodent species, leading to a much lowerotential for genotoxicity in humans than in either ofhese species.
Consistent with the non-detectable pyr-Val adductoncentrations in humans are the important inter-pecies comparisons for irreversible genotoxic effectsTable 12). Mice have shown statistically significantncreases in Hprt mutations over controls even at expo-ure levels as low as 3.0 ppm administered for 2 weeks,onfirming that mice are extremely susceptible to theenotoxicity of BD [21]. At present, this is the low-st observed adverse effect level (LOAEL) for muta-ions in mice, although the effects at lower exposure
evels are to be determined. Induction of Hprt muta-ions in rats required 62.5 ppm level BD exposures forweeks (LOAEL), while exposures to 20 ppm for thisame period of time did not result in a statistically sig- Ta
ble
12In
ters
peci
esco
Seri
esB
Dco
dura
tio
Mou
se1
ppm
3pp
m62
.5pp
Rat
1pp
m3
ppm
62.5
ppH
uman
s[2
]0.
8pp
m(T
WA
year
s[
Not
e:L
OA
EL
vs.N
(EB
D-d
eriv
ed);
M1:
aN
OA
EL
=20
.0b
pyr-
Val
addu
ct
ologica
[
[
[
76 R.J. Albertini et al. / Chemico-Bi
nificant increase in mutations (NOAEL) [21]. For themice, only a large experiment could detect the slight(but significant) increase in Hprt mutations at 3.0 ppm.In rats, the 62.5 ppm exposure produced a similar slight(but significant) increase in mutations. The results ofpyr-Val hemoglobin adduct determinations for the miceand rats used in these same experiments are importantfor their interpretations [6]. Mice exposed to 3.0 ppmactually had higher levels of accumulation of this DEBspecific hemoglobin adduct than did the rats exposed to62.5 ppm. BD exposed human workers have shown noincreases in HPRT gene mutations over background ineither the current study or the initial Czech study wherethe mean TWA BD exposure level in the highest expo-sure group was 1.794 mg/m3 (0.812 ppm) [2].
Results from other studies extend the animal—humancomparisons to additional end-points (Table 12). BDinduced chromosome aberrations have been reportedrepeatedly in mice but have never been observed in rats[reviewed in 22,24]. There were no increases in aberra-tions over background in the Czech studies reported hereor in the earlier large study in China [16]. The weight ofevidence from other studies indicates that chromosomeaberrations frequency elevations over background havenot been associated with BD exposures in humans [3].The comparative cancer data for rodents and humans areshown in Table 12 for completeness. Mice developedtumors following BD inhalation exposures at much lowerlevels than were studied in rats [25,26]. It is unknownif BD has any carcinogenic potential in humans at theexposure levels shown in the table.
In summary, Table 12 illustrates how animal data andhuman molecular epidemiological results might be com-bined for conducting mechanistically based risk assess-ments. This scheme should help guide future studies ofBD. More heavily exposed human populations should besought and, if found, studied for all of these biomarkers,in an attempt to document whether or not irreversiblechanges in DNA, i.e. gene mutations or chromosomeaberrations, can be found at any level of BD exposure. IfBD acts as a genotoxic carcinogen in humans, as it doesin rodents, then irreversible genotoxicity underlies car-cinogenicity and should be the rate limiting step. When(or if) such genotoxicity is found, the effective levels ofBD exposure that produce it can be used to quantitativelyextrapolate risk for cancer to humans using combinedanimal–human data sets, as illustrated, in the context ofthe animal cancer bioassay results. Furthermore, find-
ing a lowest observed adverse effect level (LOAEL)for BD irreversible genotoxicity in humans will spec-ify which of the biomarkers of exposure should be usedas critical markers for effective internal exposure levels.[
l Interactions 166 (2007) 63–77
These exposure markers are predicted to be either theHB-Val adducts or, more likely, the important pyr-Valadducts.
References
[1] R.J. Albertini, R.J. Sram, P.M. Vacek, J. Lynch, M. Wright, J.A.Nicklas, P.J. Boogaard, R.F. Henderson, J.A. Swenberg, A.D.Tates, J.B. Ward Jr., Biomarkers for assessing occupational expo-sures to 1,3-butadiene, Chem. Biol. Interact. 135–136 (2001)429–453.
[2] R.J. Albertini, R.J. Sram, P.M. Vacek, J. Lynch, J.A. Nicklas,N.J. van Sittert, P.J. Boogaard, R.F. Henderson, J.A. Swenberg,A.D. Tates, J.B. Ward Jr., M. Wright, et al., Biomarkers in Czechworkers exposed to 1,3-butadiene: a transitional epidemiologicstudy, HEI Final Report #116, Health Effects Institute, Boston,MA, 2003.
[3] R.J. Albertini, H. Clewell, M.W. Himmelstein, E. Morinello, S.Olin, J. Preston, L. Scarano, M.T. Smith, J. Swenberg, R. Tice,C. Travis, The use of non-tumor data in cancer risk assessment:reflections on butadiene, vinyl chloride, and benzene, Regul. Tox-icol. Pharmacol. 37 (2003) 105–132.
[4] M.W. Himmelstein, J.F. Acquavella, L. Recio, M.A. Medinsky,J.A. Bond, Toxicology of 1,3-butadiene, Crit. Rev. Toxicol. 27(1997) 1–108.
[5] J.A. Swenberg, H. Koc, P.B. Upton, N.I. Georgieva, A. Ranas-inghe, V.E. Walker, R. Henderson, Using DNA and hemoglobinadducts to improve the risk assessment of butadiene, Chem. Biol.Interact. 135–136 (2001) 387–403.
[6] G. Boysen, N.I. Georgieva, P.B. Upton, K. Jayaraj, Y. Li, V.E.Walker, J.A. Swenberg, Analysis of diepoxide-specific cyclic N-terminal globin adducts in mice and rats after inhalation exposureto 1,3-butadiene, Cancer Res. 64 (23) (2004) 8517–8520.
[7] J.D. McDonald, W.E. Bechtold, J.R. Krone, W.B. Blackwell, D.A.Kracko, R.F. Henderson, Analysis of butadiene urinary metabo-lites by liquid chromatography/triple quadruple mass spectrome-try, J. Anal. Toxicol. 28 (3) (2004) 168–173.
[8] J.P. O’Neill, M.J. McGinniss, J.K. Berman, L.M. Sullivan, J.A.Nicklas, R.J. Albertini, Refinement of a T-lymphocyte cloningassay to quantify the in vivo thioguanine-resistant mutant fre-quency in humans, Mutagenesis 2 (1987) 87–94.
[9] J.D. Tucker, W.F. Morgan, A.A. Awa, M. Bauchinger, D. Blakey,M.N. Comforth, L.G. Littlefield, A.T. Natarajan, G. Shasserre,A proposed system for scoring structural aberrations detectedby chromosome painting, Cytogenet. Cell Genet. 68 (1995)211–221.
10] D. Lucas, M. Poggenesee, T. Straume, Translocation between twospecific human chromosomes detected by three-color “chromo-some painting”, Cytogenet. Cell Genet. 62 (1993) 11.
11] D.B. Barr, L.C. Wilder, S.P. Caudill, A.J. Gonzalez, L.L.Needham, J.L. Pirkle, Urinary creatinine concentrations in theU.S. population: implications for urinary biologic monitor-ing measurements, Environ. Health Perspect. 113 (2) (2005)192–200.
12] M. Carrieri, A. Trevisan, G.B. Barolucci, Adjustment toconcentration-dilution of spot urine samples: correlation between
specific gravity and creatinine, Int. Arch. Occup. Environ. Health74 (1) (2001) 63–67.13] Y. Suwazono, A. Akesson, T. Alfven, L. Jarup, M. Vahter, Crea-tinine versus specific gravity-adjusted urinary cadmium concen-trations, Biomarkers 10 (2–3) (2005) 117–126.

ologica
[
[
[
[
[
[
[
[
[
[
[
[
centrations, Cancer Res. 50 (1990) 6592–6599.[26] P.E. Owen, J.R. Glaister, I.F. Gaunt, D.H. Pullinger, Inhala-
R.J. Albertini et al. / Chemico-Bi
14] G. Boysen, N.I. Georgieva, P. Upton, J.A. Swenberg, N-terminalglobin adducts as biomarkers of formation of butadiene derivedepoxides, Chem. Biol. Int. 166 (2007) 84–92.
15] J.A. Swenberg, M.G. Bird, R.J. Lewis, Future directions in buta-diene risk assessment, Chem. Biol. Int. 166 (2007) 78–83.
16] R.B. Hayes, L. Zhang, S. Yin, J.A. Swenberg, L. Xi, J. Wiencke,W.E. Bechtold, M. Yao, N. Rothman, R. Haas, J.P. O’Neill, J.Wiemels, M. Dosemeci, G. Li, M.T. Smith, Genotoxic markersamong butadiene-polymer workers in China, Carcinogenesis 21(2000) 55–62.
17] Q. Meng, L. Recio, A.A. Reilly, B. Wong, M. Bauer, V.E. Walker,Comparison of the mutagenic potency of 1,3 butadiene at thehprt locus of T lymphocytes following inhalation exposure offemale B6C3F1 mice and F344 rats, Carcinogenesis 19 (1998)1019–1027.
18] Q. Meng, R.F. Henderson, A.A. Reilly, M. Bauer, T. Chen, R.H.Heflich, V.E. Walker, Mutagenicity of 1,3-butadiene at the hprtlocus of T cells following inhalation exposures of female miceand rats, Mutat. Res. 429 (1999) 107–125.
19] Q. Meng, R.F. Henderson, L. Long, L. Blair, D.M. Walker, P.B.Upton, J.A. Swenberg, V.E. Walker, Mutagenicity at the HPRTlocus in T cells of female mice following inhalation exposures tolow levels of 1,3-butadiene, Chem. Biol. Interact. 135–136 (2001)343–361.
20] V. Walker, Q. Meng, Part III. In vivo mutation of the endoge-nous HPRT genes of mice and rats by 1,3-butadiene and itsmetabolites, in: 1,3-Butadiene: Cancer, Mutations, and Adducts,Research Report 92, Health Effects Institute, Boston, MA, 2000,pp. 89–139.
l Interactions 166 (2007) 63–77 77
21] Q. Meng, D.M. Walker, J.D. McDonald, R.F. Henderson,M.N. Carter, D.L. Cook Jr., C.L. McCash, S.M. Torres, M.J.Gauer, S.K. Seilkop, P.B. Upton, N.I. Georgiera, G. Boy-sen, J.A. Swenberg, V.E. Walker, Age-gender- and species-dependent mutagenicity in T cells of mice and rats exposed byinhalation to 1,3-butadiene, Chem. Biol. Int. 166 (2007) 121–131.
22] F. Pacchierotti, I.-D. Adler, D. Anderson, M. Brinkworth, N.A.Demopoulos, J. Lahdetie, S. Osterman-Golkar, K. Peltonen, A.Russo, A. Tates, R. Waters, Genetic effects of 1,3-butadiene andassociated risk for heritable damage, Mutat. Res. 397 (1998)93–115.
23] W.E. Bechtold, M.R. Strunk, I.-Y. Chang, J.B. Ward Jr., R.F.Henderson, Species differences in urinary butadiene metabolites:comparisons of metabolite ratios between mice, rats, and humans,Toxicol. Appl. Pharmacol. 127 (1994) 44–49.
24] K. Autio, L. Renzi, J. Catalan, O.E. Albrecht, M. Sorsa, Inductionof micronuclei in peripheral blood and bone marrow erythrocytesof rats and mice exposed to 1,3-butadiene by inhalation, Mutat.Res. 309 (2) (1994) 315–320.
25] R.L. Melnick, J. Huff, B.J. Chou, R. Miller, Carcinogenicity of1,3-butadiene in C57BL/6XC3H F1 mice at low exposure con-
tion toxicity studies with 1,3-butadiene. 3. Two-year toxic-ity/carcinogenicity studies in rats, Am. Ind. Hyg. Assoc. J. 48(1987) 407–413.

![Diethyl 4,4′-dihydroxy-3,3′-{[(3a RS ,7a RS )-2,3,3a,4,5,6,7,7a-octahydro-1 H -1,3-benzimidazole-1,3-diyl]bis(methylene)}dibenzoate](https://static.fdokumen.com/doc/165x107/63258a10584e51a9ab0ba0e1/diethyl-44-dihydroxy-33-3a-rs-7a-rs-233a45677a-octahydro-1.jpg)