A Spatial Epidemiological Analysis of Stroke in Alberta ...
157
University of Calgary PRISM: University of Calgary's Digital Repository Graduate Studies The Vault: Electronic Theses and Dissertations 2015-01-08 A Spatial Epidemiological Analysis of Stroke in Alberta, Canada, Using GIS. van Rheenen, Susan M. van Rheenen, S. M. (2015). A Spatial Epidemiological Analysis of Stroke in Alberta, Canada, Using GIS. (Unpublished doctoral thesis). University of Calgary, Calgary, AB. doi:10.11575/PRISM/25014 http://hdl.handle.net/11023/1997 doctoral thesis University of Calgary graduate students retain copyright ownership and moral rights for their thesis. You may use this material in any way that is permitted by the Copyright Act or through licensing that has been assigned to the document. For uses that are not allowable under copyright legislation or licensing, you are required to seek permission. Downloaded from PRISM: https://prism.ucalgary.ca
-
Upload
khangminh22 -
Category
Documents
-
view
0 -
download
0
Transcript of A Spatial Epidemiological Analysis of Stroke in Alberta ...

University of Calgary
PRISM: University of Calgary's Digital Repository
Graduate Studies The Vault: Electronic Theses and Dissertations
2015-01-08
A Spatial Epidemiological Analysis of Stroke in
Alberta, Canada, Using GIS.
van Rheenen, Susan M.
van Rheenen, S. M. (2015). A Spatial Epidemiological Analysis of Stroke in Alberta, Canada, Using
GIS. (Unpublished doctoral thesis). University of Calgary, Calgary, AB. doi:10.11575/PRISM/25014
http://hdl.handle.net/11023/1997
doctoral thesis
University of Calgary graduate students retain copyright ownership and moral rights for their
thesis. You may use this material in any way that is permitted by the Copyright Act or through
licensing that has been assigned to the document. For uses that are not allowable under
copyright legislation or licensing, you are required to seek permission.
Downloaded from PRISM: https://prism.ucalgary.ca
UNIVERSITY OF CALGARY
A Spatial Epidemiological Analysis of Stroke in Alberta, Canada, Using GIS.
by
Susan van Rheenen
A THESIS
SUBMITTED TO THE FACULTY OF GRADUATE STUDIES
IN PARTIAL FULFILLMENT OF THE REQUIREMENTS FOR THE
DEGREE OF DOCTOR OF PHILOSOPHY
DEPARTMENT OF COMMUNITY HEALTH SCIENCES
CALGARY, ALBERTA
January, 2015
© Susan van Rheenen 2015

ii
Abstract
Stroke is the potentially devastating result of a sudden interruption of blood flow
to the brain. It is a leading cause of death and disability world wide and incidence is
expected to increase due to an aging population and increased prevalence in risk factors.
Epidemiological research can enhance our understanding of stroke as a health
problem in the population with respect to the extent of disease incidence and prevalence,
the efficacy of health care delivery for stroke prevention and acute care, and to inform
public health policy and planning.
Geographic Information Systems (GIS) technology and spatial methods provide
the means to store and retrieve spatially indexed health data, display the spatial
information in maps, and conduct analyses examining health service delivery and
utilization.
The overall objective of this research is to enrich our current understanding of
stroke as a health problem in the province of Alberta, Canada. This thesis is comprised
of three studies. The first study utilized GIS-based methods and administrative datasets
to identify and locate significant clusters of high and low rates of the major stroke types
and in-hospital mortality. Important questions were raised regarding why regional
differences exist and how disparities might be mitigated.
The second study expanded upon the cluster analysis with an examination of
associations between selected predictors and stroke and mortality hot and cold spots,
mortality at the individual level, and recurrent stroke, using multivariable logistic
regression. Distance from specialized stroke care was a significant predictor of index and
iii
recurrent stroke and mortality. EMS transport and Comprehensive Stroke Centre care
significantly lowered the odds of stroke mortality.
The third study employed spatial methods to evaluate the concordance of GIS
predicted versus actual EMS ground transport times and to estimate the proportion of the
Alberta population with potential and realized access to stroke care within critical time
windows. GIS methods predicted ground transport time with reasonable accuracy and
there was expanded access to stroke care over a 5-year time span.
This research highlights the benefits of incorporating spatial methods and GIS in
epidemiological research to elucidate how and to what extent place matters to health.
iv
Acknowledgements
I thank my supervisor Dr. Michael D. Hill and co-supervisor Dr. Tim Watson for their
support of my studies and for their guidance and feedback. I am grateful to Michael for giving
me the opportunity to forge two seemingly disparate career paths and for the opportunity to
research a topic that most interested me, for supporting my learning about GIS and spatial
software applications as they apply to stroke, and for providing research funding from the Heart
and Stroke Foundation that afforded more time dedicated to research. Tim is an extraordinary
teacher and I thank him for sharing his expertise, encouragement, and humour (for which he is
famous). Thank you to my committee members, Dr. Shelley Alexander and Dr. Shelagh Coutts,
for their valued guidance and feedback. Shelley’s course (GEOG 607.01) and teachings were
inspiring to me and encouraged my thinking about health in ways that were, for me, new.
Thank you to Dr. Nigel Waters, Professor Emeritus of Geography at the University of
Calgary, and Dr. Eddy Lang, Department of Emergency Medicine, for generously giving their
time to participate in my defense and for sharing their valued expertise.
Thank you to Peter Peller (SANDS), Vicki Stagg (DCHS), Greg Vogelaar and Cherie
Goddu (AHS EMS), and Crystal Elliott (DCHS) for their assistance and support. Peter and Vicki
made (spatial) data coding, exploration, and learning software applications enjoyable. Thank you
to the Administrative Data 659.07 instructors and Bing Li for the administrative stroke database.
To my family and my friends, for their unfailing encouragement and support... thank you.
In closing, I am grateful to have known and worked with Dr. Mike Hodsman in the
Emergency Department and to have had his support in pursuance of my advanced studies.

v
Table of Contents
Abstract…………………………………………………………………………………… ii Acknowledgements ….…………………………………………………………………... iv Table of Contents………………………………………………………............................. v List of Tables……………………………………...…………………………................... ix List of Figures and Illustrations……………………...…………………………………… x List of Symbols, Abbreviations and Nomenclature..…………..……………………….... xi Contribution of Authors…………………………………………………………………. xii CHAPTER ONE: THESIS OVERVIEW……………………………………..………….. 1 1.1 Stroke: A Spatial Epidemiological Perspective…………………………………..... 1 1.2 Thesis Outline…………………………………………………………………….... 5 CHAPTER TWO: THESIS PURPOSE…………………………………........................... 8 2.1 Study Rationale…………………………………………………………………...... 8 2.2 Study Hypotheses………………………………………………………………….10 2.3 Study Objectives………………………………………………………………….. 11 CHAPTER THREE: STROKE, STROKE SYSTEMS OF CARE, OUTCOMES AND GEOGRAPHY.................................................................................................................. 13 3.1 Stroke Types and Treatment…………………………………………………….... 13 3.2 Stroke Systems of Care………………………………………………………….... 15 3.2.1 Stroke Systems of Care in Alberta, Canada……………………………….... 15 3.3 Conceptual Framework: The Structurationist Approach……………………........ 17 3.4 Integration of Spatial Methods and GIS in Stroke Research……………………... 21 3.4.1 Spatial Methods and GIS………………………………………………….... 21 3.4.2 Defining Access to Care….………………………………………………… 22 3.4.3 Stroke Research Utilizing Spatial Methods and GIS……………………….. 23 CHAPTER FOUR: STUDY I. AN ANALYSIS OF SPATIAL CLUSTERING OF STROKE TYPES, IN-HOSPITAL MORTALITY, AND REPORTED RISK FACTORS IN ALBERTA, CANADA, USING GIS……………………........................ 28 4.1 Background….…………………………………………………………................. 28 4.2 Study Purpose………………………………………………………...................... 28 4.3 Methods……………………………………………………………………………30 4.3.1 Study Design…………………………………………………...................... 30 4.3.2 Data…………………………………………………………………………. 30 4.3.2.1 Administrative Data……………………………………….................. 30 4.3.2.2 Spatial Data ………………………………………………………...... 32 4.3.3 Non-spatial Methods……………………………………………….............. 32 4.3.4 Spatial Methods…………………………………………………………...... 32 4.3.4.1 Spatial Unit of Analysis………………………………………………. 32 4.3.4.2 Definition of Rural……………………………………………………. 30 4.3.4.3 Annualized Rates………..……………………………………………. 34 4.3.4.4 Spatial Statistics………………………………………………………. 34 4.4 Results………………………………………………………………………….... 36
vi
4.4.1 Study Population……………………………………………………………. 36 4.4.2 Clusters of Stroke Types and Mortality……………………………………. 38 4.4.3 Clusters of Risk……………………………………………………………... 39 4.5 Discussion………………………………………………………………………… 50 4.5.1 Principal Findings…………………………………………………………... 50 4.5.2 Ischemic Stroke and Transient Ischemic Attack…..……………………….. 50 4.5.3 Intracerebral Hemorrhage and Subarachnoid Hemorrhage……………...... 51 4.5.4 In-hospital Mortality……………………………………………………….. 51 4.5.5 Risk Factors……………………………………………………………….... 52 4.6 Study Implications………………………………………………………………... 52 4.7 Study Limitations…………………………………………………………………. 53 4.8 Conclusion…………………………………………………………………………54 CHAPTER FIVE: STUDY II. A MULTIVARIABLE REGRESSION ANALYSIS OF STROKE AND IN-HOSPITAL MORTALITY HOT AND COLD SPOTS IN ALBERTA, CANADA..................................................................................................... 57 5.1 Background……………………………………………………………………….. 57
5.1.1 Stroke Types………………………………………………………………... 57 5.1.1.1 Ischemic Stroke………………………………………………………. 57 5.1.1.2 Transient Ischemic Attack……………………………………………..58 5.1.1.3 Intracerebral Hemorrhage…………………………………………….. 58 5.1.1.4 Subarachnoid Hemorrhage…………………………………………… 59 5.1.1.5 Recurrent Stroke……………………………………………………… 59 5.1.2 Individual Predictors of Stroke and Stroke Mortality……………………… 60 5.1.3 Geographic Predictors of Stroke and Stroke Mortality……………………. 60 5.1.3.1 Sociodemographic Dissemination Area Level Characteristics……….. 60 5.1.3.2 Distance and Access to Care………………………………………….. 62 5.2 Study Purpose…………………………………………………………………… 63 5.3 Methods………………………………………………………………………… 63 5.3.1 Study Design……………………………………………………………….. 63 5.3.2 Data………………………………………………………………………… 64 5.3.2.1 Administrative Data…………………………………………………. 64 5.3.2.2 Spatial Data…………………………………………………………… 65 5.3.3 Analysis……………………………………………………………………. 65 5.3.3.1 1a. Stroke and Predicted Drive Time to a SPC. 1b. Mortality and Predicted Drive Time to a SC……………………... 66
5.3.3.2 Mortality and Predicted Drive Time to a SC and Individual Level Predictors………………………………………………………………67 5.3.3.3 Recurrent Stroke Events and Predicted Drive Time to a SPC and Individual Level Predictors…………………………………………… 69
5.4 Results……………………………………………………………………………. 69 5.5 Discussion………………………………………………………………………… 79 5.6 Study Implications……………………………………………………………….. 87 5.7 Study Limitations………………………………………………………………… 88 5.8 Conclusion.………………………………………………………………………. 89
vii
CHAPTER SIX: STUDY III. ANALYSIS OF GEOGRAPHIC ACCESS TO ACUTE STROKE CARE IN ALBERTA, CANADA, USING NETWORK ANALYSIS AND GIS………………………………………………………………………………………. 92 6.1 Study Background…………………………………………………………............ 92 6.2 Study Purpose………………………………………………………………...........94 6.3 Methods……………………………………………………………………………95 6.3.1 Concordance of GIS Predicted Versus Observed EMS Ground Transport Times and Generation of Ground Transport Time Service Areas…............. 95 6.3.1.1 Data………………………………………………………………….... 95 6.3.1.2 Analysis…………………………………………………………....…..95 6.3.2 Predicted Geographic Access: Regional Data From Statistics Canada 2006 and 2011 Census………………………………………………........... 97 6.3.2.1 Data …………………………………………………………………... 97 6.3.2.2 Analysis………………………………………………………………. 97 6.3.3 Realized Access: Administrative Data Stroke Events……………………... 98 6.3.3.1 Data …………………………………………………………………... 98 6.3.3.2 Predicted and Realized Access to Stroke Care………………………. 99 6.3.4 Characteristics of Populations Within and Outside of Critical Transport Time Service Areas………………………………………………………… 99 6.4 Results ………………………………………………………………………....... 100 6.4.1 Concordance of GIS Predicted Versus Observed EMS Ground Transport Times.……………………………………………………………………...100 6.4.2 Predicted Geographic Access: Regional Data From Statistics Canada 2006 and 2011 Census……………………………………………………. 100 6.4.3 Predicted and Realized Geographic Access: Administrative Stroke Events 102 6.4.4 Characteristics of Populations Within and Outside of Critical Transport Time Windows.…………………………………………………………… 105 6.5 Discussion……………………………………………………………………….. 106 6.5.1 Principal Findings……………………………………………………......... 106 6.5.2 Concordance of GIS Predicted Versus Observed EMS Ground Transport Times.……………………………………………………………………...107
6.5.3 Predicted Geographic Access: Regional Data From Statistics Canada 2006 and 2011 Census…………………………………............................. 108 6.5.4 Predicted and Realized Geographic Access: Administrative Data Stroke Events.…………………………………………………………………….. 109 6.5.5 Characteristics of Populations Within and Outside of Critical Transport Time Windows…………………………………………………………… 110
6.6 Study Implications……………………………………………………………… 111 6.7 Study Limitations………………………………………………………………... 113 6.8 Study Conclusion………………………………………………………………... 115 CHAPTER SEVEN: THESIS CONCLUSION………………………………………... 117 7.1 Summary of Thesis Findings……………………………………………………. 117 7.1.1 Missing Data………………………………………………………………. 117 7.1.2 Thesis Conclusions………………………………………………………... 118

viii
7.2 Merits and Limitations of Integrating GIS in Stroke Research…………………. 120 7.2.1 Merits of Integrating GIS………………………………………………….. 120 7.2.2 Limitations of Integrating GIS…………………………………………….. 122 7.3 Future Research Directions……………………………………………………… 122 REFERENCES……………………………….………………………………………... 125
ix
List of Tables
Table 4.1 Study population characteristics.……………………………………………. 37 Table 4.2 Characteristics of Dissemination Areas (DAs) within statistically significant high and low clusters of stroke types and in-hospital mortality identified using the spatial scan statistic in SaTScan..……………. 45 Table 4.3 Characteristics of Getis-Ord Gi* and spatial scan statistic cluster intersects.. 46 Table 4.4 High and low clusters of stroke types and in-hospital mortality and proportion with risk factor(s)…………………............................................... 47 Table 4.5 Characteristics of high and low clusters of in-hospital mortality..………….. 48 Table 4.6 In-hospital mortality hot spot and transport destination, by stroke type……. 48 Table 5.1 Adjusted estimates for drive time distance, at 30-minute intervals to 180- minutes, to a SPC / SC and inclusion in a stroke / mortality hot or cold spot. 70 Table 5.2 Drive time distance, at 30-minute intervals to 180-minutes, to a Stroke Centre and in-hospital mortality after stroke. Main effects and effect modification of EMS transport on distance to a Stroke Centre………………75
Table 5.3 Drive time distance, at 30-minute intervals to 180-minutes, from a Stroke Prevention Clinic and admission to hospital with a recurrent stroke event.
Main effects and effect modification of documented atrial fibrillation on distance to a Stroke Prevention Clinic. ………..……………………………. 78
Table 6.1 Alberta population age ≥20-years with predicted geographic access to stroke care within critical transport time service areas.................................. 102
Table 6.2 Proportion of stroke events with predicted geographic access to stroke care within critical transport time service areas treated at a Stroke Centre (realized access), 2002 and 2007. ………..…………………………………104
Table 6.3 Characteristics of Alberta Administrative Data stroke events (2002/03 to 2007/08) within and outside predicted critical transport time service areas using 2010 stroke infrastructure. ….………………………………………..105 Table 7.1 Characteristics of stroke events excluded from DA calculations………….. 117 Table 7.2 Urban-rural proportions of stroke events with a documented risk factor….. 120

x
List of Figures and Illustrations
Figure 3.1 Guidelines for symptom onset (time last seen normal) to treatment time intervals. …..………………………………………………………………… 16
Figure 3.2 An Emerging Behavioral Model of Health Services Use – Phase 4................ 19 Figure 3.3 Birkmeyer’s model of potential reasons for geographic variation in
intervention rates……………………………………………………………. 20 Figure 5.1(a) Adjusted estimates for drive time distance, at 30-minute intervals to 180-minutes, to a SPC / SC and inclusion in a stroke / mortality hot spot…. 71 Figure 5.1(b) Adjusted estimates for drive time distance, at 30-minute intervals to 180-minutes, to a SPC / SC and inclusion in a stroke / mortality cold spot… 71 Figure 5.2 Estimated distance from recurrent stroke event postal code centroid to closest Stroke Prevention Clinic Using Network Analyst Route Analysis…. 81 Figure 5.3 Proportion of administrative data stroke events with documented pre-existing medical conditions, by stroke type. ……..…………………….. 83 Figure 6.1 AHS EMS – CSP data symptom onset (time last seen normal) to treatment
interval times……………... ………………………………………………… 97 Figure 6.2 Scatter plot of Network Analyst Route Analysis predicted transport times and observed EMS transport times..……..………………………………… 101 Figure 6.3 Association between actual EMS ground transport times and Network Analyst Service Areas at 5-minute intervals from the CSC……………….. 101 Map 4.1 Standard deviation map of Dissemination Area size (km2). .……………….. 29 Map 4.2 Hot and cold clusters of Ischemic Stroke identified using the Getis-Ord Gi* and Spatial Scan statistics. ……………………………………………... 40 Map 4.3 Hot and cold clusters of Transient Ischemic Attack identified using the Getis-Ord Gi* and Spatial Scan statistics…………………………………… 41 Map 4.4 Hot and cold clusters of Intracerebral Hemorrhage identified using the Getis-Ord Gi* and Spatial Scan statistics.………………………………….. 42 Map 4.5 Hot and cold clusters of Subarachnoid Hemorrhage identified using the Getis-Ord Gi* and Spatial Scan statistics.…………………………………... 43

xi
Map 4.6 Hot and cold clusters of In-Hospital Mortality identified using the Getis-Ord Gi* and Spatial Scan statistics. …………………………………. 44 Map 4.7 Cluster analysis of the proportion of stroke patients with ≥ 1 reported risk
factor(s) by Dissemination Area……………………………………………. 49
Map 5.1 Predicted Stroke Prevention Clinic drive time (minutes) service areas; 2005 and 2010 infrastructure. …….……………………………………………… 72
Map 5.2 Predicted Stroke Centre drive time (minutes) service areas; 2005, 2007, and 2010 infrastructure. …….…………………………………………………… 76
Map 5.3 Hot and cold spots of stroke and in-hospital mortality and predicted drive time (minutes) service areas. ……………………………………………….. 80
Map 6.1 Predicted transport time service areas around Comprehensive and Primary Stroke Centres, 2002 to 2010. ……………………………………………... 103
Map 6.2 Air medevacs for stroke related events, 2010/11 to 2013/14 (n = 66). ….… 112
Map 7.1 Dissemination Areas with strokes and unavailable Statistics Canada census data…………....………………………………………………......... 118 Map 7.2 EMS interval times using Inverse Distance Weighted (IDW) technique….. 124

xii
List of Symbols, Abbreviations and Nomenclature
Symbol Definition AIS Acute Ischemic Stroke CSC Comprehensive Stroke Centre CT Computerized Tomography DA Dissemination Area DM Diabetes Mellitus ED Emergency Department EMS Emergency Medical Services GIS Geographic Information Systems ICH Intracerebral Hemorrhage IDDM Insulin Dependent Diabetes Mellitus (Type 1) IV Intravenous LR Likelihood Ratio MAUP Modifiable Areal Unit Problem MRI Magnetic Resonance Imaging NIDDM Non-Insulin Dependent Diabetes Mellitus (Type 2) OTT Onset-to-Treatment Time PSC Primary Stroke Centre SAH Subarachnoid Hemorrhage SC Stroke Centre SPC Stroke Prevention Clinic TIA Transient Ischemic Attack tPA Tissue plasminogen activator

xiii
Contribution of Authors
I thank Michael D. Hill, Tim W.J. Watson, and Shelley Alexander for their
assistance with elements of the study and critical revision for Study I, “An Analysis of
Spatial Clustering of Stroke Types in Alberta, Canada, Using GIS.” which has been accepted into
the Canadian Journal of Neurological Sciences.

1
Chapter 1: Thesis Overview
1.1 Stroke: A Spatial Epidemiological Perspective
Stroke is the result of a sudden interruption of blood flow to the brain. It is a
leading cause of death and disability world wide. Strategies to reduce stroke burden must
account for the fact that stroke is a complex and multifactorial disease caused by a
combination of risk factors. Strategies to reduce stroke burden include (i) treating first
ever and recurrent stroke to reduce case fatality and maximize independence; (ii) reduce
the risk of stroke after transient ischemic attack; (iii) seek out and treat those at high risk
of stroke; and (iv) reduce the average level of causative risk factors in the whole
population (Warlow et al., 2001).
There have been significant advances in treatments for index and recurrent stroke
since the pivotal National Institute for Neurological Disorders Trial in 1995 which found
the administration of intravenous (IV) thrombolysis (tPA) within 3-hours of onset of
ischemic stroke improved clinical outcome at 3-months (NINDS and Stroke r-tPA Stroke
Study Group, 1995). Subsequent to this trial, the treatment window for tPA
administration has been extended from 3-hours to 4.5-hours in select cases (Hacke et al.,
2008). Trials for endovascular treatments (thrombectomy and thrombolysis),
neuroprotective agents, and diagnostic testing with high sensitivity and specificity for
ischemic stroke are ongoing.
Primary and secondary stroke prevention practices have been informed by
findings from research examining the efficacy of behavioural risk factor modification,
medical treatments (e.g. anticoagulation, antiplatelet, and lipid lowering), and surgical
interventions (e.g. carotid endarterectomy, stenting) on stroke reduction. Risk factors

2
that may be rooted in behaviours that are considered to be self-imposed (Lalonde, 1981;
Frohlich, 2008) are identified and managed through high risk identification strategies and
individual consultation at primary care offices and prevention clinics with the expectation
that adherence to risk reductions strategies will be maintained.
There is increasing evidence that compliance with treatment in ‘real life’ is
considerably less than in randomized control trials and that efforts at health promotion
have transient effects (Warlow, 2001; Rothwell, 2005). Many disparities that affect an
individual’s opportunity to pursue a healthy lifestyle occur beyond individual level
characteristics, resources, and behaviours (Holmes et al., 2008); rather they are shaped by
the physical, social, geopolitical and other environments within which one lives. Issues
relating to environmental justice where negative health impacts resulting from exposure
to toxic pollutants are visited on those least able to deal with them (Harvey, 1996; WHO,
Dec 2014; Maheswaran et al., 2005); neighbourhood stressors (e.g. crime, poverty);
government investment in stroke infrastructure to enhance access to care and improve
outcomes (APSS, 2014); and universal health care coverage are examples of structural
influences on individual health. A prevention strategy that reduces the average level of
causative risk factors for the population complements the individually based ‘high risk’
strategy (Warlow et al., 2001; Rose, 1985). A population prevention strategy is likely to
lower stroke incidence (and prevalence) because most strokes occur in those who are at
moderate risk and who comprise a much greater proportion of the population than those
at high risk (Rose, 1985). A population approach proposes that the magnitude of stroke
as a health problem and on future short and long term population health may be better

3
elucidated as a function of the distribution of the population and health care resources
(Rose, 1985; Spasoff, 1999).
A fundamental assumption of epidemiology is that diseases do not distribute
randomly in populations but rather distribute in relation to their determinants (Last,
2000). For most non-infectious diseases, a lot is known about the individual
characteristics of susceptible individuals but less is known about the determinants of the
incidence rate (Rose, 1985). A valuable first step in terms of our understanding of stroke
in the population and for public health planning is to examine the characteristics of
populations where clusters of modifiable risk factors exist and where higher than
expected stroke and stroke mortality rates overlap. Directed and potentially more
effective population risk reduction strategies could then be implemented in a more cost
effective manner. These strategies might include (i) increasing the availability of healthy
and affordable foods in food deserts (CDC, Dec 2014), (ii) mandatory reductions of
sodium levels in pre-prepared foods (Mohan, Campbell, & Willis, 2009), (iii) increasing
the availability of safe environments for play and exercise (Harvard School of Public
Health, Dec 2014), (iv) risk reduction strategies that consider the contextual setting of
communities including cultural values and language (including the homeless
community), and (v) equitable access to preventive care that includes bringing care to
populations where exposure to multiple risk factors and a greater number of
comorbidities exist (including the workplace).
Analyses exploring population level risk factors are enhanced by the inclusion of
explanatory variables that are spatial, enabling a richer and more comprehensive
exploration of ‘where’ and ‘why’ questions. Spatial epidemiology is a dynamic body of
4
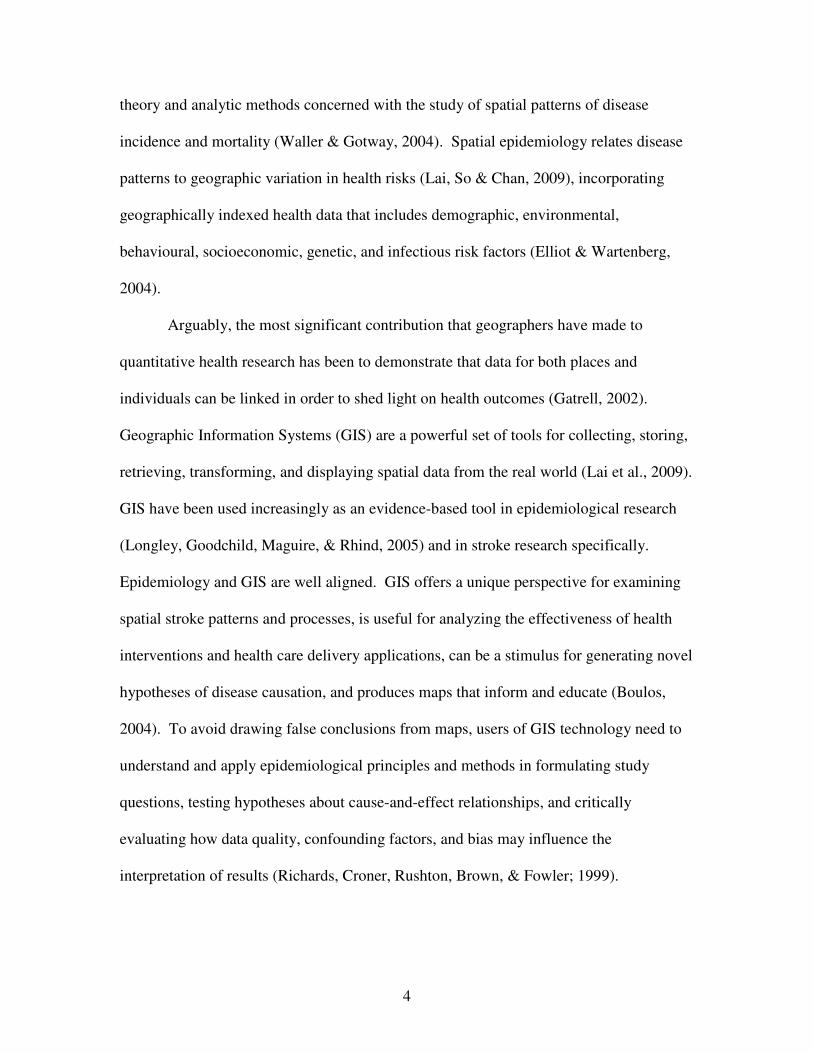
theory and analytic methods concerned with the study of spatial patterns of disease
incidence and mortality (Waller & Gotway, 2004). Spatial epidemiology relates disease
patterns to geographic variation in health risks (Lai, So & Chan, 2009), incorporating
geographically indexed health data that includes demographic, environmental,
behavioural, socioeconomic, genetic, and infectious risk factors (Elliot & Wartenberg,
2004).
Arguably, the most significant contribution that geographers have made to
quantitative health research has been to demonstrate that data for both places and
individuals can be linked in order to shed light on health outcomes (Gatrell, 2002).
Geographic Information Systems (GIS) are a powerful set of tools for collecting, storing,
retrieving, transforming, and displaying spatial data from the real world (Lai et al., 2009).
GIS have been used increasingly as an evidence-based tool in epidemiological research
(Longley, Goodchild, Maguire, & Rhind, 2005) and in stroke research specifically.
Epidemiology and GIS are well aligned. GIS offers a unique perspective for examining
spatial stroke patterns and processes, is useful for analyzing the effectiveness of health
interventions and health care delivery applications, can be a stimulus for generating novel
hypotheses of disease causation, and produces maps that inform and educate (Boulos,
2004). To avoid drawing false conclusions from maps, users of GIS technology need to
understand and apply epidemiological principles and methods in formulating study
questions, testing hypotheses about cause-and-effect relationships, and critically
evaluating how data quality, confounding factors, and bias may influence the
interpretation of results (Richards, Croner, Rushton, Brown, & Fowler; 1999).

5
Population based administrative data are useful for epidemiologic studies. In
Canada, they have the advantage of providing data for virtually all members of the
population that they represent and are therefore highly generalizable and representative of
large (geographically) defined populations (Deyo et al., 1994). When linked with more
detailed spatial data that are now available, analyses can take ‘place’ into account,
recognizing that where one lives matters to health. These studies may be followed by
more focused analyses conducted at larger geographic scales that incorporate qualitative
methods.
GIS and spatial methods have been utilized to examine regional disparities in
disease risk, incidence and mortality. Regional disparities in stroke are well documented
in the literature and persist despite our knowledge of them. It is inevitable that some
variation in disease incidence and outcomes will exist, but inequities may be avoidable,
and should be capable of being narrowed (Gatrell, 2002). Although regional disparities
in stroke are acknowledged to exist in Alberta, no published research exploring
disparities using GIS has been carried out. Hence, the focus of this research is to enrich
our current understanding of stroke as a health problem in Alberta by exploring spatial
patterns of stroke occurrence and mortality and by examining geographic accessibility to
specialized stroke care services.
1.2 Thesis Outline
This is a retrospective, population based exploratory study using administrative
data and linked ambulance and hospital data and a spatial epidemiological approach
6
integrating GIS examining the geographic distribution of stroke in Alberta and
geographic access to specialized stroke care.
This thesis begins with a cursory review of stroke types and treatments, stroke
systems of care, a discussion of the integration of GIS in health research, and a summary
of selected research papers on stroke utilizing GIS and spatial methods. This is followed
by the presentation of Studies I, II, and III. This thesis concludes with a synopsis of
research findings, a discussion of the merits and limitations of integrating GIS in stroke
research, and suggestions for future research.
The first study employed spatial methods using administrative data to identify and
locate geographic clusters of high and low rates of stroke, in-hospital mortality, and
stroke risk factors across Alberta, Canada. Findings from the first study raised important
questions regarding why regional differences exist and how disparities might be
mitigated. The second study expanded upon the cluster analysis with an examination of
associations between known and novel predictors of stroke and (i) stroke and mortality
hot and cold spots identified in Study I, (ii) mortality at the individual level, and (iii)
recurrent stroke, using multivariable logistic regression methods. Taking into account the
importance of timely access to specialized stroke care to good outcome, the third study
employed spatial methods to estimate the proportion of the Alberta population with
predicted geographic access to specialized stroke care by ground transport within critical
treatment time windows. The proportion of stroke events with predicted geographic
access to stroke care who accessed care at an accredited stroke centre (realized access)
was also determined and regions where realized access might be increased were
highlighted. This thesis concludes with a summary integrating findings from the three

7
studies, a discussion of the merits and limitations of integrating GIS in stroke research,
and suggestions for future research.

8
Chapter 2: Thesis Purpose
2.1 Study Rationale
Studies examining geographic variations in health care often identify
unrecognized problems in clinical decision making, identify populations with inequitable
geographic access to health care, inform public health policy, quantify the impact(s) of
process and policy changes, may predict future population health care trends and needs
(Birkmeyer, 2001), and enhance our understanding of how disparities might be mitigated.
Specific gaps in knowledge pertaining to stroke in Canada have been identified
and include (i) the extent to which health services before admission to hospital affect
mortality rates, other patient outcomes, and costs (CIHI, 2006), (ii) why regional
differences in 30-day in-hospital stroke mortality exist (CIHI, 2006), and (iii) our
understanding of why stroke that occurs in women, in children, in rural areas, ethnic
minorities and disadvantaged populations persist (Birdsell, Omelchuk, & Skanes, 2007).
Efficacious stroke prevention strategies and timely access to specialized care for stroke
are necessary components of a strategy to reduce stroke incidence and improve outcomes.
Although geographic variability in access to health care experts, technology, and at-risk
populations in Alberta has been established, evaluations of stroke services and outcomes
in Alberta have been conducted to assess changes in service provision and outcomes over
time but have not incorporated a spatial component beyond the stratification of outcomes
by health zone (Jeerakathil, Burridge, Thompson, Fang, & Hill, 2010). An analysis of the
spatial distribution of stroke types and mortality in Alberta has not previously been
undertaken, and the extent to which regional differences in known and novel risk factors
for stroke are associated with any disparities in the spatial distribution of stroke in

9
Alberta has not been fully considered. How much geographic variation exists, where it
exists, what populations (rather than persons) are affected, and whether preventable
regional disparities have been mitigated with targeted enhancements to stroke services
are not known.
There has been extensive research investigating regional disparities in disease
incidence and mortality. Geographic variation in traditional stroke risk factors is now
thought to play a smaller role in the geographic variation in stroke and mortality than
previously thought (Howard et al., 2009). It is estimated that 15% of the population’s
health is attributable to biology and genetic factors, 10% to the physical environment,
25% to the reparative work of the health care system, and 50% to the social and
economic environment (Keon & Pépin, 2009). There is a need to consider alternative
causes, in addition to traditional risk factors, that underlie geographic variation in stroke
incidence and mortality (Howard et al., 2009).
Although stroke and mortality data have been available within the public domain
in table, report, and choropleth rate map formats at multiple scales - international (WHO,
Oct 2014), national (WHO, Oct 2014), and provincial and regional for Alberta (PHAC,
Oct 2014; AHW, Oct 2014), the availability of spatial incidence and prevalence data at
larger geographic scales is inconsistent across disease states and geography within
Canada. The availability of geocoded administrative stroke data for Alberta joined with
Statistics Canada census data, geocoded and linked ambulance and hospital stroke data,
detailed spatial data files, and GIS has facilitated the analyses for Parts I, II, and III of
this research project that are designed to address some of these gaps as they pertain to
stroke in Alberta.

10
2.2 Study Hypotheses
It is hypothesized that, after adjusting for age and population distribution, the
geographic distribution of stroke in Alberta is neither uniform nor random. There will be
geographic areas with populations who are at greater risk for stroke, experience higher
than expected rates of stroke, and have worse outcomes after stroke. Variations will exist
at the local and regional scale. There may additionally be geographic variations in stroke
distribution according to stroke type.
It is expected that strokes will be higher in areas with populations who have
higher than expected risk(s) for stroke that include diabetes mellitus, hypertension, atrial
fibrillation, and hypercholesterolemia, and where there is a greater proportion of the
resident population with low median household income, who are ethnic minorities, non-
English speaking, and have less than high school education. It is hypothesized that these
predictors may be of less importance to outcome after stroke than geographic proximity,
costed by ground travel time, to a Primary Stroke Centre (PSC) or Comprehensive Stroke
Centre (CSC).
It is expected that geographic proximity to a Stroke Prevention Clinic (SPC) will
be an important predictor of recurrent stroke and that geographic proximity to a Stroke
Centre (SC) will be an important predictor of mortality after adjusting for stroke severity.
It is also expected that with the increase in the number of PSCs, a greater proportion of
the population of Alberta have access to specialized stroke care within acute stroke
treatment time windows.

11
2.3 Study Objectives
The primary objective of this research study is to inform on the role of geography
in stroke as a health problem in Alberta. A spatial epidemiological analysis will be
carried out in three parts with study objectives as follows:
Study I: to identify geographic variances in stroke occurrence, in-hospital mortality and
reported stroke risk factors using GIS based methods and administrative data
sets in the province of Alberta. The goal is to identify population clusters with
higher or lower rates of the major stroke types and in-hospital mortality;
Study II: to investigate whether (1) distance from a SPC predicts inclusion in a hot or
cold spot for stroke and distance from a SC predicts in-hospital mortality after
adjusting for selected Dissemination Area level characteristics, (2) drive time
(minutes) from a SC predicts in-hospital mortality after stroke, and (3) drive
time (minutes) from a SPC predicts admission to hospital for a recurrent stroke
event, using multivariable logistic regression; and
Study III: to (1) evaluate the concordance of GIS predicted versus actual Emergency
Medical Services (EMS) ground transport times for stroke, (2) estimate the
proportion of Alberta population age ≥20 years with potential geographic
access to acute stroke care by ground within critical onset-to-treatment (OTT)
time windows as defined by parameters in our data (predicted geographic
access), (3) identify the proportion of a stroke population with predicted
geographic access to stroke care who accessed care at a CSC or PSC (realized
access) in 2002 and 2007, and (4) to characterize stroke populations with

12
predicted geographic access within and outside of critical transport time
windows.
An overview of stroke types and treatments, stroke systems of care, and a
summary of selected studies in the stroke literature utilizing spatial methods and GIS now
follows.

13
Chapter 3: Stroke, Stroke Systems of Care, Outcomes and Geography
3.1 Stroke Types and Treatment
Stroke is the result of a sudden interruption of blood flow to the brain caused
either by the occlusion of a blood vessel by a thrombus or atherosclerotic plaque in
ischemic stroke or the rupture of a diseased blood vessel in hemorrhagic stroke (AHA,
Sept 2014). Neurological deficits reflect the area of the brain that has been affected.
Stroke is the fourth leading cause of death in Canada and a leading cause of acquired
long-term disability in adults (APSS, 2006). Twenty percent of strokes are fatal and for
those who survive, 75% live with some form of disability (APSS, 2006).
Diagnostic imaging (Computed Tomography or CT) is required to identify stroke
type and to delineate viable (penumbra) and infarcted tissue. Treatment varies according
to the type of stroke. The National Institute for Neurological Disorders and Stroke
(NINDS) Trial (1995) was a pivotal study that found treatment with IV tPA within 3-
hours after onset of stroke symptoms improved clinical outcome at 3-months (NINDS
and Stroke r-tPA Stroke Study Group, 1995). Definitive treatment for Acute Ischemic
Stroke (AIS) remains the administration of IV tPA within 3-hours of onset of symptoms
and longer (up to 4.5-hours) in selected circumstances (Hacke et al., 2008). The onset-to-
treatment (OTT) time with IV-tPA is strongly associated with outcome, with a doubling
of the odds of good outcome when administered under 1.5-hours after onset versus 1.5 to
3.0-hours after onset (Hacke et al., 2008; Marler et al., 2000). This relationship holds for
all forms of reperfusion therapy (Mazighi et al., 2009; Mazighi et al., 2012; Khatri et al.,
2014).

14
Transient Ischemic Attack (TIA) is a brief episode of neurologic dysfunction
caused by focal brain or retinal ischemia, with clinical symptoms similar to ischemic
stroke but typically lasting less than one hour, and without evidence of acute infarction
(Albers et al., 2002) on imaging (Magnetic Resonance Imaging or MRI). After a first
TIA, 10% to 20% of patients go on to have an ischemic stroke in the next 90-days
(Albers et al., 2002). Therefore, urgent evaluation and treatment to prevent ischemic
stroke is recommended. Effective lifestyle changes and treatments for preventing
ischemic stroke include blood pressure management, dietary modification, exercise
(Davis & Donnan, 2012), surgery for severe carotid-artery stenosis, anticoagulant therapy
for high-risk cardioembolic conditions (e.g. atrial fibrillation), and antiplatelet agents for
the prevention of noncardioembolic stroke (e.g. atherosclerotic plaque) (Albers et al.,
2002).
Intracerebral Hemorrhage (ICH) is bleeding into the parenchyma of the brain
(Qureshi et al., 2001). Treatment is time sensitive and may include blood pressure
management, intraventricular administration of thrombolytic agents, and surgical
evacuation (Qureshi et al., 2001) necessitating admission to a neuro-intensive care unit.
The leading cause of non-traumatic Subarachnoid Hemorrhage (SAH) is rupture
of an intracranial aneurysm (80% of cases) leading to the extravasation of blood into the
subarachnoid space (Suarez, Tarr, & Selman, 2006). Hypertension and smoking increase
the risk of SAH. Treatment for intracranial aneurysms includes observation, craniotomy
with clipping of the aneurysm, and endovascular coil-occlusion of the aneurysm
(Brisman, Song, & Newell, 2006), also necessitating admission to a neuro-intensive care
unit. Treatment is time-sensitive.

15
3.2 Stroke Systems of Care
A stroke system of care should coordinate and promote patient access to services
associated with primary and secondary stroke prevention, community education,
notification and response of EMS, acute stroke treatment, subacute stroke treatment and
secondary prevention, rehabilitation, reintegration, and continuous quality improvement
activities (Schwamm et al, 2005). Fragmentation of the delivery of these services
frequently results in suboptimal treatment, safety concerns, and inefficient use of
healthcare resources (Schwamm et al, 2005).
Increasing access to acute reperfusion therapy and minimizing OTT are two of the
major goals in the implementation of an integrated system of stroke care (Schwamm et al,
2005; Lackland et al, 2014, Acker et al., 2007) (Figure 3.1). Prevention of delays in
treatment for stroke requires early stroke recognition, rapid activation of EMS and use of
transport protocols for EMS and close geographic proximity of the populace to
operational stroke centres. Implementation of a comprehensive system of stroke care has
been shown to increase the use of EMS for transport, reduce interfacility transfer delays,
reduce OTT times, and increase rates of thrombolysis administration for AIS
(Prabhakaran, O’Neill, Stein-Spencer, Walter, & Alberts, 2013; Prabhakaran et al., 2011;
Saver et al, 2010).
3.2.1 Stroke Systems of Care in Alberta, Canada
In Alberta, there are 2 Comprehensive Stroke Centres (CSC), located in the two
largest cities, and 14 Primary Stroke Centres (PSC). PSCs have CT scan availability,
stroke expertise on-site or available by telestroke linkage, and tPA treatment availability.

16
ONSET → DOOR → CT → NEEDLE
Symptom Onset to 9-1-1
9-1-1
to Dispatch
Dispatch
to Scene
Scene Scene
to PSC/CSC
ED
to CT
CT
to Treatment
<90-sec* <8-min* <15-min* Lights & Siren† ≤25-min*
<20-min‡
< 3.0-hours
[Class 1 Recommendation; Level of Evidence A]§
<60-minutes
[Class 1; Level of Evidence A]§
3.0 to 4.5-hours
[Class 1 Recommendation; Level of Evidence B]§
*American Heart Association Guidelines, 2013. https://www.aan.com/Guidelines/home/GetGuidelineContent/581. †Alberta Health Services Emergency Medical Services. ‡Alberta Provincial Stroke Strategy Pre-Hospital Care, 2009. http://www.strokestrategy.ab.ca/Prehospital%20Nov2409%20Final.pdf. §American Heart Association Target: Stroke. http://www.strokeassociation.org/idc/groups/heart-public/@wcm/@hcm/@gwtg/documents/downloadable/ucm_308277.pdf.
Figure 3.1. Guidelines for symptom onset (time last seen normal) to treatment time
intervals.
CSCs have a stroke team, neurosurgical expertise, and neuro-interventionalist expertise
on-site in addition to PSC capabilities. Telestroke linkage can increase access to IV-tPA
treatment for AIS patients receiving care at SCs without on-site stroke expertise but with
tPA treatment availability. The SC connects to a remote neurologist who can access CT
imaging and examine a patient via video-link for the purpose of advising the ED
physician whether to administer IV-tPA (Bisby & Campbell, 2012). Telestroke linkage
can also be used to access specialized care for primary and secondary stroke prevention.
In 2006, the Government of Alberta recognized the need to provide an integrated
and accessible health service to best meet the needs of stroke patients regardless of place
of residence, noting that 40% of the population resided in rural Alberta (APSS, 2006).
Eleven existing regional hospitals with CT scan availability were designated as PSCs,
supported by a standardized EMS stroke screen tool, direct EMS transport protocols, and
best practice stroke care guidelines instituted at all sites.

17
EMS modes of transport for acute stroke patients include ground ambulance and
rotary or fixed wing aircraft. In Alberta, the Referral Access Advice Placement
Information and Destination centre (RAAPID) facilitates critical and urgent transfers or
consultations with a tertiary care centres or specialists, ensuring that patients are
transferred expeditiously to the appropriate facility (AHS, Oct 2014).
3.3 Conceptual Framework: The Structurationist Approach
The structurationist approach to health geography is selected as a framework for
this research because it recognizes the duality of structure and human agency; that
humans make their own health but not in conditions of their choosing (Gatrell & Elliott,
2009). Social structure affects agency. Social structures (e.g. health care infrastructure
and proximity to specialized care; transportation infrastructure; universal health
coverage) together with employment and family commitments; health beliefs, attitudes,
values and knowledge; and physical ability may dictate whether a person seeks care, is
referred to a specialist, attends preventive care appointments, and is compliant with / can
afford recommended therapy(s). Agency may transform structure. Public awareness
campaigns regarding abstinence from risk taking behaviours are often ineffective because
these behaviours are social and rooted in community life (Rose, 1985; Douglas &
Wildavsky, 1983; Frohlich & Potvin, 2008) and roots of these behaviours are not
effectively addressed at a structural level. A consequence of a lack of change in risk
taking behaviours or of uptake of health care in particular locations may be modifications
to how services are delivered.

18
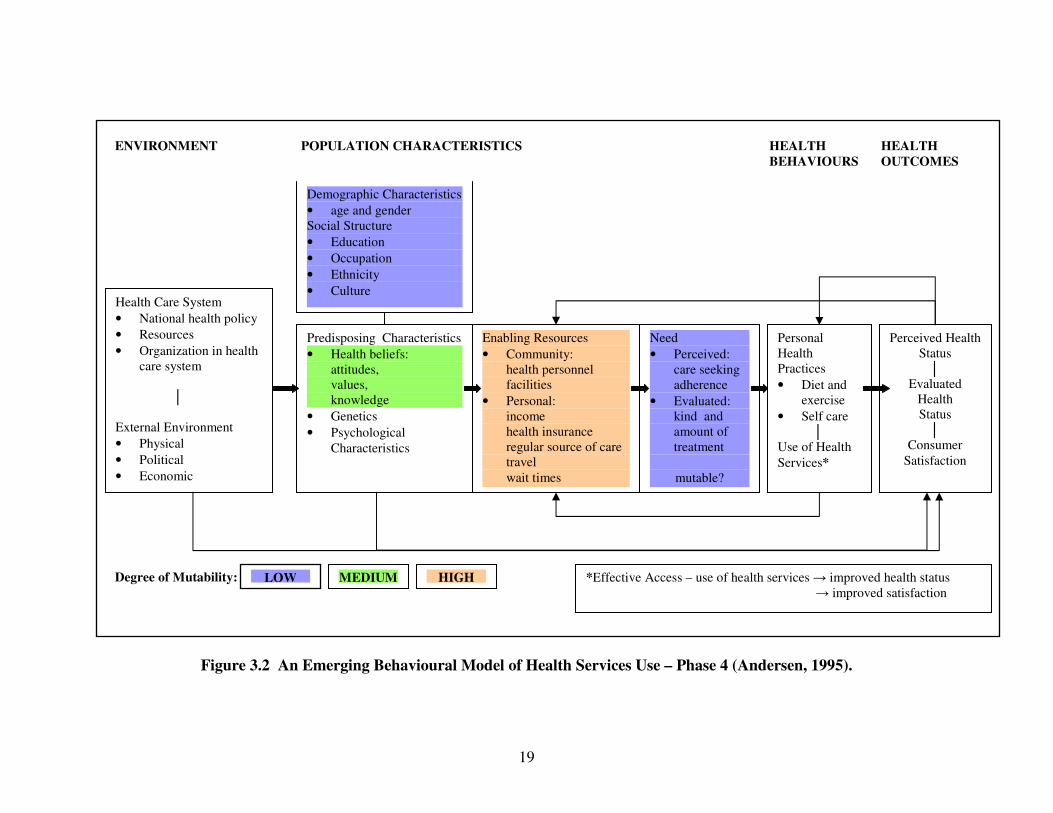
Andersen’s behavioural model (Figure 3.2) (Andersen, 1995) is used as a framework for
understanding conditions that either facilitate or impede utilization of health care services
and equitable access to health care. It fits within a structurationist framework because it
recognizes that both community (structural) and personal enabling resources must be
present for utilization of health care services to take place. In Andersen’s model,
‘perceived need’ will help us better understand care-seeking and adherence to a medical
regime, and ‘evaluated need’ will be related to the type and amount of treatment that will
be provided. ‘Need’ and ‘demographic’ characteristics would dictate hospital services
received for an acute health event. Utilization of more discretionary health services
would be explained more by social structure, beliefs, and enabling factors. Andersen
defines ‘equitable’ access as occurring when ‘demographic’ and ‘need’ variables account
for most of the variance in utilization. ‘Inequitable’ access occurs when ‘social
structure’, ‘health beliefs’, and ‘enabling resources’ determine who receives health care.
Petersen relates the importance of mutability of variables to the ability to institute policy
change(s) that increase access to care. Enabling resources are considered highly mutable.
Health beliefs are rated as having medium mutability since they can be altered and
sometimes effect behavioural change. Health education may increase or decrease
perceived need, and evaluated needs can be altered to influence the medical practitioner’s
judgment about the patient’s evaluated need for health care. This last point ties in with
Birkmeyer’s model addressing geographic variation in the provision of care.
19
Figure 3.2 An Emerging Behavioural Model of Health Services Use – Phase 4 (Andersen, 1995).
Health Care System
• National health policy
• Resources
• Organization in health care system
│
External Environment
• Physical
• Political
• Economic
Demographic Characteristics
• age and gender Social Structure
• Education
• Occupation
• Ethnicity
• Culture
Predisposing Characteristics
• Health beliefs: attitudes, values, knowledge
• Genetics
• Psychological Characteristics
Enabling Resources
• Community: health personnel facilities
• Personal: income health insurance regular source of care travel wait times
Need
• Perceived: care seeking adherence
• Evaluated: kind and
amount of treatment
mutable?
Personal Health Practices
• Diet and exercise
• Self care │ Use of Health
Services*
Perceived Health Status │
Evaluated Health Status │
Consumer Satisfaction
Degree of Mutability: MEDIUM HIGH LOW *Effective Access – use of health services → improved health status → improved satisfaction
ENVIRONMENT POPULATION CHARACTERISTICS HEALTH HEALTH
BEHAVIOURS OUTCOMES
20
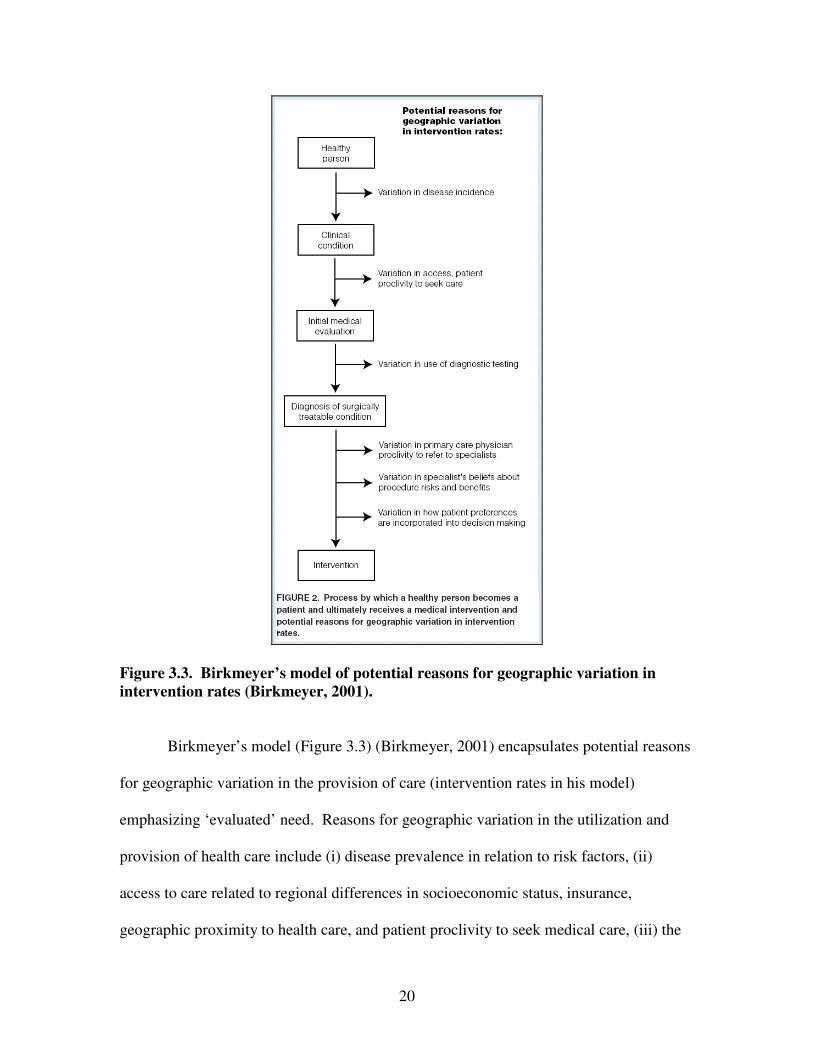
Figure 3.3. Birkmeyer’s model of potential reasons for geographic variation in
intervention rates (Birkmeyer, 2001).
Birkmeyer’s model (Figure 3.3) (Birkmeyer, 2001) encapsulates potential reasons
for geographic variation in the provision of care (intervention rates in his model)
emphasizing ‘evaluated’ need. Reasons for geographic variation in the utilization and
provision of health care include (i) disease prevalence in relation to risk factors, (ii)
access to care related to regional differences in socioeconomic status, insurance,
geographic proximity to health care, and patient proclivity to seek medical care, (iii) the

21
decision on the part of the physician to test, and (iv) the decision to treat, and the
propensity to refer the patient to a specialist and the specialist’s beliefs regarding the risks
and benefits of a given treatment. As Birkmeyer’s model pertains to stroke, it highlights
the support that is necessary on behalf of healthcare providers working at sites that care
for a smaller number of stroke patients in the provision of best practice stroke care.
Support is currently available in Alberta via Strategic Clinical Networks, continuing
education programs (including interprovincial rounds), RAAPID, telestroke linkages
(AHS – Telestroke, 2014), and the TIA Hotline (Coutts & Jeerakathil, 2014).
This research will consider predictors for stroke and mortality that are tied to
human agency and are potentially mutable (e.g. hypertension), are structural and have
low mutability (e.g. ethnicity), and are structural and mutable (e.g. geographic proximity
to specialized stroke care) via government health care policy initiatives and investment.
3.4 Integration of Spatial Methods and Geographic Information Systems in Stroke
Research
3.4.1 Spatial Methods and Geographic Information Systems
GIS technology serves two main functions: (i) the production of maps to promote
the visualization of spatial information (e.g. disease atlases), and (ii) the analysis of
spatial information including exploratory spatial data analysis (e.g. buffer analysis,
cluster analysis of high and low risk, network analysis), modeling of health data in a
spatial setting (e.g. assessing disease incidence and associations with explanatory
variables), and multi-level modeling (Lai et al, 2009; Longley et al., 2005; Gatrell et al.,
2009). Multi-level modeling helps to establish whether health variations from place to

22
place are due to compositional effects (because different sorts of people live in different
places) or due to contextual effects (because attributes of places themselves differ),
thereby contributing to our understanding of how the interaction of human agency and
the environment impact health (Gatrell et al., 2009). This research paper will utilize
exploratory spatial data analysis and logistic regression techniques.
3.4.2 Defining Access to Care
Dimensions of “access” to health care include (i) availability – the relationship of
existing services to the clients’ volume and types of needs, (ii) accessibility – the
relationship between the location of supply and the location of clients, taking client
transportation resources, travel time, distance and cost into account, (iii) accommodation
– the relationship between the manner in which the supply resources are organized to
accept clients and the clients’ ability to accommodate to these factors and the clients’
perception of their appropriateness, (iv) affordability – the relationship of prices of
services and providers’ insurance, ability to pay, and existing health insurance (e.g. in the
Canadian context – supplemental costs including ambulance transport, prescription
medications, travel and accommodation, rehabilitation), and (v) acceptability – the
relationship of clients’ attitudes about personal and practice characteristics of providers to
the actual characteristics of existing providers, as well as to provider attitudes about
acceptable personal characteristics of clients (Penchansky & Thomas, 1981). In the case
of acute stroke, a potentially life-threatening emergency, availability and accessibility are
germane.

23
Spatial accessibility is a measure of the number of services in comparison to the
number of potential users. The extent to which inequalities in access to health care exist
is a product of the spatial arrangement of the health care delivery system, the location and
distribution of the population within a region, characteristics of the transportation
infrastructure (Delamater, Messina, Shortridge, & Grady, 2012), and associated costs.
Therefore, the location and number of healthcare services is an important health policy
issue. Location-allocation analysis in GIS can support health policy decision making as it
considers accessibility and availability in the locating of facilities that makes it possible
to reach the most people within a defined time frame (ESRI – Location-Allocation,
2014), imperative for adverse health events including stroke that have critical treatment
time windows, and avoids duplication of services.
‘Potential’ access to health care exists when a needy population coexists in a
space and time with a willing and able healthcare delivery system and ‘realized’ care
occurs when all barriers to provision are overcome (Guagliardo, 2004). ‘Potential’ and
‘realized’ access are not necessarily equivalent. Gomez et al. (2013) found that a
discrepancy existed between the availability of trauma services care (potential access)
and realized access to care at a trauma centre, concluding that the availability of services
does not ensure their utilization.
3.4.3 Stroke Research Utilizing Spatial Methods and GIS
There has been extensive choropleth mapping of stroke, risk factors, and stroke
mortality in the U.S., however geographic mapping of stroke in Canada (WHO, 2014)
and Alberta (AHW - IHDA, 2014; AHW, 2007) has been limited. Data are most often
24
presented in table and graphic formats and, if spatial data are available, they are provided
at smaller geographic scales (e.g. health region/zone or province).
Spatial methods and GIS have been used to identify patterns of stroke and locate
regions where disparities in incidence and mortality exist. In the U.S., the concept of a
stroke belt, a broad band of excess mortality from stroke encompassing much of the
southeastern U.S., was introduced in 1995 (Lanska & Lewis, 1995). Since this time,
choropleth maps of incidence and mortality have been constructed and assessed for
associations with spatial distributions of known and novel risk factors including
hypertension, ethnicity, and poverty (Tenenbaum & Waters, 2011). More recently Xu,
Ma, Liu & Hankey (2013) used GIS to create choropleth maps displaying a newly
identified stroke belt of high incidence in China. Differences in risk factor distributions
between the stroke belt and other regions were compared using one-way ANOVA.
Pedigo, Aldrich, & Odoi (2011) performed a cluster analysis using the spatial scan
statistic to identify and locate statistically significant clusters of stroke mortality in the
East Tennessee Appalachian Region of the U.S. Logistic modeling was utilized to
identify potential associations between neighbourhoods located within a high risk cluster
and selected neighbourhood socioeconomic and demographic predictors. GIS have been
used to support analyses investigating novel risk factors for stroke. For example,
Maheswaran et al. (2005) used GIS to interpolate modeled air pollution data to census
enumeration districts in their analysis examining the association between exposure to
elevated levels of air pollution and increased risk for stroke mortality and hospital
admissions for stroke.

25
Buffer analysis was used by Scott, Temovsky, Lawrence, Guidaitis & Lowell
(1998) in their evaluation of the proportion of the Canadian population with potential
geographic access to IV tPA for AIS. Census population data were attached to
Enumeration Area (EA) centroids. Census data were then extracted from the EAs located
within specified areas around hospitals identified as having the capability to provide care
for AIS. These areas were created based upon travel distances and times deemed
clinically significant in the treatment of AIS. Proportions of the Canadian population
considered to have timely access to stroke care were calculated. Similar methods were
used in Suzuki et al.’s (2004) work assessing the proportion of the U.S. population with
access to intra-arterial therapies for AIS. The availability of more detailed
representations of geographic accessibility (e.g. street network data) incorporating
transportation infrastructure (roads for travel distances), travel impedance (speed limits
and distance for travel time), and various modes of travel (e.g. public transportation)
(Delamater et al., 2012) have enabled more accurate calculations of scene-to-healthcare
destination travel times. Acharya et al. (2011) used GIS network analysis to calculate a
network distance from each patient’s home to the hospital. Patients were grouped by
distance into quintiles and a multivariate model was created to identify whether patients
living in close proximity to the hospital (arrival within 3-hours of symptom onset) were
more likely to receive thrombolysis for AIS. Network analysis was also used by Pedigo
& Odoi (2010) in their investigation of neighbourhood disparities in travel time to
emergency stroke and myocardial infarction care in East Tennessee.

26
Study I, the first of three studies exploring stroke as a population health problem
in Alberta, now follows. This study will elucidate the geographic distribution of stroke
events, mortality, and risk factors occurring from 2002 to 2007 inclusive in Alberta.

27
Study I. An Analysis of Spatial Clustering of Stroke Types, In-hospital Mortality,
and Reported Risk Factors in Alberta, Canada, Using GIS.

28
Chapter 4: Study I. An Analysis of Spatial Clustering of Stroke Types, In-hospital
Mortality, and Reported Risk Factors in Alberta, Canada, Using GIS.
4.1 Background
Alberta is a Canadian province with diverse topography spanning 640,000 square
kilometres and a population of 3,645,000 (Statistics Canada – Population and Dwelling
Counts, 2014). Population density varies greatly. Two-thirds of the population resides in
two major urban centres and the remainder in rural and smaller urban centres (Statistics
Canada – Population Urban and Rural, 2014). Stroke expertise is concentrated in the two
Comprehensive Stroke Centres (CSC) located in Edmonton and Calgary. There are
fourteen Primary Stroke Centres (PSC) with thrombolysis protocols and telestroke access
in place (Jeerakathil et al., 2010) strategically located throughout the province (Map 4.1).
In 2011, there were 6,951 incident stroke cases (AHW – IHDA, 2014) and approximately
36,000 stroke survivors in Alberta (Michael D. Hill, unpublished data, 2013).
4.2 Study Purpose
Major advances have been made to the quality and delivery of specialized stroke
care but regional disparities in stroke incidence and mortality persist (Prabhakaran et al.,
2013; Sarti, Rastenyte, Zygimantas & Tuomilehto, 2000). Documenting existing trends
and identifying the reason(s) for these variances is fundamental to the design of rational
health care planning, distribution of resources and program development (Wennberg &
Gittelsohn, 1973). The aim of this investigation was to identify geographic variances in
stroke occurrence, in-hospital mortality (henceforth known as mortality) and reported
stroke risk factors using Geographic Information Systems (GIS) based methods and

29
administrative data sets in the province of Alberta. The goal was to identify population
clusters with higher and lower rates of the major stroke types and in-hospital stroke
mortality.
Map 4.1 Standard deviation map of Dissemination Area size (km2).

30
4.3 Methods
4.3.1 Study Design
This study employed a spatial epidemiological approach using population-based
administrative data, collected over 6-years, integrating GIS. GIS have been used
increasingly as an evidence-based tool in epidemiological research (Boulos, 2004), and in
stroke research specifically (Pedigo et al., 2011; Han et al., 2005). The study was
approved by the Conjoint Health Research Ethics Board at the University of Calgary.
4.3.2 Data
4.3.2.1 Administrative Data
Using administrative data has advantages: (1) there are data for all stroke types
and all geographic regions of Alberta, presenting to most or all health care facilities, and
(2) these data are more representative than data obtained from small sample size research,
or where there are strict eligibility criteria.
Alberta, like other provinces in Canada, has a provincially administered
government funded universal health care insurance system covering approximately 97%
of permanent residents. Exceptions include Registered First Nations persons, prison
inmates, and members of the military and the Royal Canadian Mounted Police who have
similar coverage federally (Health Canada, 2013). All persons diagnosed with stroke
who accessed the health care system in Alberta are included in our database. Stroke was
considered by type – ischemic stroke, transient ischemic attack (TIA), intracerebral
hemorrhage (ICH) and subarachnoid hemorrhage (SAH). Alberta Inpatient Discharge
Abstract data (CIHI – DAD, 2013) and Ambulatory Care data (CIHI – NACRS, 2013)
31
that includes Emergency Department (ED) visits for fiscal years 2002/03 to 2007/08
inclusive were linked and all personal identifiers removed. Subjects included had an
administrative data diagnosis of stroke. Patients selected for inclusion had an ICD-10
(WHO – ICD-10, 2013) diagnosis of I63 (cerebral infarction), H34 (retinal arterial
occlusion), I64 (stroke not specified as hemorrhage or infarction); I60 (subarachnoid
hemorrhage - SAH); I61 (intracerebral hemorrhage - ICH); or G45 (transient ischemic
attack - TIA). ICD-10 I64 (not specified as hemorrhage or infarction) was coded with
I63 and H34 as ischemic stroke based on the assumption that 87% of strokes are ischemic
and 13% are hemorrhagic (CDC – Stroke Facts, 2014). ICD-10 codes G454 (transient
global amnesia) and I676 (venous thrombosis) were excluded. Patients under 20-years of
age were excluded as mechanisms for stroke in children differ from those in adults.
Persons without a health care number and/or a valid Alberta postal code were also
excluded.
A new stroke event was identified as follows. If multiple visits for the same
patient occurred within 48-hours, the most serious event was selected (ICH > SAH >
ischemic > TIA). If multiple visits within 48-hours were of the same stroke type, the first
event was selected because any treatment(s) received during the first health encounter
could alter the patient’s risk profile prior to the second encounter (Jeerakathil et al.,
2010).
Known risk factors included for examination had an ICD-10 code of E10 (Type 1
or Insulin Dependent Diabetes Mellitus - IDDM), E11-E14 (Type 2 or Non-Insulin
Dependent Diabetes Mellitus - NIDDM), I48 (atrial fibrillation), I10-I15 (hypertension),
and E780, E781, E784, E785, E788, E789 (hypercholesterolemia).
32
4.3.2.2 Spatial Data
For the spatial analysis, shapefiles including health care facilities, cities, and
Dissemination Area (DA) and Alberta boundaries were obtained from Spatial and
Numeric Data Services (SANDS), University of Calgary (University of Calgary, 2013).
4.3.3 Non-Spatial Methods
Administrative data were linked with Statistics Canada 2006 census population
data and age standardized rates, using 10-year age categories, were calculated using the
direct method in order to preserve consistency for comparisons across geographic areas
(Lai et al., 2009; Beyer, Tiwari & Rushton, 2009). Five-year, 10-year, and 20-year
(Johansen, Wielgosz, Nguyen & Fry, 2006) age-categories were considered and 10-year
categories chosen because they capture differences in age distribution (Buescher, 1998)
and are comparable to other epidemiological studies (Klein & Schoenborn, 2001). No
adjustment was made for sex to avoid spreading the data too thinly and because age
generally has a much stronger impact on stroke incidence and mortality (Buescher, 1998).
The date of designation of a health care facility as PSC was not considered in this
analysis. STATA/IC 12.1 (StataCorp, 2013) software was used for the non-spatial
portion of the analysis.
4.3.4 Spatial Methods
4.3.4.1 Spatial Unit of Analysis
Dissemination Area (DA), as defined by Statistics Canada, was selected as the
geographic unit of analysis. DAs are small, relatively stable geographic units with a

33
population of between 400 and 700 persons (Statistics Canada – PCCF, 2013), designed
to be socio-economically relatively homogeneous. DA was selected because it is the
smallest geographical unit for which Statistics Canada census data is available, cover all
of the territory of Canada, and may be demographically more homogenous than larger
units. This may facilitate examination of broad regional and local patterns as well as
associations with risk factors. DAs have similar population numbers but often vary
widely in area. Our DAs ranged in area from 0.005 square kilometres (km2) in urban
centres to 42,640 km2 in rural regions. Hence, visualization of DA rates and patterns
using choropleth maps (i.e. area based) was difficult and potentially misleading as
attention may be drawn to DAs with the greatest area (Monmonier, 1991).
Statistically, rates for geographic areas with small populations may be unstable.
High rates may be attributable to either underlying high risk or to high variance due to
small population numbers (Buescher, 1998). This was addressed in part as (i) DA
population numbers are relatively uniform, and (ii) stroke events for fiscal years 2002/03
to 2007/08 were aggregated and annualized mean rates were calculated. Data were not
aggregated into larger geographic units as this would obscure local level information.
4.3.4.2 Definition of Rural
Postal codes were used to identify rural and urban geographic areas. Postal code
location has been found to closely approximate the location of residence in urban areas;
however these findings cannot be generalized to rural areas where single postal codes
cover a large geographic territory (Bow et al., 2004). The use of postal code as proxy for
location of residence sufficed for this research study. Depending on the definition,
34
Canada’s rural population may vary between 22% and 38% of the total population (23%
for PC) (du Plessis, Beshiri, Bollman, & Clemenson, 2002). Postal codes were converted
to latitude and longitude coordinates using the 2006 and 2011 Postal Code Conversion
Files (Statistics Canada – PCCF, 2013). Data were imported into ArcGIS ArcMap 10
(ESRI – ArcMap 10.0, 1999-2010). There were no unmatched postal codes in our
dataset. Individual events were aggregated according to DA. Statistics Canada 2006
Census data were suppressed for 15 DAs of 3757 DAs with stroke events due to reserve
land, unreliable census data, or small population numbers (<100 for 6-character postal
code (Statistics Canada – Data Quality, 2013).
4.3.4.3 Annualized Rates
Annualized mean age-standardized stroke and mortality rates were calculated for
each DA and used for our cluster analysis. DAs with suppressed data were assigned a
rate of “0” for the cluster analysis if no strokes were reported during the 6-year time span.
4.3.4.4 Spatial Statistics
Data were projected to NAD1983, 10-degree Transverse Mercator, because this
best maintains area accuracy (ESRI – Transverse Mercator, 2013). Two widely used
statistical methods were employed in GIS, the Getis-Ord Gi* (ESRI – Hot Spot Analysis,
2013) statistic in ArcGIS and spatial scan statistic (Kulldorff, 2013) in SaTScan
(SaTScan, 2013) to identify ‘hot spots’ and ‘cold spots’ of stroke occurrence and
mortality. The Getis-Ord Gi* statistic delineates clusters with rates significantly higher
or lower than the overall study area mean. Rates for each DA and its neighbouring DAs
35
are summed and divided by the sum of all values in the data set (Mitchell, 2009). When
the observed local sum is larger (or smaller) than the expected, the output is a statistically
significant z-score (Mitchell, 2009). The spatial scan statistic, developed by Kulldorff &
Nagarwalla (1995), imposes a circular scanning window of varying sizes for each set of
DA centroid coordinates across the study area. The window with the maximum
Likelihood Ratio (LR), where there is elevated (or reduced) risk within the window as
compared to outside, constitutes the most likely cluster. A p-value is obtained through
Monte Carlo hypothesis testing (Kulldorff, 2013). Secondary clusters are also identified
and are ordered according to their LR statistic. Those clusters that do not overlap with
the most likely cluster may offer important additional information and are included in our
analysis. Age-standardized rates using the direct method were used for the Getis-Ord Gi*
analysis and age-standardized rates using the indirect method were used for the spatial
scan statistic analysis.
Statistical significance for hot spots was set as DAs with a Gi* Z-score of >1.96,
and spatial scan statistic RR >1.0 and p-value <0.05. Statistical significance for cold
spots was defined as DAs with a Gi* Z-score <-1.96, and a spatial scan statistic RR <1.0
and p-value <0.05. 999 Monte Carlo simulations were used for the spatial scan statistic.
Proportions of stroke patients with known risk factors for stroke were calculated for each
DA and comparisons made (1) within and external to the cluster boundary, and (2)
between hot and cold clusters.
Getis-Ord Gi* Statistic. Distance band was selected as the method for
conceptualization of spatial relationships because of the large variation in DA area (ESRI
– Conceptualization of Spatial Relationships, 2013). A spatial weights matrix file was
36
created using (i) a fixed distance band calculation, based on DAs with an area <2.58 SD
(Figure 1), that reflected maximum spatial autocorrelation as indicated by the peak Z-
score (ESRI – Selecting a Fixed Distance Band Value, 2013), and (ii) a minimum number
of 8 neighbors to ensure a reliable Z-score (ESRI – Hot Spot Analysis, 2013). To verify
findings, Getis-Ord Gi* analyses were conducted based on two differing
conceptualizations. First, a fixed distance band calculated to include all DAs and 8
neighbours was used. Cluster patterns for high and low values were similar for all stroke
types and mortality. Second, a K-nearest neighbors conceptualization was used with a
minimum number of neighbours set at 15. Cluster patterns for high values were similar
for stroke types and mortality although clusters of low values were only starting to
emerge.
Spatial Scan Statistic. A purely spatial, discrete Poisson model was used for the
analysis. Areas were scanned simultaneously for statistically significant high and low
rates. The circular scanning window was set to a maximum size of 40% (the default is
50%) of the population at risk based on the population of the largest DA (Walsh &
DeChello, 2001) and a size considered sufficiently large to ensure that small and large
clusters could be included (Kulldorff, 2013).
4.4 Results
4.4.1 Study Population
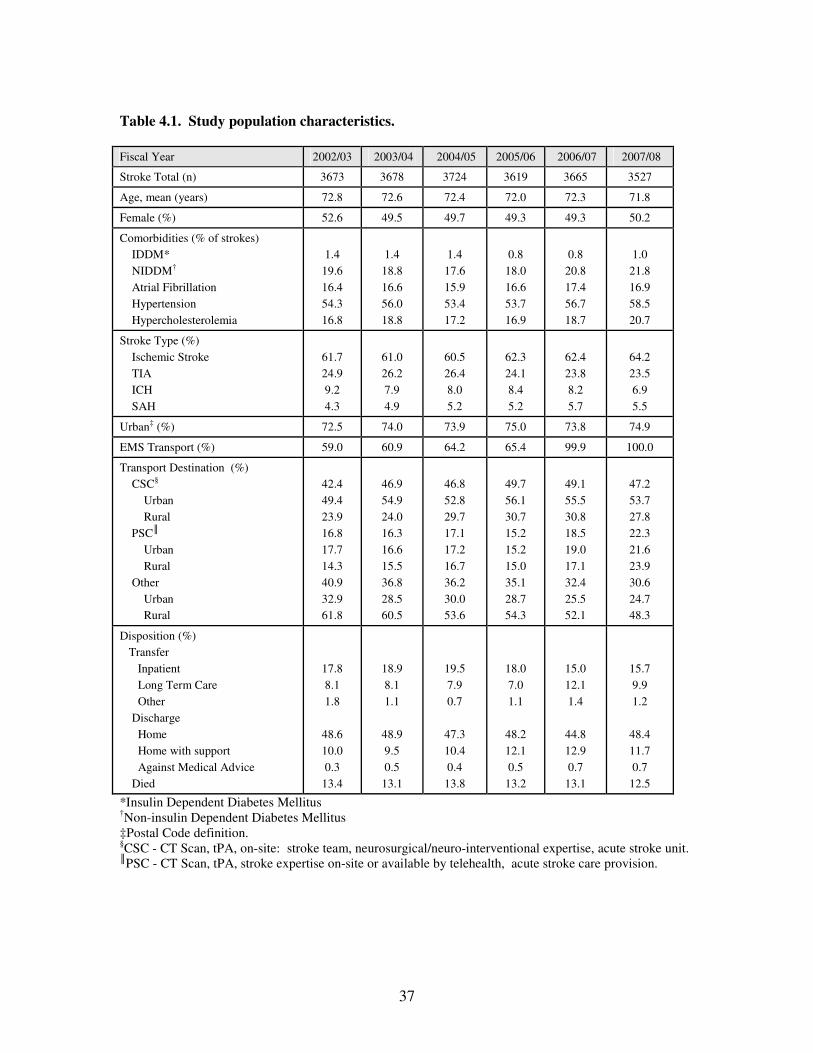
Characteristics of the study population by fiscal year are presented in Table 4.1.
Ischemic stroke and TIA accounted for 86.8% of all strokes. Stroke types were evenly
divided amongst men and women except for SAH which occurred more often in women
37
Table 4.1. Study population characteristics.
Fiscal Year 2002/03 2003/04 2004/05 2005/06 2006/07 2007/08
Stroke Total (n) 3673 3678 3724 3619 3665 3527
Age, mean (years) 72.8 72.6 72.4 72.0 72.3 71.8
Female (%) 52.6 49.5 49.7 49.3 49.3 50.2
Comorbidities (% of strokes)
IDDM*
NIDDM†
Atrial Fibrillation
Hypertension
Hypercholesterolemia
1.4
19.6
16.4
54.3
16.8
1.4
18.8
16.6
56.0
18.8
1.4
17.6
15.9
53.4
17.2
0.8
18.0
16.6
53.7
16.9
0.8
20.8
17.4
56.7
18.7
1.0
21.8
16.9
58.5
20.7
Stroke Type (%)
Ischemic Stroke
TIA
ICH
SAH
61.7
24.9
9.2
4.3
61.0
26.2
7.9
4.9
60.5
26.4
8.0
5.2
62.3
24.1
8.4
5.2
62.4
23.8
8.2
5.7
64.2
23.5
6.9
5.5
Urban‡ (%) 72.5 74.0 73.9 75.0 73.8 74.9
EMS Transport (%) 59.0 60.9 64.2 65.4 99.9 100.0
Transport Destination (%)
CSC§
Urban
Rural
PSC║
Urban
Rural
Other
Urban
Rural
42.4
49.4
23.9
16.8
17.7
14.3
40.9
32.9
61.8
46.9
54.9
24.0
16.3
16.6
15.5
36.8
28.5
60.5
46.8
52.8
29.7
17.1
17.2
16.7
36.2
30.0
53.6
49.7
56.1
30.7
15.2
15.2
15.0
35.1
28.7
54.3
49.1
55.5
30.8
18.5
19.0
17.1
32.4
25.5
52.1
47.2
53.7
27.8
22.3
21.6
23.9
30.6
24.7
48.3
Disposition (%)
Transfer
Inpatient
Long Term Care
Other
Discharge
Home
Home with support
Against Medical Advice
Died
17.8
8.1
1.8
48.6
10.0
0.3
13.4
18.9
8.1
1.1
48.9
9.5
0.5
13.1
19.5
7.9
0.7
47.3
10.4
0.4
13.8
18.0
7.0
1.1
48.2
12.1
0.5
13.2
15.0
12.1
1.4
44.8
12.9
0.7
13.1
15.7
9.9
1.2
48.4
11.7
0.7
12.5
*Insulin Dependent Diabetes Mellitus †Non-insulin Dependent Diabetes Mellitus ‡Postal Code definition. §CSC - CT Scan, tPA, on-site: stroke team, neurosurgical/neuro-interventional expertise, acute stroke unit. ║PSC - CT Scan, tPA, stroke expertise on-site or available by telehealth, acute stroke care provision.
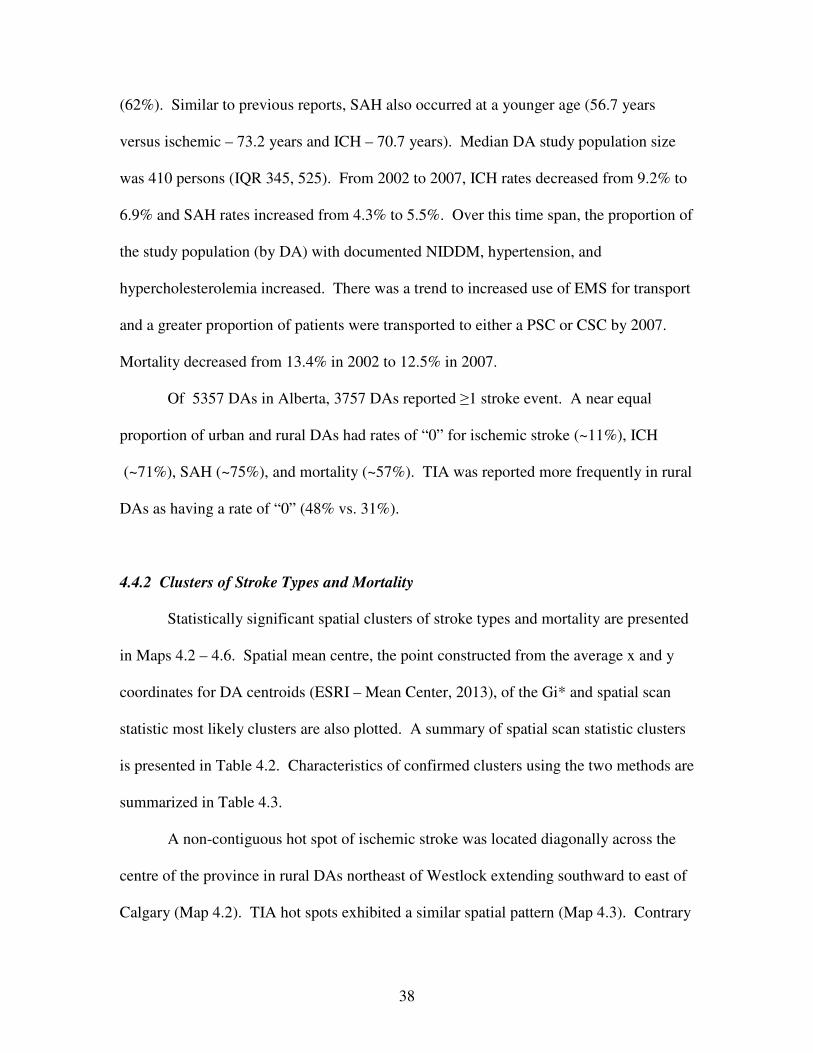
38
(62%). Similar to previous reports, SAH also occurred at a younger age (56.7 years
versus ischemic – 73.2 years and ICH – 70.7 years). Median DA study population size
was 410 persons (IQR 345, 525). From 2002 to 2007, ICH rates decreased from 9.2% to
6.9% and SAH rates increased from 4.3% to 5.5%. Over this time span, the proportion of
the study population (by DA) with documented NIDDM, hypertension, and
hypercholesterolemia increased. There was a trend to increased use of EMS for transport
and a greater proportion of patients were transported to either a PSC or CSC by 2007.
Mortality decreased from 13.4% in 2002 to 12.5% in 2007.
Of 5357 DAs in Alberta, 3757 DAs reported ≥1 stroke event. A near equal
proportion of urban and rural DAs had rates of “0” for ischemic stroke (~11%), ICH
(~71%), SAH (~75%), and mortality (~57%). TIA was reported more frequently in rural
DAs as having a rate of “0” (48% vs. 31%).
4.4.2 Clusters of Stroke Types and Mortality
Statistically significant spatial clusters of stroke types and mortality are presented
in Maps 4.2 – 4.6. Spatial mean centre, the point constructed from the average x and y
coordinates for DA centroids (ESRI – Mean Center, 2013), of the Gi* and spatial scan
statistic most likely clusters are also plotted. A summary of spatial scan statistic clusters
is presented in Table 4.2. Characteristics of confirmed clusters using the two methods are
summarized in Table 4.3.
A non-contiguous hot spot of ischemic stroke was located diagonally across the
centre of the province in rural DAs northeast of Westlock extending southward to east of
Calgary (Map 4.2). TIA hot spots exhibited a similar spatial pattern (Map 4.3). Contrary

39
to what would be expected from epidemiological data, ischemic stroke and TIA hot spots
had DAs with lower proportions of stroke patients with documented risk factors of atrial
fibrillation, hypertension, and hypercholesterolemia (Table 4.4). DAs within ischemic
stroke and TIA cold spots had the highest levels of documented stroke risk factors.
ICH and SAH hot spots were identified in the northernmost of the two major urban
centres (Map 4.4 and Map 4.5). DAs within the ICH and SAH hot spots had a higher
proportion of strokes with documented atrial fibrillation, hypertension, and
hypercholesterolemia as compared with DAs outside cluster boundaries (Table 4.4). ICH
and SAH were the two stroke subtypes with a higher proportion of hypertension within
the hot spot boundaries.
A non-contiguous mortality hot spot was identified in east central Alberta, in a
similar geographic distribution to the hot spot for ischemic stroke (Map 4.6).
Characteristics of DAs in mortality clusters are shown in Table 4.5. DAs within the
mortality hot spot had lower proportions of stroke patients with documented diabetes
mellitus (DM), atrial fibrillation, hypertension, and hypercholesterolemia compared with
DAs external to the cluster boundary and within the mortality cold spot. Within the
mortality hot spot, CSC was less often the transport destination for all stroke types (Table
4.6).
4.4.3 Clusters of Risk
A cluster analysis of risk factors identified hot spots in the two large urban centres
with CSCs (Calgary – RR 2.59, p <0.001 and Edmonton – RR 2.43, p <0.001) and one of
the urban PSCs (Medicine Hat - p <0.05) (Map 4.7). There was an inverse relationship

40
Map 4.2 Hot and cold clusters of Ischemic Stroke identified using the Getis-Ord Gi* and Spatial Scan statistics.

41
Map 4.3. Hot and cold clusters of Transient Ischemic Attack identified using the Getis-Ord Gi* and Spatial Scan statistics.
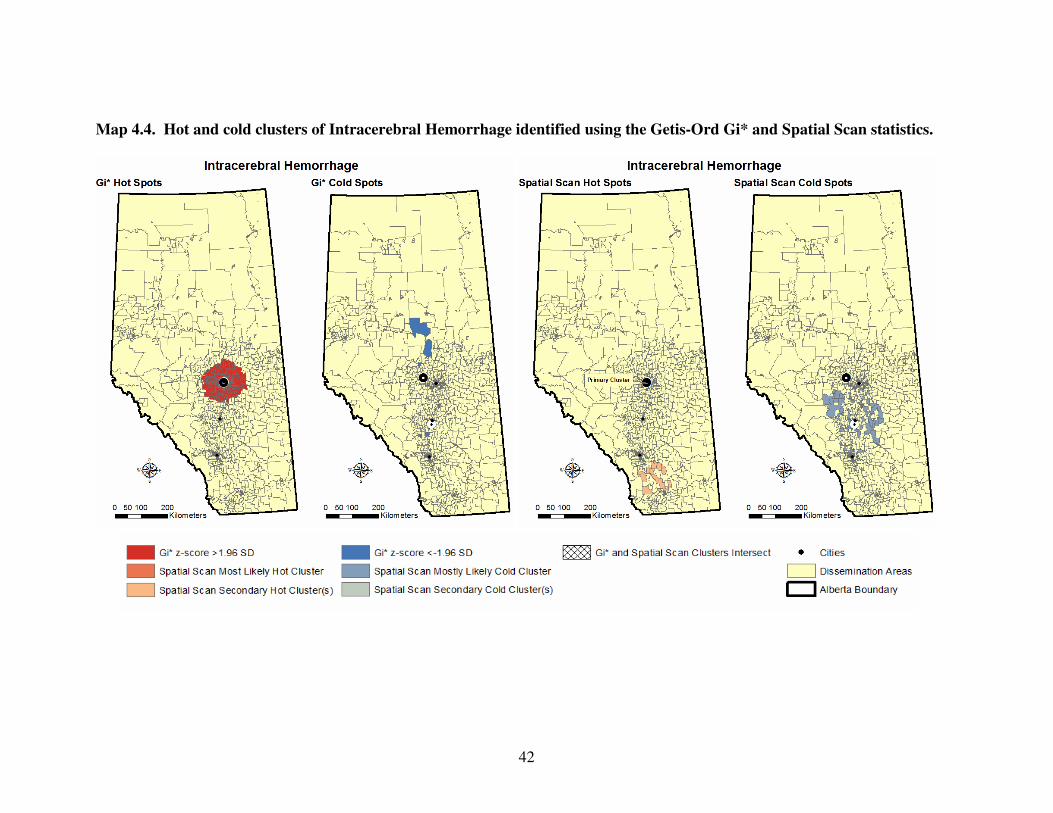
42
Map 4.4. Hot and cold clusters of Intracerebral Hemorrhage identified using the Getis-Ord Gi* and Spatial Scan statistics.

43
Map 4.5 Hot and cold clusters of Subarachnoid Hemorrhage identified using the Getis-Ord Gi* and Spatial Scan statistics.
44
Map 4.6. Hot and cold clusters of in-hospital mortality identified using the Getis-Ord Gi* and Spatial Scan statistics.
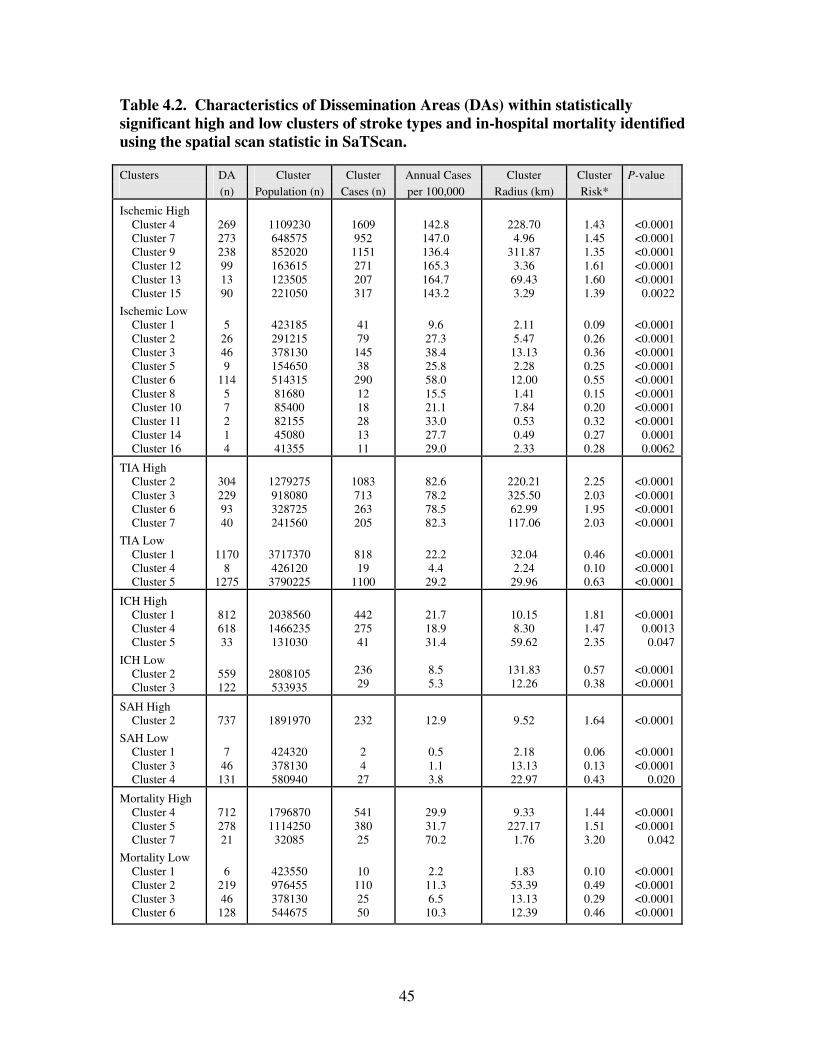
45
Table 4.2. Characteristics of Dissemination Areas (DAs) within statistically
significant high and low clusters of stroke types and in-hospital mortality identified
using the spatial scan statistic in SaTScan.
Clusters DA Cluster Cluster Annual Cases Cluster Cluster P-value
(n) Population (n) Cases (n) per 100,000 Radius (km) Risk*
Ischemic High Cluster 4 Cluster 7 Cluster 9 Cluster 12 Cluster 13 Cluster 15
Ischemic Low Cluster 1 Cluster 2 Cluster 3 Cluster 5 Cluster 6 Cluster 8 Cluster 10 Cluster 11 Cluster 14 Cluster 16
269 273 238 99 13 90
5
26 46 9
114 5 7 2 1 4
1109230 648575 852020 163615 123505 221050
423185 291215 378130 154650 514315 81680 85400 82155 45080 41355
1609 952 1151 271 207 317
41 79
145 38
290 12 18 28 13 11
142.8 147.0 136.4 165.3 164.7 143.2
9.6
27.3 38.4 25.8 58.0 15.5 21.1 33.0 27.7 29.0
228.70
4.96 311.87
3.36 69.43 3.29
2.11 5.47
13.13 2.28
12.00 1.41 7.84 0.53 0.49 2.33
1.43 1.45 1.35 1.61 1.60 1.39
0.09 0.26 0.36 0.25 0.55 0.15 0.20 0.32 0.27 0.28
<0.0001 <0.0001 <0.0001 <0.0001 <0.0001
0.0022
<0.0001 <0.0001 <0.0001 <0.0001 <0.0001 <0.0001 <0.0001 <0.0001
0.0001 0.0062
TIA High Cluster 2 Cluster 3 Cluster 6 Cluster 7
TIA Low Cluster 1 Cluster 4 Cluster 5
304 229 93 40
1170
8 1275
1279275 918080 328725 241560
3717370 426120
3790225
1083 713 263 205
818 19
1100
82.6 78.2 78.5 82.3
22.2 4.4
29.2
220.21 325.50 62.99
117.06
32.04 2.24
29.96
2.25 2.03 1.95 2.03
0.46 0.10 0.63
<0.0001 <0.0001 <0.0001 <0.0001
<0.0001 <0.0001 <0.0001
ICH High Cluster 1 Cluster 4 Cluster 5
ICH Low Cluster 2 Cluster 3
812 618 33
559 122
2038560 1466235 131030
2808105 533935
442 275 41
236 29
21.7 18.9 31.4
8.5 5.3
10.15 8.30
59.62
131.83 12.26
1.81 1.47 2.35
0.57 0.38
<0.0001
0.0013 0.047
<0.0001 <0.0001
SAH High Cluster 2
SAH Low Cluster 1 Cluster 3 Cluster 4
737
7
46 131
1891970
424320 378130 580940
232
2 4
27
12.9
0.5 1.1 3.8
9.52
2.18
13.13 22.97
1.64
0.06 0.13 0.43
<0.0001
<0.0001 <0.0001
0.020
Mortality High Cluster 4
Cluster 5
Cluster 7
Mortality Low
Cluster 1
Cluster 2
Cluster 3
Cluster 6
712 278 21
6
219 46
128
1796870 1114250 32085
423550 976455 378130 544675
541 380 25
10
110 25 50
29.9 31.7 70.2
2.2
11.3 6.5
10.3
9.33
227.17 1.76
1.83
53.39 13.13 12.39
1.44 1.51 3.20
0.10 0.49 0.29 0.46
<0.0001 <0.0001
0.042
<0.0001 <0.0001 <0.0001 <0.0001

46
Table 4.3. Characteristics of Getis-Ord Gi* and spatial scan statistic cluster
intersects.
Cluster DA Distance* Urban CSC PSC Other Primary Location Intersect (n) (km) (%) (Mean %) (Mean %) (Mean %)
Ischemic Stroke
High 64 59.2 39.1 20.4 24.6 5 Non-contiguous band extending NE of Westlock to E of Calgary
Low 127 96.4 97.6 80.7 1.7 17.6 NW & S Calgary
Transient Ischemic Attack
High 287 85.1 63.1 22.7 29.2 48.1 Non-contiguous band extending from NE of Westlock S to Red Deer & Drumheller; Peace River region
Low 2445 143.1 98.4 70.0 4.9 25.1 Edmonton & Calgary & surrounding areas
Intracerebral Hemorrhage
High 813 3.4 98.4 58.7 8.9 32.4 Edmonton (excluding sections E/NE)
Low 0 - - - - - -
Subarachnoid Hemorrhage
High 369 9.7 99.2 30.6 15.0 18.7 Edmonton (excluding regions in NW & E/SE)
Low 88 135.0 97.7 75.0 1.7 23.3 S of Calgary
In-Hospital Mortality
High 108 92.0 53.7 27.4 22.4 54.3 Non-contiguous band from Cold Lake to SE of Red Deer
Low 329 133.9 95.7 83.2 1.4 15.5 N & S Calgary; Okotoks
*Spatial mean distance: Euclidean or straight-line distance between Gi* and spatial scan most-likely cluster spatial mean centres.

47
Table 4.4. High and low clusters of stroke types and in-hospital mortality and
proportion with risk factor(s).
Cluster Intersect (Gi* and SS) High Low
% of Strokes by DA* With Risk Factor(s) (SD) Cluster Not Cluster Cluster Not Cluster
Ischemic Stroke
IDDM†
NIDDM‡
Atrial Fibrillation
Hypertension
Hypercholesterolemia
3.8 (13.8)
17.7 (20.9)
10.4 (15.6)
46.6 (29.2)
12.7 (7.9)
1.1 (7.2)
19.7 (25.7)
15.8 (23.5)
57.5 (32.3)
21.3 (27.0)
1.9 (10.8)
15.9 (26.5)
12.6 (19.1)
67.1 (31.9)
21.4 (28.5)
1.1 (7.2)
19.8 (25.5)
15.9 (23.5)
56.9 (32.3)
21.1 (26.9)
Transient Ischemic Attack
IDDM
NIDDM
Atrial Fibrillation
Hypertension
Hypercholesterolemia
2.7 (13.5)
15.5 (20.7)
10.4 (17.3)
45.1 (29.9)
13.6 (21.9)
1.0 (6.6)
20.0 (25.9)
16.2 (23.8)
58.3 (32.3)
21.8 (27.2)
1.0 (6.6)
20.2 (26.7)
17.2 (24.8)
60.7 (32.9)
24.5 (28.4)
1.5 (8.6)
18.7 (23.3)
13.1 (20.3)
50.9 (30.3)
14.9 (22.5)
Intracerebral Hemorrhage
IDDM
NIDDM
Atrial Fibrillation
Hypertension
Hypercholesterolemia
1.1 (7.4)
21.2 (26.2)
18.8 (25.1)
60.0 (32.4)
30.3 (29.1)
1.2 (7.4)
19.2 (25.4)
14.9 (22.8)
56.5 (32.2)
18.6 (25.7)
-
-
-
-
-
-
-
-
-
-
Subarachnoid Hemorrhage
IDDM
NIDDM
Atrial Fibrillation
Hypertension
Hypercholesterolemia
1.2 (8.5)
19.4 (24.9)
17.6 (23.5)
57.8 (33.1)
29.2 (28.7)
1.2 (7.2)
19.7 (25.7)
15.6 (23.4)
57.2 (32.2)
20.3 (26.6)
1.0 (5.8)
16.0 (27.9)
13.3 (21.8)
65.7 (34.7)
19.9 (28.4)
1.2 (7.4)
19.7 (25.5)
15.8 (23.4)
57.1 (32.2)
21.1 (26.9)
In-hospital Mortality
IDDM
NIDDM
Atrial Fibrillation
Hypertension
Hypercholesterolemia
1.3 (5.7)
15.0 (19.5)
9.8 (14.7)
41.8 (26.7)
14.6 (21.8)
1.2 (7.4)
19.8 (25.7)
15.9 (23.6)
57.7 (32.4)
21.3 (27.0)
1.2 (7.7)
15.9 (25.8)
17.1 (26.2)
62.7 (35.0)
18.4 (27.5)
1.2 (7.3)
20.0 (25.5)
15.6 (23.1)
56.8 (32.0)
21.4 (26.9)
*Dissemination Area (n=3757) †Insulin Dependent Diabetes Mellitus ‡Non-insulin Dependent Diabetes Mellitus

48
Table 4.5. Characteristics of high and low clusters of in-hospital mortality.
In-hospital Mortality High Low
Statistic Gi* Spatial Scan Gi* Spatial Scan
Cluster Number 4 5 7 1 2 3 6
Gi* Z-score >1.96 <-1.96
Cluster Risk 1.438 1.507 3.205 0.070 0.494 0.291 0.456
P-value <0.05 <0.001 <0.001 0.042 <0.05 <0.001 <0.001 <0.001 <0.001
Age, mean (years) 74.1 71.9 74.8 76.5 71.3 72.1 71.4 71.6 70.2
Female (%) 49.0 48.5 49.4 57.0 49.5 40.6 59.5 53.2 47.4
Comorbidity (%)
IDDM* 1.7 0.9 1.3 0 1.0 2.9 1.2 1.1 1.0
NIDDM† 15.9 21.7 16.4 28.4 19.5 18.8 15.2 16.5 17.8
Atrial Fibrillation 12.8 20.9 12.7 29.6 18.7 15.9 19.8 26.1 18.0
Hypertension 44.5 61.8 46.0 59.3 62.6 42.0 59.8 65.4 62.0
Hypercholesterolemia 12.6 28.8 12.8 16.1 18.6 17.4 16.9 28.2 18.0
Stroke Type
Ischemic 58.8 67.4 57.8 64.2 63.5 60.9 61.4 77.1 65.4
TIA 31.0 14.5 33.1 19.8 21.9 27.5 25.1 11.7 23.0
ICH 6.0 11.7 5.5 11.1 9.2 8.7 8.1 9.0 6.0
SAH 4.2 6.4 3.7 4.9 5.4 2.9 5.4 2.1 5.6
EMS Transport (%) 70.7 78.6 70.1 76.5 40.4 79.7 75.5 77.7 81.6
Destination
CSC‡ 20.2 56.9 25.3 12.3 76.5 10.1 76.9 68.1 69.4
PSC§ 31.9 7.7 20.9 84.0 2.1 87.0 1.2 11.7 1.4
Other 47.9 35.4 53.8 3.7 21.4 2.9 21.3 20.2 29.2
*Insulin Dependent Diabetes Mellitus †Non-insulin Dependent Diabetes Mellitus ‡CSC - CT Scan, tPA, stroke team, neurosurgical/neuro-interventional expertise, acute stroke unit.. §PSC - CT Scan, tPA, stroke expertise on-site or available by telehealth, acute stroke care provision.
Table 4.6. In-hospital mortality hot spot and transport destination, by stroke type.
Higher proportions of stroke events outside the in-hospital mortality hot spot were
transported to a CSC and fewer events were transported to ‘Other’ healthcare
facility.
In-hospital Mortality Events Within Hot Spot Events Outside Hot Spot
Destination (%) CSC PSC Other Total CSC PSC Other Total
Ischemic 26.3 16.3 57.4 59.7 48.7 18.3 33.0 62.1
TIA 9.6 14.3 76.1 31.3 35.8 20.7 43.5 24.4
ICH 35.9 14.1 50.0 5.3 62.5 13.8 23.7 8.3
SAH 71.1 4.4 24.5 3.7 80.8 4.4 14.8 5.2

49
Map 4.7. Cluster analysis of the proportion of stroke patients with ≥ 1 reported risk factor(s) by DA.

50
between risk factor hot spots and hot spots for ischemic stroke, TIA and stroke mortality
(Table 4.4).
4.5 Discussion
4.5.1 Principal Findings
Significant hot and cold spots of stroke types and mortality were identified and
located (Maps 4.2 - 4.6). There was overlap of clusters across statistical methods and, in
relation to the geographical expanse of the province, spatial mean centres of high clusters
calculated for each statistic were not far apart in distance (Table 4.3). Only slight
variation in Gi* clusters was found when using different conceptualizations of spatial
relationships.
4.5.2 Ischemic Stroke and Transient Ischemic Attack
DAs within ischemic stroke and TIA hot spots had lower proportions of stroke
patients with documented DM, atrial fibrillation, hypertension, and hypercholesterolemia
compared with DAs outside of the hot spot and DAs within cold spots (excluding DM)
(Table 4.4). This is contrary to the established link between stroke risk factors and stroke
occurrence (Lackland et al., 2014). The most likely explanation is a lower incidence of
recognition and reporting of stroke risk factors in these clusters with high rates of
ischemic stroke and TIA. Furthermore, the high rates of reported stroke risk factors in
cold spots for ischemic stroke and TIA suggests a strong and potentially causal link
between recognition/documentation of stroke risk factors and occurrence of ischemic
stroke and TIA. These findings serve to emphasize the importance of primary prevention.
51
Clusters with lower proportions of documented risk factors may be indicative of
populations with decreased access to primary care and/or that are less amenable to
seeking and receiving preventive care. Forty percent of TIAs have MRI evidence of
infarction (Kidwell et al., 1999). Differences in access to MRI and extent of
investigation as well as urban-rural differences in the coding accuracy of TIA versus
ischemic stroke (Kokotailo & Hill, 2005) may partially explain the urban bias for TIA
cold spots located in Edmonton and Calgary.
4.5.3 Intracerebral Hemorrhage and Subarachnoid Hemorrhage
ICH and SAH hot spots had DA populations with higher proportions of
documented hypercholesterolemia and hypertension compared to DAs outside of cluster
boundaries (Table 4.4). Under diagnosis or under treatment of hypertension may be an
important factor in addition to other risk factors. The SAH hot spot had a lower
proportion of DAs with documented hypertension than did the SAH cold spot which is
consistent with the fact that hypertension is less important as a risk factor for SAH
compared to ICH. Data relating to incidence of smoking, a major risk factor for SAH,
were not available.
4.5.4 In-hospital Mortality
DAs within the mortality hot spot had lower proportions of documented NIDDM,
atrial fibrillation, hypertension, and hypercholesterolemia (Table 4.4) and higher
occurrence of ischemic stroke and TIA. This finding raises questions regarding access to
and efficacy of prevention programs and in-hospital stroke care in this region. Transport

52
destination may have contributed to this finding as mortality hot spots had lower
proportions of patients transported to a CSC and cold spots had a higher proportion of
transports to a CSC (Table 4.6). Time from symptom onset to recanalization (NINDS
and Stroke r-tPA Stroke Study Group, 1995; Hacke et al., 2008; Mazighi et al., 2009))
and specialized stroke care (Stroke Unit Trialists’ Collaboration, 1997) are crucial factors
in morbidity and mortality after stroke. Prolonged transport times, suboptimal transport
destination (Schwamm et al., 2005; Prabhakaran, 2011), quality of care issues (i.e.
percentage receiving tPA), or other unmeasured differences in stroke systems of care
could account for mortality hot spots. Stroke severity, an important risk factor for
mortality after stroke, could not be assessed due to a lack of clinical data.
4.5.5 Risk Factors
Hot spots of risk factors were identified and located using cluster analysis in
Calgary, Edmonton, and Medicine Hat (Map 4.7). These cities have well established
stroke prevention programs in place. This supports findings stemming from the cluster
analyses of stroke types and mortality suggesting that identification and reporting of risk
factors is positively associated with significantly lower stroke occurrence and mortality.
Risk factors appeared to be less important in the spatial distribution of ICH and SAH.
4.6 Study Implications
This study highlights the power of using GIS to understand regional variability in
stroke occurrence, risk factors and outcomes. These types of analyses can be particularly
53
useful in identifying gaps in service, in planning and evaluation of health systems and
health care delivery, and in (re)allocation of resources (Wennberg & Gittelsohn, 1973).
Strengths of this research study include that spatial analyses were performed by
stroke type and that clusters were confirmed using two statistical methods. A broad
regional analysis was conducted but the geographic unit of analysis was sufficiently small
to permit a more refined delineation of cluster boundaries and a later, more detailed
examination of explanatory variables including local population characteristics and
geography using linked census data and shape files. A polygon analysis removed spatial
autocorrelation of events between DAs due to underlying population density. The small
numbers problem resulted in greater variation of rates in DAs with smaller populations
but this was mitigated, in areas of overlap, by the use of the spatial scan statistic (Tables
4.1 and 4.2). Findings were validated in that ischemic stroke and TIA had similar
geographical distributions and that risk factor hot spots were located in regions with well
established stroke prevention programs and acute care health service provision in place.
4.7 Study Limitations
Potential limitations of this study include those associated with the use of
administrative data: (1) lack of clinical detail, (2) regional differences with ICD-10
coding of stroke type, (3) regional differences in documentation of risk factors, (4)
inaccurate documentation of postal code, and (5) errors associated with the collection of
Statistics Canada census data including under or over coverage of specific populations
(Statistics Canada – Population Coverage Error, 2013). An important potential limitation
in our study was that the postal code documented on the clinical health record may not
54
accurately represent location of residence or stroke or risk exposure. Residential mobility
was not taken into account. Limitations associated with the spatial data analysis include:
(1) position error, (2) DAs limited capacity to reveal what is happening in rural areas
(greater heterogeneity in larger DAs; greater number of PCs per DA in rural areas), (3)
Modifiable Area Unit Problem (rates change with a change in the geographic unit of
analysis) (Openshaw, 1983), (4) small numbers problem (greater variability in rate
estimates with smaller geographic unit of analysis), and (5) ecological and atomistic
fallacy. It remains a useful but high level tool for evaluation of disease incidence and
outcomes.
4.8 Conclusion
Using whole population administrative data for a large geographic region of
Canada integrated with GIS, significant regional variations in ischemic stroke, TIA, ICH,
SAH and in-hospital mortality were found. Risk factor hot spots were identified in
regions with significantly low ischemic, TIA, and in-hospital mortality rates. ICH and
SAH did not have this same inverse association. Spatial regression and other tools in GIS
may be used in future research to examine whether regional variations in incidence and
outcomes identified in this study reflect disparities in access to and/or the provision of
best practice primary and secondary preventive stroke care and care for acute stroke.
Future research might include a more localized investigation of the mortality hot
spot that incorporates additional novel predictors (e.g. ethnicity, economic,
environmental, and preventive, pre-hospital and in-hospital service provision). Future
research might also entail conducting a cluster of analysis of smoothed age-standardized

55
annual stroke (by type), recurrent stroke, and mortality rates to permit an examination of
spatial migration of clusters over time and associations with enhancements to pre-hospital
and SC care. Findings may inform public health policy and health service provision.

56
Study II. Multivariable Regression Analysis of Stroke and In-hospital Mortality
Hot Spots and Cold Spots in Alberta, Canada.

57
Chapter 5: Study II. Multivariable Regression Analysis of Stroke and In-hospital
Mortality Hot Spots and Cold Spots in Alberta, Canada.
5.1 Background
Stroke is the potentially devastating result of a sudden interruption of blood flow
to the brain (CIHI, 2006) and is a leading cause of acquired disability (Davis & Donnan,
2012) and death worldwide (van der Worp & van Gijn, 2007). Overall 30-day in-hospital
mortality following admission with a new stroke in Canada is approximately 19% and
has remained stable since 1999-2000 (CIHI, 2006). There are four stroke types, each
differing with respect to causal mechanisms, severity, treatment, and outcomes. Eighty-
seven percent of strokes are caused by ischemia due to arterial occlusion and 13% are
caused by hemorrhage (CDC – Stroke Facts, 2014).
5.1.1 Stroke Types
5.1.1.1 Ischemic Stroke
Ischemic stroke occurs when there is occlusion of a blood vessel by a
thromboembolism resulting in brain tissue injury and death. Definitive treatment for
acute ischemic stroke (AIS) is the administration of IV thrombolysis or tPA within 3-
hours of onset of symptoms (NINDS and Stroke r-tPA Stroke Study Group, 1995) and
longer (up to 4.5-hours) in selected circumstances (Hacke et al, 2008). The symptom
onset-to-treatment (OTT) time with IV-tPA is strongly associated with outcome, with a
doubling of the odds of good outcome when administered under 1.5-hours after onset
versus 1.5 to 3.0-hours after onset (Marler et al., 2000; Hacke et al., 2008). Thirty-day
58
stroke mortality ranges from 2% in patients with lacunar infarct to 78% in patients with
large hemispheric lesions (van der Worp & van Gijn, 2007).
5.1.1.2 Transient Ischemic Attack
Transient Ischemic Attack (TIA) is a brief episode of focal ischemia with
symptoms similar to ischemic stroke but typically lasting less than one hour and without
evidence of acute infarction on imaging (Magnetic Resonance Imaging or MRI) (Albers
et al., 2002). Because clinical symptoms resolve, a TIA diagnosis may be missed in
persons who do not seek medical attention. If medical attention is sought, accuracy of
the diagnosis depends on the clinical experience, skills, and judgment of the evaluating
physician (Albers et al., 2002). Milder strokes that were once diagnosed as TIA are now
diagnosed as ischemic stroke as a result of diagnostically competent physicians and more
sensitive brain imaging (Warlow et al., 2001). After a first TIA, 10% to 20% of patients
have an ischemic stroke within the next 90 days, and in 50% of these patients, the stroke
occurs in the first 24 to 48-hours after the TIA (Albers et al., 2002). TIA offers a
valuable opportunity to initiate early and aggressive risk factor management to prevent
ischemic stroke and therefore time to expert diagnosis and treatment is important to good
outcome (Davis & Donnan, 2012).
5.1.1.3 Intracerebral Hemorrhage
Intracerebral Hemorrhage (ICH) is bleeding into the parenchyma of the brain
(Qureshi et al., 2001). ICH accounts for 10% to 15% of all strokes and is associated with
the highest mortality rate with only 38% of patients surviving the first year (Qureshi et
59
al., 2001). Primary ICH accounts for 78% to 88% of ICH and originates from the
spontaneous rupture of small blood vessels damaged by chronic hypertension or amyloid
angiopathy (Qureshi et al., 2001). Treatment may include blood pressure management,
intraventricular administration of thrombolytic agents, and surgical evacuation (Qureshi
et al., 2001). Treatment is also time sensitive.
5.1.1.4 Subarachnoid Hemorrhage
Subarachnoid Hemorrhage (SAH) accounts for 2% to 5% of all new strokes
(Suarez et al., 2006). The leading cause of non-traumatic SAH is rupture of an
intracranial aneurysm (80% of cases) leading to the extravasation of blood into the
subarachnoid space (Suarez et al., 2006). Hypertension and smoking increase the risk of
SAH. SAH has a 30-day mortality rate of 45% (Brisman et al., 2006) and case-fatality
rate of 51% (Suarez et al., 2006). An estimated 30% (Brisman et al., 2006) to 46%
(Suarez et al., 2006) of survivors will have moderate-to-severe disability. Treatment for
intracranial aneurysm includes observation, craniotomy with clipping of the aneurysm,
and endovascular coil-occlusion of the aneurysm (Brisman et al., 2006). Similar to other
stroke types, treatment is time sensitive.
5.1.1.5 Recurrent Stroke
Risk of recurrent stroke is dependent upon stroke type, age, adherence to
secondary prevention risk factor management, and lifestyle change. Risk of recurrent
stroke is also affected by differences in geography, race and ethnicity, socioeconomic
status, and type of care (Lackland et al., 2014). The 30-day case fatality rate is almost

60
double for recurrent stroke compared with index stroke, and age plays a significant role
(Lackland et al., 2014).
5.1.2 Individual Predictors of Stroke and Stroke Mortality
The risk of stroke doubles with each decade increase in age (Mohr et al., 2004)
and the risk of dying is two times higher for those aged 65 to 74 years and four times
higher for those aged ≥75 years as compared to those <50 years (CIHI, 2006).
Hypertension is the most important modifiable risk factor for both primary and secondary
stroke (Davis & Donnan 2012; Lackland et al., 2014). Diabetes mellitus, atrial
fibrillation, and dyslipidemia are strong risk factors for stroke and stroke mortality.
Success of risk factor management varies according to multiple socioeconomic and
geographic factors (Albers et al., 2002; Davis & Donnan, 2012; Qureshi et al., 2001;
Suarez et al., 2006; Lackland et al., 2014; van der Worp & van Gijn, 2007; Abbott,
Donahue, MacMahon, Reed & Yano, 1987; Kneeland & Fang; 2014).
5.1.3 Geographic Predictors of Stroke and Stroke Mortality
5.1.3.1 Sociodemographic Dissemination Area Level Characteristics
Socioeconomic status, minority status, and less than high school education are
predictors associated with stroke and mortality. Non or limited proficiency in the English
language may diminish the effectiveness of public awareness campaigns, understanding
of the importance of risk reduction strategies including compliance with medication
regimes and maintenance of therapeutic levels (Rodriquez et al., 2013), awareness to dial

61
9-1-1 for onset of stroke symptoms, and may result in delays in clinical assessment and
treatment for stroke in the acute setting.
There is evidence at an international level that education is linked to health and to
determinants of health including health behaviours, risky health behaviours, and use of
preventive health services, and that the effects of education on health are at least as great
as the effect of income (Han et al., 2005; Feinstein, Sabates, Anderson, Sorhaindo, &
Hammond, 2006). Explanations for this link include differential use of tobacco and
alcohol, receipt of primary and preventive care, referral to a specialist (Feinstein et al.,
2006), and access to inpatient rehabilitation services after stroke (Ado et al., 2012).
Workers in manual positions have been found to have higher rates of mortality after
stroke than non-manual workers, with differences decreasing with age (Martinez,
Pampalon, & Hamel, 2003).
Stroke has a disproportionate effect on minority and underserved populations and
this has been identified as a critical health disparities issue (NINDS, 2002). Disparities
may be related to genetic predisposition, racial and ethnic variations in lifestyle, access to
healthcare including proclivity to seek care, the quality of healthcare received,
differences in health beliefs, religiosity, health literacy, adherence to prescribed therapy,
stress, and exposure to environmental toxins (NINDS, 2002). Studies of migrants have
shown the tendency to acquire the risk of the country they migrate to, rather than
retaining the risk of the country that they came from (Ebrahim & Harwood, 1999)
emphasizing the importance of neighbourhood and community to health.
Poverty has been linked to increased stroke risk (Howard & Feigin, 2008) and to
more severe deficits after stroke (Ado et al., 2012). Socioeconomic status has been
62
associated with inequalities in the delivery of care across the stroke pathway, within
countries with universal health care (Ado et al., 2012). Han et al. (2005) found that the
relationship between cerebrovascular disease and median ZIP code level income was
non-linear, with both low and high observed disease rate areas associated with higher
income. Because mortality (versus morbidity) data were used in their analysis, it was
thought that residents in higher income areas survive longer with cerebrovascular disease
than those in lower income areas and that deaths are not as prevalent (making disease
rates higher). In Canada, for every $10,000 increase in median neighbourhood income,
the risk of death at 30-days after stroke dropped by 9% (CIHI, 2006). People with lower
incomes, or from lower-income neighbourhoods, are less likely to be admitted to a high
volume hospital following a stroke or be treated by a physician specializing in stroke care
(CIHI, 2006), have less access to specialized care following a stroke and are more likely
to die from stroke than those living in wealthier neighbourhoods (CIHI, 2006, Martinez et
al., 2003).
5.1.3.2 Distance and Access to Care
The use of EMS for pre-hospital transport and care is associated with significantly
shorter transport times (Prabhakaran et al., 2013; Moser et al., 2006) and is a powerful
determinant of arrival to hospital within the first 60-minutes of stroke onset (Saver et al.,
2010). Delays in transport result in prolonged ischemia and a greater likelihood of not
meeting criteria for thrombolysis for AIS. Paramedics initiate protocols for patient
stabilization and provide early notification of arrival to the stroke centre.
63
Direct transport to a CSC is associated with a better response to thrombolytic
treatment, a greater probability of neurologic improvement at 24-hours, and better long
term functional outcome after adjustment for baseline neurologic condition (Pérez de la
Ossa et al., 2009). U.S. data have shown that PSCs may have lower rates of mortality at
discharge and beyond compared with non-stroke centres (Lackland et al., 2014).
Geographic variation in traditional stroke risk factors plays a smaller role in the
geographic variation in stroke and mortality (Howard et al., 2009) than previously
thought. As location of residence is associated with the type and quality of primary and
secondary preventive stroke care available, and with geographic proximity to accredited
stroke centres for acute care, distance to a SPC was included as a predictor for recurrent
stroke and distance to a SC was included as a predictor for in-hospital mortality in our
logistic regression models.
5.2 Study Purpose
Research objectives for this study were to investigate whether (1) drive time from
a SPC / SC predicts inclusion in a hot or cold spot for stroke / in-hospital mortality after
adjusting for DA level sociodemographic characteristics, (2) drive time (minutes) from a
SC predicts in-hospital mortality after stroke, and (3) drive time (minutes) from a SPC
predicts admission to hospital for a recurrent stroke event, using multivariable logistic
regression.
5.3 Methods
5.3.1 Study Design
64
This is a population-based, retrospective cohort study employing multivariable
logistic regression techniques, using administrative data, integrating GIS. The aims of
this study were to investigate associations between (1) (a) previously identified stroke hot
spots/cold spots and predicted drive time from a SPC, adjusting for DA level
sociodemographic predictors, (b) previously identified in-hospital mortality (henceforth
referred to as ‘mortality’) hot spots/cold spots and predicted drive time to an accredited
SC, adjusting for DA level sociodemographic predictors, (2) mortality and predicted
drive time to an accredited SC and individual level predictors, and (3) predicted drive
time to a SPC and admission to hospital with a recurrent stroke event and individual level
predictors. The study was approved by the Conjoint Health Research Ethics Board at the
University of Calgary.
5.3.2 Data
5.3.2.1 Administrative Data
All persons diagnosed with stroke who accessed the health care system in Alberta
are included in the database. Alberta Inpatient Discharge Abstract data (CIHI – DAD,
2013) and Ambulatory Care data (CIHI – NACRS, 2013) that includes ED visits for
fiscal years 2002/03 to 2007/08 inclusive were linked and all personal identifiers
removed. New stroke events aged ≥ 20-years with an ICD-10 (WHO – ICD-10, 2013)
diagnosis of I63 (cerebral infarction), H34 (retinal arterial occlusion), I64 (stroke not
specified as hemorrhage or infarction); I60 (subarachnoid hemorrhage - SAH); I61
(intracerebral hemorrhage - ICH); or G45 (Transient Ischemic Attack - TIA) were
included (n = 21,886). ICD-10 I64 (not specified as hemorrhage or infarction) was coded

65
with I63 and H34 as ischemic stroke based on the assumption that 87% of strokes are
ischemic and 13% are hemorrhagic (CDC – Stroke Facts, 2014). A new stroke event was
identified as follows. If multiple visits for the same patient occurred within 48-hours, the
most serious event was selected (ICH > SAH > AIS > TIA). If multiple visits within 48-
hours were of the same stroke type, the first event was selected because any treatment(s)
received during the first health encounter could alter the patient’s risk profile prior to the
second encounter (Jeerakathil et al., 2010). A stroke event was considered a ‘recurrent’
event if it occurred >48-hours after the ‘index’ event. Persons <20-years of age, without
a health care number and/or a valid Alberta postal code were excluded.
5.3.2.2 Spatial Data
Spatial shapefiles including healthcare centres, cities, street network data, and
Dissemination Area and Alberta boundaries were obtained from Spatial and Numeric
Data Services, University of Calgary (University of Calgary, 2013). These data were
joined with Statistics Canada 2006 census demographic data that is based on a 20%
sample (Statistics Canada – 20% Sample, 2014), by DA. DAs are defined by Statistics
Canada as small, relatively stable geographic units with a population of between 400 and
700 persons (Statistics Canada – Census Dictionary, 2014).
5.3.3 Analysis
Predicted drive time service areas were generated at 30-minute intervals to 180-
minutes, from SCs (for 2005, 2007, and 2010 stroke infrastructure) (Jeerakathil et al.,
2010) and SPCs (for 2005 and 2010 stroke infrastructure) (Jeerakathil et al., 2010) using
66
Street Network data (DMTI 2011, 2014) and ArcGIS ArcMap Network Analyst Service
Area analysis (Mitchell, 1999). An interval of 30-minutes was selected arbitrarily as it
was thought to be sufficiently sensitive to capture changes in the estimate of effect with
increased distance while limiting the number of categories. A service area includes all
streets that can be reached within a specified period of travel distance or time from the
SC or SPC (Mitchell, 1999).
DA and individual level predictors for the multivariable regression models were
selected based upon (i) known risk factors for stroke, and (ii) available predictors which
enabled an examination of the research objectives. STATA/IC 12.1 (StataCorp, 2013)
software was used for the regression analysis.
Rotary and fixed wing transport were not considered for this analysis as these
transports currently comprise only a small proportion of transports for acute stroke
events. Research indicates that air transport does not necessarily reduce dispatch-to-
arrival times for stroke and incurs greater cost and risk (Hesselfeldt, Gyllenborg,
Steinmetz, Do & Rasmussen, 2014; Olson & Rabinstein, 2012). Patel et al. (2007)
conducted an analysis of air versus ground travel times for acute myocardial infarction in
Alberta, Canada, using GIS.
5.3.3.1 (1a) Stroke and Predicted Drive Time to a SPC. (1b) Mortality and Predicted
Drive Time to a SC. Adjusted for DA Level Sociodemographic Predictors.
DA (Statistics Canada – PCCF, 2013) was selected as the geographic unit of
analysis for the cluster analysis as previously described (van Rheenen, Watson,
Alexander & Hill, May 2014). Hot spots and cold spots of stroke types and mortality

67
were identified and located using the Getis-Ord Gi* statistic (ESRI – Hot Spot Analysis,
2013) in ArcGIS and Spatial Scan Statistic (Kulldorff, 2013) in SaTScan. DA centroids
were ‘selected by location’ in ArcMap and identified as positioned within or outside Gi*
and SSS hot spot and cold spot boundaries. Data were imported into ArcGIS ArcMap 10
(ESRI – ArcMap 10.0, 1999-2000) and joined with Statistics Canada 2006 census
demographic data.
Binary outcomes of interest were: (i) DA within hot spot of stroke type (=1) or
outside hot spot (=0), (ii) DA within hot spot of mortality (=1) or outside hotspot (=0),
(iii) DA within cold spot of stroke type (=1) or outside cold spot (=0), and (iv) DA within
cold spot of mortality (=1) or outside cold spot (=0). The primary predictor of interest
was drive time, at 30-minute intervals to 180-minutes, from a SPC for stroke and from a
SC for mortality. Highly correlated variables included ‘urban’ and ‘drive time to a SC’ (-
0.4030 for 2005 and -0.3996 for 2010) and ‘drive time to a SPC’(-0.4050 for 2005 and -
0.4390 for 2010), therefore ‘urban’ was excluded from the models. Quartile cutpoints
from the distribution of DA level sociodemographic predictors were used to dichotomize
variables as follows: proportion with English language (1 = lowest quartile), visible
minority status (1 = highest quartile), high school or less education (1 = highest quartile).
Median household income was modeled as a continuous variable. Models were created
based on 2005 and 2010 stroke infrastructure for comparison.
5.3.3.2 Mortality and Predicted Drive Time to an Accredited SC and Individual Level
Predictors.

68
Postal codes of individual stroke events (Bow et al., 2004) (proxy for place of
residence and location of stroke) were geocoded using the 2006 and 2011 Postal Code
Conversion Files (Statistics Canada – PCCF, 2013) and imported into ArcGIS ArcMap
10.0 (ESRI – ArcMap10.0, 1999-2000). Stroke point data were ‘selected by location’
and positioned within their corresponding 30-minute drive time from SC service area for
examination. SC service areas based on 2005 infrastructure were used for stroke events
occurring in fiscal years 2002/03, 2003/04, 2004/05, and 2005/06. SC service areas
based on 2007 infrastructure were used for stroke events occurring in fiscal years
2006/07 and 2007/08.
Unadjusted estimates were performed using the chi-square test for dichotomous
variables and ‘logistic’ function in Stata for continuous (age, median household income),
ordinal (distance from SC), and categorical (stroke type, transport destination) data to
determine the association between mortality and predictors. The primary predictor of
interest was drive time, at 30-minute intervals to 180-minutes, from a SC. Variables
‘drive time to a SC’ and ‘urban’ were highly correlated (-0.4471 for 2005 and -0.4919 for
2007), therefore ‘urban’ was excluded from the model. Individual patient predictors
included age, sex, stroke type, EMS transport, transport destination (PSC, CSC, or
‘Other’ healthcare facility), and known risk factors including Type 1 or insulin dependent
diabetes mellitus (IDDM), Type 2 or non-insulin dependent diabetes mellitus (NIDDM),
hypertension, atrial fibrillation, and hypercholesterolemia. Two-way interaction terms
were created to assess for effect modification. Adjusted estimates for predictors were
obtained using backwards selection and variables with non-significant associations (p>

69
0.05) were removed. If no effect modification was found, an assessment for confounding
would be carried out.
5.3.3.3 Recurrent Stroke Events and Predicted Drive Time to a SPC and Individual Level
Predictors.
Postal codes of individual stroke events (proxy for place of residence and location
of stroke) were geocoded using the 2006 and 2011 Postal Code Conversion Files and
imported into ArcGIS ArcMap 10. Stroke point data were ‘selected by location’ and
positioned within their corresponding 30-minute drive time from SPC service area for
examination. SPC service areas based on 2005 infrastructure were used for recurrent
stroke events occurring in fiscal years 2002/03, 2003/04, 2004/05, and 2005/06. SPC
service areas based on 2010 infrastructure were used for recurrent stroke events occurring
in fiscal years 2006/07 and 2007/08. An identical approach to multivariable modeling
was taken as was for mortality. The primary predictor of interest was drive time, at 30-
minute intervals to 180-minutes, to a SPC and individual patient predictors included age,
sex, stroke type, transport destination (PSC, CSC, or ‘Other’ healthcare facility), and
known risk factors including IDDM, NIDDM, hypertension, atrial fibrillation, and
hypercholesterolemia.
5.4 Results
Predictors of DA hot and cold spots (see footnote1) after adjustment for
proportion English speaking, visible minority, high school or less education, and median
household income varied by stroke type (Table 5.1). For ischemic stroke, for every 30-
1 † denotes Getis-Ord Gi* statistic. ‡ denotes Spatial Scan statistic.
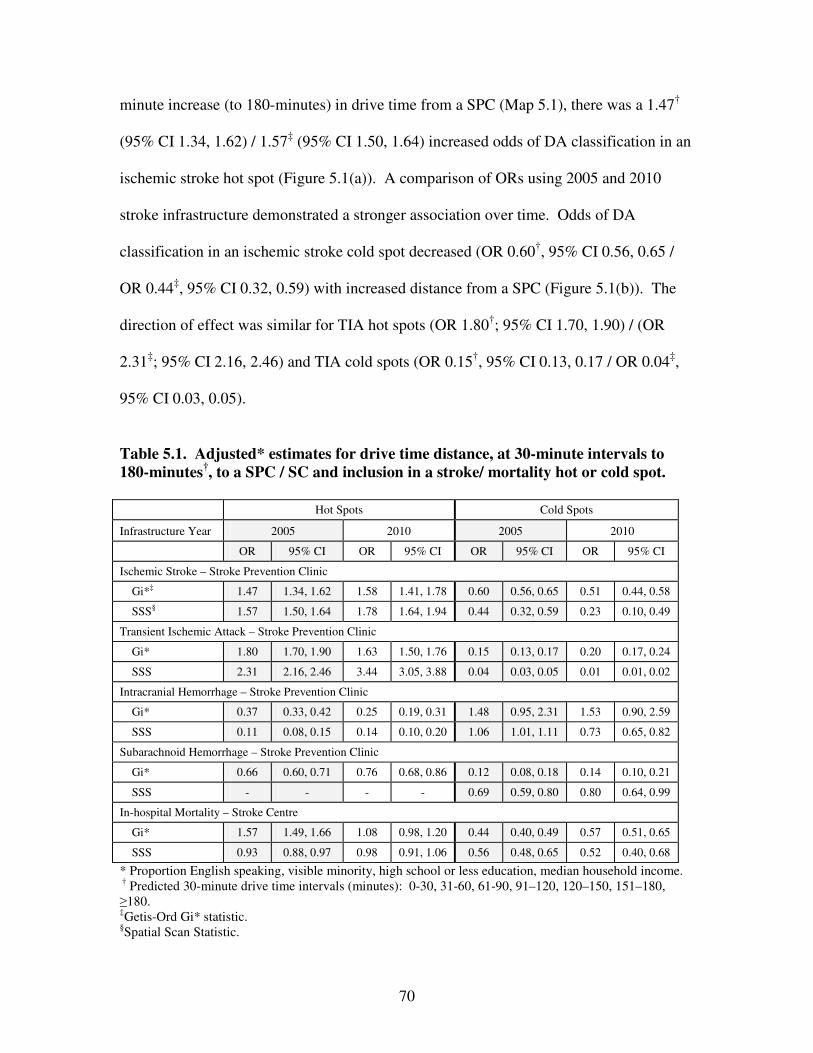
70
minute increase (to 180-minutes) in drive time from a SPC (Map 5.1), there was a 1.47†
(95% CI 1.34, 1.62) / 1.57‡ (95% CI 1.50, 1.64) increased odds of DA classification in an
ischemic stroke hot spot (Figure 5.1(a)). A comparison of ORs using 2005 and 2010
stroke infrastructure demonstrated a stronger association over time. Odds of DA
classification in an ischemic stroke cold spot decreased (OR 0.60†, 95% CI 0.56, 0.65 /
OR 0.44‡, 95% CI 0.32, 0.59) with increased distance from a SPC (Figure 5.1(b)). The
direction of effect was similar for TIA hot spots (OR 1.80†; 95% CI 1.70, 1.90) / (OR
2.31‡; 95% CI 2.16, 2.46) and TIA cold spots (OR 0.15†, 95% CI 0.13, 0.17 / OR 0.04‡,
95% CI 0.03, 0.05).
Table 5.1. Adjusted* estimates for drive time distance, at 30-minute intervals to
180-minutes†, to a SPC / SC and inclusion in a stroke/ mortality hot or cold spot.
Hot Spots Cold Spots
Infrastructure Year 2005 2010 2005 2010
OR 95% CI OR 95% CI OR 95% CI OR 95% CI
Ischemic Stroke – Stroke Prevention Clinic
Gi*‡ 1.47 1.34, 1.62 1.58 1.41, 1.78 0.60 0.56, 0.65 0.51 0.44, 0.58
SSS§ 1.57 1.50, 1.64 1.78 1.64, 1.94 0.44 0.32, 0.59 0.23 0.10, 0.49
Transient Ischemic Attack – Stroke Prevention Clinic
Gi* 1.80 1.70, 1.90 1.63 1.50, 1.76 0.15 0.13, 0.17 0.20 0.17, 0.24
SSS 2.31 2.16, 2.46 3.44 3.05, 3.88 0.04 0.03, 0.05 0.01 0.01, 0.02
Intracranial Hemorrhage – Stroke Prevention Clinic
Gi* 0.37 0.33, 0.42 0.25 0.19, 0.31 1.48 0.95, 2.31 1.53 0.90, 2.59
SSS 0.11 0.08, 0.15 0.14 0.10, 0.20 1.06 1.01, 1.11 0.73 0.65, 0.82
Subarachnoid Hemorrhage – Stroke Prevention Clinic
Gi* 0.66 0.60, 0.71 0.76 0.68, 0.86 0.12 0.08, 0.18 0.14 0.10, 0.21
SSS - - - - 0.69 0.59, 0.80 0.80 0.64, 0.99
In-hospital Mortality – Stroke Centre
Gi* 1.57 1.49, 1.66 1.08 0.98, 1.20 0.44 0.40, 0.49 0.57 0.51, 0.65
SSS 0.93 0.88, 0.97 0.98 0.91, 1.06 0.56 0.48, 0.65 0.52 0.40, 0.68
* Proportion English speaking, visible minority, high school or less education, median household income. † Predicted 30-minute drive time intervals (minutes): 0-30, 31-60, 61-90, 91–120, 120–150, 151–180, ≥180. ‡Getis-Ord Gi* statistic. §Spatial Scan Statistic.

71
0
0.5
1
1.5
2
2.5
3
3.5
4
4.5
Gi* SS Gi* SS Gi* SS Gi* SS Gi* SS Gi* SS Gi* SS Gi* SS Gi* SS Gi* SS
2005 2010 2005 2010 2005 2010 2005 2010 2005 2010
Ischemic TIA ICH SAH Mortality
Odds R
atio (
Hot
Spots
)
* Proportion English speaking, visible minority, high school or less education, median household income. † Predicted 30-minute drive time intervals (minutes): 0-30, 31-60, 61-90, 91–120, 120–150, 151–180, ≥180.
Figure 5.1(a). Adjusted* estimates for drive time distance, at 30-minute intervals to
180-minutes†, to a SPC / SC and inclusion in a stroke/ mortality hot spot.
0
0.5
1
1.5
2
2.5
3
3.5
4
4.5
Gi* SS Gi* SS Gi* SS Gi* SS Gi* SS Gi* SS Gi* SS Gi* SS Gi* SS Gi* SS
2005 2010 2005 2010 2005 2010 2005 2010 2005 2010
Ischemic TIA ICH SAH Mortality
Odds R
atio (
Cold
Spots
)
* Proportion English speaking, visible minority, high school or less education, median household income. † Predicted 30-minute drive time intervals (minutes): 0-30, 31-60, 61-90, 91–120, 120–150, 151–180, ≥180.
Figure 5.1(b). Adjusted* estimates for drive time distance, at 30-minute intervals to
180-minutes†, to a SPC / SC and inclusion in a stroke/ mortality cold spot.

72
Map 5.1. Predicted Stroke Prevention Clinic drive time (minutes) service areas;
2005 and 2010 infrastructure.
The effect was opposite for hemorrhagic forms of stroke. In ICH, for every 30-
minute increase (to 180-minutes) in drive time from a SPC (Map 5.1), odds of DA
classification in an ICH hot spot decreased by 63%† (OR 0.37; 95% CI 2) / 89%‡

73
(OR 0.11; 95% CI 0.08, 0.15) (Table 5.1; Figure 5.1(a)). This association became
stronger from 2005 to 2010 for the Gi* statistic and weaker for the Spatial Scan statistic.
Odds of DA classification in an ICH cold spot increased by 1.48† ( 95% CI 0.95, 2.31) /
1.06‡ (95% CI 1.01, 1.11) for every 30-minute increase (to 180-minutes) in drive time to
a SPC (Figure 5.1(b)). The association became stronger for the Gi* statistic and weaker
for the Spatial Scan statistic over time. Similarly, for SAH, for every 30-minute increase
(to 180-minutes) in drive time from a SPC (Map 5.1), odds of DA classification in a SAH
hot spot decreased by 34%† (OR 0.66; 95% CI 0.60, 0.71) (Figure 5.1(a)). An estimate
for the Spatial Scan statistic was not obtained because there were no SAH events
included within the Spatial Scan SAH hot spot beyond the 30-minute drive time service
area. For every 30-minute increase in drive time from a SPC, the OR for DA
classification in a SAH cold spot decreased by 88%† (OR 0.12; 95% CI 0.08, 0.18) /
31%‡ (OR 0.69; 95% CI 0.59, 0.80) (Figure 5.1(b)). From 2005 to 2010,
the association weakened for the Gi* statistic and strengthened for the Spatial Scan
statistic.
The distance effect on in-hospital mortality paralleled the effect for ischemic
stroke (Table 5.1). For every 30-minute increase (to 180-minutes) in drive time from a
SC (Map 5.2), there was a 1.57† (95% CI 1.49, 1.66) increase in odds of DA
classification in a mortality hot spot for the Gi* statistic and a 7% decreased odds‡ (OR
0.93; 95% CI 0.88, 0.97) for the Spatial Scan statistic. From 2005 to 2010 the
associations weakened and by 2010 neither statistic was statistically significant. For
every 30-minute increase in drive time from a SC, odds of DA classification in a
mortality cold spot decreased 56%† (OR 0.44; 95% CI 0.40, 0.49) / 44%‡ (OR 0.56; 95%
74
CI 0.48, 0.65). From 2005 to 2010, the association weakened for the Gi* statistic and
strengthened for the Spatial Scan statistic.
Adjusted analysis of individual events confirmed this direction of effect (Table
5.2). Every 30-minute increase in drive time from a SC (to 180-minutes) (Map 5.2) was
associated with increased odds of mortality (OR 1.11; 95% CI 1.04, 1.05) after adjusting
for age, sex, stroke type, risk factors, EMS transport, and transport destination. Stroke
type was significantly associated with mortality. As expected, with ischemic stroke as
the referent category, ICH (OR 3.95; 95% CI 3.51, 4.44) and SAH (OR 4.12; 95% CI
3.49, 4.87) had higher odds of mortality and TIA had lower odds (OR 0.02; 95% CI 0.02,
0.04). Advanced age (OR 1.04; 95% CI 1.04, 1.05), NIDDM (OR 1.13; 95% CI 1.01,
1.26), and atrial fibrillation (OR 1.36; 95% CI 1.23, 1.52) were associated with higher
odds of mortality. Hypertension (OR 0.64; 95% CI 0.58, 0.70) and hypercholesterolemia
(OR 0.48; 95% CI 0.41, 0.56) had lower odds of mortality.
Effect modification of EMS transport on drive time from a SC was found.
Increased drive time from a SC and non-EMS transport was significantly associated with
mortality (OR 1.11; 95% CI 1.03, 1.19) whereas increased drive time from a SC and
transport by EMS was not (OR 0.98; 95% CI 0.94, 1.01). Transport destination was
associated with mortality. With PSC as the referent category, transport to a CSC was
associated with a 37% reduction in mortality (OR 0.63; 95% CI 0.56, 0.71). Transport to
‘Other’ healthcare facility was not significantly associated with mortality (OR 0.91; 95%
CI 0.80, 1.02).

75
Table 5.2. Drive time distance, at 30-minute intervals to 180-minutes*, to a Stroke
Centre (SC) and in-hospital mortality after stroke†. Main effects and effect
modification (EM) of EMS transport on distance to a Stroke Centre.
Adjusted‡ Estimates
Main Effects EM of EMS Transport on Distance
EMS=1 EMS=0
(n=21,886) (n=16,351) (n=5,535)
Predictor OR 95% CI OR 95% CI OR 95% CI
Distance from SC* (minutes) 1.11 1.04, 1.18 0.98 0.94, 1.01 1.11 1.03, 1.19
Age, years 1.04 1.04, 1.05 1.04 1.03, 1.04 1.06 1.05, 1.07
Stroke Type
Ischemic Stroke Referent Referent
Transient Ischemic Attack 0.02 0.02, 0.04 0.02 0.02, 0.04 0.02 0.01, 0.05
Intracerebral Hemorrhage 3.95 3.51, 4.44 3.95 3.48, 4.49 3.69 2.65, 5.12
Subarachnoid Hemorrhage 4.12 3.49, 4.87 4.01 3.37, 4.77 4.30 2.30, 8.04
NIDDM 1.13 1.01, 1.26 1.13 1.01, 1.28 1.10 0.82, 1.49
Hypertension 0.64 0.58, 0.70 0.64 0.58, 0.71 0.62 0.49, 0.80
Atrial Fibrillation 1.36 1.23, 1.52 1.32 1.18, 1.48 1.72 1.28, 2.31
Hypercholesterolemia 0.48 0.41, 0.56 0.46 0.39, 0.54 0.72 0.47, 1.04
EMS Transport 2.58 2.21, 3.01 -
Transport Destination
Primary Stroke Centre Referent Referent
Comprehensive Stroke Centre 0.63 0.56, 0.71 0.64 0.56, 0.73 0.52 0.36, 0.75
‘Other’ healthcare facility 0.91 0.80, 1.02 0.91 0.79, 1.04 0.87 0.66, 1.15
*Predicted 30-minute drive time intervals: 0-30, 31-60, 61-90, 91–120, 120–150, 151–180, ≥180. †2005 SC infrastructure used for stroke events in fiscal years 2002/03, 2003/04, 2004/05, 2005/06 and 2007 SC infrastructure used for stroke events in fiscal years 2006/07 and 2007/08. ‡Adjusted for distance to Stroke Centre, age, sex, stroke type, IDDM, NIDDM, hypertension, atrial fibrillation, hypercholesterolemia, EMS for transport, transport destination.
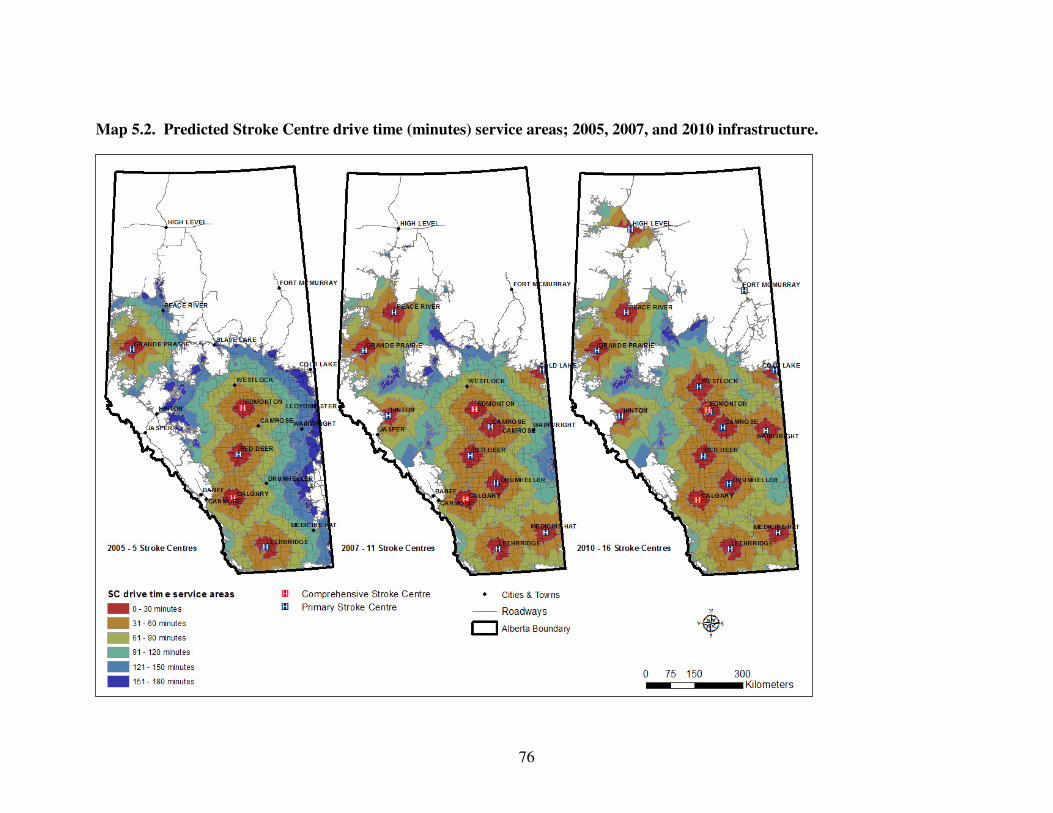
76
Map 5.2. Predicted Stroke Centre drive time (minutes) service areas; 2005, 2007, and 2010 infrastructure.

77
Distance also predicted recurrent stroke events (Table 5.3). Every 30-minute
increase in drive time from a SPC (to 180-minutes) (Map 5.1) was associated with
increased odds (OR 1.16; 95% CI 1.13, 1.18) of hospitalization with a recurrent stroke
event. With TIA as the referent category, ischemic stroke (OR 0.82; 95% CI 0.76, 0.89),
ICH (OR 0.64; 95% CI 0.55, 0.74), and SAH (OR 0.59; 95% CI 0.48, 0.72) had lower
odds of being a recurrent event. Advanced age (OR 1.01; 95% CI 1.01, 1.02), male sex
(OR 1.22; 95% CI 1.14, 1.31), NIDDM (OR 1.21; 95% CI 1.11, 1.32), and atrial
fibrillation (OR 1.25; 95% CI 1.13, 1.40) showed increased odds of recurrent event.
There was effect modification of atrial fibrillation on drive time from a SPC
(Table 5.3). Increased drive time from a SPC and no documented atrial fibrillation was
associated with increased odds of recurrent stroke event (OR 1.15; 95% CI 1.13, 1.18),
whereas documented atrial fibrillation had an OR of 1.09 (95% CI 1.04, 1.15). With PSC
as the referent category, transport to ‘Other’ healthcare facility was associated with
increased odds of recurrent stroke event (OR 1.22; 95% CI 1.12, 1.35). The association
between transport to a CSC and recurrent stroke event was not statistically significant
(OR 0.99; 95% CI 0.89, 1.09).

78
Table 5.3. Drive time distance, at 30-minute intervals to 180-minutes*, from a
Stroke Prevention Clinic (SPC) and admission to hospital with a recurrent stroke
event†. Main effects and effect modification (EM) of documented atrial fibrillation
on distance to a Stroke Prevention Clinic.
Adjusted‡ Estimates
Main Effects EM of Atrial Fibrillation on Distance
Atrial Fibrillation=1
Atrial Fibrillation=0
(n=21,886) (n=3,642) (n=18,244)
Predictor OR 95% CI OR 95% CI OR 95% CI
Distance from SPC* (minutes) 1.16 1.13, 1.18 1.09 1.04, 1.15 1.15 1.13, 1.18
Age, years 1.01 1.01, 1.02 1.01 1.00, 1.02 1.01 1.01, 1.02
Sex (Male=1) 1.22 1.14, 1.31 1.00 0.85, 1.18 1.27 1.18, 1.38
Stroke Type
Transient Ischemic Attack Referent Referent
Ischemic Stroke 0.82 0.76, 0.89 0.70 0.58, 0.86 0.85 0.78, 0.92
Intracerebral Hemorrhage 0.64 0.55, 0.74 0.57 0.39, 0.81 0.65 0.56, 0.77
Subarachnoid Hemorrhage 0.59 0.48, 0.72 0.85 0.45, 1.60 0.58 0.47, 0.73
NIDDM 1.21 1.11, 1.32 1.26 1.03, 1.52 1.20 1.10, 1.32
Atrial Fibrillation 1.25 1.13, 1.40 -
Transport Destination
Primary Stroke Centre Referent Referent
Comprehensive Stroke Centre 0.99 0.89, 1.09 1.18 0.94, 1.49 0.94 0.84, 1.05
‘Other’ healthcare facility 1.22 1.12, 1.35 1.16 0.92, 1.47 1.24 1.12, 1.38
*Predicted 30-minute drive time intervals: 0-30, 31-60, 61-90, 91–120, 120–150, 151–180, ≥180. †2005 SPC infrastructure used for stroke events in fiscal years 2002/03, 2003/04, 2004/05, 2005/06 and 2010 SPC infrastructure used for stroke events in fiscal years 2006/07 and 2007/08. ‡Adjusted for distance to Stroke Prevention Clinic, age, sex, stroke type, IDDM, NIDDM, hypertension, atrial fibrillation, hypercholesterolemia, transport destination.

79
5.5 Discussion
In summary, drive time from a SPC and SC were significant predictors of hot
spots and cold spots of ischemic stroke, TIA, and mortality in Alberta from 2002/03 to
2007/08 at both DA and individual levels. With increased distance from a SPC, DAs had
higher odds of classification in ischemic stroke and TIA hot spots and lower odds of
classification in ICH and SAH hot spots. Higher adjusted odds of mortality was
associated with increased drive time from a SC, ICH and SAH, NIDDM, atrial
fibrillation, and non-EMS transport. Increased odds of hospitalization with a recurrent
stroke event was associated with increased drive time from a SPC, male sex, TIA,
NIDDM, atrial fibrillation and transport destination ‘Other’ than SC. Geographic
patterns and locations of stroke and mortality hot and cold spots shown in Map 5.3
signify that there are important predictors related to geography, in addition to distance
from specialized stroke care.
After adjusting for selected DA sociodemographic characteristics, increased drive
time from a SPC was associated with increased odds of DA classification in an ischemic
stroke and TIA hot spot (Table 5.1). Factors accounting for this association may include
(i) preventive care received at a SPC is effective for stroke prevention, and (ii) a distance
decay effect of the influence of SPCs on the medical community, (iii) a higher cost
burden associated with increased travel for primary and secondary prevention reduces
attendance at a SPC appointment, (iv) reduced number of referrals to a SPC with
increased distance, (v) DA characteristics including the type and quality of preventive
stroke care available, limited transportation options, employment sector flexibility, (vi)

80
Map 5.3. Hot and cold spots of stroke and in-hospital mortality and predicted drive
time (minutes) service areas.

81
increased exposure to risks for stroke, and (vii) unique population characteristics
including proclivity to seek preventive care and adhere to risk reduction strategies. Box
plots of estimated ground travel distance from the recurrent stroke event’s documented
postal code centroid to the closest SPC, obtained using Network Analyst Route analysis,
suggest that there is a proportion of stroke patients who may be required to travel great
distances in order to receive secondary preventive care at a SPC (Figure 5.2).
Figure 5.2. Estimated distance from recurrent stroke event postal code centroid to
nearest Stroke Prevention Clinic obtained using Network Analyst Route Analysis.
Variations in clinical practice exist around the decision to test, treat and refer
patients to specialists. There is variation in specialists’ beliefs about the risks and
benefits of medications and procedures, and regional variations in the degree to which
patient preferences are incorporated into clinical decisions and influence patient
outcomes (Birkmeyer, 2001). SPCs work in partnership with primary care, acute care,
0
100
200
300
400
500
50
150
Dis
tance
to S
PC
(K
ilom
etr
es)
Chino
okFM
C
Gre
y Nun
s
Med
icine
Hat
Nor
ther
n Ligh
tsQEII
Red
Dee
r
Roy
al A
exan
dra
Slave
Lak
e
St.
Mar
y's
St.The
resa
St.P
aul
U o
f A
Stroke Prevention Clinic

82
rehabilitation, long-term care, and community services and other stakeholders to offer
prevention to those patients within their community (emphasis added) who have been
identified as having high risk for stroke, or who have had a TIA and/or stroke (HSF,
2014). They work collaboratively with CSCs and PSCs to guide the primary and
secondary stroke prevention plan (i.e. referrals and diagnostic work-ups) and facilitate
best practice prevention throughout the community (HSF, 2014). Increased distance
from a SPC may be associated with diminished influence on medical practitioners’
judgments about stroke care provision.
Drive time from a SPC was also a significant predictor for ischemic stroke cold
spots (Table 5.1). The geographic pattern of the ischemic stroke cold spot shown in Map
5.3 suggests that there are factors in addition to distance from a SPC that are uniquely
and positively related to this population and/or the way in which preventive stroke care is
delivered in this area.
Similar to ischemic stroke, drive time from a SPC was a significant predictor of
TIA hot and cold spots (Table 5.1). TIA cold spots were located in and surrounding the
cities of Edmonton and Calgary (Map 5.3). Differences in access to MRI, extent of
investigation, expertise of the investigator, as well as urban-rural differences in the
coding accuracy of TIA versus ischemic stroke (Kokotailo & Hill, 2005) may partially
explain the urban bias for TIA cold spots located in Edmonton and Calgary.
Increased drive time from a SPC was associated with decreased odds of DA
classification in an ICH or SAH hot spot (Table 5.1). This finding is likely due to
differing population risk profiles for ischemic versus hemorrhagic stroke.
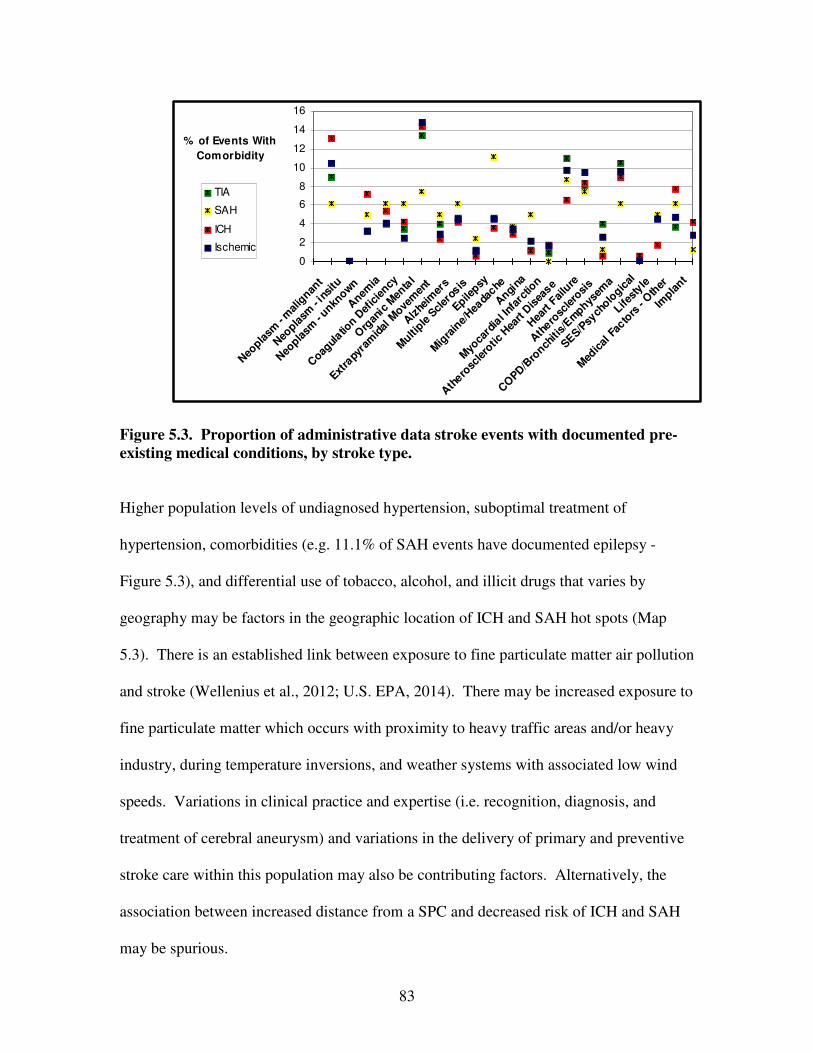
83
0
2
4
6
8
10
12
14
16
Neo
plasm
- m
alig
nant
Neo
plasm
- in
situ
Neo
plasm
- unkn
own
Anem
ia
Coag
ulatio
n Def
icie
ncy
Org
anic
Men
tal
Extra
pyra
mid
al M
ovem
ent
Alz
heim
ers
Multi
ple S
cler
osis
Epilepsy
Mig
rain
e/Hea
dache
Angi
na
Myo
card
ial I
nfar
ctio
n
Ath
erosc
lero
tic H
eart D
isea
se
Hea
rt F
ailu
re
Ath
erosc
lero
sis
CO
PD/B
ronch
itis/
Em
physem
a
SES/P
sych
ologic
al
Lifest
yle
Med
ical
Fac
tors
- O
ther
Impla
nt
% of Events With
Comorbidity
TIA
SAH
ICH
Ischemic
Figure 5.3. Proportion of administrative data stroke events with documented pre-
existing medical conditions, by stroke type.
Higher population levels of undiagnosed hypertension, suboptimal treatment of
hypertension, comorbidities (e.g. 11.1% of SAH events have documented epilepsy -
Figure 5.3), and differential use of tobacco, alcohol, and illicit drugs that varies by
geography may be factors in the geographic location of ICH and SAH hot spots (Map
5.3). There is an established link between exposure to fine particulate matter air pollution
and stroke (Wellenius et al., 2012; U.S. EPA, 2014). There may be increased exposure to
fine particulate matter which occurs with proximity to heavy traffic areas and/or heavy
industry, during temperature inversions, and weather systems with associated low wind
speeds. Variations in clinical practice and expertise (i.e. recognition, diagnosis, and
treatment of cerebral aneurysm) and variations in the delivery of primary and preventive
stroke care within this population may also be contributing factors. Alternatively, the
association between increased distance from a SPC and decreased risk of ICH and SAH
may be spurious.

84
After adjusting for selected predictors, the association between drive time to a SC
and DA classification in a mortality hot spot was inconsistent between the Getis-Ord Gi*
and Spatial Scan statistics (Table 5.1). The geographic location and pattern of the
mortality hot spot (Map 5.3) suggests that there are important regional level predictors for
mortality in this region in addition to distance from a SC. Factors might include a higher
at-risk population for mortality, systemic issues resulting in prolonged OTT times, the
provision of pre-hospital care (e.g. lack of or underutilization of a stroke screen tool, type
of EMS service provider, availability of EMS vehicles, decisions regarding transport
destination), and ED and in-hospital care (e.g. timely access to a CT scanner, stroke team
care, and stroke unit care). Increased drive time from a SC was significantly associated
with decreased odds of DA classification in a mortality cold spot for both statistics (Table
5.1). Decreased drive time from a SC may contribute to reduced mortality from stroke in
part due to the increased likelihood of meeting criteria for thrombolysis (87% of strokes
are ischemic). The location of the mortality cold spot shown in Map 5.3 suggests that
there are factors unique to the population of this area and/or the ways in which stroke
care is delivered in this area that contribute to this significant cluster of low mortality.
Effect modification of EMS transport on increased drive time from a SC was
found where non-EMS transport and increased drive time from a SC was associated with
increased odds of mortality. Patient stabilization by EMS personnel, EMS direct
transport protocols where patients are transported to the nearest SC (Greg Vogelaar,
unpublished data, 2014), pre-notification to the receiving SC, and transport speed are
likely associated with the increasingly significant role that EMS transport has as distance
from a SC becomes greater. This is despite the unique challenges for EMS related to the

85
expanse and realities of rural and remote coverage (Health Quality Council of Alberta,
2013). ICH and SAH were both associated with higher odds of mortality (Table 5.2).
Stroke severity is the primary predictor of survival at one month after stroke (Brown et
al., 2013). Documented hypertension and hypercholesterolemia were associated with
reduced odds of mortality (36% and 52% respectively) (Table 5.2). An association
between hypertension and mortality has been found at 1-year but not at 30-days (Brown
et al., 2013). A lower ratio of TC/HDL is associated with higher mortality at both 30
days and 1 year (Brown et al., 2013) but dyslipidemia is associated with reduced risk for
hemorrhagic stroke. It would be expected that hypertension and hypercholesterolemia
would be associated with higher risk of mortality, however adherence to treatment
regimens (i.e. diagnosed and controlled hypertension equates with reduced mortality risk)
may have confounded these associations or there may be a difference in the type and
quality of care provided to those individuals with documented hypertension and
hypercholesterolemia. NIDDM and atrial fibrillation were associated with increased
odds of mortality (Table 5.2). Diabetes mellitus is a risk factor for cardiovascular
disease, renal failure, and other serious health problems that can increase overall
mortality risk. Cardioembolic clots associated with atrial fibrillation may be more
resistant to thrombolysis leading to worsened outcomes. Additionally, risk for atrial
fibrillation and mortality both increase with age so age may have confounded this
association. With PSC as referent, care at a CSC was associated with a 37% reduction in
mortality (Table 5.2). CSC care has been associated with reduced OTT times, increased
use of tPA for AIS, reduced mortality related to specialized care on a stroke unit, and
availability of neuro-interventional and neuro-intensive care for AIS, ICH and SAH.

86
Increased drive time from a SPC was associated with increased odds of hospital
admission with a recurrent stroke event. This relationship held even after adjustment for
individual predictors (Table 5.3). With TIA as the referent category, ischemic stroke,
ICH, and SAH all had decreased odds of being a recurrent event. This finding was
expected due to the increased risk for ischemic stroke after TIA. As of 2010, 51% of
ischemic stroke and TIA patients received a referral to a SPC for secondary prevention
(Jeerakathil et al., 2010). Advanced age, male sex (at higher risk for non-adherence to
warfarin) (Kneeland & Fang, 2014), NIDDM, and atrial fibrillation were significantly
associated with a recurrent stroke event. There was effect modification of atrial
fibrillation on distance from a SPC where events with no documented atrial fibrillation
had higher odds of being a recurrent event (Table 5.3). The efficacy of secondary
prevention of stroke with anticoagulation therapy for atrial fibrillation combined with
patient adherence with medication and blood work regimes lowers the odds of recurrent
stroke. With PSC as referent, transport to ‘Other’ than SC healthcare facility was
associated with increased odds of a recurrent stroke event. The referral and follow-up
process for preventive stroke care provided at a SPC may be more efficacious and
streamlined when initiated at CSCs and PSCs, due to the comparatively larger patient
volumes. ICH and SAH patients are more likely to be followed by neurosurgeons
practicing at CSCs, sites where SPCs are also located. Organized approaches for
preventive strategies (e.g. medication adherence interventions) initiated during
hospitalization may help support adherence to secondary stroke prevention guidelines
after discharge (Schwamm et al., 2005). There should be a smooth transition from
inpatient to outpatient care, including timely transfer of hospital discharge information to

87
the subsequent treating physician and a clear method of appropriate follow-up
(Schwamm et al., 2005).
5.6 Study Implications
Distance from a SPC and SC to place of residence (proxy for location of stroke) is
a significant predictor of index ischemic stroke and TIA, recurrent stroke, and mortality
in Alberta. Associations were identified at both the DA and individual levels. EMS
transport and CSC care significantly lowered the odds of mortality after stroke.
Strengths of this research study include that associations with known predictors of
stroke and mortality were confirmed and significant associations with novel predictors
(e.g. distance to stroke care) identified. The analysis was conducted according to stroke
type. The spatial unit of analysis (DA) was sufficiently small to control for predictors at
a more localized scale and to permit more accurate estimations of distance (e.g. DA
centroid to SPC or SC). GIS can be used to predict actual ground transport times with
reasonable accuracy (van Rheenen, Hill, Alexander, & Watson, July 2014), therefore
predicted 30-minute drive time service areas used in this study were considered a
reasonably accurate representation of actual drive times. Multivariable regression
modeling identified statistically significant associations between outcomes and predictors
of interest, several of which were unexpected. GIS generated maps augmented the
analysis by permitting the visualization of the spatial relationship between patterns of hot
and cold spots and drive time service areas. In addition to known risk factors for stroke,
this study highlights the significance of geographic proximity to specialized stroke care
for primary and secondary stroke prevention and for (hyper)acute stroke. It emphasizes

88
the importance of EMS transport and Stroke Centre care to in-hospital mortality and may
thus inform future directions in stroke research and underscore the benefit of
incorporating GIS based methods.
5.7 Study Limitations
Potential limitations of this study include those associated with the use of
administrative data: (1) lack of clinical detail (i.e. stroke severity, INR, blood pressure,
BMI), (2) regional differences with ICD-10 coding of stroke type, (3) regional
differences in the documentation of risk factors, (4) inaccurate documentation of postal
code, and (5) errors associated with the collection of Statistics Canada census data
including under or over coverage of specific populations (Statistics Canada – Population
Coverage Error, 2013). A limitation of TIA diagnosis is that patients who undergo more
extensive diagnostic evaluations may be classified differently from those who undergo
less extensive evaluations (Albers et al., 2002). The postal code documented on the
clinical health record may not accurately represent location of residence or location of
stroke (predicted travel distance from stroke location to care that is associated with
outcome may not accurately reflect actual travel distance). The large study sample size
would likely negate differential bias. Limitations associated with the use of multivariable
logistic regression include residual confounding as it is not possible to have knowledge of
or include all possible predictors. There are uncertainties associated with the graphic
representation of spatial data including (1) the positional accuracy of DA centroids and
events (Longley et al., 2005), (2) the limited capacity of DAs to reveal what is happening
in rural areas, (3) the Modifiable Areal Unit Problem for rate and estimate drive time

89
distance calculations, (4) small numbers problem and DA rate stability, and (5) ecological
and atomistic fallacy. Misclassification of DA centroids within drive time service areas
may occur but likely would be non-differential due to the large sample size.
5.8 Conclusion
Study findings confirm that where you live in relation to a SPC and SC matters
with respect to stroke and stroke mortality at both the DA and individual level. At the
individual level, stroke type was the most important predictor of in-hospital mortality.
The majority of the population in Alberta have potential geographic access to acute
stroke care within critical time windows (van Rheenen et al., July 2014), however
increased distance from a SC (a component of OTT time) remains a significant predictor
for stroke mortality. This fits with the literature that early treatment is crucial to good
outcome. Study findings support ongoing public awareness emphasizing the importance
of dialing 9-1-1 for symptoms of stroke. Geographic proximity to a SPC is an important
predictor of recurrent stroke. At the DA level, there are predictors for ICH and SAH that
are unaccounted for in this analysis that warrant further exploration (Map 5.3).
A multi-level spatial analysis utilizing GIS that provides the ability to examine the
dual complexity of compositional (individual level) and contextual (neighbourhood level)
predictors on stroke and stroke mortality using geographically weighted regression
techniques would be both interesting and valuable. Predictors might include population
proclivity to seek preventive care, the efficacy of preventive care, and differentials with
respect to meeting thrombolysis criteria if geocoded linked EMS, ED, in-hospital, and
administrative and pharmaceutical data were available for stroke events assessed at a SPC

90
and/or admitted to hospital with a diagnosis of stroke. Novel predictors might include
proximity (exposure to) to environmental pollutants, smoking rates, drug use, crime rates,
access to public transportation, access to healthy and affordable foods, access to safe
green spaces, and distance to specialized stroke care. Findings would inform and guide
future population level stroke prevention strategies.
91
Study III. An Analysis of Geographic Access to Acute Stroke Care in Alberta,
Canada, Using Network Analysis and GIS.

92
Chapter 6: Study III. An Analysis of Geographic Access to Acute Stroke Care in
Alberta, Canada, Using Network Analysis and GIS.
6.1 Background
In Acute Ischemic Stroke (AIS), tissue outcome is determined by the sensitivity to
ischemia, severity and duration of ischemia (Jones et al., 1981). Duration of ischemia is
a critical factor. The onset-to-treatment (OTT) time with IV tPA is strongly associated
with outcome, with a doubling of the odds of good outcome when administered under
1.5-hours after onset versus 1.5 to 3.0-hours after onset (Hacke et al., 2008; Marler et al.,
2000). This relationship holds for all forms of reperfusion therapy (Hacke et al., 2008,
Mazighi et al., 2012; Mazighi et al., 2009).
Increasing access to acute reperfusion therapy and minimizing OTT time are two
of the major goals in the implementation of an integrated system of stroke care
(Schwamm et al., 2005; Lackland et al., 2014; Acker et al., 2007). Delays to presentation
at a PSC or tertiary stroke centre (CSC) are the main source of lost opportunity for
reperfusion therapy. This requires early stroke recognition, rapid activation and transport
protocols for EMS and close proximity of the populace to operational stroke centres.
Implementation of a comprehensive system of stroke care has been shown to increase the
use of EMS for transport, reduce interfacility transfer delays, reduce OTT times, and
increase rates of thrombolysis administration for AIS (Prabhakaran et al., 2013;
Prabhakaran et al., 2011; Saver et al., 2010). Changes in the organization of stroke care
delivery over the past two decades may have had the greatest impact on the decline in
stroke mortality (Lackland et al., 2014).
93
Use of EMS for pre-hospital transport has been associated with significantly
shorter transport times (Prabhakaran et al., 2013; Moser et al., 2006) and is a powerful
determinant of arrival to hospital within the first 60 minutes (Saver et al., 2010). EMS
transport and travel time by ground from a Stroke Centre (SC) is inversely associated
with in-hospital mortality after stroke (van Rheenen, Watson, Alexander & Hill, Oct.
2014). Recommended implementation strategies designed to meet critical treatment time
windows for stroke include established targets for onset-to-dispatch, dispatch-to-scene,
scene, scene-to-stroke centre, and ED arrival-to-treatment interval times (APSS, 2010;
Acker et al., 2007; AHW, 2012) (Figure 3.1).
Stroke care is geographically accessible when it is available in terms of the
number of service points (SCs) and in terms of travel impedance (by distance or time)
between patient location and service points (Guagliardo, 2004). Access to coordinated
stroke care may be problematic in rural areas or areas where there is inadequate access to
neurological expertise (Schwamm et al., 2005; Health Quality Council of Alberta, 2013)
leading to geographic disparities in access to stroke care, morbidity and mortality.
Studies in the U.S. indicate that designated PSCs have lower rates of mortality at and
after discharge than non-accredited hospitals (Lackland et al., 2014). Delineation of
geographic regions where services can potentially be accessed within a specified time or
distance of a healthcare centre can be carried out using GIS. The availability of health
care services does not ensure utilization and good outcomes. Therefore, an assessment of
only the spatial relationship between SCs and patient or population (DA centroid)
locations is incomplete and insufficient to fully understand access (Gomez et al., 2013).
Administrative data can be used to identify populations with predicted geographic access

94
who accessed care at a stroke centre. However, a lack of clinical time data precludes an
evaluation of whether this access to care is timely.
In 2005, the Government of Alberta funded the implementation of a stroke system
of care to enhance geographic access to best-practice stroke care across the province.
Extensive educational and training programs resulted in the addition of 11 new PSCs, in
addition to the 2 CSCs and 3 preexisting PSCs. This increased the number of hospital
sites capable of administering IV-tPA from 5 to 16 by 2010 (Jeerakathil et al., 2010). A
standardized EMS stroke screen tool, direct EMS transport protocols, and best practice
stroke care guidelines were instituted at all sites.
6.2 Study Purpose
This is a population-based, retrospective cohort study employing spatial methods
using matched Alberta Health Services (AHS) EMS and Calgary Stroke Program (CSP)
data, Statistics Canada census data, and population-based administrative data integrating
GIS. The aims of this study were to (1) evaluate the concordance of GIS predicted versus
actual EMS ground transport times for stroke, (2) estimate the proportion of Alberta
population age ≥20 years with potential geographic access to acute stroke care by ground
within critical OTT time windows as defined by parameters in our data (henceforth
referred to as ‘predicted’ geographic access), (3) identify the proportion of a stroke
population with predicted geographic access to stroke care who accessed care at a CSC or
PSC (henceforth referred to as ‘realized’ access) in 2002 and 2007, and (4) to
characterize stroke populations with predicted geographic access within and outside of
95
critical transport time windows. The study was approved by the Conjoint Health
Research Ethics Board at the University of Calgary.
6.3 Methods
6.3.1 Concordance of GIS Predicted Versus Observed EMS Ground Transport Times
and Generation of Ground Transport Time Service Areas.
6.3.1.1 Data
Demographic, clinical, and spatial data (northings and eastings for scene location
of stroke event) for AIS patients transported by AHS EMS and treated at a CSC from
April 2010 to March 2013 (n = 367) were matched using a deterministic linkage strategy.
Events with missing time data, transfer patients, and inpatients were excluded from the
analysis (n = 50). Street network data (DMTI 2011, 2014) and spatial shapefiles
including healthcare centres, cities, and Dissemination Area (DA) and Alberta boundaries
were obtained from Spatial and Numeric Data Services, University of Calgary
(University of Calgary, 2013).
6.3.1.2 Analysis
Median (IQR) time intervals that included symptom onset (time last seen well)-to-
dispatch, dispatch-to-scene, scene, transport-to-CSC, and ED arrival-to-treatment were
obtained from the AHS EMS - CSP dataset using STATA/IC 12.1 (StataCorp, 2013)
software. Predicted ground transport times (scene-to-CSC) were calculated using two
methods in ArcGIS ArcMap 10.0 (ESRI – ArcMAP 10.0, 1999-2010): Network Analyst
New Route analysis and Network Analyst New Service Area analysis. A network data
96
model was selected for transport time calculations as it has been found to more accurately
estimate vehicular-based travel time (Delamater et al., 2012; DMTI 2011, 2014).
In Network Analyst Route Analysis, the GIS uses Dijkstra’s algorithm to compute
the route between an origin (stroke event) and a destination (SC) that has the lowest
impedance (time in minutes) based on street segment edges’ assigned distances and speed
limits (ESRI – Algorithms, 2014). GIS predicted transport times were compared with
EMS observed transport times and outliers examined by month, time of day of transport,
and distance from CSC.
Service areas were generated at 5-minute drive time intervals, selected arbitrarily
for the purpose of capturing small urban and rural differences in concordance, from the
CSC using Street Network data and ArcGIS Network Analyst Service Area analysis. A
service area includes all streets that can be reached within a specified period of travel
distance or time from the CSC (Mitchell, 1999). Concordance between GIS generated
service areas and observed EMS transport times was assessed.
Ground transport time service areas originating from CSCs and PSCs were
created based upon stroke infrastructure for years 2002, 2007, and 2010 (Jeerakathil et
al., 2010) and time intervals derived from AHS EMS – CSP data. Median (IQR) interval
times in minutes for AIS patients who received thrombolysis were (i) symptom onset-to-
dispatch - 20 minutes (80), (ii) dispatch-to-scene - 6 minutes (4), (iii) scene - 19 minutes
(9), (iv) scene-to-CSC - 14 minutes (10), and (v) ED arrival-to-treatment in accordance
with guideline recommended door-to-needle time of <1-hour (Figure 6.1). Calculations
incorporating these interval times resulted in scene-to-CSC ground transport times of 15-

97
minutes for an OTT time of 2.0-hours, 75-minutes for an OTT time of 3.0-hours, and
165-minutes for an OTT time of 4.5-hours:
20 + 6 + 19 + [ 15] + 60 = 120 minutes / 2.0 hour onset-to-treatment time
20 + 6 + 19 + [ 75] + 60 = 180 minutes / 3.0 hour onset-to-treatment time
20 + 6 + 19 + [165] + 60 = 270 minutes / 4.5 hour onset-to-treatment time.
ONSET → DOOR → NEEDLE
Symptom Onset to 9-1-1
Dispatch
to Scene
Scene Scene
to CSC
ED
to Treatment
Median (IQR), minutes 20 (80) 6 (4) 19 (9) 14 (10) 59 (35)
Figure 6.1. AHS EMS – CSP data symptom onset (time last seen normal) to
treatment interval times (excluding transfer patients).
6.3.2 Predicted Geographic Access: Regional Data From Statistics Canada 2006 and
2011 Census.
6.3.2.1 Data
Spatial shapefiles including healthcare centres, cities, and Dissemination Area
(DA) and Alberta boundaries were obtained from Spatial and Numeric Data Services,
University of Calgary (University of Calgary, 2013). These data were joined with
Statistics Canada 2006 and 2011 census population data by Dissemination Area.
Dissemination Areas (DAs) are defined by Statistics Canada as small, relatively stable
geographic units with a population of between 400 and 700 persons (Statistics Canada –
Census Dictionary, 2014).
6.3.2.2 Analysis

98
DA centroids (latitude and longitude coordinates) with joined census population
data were selected by location within their corresponding <15-minute, <75-minute, <165-
minute, or >165-minute transport time service area in ArcGIS ArcMap for examination.
Proportions of the population deemed to have potential geographic access were obtained
by summing the total population ≥20-years for each service area and dividing by the total
population ≥20-years for Alberta.
6.3.3 Realized Access: Administrative Data Stroke Events
6.3.3.1 Data
Alberta Inpatient Discharge Abstract data (CIHI – DAD, 2013) and Ambulatory
Care data (CIHI – NACRS, 2013) that includes ED visits for fiscal years 2002/03 to
2007/08 inclusive were linked and all personal identifiers removed. New stroke events
aged ≥ 20-years with an ICD-10 (WHO - ICD-10, 2013) diagnosis of I63 (cerebral
infarction), H34 (retinal arterial occlusion), I64 (stroke not specified as hemorrhage or
infarction); I60 (subarachnoid hemorrhage - SAH); I61 (intracerebral hemorrhage - ICH);
or G45 (Transient Ischemic Attack - TIA) were included (n = 21,886). ICD-10 I64 (not
specified as hemorrhage or infarction) was coded with I63 and H34 as ischemic stroke
based on the assumption that 87% of strokes are ischemic and 17% are hemorrhagic
(CDC – Stroke Facts, 2014). A new stroke event was identified as follows. If multiple
visits for the same patient occurred within 48-hours, the most serious event was selected
(ICH > SAH > ischemic > TIA). If multiple visits within 48-hours were of the same
stroke type, the first event was selected because any treatment(s) received during the first
health encounter could alter the patient’s risk profile prior to the second encounter

99
(Jeerakathil et al., 2010). Persons without a health care number and/or a valid Alberta
postal code were also excluded.
6.3.3.2 Predicted and Realized Geographic Access to Stroke Care
Documented postal codes of stroke events (proxy for place of residence and
location of stroke) were converted to latitude and longitude coordinates using the 2006
and 2011 Postal Code Conversion Files (Statistics Canada – PCCF, 2013) and imported
into ArcGIS ArcMap 10.0 (ESRI – ArcMap 10.0, 1999-2000). Stroke event points were
selected by location within their corresponding <15-minute, 15 to 75-minute, 75 to 165-
minute, or >165-minute transport time service area. These events were considered to
have predicted geographic access to acute stroke care within our defined critical OTT
times based on the interval times described earlier. Stroke events identified as having
predicted geographic access who presented to a CSC or PSC for care were deemed to
have realized access and proportions were calculated for each transport time service area.
Lack of interval time data in our administrative database precluded an analysis of
whether realized access to care was timely.
6.3.4 Characteristics of Populations Within and Outside of Critical Transport Time
Service Areas.
Administrative data stroke events for 2002/03 to 2007/08 were selected in ArcGIS
ArcMap by location of residence within their corresponding <75-minute, 75 to 165-
minute, or >165-minute transport time service area based on 2010 stroke infrastructure.
Characteristics of events were then summarized by transport time service area according
100
to stroke type, risk factors, EMS transport, disposition, and urban/rural residence using
the postal code definition (du Plessis et al., 2002).
6.4 Results
6.4.1 Concordance of GIS Predicted Versus Observed EMS Ground Transport Times.
GIS-predicted EMS ground transport time using Network Analyst Route analysis was
reliably correlated with observed EMS transport times. Predicted time was 70% of actual
time plus 2.1 minutes (Figure 6.2). Absolute time differences were small with a median
difference in minutes of 1.95 minutes (IQR 5.87). Of EMS transports with a >10-minute
difference (n = 33), 63.6% occurred in winter months and 51.5% during peak morning
and afternoon rush hour traffic periods. Of patients with EMS transport times shorter
than predicted in Network Analyst (n = 6), 5 were transported from towns located outside
of Calgary. There was slight discrepancy between GIS Network Analyst Service Area
analysis predicted transport time service areas originating from the CSC at 5-minute
ground transport time intervals and actual EMS transport times (Figure 6.3). Variation
occurred at shorter distances to the CSC and was <6-minutes in 80% of stroke events.
6.4.2 Predicted Geographic Access: Regional Data From Statistics Canada 2006 and
2011 Census.
The increase in geographic extent of transport time service areas based on 2002,
2007, and 2010 stroke infrastructure is shown in Map 6.1. There is overlap of service
areas in central and southern Alberta. Based on stroke infrastructure in 2002 and 2007

101
0
25
50
75
100
125
150
Pre
dic
ted
tra
vel tim
e u
sin
g R
oute
Ana
lysi
s (
min
ute
s)
0 25 50 75 100 125 150
EMS transport time to CSC (minutes)
GIS predicted EMS transport time = 0.70 * actual EMS transport time + 2.1 minutes
Figure 6.2. Scatter plot of Network Analyst Route Analysis predicted transport
times and observed EMS transport times. GIS-predicted EMS transport times were
highly linearly related to observed EMS transport times.
0
10
20
30
40
50
60
70
80
90
100
Pe
rce
nt
10 20 30 40 50 60 70 80 90 100 110 120 130 140 150 160 170 180CSC
Service Area (SA) Distance from CSC (minutes)
EMS transport > SA time EMS transport 6+ min > SA time
Figure 6.3 Association between actual EMS ground transport times and Network
Analyst Service Areas at 5-minute intervals from the CSC. The greatest variation
occurred within a 10-minute drive time of CSC.
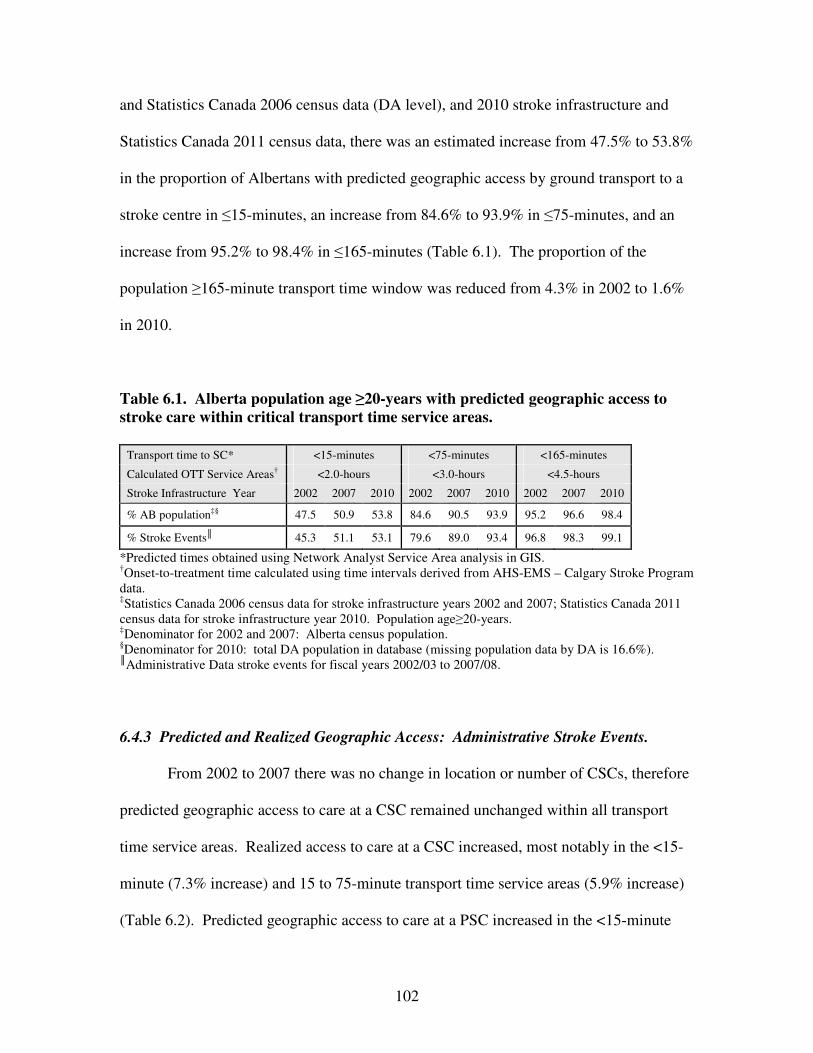
102
and Statistics Canada 2006 census data (DA level), and 2010 stroke infrastructure and
Statistics Canada 2011 census data, there was an estimated increase from 47.5% to 53.8%
in the proportion of Albertans with predicted geographic access by ground transport to a
stroke centre in ≤15-minutes, an increase from 84.6% to 93.9% in ≤75-minutes, and an
increase from 95.2% to 98.4% in ≤165-minutes (Table 6.1). The proportion of the
population ≥165-minute transport time window was reduced from 4.3% in 2002 to 1.6%
in 2010.
Table 6.1. Alberta population age ≥20-years with predicted geographic access to
stroke care within critical transport time service areas.
Transport time to SC* <15-minutes <75-minutes <165-minutes
Calculated OTT Service Areas† <2.0-hours <3.0-hours <4.5-hours
Stroke Infrastructure Year 2002 2007 2010 2002 2007 2010 2002 2007 2010
% AB populationठ47.5 50.9 53.8 84.6 90.5 93.9 95.2 96.6 98.4
% Stroke Events║ 45.3 51.1 53.1 79.6 89.0 93.4 96.8 98.3 99.1
*Predicted times obtained using Network Analyst Service Area analysis in GIS. †Onset-to-treatment time calculated using time intervals derived from AHS-EMS – Calgary Stroke Program data. ‡Statistics Canada 2006 census data for stroke infrastructure years 2002 and 2007; Statistics Canada 2011 census data for stroke infrastructure year 2010. Population age≥20-years. ‡Denominator for 2002 and 2007: Alberta census population. §Denominator for 2010: total DA population in database (missing population data by DA is 16.6%). ║Administrative Data stroke events for fiscal years 2002/03 to 2007/08.
6.4.3 Predicted and Realized Geographic Access: Administrative Stroke Events.
From 2002 to 2007 there was no change in location or number of CSCs, therefore
predicted geographic access to care at a CSC remained unchanged within all transport
time service areas. Realized access to care at a CSC increased, most notably in the <15-
minute (7.3% increase) and 15 to 75-minute transport time service areas (5.9% increase)
(Table 6.2). Predicted geographic access to care at a PSC increased in the <15-minute

103
Map 6.1. Predicted transport time service areas around Comprehensive and Primary Stroke Centres, 2002 to 2010.
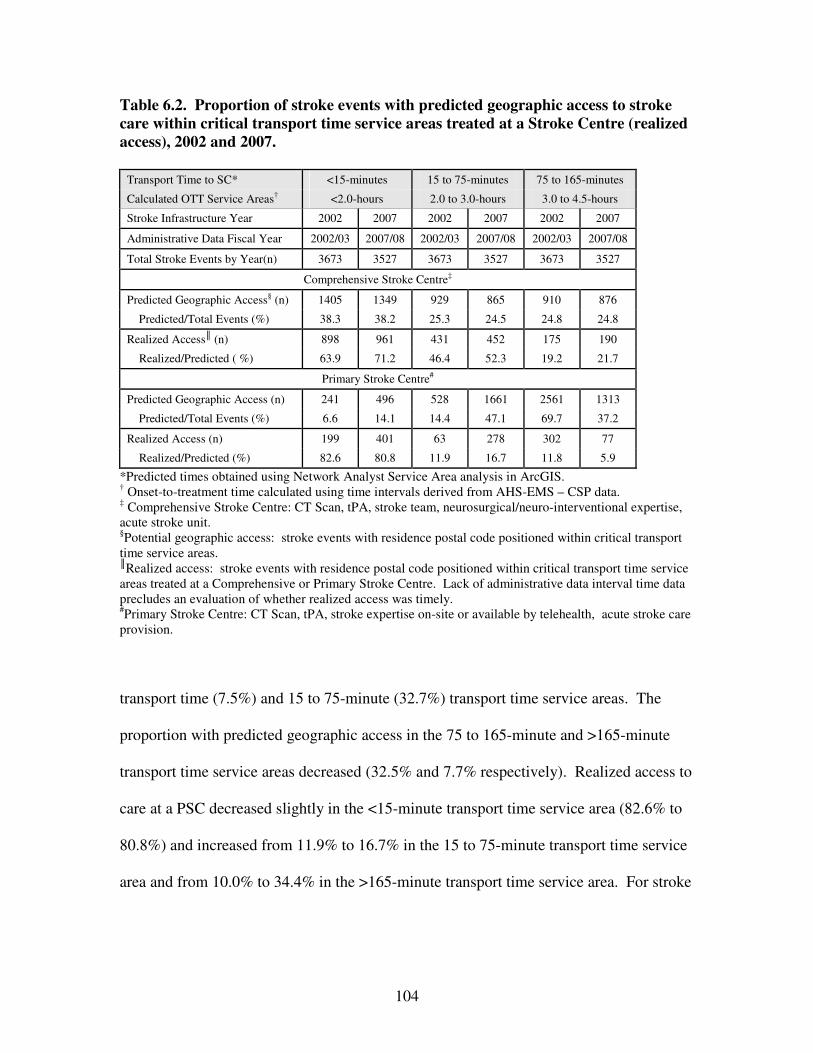
104
Table 6.2. Proportion of stroke events with predicted geographic access to stroke
care within critical transport time service areas treated at a Stroke Centre (realized
access), 2002 and 2007.
Transport Time to SC* <15-minutes 15 to 75-minutes 75 to 165-minutes
Calculated OTT Service Areas† <2.0-hours 2.0 to 3.0-hours 3.0 to 4.5-hours
Stroke Infrastructure Year 2002 2007 2002 2007 2002 2007
Administrative Data Fiscal Year 2002/03 2007/08 2002/03 2007/08 2002/03 2007/08
Total Stroke Events by Year(n) 3673 3527 3673 3527 3673 3527
Comprehensive Stroke Centre‡
Predicted Geographic Access§ (n) 1405 1349 929 865 910 876
Predicted/Total Events (%) 38.3 38.2 25.3 24.5 24.8 24.8
Realized Access║ (n) 898 961 431 452 175 190
Realized/Predicted ( %) 63.9 71.2 46.4 52.3 19.2 21.7
Primary Stroke Centre#
Predicted Geographic Access (n) 241 496 528 1661 2561 1313
Predicted/Total Events (%) 6.6 14.1 14.4 47.1 69.7 37.2
Realized Access (n) 199 401 63 278 302 77
Realized/Predicted (%) 82.6 80.8 11.9 16.7 11.8 5.9
*Predicted times obtained using Network Analyst Service Area analysis in ArcGIS. † Onset-to-treatment time calculated using time intervals derived from AHS-EMS – CSP data. ‡ Comprehensive Stroke Centre: CT Scan, tPA, stroke team, neurosurgical/neuro-interventional expertise, acute stroke unit. §Potential geographic access: stroke events with residence postal code positioned within critical transport time service areas. ║Realized access: stroke events with residence postal code positioned within critical transport time service areas treated at a Comprehensive or Primary Stroke Centre. Lack of administrative data interval time data precludes an evaluation of whether realized access was timely. #Primary Stroke Centre: CT Scan, tPA, stroke expertise on-site or available by telehealth, acute stroke care provision.
transport time (7.5%) and 15 to 75-minute (32.7%) transport time service areas. The
proportion with predicted geographic access in the 75 to 165-minute and >165-minute
transport time service areas decreased (32.5% and 7.7% respectively). Realized access to
care at a PSC decreased slightly in the <15-minute transport time service area (82.6% to
80.8%) and increased from 11.9% to 16.7% in the 15 to 75-minute transport time service
area and from 10.0% to 34.4% in the >165-minute transport time service area. For stroke
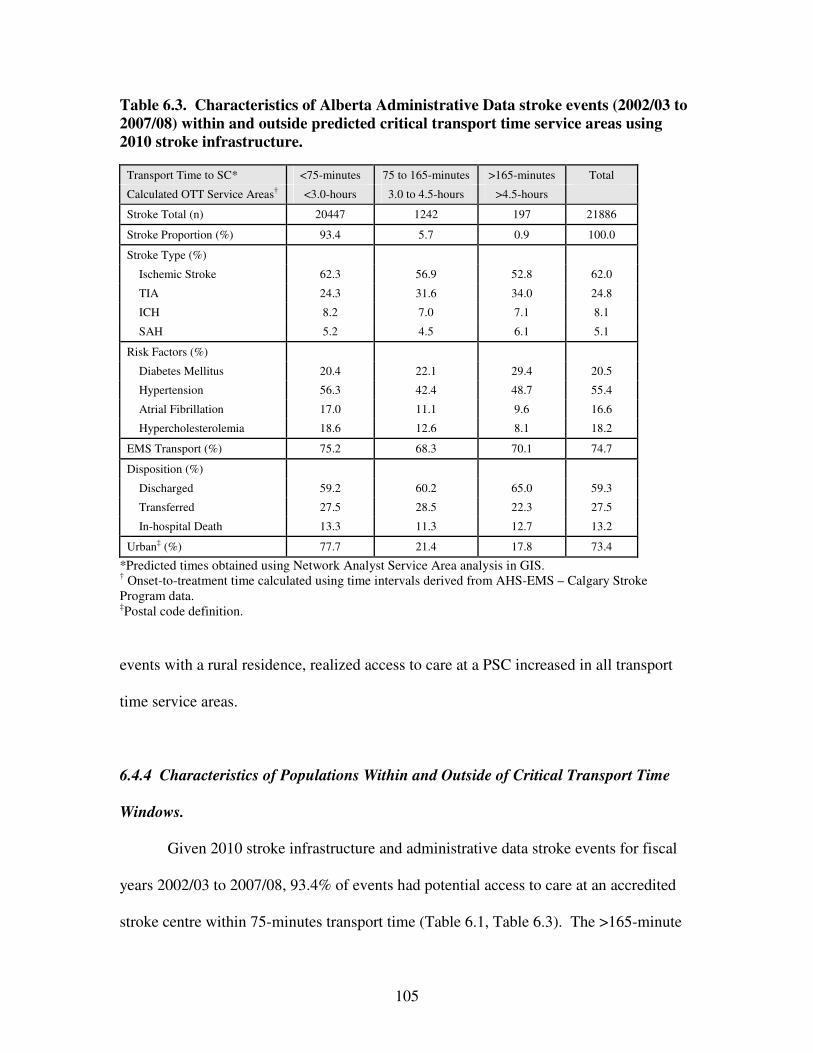
105
Table 6.3. Characteristics of Alberta Administrative Data stroke events (2002/03 to
2007/08) within and outside predicted critical transport time service areas using
2010 stroke infrastructure.
Transport Time to SC* <75-minutes 75 to 165-minutes >165-minutes Total
Calculated OTT Service Areas† <3.0-hours 3.0 to 4.5-hours >4.5-hours
Stroke Total (n) 20447 1242 197 21886
Stroke Proportion (%) 93.4 5.7 0.9 100.0
Stroke Type (%)
Ischemic Stroke 62.3 56.9 52.8 62.0
TIA 24.3 31.6 34.0 24.8
ICH 8.2 7.0 7.1 8.1
SAH 5.2 4.5 6.1 5.1
Risk Factors (%)
Diabetes Mellitus 20.4 22.1 29.4 20.5
Hypertension 56.3 42.4 48.7 55.4
Atrial Fibrillation 17.0 11.1 9.6 16.6
Hypercholesterolemia 18.6 12.6 8.1 18.2
EMS Transport (%) 75.2 68.3 70.1 74.7
Disposition (%)
Discharged 59.2 60.2 65.0 59.3
Transferred 27.5 28.5 22.3 27.5
In-hospital Death 13.3 11.3 12.7 13.2
Urban‡ (%) 77.7 21.4 17.8 73.4
*Predicted times obtained using Network Analyst Service Area analysis in GIS. † Onset-to-treatment time calculated using time intervals derived from AHS-EMS – Calgary Stroke Program data. ‡Postal code definition.
events with a rural residence, realized access to care at a PSC increased in all transport
time service areas.
6.4.4 Characteristics of Populations Within and Outside of Critical Transport Time
Windows.
Given 2010 stroke infrastructure and administrative data stroke events for fiscal
years 2002/03 to 2007/08, 93.4% of events had potential access to care at an accredited
stroke centre within 75-minutes transport time (Table 6.1, Table 6.3). The >165-minute
106
transport time service area had the highest proportion of documented TIA (34.0% versus
24.8% for the dataset) and SAH (6.1% versus 5.1% for the dataset) (Table 6.2). ICH was
highest (8.2%) in the <75-minute transport time service area. The proportion with
documented diabetes mellitus (DM) was highest in the >165-minute transport time
service area (29.4% versus 20.5% for the dataset), and hypertension, atrial fibrillation,
and hypercholesterolemia were highest in the <75-minute transport time service area
(56.3%, 17.0%, and 18.6% respectively). EMS transport was highest in the <75-minute
transport time service area (75.2%) and lowest in the 75 to 165-minute transport time
service area (68.3%). The proportion of strokes discharged from hospital was highest in
the >165-minute transport time service area (65.0%), the proportion transferred was
highest in the 75 to 165-minute transport time service area (28.5%), and in-hospital
mortality was similar across all transport time service areas.
6.5 Discussion
6.5.1 Principal Findings
The principal findings of this study were: (1) GIS methods can be used to predict
actual EMS ground transport time, (2) the implementation of a provincial stroke strategy
and addition of 6 new PSCs over a 5-year interval resulted in a 40.2% increase in the
number of Albertans with shortened transport times and estimated access to tPA in under
3 hours, and (3) there is a marked difference in the potential for early reperfusion therapy
between those living in rural versus urban locations. The implications of this work are
that potential (predicted) access does not necessarily equate with utilization of services
and that maximum utilization of expanded geographic access should be supported by

107
stroke protocols, policies, and education. In 2007, Alberta had near population-wide
coverage for acute stroke care access based upon its geography and population
distribution. The proportion of stroke patients who had realized access to care at a stroke
centre within a 165-minute transport time increased to 68% by 2007. The rural stroke
population made significant gains in realized access to CSC and PSC care during this
time period.
6.5.2 Concordance of GIS Predicted Versus Observed EMS Ground Transport Times.
Minimal variation was observed between predicted GIS transport times using
Network Analyst Route Analysis (Figure 6.2) and Service Area analysis (Figure 6.3) and
observed EMS transport times. Dispatch-to-scene, scene, and scene-to-CSC interval
times are similar to those in the literature (Kleindorfer et al., 2006; Patel et al., 2012).
GIS predicted AHS EMS transport distances ranged from 0.99-kilometres to 201.79-
kilometres. Winter season and rush hour traffic times were factors in longer than
predicted transport times. Shorter than predicted transport times occurred most often in
transports originating outside of Calgary city limits. ‘Lights and Siren’ transport speeds
and enhancements to road networks not yet incorporated into Street Network data may
have been factors in shorter travel times. Because EMS transports occurred over a period
of years, during all seasons and hours of the day, over varied terrain, and because
minimal variation between actual EMS transport times and GIS predicted transport time
service areas was observed, it was concluded that predicted transport time service areas
could be generated around CSCs and PSCs for the province that reflected actual ground
transport times with reasonable accuracy.

108
6.5.3 Predicted Geographic Access: Regional Data From Statistics Canada 2006 and
2011 Census.
The addition of 11 PSCs by 2010 for a total of 14 PSCs and 2 CSCs and
concomitant extension of stroke centre service area coverage translated into a greater
proportion of Albertans having predicted geographic access to care a stroke centre by
ground transport within critical transport time windows based on median time intervals
derived from the dataset (Table 6.1, Map 6.1). The analysis predicted that given
Statistics Canada 2011 census data and 2010 stroke infrastructure, 53.8% of the
population would have predicted access to care at stroke centre within the <15-minute
transport time service area (OTT time of <2.0-hours) and 98.4% would have predicted
geographic access to care within a ≤165-minute transport time (OTT time of <4.5-hours).
The region outside of the 165-minute transport time service area is rural and less densely
populated, and has a more limited transportation infrastructure. Limited geographic
access to stroke prevention services and greater travel distances to stroke centres may be
important contributing factors to stroke risk, morbidity, and in-hospital mortality.
Overlap of CSC and PSC transport time service areas was found in central and
southern Alberta (Map 6.1). Pre-hospital decision-making regarding transport destination
for acute stroke may become more complex when PSCs and CSCs are within close
geographic proximity. Recommendations for stroke care include that a patient with
stroke presentation be transported to the nearest stroke centre for evaluation (Acker et al.,
2007). Rapid interfacility transport protocols should be in place for the subset of stroke
population transported to a PSC who do not recanalize with IV thrombolysis and/or who
require endovascular treatment in order to avoid delays that may preclude a patient from
109
receiving intra-arterial treatment. Prabhakaran et al. (2011) found that odds of emergent
angiography decreased by 3% per minute delay of interfacility transport beyond 46-
minutes (lowest limit in their study). In Alberta, EMS practitioners have a specific stroke
protocol and screening tool that sanction when to transport to the nearest PSC or CSC.
As required, practitioners may consult “Online Medical Control” where a dedicated ED
physician assists with decision-making and may authorize the bypass of a healthcare
facility if patients do not meet guidelines outlined by protocol (Greg Vogelaar,
unpublished data, 2014).
6.5.4 Predicted and Realized Geographic Access: Administrative Data Stroke Events.
The analysis of administrative data stroke events (2002/03 to 2007/08) yielded
similar findings to those found using Statistics Canada census data (Table 6.1). From
2002 to 2010, the proportion of stroke events with predicted geographic access in the
<15-minute, 15 to 75-minute, and 75 to 165-minute transport time service areas
increased. The proportion of stroke events outside the 165-minute transport time service
area decreased from 3.2% to 0.9% (Table 6.2).
From 2002 to 2007, predicted geographic access to care at a CSC was unchanged
within all transport time service areas yet realized access to care increased, most notably
within the <15-minute and 15 to 75-minute service areas (Table 6.2). This increase may
have reflected the expanded adoption of a standardized EMS stroke screen tool, direct
transport protocols, and stroke education campaigns. From 2002 to 2007, predicted
geographic access to care at a PSC increased in the <15-minute and 15 to 75-minute
transport time service areas and decreased in the 75 to 165-minute and >165-minute

110
transport time service areas. The addition of 6 stroke centres by 2007 extended <15-
minute and 15 to 75-minute transport time service areas incorporating more densely
populated regions, and the 75 to 165-minute and >165-minute transport time service
areas incorporated less densely populated territory resulting in a reduction in the
proportion of the population with predicted geographic access in the latter two transport
time service areas. Realized access to care at a PSC in the <15-minute transport time
service area decreased from 82.6% to 80.8% likely as a result of increased transports to
CSCs or variation in residence of the 2002 and 2007 stroke populations, and increased
from 11.9% to 16.7% in the 15 to 75-minute transport time service area. This service
area experienced the largest increase in predicted geographic access to care at a stroke
centre (from 14.4% to 47.1%) and a disproportionately lower increase in realized access
leaving potential for enhanced utilization. Expansion of PSC coverage, increased use of
EMS for transport, and direct transport protocols would have important roles in the
increased number of Albertans receiving care at an accredited stroke centre over time.
6.5.5 Characteristics of Populations Within and Outside of Critical Transport Time
Windows.
A higher proportion of stroke events in the <15-minute transport time service area
were ischemic stroke (Table 6.3) and a higher proportion of stroke events outside of the
165-minute transport time service area were TIA and SAH. Differences in access to MRI
(Kidwell et al., 1999), investigator expertise, and extent of investigation as well as urban-
rural differences in the coding accuracy of TIA versus ischemic stroke (Kokotailo & Hill,
2005) may partially explain the variation in ischemic stroke versus TIA diagnosis. Stroke
111
events outside of the 165-minute transport time service area were younger, a higher
proportion were male, had diabetes mellitus, accessed care at a PSC (compared to the 3.0
to 4.5-hour service area), and were discharged from hospital. Fewer stroke events in this
transport time service area had documented hypertension, atrial fibrillation or
hypercholesterolemia; conditions which are more likely to occur at a more advanced age.
Air medevacs can reduce transport times for stroke patients residing at greater
distances from SC care or at locations that are more difficult to access by ground
transport. Air medevac transport patterns for stroke related events are shown in Map 6.2.
Of the 66 air medevac origins, 39% were located within the <15-minute transport time
service area, 59% within the <75-minute, and 100% within <165-minute transport time
service areas. Rotary and fixed wing transports did not service geographically remote
events (with respect to access to a SC by ground transport within critical time windows).
Rather, they may have serviced events with prolonged onset-to-dispatch times who
required reduced transport times in order to meet critical OTT time windows.
6.6 Study Implications
Strengths of this research include the availability of AHS EMS - CSP matched
data that enabled the calculation of precise interval times and assessment of the
correlation between GIS predicted times and observed EMS transport times. Variation
between GIS Network Analyst Service Area analysis predicted transport time service
areas and actual EMS transport times was minimal (<6-minutes in 80% of transports) and
occurred at shorter distances from the CSC likely due in part to traffic congestion on
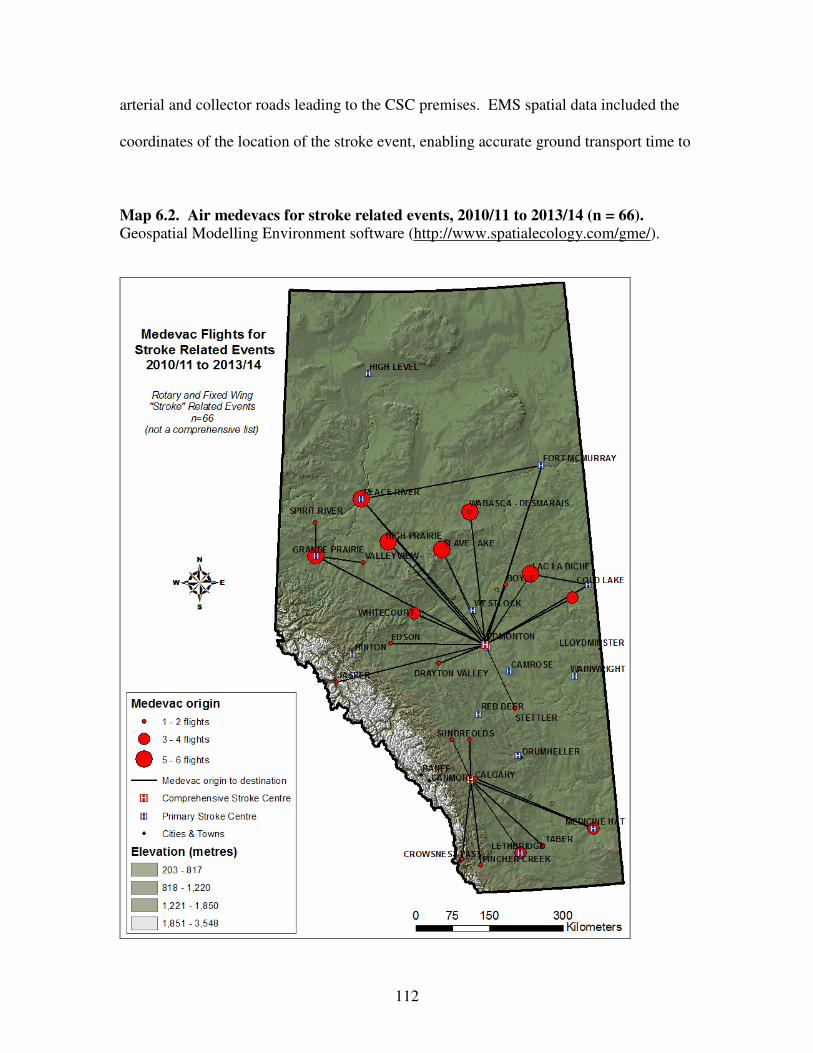
112
arterial and collector roads leading to the CSC premises. EMS spatial data included the
coordinates of the location of the stroke event, enabling accurate ground transport time to
Map 6.2. Air medevacs for stroke related events, 2010/11 to 2013/14 (n = 66).
Geospatial Modelling Environment software (http://www.spatialecology.com/gme/).
113
CSC calculations. These types of EMS data for stroke are sparsely available in the
literature, and interval times for other acute health events may not be generalizable to
acute stroke. Onset-to-dispatch times for stroke may be prolonged due to aphasia,
inability to access a phone, or if onset occurs during the night (there is no pain to awaken
the patient). Scene times may be prolonged if the patient is physically unable to provide
access to health care providers onto the premises. Additional time may be required to
obtain vital information (e.g. contraindications to thrombolysis) and to have family
member accompaniment to support critical decision-making. The availability of more
detailed Street Network data permitted the generation of service areas that more
accurately reflected actual transport times in comparison with other spatial methods (i.e.
buffer analysis). Because GIS predicted times and observed EMS transport times were
well correlated and representative of seasonal and traffic conditions, it was concluded
that predicted transport time service areas for CSCs and PSCs in the province reflected
actual transport times with reasonable accuracy.
The incorporation of spatial methods added dimension and new perspective to our
understanding of the complexities of pre-hospital service provision, of how changes in
service provision can enhance access to healthcare services, and to identify potentially
vulnerable populations. Regions with increased predicted geographic access and
disproportionately low realized access were highlighted. These are regions where
supplemental support of current health services or enhancements to health services could
result in the increased utilization of specialized stroke care and improved outcomes.
6.7 Study Limitations
114
Limitations of this study include that AHS EMS – CSP data interval times were
obtained for AIS patients who were candidates for and received thrombolytic therapy. If
interval times for the Alberta stroke population differed significantly from times in our
AHS EMS – CSP stroke population, the size of transport time service areas could be
significantly altered. For example, a longer onset-to-dispatch time would decrease time
allotted for transport in order to meet critical OTT time windows of 2.0-hours, 3.0-hours
and 4.5-hours in our study, thereby reducing CSC and PSC service area coverage.
Conversely, service area coverage would expand with decreased interval times (e.g. ED
arrival-to-treatment). Delays related to patient or family recognition of stroke systems
and limited use of 9-1-1 services are likely much more important than delays that occur
because of EMS systems and providers (Kleindorfer et al., 2006). There was remarkably
little variation in AHS EMS interval times observed in this study. In this study, the
‘symptom onset-to-dispatch’ time interval had the greatest variation. The implication of
this is that variation in ‘symptom onset-to-dispatch’ time is more likely to alter CSC and
PSC service area coverage and this interval is unaffected by enhancements to pre-hospital
and ED care.
Although proportions of the Alberta population with realized access to care at a
stroke centre were identified, it could not be concluded that care was received within
critical OTT times for good outcome because pre-hospital and interval time data for this
population were lacking. Limitations associated with administrative data and the use of
postal code as proxy for place of residence and location of stroke including inaccurate
documentation of postal code, the postal code may not be current, and the postal code
may not accurately represent the location of the stroke event. Limitations also include

115
errors associated with the collection of Statistics Canada census data including under or
over coverage of specific populations (Statistics Canada – Population Coverage Error,
2013).
There are uncertainties associated with the graphic representation of spatial data
including the positional accuracy of events (Longley et al., 2005). Misclassification of
stroke events within transport time service areas may occur but likely would be non-
differential due to the large sample size. The position of the DA centroid (with joined
census data) may not represent the location of highest population density within the DA
resulting in a misclassification of the population at risk within a transport time service
area.
6.8 Study Conclusion
IV-tPA administered within 1.5-hours of symptom onset is significantly
associated with good outcome. By spatially defining and characterizing populations with
predicted and realized geographic access to acute stroke care within critical OTT time
windows of 2.0-hours, 3.0-hours and 4.5-hours (based on interval times derived from the
study database), an increase in both predicted geographic access and realized access to
care at a stroke centre in Alberta from 2002 to 2007 was demonstrated. By 2010, it is
estimated that 54% of the Alberta population had predicted geographic access to care at a
stroke centre within 2.0-hours of symptom onset. The geographic expansion of stroke
centre coverage associated with the addition of 11 PSCs, widened adoption of a
standardized EMS stroke screen tool and direct transport protocols, and stroke awareness
campaigns have had an important role in the increased utilization of specialized stroke
116
care in Alberta at a population level. Increased utilization has been demonstrated at the
individual level where the proportion of patients with a discharge diagnosis of ischemic
stroke who received IV thrombolysis increased from 8.6% to 11.3% across Alberta by
2007 (Jeerakathil et al., 2010). Stroke awareness campaigns should be ongoing as it is
imperative that EMS services be utilized for stroke and that onset-to-dispatch time
intervals be kept to a minimum.
A reanalysis using current data for all ischemic stroke events for the province
would more accurately reflect predicted and realized geographic access to (hyper)acute
stroke care, utilization of specialized stroke care services, and outcomes. A more
accurate assessment of how geographic access has changed in accordance with the
provincial initiative to enhance stroke care could be carried out. Future research might
also include a location-allocation (optimization technique) analysis of SPCs and SCs to
minimize impedance (time and distance), maximize coverage, minimize the number of
facilities required, and maximize attendance. An analysis of the spatial distribution of
OTT time intervals using density surface or interpolation maps (Map 7.2) would inform
potential courses of action to reduce times and increase the number of events who meet
critical treatment time windows.
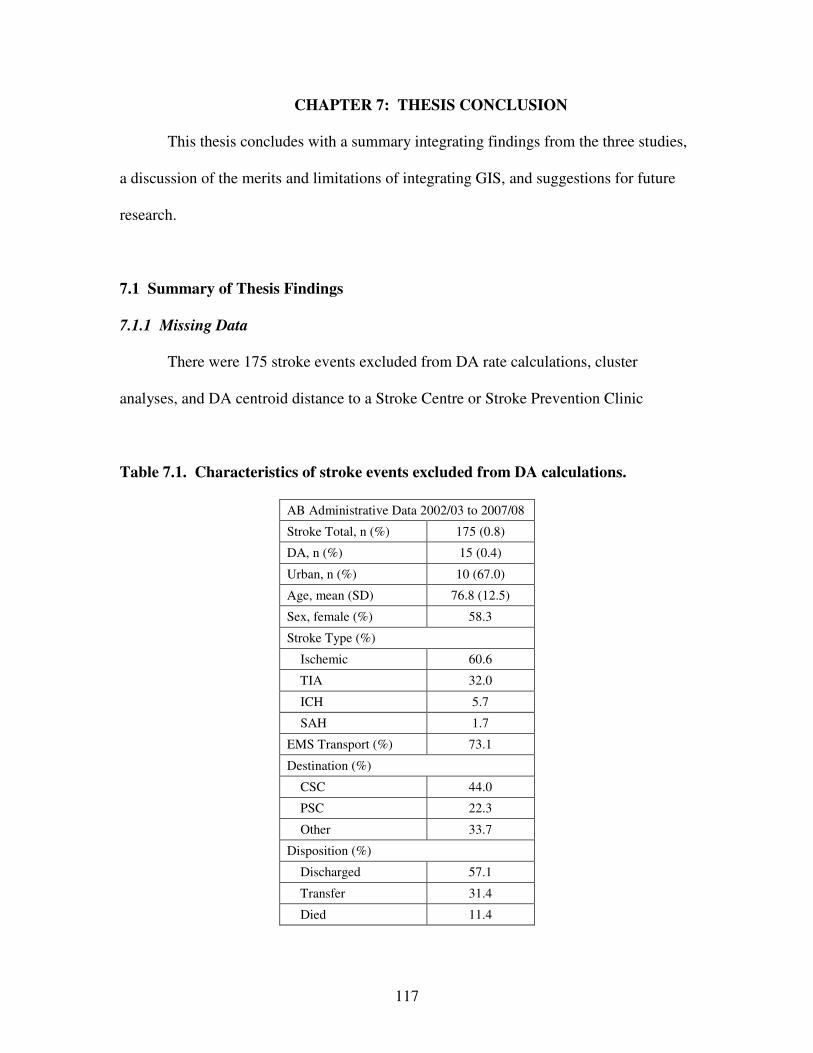
117
CHAPTER 7: THESIS CONCLUSION
This thesis concludes with a summary integrating findings from the three studies,
a discussion of the merits and limitations of integrating GIS, and suggestions for future
research.
7.1 Summary of Thesis Findings
7.1.1 Missing Data
There were 175 stroke events excluded from DA rate calculations, cluster
analyses, and DA centroid distance to a Stroke Centre or Stroke Prevention Clinic
Table 7.1. Characteristics of stroke events excluded from DA calculations.
AB Administrative Data 2002/03 to 2007/08
Stroke Total, n (%) 175 (0.8)
DA, n (%) 15 (0.4)
Urban, n (%) 10 (67.0)
Age, mean (SD) 76.8 (12.5)
Sex, female (%) 58.3
Stroke Type (%)
Ischemic 60.6
TIA 32.0
ICH 5.7
SAH 1.7
EMS Transport (%) 73.1
Destination (%)
CSC 44.0
PSC 22.3
Other 33.7
Disposition (%)
Discharged 57.1
Transfer 31.4
Died 11.4

118
Map 7.1. Dissemination Areas with strokes and unavailable Statistics Canada
census data.
calculations due to unavailable Statistics Canada census data for 15 Dissemination Areas.
Characteristics of this population are shown in Table 7.1 and Map 7.1.
7.1.2 Thesis Conclusions
Geographic distributions of stroke and mortality in Alberta from 2002/03 to
2007/08 were not random and varied according to stroke type. Ischemic stroke and TIA
hot spots were associated with increased distance from a SPC; in contrast, ICH and SAH

119
hot spots were inversely associated with distance from a SPC. There was higher odds of
in-hospital mortality after stroke with longer drive times to a Stroke Centre. ICH and
SAH stroke types, NIDDM, atrial fibrillation, and non-EMS transport were also
associated with higher odds of mortality. Recurrent stroke was associated with a longer
drive time from a SPC. Odds of recurrent stroke were also higher for males, TIA stroke
type, NIDDM, atrial fibrillation and transport to a non-Stroke Centre.
Health services before admission to hospital affected outcome. Proximity to a
SPC reduced the odds of having a recurrent stroke event. EMS transport and transport to
a CSC were associated with reduced odds of mortality. This is despite the unique
challenges for EMS related to the geographical expanse of the province and realities of
rural and remote coverage and despite CSCs receiving more severe strokes.
It was expected that DAs within high clusters of stroke and mortality would have
a higher proportion of documented risk factors but this was not the case for all stroke
types. This finding may be related to differing risk distributions, regional differences in
the coding of risk factors and the type (a diagnosis bias) and quality of care that is
associated with having a documented risk factor.
GIS methods can be used to predict actual EMS ground transport time. The
addition of 6 PSCs over a 5-year time period accompanied by the widened adoption of a
standardized EMS stroke screen tool and direct transport protocols resulted in a greater
proportion of Albertans having predicted geographic access to care at a stroke centre by
ground transport within critical time windows based on median time intervals derived
from the dataset. This coincides with individual level data demonstrating increased
frequency of administration of thrombolysis for AIS.

120
There was a marked difference between documented risk factors for urban and
rural areas (Table 7.2). There was also a marked difference in the potential for early
reperfusion therapy between those living in rural versus urban locations. Discrepancy
was higher between predicted geographic access and realized access to stroke care at a
PSC within the 15 to 75-minute transport time service area. Use of EMS for transport
and direct transport protocols would likely increase utilization of PSCs.
Table 7.2 Urban-rural proportions of stroke events with a documented risk factor.
Proportion of Events (%) Urban Rural
IDDM 1.07 1.28
NIDDM 19.70 18.63
Hypertension 58.35 47.09
Atrial Fibrillation 17.59 13.95
Hypercholesterolemia 19.99 12.92
Given that the ‘symptom onset-to-dispatch’ is more likely to alter CSC and PSC
service area coverage and that this interval is unaffected by enhancements to pre-hospital
and ED care, public stroke awareness campaigns (prevention, recognition of stroke
symptoms, dialing 9-1-1 for symptoms of stroke) should be ongoing.
7.2 Merits and Limitations of Integrating GIS in Stroke Research
7.2.1 Merits of Integrating GIS
The merits of incorporating GIS technology in this research included the capacity
to join individual level and administrative area level data, data storage and retrieval, the
generation of maps and diagrams (e.g. spider), and facilitation of exploratory spatial
analyses including cluster analysis, network analysis, and service area analysis.

121
Available tools used in the analyses included selection, extraction, overlay and proximity.
GIS and software capabilities extend far beyond what was used for this research and,
providing that spatial data are available, support original evidence-based complex
analyses.
The opportunity to visualize patterns of stroke and mortality in map format as
they relate to terrain, SPC and SC locations, cities, and transportation infrastructure
augments current understanding of stroke as a health problem in Alberta and highlights
the complexities of providing pre-hospital and emergent care.
GIS and spatial methods are well suited for analyses that involve adverse health
states (including stroke) that are time critical. An assessment of geographic access to
care that did not incorporate a spatial component would be incomplete. GIS can be used
to assess spatial relationships between geographic access to care, health care utilization,
and health outcomes.
Spatial analysis can support a variety of study types in health research including
clinical trials, prospective cohort, and case-control studies. Bias as a result of differential
losses due to attrition can be assessed spatially; if attrition rates are higher for participants
who reside at greater distances from health care, and time to health care is significantly
associated with outcome, bias may be introduced into the study. If low income
neighbourhoods are under-represented in clinical trials, findings may not be generalizable
to a particularly vulnerable population. Cases and controls in a case-control study can be
assessed for differences in characteristics with regard to the populations from which they
are drawn.
122
7.2.2 Limitations of Integrating GIS
There are limitations associated with integrating GIS and spatial methods in
health research including data quality and availability, data sharing and maintaining the
confidentiality of individuals and households (Rushton et al., 2008). Data may only be
available in larger geographic units because of concerns regarding the stability of rates
(particularly for rare outcomes) and/or confidentiality which can limit investigations
relating to healthcare utilization and clinical activity (Boulos, 2004).
Spatial and temporal aggregation of data can preserve data confidentiality and still
permit fine-level analyses with reliable results (Boulos, 2004). However, data
aggregation creates spatial uncertainty. There can be errors in the positioning of objects
(e.g. using area centroids), errors in the attributes associated with the objects, and errors
in modelling spatial variation (Boulos, 2004).
There is the potential for the data display to be misleading and for the
misinterpretation of data (Monmonier, 1991). Data quality, confounding factors and bias
may influence the interpretation of results. Therefore, it is important that robust
statistical methods are used to support thematic data layers in order to avoid visual bias.
The researcher cannot infer causation from correlation, make inferences about individuals
from population data (ecological fallacy), or fail to consider the broader context in which
individual behaviour occurs (atomistic fallacy) (Boulos, 2004).
7.3 Future Research Directions
Suggestions for future research include the following:

123
(1) a cluster analysis of spatially smoothed stroke (by type) and mortality rates over time
to assess the spatial migration of clusters and potential associations with enhancements to
preventive, pre-hospital, and SC care;
(2) a more localized and detailed examination of the mortality hot spot;
(3) a reanalysis of predicted and realized access to preventive and acute stroke care using
current data to inform whether geographic access to acute stroke care is (more) equitable
and whether mortality clusters have been reduced in size or eliminated. Potential
associations with alterations to the provision of pre-hospital and ED care could be
examined;
(4) a location-allocation (optimization technique) analysis of SPCs and SCs to minimize
impedance, maximize coverage, minimize the number of facilities required, and
maximize attendance;
(5) an analysis of the spatial distribution of OTT time intervals using density surface or
interpolation maps (Map 7.2) to inform potential courses of action to reduce interval
times and increase the number of events who meet critical treatment time windows; and
(6) a multi-level spatial analysis that provides the ability to examine the dual complexity
of compositional (individual level) and contextual (neighbourhood level) predictors on
stroke and stroke mortality using geographically weighted regression techniques.
Predictors might include population proclivity to seek preventive care, the efficacy of
preventive care, and differentials with respect to meeting thrombolysis criteria if
geocoded linked EMS, ED, in-hospital, and administrative and pharmaceutical data were
available for all patients assessed at a SPC and/or admitted to hospital in Alberta with a
diagnosis of stroke. Novel neighbourhood predictors might include proximity to

124
environmental pollutants (particulate matter), smoking rates, drug use, crime rates, public
transportation infrastructure, access to healthy foods, access to green spaces, and distance
to specialized stroke care. GIS technology enables the linking of individual data with
contextual information and aggregated ecologic predictors for the preparation of multi-
level spatial models to better evaluate and distinguish biological, contextual and
ecological effects (16).
Map 7.2. EMS interval times using Inverse Distance Weighted (IDW) technique.
In this research, the identification of a mortality hot spot, urban-rural differences
in clustering of reported risk factors, regional variations in realized access to stroke care,
and populations with predicted access to care that is outside of critical transport time
areas suggest that there may be inequities that warrant further investigation.

125
References
Abbott RD, Donahue RP, MacMahon SW, Reed DM, Yano K. Diabetes and the
Risk of Stroke. The Honolulu Heart Program. JAMA. 1987; 257(7): 949-952.
Acker JE, Pancioli A, Crocco TJ, Eckstein MK, Jauch EC, Larrabee H, Meltzer N
M, Mergendahl WC, Munn JW, Prentiss SM, Sand C, Saver JL, Eigel B, Gilpin BR,
Schoeberl M, Solis P, Bailey JR, Horton KB, Stranne SK.. Implementation strategies for
emergency medical services with stroke systems of care: A policy statement from the
American Heart Association/American Stroke Association expert panel on emergency
medical services systems and the Stroke Council. A Summary Policy Brief. Stroke.
2007; 38: 3097-3115.
Addo J, Ayerbe L, Mohan KM, Crichton S, Sheldenkar A, Chen R et al.
Socioeconomic Status and Stroke: An Updated Review. Stroke. 2012; 43: 1186-1191.
Albers GW, Caplan LR, Easton JD, Fayad PB, Mohr JP, Saver JL, Sherman DG,
TIA Working Group. Sounding Board. Transient Ischemic Attack – Proposal for a New
Definition. N Engl J Med. 2002; 347: 1713-16.
Alberta Health and Wellness (AHW). Emergency Medical Services Provincial
Medical Protocols: Adult and Pediatric. 2012. http://www.albertahealthservices.ca/hp/if-
hp-ems-mcp.pdf.
Alberta Health and Wellness (AHW). Health Trends in Alberta: A Working
Document, Surveillance and Environmental Health Branch, Edmonton, 2007.
http://www.health.alberta.ca/documents/Trends-2007-Health.pdf.
Alberta Health and Wellness (AHW). Interactive Health Data Application
(IHDA). http://www.ahw.gov.ab.ca/IHDA_Retrieval/. Accessed October 2014.
126
Alberta Health and Wellness (AHW). Stroke – Age-Standardized Occurrence
Rate. Alberta Interactive Health Data Application.
http://www.ahw.gov.ab.ca./IHDA_Retrieval/selectSubCategory.do. Accessed October
2014.
Alberta Health Services (AHS). RAAPID.
http://www.albertahealthservices.ca/facilities.asp?pid=saf&rid=1059504. Accessed
October 2014.
Alberta Health Services (AHS). Technology (telestroke) critical in timely stroke
treatment. http://www.albertahealthservices.ca/717.asp. Accessed December 2014.
Alberta Provincial Stroke Strategy (APSS). Alberta Provincial Stroke Strategy
Stroke Blueprint Report of Phase I. May 15, 2006.
http://www.strokestrategy.ab.ca/PDFs/APSS_Blueprint.pdf.
Alberta Provincial Stroke Strategy (APSS). Improving Stroke Care Across
Alberta. http://www.albertahealthservices.ca/3914.asp. Accessed December 2014.
American Heart Association (AHA). Stroke.
http://www.americanheart.org/presenter.jhtml?identifier=4755. Accessed September
2014.
Andersen RM. Revisiting the Behavioral Model and Access to Medical Care:
Does It Matter? Journal of Health and Social Behavior. 1995; 36: 1-10.
Acharya AB, Nyirenda JC, Higgs GB, Bloomfield MS, Cruz-Flores S, Connor
LT, Lee JM, Leet TL. Distance From Home to Hospital and Thrombolytic Utilization for
Acute Ischemic Stroke. J of Stroke and Cerebrovas Dis. 2011; 20(4): 295-301.

127
Beyer KMM, Tiwari C, Rushton G. Five Essential Properties of Disease Maps.
Annals of the Association of American Geographers. 2012; 102: 1067-1075.
Birdsell J, Omelchuk K, Skanes V. Mapping the Terrain. An Environmental
Scan of Gaps and Opportunities in Stroke Research and its Use. 2007.
http://www.hsf.ca/research/images/PDF/hsf_strokegapsenvironmentalscan_eng.pdf.
Accessed June 2010.
Birkmeyer JD. Primer on Geographic Variation in Health Care. Effective
Clinical Practice, Volume 4, Number 5, September/October 2001.
Bisby M, Campbell M. Expanding Telestroke in Canada. September 2012.
https://otn.ca/sites/default/files/files/Telestroke-Report(2).pdf.
Boulos MN. Towards evidence-based, GIS-driven national spatial health
information infrastructure, and surveillance services in the United Kingdom.
International Journal of Health Geographics. 2004; 3: 1-50.
Bow CJ, Waters NM, Faris PD, Seidel JE, Galbraith PD, Knudtson ML, Ghali
WA. Accuracy of city postal code coordinates as a proxy for location of residence.
International Journal of Health Geographics. 2004, 3(1): 5.
Brisman JL, Song JK, Newell DW. Cerebral Aneurysms. N Engl J Med. 2006;
355: 928-39.
Brown AF, Liang L, Vassar SD, Stein Merkin S, Longstreth Jr WT, Ovbiagele B
et al. Neighborhood socioeconomic disadvantage and mortality after stroke. Neurology.
2013; 80: 520-527.
128
Buescher PA. Age-Adjusted Death Rates. Statistical Primer. State Center for
Health Statistics. Raleigh, NC: North Carolina Department of Health and Human
Services. August 1998: 1-11.
Centers for Disease Control and Prevention (CDC). A Look Inside Food Deserts.
http://www.cdc.gov/Features/FoodDeserts/. Accessed December 2014.
Centers for Disease Control and Prevention (CDC). Stroke Facts.
http://www.cdc.gov/stroke/facts.htm. Accessed October 2014.
Canadian Institute for Health Information (CIHI). Discharge Abstract Database
(DAD)Metadata.http://www.cihi.ca/CIHI-ext-
portal/internet/en/document/types+of+care/hospital+care/acute+care/dad_metadata.
Accessed June 2013.
Canadian Institute for Health Information (CIHI). Health Care in Canada.
Ottawa, ON: Statistics Canada; 2006.
Canadian Institute for Health Information (CIHI). National Ambulatory Care
Reporting System (NACRS). http://www.cihi.ca/CIHI-ext-
portal/internet/en/document/types+of+care/hospital+care/emergency+care/NACRS_MET
ADATA. Accessed June 2013.
Coutts SB, Jeerakathil TJ. Alberta Stroke Prevention in TIAs and mild strokes
(ASPIRE). http://www.hsf.ca/research/en/alberta-stroke-prevention-tias-and-mild-
strokes-aspire. Accessed December 2014.
Davis SM, Donnan GA. Secondary Prevention after Ischemic Stroke or Transient
Ischemic Attack. N Engl J Med. 2012; 366:1914-22.

129
Delamater PL, Messina JP, Shortridge AM, Grady SC. Measuring geographic
access to health care: raster and network-based methods. International Journal of Health
Geographics. 2012, 11: 15.
Deyo RA, Taylor VM, Diehr P, Conrad D, Cherkin DC, Ciol M, Kreuter W.
Analysis of Automated Administrative and Survey Databases to Study Patterns and
Outcomes of Care. Spine. 1994:19; 2083S-2091S.
DMTI 2011 CanMap Route Logistics and Streetfiles. University of Calgary.
http://libdata.ucalgary.ca/index.php?dir==DMTI_2011/CanMapRouteLogistics/Docs/.
Accessed January 2014.
Douglas M, Wildavsky A. Risk and Culture. Berkeley: University of California
Press, 1983.
du Plessis V, Beshiri R, Bollman RD, Clemenson H. Definitions of “Rural”.
Statistics Canada, Ottawa, ON: 2002.
Ebrahim S, Harwood R. Stroke. Epidemiology, evidence, and clinical practice.
Oxford; Oxford University Press, 1999.
Elliott P, Wartenberg D. Spatial Epidemiology: current approaches and future
challenges. Environmental Health Perspectives. 2004; 112(9): 998-1006.
Environmental Systems Research Institute (ESRI). Algorithms Used by the
ArcGIS Network Analyst Extension.
http://resources.arcgis.com/en/help/main/10.1/index.html#//004700000053000000.
Accessed January 2014.
Environmental Systems Research Institute (ESRI). ArcMAP 10.0. ArcGIS
Desktop 10. Redlands, CA: ESRI Inc.; 1999-2010.

130
Environmental Systems Research Institute (ESRI). How Hot Spot Analysis
(Getis-Ord Gi*) works. ArcGIS Resource Center Desktop 10.
http://help.arcgis.com/en/arcgisdesktop/10.0/help/index.html#//005p00000011000000.
Accessed June 2013.
Environmental Systems Research Institute (ESRI). Location-Allocation Analysis.
ArcGIS Resource Center. Desktop 10. http://help.arcgis.com/en/arcgisdesktop/10.0/.
Accessed October 2014.
Environmental Systems Research Institute (ESRI). Selecting a conceptualization
of spatial relationships: Best practices. ArcGIS Resource Center. Desktop 10.0.
http://help.arcgis.com/en/arcgisdesktop/10.0/help/index.html#//005p00000005000000.
Accessed Sept ember 2013.
Environmental Systems Research Institute (ESRI). Selecting a fixed distance
band value. ArcGIS Resource Center Desktop 10.
http://help.arcgis.com/en/arcgisdesktop/10.0/help/index.html#/Modeling_spatial_relation
ships/. Accessed June 2013.
Environmental Systems Research Institute (ESRI). Mean Center (Spatial
Statistics). ArcGIS Resource Center Desktop 10 website.
http://help.arcgis.com/en/arcgisdesktop/10.0/help/index.html#//005p00000018000000.
Accessed June 2013.
Environmental Systems Research Institute (ESRI). Transverse Mercator. ArcGIS
Resource Center Desktop 10 website.
http://help.arcgis.com/en/arcgisdesktop/10.0/help/index.html#/Transverse_Mercator/003r
00000046000000/. Accessed June 2013.

131
Feinstein L, Sabates R, Anderson TM, Sorhaindo A, Hammond C. What are the
effects of education on health? In: Measuring the Effects of Education on Health and
Civic Engagement: Proceedings of the Copenhagen Symposium. OECD; 2006.
http://www.oecd.org/education/innovation-education/37437718.pdf. Accessed August
2014.
Frohlich KL. Government, Politics, and Law. Transcending the Known in Public
Health Practice. The Inequality Paradox: The Population Approach and Vulnerable
Populations. American Journal of Public Health. 2008: 98; 2: 216-221.
Frohlich KL, Potvin L. The Inequality Paradox: The Population Approach and
Vulnerable Populations. American Journal of Public Health. Vol. 98, No. 2, 2008.
Gatrell Anthony C. Geographies of Health: An Introduction. Oxford; Blackwell
Publishers Ltd., 2002.
Gatrell AC, Elliott SJ. Geographies of Health: An Introduction. 2nd Ed. West
Sussex; Wiley Blackwell, 2009.
Gomez D, Haas B, Doumouras AG, Zagorski B, Ray J, Rubenfeld G, McLellan
BA, Boyes DM, Nathens AB. A Population-Based Analysis of the Discrepancy Between
Potential and Realized Access to Trauma Center Care. Annals of Surgery. 2013; 257(1):
160-165.
Guagliardo MF. Spatial accessibility of primary care: concepts, methods and
challenges. International Journal of Health Geographics. 2004, 3: 3.
Hacke W, Kaste M, Bluhmki E, Brozman M, Dávalos A, Guidetti D, Larrue V,
Lees KR, Medeghri Z, Machnig T, Schneider D, von Kummer R, Wahlgren N, Toni D,
ECASS Investigators. Thrombolysis with Alteplase 3 to 4.5 Hours After Acute Ischemic
Stroke. N Engl J Med. 2008; 359: 1317-29.
132
Han D, Carrow SS, Rogerson PA, Munschauer FE. Geographical variation of
cerebrovascular disease in New York State: the correlation with income. International
Journal of Health Geographics. 2005, 4: 25.
Harvard School of Public Health. Environmental Barriers to Activity.
http://www.hsph.harvard.edu/obesity-prevention-source/obesity-causes/physical-activity-
environment/. Accessed December 2014.
Harvey D. Justice, Nature & the Geography of Difference. Oxford: Blackwell
Publishers,1996.
Health Canada. Canada Health Act Annual Report 2007-2008. Introduction.
http://www.hc-sc.gc.ca. Accessed June 2013.
Health Quality Council of Alberta. Review of Operations of Ground Emergency
Medical Services in Alberta. In Accordance with Section 15 (1) of the Health Quality
Council of Alberta Act. January 2013.
http://www.hqca.ca/assets/files/March2013/Review%20of%20the%20Operations%20of%20Grou
nd%20EMS%20in%20Alberta_Final%20Report.pdf.
Heart & Stroke Foundation (HSF). Role of Stroke Prevention Clinics (SPCs).
Accessed Aug 2014.
http://www.heartandstroke.on.ca/site/c.pvI3IeNWJwE/b.5353691/k.E4CC/HCP__Role_o
f_the_Stroke_Prevention_Clinics_SPCs.htm
Hesselfeldt R, Gyllenborg J, Steinmetz J, Do HQ, Hejselbæk J, Rasmussen LS. Is
air transport of stroke patients faster than ground transport? A prospective controlled
observational study. Emergency Medicine Journal. 2014; 31(4): 268-72.
133
Holmes JH, Lehman A, Hade E, Ferketich AK, Gehlert S, Rauscher GH, Abrams
J, Bird CE. Challenges for Multilevel Health Disparities Research in a Transdisciplinary
Environment. Am J Prev Med. 2008; 35(25): S182-S192.
Howard G, Feigin V. Advances in Population Studies 2007. Stroke. 2008; 39;
283-285.
Howard G, Cushman M, Prineas RJ, Howard VJ, Moy CS, Sullivan LM,
D’Agostino RB Sr, McClure LA, Pulley L, Safford MM. Advancing the Hypothesis that
Geographic Variations in Risk Factors Contribute Relatively Little to Observed
Geographic Variations in Heart Disease and Stroke Mortality. Prev Med. 2009; 49(2-3):
129-132.
Jeerakathil T, Burridge D, Thompson G, Fang S, Hill MD. The Alberta
Provincial Stroke Strategy: Improving Stroke Care Across Alberta. Interim Evaluation
Report. Edmonton: Alberta Provincial Stroke Strategy: December 2010.
Jones, TH, Morawetz RB, Crowell RM, Marcoux FW, FitzGibbon SJ,
DeGirolami U. Thresholds of focal cerebral ischemia in awake monkeys. J.
Neurosurgery. 1981; 54: 773-782.
Johansen H, Wielgosz A, Nguyen K, Fry R. Incidence, comorbidity, case fatality
and readmission of hospitalized stroke patients in Canada. Canadian Journal of
Cardiology. 2006; 22: 65-71.
Keon WJ, Pépin L. Population Health Policy: Issues and Options. Fourth
Report of the Subcommittee on Population Health of the Standing Senate Committee on
Social Affairs, Science and Technology. www.parl.gc.ca. September 2009.
Khatri P, Yeatts S, Mazighi , Broderick J, Liebeskind D, Demchuk A, Amarenco
P, Carrozzella J, Spilker J, Foster LD, Goyal M, Hill MD, Palesch YY, Jauch EC, Haley

134
EC, Vagal A, Tomsick TA, IMS III Trialists. Time to angiographic reperfusion and
clinical outcome after acute ischaemic stroke: an analysis of data from the Interventional
Management of Stroke (IMS III) phase 3 trial. The Lancet Neurology. 2014; 13; 6: 567-
574.
Kidwell CS, Alger JR, Di Salle F, Starkman S, Villablanca P, Bentson J, Saver
JL. Diffusion MRI in Patients With Transient Ischemic Attacks. Stroke. 1999; 30: 1174-
1180.
Klein RJ, Schoenborn CA. Age Adjustment Using the 2000 Projected U.S.
Population. Healthy People 2010 Statistical Notes. Hyattsville, MD: National Center for
Health Statistics; 2001: 20: 1-10.
Kleindorfer DO, Lindsell CJ, Broderick JP, Flaherty ML, Woo D, Ewing I,
Schmit P, Moomaw C, Alwell K, Pancioli A, Jauch E, Khoury J, Miller R, Schneider A,
Kissela BM. Community Socioeconomic Status and Prehospital Times in Acute Stroke
and Transient Ischemic Attack: Do Poorer Patients Have Longer Delays From 911 Call
to the Emergency Department? Stroke. 2006; 37: 1508-1513.
Kneeland PP, Fang MC. Current issues in patient adherence and persistence:
focus on anticoagulants for the treatment and prevention of thromboembolism. Patient
Preference and Adherence. 2014; 4: 51-60.
Kokotailo RA, Hill MD. Coding of Stroke and Stroke Risk Factors Using
International Classification of Diseases, Revisions 9 and 10. Stroke. 2005; 36; 1776-
1781.
Kulldorff M. SaTScan User Guide for version 9.0. 2010.
http://www.satscan.org/. Accessed June 2013.
135
Kulldorff M, Nagarwalla N. Spatial Disease Clusters: Detection and Inference.
Statistics in Medicine. 1995; 14: 799-810.
Lackland DT, Roccella EJ, Deutsch AF, Fornage M, George MG, Howard G,
Kissela BM, Kittner SJ, Lichtman JH, Lisabeth LD, Schwamm LH, Smith EE, Towfighi
A. Factors Influencing the Decline in Stroke Mortality. A Statement From the American
Heart Association/American Stroke Association. Stroke. December 2013.
http://stroke.ahajournals.org/content/early/2013/12/05/01.str.0000437068.30550.cf.
January 2014.
Lai PC, So FM, Chan KW. Spatial Epidemiological Approaches in Disease
Mapping and Analysis. Boca Raton FL; CRC Press; 2009.
Lalonde M. A New Perspective on the Health of Canadians. Government of
Canada. Minister of Supply and Services Canada. 1981. http://www.phac-aspc.gc.ca/ph-
sp/pdf/perspect-eng.pdf. Accessed October 2014.
Lanska DJ, Lewis HK. The Geography of Stroke Mortality in the United States
and the Concept of a Stoke Belt. Stroke. 1995; 26: 1145-1149.
Last JM. A Dictionary of Epidemiology. 4th Edition. New York. Oxford
University Press, 2000.
Longley PA, Goodchild MF, Maguire DJ, Rhind DW. Geographic Information
Systems and Science. 2nd
Edition. West Sussex; John Wiley & Sons, Ltd, 2005.
Maheswaran R, Haining RP, Brindley P, Law J, Pearson T, Fryers PR, Wise S,
Campbell MJ. Outdoor Air Pollution and Stroke in Sheffield, United Kingdom. A
Small-Area Level Geographic Study. Stroke. 2005; 36: 239-243.

136
Maldonado G, Greenland S. Simulation study of confounder-selection strategies.
American Journal of Epidemiology. 1993; 138: 923-936.
Marler JR, Tilley BC, Lu M, Brott TG, Lyden PC, Grotta JC, Broderick JP,
Levine SR, Frankel MP, Horowitz SH, Haley EC Jr, Lewandowski CA, Kwiatkowski TP.
Early stroke treatment associated with better outcome: the NINDS rt-PA stroke study.
Neurology. 2000; 55(11): 1649-55.
Martinez J, Pampalon R, Hamel D. Deprivation and stroke mortality in Quebec.
Chronic Diseases in Canada, Public Health Agency of Canada. 2003; 24(2/3).
Mazighi M, Meseguer E, Labreuche J, Serfaty JM, Laissy JP, Lavallée PC,
Cabrejo L, Guidoux C, Laperque B, Klein IF, Olivot JM, Rouchaud A, Desilles JP,
Schouman-Claeys E, Amarenco P. Dramatic Recovery in Acute Ischemic Stroke Is
Associated With Arterial Recanalization Grade and Speed. Stroke. 2012; 43: 2998-3002.
Mazighi M, Serfaty JM, Labreuche J, Laissy JP, Mesequer E, Lavallée PC,
Cabrejo L, Slaoui T, Guidoux C, Laperque B, Klein IF, Olivot JM, Abboud H, Simon O,
Niclot P, Nifle C, Touboul PJ, Raphaeli G, Gohin C, Claeys ES, Amarenco P,
RECANALISE investigators. Comparison of intravenous alteplase with a combined
intravenous-endovascular approach in patients with stroke and confirmed arterial
occlusion (RECANALISE STUDY): a prospective cohort study. Lancet Neurology.
2009; 8(9): 802-9.
Mitchell A. The ESRI Guide to GIS Analysis. Volume 1: Geographic Patterns
and Relationships. Redlands, CA: ESRI Inc.; 1999.
Mitchell A. Identifying Clusters. In: Mitchell A. The ESRI Guide to GIS
Analysis. Volume 2: Spatial Measurements & Statistics. Redlands, CA: ESRI Press;
2009: 176-181.
137
Mohan S, Campbell NRC, Willis K. Effective population-wide public health
interventions to promote sodium reduction. CMAJ. 2009; 181(9): 605-609.
Mohr JP, Choi DW, Grotta JC, Weir B, Wolf PA. Stroke. Pathophysiology,
Diagnosis, and Management. Fourth Edition, Philadelphia; Churchill Livingstone, 2004.
Monmonier M. How to Lie with Maps. 2nd Ed. Chicago, IL: The University of
Chicago Press; 1991, 139-162.
Moser DK, Kimble LP, Alberts MJ, Alonzo A, Croft JB, Dracup K, Evenson KR,
Go AS, Hand MM, Kothari RU, Mensah GA, Morris DL, Pancioli AM, Riegel B,
Johnson J. Reducing Delays in Seeking Treatment by Patients With Acute Coronary
Syndrome and Stroke: A Scientific Statement From the American Heart Association
Council on Cardiovascular Nursing and Stroke Council. Circulation. 2006; 114:168-182.
National Institute of Neurological Disorders and Stroke (NINDS). NINDS Stroke
Disparities Advisory Panel Meeting, Bethesda, Maryland, November 7-8, 2002.
National Institute for Neurological Disorders and Stroke r-tPA Stroke Study
Group. Tissue plasminogen activator for acute ischemic stroke. N Engl J Med. 1995; 333
(24): 1158-8.
Olson MD, Rabinstein AA. Does Helicopter Emergency Medical Service
Transfer Offer Benefit to Patients With Stroke? Stroke. 2012; 43: 878-880.
Openshaw S. Concepts and Techniques in Modern Geography No. 38. The
Modifiable Areal Unit Problem. Norwich: Geo Books; 1983: 1-41.
Patel AB, Waters NM, Blanchard IE, Doig CJ, Ghali WA. A validation of ground
ambulance pre-hospital times modeled using geographic information systems.
International Journal of Health Geographics. 2012,11: 42.
138
Patel AB, Waters NM, Ghali WA. Determining geographic areas and populations
with timely access to cardiac catheterization facilities for acute myocardial infarction care
in Alberta, Canada. International Journal of Health Geographics. 2007, 6: 47.
Pedigo A, Aldrich T, Odoi A. Neighborhood disparities in stroke and myocardial
infarction mortality: a GIS and spatial scan statistics approach. BMC Public Health.
2011; 11: 644.
Pedigo AS, Odoi A. Investigation of Disparities in Geographic Accessibility to
Emergency Stroke and Myocardial Infarction Care in East Tennessee Using Geographic
Information Systems and Network Analysis. AEP. 2010; 20(12): 924-930.
Penchansky R, Thomas JW. The Concept of Access. Definition and Relationship
to Consumer Satisfaction. Medical Care. 1981; XIX; 127-140.
Pérez de la Ossa N, Millán M, Arenillas JF, Sánchez-Ojanguren J, Palomeras E,
Dorado L, Guerrero C, Dávalos. Influence of direct admission to Comprehensive Stroke
Centers on the outcome of acute stroke patients treated with intravenous thrombolysis. J
Neurol. 2009; 256: 1270-1276.
Prabhakaran S, O’Neill K, Stein-Spencer L, Walter J, Alberts MJ. Prehospital
Triage to Primary Stroke Centers and Rate of Stroke Thrombolysis. JAMA Neurol. 2013;
70(9): 1126-1132.
Prabhakaran S, Ward E, John S, Lopes DK, Chen M, Temes RE, Mohammad Y,
Lee VH, Bleck TP. Transfer Delay Is a Major Factor Limiting the Use of Intra-arterial
Treatment in Acute Ischemic Stroke. Stroke. 2011; 42: 1626-1630.

139
Public Health Agency of Canada (PHAC). Tracking Heart Disease and Stroke in
Canada – Stroke Highlights 2011. http://www.phac-aspc.gc.ca/cd-mc/cvd-mcv/sh-fs-
2011/index-eng.php. Accessed October 2014.
Qureshi AI, Tuhrim S, Broderick JP, Hunt Batjer H, Hondo H, Hanley DF.
Spontaneous Intracerebral Hemorrhage. N Engl J Med. 2001; 19: 1450-1460.
Richards TB, Croner CM, Rushton G, Brown CK, Fowler L. Geographic
information systems and public health: mapping the future. Public Health Rep. 1999;
114(4): 359-73.
Rodriquez F, Hong C, Chang Y, Oertel LB, Singer DE, Green AR, López L.
Limited English Proficient Patients and Time Spent in therapeutic Range in a Warfarin
Anticoagulation Clinic. J Am Heart Assoc. 2013; 2(4).
Rose G. Sick Individuals and Sick Populations. International Journal of
Epidemiology. Vol. 14, No. 1, 1985.
Rothwell P. Treating Individuals 1. External validity of randomised controlled
trials: “To whom do the results of this trial apply?” Lancet. 2005; 365: 82-93.
Rushton G, Armstrong MP, Gittler J, Greene BR, Pavlik CE, West MM,
Zimmerman DL. Eds. Geocoding Health Data: The Use of Geographic Codes in Cancer
Prevention and Control, Research and Practice. Boca Raton: CRC Press; 2008.
Sarti C, Rastenyte D, Zygimantas C, Tuomilehto J. International Trends in
Mortality From Stroke, 1968 to 1994. Stroke. 2000; 31; 1588-1601.
SaTScan. http://www.satscan.org/. Accessed December 2013.

140
Saver JL, Smith EE, Fonarow GC, Reeves MJ, Zhao X, Olson DM, Schwamm
LH. The “Golden Hour” and Acute Brain Ischemia: Presenting Features and Lytic
Therapy in >30,000 Patients Arriving Within 60 Minutes of Stroke Onset. Stroke. 2010;
41: 1431-1439.
Schwamm LH, Pancioli A, Acker JE, Goldstein LB, Zorowitz RD, Shephard TJ,
Moyer P, Gorman M, Claiborne Johnston S, Duncan PW, Gorelick P, Frank J, Stranne
SK, Smith R, Federspiel W, Horton KB, Magnis E, Adams RJ. Recommendations For
the Establishment of Stroke Systems of Care. Circulation. 2005; 111: 1078-1091.
Scott PA., Temovsky CJ, Lawrence K, Gudaitis E., Lowell MJ. Analysis of
Canadian Population With Potential Geographic Access to Intravenous Thrombolysis for
Acute Ischemic Stroke. Stroke. 1998; 29(11); 2304-2310.
Spasoff RA. Epidemiologic methods for health policy. New York: Oxford
University Press, 1999.
StataCorp LP. Stata/IC 12.1 for Windows. College Station, TX: 1985-2011
(Rev. 20 Mar 2013).
Statistics Canada Census Dictionary. Dissemination area (DA).
http://www12.statcan.gc.ca/census-recensement/2011/ref/dict/geo021-eng.cfm. Accessed
January 2014.
Statistics Canada. Data products that are identified as 20% sample data.
https://www12.statcan.gc.ca/census-recensement/2006/ref/notes/sample_data-
donnees_echantillon-eng.cfm. Accessed December 2014.
Statistics Canada. Data Quality and Confidentiality Standards and Guidelines
(Public). http://www12.statcan.gc.ca/census-recensement/2011/ref/DQ-QD/conf-
eng.cfm. Accessed September 2013.

141
Statistics Canada. Population coverage error. http://www12.statcan.gc.ca/census-
recensement/2006/ref/rp-guides/rp/coverage-couverture/cov-couv_p03-eng.cfm.
Accessed July 2013.
Statistics Canada. Population and dwelling counts, for Canada, provinces and
territories, 2011 and 2006 censuses.
http://www.statcan.gc.ca/tables-tableaux/sum-som/l01/cst01/agrc42j-eng.htm. Accessed
June 2013.
Statistics Canada. Population, urban and rural, by province and territory.
http://www.statcan.gc.ca/tables-tableaux/sum-som/l01/cst01/demo62a-eng.htm.
Accessed June 2013.
Statistics Canada. Postal Code Conversion File (PCCF), Reference Guide 2006,
2011. http://www.statcan.gc.ca/bsolc/olc-cel/olc-
el?catno=92F0153G&CHROPG=1&lang=eng. Accessed June 2013.
Stroke Unit Trialists’ Collaboration. Collaborative systematic review of the
randomised trials of organised inpatient (stroke unit) care after stroke. BMJ; 1997;
314:1151-9.
Suarez JI, Tarr RW, Selman WR. Aneurysmal Subarachnoid Hemorrhage. N
Engl J Med. 2006; 354: 387-96.
Suzuki S, Saver JL, Scott P, Jahan R, Duckwiler G, Starkman S, Su Y, Kidwell
CS. Access to Intra-Arterial Therapies for Acute Ischemic Stroke: An Analysis of the
US Population. American Journal of Neuroradiology. 2004; 25: 1802-1806.

142
Tenenbaum HS, Waters NM. Spatial patterns of subprime mortgages by local banks,
nonlocal banks, and independents in the continental U.S. Environment and Planning –
Part A. 2011; 43(8): 1761.
United States Environmental Protection Agency (U.S. EPA). Heart Disease,
Stroke, and Outdoor Air Pollution. http://www.epa.gov/airnow/heart_flyer-1-28-10-
final.pdf. December 2014.
University of Calgary. Spatial and Numeric Data Services (SANDS).
http://library.ucalgary.ca/sands. Accessed June 2013.
van der Worp HB, van Gijn J. Acute Ischemic Stroke. N Engl J Med. 2007; 357:
572-9.
van Rheenen S, Watson TWJ, Alexander S, Hill MD. An Analysis of Spatial
Clustering of Stroke Types, In-hospital Mortality, and Reported Risk Factors in Alberta,
Canada, Using GIS. Unpublished. May 2014.
van Rheenen S, Hill MD, Alexander S, Watson TWJ. An Analysis of Geographic
Access to Acute Stroke Care in Alberta, Canada, Using Network Analysis and GIS.
Unpublished. July 2014.
van Rheenen S, Watson TWJ, Alexander S, Hill MD. Multivariable Regression
Analysis of Stroke and In-hospital Mortality Hot Spots and Cold Spots in Alberta,
Canada. Unpublished. October 2014.
Waller LA, Gotway CA. Applied Spatial Statistics for Public Health Data.
Hoboken, NJ: Wiley; 2004.
Walsh SJ, DeChello LM. Geographical variation in mortality from systemic
lupus erythematosus in the United States. Lupus. 2001; 10: 637-646.

143
Warlow CP, Dennis MS, van Gijn J, Hankey GJ, Sandercock PAG, Bamford JM,
Wardlaw JM. Reducing the burden of stroke and improving public health. In: Stroke: A
Practical Guide to Management. 2nd Ed. Oxford: Blackwell Science Ltd.; 2001: 762-784.
Wellenius GA, Burger MR, Coull BA, Schwartz J, Suh HH, Koutrakis P et al.
Ambient Air Pollution and the Risk of Acute Ischemic Stroke. Arch Int Med.
2012;172(3):229-234.
Wennberg J, Gittelsohn A. Small area variations in health care delivery. Science.
1973; 182: 1102-8.
World Health Organization (WHO). Ambient Outdoor Air Quality and Health.
http://www.who.int/mediacentre/factsheets/fs313/en/. Accessed December 2014.
World Health Organization (WHO). Cardiovascular Disease. The Atlas of Heart
Disease and Stroke. http://www.who.int/cardiovascular_diseases/resources/atlas/en/.
Accessed October 2014.
World Health Organization (WHO). International Statistical Classification of
Diseases and Related Health Problems 10th Revision.
http://apps.who.int/classifications/icd10/browse/2010/en. Accessed December 2013.
Xu G, Ma M, Liu X, Hankey GJ. Is There a Stroke Belt in China and Why?
Stroke. 2013; 44(7): 1775-83.