Gender and generation in native title: director demographics and the future of prescribed bodies...
20
Gender and generation in native title Director demographics and the future of prescribed bodies corporate LAND, RIGHTS, LAWS: ISSUES OF NATIVE TITLE vol. 6, no. 3, March 2015 Abstract While gender and age are often noted as being important dimensions of Indigenous leadership and governance, they have rarely been examined in detail. This paper focuses specifically on the gender and age of directors on the boards of prescribed bodies corporate (PBCs), the corporations established to hold and/or manage native title rights and interests. A predominant view persists of Aboriginal and Torres Strait Islander women as excluded or marginalised in native title. Statistical data for the year 2011–12 reveals, however, that women’s representation on PBC boards is higher than that found in mainstream sectors, while the literature reveals a complex picture of cultural, historical, demographic, institutional and intercultural factors that influence men’s and women’s participation and power in the native title arena. A key generational concern is the relatively low number of older people and the growing number of young people in the Aboriginal and Torres Strait Islander population. Viewed in relation to the Aboriginal and Torres Strait Islander population and projected changes, the pool of potential PBC directors looks likely to grow in coming years. This paper argues that, as an increasingly significant sector, PBCs have the potential to both contribute to and benefit from the strengthening of community capacity but this potential will not be realised until the constraints on the capacity of PBCs to meet their statutory obligations and pursue native title holder aspirations are addressed. Geoff Buchanan
Transcript of Gender and generation in native title: director demographics and the future of prescribed bodies...
Gender and generation in native titleDirector demographics and the future of
prescribed bodies corporate
LAND, RIGHTS, LAWS: ISSUES OF NATIVE TITLE
vol. 6, no. 3, March 2015
AbstractWhile gender and age are often noted as being important dimensions of Indigenous leadership and governance, they have rarely been examined in detail. This paper focuses specifically on the gender and age of directors on the boards of prescribed bodies corporate (PBCs), the corporations established to hold and/or manage native title rights and interests.
A predominant view persists of Aboriginal and Torres Strait Islander women as excluded or marginalised in native title. Statistical data for the year 2011–12 reveals, however, that women’s representation on PBC boards is higher than that found in mainstream sectors, while the literature reveals a complex picture of cultural, historical, demographic, institutional and intercultural factors that influence men’s and women’s participation and power in the native title arena.
A key generational concern is the relatively low number of older people and the growing number of young people in the Aboriginal and Torres Strait Islander population. Viewed in relation to the Aboriginal and Torres Strait Islander population and projected changes, the pool of potential PBC directors looks likely to grow in coming years. This paper argues that, as an increasingly significant sector, PBCs have the potential to both contribute to and benefit from the strengthening of community capacity but this potential will not be realised until the constraints on the capacity of PBCs to meet their statutory obligations and pursue native title holder aspirations are addressed.
Geoff Buchanan
1
Gender and generation in native title: director demographics and the future of prescribed bodies corporate
Geoff Buchanan1
IntroductionGender and generational issues matter in native title. From international development to Indigenous governance, there is a common emphasis in the literature on the need to appreciate the roles and experiences of men, women, younger people and older people in order to inform policy and practice.2 This paper explores gender and generation in the context of native title governance. Specifically the paper focuses on the gender and age of directors on the boards of prescribed bodies corporate (PBCs) — the corporations established to hold and/or manage native title rights and interests under the requirements of the Native Title Act 1993 (Cth) (NTA) and the Native Title (Prescribed Bodies Corporate) Regulations 1999. Now numbering over 130, PBCs form a significant sector and are a fundamental element of the native title system. This analysis of PBC director demographics aims to deepen our understanding of existing and emerging governance issues in the sector.
While gender and age are often noted as being important dimensions of Indigenous leadership and governance they have rarely been examined in detail. In the native title arena, Ganesharajah and McCourt have noted a lacuna in the literature around gender.3 While some literature has examined gender in the context of native title claims,4 institutions5 and negotiations,6 a significant gap remains in our understanding of the roles of men and women, or the implications of gender, in the governance of native title. In relation to the issue of gender, this paper seeks to address a predominant view of the exclusion and marginalisation of women in native title processes and the uneven distribution of the burdens and benefits of native title among men and women. In relation to generational issues, a key concern raised in the literature relates to challenges presented by the distinctive demographic profile of the Aboriginal and Torres Strait Islander population.7 A relatively low number of older leaders and mentors and a growing number of young people suggests there is an urgent need to build the capacity of future leaders through education, training opportunities and employment, and
1 I would like to thank Aurora Intern Claire Welsh for excellent research assistance and Toni Bauman, Pamela McGrath, Pauline McGuire, Claire Stacey and two anonymous reviewers for their constructive comments on draft versions of this paper. Any errors are my own.
2 See, for example, C Tacoli & D Gnisci, ‘Gender and generation matter’, Reflect and Act, International Institute for Environment and Development, March 2011, http://pubs.iied.org/pdfs/G03109.pdf; J Hunt & D Smith, Indigenous community governance project: year two research findings, CAEPR Working Paper series, no. 36, Centre for Aboriginal Economic Policy Research, Australian National University, 2007, http://caepr.anu.edu.au/sites/default/files/Publications/WP/CAEPRWP36.pdf.
3 C Ganesharajah & P McCourt, ‘Reflections on women and native title’, Native Title Newsletter, no. 4, Native Title Research Unit, Australian Institute of Aboriginal and Torres Strait Islander Studies, July/August 2009, pp. 4–5, http://aiatsis.gov.au/publications/products/native-title-newsletter-july-2009.
4 See, for example, P Baines, ‘Seeking justice: traditions of social action among Indigenous women in the southwest of Western Australia’, in P Brock (ed.), Words and silences: Aboriginal women, politics and land, Allen & Unwin, Crows Nest, NSW, 2001, pp. 56–91; M Langton, ‘Grandmother’s law, company business and succession in changing Aboriginal land tenure systems’, in G Yun-upingu (ed.), Our land is our life: land rights — past, present and future, University of Queensland Press, St Lucia, Queensland, 1997, pp. 84–116; DB Rose, Women and land claims, Land, Rights, Laws: Issues of Native Title series, vol. 1, no. 6, 1995; C Wohlan, Aboriginal women’s interests in customary law recognition, Background Paper 13, Law Reform Commission of Western Australia, Perth, 2005, http://www.lrc.justice.wa.gov.au/_files/P94_Background_Papers.pdf.
5 H McGlade, ‘Aboriginal women and the Commonwealth Government’s response to Mabo — an international human rights perspective’, in Brock, op. cit., pp. 139–56.
6 JC Keenan & RB Ramsay, ‘Case report 3: Australian case study’, in JC Keenan & DL Kemp (eds) Mining and local-level develop-ment: examining the gender dimensions of agreements between companies and communities, Centre for Social Responsibility in Mining, University of Queensland, Brisbane, 2013; C O’Faircheallaigh, ‘Women’s absence, women’s power: indigenous women and negotiations with mining companies in Australia and Canada’, Ethnic and Racial Studies, vol. 36, no. 11, pp. 1789–1807, 2013, http://dx.doi.org/10.1080/01419870.2012.655752; S Toussaint, M Tonkinson & D Trigger, ‘Gendered landscapes: the politics and processes of inquiry and negotiating interests in land’, in Brock, op. cit., pp. 157–74.
7 See Hunt & Smith, op. cit.
Gender and generation in native title
2
through the intergenerational transmission of cultural knowledge. This paper addresses this concern by focusing on the implications of demographic change for continuity and succession in native title governance.
The first section of the paper provides a brief overview of PBCs and the PBC sector, including a snapshot of the sector in 2011–12. The second section provides a demographic profile of PBC directors, broken down by age and sex. This profile is based on an analysis of publicly available information extracted from PBCs’ 2011–12 general reports provided to the Office of the Registrar of Indigenous Corporations (ORIC) as per the requirements of the Corporations (Aboriginal and Torres Strait Islander) Act 2006 (Cth) (CATSI Act). The third section provides a discussion of gender and generation in native title governance. This discussion draws on a review of the literature to explore factors influencing PBC director demographics and future implications for native title governance. The paper concludes by highlighting key gender and generational issues confronting a growing PBC sector and a changing Aboriginal and Torres Strait Islander population.
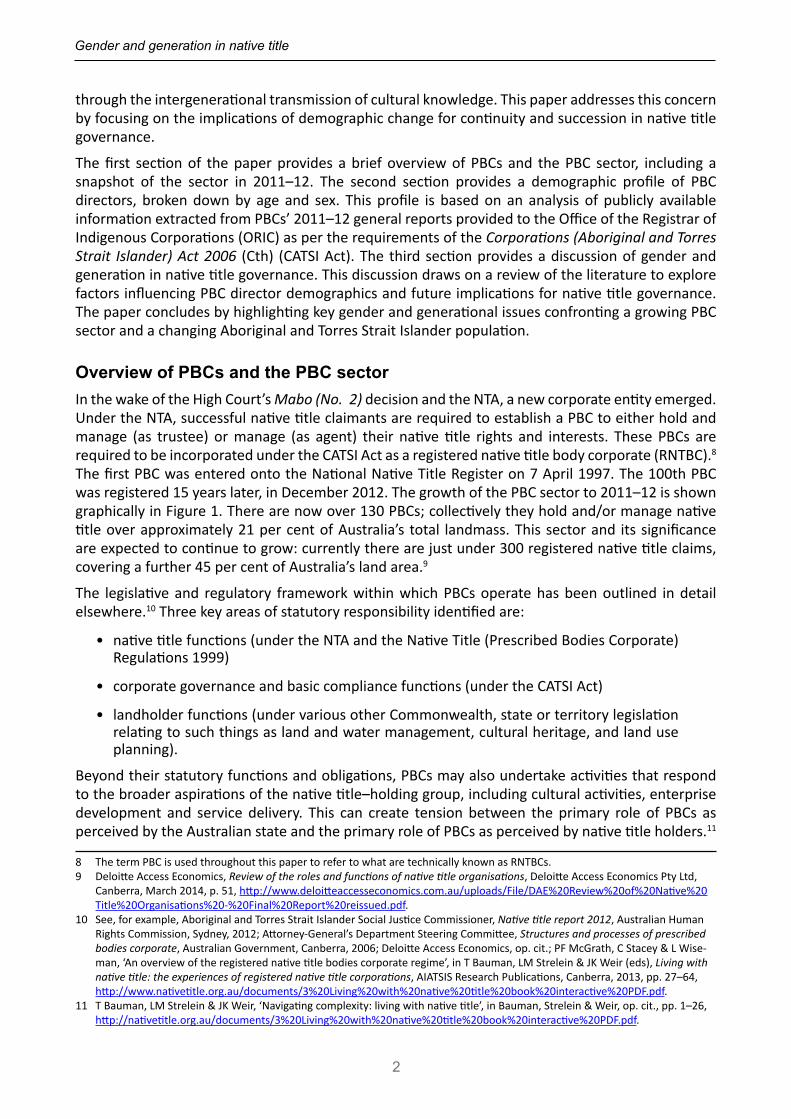
Overview of PBCs and the PBC sectorIn the wake of the High Court’s Mabo (No. 2) decision and the NTA, a new corporate entity emerged. Under the NTA, successful native title claimants are required to establish a PBC to either hold and manage (as trustee) or manage (as agent) their native title rights and interests. These PBCs are required to be incorporated under the CATSI Act as a registered native title body corporate (RNTBC).8 The first PBC was entered onto the National Native Title Register on 7 April 1997. The 100th PBC was registered 15 years later, in December 2012. The growth of the PBC sector to 2011–12 is shown graphically in Figure 1. There are now over 130 PBCs; collectively they hold and/or manage native title over approximately 21 per cent of Australia’s total landmass. This sector and its significance are expected to continue to grow: currently there are just under 300 registered native title claims, covering a further 45 per cent of Australia’s land area.9
The legislative and regulatory framework within which PBCs operate has been outlined in detail elsewhere.10 Three key areas of statutory responsibility identified are:
• native title functions (under the NTA and the Native Title (Prescribed Bodies Corporate) Regulations 1999)
• corporate governance and basic compliance functions (under the CATSI Act)
• landholder functions (under various other Commonwealth, state or territory legislation relating to such things as land and water management, cultural heritage, and land use planning).
Beyond their statutory functions and obligations, PBCs may also undertake activities that respond to the broader aspirations of the native title–holding group, including cultural activities, enterprise development and service delivery. This can create tension between the primary role of PBCs as perceived by the Australian state and the primary role of PBCs as perceived by native title holders.11
8 The term PBC is used throughout this paper to refer to what are technically known as RNTBCs. 9 Deloitte Access Economics, Review of the roles and functions of native title organisations, Deloitte Access Economics Pty Ltd,
Canberra, March 2014, p. 51, http://www.deloitteaccesseconomics.com.au/uploads/File/DAE%20Review%20of%20Native%20Title%20Organisations%20-%20Final%20Report%20reissued.pdf.
10 See, for example, Aboriginal and Torres Strait Islander Social Justice Commissioner, Native title report 2012, Australian Human Rights Commission, Sydney, 2012; Attorney-General’s Department Steering Committee, Structures and processes of prescribed bodies corporate, Australian Government, Canberra, 2006; Deloitte Access Economics, op. cit.; PF McGrath, C Stacey & L Wise-man, ‘An overview of the registered native title bodies corporate regime’, in T Bauman, LM Strelein & JK Weir (eds), Living with native title: the experiences of registered native title corporations, AIATSIS Research Publications, Canberra, 2013, pp. 27–64, http://www.nativetitle.org.au/documents/3%20Living%20with%20native%20title%20book%20interactive%20PDF.pdf.
11 T Bauman, LM Strelein & JK Weir, ‘Navigating complexity: living with native title’, in Bauman, Strelein & Weir, op. cit., pp. 1–26, http://nativetitle.org.au/documents/3%20Living%20with%20native%20title%20book%20interactive%20PDF.pdf.
Land, Rights, Laws: Issues of Native Title, vol. 6, no. 3, 2015
3
From the perspective of the state the statutory functions are primary, while for native title holders the primary role of a PBC is the pursuit of their aspirations. These functions and the tensions between them can place a significant burden on PBCs, which typically have limited human, financial and physical resources.12 As the PBC sector has grown, research and reviews have consistently highlighted a lack of capacity and the need for greater support for the sector.13
Further indicators of a lack of capacity within the PBC sector and the related burden placed on PBC directors are provided below through an analysis of data extracted from each PBC’s general report to ORIC for 2011–12. ORIC data, supplemented by data from the National Native Title Tribunal, has been used to provide a snapshot of PBCs and their directors as at 30 June 2012. Two caveats come with this snapshot. First, it is possible that 2011–12 was an atypical year for the PBC sector or the composition of PBC boards. For the purpose of this paper, 2011–12 is assumed to represent the current state of the sector. Wherever possible, comparisons between 2011–12 and 2012–13 are included in footnotes based on PBC-specific data published for the first time in ORIC’s yearly report on the top 500 Aboriginal and Torres Strait Islander corporations for 2012–13.14 Second, in some instances assets, income and employee numbers may not include those of separate but closely associated entities (such as trusts or commercial enterprises). That aside, the data still highlights ‘the limited means of the vast majority of [PBCs]’.15
12 See Deloitte Access Economics, op. cit.13 For an overview of these reviews, see McGrath, Stacey & Wiseman, op. cit.14 Office of the Registrar of Indigenous Corporations (ORIC), The top 500 Aboriginal and Torres Strait Islander corporations
2012–13, ORIC, Canberra, September 2014.15 Deloitte Access Economics, op. cit., p. 14.
Figure 1: PBCs on the National Native Title Register, 1994–95 to 2011–12
Source: unpublished National Native Title Register data provided by the National Native Title Tribunal, 11 October 2013.
0
10
20
30
40
50
60
70
80
90
100
No.
of P
BCs
Year
PBCs
add
ed to
the
Nati
onal
Nati
ve T
itle
Regi
ster
Tota
l no.
of P
BCs o
n th
eN
ation
al N
ative
Titl
eRe
gist
er
Gender and generation in native title
4
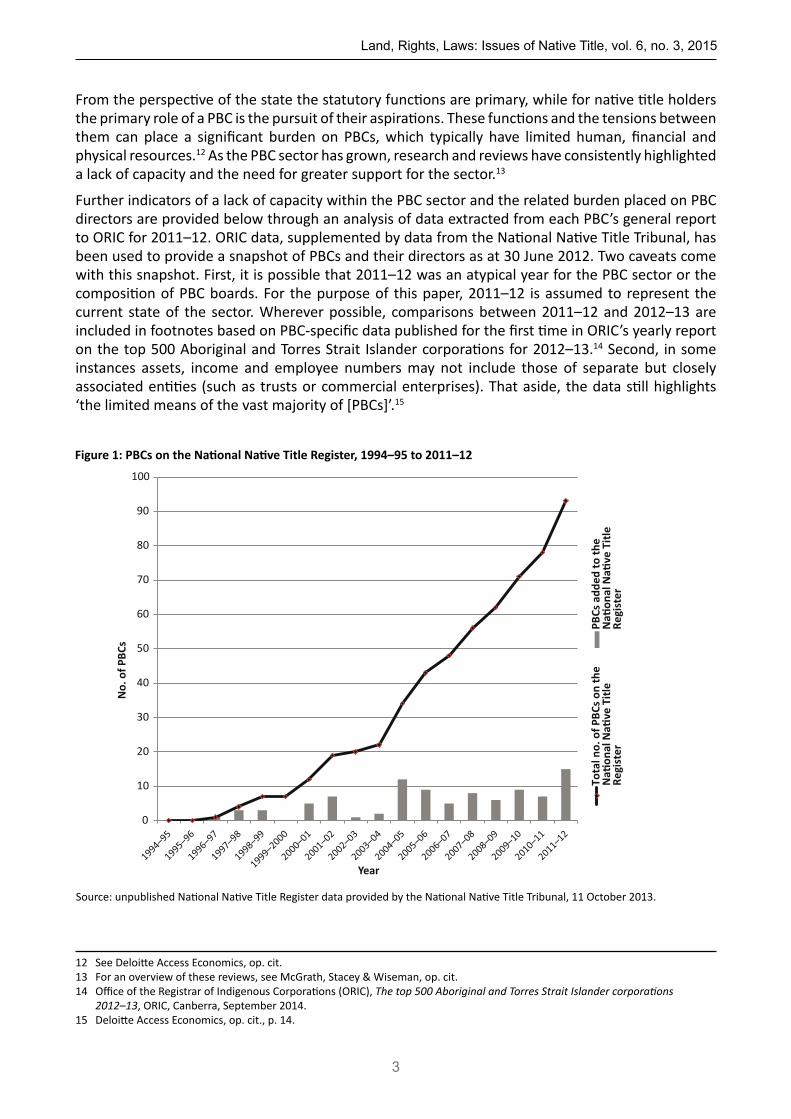
The PBC sector in 2011–12As at 30 June 2012, there were 93 registered PBCs.16 These PBCs held and/or managed native title over 18.1 per cent (1,394,956 km2) of the landmass of Australia.17 PBCs had been established in all jurisdictions except Tasmania and the Australian Capital Territory. The majority of PBCs were located in Queensland (including the Torres Strait) (50.6 per cent) and Western Australia (26.4 per cent) (see Table 1). The geographic distribution of native title is heavily skewed in terms of remoteness: data from 2011 shows that 98.1 per cent of native title land was in very remote Australia, with the remainder located in remote (1.5 per cent) and outer regional (0.3 per cent) areas.18 Outside the main service and mining towns in very remote Australia, Indigenous people make up a clear majority of the population; Indigenous people and institutions dominate this considerable proportion of Australia’s landmass.19 Within this context PBCs have emerged as a significant sector, particularly in remote Australia.
Table 1: Distribution of PBCs by state/territory and size, 2011–12*
NSW NTQld (excluding Torres Strait)
Torres Strait SA Vic. WA Total (no.) Total (%)
Small 1 6 25 19 6 1 17 75 82.4Medium 1 1 2 0 2 3 5 14 15.4Large 0 0 0 0 0 0 2 2 2.2Total (no.) 2 7 27 19 8 4 24 91* –Total (%) 2.2 7.7 29.7 20.9 8.8 4.4 26.4 – 100.0
Source: PBC 2011–12 general reports to ORIC, accessed via www.oric.gov.au, 31 March 2013.*Analysis is limited to the 91 PBCs that provided 2011–12 general reports to ORIC.
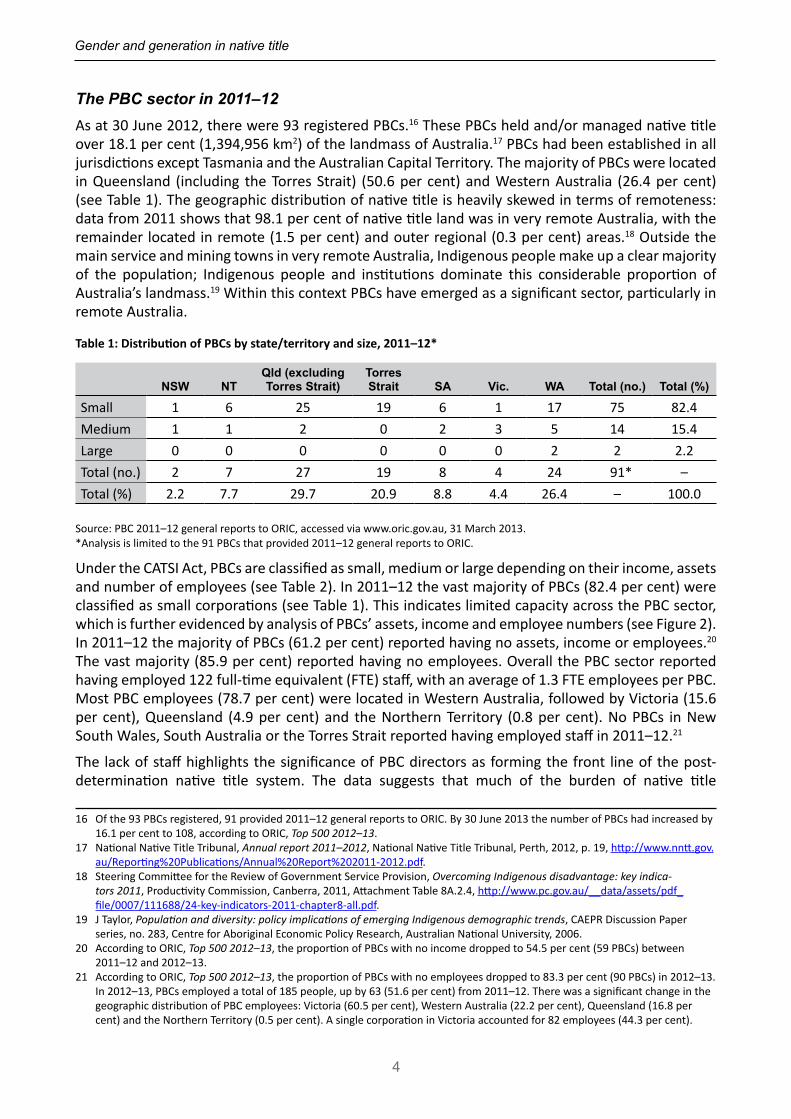
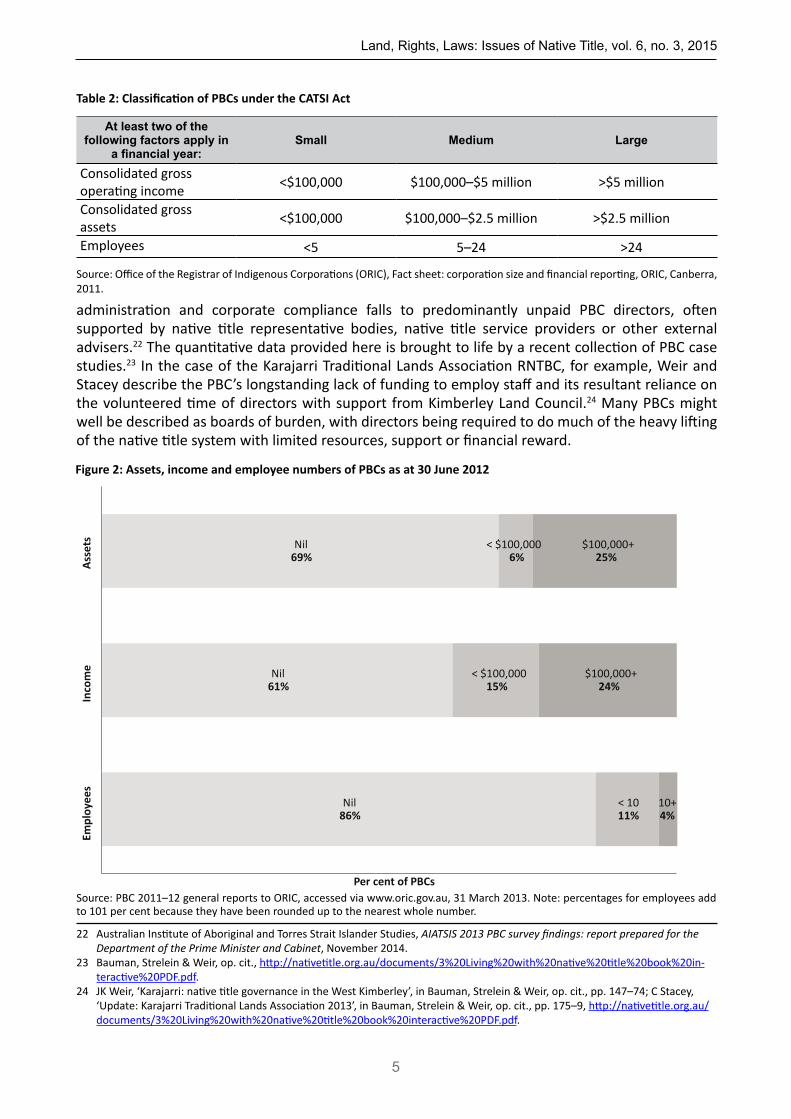
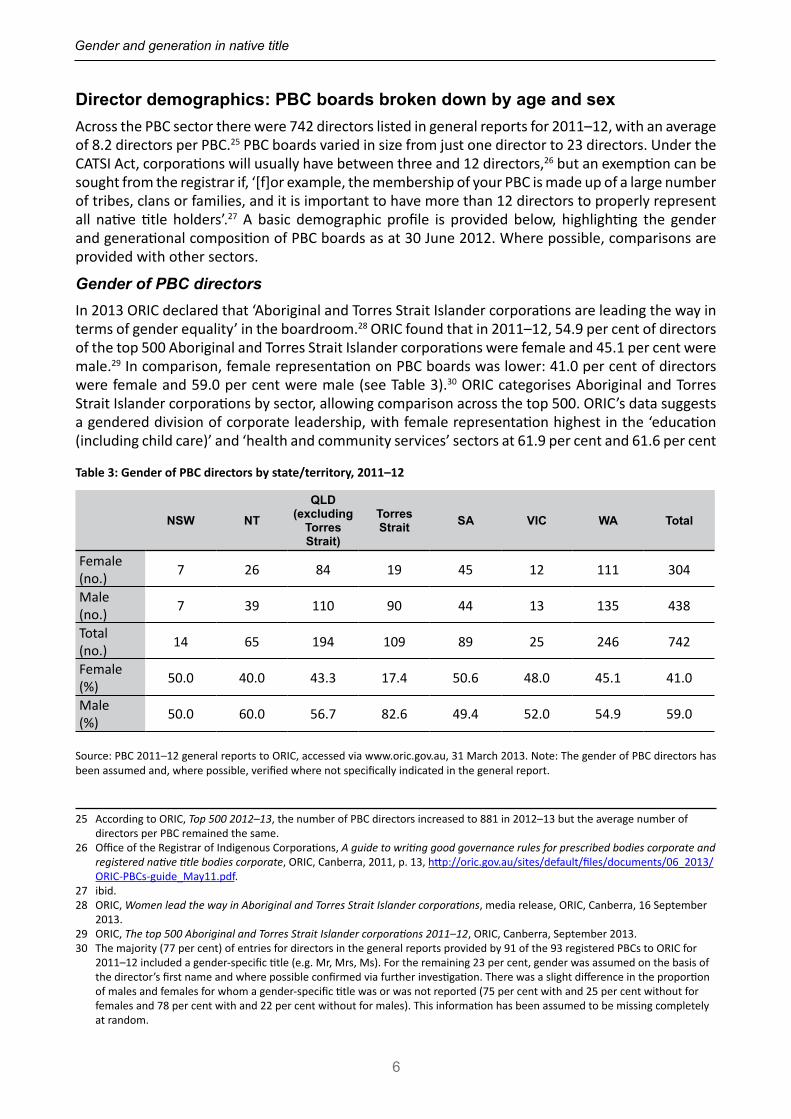
Under the CATSI Act, PBCs are classified as small, medium or large depending on their income, assets and number of employees (see Table 2). In 2011–12 the vast majority of PBCs (82.4 per cent) were classified as small corporations (see Table 1). This indicates limited capacity across the PBC sector, which is further evidenced by analysis of PBCs’ assets, income and employee numbers (see Figure 2). In 2011–12 the majority of PBCs (61.2 per cent) reported having no assets, income or employees.20 The vast majority (85.9 per cent) reported having no employees. Overall the PBC sector reported having employed 122 full-time equivalent (FTE) staff, with an average of 1.3 FTE employees per PBC. Most PBC employees (78.7 per cent) were located in Western Australia, followed by Victoria (15.6 per cent), Queensland (4.9 per cent) and the Northern Territory (0.8 per cent). No PBCs in New South Wales, South Australia or the Torres Strait reported having employed staff in 2011–12.21
The lack of staff highlights the significance of PBC directors as forming the front line of the post-determination native title system. The data suggests that much of the burden of native title
16 Of the 93 PBCs registered, 91 provided 2011–12 general reports to ORIC. By 30 June 2013 the number of PBCs had increased by 16.1 per cent to 108, according to ORIC, Top 500 2012–13.
17 National Native Title Tribunal, Annual report 2011–2012, National Native Title Tribunal, Perth, 2012, p. 19, http://www.nntt.gov.au/Reporting%20Publications/Annual%20Report%202011-2012.pdf.
18 Steering Committee for the Review of Government Service Provision, Overcoming Indigenous disadvantage: key indica-tors 2011, Productivity Commission, Canberra, 2011, Attachment Table 8A.2.4, http://www.pc.gov.au/__data/assets/pdf_file/0007/111688/24-key-indicators-2011-chapter8-all.pdf.
19 J Taylor, Population and diversity: policy implications of emerging Indigenous demographic trends, CAEPR Discussion Paper series, no. 283, Centre for Aboriginal Economic Policy Research, Australian National University, 2006.
20 According to ORIC, Top 500 2012–13, the proportion of PBCs with no income dropped to 54.5 per cent (59 PBCs) between 2011–12 and 2012–13.
21 According to ORIC, Top 500 2012–13, the proportion of PBCs with no employees dropped to 83.3 per cent (90 PBCs) in 2012–13. In 2012–13, PBCs employed a total of 185 people, up by 63 (51.6 per cent) from 2011–12. There was a significant change in the geographic distribution of PBC employees: Victoria (60.5 per cent), Western Australia (22.2 per cent), Queensland (16.8 per cent) and the Northern Territory (0.5 per cent). A single corporation in Victoria accounted for 82 employees (44.3 per cent).
Land, Rights, Laws: Issues of Native Title, vol. 6, no. 3, 2015
5
Table 2: Classification of PBCs under the CATSI Act
At least two of the following factors apply in
a financial year:Small Medium Large
Consolidated gross operating income <$100,000 $100,000–$5 million >$5 million
Consolidated gross assets <$100,000 $100,000–$2.5 million >$2.5 million
Employees <5 5–24 >24
Source: Office of the Registrar of Indigenous Corporations (ORIC), Fact sheet: corporation size and financial reporting, ORIC, Canberra, 2011.
administration and corporate compliance falls to predominantly unpaid PBC directors, often supported by native title representative bodies, native title service providers or other external advisers.22 The quantitative data provided here is brought to life by a recent collection of PBC case studies.23 In the case of the Karajarri Traditional Lands Association RNTBC, for example, Weir and Stacey describe the PBC’s longstanding lack of funding to employ staff and its resultant reliance on the volunteered time of directors with support from Kimberley Land Council.24 Many PBCs might well be described as boards of burden, with directors being required to do much of the heavy lifting of the native title system with limited resources, support or financial reward.
22 Australian Institute of Aboriginal and Torres Strait Islander Studies, AIATSIS 2013 PBC survey findings: report prepared for the Department of the Prime Minister and Cabinet, November 2014.
23 Bauman, Strelein & Weir, op. cit., http://nativetitle.org.au/documents/3%20Living%20with%20native%20title%20book%20in-teractive%20PDF.pdf.
24 JK Weir, ‘Karajarri: native title governance in the West Kimberley’, in Bauman, Strelein & Weir, op. cit., pp. 147–74; C Stacey, ‘Update: Karajarri Traditional Lands Association 2013’, in Bauman, Strelein & Weir, op. cit., pp. 175–9, http://nativetitle.org.au/documents/3%20Living%20with%20native%20title%20book%20interactive%20PDF.pdf.
Figure 2: Assets, income and employee numbers of PBCs as at 30 June 2012
Source: PBC 2011–12 general reports to ORIC, accessed via www.oric.gov.au, 31 March 2013. Note: percentages for employees add to 101 per cent because they have been rounded up to the nearest whole number.
Nil 86%
Nil 61%
Nil 69%
< 10 11%
< $100,000 15%
< $100,000 6%
10+ 4%
$100,000+ 24%
$100,000+ 25%
Empl
oyee
sIn
com
eAs
sets
Per cent of PBCs
Gender and generation in native title
6
Director demographics: PBC boards broken down by age and sexAcross the PBC sector there were 742 directors listed in general reports for 2011–12, with an average of 8.2 directors per PBC.25 PBC boards varied in size from just one director to 23 directors. Under the CATSI Act, corporations will usually have between three and 12 directors,26 but an exemption can be sought from the registrar if, ‘[f]or example, the membership of your PBC is made up of a large number of tribes, clans or families, and it is important to have more than 12 directors to properly represent all native title holders’.27 A basic demographic profile is provided below, highlighting the gender and generational composition of PBC boards as at 30 June 2012. Where possible, comparisons are provided with other sectors.
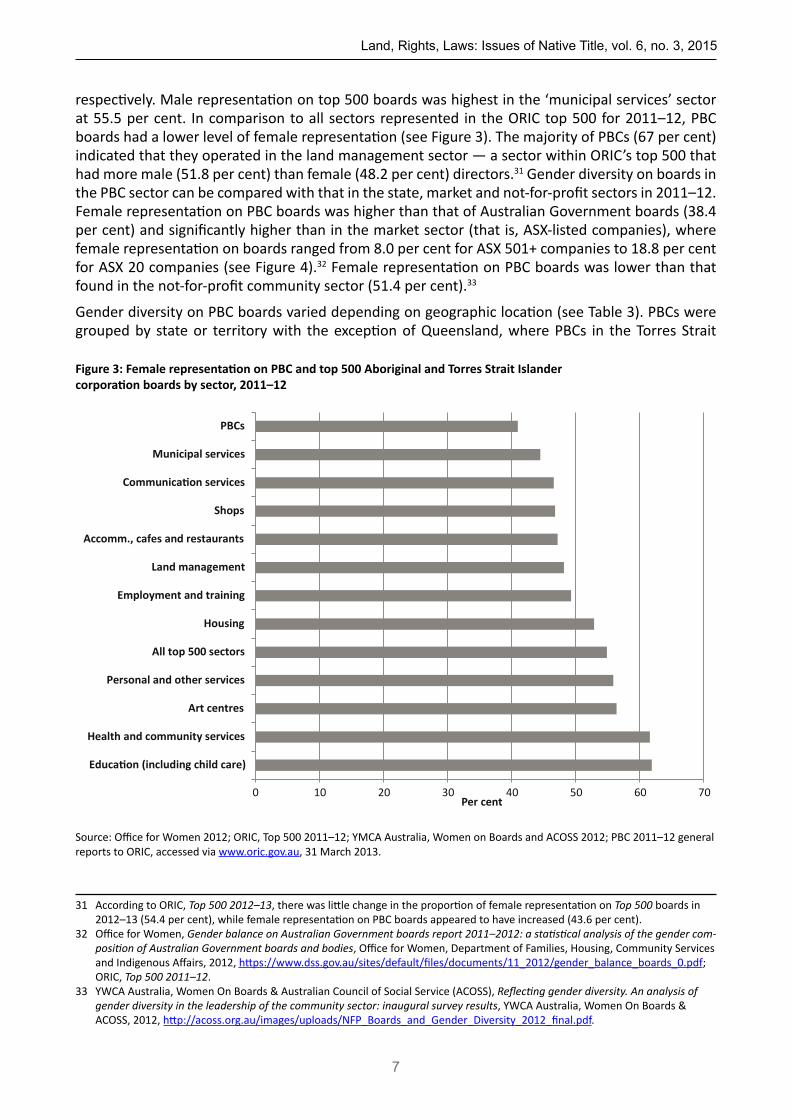
Gender of PBC directorsIn 2013 ORIC declared that ‘Aboriginal and Torres Strait Islander corporations are leading the way in terms of gender equality’ in the boardroom.28 ORIC found that in 2011–12, 54.9 per cent of directors of the top 500 Aboriginal and Torres Strait Islander corporations were female and 45.1 per cent were male.29 In comparison, female representation on PBC boards was lower: 41.0 per cent of directors were female and 59.0 per cent were male (see Table 3).30 ORIC categorises Aboriginal and Torres Strait Islander corporations by sector, allowing comparison across the top 500. ORIC’s data suggests a gendered division of corporate leadership, with female representation highest in the ‘education (including child care)’ and ‘health and community services’ sectors at 61.9 per cent and 61.6 per cent
Table 3: Gender of PBC directors by state/territory, 2011–12
NSW NTQLD
(excluding Torres Strait)
Torres Strait SA VIC WA Total
Female (no.) 7 26 84 19 45 12 111 304
Male (no.) 7 39 110 90 44 13 135 438
Total (no.) 14 65 194 109 89 25 246 742
Female (%) 50.0 40.0 43.3 17.4 50.6 48.0 45.1 41.0
Male (%) 50.0 60.0 56.7 82.6 49.4 52.0 54.9 59.0
Source: PBC 2011–12 general reports to ORIC, accessed via www.oric.gov.au, 31 March 2013. Note: The gender of PBC directors has been assumed and, where possible, verified where not specifically indicated in the general report.
25 According to ORIC, Top 500 2012–13, the number of PBC directors increased to 881 in 2012–13 but the average number of directors per PBC remained the same.
26 Office of the Registrar of Indigenous Corporations, A guide to writing good governance rules for prescribed bodies corporate and registered native title bodies corporate, ORIC, Canberra, 2011, p. 13, http://oric.gov.au/sites/default/files/documents/06_2013/ORIC-PBCs-guide_May11.pdf.
27 ibid.28 ORIC, Women lead the way in Aboriginal and Torres Strait Islander corporations, media release, ORIC, Canberra, 16 September
2013.29 ORIC, The top 500 Aboriginal and Torres Strait Islander corporations 2011–12, ORIC, Canberra, September 2013.30 The majority (77 per cent) of entries for directors in the general reports provided by 91 of the 93 registered PBCs to ORIC for
2011–12 included a gender-specific title (e.g. Mr, Mrs, Ms). For the remaining 23 per cent, gender was assumed on the basis of the director’s first name and where possible confirmed via further investigation. There was a slight difference in the proportion of males and females for whom a gender-specific title was or was not reported (75 per cent with and 25 per cent without for females and 78 per cent with and 22 per cent without for males). This information has been assumed to be missing completely at random.
Land, Rights, Laws: Issues of Native Title, vol. 6, no. 3, 2015
7
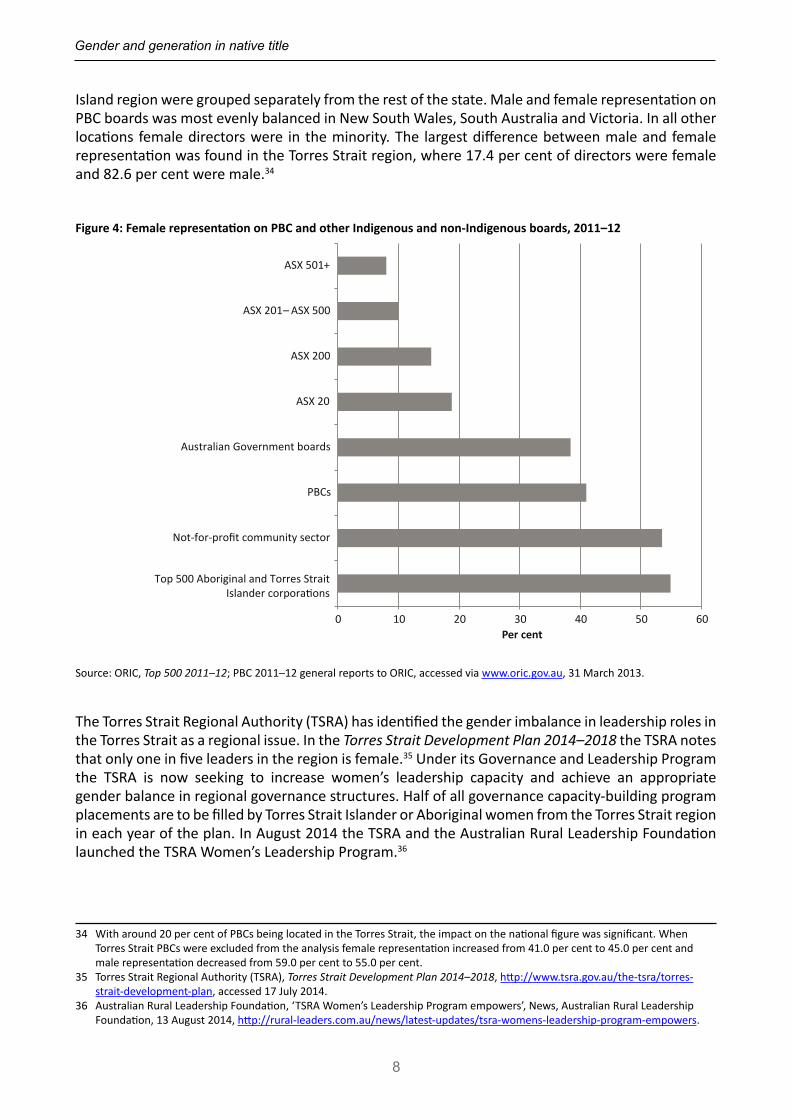
respectively. Male representation on top 500 boards was highest in the ‘municipal services’ sector at 55.5 per cent. In comparison to all sectors represented in the ORIC top 500 for 2011–12, PBC boards had a lower level of female representation (see Figure 3). The majority of PBCs (67 per cent) indicated that they operated in the land management sector — a sector within ORIC’s top 500 that had more male (51.8 per cent) than female (48.2 per cent) directors.31 Gender diversity on boards in the PBC sector can be compared with that in the state, market and not-for-profit sectors in 2011–12. Female representation on PBC boards was higher than that of Australian Government boards (38.4 per cent) and significantly higher than in the market sector (that is, ASX-listed companies), where female representation on boards ranged from 8.0 per cent for ASX 501+ companies to 18.8 per cent for ASX 20 companies (see Figure 4).32 Female representation on PBC boards was lower than that found in the not-for-profit community sector (51.4 per cent).33
Gender diversity on PBC boards varied depending on geographic location (see Table 3). PBCs were grouped by state or territory with the exception of Queensland, where PBCs in the Torres Strait
31 According to ORIC, Top 500 2012–13, there was little change in the proportion of female representation on Top 500 boards in 2012–13 (54.4 per cent), while female representation on PBC boards appeared to have increased (43.6 per cent).
32 Office for Women, Gender balance on Australian Government boards report 2011–2012: a statistical analysis of the gender com-position of Australian Government boards and bodies, Office for Women, Department of Families, Housing, Community Services and Indigenous Affairs, 2012, https://www.dss.gov.au/sites/default/files/documents/11_2012/gender_balance_boards_0.pdf; ORIC, Top 500 2011–12.
33 YWCA Australia, Women On Boards & Australian Council of Social Service (ACOSS), Reflecting gender diversity. An analysis of gender diversity in the leadership of the community sector: inaugural survey results, YWCA Australia, Women On Boards & ACOSS, 2012, http://acoss.org.au/images/uploads/NFP_Boards_and_Gender_Diversity_2012_final.pdf.
Figure 3: Female representation on PBC and top 500 Aboriginal and Torres Strait Islander corporation boards by sector, 2011–12
Source: Office for Women 2012; ORIC, Top 500 2011–12; YMCA Australia, Women on Boards and ACOSS 2012; PBC 2011–12 general reports to ORIC, accessed via www.oric.gov.au, 31 March 2013.
0 10 20 30 40 50 60 70
Education (including child care)
Health and community services
Art centres
Personal and other services
All top 500 sectors
Housing
Employment and training
Land management
Accomm., cafes and restaurants
Shops
Communication services
Municipal services
PBCs
Per cent
Gender and generation in native title
8
Island region were grouped separately from the rest of the state. Male and female representation on PBC boards was most evenly balanced in New South Wales, South Australia and Victoria. In all other locations female directors were in the minority. The largest difference between male and female representation was found in the Torres Strait region, where 17.4 per cent of directors were female and 82.6 per cent were male.34
The Torres Strait Regional Authority (TSRA) has identified the gender imbalance in leadership roles in the Torres Strait as a regional issue. In the Torres Strait Development Plan 2014–2018 the TSRA notes that only one in five leaders in the region is female.35 Under its Governance and Leadership Program the TSRA is now seeking to increase women’s leadership capacity and achieve an appropriate gender balance in regional governance structures. Half of all governance capacity-building program placements are to be filled by Torres Strait Islander or Aboriginal women from the Torres Strait region in each year of the plan. In August 2014 the TSRA and the Australian Rural Leadership Foundation launched the TSRA Women’s Leadership Program.36
34 With around 20 per cent of PBCs being located in the Torres Strait, the impact on the national figure was significant. When Torres Strait PBCs were excluded from the analysis female representation increased from 41.0 per cent to 45.0 per cent and male representation decreased from 59.0 per cent to 55.0 per cent.
35 Torres Strait Regional Authority (TSRA), Torres Strait Development Plan 2014–2018, http://www.tsra.gov.au/the-tsra/torres-strait-development-plan, accessed 17 July 2014.
36 Australian Rural Leadership Foundation, ‘TSRA Women’s Leadership Program empowers’, News, Australian Rural Leadership Foundation, 13 August 2014, http://rural-leaders.com.au/news/latest-updates/tsra-womens-leadership-program-empowers.
Figure 4: Female representation on PBC and other Indigenous and non-Indigenous boards, 2011–12
Source: ORIC, Top 500 2011–12; PBC 2011–12 general reports to ORIC, accessed via www.oric.gov.au, 31 March 2013.
0 10 20 30 40 50 60
Top 500 Aboriginal and Torres StraitIslander corporations
Not-for-profit community sector
PBCs
Australian Government boards
ASX 20
ASX 200
ASX 201– ASX 500
ASX 501+
Per cent
Land, Rights, Laws: Issues of Native Title, vol. 6, no. 3, 2015
9
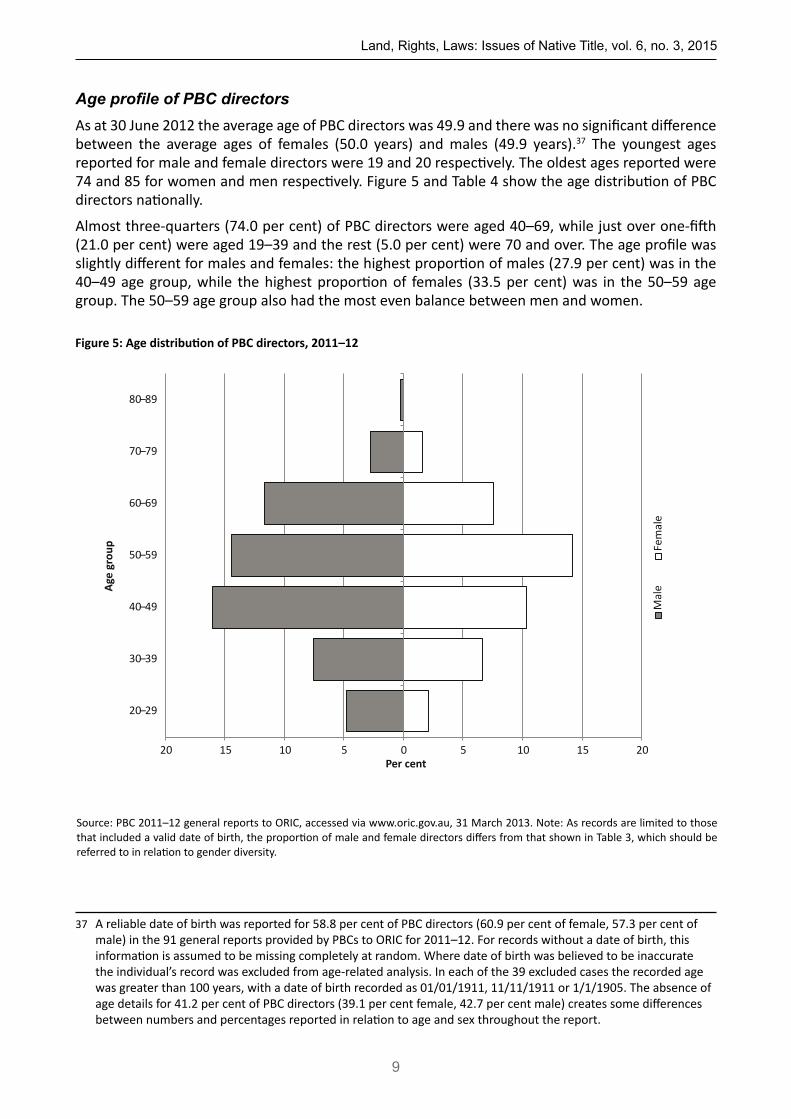
Age profile of PBC directorsAs at 30 June 2012 the average age of PBC directors was 49.9 and there was no significant difference between the average ages of females (50.0 years) and males (49.9 years).37 The youngest ages reported for male and female directors were 19 and 20 respectively. The oldest ages reported were 74 and 85 for women and men respectively. Figure 5 and Table 4 show the age distribution of PBC directors nationally.
Almost three-quarters (74.0 per cent) of PBC directors were aged 40–69, while just over one-fifth (21.0 per cent) were aged 19–39 and the rest (5.0 per cent) were 70 and over. The age profile was slightly different for males and females: the highest proportion of males (27.9 per cent) was in the 40–49 age group, while the highest proportion of females (33.5 per cent) was in the 50–59 age group. The 50–59 age group also had the most even balance between men and women.
37 A reliable date of birth was reported for 58.8 per cent of PBC directors (60.9 per cent of female, 57.3 per cent of male) in the 91 general reports provided by PBCs to ORIC for 2011–12. For records without a date of birth, this information is assumed to be missing completely at random. Where date of birth was believed to be inaccurate the individual’s record was excluded from age-related analysis. In each of the 39 excluded cases the recorded age was greater than 100 years, with a date of birth recorded as 01/01/1911, 11/11/1911 or 1/1/1905. The absence of age details for 41.2 per cent of PBC directors (39.1 per cent female, 42.7 per cent male) creates some differences between numbers and percentages reported in relation to age and sex throughout the report.
20 15 10 5 0 5 10 15 20
20–29
30–39
40–49
50–59
60–69
70–79
80–89
Per cent
Age
grou
p Fem
ale
Mal
e
Figure 5: Age distribution of PBC directors, 2011–12
Source: PBC 2011–12 general reports to ORIC, accessed via www.oric.gov.au, 31 March 2013. Note: As records are limited to those that included a valid date of birth, the proportion of male and female directors differs from that shown in Table 3, which should be referred to in relation to gender diversity.
Gender and generation in native title
10
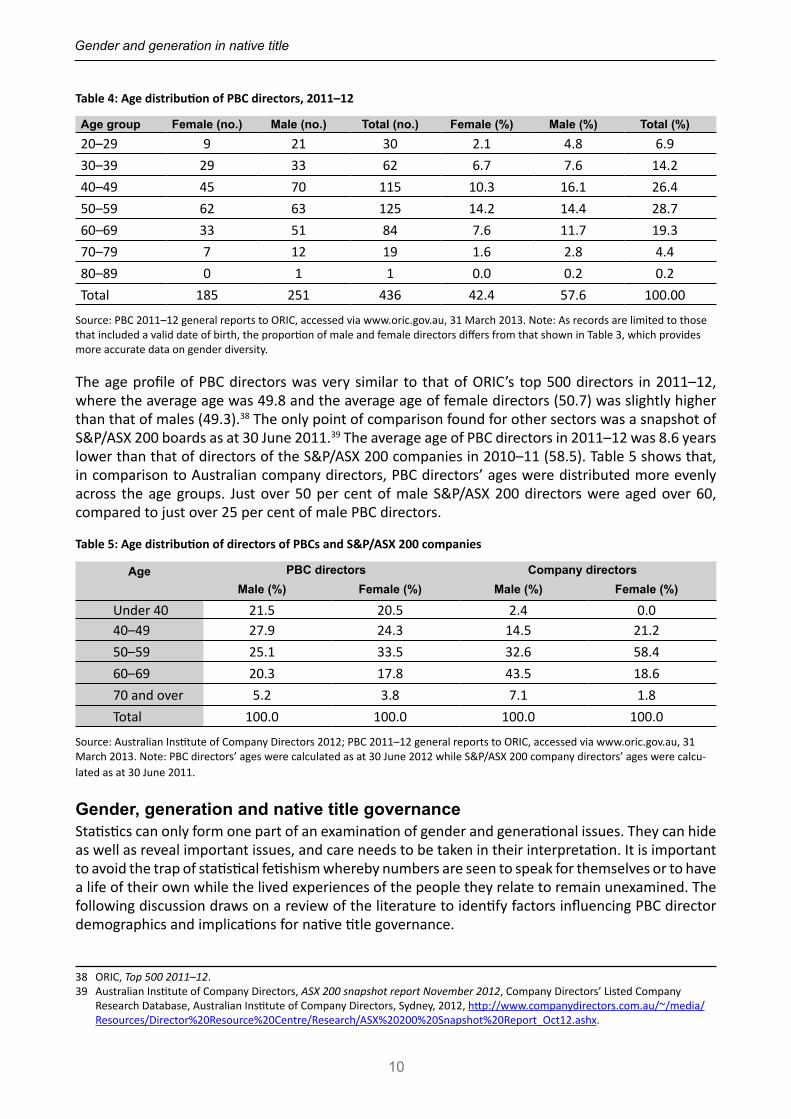
Table 4: Age distribution of PBC directors, 2011–12
Age group Female (no.) Male (no.) Total (no.) Female (%) Male (%) Total (%)20–29 9 21 30 2.1 4.8 6.930–39 29 33 62 6.7 7.6 14.240–49 45 70 115 10.3 16.1 26.450–59 62 63 125 14.2 14.4 28.760–69 33 51 84 7.6 11.7 19.370–79 7 12 19 1.6 2.8 4.480–89 0 1 1 0.0 0.2 0.2Total 185 251 436 42.4 57.6 100.00
Source: PBC 2011–12 general reports to ORIC, accessed via www.oric.gov.au, 31 March 2013. Note: As records are limited to those that included a valid date of birth, the proportion of male and female directors differs from that shown in Table 3, which provides more accurate data on gender diversity.
The age profile of PBC directors was very similar to that of ORIC’s top 500 directors in 2011–12, where the average age was 49.8 and the average age of female directors (50.7) was slightly higher than that of males (49.3).38 The only point of comparison found for other sectors was a snapshot of S&P/ASX 200 boards as at 30 June 2011.39 The average age of PBC directors in 2011–12 was 8.6 years lower than that of directors of the S&P/ASX 200 companies in 2010–11 (58.5). Table 5 shows that, in comparison to Australian company directors, PBC directors’ ages were distributed more evenly across the age groups. Just over 50 per cent of male S&P/ASX 200 directors were aged over 60, compared to just over 25 per cent of male PBC directors.
Table 5: Age distribution of directors of PBCs and S&P/ASX 200 companies
Age PBC directors Company directorsMale (%) Female (%) Male (%) Female (%)
Under 40 21.5 20.5 2.4 0.040–49 27.9 24.3 14.5 21.250–59 25.1 33.5 32.6 58.460–69 20.3 17.8 43.5 18.670 and over 5.2 3.8 7.1 1.8Total 100.0 100.0 100.0 100.0
Source: Australian Institute of Company Directors 2012; PBC 2011–12 general reports to ORIC, accessed via www.oric.gov.au, 31 March 2013. Note: PBC directors’ ages were calculated as at 30 June 2012 while S&P/ASX 200 company directors’ ages were calcu-lated as at 30 June 2011.
Gender, generation and native title governanceStatistics can only form one part of an examination of gender and generational issues. They can hide as well as reveal important issues, and care needs to be taken in their interpretation. It is important to avoid the trap of statistical fetishism whereby numbers are seen to speak for themselves or to have a life of their own while the lived experiences of the people they relate to remain unexamined. The following discussion draws on a review of the literature to identify factors influencing PBC director demographics and implications for native title governance.
38 ORIC, Top 500 2011–12.39 Australian Institute of Company Directors, ASX 200 snapshot report November 2012, Company Directors’ Listed Company
Research Database, Australian Institute of Company Directors, Sydney, 2012, http://www.companydirectors.com.au/~/media/Resources/Director%20Resource%20Centre/Research/ASX%20200%20Snapshot%20Report_Oct12.ashx.
Land, Rights, Laws: Issues of Native Title, vol. 6, no. 3, 2015
11
Sex and the PBC: gender in native title governanceThis section addresses a predominant view ‘that women have been excluded from native title… that they are marginalised, inadequately represented and play minimal roles in negotiations’.40 The demographic snapshot of PBC directors shows that in 2011–12 there were more men than women on PBC boards nationally, with significant geographical variation. The Torres Strait region stands out in terms of the predominance of male directors while the southern states had more or less equal representation of men and women on PBC boards. In any sector or society, gender imbalance raises two important, interrelated questions. First, does it reflect exclusion or marginalisation from decision-making processes? Second, does it reflect an imbalance in the distribution of costs and benefits? The data presented here is not in itself evidence of the exclusion or marginalisation of Aboriginal and Torres Strait Islander women in native title governance, and the literature and comparative data recommend caution in interpreting these findings as such.41 Data from the state, market, not-for-profit and Indigenous sectors clearly shows that gender imbalance on boards and the gendered division of corporate leadership is not peculiar to Aboriginal and Torres Strait Islander societies or the PBC sector. A key question that arises from the data is why female representation on boards within the Indigenous sector — including the PBC sector — is significantly higher than that in the mainstream state and market sectors.
Within the literature, a number of observers have contextualised and/or challenged the view of women as excluded from native title. The literature highlights the complex mix of cultural, historical, demographic and institutional factors that underlie men’s and women’s perceived or actual power and participation in native title processes. These observations reveal a further critical factor influencing gender roles and relations in the native title arena: a factor captured by the concept of ‘the intercultural’.42 Edmunds lucidly describes the intercultural factor in her discussion of continuity and change and the roles of Aboriginal women at the dawn of the native title era:
Gender relations in contemporary Australian Aboriginal communities reflect (and shape) both conditions of their incorporation into ‘Australian’ society, particularly their relations with the state, and social dynamics based on traditional structures, values and practices. Relations between Aboriginal and other Australians, and the attitudes generated by these relations, are central to the experience of all Aboriginal people. They are also crucial to understanding the positions of Aboriginal women within their own and the wider society, insofar as these remain different.43
Observing the intercultural interface in the Northern Territory township of Tennant Creek in the late 1980s, Edmunds argues that, in the 20 years prior to the recognition of native title, land rights and the growth of Aboriginal organisations had transformed relations — impacting ‘on both men and women, and on the relations between them and on the relations between them and white Australian society’.44
Observations by Edmunds and others in the pre–native title context of land claims in the Northern Territory under the Aboriginal Land Rights (Northern Territory) Act 1976 (Cth) (ALRA) formed the basis of concern during the establishment of a claims process under the NTA. Edmunds observed that, while Aboriginal men and women both held traditional knowledge and public responsibilities in relation to land, it was the men who rebuilt a place for themselves in the public sphere of land
40 Ganesharajah & McCourt, op. cit., p. 4.41 See, for example, Ganesharajah & McCourt, op. cit.; O’Faircheallaigh, op. cit.42 F Merlan, Caging the rainbow: places, politics, and Aborigines in a north Australian town, University of Hawai’i Press, Honolulu,
1998; F Merlan, ‘Explorations towards intercultural accounts of socio-cultural reproduction and change’, Oceania, vol. 75, no. 3, pp. 167–82.
43 M Edmunds, ‘Redefining place: Aboriginal women and change’, in R Howitt, J Connell & P Hirsch (eds), Resources, nations and indigenous peoples: case studies from Australasia, Melanesia and Southeast Asia, Oxford University Press, Melbourne, 1996, p. 122.
44 ibid., p. 129.
Gender and generation in native title
12
claims and organisations while women struggled to assert a public role within these new institutional settings. For Edmunds, the restriction of Aboriginal women’s contemporary role to the private or domestic sphere was a result of the redefinition of their roles by settler society rather than a reflection of tradition. Similarly, others observed that the historical legacy of misrepresentations of women’s role in Aboriginal culture had contributed to the exclusion and marginalisation of women in ALRA land claims.45 Androcentrism in the ALRA land claim process was linked to male dominance in the legal and anthropological professions and reinforcement of the colonial stereotype ‘that Aboriginal societies are male dominated and that women are essentially pawns in social life’.46 Gender bias was also seen to stem from the ALRA definition of ‘traditional Aboriginal owners’, with the orthodox view being ‘that descent is patrilineal, or at least determined by patrifiliation’.47 The absence of such a restrictive definition of traditional ownership under the NTA was subsequently seen as providing greater space for the involvement of women in native title claims.48 Wohlan notes that it soon became apparent in native title claims that ‘[c]onnection to country needed to be shown through both men and women’ and ‘women particularly showed their power in terms of family histories’.49 For O’Faircheallaigh, the NTA ‘creates legal entitlements and requirements for women claimants to be involved in agreements…and reinforces indigenous values that facilitate recognition of women’s rights and responsibilities’.50
In a number of cases, Aboriginal women have been observed as playing a critical and, at times, dominant role in native title processes. In some instances the significant involvement of women in native title processes has been linked to the demographic transformation of Aboriginal societies in the wake of colonisation. Toussaint, Tonkinson and Trigger argue that the increasing importance of matrifiliation in the contemporary assertion of rights to land is largely due to social changes including movement into towns, non-Aboriginal parentage and non-adherence to previous marriage rules. For Langton, women’s rights and roles in relation to land have often been a critical part of survival strategies in the face of demographic stress. She observes that in some areas the demographic impacts of ‘massacres, epidemics, forced removals [and the] impact of alcohol abuse, imprisonment, employment in the pastoral industry and itinerant labouring have resulted in a female gerontocracy of the remnant clans and of amalgamated customary land corporations’.51
A recent exploration of gender dimensions of two major mining agreements in western Cape York identified the demographic context — namely men’s frequent absence and women’s consistent presence within communities — as a key factor underlying women’s significant involvement in the negotiation and implementation of the agreements.52 The study also suggests that lower life expectancy and lower levels of literacy and numeracy contributed to a lower level of participation by Aboriginal men than women. Women’s participation in western Cape York community institutions such as local councils, committees and boards, their higher life expectancy and their higher education levels were seen as further enabling their participation in agreement-making and implementation. The western Cape York case studies provide an important reminder that disempowerment in native
45 See Langton, op. cit.; Rose, op. cit.; and Wohlan, op. cit. For discussion in relation to Aboriginal society and leadership more broadly, see D Bell, Daughters of the Dreaming, 2nd edn, Allen & Unwin, St Leonards, NSW, 1993; D Bell & P Ditton, Law: the old and the new — Aboriginal women in Central Australia speak out, Aboriginal History, Canberra, 1980; Brock, op. cit.; B Ivory, ‘Indigenous leaders and leadership: agents of networked governance’, in J Hunt, D Smith, S Garling & W Sanders (eds), Contested governance: culture, power and institutions in Indigenous Australia, CAEPR Research Monograph, no. 29, ANU E Press, Canberra, 2008; McGlade, op. cit.; F Merlan, ‘Gender in Aboriginal social life: a review’, in RM Berndt & R Tonkinson (eds), Social anthropology and Australian Aboriginal studies: a contemporary overview, Aboriginal Studies Press, Canberra, 1988; HL Moore, Feminism and anthropology, Polity Press, Cambridge, 1988; O’Faircheallaigh, op. cit.
46 Rose, op. cit., p. 2; see also Edmunds, op. cit.; Langton, op. cit.; Merlan, ‘Gender in Aboriginal social life’, op. cit.47 Langton, op. cit., p. 85.48 Brock, op. cit.; Langton, op. cit.49 Wohlan, op. cit., p. 522. See also Brock, op. cit.; Langton, op. cit.50 O’Faircheallaigh, op. cit., p. 1803.51 Langton, op. cit., p. 92.52 Keenan & Ramsay, op. cit.
Land, Rights, Laws: Issues of Native Title, vol. 6, no. 3, 2015
13
title processes can be experienced by men as well as women. In contrast to Edmunds’s observations from Tennant Creek, western Cape York women appear to have successfully asserted their knowledge and public responsibilities in relation to land, while men have struggled to reassert their roles.
In other cases, women’s power and influence have been seen to reside more in the private than in the public sphere. Elu provides a rare insight into gender roles and relations in Torres Strait Islander society, highlighting the importance of women’s role in the domestic domain.53 She describes how, through their role as ‘the keepers of the household, the nurturers and managers of the family’, Torres Strait Islander women have been ‘the bedrock of continuity’ during a period of great change in the Torres Strait.54 Elu states:
Usually, but not always, those who have the most social and political power in the Torres Strait are men…Men are normally the clan, local government, economic and political leaders, while women traditionally fulfil their roles in the ‘background’…women with special gifts — such as knowledge, ability, intellect and/or skill — can reach positions of importance and be respected for themselves…Social restrictions, however, mean that women have less chances to fulfil their potential.55
For Elu, Torres Strait Islander women have proved their strength in part by ‘incorporating the tenets of Christianity into the social order to reinforce balance and harmony’, as they play ‘a dominant role these days in the “theology” of family life by highlighting correct conduct in religious and social participation, church-going and prayer’.56 Elu’s perspective emphasises women’s power in keeping the family hearth and home as central to island life.
Cases from the Kimberley to Cape York and from Yolngu country to Nyungar country show that Aboriginal women’s actions and authority have often remained invisible to outside observers. Having observed Aboriginal women’s behind-the-scenes role in negotiations with mining companies in the Kimberley and Cape York regions, O’Faircheallaigh argues that women’s apparent absence from negotiations does not necessarily imply their exclusion. Observing the active role of Nyungar women in initiating native title claims in the south-west of Western Australia, Baines refers to the ‘secret life of the family’, noting that ‘the actions of generations of senior women became invisible to outsiders unless they were privileged to be invited into the domestic domain where continuities of responsibility and action were made apparent’.57 Among Yolngu people in north-east Arnhem Land, Morphy observes, women are not generally excluded from positions of leadership but ‘they do not generally attempt to exert their authority overtly in public contexts in the same way that men do’.58 Morphy notes that Yolngu women may sit on the periphery but are not marginalised, instead playing a critical role in determining whether male leaders’ decisions actually take effect. Observing a land dispute in the Cape York community of Hope Vale, Langton notes how the ‘senior women sent their sons to argue their interests in court’.59
Following O’Faircheallaigh, a complete analysis of gender in native title governance needs to look beyond the PBC board to who is setting the agenda and determining priorities. This is not to deny the potential for, and implications of, women’s exclusion or marginalisation, particularly where settler and/or Indigenous institutions have a distinct male bias or dominance in terms of ideology or personnel. The mining industry in particular has been criticised for a gender bias that has seen the
53 M Elu, ‘Cooking, walking, and talking cosmology: an Islander woman’s perspective of religion’, in R Davis (ed.), Woven histories, dancing lives: Torres Strait Islander identity, culture and history, Aboriginal Studies Press, Canberra, 2004, pp. 140–50. Thanks to Dr Julie Lahn, who provided useful references regarding gender relations in the Torres Strait.
54 ibid., pp. 141–2.55 ibid.56 ibid., pp. 142.57 Baines, op. cit., p. 80.58 F Morphy, ‘Whose governance, for whose good? The Laynhapuy Homelands Association and the neo-assimilationist turn in
Indigenous policy’, in Hunt, Smith, Garling & Sanders, op. cit., p. 129.59 Langton, op. cit., p. 106.
Gender and generation in native title
14
majority of economic benefits flow to men while social costs have fallen more heavily on women.60 For O’Faircheallaigh, women’s exclusion from negotiations surrounding major resource projects can explain their failure to share in project benefits. He argues that ‘Indigenous women’s participation and the world view they bring to negotiations is reflected in the content of the agreements…and in the distribution of benefits from them’.61 Of particular interest here, and as will be made clear in the following section, is that effective leadership and resourcing in education and health will be critical to addressing significant generational issues that confront the PBC sector and Aboriginal and Torres Strait Islander communities more broadly. From this perspective, a key concern is to ensure not only that the costs and benefits of native title are distributed equitably among men and women but also that the benefits of native title flow into the critical sectors in which women are more often the leaders.
Age and the PBC: generation in native title governanceIn 2011–12 PBC directors had a relatively youthful demographic profile, with an average age of 50. A number of observers have noted a tendency to have more middle-aged directors in the Indigenous sector. In relation to the PBC sector, Sweeney notes that:
it is usually the senior native title holders who are involved in setting up a PBC, and as time goes on their responsibilities are often assumed by middle aged native title holders who are more familiar and comfortable with taking on the roles and responsibilities as directors of the PBC.62
This echoes Ivory’s observations of Indigenous community governance in the case of Thamarrurr Regional Council in Wadeye, Northern Territory:
In about 2002, the classic leaders of the clans and ceremony informed Thamarrurr management that they were aware that there are areas of governance that require a certain level of education, energy and knowledge. They advised that they wished certain areas of their leadership to be delegated to the middle-aged emerging leaders (kake) and this occurred and continues to emerge.63
In the case of the Laynhapuy Homelands Association in north-east Arnhem Land, Morphy notes, elected Yolngu board members ‘tend to be drawn from the ranks of middle-aged leaders…Middle-aged here designates people between the ages of approximately 35 and 55…Power is ostensibly delegated [by elderly leaders] to the next generation’.64
These observations highlight age as an important aspect of governance and leadership in Aboriginal and Torres Strait Islander communities. They suggest that, as cultural leaders, elders tend to delegate corporate leadership to middle-aged people who have the necessary education, energy and experience. These observations suggest that the absence of older people from formal governance structures such as PBCs does not necessarily reflect a lack of power and influence in decision-making processes. While not necessarily being on PBC boards, senior native title holders often hold important cultural and corporate knowledge that is critical to native title governance.
A key generational concern in light of the distinctive demographic profile of the Aboriginal and Torres Strait Islander population is ensuring succession in cultural and corporate leadership. Underlying this concern is the fact that ‘there are fewer “older” Indigenous people available to take leadership and mentoring roles, and there are growing numbers of unemployed younger people
60 Minerals Council of Australia, Voluntary community investment: a strategic approach that incorporates gender — a toolkit for the extractive industry, Minerals Council of Australia, n.d.
61 O’Faircheallaigh, op. cit., p. 1802.62 A Sweeney, ‘Practical and strategic considerations for PBCs’, paper presented to the National Native Title Conference, Perth, 3–5
June 2008, p. 13.63 B Ivory, ‘Leadership: issues and principles from the Thamarrurr (Port Keats) region of the Northern Territory’, paper prepared
for the CAEPR – Reconciliation Australia ICG Project Workshop with Northern Territory Government Partners, Darwin, NT, 5 December 2005, p. 6.
64 Morphy, op. cit., p. 133.
Land, Rights, Laws: Issues of Native Title, vol. 6, no. 3, 2015
15
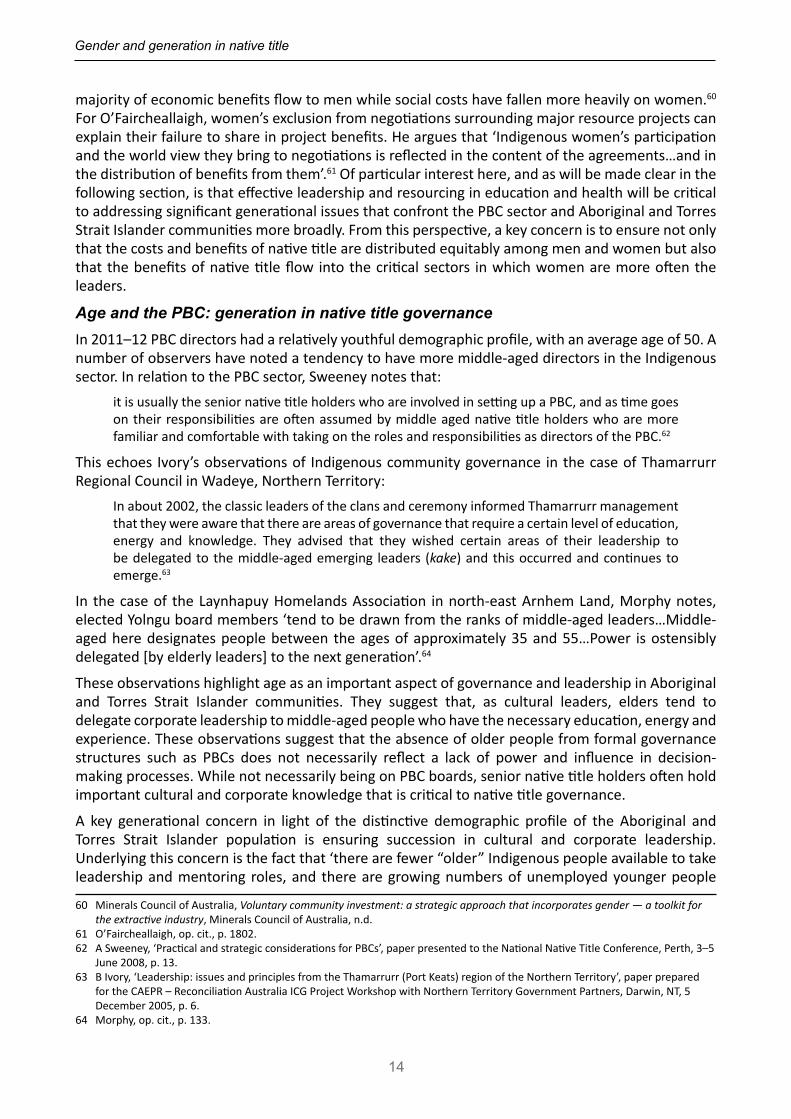
with low educational outcomes’.65 Related to this are the ‘concerns of native title holders around the intergenerational transmission of cultural knowledge’.66 The age profile of the Aboriginal and Torres Strait Islander population is more youthful than that of the non-Indigenous population (see Figure 6). The median age of the Aboriginal and Torres Strait Islander population as at the 2011 Census was 21 years, compared to 38 years for the non-Indigenous population. At the same time, life expectancy for Aboriginal and Torres Strait Islander people is significantly lower than for the non-Indigenous population. The Australian Bureau of Statistics (ABS) has calculated a life expectancy for Aboriginal and Torres Strait Islander males at birth of 67.4 years, 12.4 years less than that for non-Indigenous males (79.8 years).67 For Aboriginal and Torres Strait Islander women, life expectancy at birth is 72.3 years, 10.9 years less than for non-Indigenous females (83.2 years).
With an average age of 50 years and with 47.5 per cent of directors aged under 50, the demographic profile of PBC directors appears to place the sector in a good position in terms of both continuity and succession in corporate leadership. Biddle notes that ‘although there was an increase in all age categories over the [2006–2011] period, the greatest increase was amongst those aged 55 years and over’.68 According to the ABS, the 55 and over age group is projected to have the highest percentage
65 Hunt & Smith, op. cit., p. 2.66 McGrath, Stacey & Wiseman, op. cit., p. 34.67 Australian Bureau of Statistics (ABS), Life tables for Aboriginal and Torres Strait Islander Australians 2010–2012, cat. no.
3302.0.55.003, ABS, Canberra, 2013.68 N Biddle, Population and age structure, CAEPR Indigenous Population Project 2011 Census Papers series, no. 5, Centre for
Aboriginal Economic Policy Research, Australian National University, 2012, p. 11.
10 5 0 5 10
0–4 years5–9 years
10–14 years15–19 years20–24 years25–29 years30–34 years35–39 years40–44 years45–49 years50–54 years55–59 years60–64 years65–69 years70–74 years75–79 years80–84 years
85+ years
Per cent of population
Indigenous Non-Indigenous
Males Females
Figure 6: Age distribution of the Indigenous and non-Indigenous population, Australia, 2011
Source: ABS 2011 Census of Population and Housing, using TableBuilder Pro.
Gender and generation in native title
16
increase within the Indigenous population of Australia over the next decade.69 Projections produced for the Indigenous population of the arid and semi-arid zones, where most native title land exists, predict that the highest percentage increase over the period from 2006 to 2021 will be among those aged 45–64, with projected increases of 54 per cent for arid zones and 50 per cent for semi-arid zones.70 With almost three-quarters of PBC directors in the 40–69 age group and almost half aged under 50 in 2011–12, these projections suggest that the size of the pool from which PBCs will be able to draw directors will grow significantly over the next decade. From this perspective PBCs seem well placed to benefit from what demographers refer to as a ‘demographic dividend’.
For demographers the potential for a demographic dividend arises ‘when the bulk of the population is found in the key workforce age groups with work, savings and investments potentially highest and dependency ratios lowest’.71 While population projections suggest that such a transition is now underway, there is no guarantee that this will result in a dividend. Projections suggest a significant percentage increase (22 per cent) in the working-age population (25–44 years) in the arid zone between 2006 and 2021; this age group is expected to show the largest absolute increase in the Indigenous population in the semi-arid zone over that period.72 While this presents the potential for a demographic dividend, demographers also warn of a potential disaster.73
Taylor notes that, while investment in capacity building in remote Australia is critical, regional analysis has found resourcing to be lacking in key areas such as education, employment and training. In Cape York Peninsula the lack of meaningful work, high levels of welfare dependency, and deficiencies in skills among working-age cohorts have had significant implications for community capacity for social and economic development.74 In Wadeye in the Northern Territory, poor educational outcomes have left people ‘poorly positioned to benefit from any economic opportunities that might arise’.75 Taylor has observed a pattern in key mining regions ‘whereby younger adults are far less likely to be in mainstream employment and far more likely not to be in the labour force than older adults of working age’ with ‘levels of skill, knowledge and education…less than ideal in terms of maximising returns from demographic change’.76 Taylor argues that across remote Australia ‘the burgeoning working-age population that is emerging from demographic transition presents a very substantial social policy challenge that could reverberate for decades to come if not urgently addressed’.77
The implications of demographic change clearly extend beyond PBCs and native title governance. The key point I want to highlight here is that PBCs are increasingly important, if not critical, institutions within this context of demographic change in remote Australia. The 130-plus PBCs that now hold and/or manage native title over more than one-fifth of the Australian landmass stand to benefit from and contribute to a demographic dividend. They also stand to lose out if deficiencies in human, physical and financial resources are not addressed and if community capacity is not supported and
69 Australian Bureau of Statistics, Experimental estimates and projections, Aboriginal and Torres Strait Islander Australians, cat. no. 3238.0, ABS, Canberra, 2009.
70 D Brown, J Taylor & M Bell, ‘The demography of desert Australia’, The Rangeland Journal, vol. 30, pp. 29–43, 2008.71 N Biddle & J Taylor, Indigenous population projections, 2006–31: planning for growth, CAEPR Working Paper series, no. 56,
Centre for Aboriginal Economic Policy Research, Australian National University, 2009, p. 17.72 Brown, Taylor & Bell, op. cit.73 Biddle, op. cit.; Biddle & Taylor, op. cit.; N Jackson, ‘Educational attainment and the (growing) importance of age structure:
Indigenous and non-Indigenous Australians’, Journal of Population Research 25(2): 223–44, 2008; Taylor, Population and diver-sity, op. cit.; J Taylor, Demography as destiny: schooling, work and Aboriginal population change at Wadeye, CAEPR Working Paper series, no. 64, Centre for Aboriginal Economic Policy Research, Australian National University, 2010; J Taylor, ‘Postcolonial transformation of the Australian Indigenous population’, Geographical Research 49(3): 286–300, August 2011; J Taylor, Indig-enous population projections in mining regions: dividend or dependency?, Agreements, Treaties and Negotiated Settlements Project Working Paper series, no. 2, Agreements, Treaties and Negotiated Settlements Project, University of Melbourne, 2011.
74 J Taylor & M Bell, The Indigenous population of Cape York Peninsula, 2001–2016, CAEPR Discussion Paper series, no. 227, Centre for Aboriginal Economic Policy Research, Australian National University, 2002.
75 Taylor, Demography as destiny, op. cit., p. 48.76 Taylor, Indigenous population projections in mining regions, op. cit., pp. 19, 25.77 Taylor, Demography as destiny, op. cit., p. 49.
Land, Rights, Laws: Issues of Native Title, vol. 6, no. 3, 2015
17
strengthened. Meaningful education, employment and training opportunities are urgently required to develop the skills and knowledge of future directors of PBCs. At the same time, efforts are also needed to address concerns of native title holders around the intergenerational transmission of cultural knowledge that underpins native title and its governance.
ConclusionPBCs form a fundamental element of the native title system and over the past 20 years have grown to form a significant sector. Reviews of the roles and functions of native title organisations reveal a persistent lack of capacity within the sector.78 The findings presented in this paper indicate that PBC capacity is significantly limited due to low levels of human, financial and physical resources. Consequently PBC boards can become boards of burden — doing much of the heavy lifting of the native title system for little financial reward and relying heavily on support from native title representative bodies, native title service providers or other external bodies.
This paper has highlighted a key generational challenge for the PBC sector: the need to ensure that the directors of tomorrow have access to education, employment and training opportunities today. It will also be critical to address native title holder concerns about the intergenerational transmission of cultural knowledge that underpins native title. While demographic change has implications for PBCs, PBCs also have the potential to influence the outcomes of such change. As noted in the most recent review of the native title system, well-functioning PBCs have the potential to play an important part in empowering Indigenous communities and delivering cultural, social, environmental and economic benefits.79 Faced with the prospect of either a demographic dividend or a demographic disaster, strengthening the capacity of PBCs to realise the potential of native title may well prove critical.
While the key demographic challenge for the PBC sector identified in this paper is generational, the issue of gender, though rarely examined in relation to native title governance, is also shown to be important. This paper has presented statistical data alongside observations from the literature that either challenge or contextualise a predominant view of the exclusion and marginalisation of Aboriginal and Torres Strait Islander women in native title processes. While the gender profile of PBC directors showed that women were less likely to be represented on boards than men, this level of representation was higher than that found in the mainstream state and market sectors. Observations recorded in the literature from various locations highlight the diversity of roles and experiences of Aboriginal and Torres Strait Islander men and women across Australia. This literature suggests that the higher proportion of female directors in the Indigenous sector (including the PBC sector) compared to mainstream sectors is in part the result of demographic transformations in Aboriginal and Torres Strait Islander societies following colonisation. Case study material reveals a complex picture of cultural, historical, demographic, institutional and intercultural factors that influence men’s and women’s participation and power in native title processes. As at least one of these case studies shows, exclusion and marginalisation can be the experience of Aboriginal and Torres Strait Islander men as well as women. Also, community members may think about things not ‘in terms of women and men, or individuals, but in terms of their family or clan, or more generally “the community”’.80
Within communities gender and generational issues overlap in important ways, as do the sectors within which PBCs and other Aboriginal and Torres Strait Islander corporations operate. Data presented in this paper indicates a gendered division of corporate leadership in Aboriginal and Torres Strait Islander communities. While more men than women were directors of corporations in the employment and training sector in 2011–12, there were more female than male directors in the
78 See Attorney-General’s Department Steering Committee, op. cit.; Deloitte Access Economics, op. cit.79 See Deloitte Access Economics, op. cit., p. 2.80 Keenan & Ramsay, op. cit., p. vii.
Gender and generation in native title
18
education sector. The argument set out in this paper suggests that effective leadership in both sectors will be critical to addressing generational change in Aboriginal and Torres Strait Islander communities and achieving continuity and succession in native title governance. The benefits from building capacity in native title governance could then flow back into these and other sectors. Replacing a vicious cycle with a more virtuous one would see PBCs both benefiting from and contributing to a demographic dividend for Aboriginal and Torres Strait Islander peoples. Realising this requires addressing persistent constraints on the capacity of PBCs to meet their statutory obligations and pursue native title holder aspirations.
Published in 2015 by AIATSIS Research Publications© Australian Institute of Aboriginal and Torres Strait Islander Studies, 2015
All rights reserved. Apart from any fair dealing for the purpose of private study, research, criticism or review, as permitted under the Copyright Act 1968 (Cth), no part of this article may be reproduced or transmitted in any form or by any means, electronic or mechanical, including photocopying, recording or by any information storage and retrieval system, without prior permission in writing from the publisher. The Act also allows a maximum of one chapter or 10 per cent of this article, whichever is the greater, to be photocopied or distributed digitally by any educational institution for its educational purposes provided that the educational institution (or body that administers it) has given a remuneration notice to the Copyright Agency Limited (CAL) under the Act.
The views expressed in this series are those of the author and do not necessarily reflect the official policy or position of the Australian Institute of Aboriginal and Torres Strait Islander Studies.
Australian Institute of Aboriginal and Torres Strait Islander Studies (AIATSIS)GPO Box 553, Canberra, ACT 2601Phone: (61 2) 6246 1111Fax: (61 2) 6261 4288Email: [email protected]: aiatsis.gov.au/publications/research-publications
Cataloguing-in-Publication details are available from the National Library of Australia, www.trove.nla.gov.au.
Suggested citation: Buchanan, G 2015, Gender and generation in native title: director demographics and the future of prescribed bodies corporate, Land, Rights, Laws: Issues of Native Title series, vol. 6, no. 3, AIATSIS, Canberra.
AIATSIS acknowledges the support of the Department of the Prime Minister and Cabinet (PM&C).
ISSN 2204-6607ISBN 978-1-922102-32-4
About the author
Geoff Buchanan is a project officer at the Native Title Research Unit, Australian Institute of Aboriginal and Torres Strait Islander Studies. He previously worked as a research officer with the Centre for Aboriginal Economic Policy Research at the Australian National University where he is currently completing a PhD in anthropology. For over a decade he has been engaged in multidisciplinary research that has combined qualitative and quantitative methods and drawn on anthropological, demographic, ecological, economic, geographical, Indigenous, legal and policy perspectives.
AIATSIS Research Publications