Behaviours versus Demographics as Identifiers of CHAID Splits
19
Behaviours Versus Demographics as Predictors of Segment Membership Christopher Riquier, Rachel Kennedy and Byron Sharp Marketing Science Centre University of South Australia Riquier, Christopher;Kennedy, Rachel; Sharp, Byron (1998) "Behaviours Versus Demographics as Identifiers of CHAID Splits: Implications for Segment Formation", Journal of Segmentation in Marketing, Vol.2, No.1, p.111-129. Demographic variables have traditionally been adopted as bases and descriptors for segmentation studies due to their inherent convenience and their conformance to the golden rules of measurability, substantiality, accessability and actionability. Despite significant research in the field of segmentation, little has examined the power of demographics versus other, more behavioural variables, in predicting segment membership. This paper uses data from a large empirical study to investigate the predictive power of a range of segmentation variables. Specifically, the ability to predict segment membership using descriptive demographics is compared to the predictive ability of other behaviours. Segments are determined by propensity to react to particular marketing stimuli. Propensity to react is measured using the Juster scale based verbal probability scale. For the product category examined, results highlight a stronger ability of behaviours in predicting segment membership. Results as such highlight the additional wealth that behavioural descriptors can provide to segmentation studies in addition to having significant implications for the facilitation of marketing and communication strategies for segments. Keywords: segmentation, demographic, behavioural, probabilistic segmentation Christopher Riquier (B.Bus., M.Bus. research) and Rachel Kennedy (B.Bus. hons.) are Senior Research Associates at the Marketing Science Centre. Byron Sharp (B.Bus., M.Bus. research) is Director of the Marketing Science Centre.
Transcript of Behaviours versus Demographics as Identifiers of CHAID Splits

Behaviours Versus Demographics as Predictors of Segment Membership
Christopher Riquier, Rachel Kennedy and Byron Sharp
Marketing Science Centre
University of South Australia
Riquier, Christopher;Kennedy, Rachel; Sharp, Byron (1998) "Behaviours Versus
Demographics as Identifiers of CHAID Splits: Implications for Segment Formation",
Journal of Segmentation in Marketing, Vol.2, No.1, p.111-129.
Demographic variables have traditionally been adopted as bases and descriptors for segmentation
studies due to their inherent convenience and their conformance to the golden rules of
measurability, substantiality, accessability and actionability. Despite significant research in the
field of segmentation, little has examined the power of demographics versus other, more
behavioural variables, in predicting segment membership.
This paper uses data from a large empirical study to investigate the predictive power of a range of
segmentation variables. Specifically, the ability to predict segment membership using descriptive
demographics is compared to the predictive ability of other behaviours. Segments are determined
by propensity to react to particular marketing stimuli. Propensity to react is measured using the
Juster scale based verbal probability scale.
For the product category examined, results highlight a stronger ability of behaviours in predicting
segment membership. Results as such highlight the additional wealth that behavioural
descriptors can provide to segmentation studies in addition to having significant implications for
the facilitation of marketing and communication strategies for segments.
Keywords: segmentation, demographic, behavioural, probabilistic segmentation
Christopher Riquier (B.Bus., M.Bus. research) and Rachel Kennedy (B.Bus. hons.) are Senior
Research Associates at the Marketing Science Centre. Byron Sharp (B.Bus., M.Bus. research) is
Director of the Marketing Science Centre.

Introduction
Segmentation, a well-known concept to readers of this journal, involves the process of dividing a
market into groups of buyers or potential buyers who are similar to each other but different from
other buyer and potential buyer groups. The aim and practical significance of the segmentation
exercise being that payoffs are likely to be greater if companies match their products and
marketing offerings to particular segments . Wind and Beane and Ennis provide more details
for those new to the area.
While it is not necessary or indeed often possible to identify the members of a segment,
traditional views of segmentation assume that this is a requirement and certainly there are a
number of targeting advantages of knowing who constitutes the core segments in a market. This
is one of the reasons that descriptive, identifiable and hence actionable demographic variables
have been so popular as segmentation bases. Other bases for segmentation have also been used
but less regularly, including psychographics, geographics and different behaviours (including
other buying behaviours).
Demographic segmentation appears to be the most prevalent form of market segmentation as
measurement is easily understood, interpreted and transferable between studies . For certain
categories such as infant products which change with the childs age and femine hygiene products
demographic variables are an obvious choice, however, in many cases they will produce no clear
or actionable segments.
Behaviour, the alterative segmentation variable that is compared in this paper, can take many
forms including, purchase occasion, benefits sought, degree of usage and degree of loyalty .
Specific examples of the types of demographic variables and other behaviours used and
compared in this study include;
Demographics Other Behaviours Age Attendance at sporting events Gender Cinema attendance Occupation Eating Out Education Going to the beach

Segmentation & the Role of Identifying Variables
Segmentation is the process of dividing a market up, with the intention of targeting marketing
activities toward specific segments based on a relevant underlying factor such as propensity to
purchase or react to marketing stimuli. Segments must consist of different buying demand. The
buying behaviour within each segment will be relatively homogeneous and different from that of
other segments. It therefore follows that segments may or may not consist of different
buyers/individuals (or types of buyers). Thus there is:
1. Segmentation where membership of each segment is identified, or at least, membership of the
core segment(s) is identified.
2. Segmentation where membership is not identified because buyers continuously move
between segments. While a particular interaction of, say, situation and person may identify
membership, such identification is still extremely complex and often impractical. Thus you
may know that there is a segment of the market (say 20%) which buys the flavour strawberry.
So you might want no more than 20% of your (say ice cream) brands' flavour combinations to
be strawberry, and you know that your strawberry brand is unlikely to gain share above 20%.
But you probably don't know who these strawberry buyers are. Most people buy strawberry
at some time. The demographic (etc) profile of strawberry buyers may be slighly different
but overall pretty much the same as vanilla buyers (largely because they are the same people).
Textbooks and market research studies tend to infer that the first type of segmentation is most
common. Marketing practitioners the world around have upheld this view probably due only to
its simplicity and hence attractiveness. In fact the opposite is true. As (at least in the area of
FMCG’s) consumers hold a repertoire of brands from which they regularly select, consumers
also, by current segmentation practices, belong to a repertoire of segments for an individual
product category. Using the ice cream example, the same individual will likely fit into a segment
profile for strawberry and vanilla flavour consumers, but possibly also into the chocolate and all
other flavours of ice cream segments. This segment cross-pollenation reduces signficantly the
utility of the segmentation process and makes for a difficult targetting process for marketing
activities. A common fallacy leading to such circumstance is the attempt to achieve total
segmentation. Total segmentation is the attempt to segment the entire market using one of the
many bases for segmentation currently available. Total segmentation is most easily facilitated
using demographic bases but has rarely led to marketing success .
The fact that segments do not appear to consist of easily identifiable members has and will not in
the near future diminish the desirability of being able to identify which individuals (&/or when
these individuals) belong to which segment and which of these segments exhibit higher
propensities to purchase or adopt a particular marketing offerring. Today, more than ever,
marketers have at their fingertips the ability to target individuals, thanks to technologies such as
database mailings, the internet, smart cards, and a more fragmented “mass” media. However, this
ability can not be exploited without being able to identify who belongs, and does not belong, to
the segment(s) which the marketer is aiming for.
The researchers postulate that it is the reliance on traditional demographics as segmentation bases
and descriptors that has led to the decline in the utility of the segmentation process. A key
objective of any segmentation exercise is to identify groups of individuals with greater propensity
to react to a particular marketing stimuli. Still to this day, marketers have placed great emphasis
on apparently inefficient demographics as identifying variables despite their (often) lack of a
relationship with purchase propensity. This is largely due to the widespread availability and
convenience of demographic statistics rather than their effectiveness at predicting segment
membership. In addition, demographics have been upheld by practitioners due to their
conformance to Kotler’s segmentation criteria of measurability, substantiality, accessability and
actionability. What is most often overlooked is the criteria added by Mitchman that
segmentation studies should be “meaningful”. Meaningful segments will be identified by the
products they currently use or need.
Traditional segmentation studies tend to utilise the firms perspective rather than the customers
needs when assigning a basis for segmentation. Ultimately this has resulted in segmentation
bases which are easily measurable, easily understood, easily interpreted, easily gathered, and
easily compatible with external data sources (ie. census data). On the downside, however, such
segmentation bases (often demographic) have exhibited little if any correlation with actual
purchase behaviour of individuals within the segments.
Demographics have typically performed reasonably well in predicting market membership (eg.
women tend to buy dresses) but have performed less well in predicting segment membership (eg.
which women buy brand x rather than brand y and which women are very price sensitive and
which women aren’t?) and worst of all in predicting future buying behaviour. This has lead to
marketers experimenting with other potential identifying variables, including complex
multivariate combinations, such as intentions, preferences, attitudes, personality profiles, values,
and psychographics.
The search for other identifying variables has very much reflected the impact of cognitive
psychology on marketing, and as a result behavioural variables have been somewhat overlooked.
Yet intuitively since segments themselves reflect different buying behaviours it is reasonable to
expect that these particular behaviours might be correlated to other behaviours, particularly other
buying behaviours. This line of thinking is very much in line with modern behaviourist theories.
Mitchell suggests but provides little support for the notion that the usefulness of demographic
segmentation bases is related to the extent with which they can be correlated with behavioural
tendancies. The true test of geographics and demographics is how well they perform against
other behaviours as segment descriptors using a propensity to react (behavioural) base for
segmentation.
In this paper we examine the effectiveness of such behavioural variables at predicting segment
membership based on propensitiy to react to a particular stimuli. We segment a market in terms
of propensity of individuals to react to various potential future marketing scenarios, and we then
compare the ability of demographic variables to behavioural variables to identify segment
membership.
Methodology
Traditional segmentation models involve the selection of a basis for segmentation (dependent
variable) in addition to a series of descriptors (independent variables) used to define the identified
(objective) or specified (subjective) segments . Wind’s extensive review of the segmentation
literature reveals that all possible variables appear to have been used as bases and/or descriptors
for segmentation studies. These variables include general customer characteristics:
• demographic and socio economic characteristics
• personality and lifestyle characteristics
• attitudes and behaviour toward mass media and distribution outlets

and situation specific customer characteristics including:
• product usage and purchase patterns
• attitudes toward the product and its consumption
• benefits sought in a product category
• responses to specific marketing variables including new product concepts and advertising
In this segmentation study which aimed to objectively evaluate the use of behavioural versus
demographic descriptors of segmentation, a segmentation base independent of such variables was
required. To meet this need a sophisticated form of probabilistic market segmentation using a
segmentation base of propensity to react to marketing stimuli was developed and adopted as the
methodology.
Probabilistic Market Segmentation
The probabilistic market segmentation device incorporated two major elements; the verbal
probability scale and chi-square automatic interaction detection (CHAID). Probabilistic market
segmentation incorporates the verbal probability scale as the dependent variable in the survey
instrument. CHAID is used to identify the most significant predictors (descriptors) of the
dependent variable. The range of predictor variables utilised is limited only by the length and
complexity of the survey instrument. Each element of the probabilistic market segmentation
device is discussed in following sections.
The Verbal Probability Scale
The verbal probability scale is the verbal equivalent of the Juster scale of purchase probability.
Juster originally proposed the use of an eleven point probability scale to overcome inaccuracies
in earlier purchase intention scales. Such purchase intention scales predominantly utilised a
range of verbal intention descriptors ranging from three to nine points . The shorter scales,
particularly yes-unsure-no, placed obvious limitations on respondents while larger versions
suffered from the varying interpretations of respondents . These issues were highlighted in a US
census which found that 70% of automobile purchases were made by respondents stating no
purchase intention . Of those respondents who intended purchasing, only 40% reflected this
intention in their behaviour.

Juster’s probability scale (table 1) was based on the argument that verbal intentions are really
disguised probability statements. He believed respondents to be familiar with the concept of
chances or odds out of ten and that such familiarity would both facilitate questionnaire
administration and increase the accuracy of response.
Table 1 - Juster Probability Scale
Scale Point Verbal Equivalent
10 Certain, practically certain (99 chances in 100)
9 Almost sure (9 chances in 10)
8 Very probable (8 chances in 10)
7 Probable (7 chances in 10)
6 Good possibility (6 chances in 10)
5 Fairly good possibility (5 chances in 10)
4 Fair possibility (4 chances in 10)
3 Some possibility (3 chances in 10)
2 Slight possibility (2 chances in 10)
1 Very slight possibility (1 chance in 10)
0 No chance, almost no chance (1 chance in 100)
Juster’s original testing of the scale extended to 6, 12 and 24 month purchase probabilities for
cars and other durables for 451 respondents. Results showed no tendency toward the scale
midpoint. When compared to intentions scale data collected on the same group of respondents,
purchase probabilities explained twice as much of the variance in actual purchase rates as buying
intentions data . In addition, 5% of respondents indicating zero purchase probability actually
purchased compared to 11% as indicated by the intentions scale.
The Juster scale has since been used for the prediction of purchase rates and adoption for many
different product categories, for high and low involvement products and over varying periods in
time .
The biggest limitation associated with the Juster scale was that almost all executions used
personal or mail survey methodologies. This is not surprising, given the limited ability of
respondents in remembering more than four or five response categories . In an attempt to
overcome this limitation, Brennan, Hini and Esslemont tested three potential telephone survey

techniques; an eleven category verbal probability scale, a branched eleven category verbal scale
and a pre posted Juster scale.
The branched scale was abandoned due to its laborious nature. The key finding resulting from
testing of the remaining two techniques was that they both produced relatively comparable results
in addition to their ease of use. Testing of the two techniques was replicated by Brennan et al
involving significantly greater sample sizes. Again results suggested that both techniques are
appropriate for this form of data collection, with similar response rates, refusal rates, levels of
accuracy and ease of administration.
The verbal probability scale is an eleven point scale from 0 to 10. The higher the score recorded
represents a higher probability of adoption. A score of 10 would mean the respondent is
practically certain they would adopt the product. A score of zero would mean there is no chance
or almost no chance of adopting the product. The Juster scale (table 1) is basically the written
equivalent of the verbal probability scale.
The verbal probability scale was adopted in preference to the Juster scale in the empirical study
conducted for this research project due to the practicalities of cost and the time of administration
of a telephone based survey instrument.
Chi-Square Automatic Interaction Detection (CHAID)
The second component of probabilistic segmentation is the analysis technique, chi-square
automatic interaction detection (CHAID). CHAID was used for all statistical analysis in this
research project. Although statistically complex, CHAID is relatively straightforward in terms of
application. A full description of the workings of CHAID is beyond the scope of this paper,
however, a brief overview follows.
CHAID uses a semi-hierarchical sequential procedure for partitioning a contingency table .
CHAID analysis consists of three key elements. Firstly, the chi-square significance test. This is
used to identify the most significant predictors within the data. A key strength of the chi-square
test is that few assumptions need to be made of the data. Secondly, the Bonferroni correction
adjusts for the problem of when the numbers of degrees of freedom for the chi-square test are too
small . The third element is an algorithm used to combine categories of predictor variables (ie
scale points on the verbal probability scale).

Predictors that contain three or more categories are pre defined as either monotonic, free or float.
These definitions affect the CHAID category merging algorithm . Categories of a predictor
variable may be merged where there is no statistically significant difference between categories.
Predictors defined as monotonic, generally ordinal variables, may only have adjacent categories
combined. Float variables are identical except that the last category may be combined with any
other category, to account for missing value categories. Nominal variables are defined as free
such that their categories may be combined in any order or grouping. As verbal probability
scales were the predictor variable in all analyses conducted for this research, predictors were
classified as monotonic.
CHAID for SPSS which was used in this research, first selects the smallest number of splits of
the categories of a predictor using pairwise merging and splitting of the response levels of each
predictor variable . Once the new categories have been determined, the original sample response
is split using the most significant predictor. Each of the sub-groups is then regarded as a new
parent subgroup and is split in a similar fashion. The analysis proceeds down additional levels
until the size of the group becomes too small or there are no further significant splits .
The Segmentation Study: Government Cycling Initiative
A specific government body was established in the relevant market with the sole purpose of
doubling cycling by the year 2000. This body formed part of the larger government transport
department which controlled all roads, public transport and related facilities. Hence, the body
had influence over the construction of cycling related facilities, over the implementation and
administration of the relevant legislation and over the provision of community education which
could potentially encourage more people to cycle and existing cyclists to cycle more often.
The first stage of the study was qualitative, with six focus groups being conducted to determine
the key issues, attitudes and behaviours of the various groups of cyclists and non-cyclists and
specifically to explore avenues that would lead to a doubling of cycling. Six specific segments
were identified a priori and were made the focus of the study. Specifically the segments were;
commuter cyclists, recreational cyclists, children who cycle to school, children who do not cycle
to school, non-cyclist commuters and potential recreational cyclists. These segments were
upheld by the government cycling body and correlated well with their previously implemented
segmentation strategy.

Quantitative research was then conducted to ascertain the potential increase in cycling that would
result from changes to cycling facilities, regulations, parking, education and information
provision. Thirty seven scenarios encompassing such changes were devised by the researchers
and the government body and the potentials of these scenarios to increase cycling were tested
using the verbal probability scale. Respondents were asked what was their likelihood of
increasing their cycling (or adopting cycling for non-cyclists) if the scenario were implemented.
The survey instrument was administered by telephone to a random sample of 600 respondents
from all 6 segments. It encompassed the following 40 demographic and behavioural variables
(table 2) as well as the 37 verbal probability scale items relating to the proposed cycling related
changes (scenarios). In addition to the demographic and behavioural variables included as
potential segment descriptors, the a priori segment classifications (mentioned above) were
included as potential descriptors (in the probabilistic segmentation analysis) to ascertain if they
held any relationship to the propensity to react to the proposed cycling changes (scenarios).

Table 2 - Cycling Study Demographic and Behavioural Variables
Demographic Variables Explanation
Age Of respondent in years
Education Highest level achieved by respondent
Employment status Using standard classifications (professional, clerical,
unemployed)
Industry of employment Australian Standard Industry Coding
Household income Combined household income level
Household size Number of persons in household
Home to employment Distance in kilometres
Home to shops Distance in kilometres
Home to own education Distance in kilometres
Home to downtown Distance in kilometres
Home to child’s school Distance in kilometres
Home languages Main languages spoken at home
Home address Postcode
Work address Postcode
Gender Male/Female
Behavioural Variables
Main commuting method To/from work, education, etc.
Currently cycle Respondent is currently a cyclist
Learn to cycle age Age when first learnt to cycle
First cycle age Age when first received/bought cycle
Cycle collision Accident with motor vehicle while cycling
Cycle near miss Near miss with motor vehicle while cycling
Multi mode transport Use multi mode transport (combination of car/train etc.)
Cycling organisation Member of cycling organisation
Outdoor activity Recently participated in outdoor activity
Library Visited library in past month
Beach Visited beach in past month
Bike store Visited bike store in past month
Fast food Visited fast food outlet in past month

Theatre Visited theatre (live) in past month
Cinema Visited cinema in past month
Cafe Visited cafe in past month
Sports ground Visited sports ground/stadium in past month
Promo aware Awareness of cycling promotions
Drivers licence Whether respondent holds drivers licence
Own/access car Ownership or access to a motor vehicle
Hit cyclist, driving Collided with cyclist while driving a motor vehicle
Frequency of cycling Daily, weekly, monthly
Time - cycle Time of day that respondent currently cycles (cyclists only)
Cycling classification From a priori classifications ie commuter cyclist, recreational
cyclist, etc
Results
Individual CHAID analyses were conducted for each of the 37 scenarios. A basic example of
such an analysis follows.
Figure One - CHAID Analysis for Cycling Scenario 24
Own/have access to carLow - 32%Med - 16%High - 53%
Don't have a carLow - 9%Med - 30%High - 61%
Use multimodeLow - 28%Med - 18%High - 54%
Don't use multimodeLow - 49%Med - 14%High - 36%
Cycling ScenarioTwenty Four
Most significant predictor
(use of multimode transport)
2nd most significant predictor
(whether respondent owns or
has access to a car)
This particular scenario related to trains being fitted with ample, easily accessed spaces with
anchor mechanisms that secure bikes in transit.
The most significant predictor, that is, the demographic or behavioural variable which best
described those most likely to respond to the scenario (eg those who felt that they would be
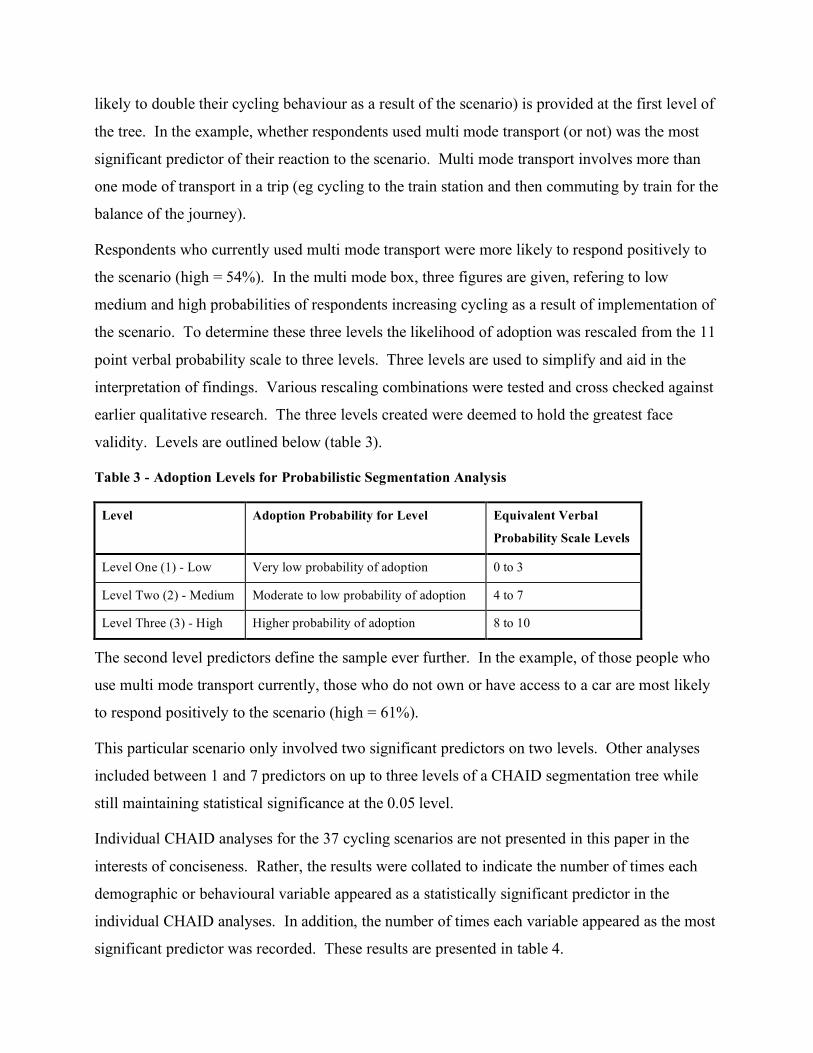
likely to double their cycling behaviour as a result of the scenario) is provided at the first level of
the tree. In the example, whether respondents used multi mode transport (or not) was the most
significant predictor of their reaction to the scenario. Multi mode transport involves more than
one mode of transport in a trip (eg cycling to the train station and then commuting by train for the
balance of the journey).
Respondents who currently used multi mode transport were more likely to respond positively to
the scenario (high = 54%). In the multi mode box, three figures are given, refering to low
medium and high probabilities of respondents increasing cycling as a result of implementation of
the scenario. To determine these three levels the likelihood of adoption was rescaled from the 11
point verbal probability scale to three levels. Three levels are used to simplify and aid in the
interpretation of findings. Various rescaling combinations were tested and cross checked against
earlier qualitative research. The three levels created were deemed to hold the greatest face
validity. Levels are outlined below (table 3).
Table 3 - Adoption Levels for Probabilistic Segmentation Analysis
Level Adoption Probability for Level Equivalent Verbal
Probability Scale Levels
Level One (1) - Low Very low probability of adoption 0 to 3
Level Two (2) - Medium Moderate to low probability of adoption 4 to 7
Level Three (3) - High Higher probability of adoption 8 to 10
The second level predictors define the sample ever further. In the example, of those people who
use multi mode transport currently, those who do not own or have access to a car are most likely
to respond positively to the scenario (high = 61%).
This particular scenario only involved two significant predictors on two levels. Other analyses
included between 1 and 7 predictors on up to three levels of a CHAID segmentation tree while
still maintaining statistical significance at the 0.05 level.
Individual CHAID analyses for the 37 cycling scenarios are not presented in this paper in the
interests of conciseness. Rather, the results were collated to indicate the number of times each
demographic or behavioural variable appeared as a statistically significant predictor in the
individual CHAID analyses. In addition, the number of times each variable appeared as the most
significant predictor was recorded. These results are presented in table 4.

Table 4 - Demographic and Behavioural Predictors
Demographic Variables Most Significant Predictor Significant Predictor
Age
Education
Employment status
Industry of employment
Household income
Household size
Home to employment
Home to shops
Home to own education
Home to downtown
Home to child’s school
Home languages
Home address
Work address
Gender
TOTAL 18 38

Table 4 - Demographic and Behavioural Predictors (cont...)
Behavioural Variables Most Significant Predictor Significant Predictor
Main commuting method
Currently cycle
Cycling reason
Learn to cycle age
First cycle age
Cycle collision
Cycle near miss
Multi mode transport
Cycling organisation
Outdoor activity
Library
Beach
Bike store
Fast food
Theatre
Cinema
Cafe
Sports ground
Drivers licence
Own/access car
Hit cyclist, driving
Cyclists in household
Frequency of cycling
Time - cycle
Cycling classification
(a priori segmentation)
TOTAL 19 56

Discussion
Expectations of the practitioners1 involved in this project were that demographic variables would
emerge from the CHAID analyses as the most significant predictors of responsiveness to the
proposed changes (scenarios). In addition, the practitioners were confident that the a priori
segment classification would be the most significant predictors of propensity to react to the
scenarios. On the second point, it should be noted that cycling classification only emerged twice
as a significant predictor (once as most significant predictor for a scenario) in the CHAID
analysis, of a total of 94 significant predictors. Clearly, the a priori segmentation performed
poorly and would have been detrimental to the objectives of the government cycling body.
Table four presents the results for the thirty seven scenarios from the cycling study. Each
scenario was tested using the verbal probability scale to ascertain whether it would increase
cycling (if respondent was currently a cyclist) or encourage uptake of cycling (if respondent was
not currently a cyclist).
The results presented in table four demonstrate that demographic variables are by no means the
most appropriate means of targeting those individuals most likely to respond to the initiatives
implemented by this government body. Of the 37 scenarios tested using the probabilistic market
segmentation tool, 18 of the most significant predictors of increased cycling were demographic,
while 19 of the most significant predictors were behavioural.
Although demographics showed a fair degree of predictive power the results still highlight the
inappropriateness of solely using demographic variables for segmentation and targeting. The
point is strengthened when all significant predictors that emerged from the 37 cycling CHAID
analyses are examined.
As CHAID analysis continues until all statistically significant predictors emerge (at the 0.05
level), many other variables were incorporated into the final CHAID analyses. At face value,
these predictors display a similar pattern to the “most” significant predictors.
A total of 94 significant predictors emerged from the 37 CHAID analyses. Of these, 38 (40%)
were classified as demographic variables while 56 (60%) were classified as behavioural
variables.
1 Practitioners from the government cycling body were consulted at all stages of this research project.

Conclusion
While Beane and Ennis suggest that many different ways exist to segment a market and that one
must remain creative when conducting segmentation research, it still remains important to
validate and compare the usefulness of the different techniques available. It is hoped that this
article helps build the knowledge pool that will guide market segmentation studies in the future.
A paper on segmentation would not be complete without some note of the long standing
criticisms of segmentation. Wright in listing the key criticims of “segmentation” includes it
being confused with variety marketing or product differentiation, that the process to identify
segments is frequently flawed, that there is no logical reason for payoffs to be greater under target
mareting, that segment membership is not stable over time and that empirical results fail to
demonstrate the patterns of purchase which are expected to arise from target marketing. While
these criticisms are accepted, the empirical evidence does not yet negate segmentation from
marketing altogether and thus the criticisms support the need to test alternative approaches to
segmentation for stability and usefulness.
Implications
It is the analysis of research projects such as the one presented in this paper that will help to
dispel the myth that demographic variables alone are suitable for segmenting markets and
targeting particular groups of consumers. This too is only an initial step in the larger
investigation into the value and role of segmentation in marketing.
Overall the study has highlighted that the use of behavioural variables can add additional wealth
to studies that currently use only demographics to understand a particular group of respondents.
In addition to just understanding who comprises a segment, the use of behavioural variables has
the practical benefit of facilitating communication with a segment. In the cycling study for
instance the fact that cyclists had a high propensity to visit cafes and sporting events but a low
propensity to go to the cinema guided the marketers of the cycling facilities in their promotions
plan for the new changes.
The results also highlight the benefits of conducting probabilistic segmentation research prior to
implementation of segmentation strategies. Even in new product categories where little
knowledge of demand exists, such probabilistic research can provide accurate estimations of

segment size and propensity to react to the offerring, in addition to providing appropriate segment
descriptors.
References
Aaker, David A., and George S. Day. Marketing Research. 4th ed. New York: John Wiley and Sons, 1990.
Baron, Steve, and Dianne Phillips. “Attitude Survey Data Reduction Using CHAID: An Example in Shopping Centre Market Research.” Journal of Marketing Management 10 (1994): 75-88.
Beane, T.P., and D.M. Ennis. “Market Segmentation: A Review.” European Journal of Marketing 21, no. 5 (1987): 20-42.
Brennan, Mike, and Don Esslemont. “The Accuracy of the Juster Scale for Predicting Purchase Rates of Branded, Fast-Moving Consumer Goods.” Marketing Bulletin, no. 5 (1994): 47-53.
Brennan, Mike, Don Esslemont, and Dean Hini. “Obtaining Purchase Predictions Via Telephone Interviews.” Paper presented at the Australian Marketing Conference, Adelaide 1994. Brennan, Mike, Don Esslemont, and Dean Hini. “A Test of Three Methods for Estimating Levels of Purchase.” Paper presented at the Academy of Marketing Science - World Marketing Congress, Melbourne 1995. Brennan, Mike, Dean Hini, and Don Esslemont. “Obtaining Purchase Probability Data Via Telephone Surveys: A Preliminary Test of Two Techniques.” Marketing Bulletin, no. 5 (1994): 64-70.
Day, Dianne, Boon Gan, Philip Gendall, and Don Esslemont. “Predicting Purchase Behaviour.” Marketing Bulletin 2 (1991): 18-30.
Juster, F. Thomas. Anticipations and Purchases - An Analysis of Consumer Behavior. Princeton, New Jersey: Princeton University Press, 1964.
Kotler, Philip. Marketing Management: Analysis, Planning Implementation, and Control. 7th ed. New Jersey: Prentice-Hall, Englewood Cliffs, 1991.
Magidson, Jay. SPSS for Windows CHAID. 6 ed. USA: Statistical Innovations, 1993. Mitchell, Vincent-Wayne. “Questioning the Role of Descriptor Variables in Market Segmentation.” Journal of Targeting, Measurement and Analysis for Marketing 5, no. No. 2 (1996): 95-103.
Mitchman, R. Lifestyle Market Segmentation. New York: Praeger, 1991. Theil, H, and RF Kosobud. “How informative are consumer buying intentions surveys?” Review of Economics and Statistics 41, no. 1 (1968): 1-11. Wind, Yoram. “Issues and Advances in Segmentation Research.” Journal of Marketing Research 15, no. August (1978): 317-337. Worcester, R.M., Burns,T.R. “A statistical examination of the relative precision of verbal scales.” Journal of the Market Research Society 17, no. 3 (1975): 181-197.

Wright, Malcolm. “Segmentation and Targeting: Some Criticisms.” Paper presented at the N.Z. Marketing Educators Conference, Hamilton 1994.