Population based resource allocation: The use of hybrid risk adjustment
24
Population based resource allocation: the use of hybrid risk adjustment Manuel García-Goñi Universidad Complutense de Madrid Pere Ibern Universitat Pompeu Fabra José María Inoriza Serveis de Salut Integrats Baix Empordà Address for correspondence: Manuel García-Goñi, Universidad Complutense de Madrid, Departamento de Economía Aplicada II. Campus de Somosaguas. 28223 Pozuelo de Alarcón, Madrid, Spain. Email: [email protected] Tel: +34913943235; Fax: +34913942457. Keywords: health expenditures, hybrid risk-adjustment, morbidity, clinical risk groups. Words in main text: 3963 JEL Classification: I18 * Title Page (showing Author Details)
Transcript of Population based resource allocation: The use of hybrid risk adjustment
Population based resource allocation: the use of hybrid risk adjustment
Manuel García-GoñiUniversidad Complutense de Madrid
Pere IbernUniversitat Pompeu Fabra
José María InorizaServeis de Salut Integrats Baix Empordà
Address for correspondence: Manuel García-Goñi, Universidad Complutense de Madrid, Departamento de Economía Aplicada II. Campus de Somosaguas. 28223 Pozuelo de Alarcón, Madrid, Spain. Email: [email protected] Tel: +34913943235; Fax: +34913942457.
Keywords: health expenditures, hybrid risk-adjustment, morbidity, clinical risk groups.
Words in main text: 3963
JEL Classification: I18
* Title Page (showing Author Details)

Population based resource allocation: the use of hybrid risk adjustment
Abstract
Objectives: The emphasis on integrated care implies new incentives that promote coordination
between levels of care. Considering a population as a whole, the resource allocation system
has to adapt to this environment. This research is aimed to design a model that allows for
morbidity related prospective and concurrent capitation payment. The model can be applied in
publicly funded health systems and managed competition settings.
Methods: We analyze the application of hybrid risk adjustment versus either prospective or
concurrent risk adjustment formulae in the context of funding total health expenditures for the
population of an integrated healthcare delivery organization in Catalonia during years 2004 and
2005.
Results: The hybrid model reimburses integrated care organizations avoiding excessive risk
transfer and maximizing incentives for efficiency in the provision. At the same time, it eliminates
incentives for risk selection for a specific set of high risk individuals through the use of
concurrent reimbursement in order to assure a proper classification of patients.
Conclusion: Prospective Risk Adjustment is used to transfer the financial risk to the health
provider and therefore provide incentives for efficiency. Within the context of a National Health
System, such transfer of financial risk is illusory, and the government has to cover the deficits.
Hybrid risk adjustment is useful to provide the right combination of incentive for efficiency and
appropriate level of risk transfer for integrated care organizations.
Abstract
1
Population based resource allocation: the use of hybrid risk adjustment
1. Introduction
The design of the incentives in health care represents a continuous challenge. Beyond payment
for services, improving resource allocation for populations is increasingly a new requirement for
health care coordination. In order to avoid fragmentation, integrated care organizations have
been created and capitation arrangements are crucial in this environment. As a consequence,
researchers and health policy-makers are devoting efforts to develop and implement risk-
adjustment systems for capitation. Prospective Risk Adjustment using capitation payments is
the approach that is being used for HMO in the United States Medicare system and a number of
other countries as Belgium, the Netherlands, Germany, Switzerland, and Israel [1-7]; through
the use of different information sets, as demographic information or diagnosis information. The
existence of asymmetric information in the predictability of total health expenditures between
single payers (as Medicare) and insurers with prospective risk adjustment also produces
incentives for risk selection by attracting profitable insured and avoiding the unprofitable ones
[8,9] In a context of publicly funded health insurance, the transfer of financial risk to public
integrated care organizations is vanishing and they may allow inefficiency. Furthermore,
because access to health care is guaranteed for everyone, risk selection cannot consist of
avoiding high risk patients (those for which the integrated care organization expects losses) as
in a private context, but benefit selection may apply in a subliminal way. Hence, the most
important problem under a National Health System is to provide incentives for efficiency in the
purchasing and provision and in order to do that, it is also necessary to avoid any potential
incentive for risk selection.
Any Risk Adjustment tool allows also the use of ex post diagnosis information (concurrent risk
adjustment) or ex post information on costs in the payment formula (risk sharing), as shown in
* Manuscript (without Author Details)
2
Van Barneveld et al. (1997) [10] or Van de Ven et al. (2000) [11]. The consequence is that it
reduces the financial risk assumed by health providers, with the positive result of a decrease in
the incentives for risk selection, but also the negative result of a decrease in the incentives for
efficiency. The tradeoff between efficiency and risk selection can be articulated through a mixed
payment system for total health expenditures started to be explored in the literature in the last
decades [12, 13]. In the last years, a mixed or hybrid risk adjustment formula with both
prospective and concurrent information with the aim of maximizing incentives for efficiency while
minimizing incentives for risk selection has been proposed by Luft and Dudley (2004) [14] and
Dudley et al. (2003) [15] for total health expenditures. The same methodology has also been
applied for pharmaceutical expenditures [16].
The predictability of health expenditures is therefore a key issue for health policy makers given
that the lower is the difference in the information between single payers and insurers or
integrated care organizations, the lower incentives for risk selection and the higher incentives
for efficiency through the use of risk adjustment [17]. Different studies have shown how the
predictive power of both total health care expenditures [18-20] and pharmaceutical expenditures
[21-23] is hugely improved through the use of diagnosis information under different systems.
Also, it is a recognized fact that a significant proportion of health care expenditures is
concentrated in a small percentage of the population [24]. Hence, it becomes crucial to
understand the relationship between morbidity and health expenditures and its variation, in
order to allocate health resources in a proper and efficient way at a population level.
The analysis of total health expenditures comprehends the provision of health services in all
primary care, hospital care, and specialist visits. A proportion of total costs consist of
pharmaceutical expenditures, whose variation has been studied in different studies [25,26].
Furthermore, incentives in the provision of total health services have also been analyzed in the
literature [9].
Different risk adjustment strategies have been studied in the literature, from the conventional
(using a linear regression approach with the available information to predict costs) to the optimal
risk adjustment [27,28]. However, health policy makers have until now only used the linear
regression specification in the conventional risk adjustment strategies, and in the literature [23]

3
is shown how for drug expenditures, the use of other specifications as “parametric” or “flexible-
parametric” models obtain very similar predictions than the simple linear regression model,
which is simpler to interpret.
There are different information systems that have been developed to group patients by
morbidity characteristics. Among others, the three most widely known are the Adjusted Clinical
Groups (ACG) system developed at Johns Hopkins University [19], the Diagnostic Cost Group
(DCG) family of models developed at Boston University [1], and the Clinical Risk Groups models
[20,29]. A recent comparison of the different information systems has been provided by the
Society of Actuaries (2007) [30].
In this paper we use individual data and analyze the relationship between total health
expenditures and morbidity grouped with the CRG classification system for the population
belonging to an integrated healthcare organization covered by the public health system in
Catalonia, in the context of the Spanish publicly funded health system. The hybrid risk
adjustment model is able to identify the expected and observed resources of the organization.
2. Data Sources
We use individual data on health expenditures and morbidity from an integrated healthcare
organization, Serveis Sanitaris Integrats Baix Empordà (SSIBE), in Catalonia. The organization
provides publicly funded health services (hospital care, primary care, and long-term care) to the
population in the county of Baix Empordà. The health providers included in the analysis are the
Palamós Hospital, with 100 beds for acute patients and 50 for skilled nursing care, and four out
of the five Primary Care Centers in the county (Palamós, Torroella, la Bisbal, and Palafrugell).
The fifth Primary Care Center (Sant Feliu de Guixols) was excluded for incomplete data.
Although most of the health care provision to citizens in that county is registered, they also may
receive health services outside the organization. Data on health provision and costs from
outside the organization were not available and are omitted from our analysis.
The information collected at SSIBE integrates both clinical activities and costs. Thus, it consists
of a unique identification patient file for all encounters including primary care, specialized care,
and inpatient services, and a decentralized activity file codified in ICD-9-CM by clinicians and
4
reviewed by documentalists. The identification of each encounter allows for the total health
expenditures allocation at an individual base. Total health care expenditures include also
pharmaceutical expenditures publicly financed by Servei Català de Salut (CatSalut) and private
copayment. We use an anonymized database belonging to years 2004 and 2005 with a total
population of 92273 citizens (89722 in 2004 and 90849 in 2005).
Among the possible grouping systems to apply risk adjustment strategies, we use in this article
the Clinical Risk Groups (CRGs) (version 1.2B). It is characterized by classifying individuals in
mutually exclusive categories while preserving clinical significance, and taking into account co-
morbidities and severity levels [20]. From the three different models provided by the CRG
software, we use the concurrent model.
For each patient we get a unique CRG as well as its corresponding aggregation in ACRG1,
ACRG2 and ACRG3. In this paper we describe the population through the highest level of
aggregation (ACRG3) and for the estimations we use the second level of aggregation ACRG2
for the classification of patients in morbidity groups. This level of aggregation originally has 176
mutually exclusive categories. However we slightly modify those into 82 mutually exclusive
categories fully maintaining its clinical significance by joining patients belonging to different
CRGs of the same category but with different levels of severity, in order to avoid over fitting in
our estimation because of a very low number of patients in some groups.
The total health expenditures information utilized incorporates residents as well as other
persons that received services from SSIBE. Also it includes resident people with charge to
international agreements or people whom they have provisional authentication codes. As a
consequence, we are unable to completely allocate all health care expenditures since a small
proportion stems from citizens not belonging to the resident’s file.
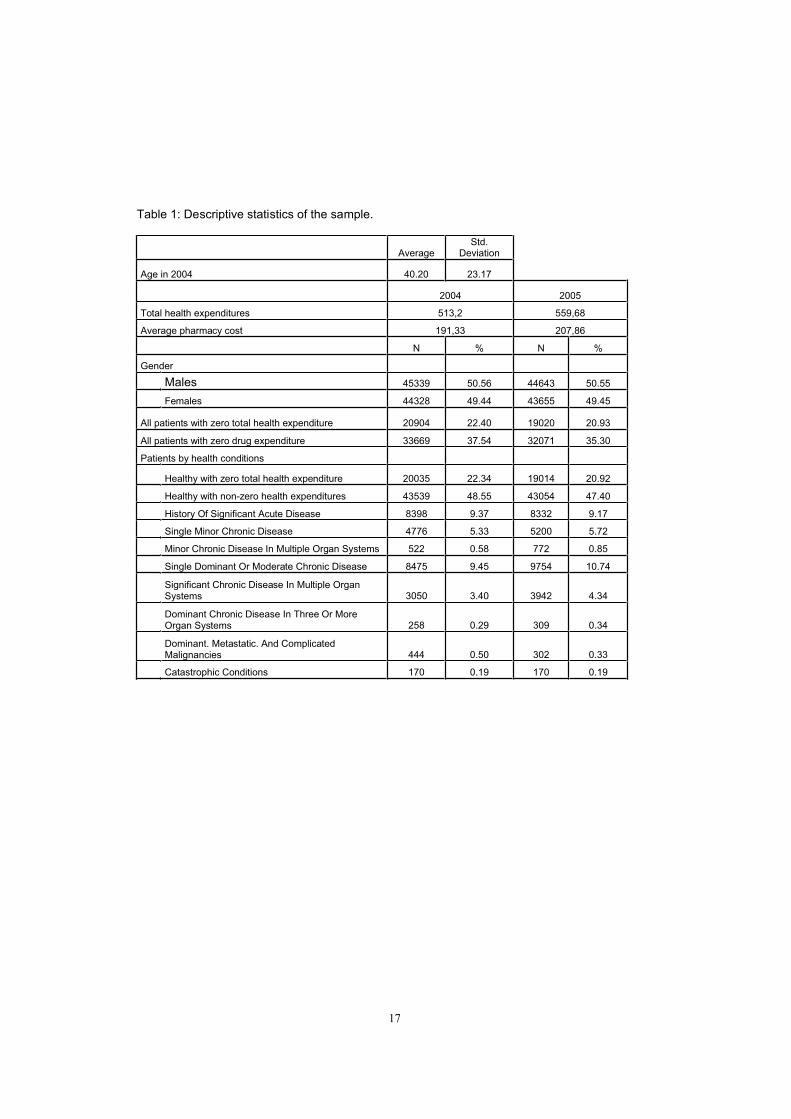
Table 1 provides the descriptive statistics of the sample. The population is almost equally
distributed between males (50.56%) and females (49.44%), and the average total health
expenditures has increased from 513.2 euros in 2004 to 559.68 euros in 2005, while average
pharmaceutical expenditure has increased from 191.33 euros in 2004 to 207.86 euros in 2005.
The same table also shows the distribution of CRG categories under the most aggregated
classification system in the population (ACRG3). Thus, most of individuals (63574 representing
5
70.89% of the total population) belong to the healthy condition (with or without health
expenditures), while the proportion of individuals is decreasing in the level of severity, and
hence, only a few belong to the highest severity group which classifies to the catastrophic
condition (170 patients representing 0.19% of the sample).
Because pharmaceutical expenditures are a part of total health expenditures, there are a lower
proportion of consumers with zero total health expenditures than with zero pharmaceutical
expenditure. Thus, in 2004, 22.4% of the population (20904 out of 89722) had zero health
expenditures while 37.54% (33669 out of 89722) had zero pharmaceutical expenditure. In year
2005, these proportions of patients with zero expenditure were of 20.93% (19014 out of 90849)
in the case of total and of 47.40% (43054 out of 91849) in the case pharmaceutical
expenditures.
3. Estimation Methods
In this paper we estimate prospective, concurrent, and hybrid risk adjustment models using
different information sets (demographic or health status information provided by the CRG
categories) in order to predict total health expenditures in the subsequent year. Our objective is
to examine the predictive power of each model, how well they explain future cost, and provide
implications in terms of the application of a hybrid payment formula in the incentives of
efficiency and risk selection in the health provision within a National Health System. The basic
model is provided by:
),,( ,,1,1,, tittititi HSdemofHealthExp
The dependent variable, health expenditures in year t for individual i, is explained by some
independent variables or risk adjusters (individual demographic characteristics and health
status information). Demographic information is provided by twelve age-gender cells.
Prospective risk adjustment models predict total actual health expenditures with information on
demographic characteristics and clinical status condition in year t-1. Differently, concurrent risk
adjustment models predict total actual health expenditures using demographic and actual
information on clinical status. Hybrid risk adjustment models combine both prospective and
concurrent models. Pure prospective models promote incentives for efficiency but they are
6
unable to avoid risk selection. Differently, the use of concurrent reimbursement models, as
those based on actual information on cost (risk sharing) or health status (concurrent risk
adjustment), presents lower incentives for risk selection because payment is associated to
actual information, but incentives for efficiency are also reduced. The same specifications for
the model have been used only for pharmaceutical expenditures [16]. However, in this article
we include the policy analysis for total health expenditures.
The only use of diagnosis-based risk adjustment models does not solve the problem of risk
selection because they do not capture within-condition variation even with concurrent
information. Hence, following the idea in Newhouse (1996) [8] we propose the use of a hybrid
risk adjustment model with information on health conditions different to the classification system
used in the risk adjustment model, trying to rescue the positive properties of both prospective
and concurrent formulae within the tradeoff between efficiency and risk selection: the hybrid
model promotes incentives for efficiency as in the prospective model for most of the population,
while it reduces incentives for risk selection for those patients suffering specific health
conditions. The reimbursement associated to the second type of patients under the hybrid
systems is set as a concurrent payment.
We utilize the set of 100 verifiable, expensive, predictive conditions (VEP100) already used and
presented in the literature [15] in order to divide the population into two parts (one for the
prospective payment and the other for the concurrent payment) and compare results.
It is key to understand the appropriateness of the use of those VEP conditions. First, it is
needed that the conditions are verifiable –which means that belonging to those categories is
based on objective clinical measures– because we avoid the incentives in the provider of
classifying to this set of patients simply to any patient producing expected losses. Second,
being expensive and predictive conditions we are selecting for belonging to the group of
concurrent payment to the type of patients that might be at risk of suffering risk selection or
excessive risk transfer to the organization.
Provided the importance of the division of the population between the two groups, we also
include a sensitivity analysis through the use of a different division in order to better understand
the scope of the VEP conditions in health policy making: the division between patients suffering
7
or not at least one condition in the set of the 50 most expensive conditions within the VEP100
conditions, which we name VEP50.
We are using for our sample the set of VEP100 conditions presented in the literature for a U.S.
sample. Therefore, it is needed to present an analysis validating the use of the same division of
patients in concurrent and prospective populations within the hybrid model, because the
characteristics of both samples might be different.
The predictive power of risk adjustment models depends on the within-group variation in
expected expenditures. Thus, we check for the distribution of the appearance of VEP100
conditions under the CRG classification system and the same type of data with respect to the
division of the population between those patients suffering or not at least one of the VEP50
conditions.
We provide a second analysis justifying the use of VEP conditions. We compare the relative
cost weights of the set of patients with and without VEP100 conditions and a sensitivity analysis
for the division using VEP50 conditions is also presented.
In order to analyze the predictive power of the different models we use the R2 and the predictive
ratio. Hybrid models take into account the two sub-samples with concurrent information for
patients with at least one VEP100 condition and prospective information for patients with no
VEP100 condition. Therefore, in order to calculate the R2 for hybrid models, we use the
following methodology [15]: we first calculate the total error sum of squares for the combined
populations (concurrent and prospective) as the error sum of squares for the concurrent
population plus the error sum of squares from the prospective population. At the same time, the
corrected total sum of squares is calculated as the sum of squares adjusted for the mean of the
overall population. Finally, the R2
is defined as one minus the ratio of the error sum of squares
to the corrected total sum of squares.
4. Results
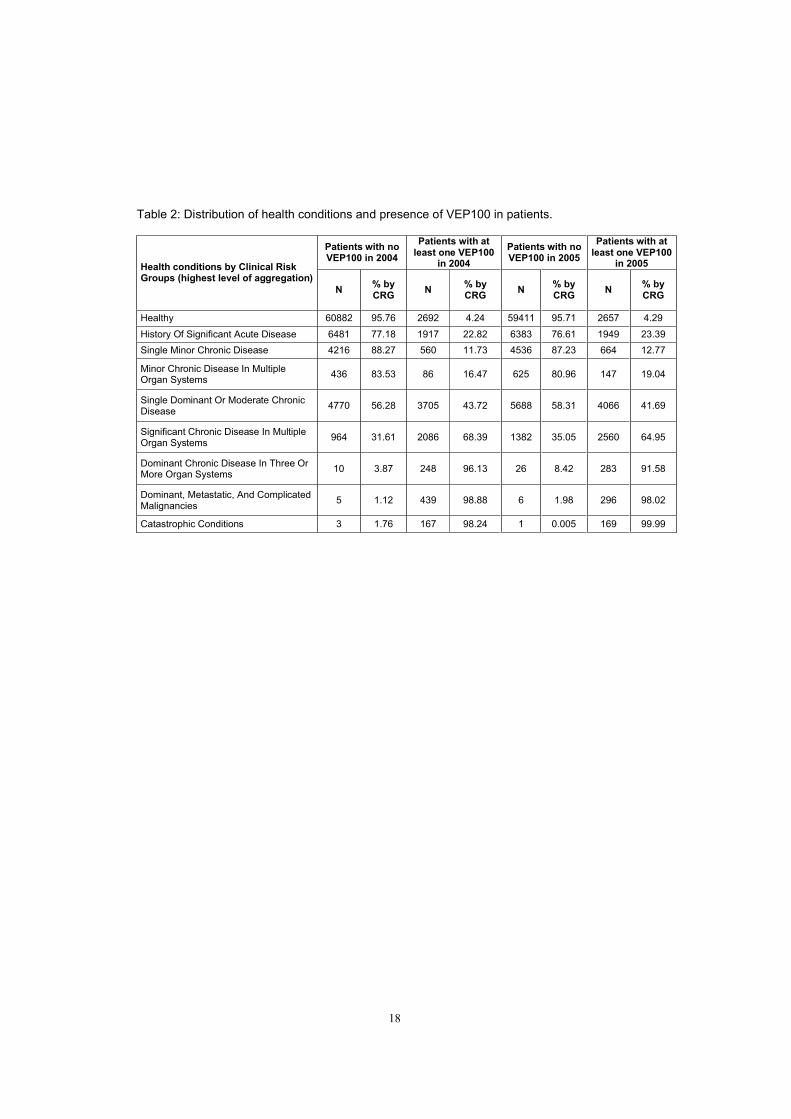
Table 2 shows how in relative terms, 95% of healthy patients do not suffer any VEP100
conditions in years 2004 and 2005, while increasing the level of severity in the CRGs supposes
increase also the proportion of patients with at least one VEP100 condition until about 98% of
8
patients in 2004 and 99% in 1999 in the catastrophic conditions group. It is also important to
note, that even if the proportion of patients suffering a VEP100 condition is increasing in the
level of severity, a significant proportion of those patients – 22.72% in 2004 (2692 out of 11900)
and 20.77% in 2005 (2657 out of 12791) – still belong to the healthy group.
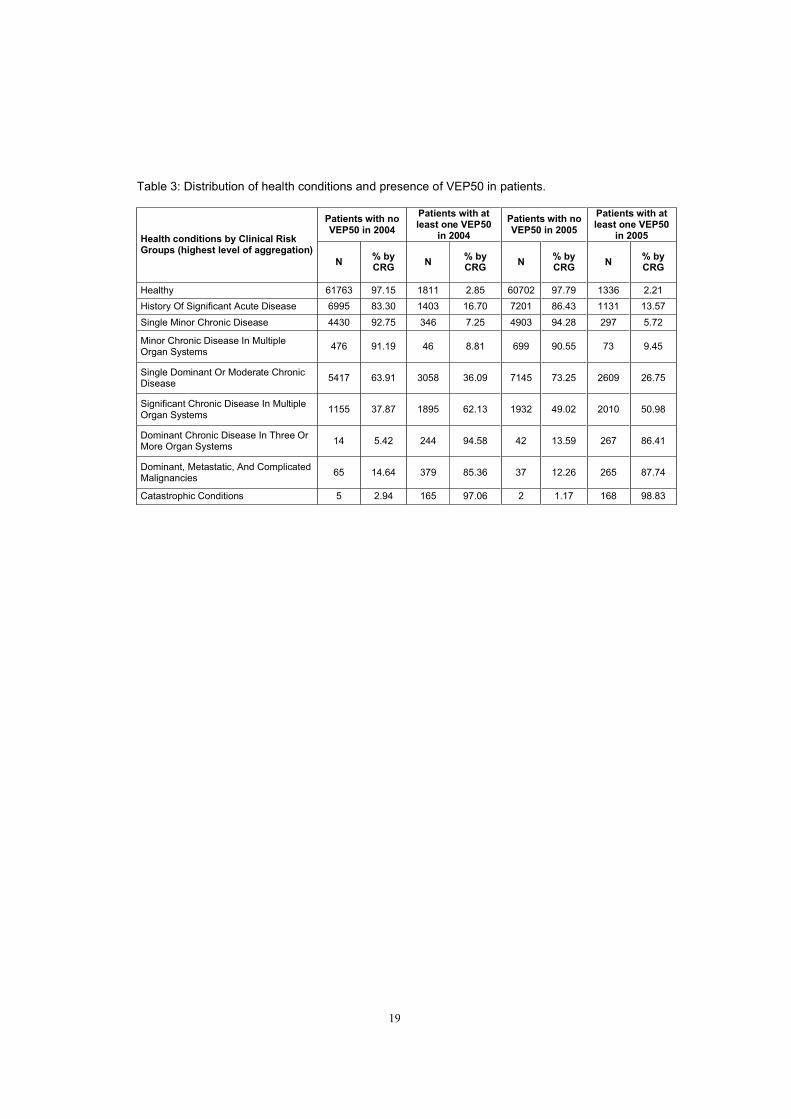
With respect to the sensitivity analysis, table 3 presents the same type of data with respect to
the division of the population between those patients suffering or not at least one of the VEP50
conditions.
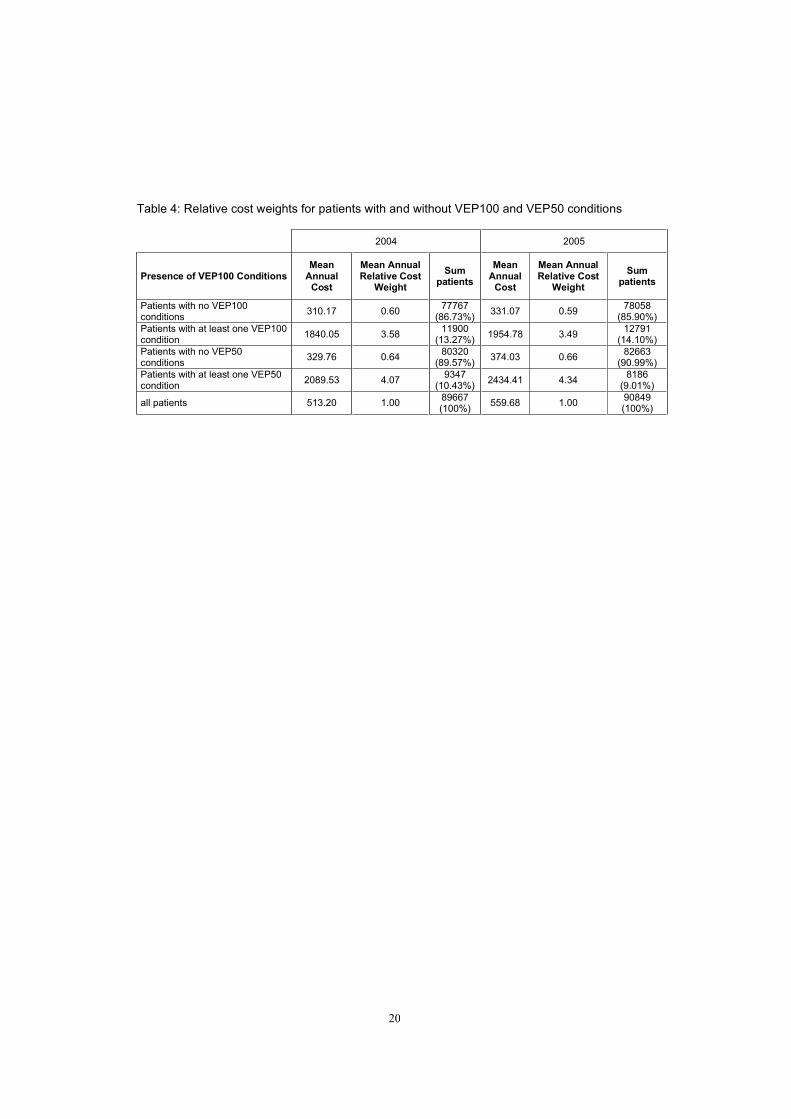
Furthermore, the analysis of the cost weights for the different subsets of patients shows (table
4), as expected, that patients suffering at least one of the specific VEP100 conditions
systematically present total health expenditures much higher than the rest of patients (1840.05€
versus 310€ in 2004 and 1954.78€ versus 331.07€ in 2005), being this different greater in the
case of the use of VEP50 conditions.
Hence, in both analyses we conclude that the presence of VEP conditions is increasing in the
level of severity and therefore, those conditions seem to be valid for the division of the
population in concurrent and prospective reimbursement systems in our sample.
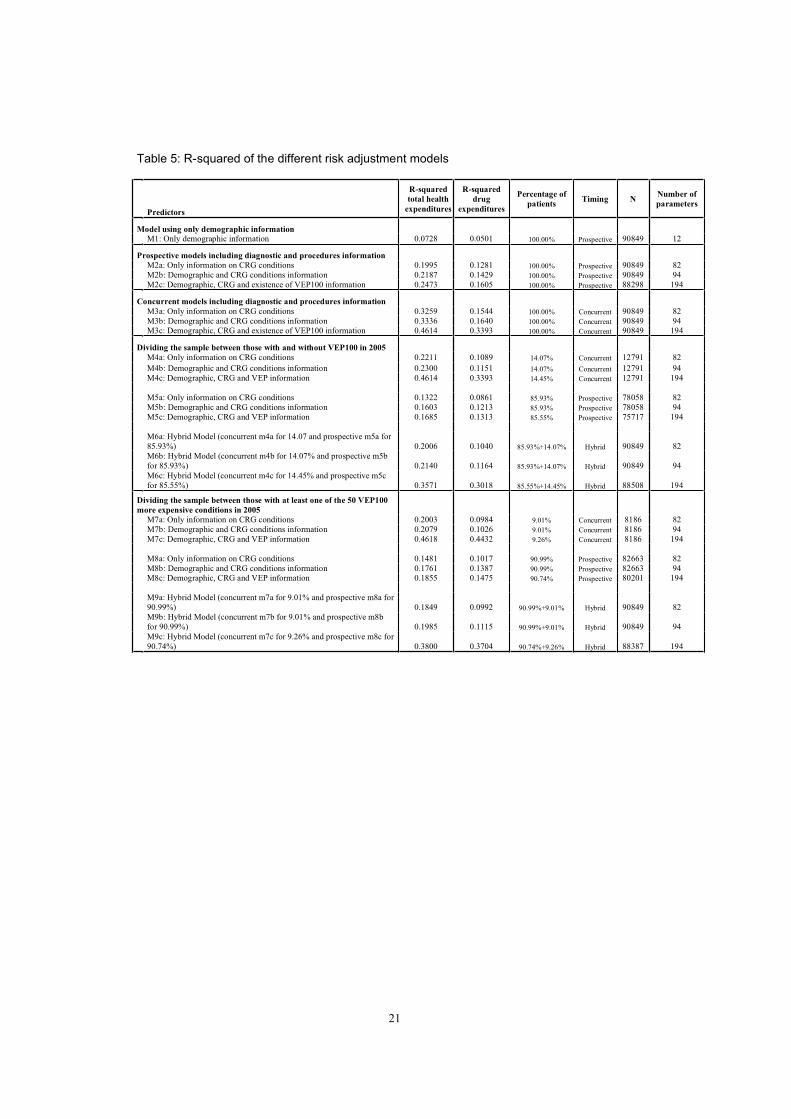
Different risk adjustment models for predicting total health expenditures are presented in table
5. The information used and the predictive power found are as follows. Model 1 only includes
demographic information and obtains an R2 of about 0.07 (0.05 for predicting only drug
expenditures). However, including health status information in the prospective model (models
2), the predictive power increases until an R2 of 0.1995 (only CRG information in model 2a),
0.2187 (demographic and CRG information in model 2b) and 0.2473 (demographic, CRG
information, and presence of at least one VEP100 condition in model 2c). As expected, the
higher is the quality of the information used in the prospective model, the better is the predictive
power (with a higher R2), and including a dummy variable with the presence of a VEP100
condition improves the usual prospective model of the usual risk adjustment model that uses
the CRG classification system. Concurrent models 3a to 3c (using only CRG information,
demographic and CRGs, or demographic, CRGs and presence of VEP100 conditions
respectively) behaves equally and increases the proportion of explained variance to a highest
value of R2=0.4614 (model 3c).
9
When dividing population into two parts depending on the presence of at least one VEP100
condition, the R2
is of 0.1685 (model 5c) in the prospective models for patients without those
conditions increases but is lower to that of the concurrent model for the whole population
(0.2473 in model 2c). This means that the predictability of the cost for healthier patients
(85.93% of the population without VEP100 conditions) is lower than that of patients with higher
level of severity (14.07% of the population with at least one VEP100 condition). In other words,
the asymmetry of information regarding clinical conditions of individuals is especially important
for patients with higher level of severity which evidences the existence of incentives for risk
selection or excessive risk transfer. The interpretation of this result is that the free variation in
total health expenditures is specially concentrated in patients suffering one VEP100 conditions
because most of them still belong to relatively healthy CRG categories. Concurrent models
applied only for patients with at least one VEP100 condition improve the predictive power of
total health expenditures (comparing models 2 with models 4) with an R2of 0.2211 using only
CRG information (model 4a), of 0.2300 using also demographic information (model 4b), and of
0.4614 when using also information on the presence of VEP100 conditions (model 4c).
We obtain an R2 for hybrid models of 0.2006 (model 6a) using only CRG information, which is
very similar to the predictive power of the usual prospective model using the same information
(model 2a presented a R2of 0.1995), and adding demographic information also present similar
results in both purely prospective and hybrid models (R2of 0.2187 in model 2b and of 0.2140 in
model 6b). Therefore, having the same incentives for efficiency for most of the population
(85.93%), focused on those individuals without VEP100 conditions, we are eliminating the
incentives for risk selection in the population at risk of suffering such a strategy (14.07%).
Adding information regarding the VEP conditions improves the predictive power presenting an
R2of 0.3571 (model 6c) higher than in the purely prospective model (model 2c). The sensitivity
analysis provides the same exercise on the predictive models but dividing population between
those with or without at least one of the VEP50 conditions. Thus, models 7 to 9 are analogous
to models 4 to 6 in table 5. In this case, the proportion of the population for which efficiency
incentives are maximized is of 90.99%, while the incentives for risk selection are eliminated for
10
the 9.01% of the population suffering at least one of the VEP50 conditions. Results in the
sensitivity analysis confirm those already obtained.
It is important to note as a limit for comparison with other results presented in the literature that
our R2 are probably higher than should be expected in other national samples. The reason is
that all of the providers are from a narrow geographic area, and hence total health expenditures
and practice style variations are reduced compared to other greater national samples. Besides,
the number of parameters in the estimations (different models c) explains the high R2obtained.
They are shown however with the aim of showing the validity of the hybrid risk adjustment tool
with a higher level of information more than pretending to obtain a higher predictive power.
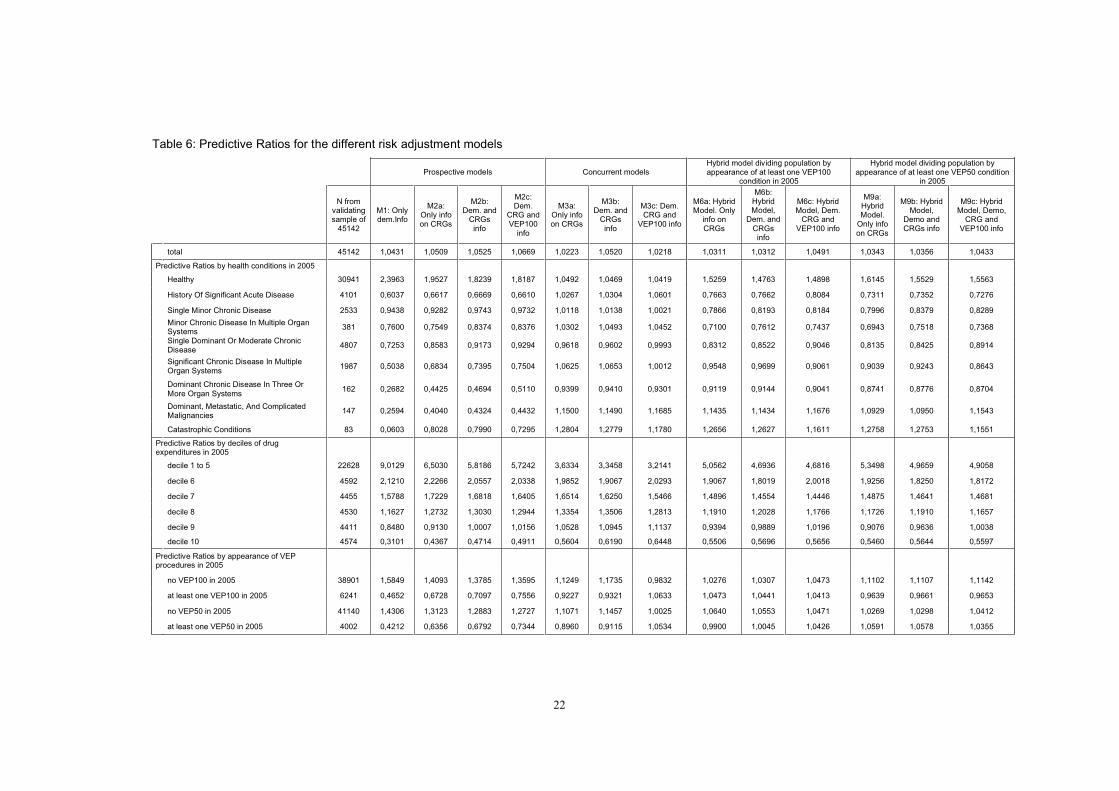
Table 6 presents the predictive ratios for the different risk adjustment models and by different
groups of population. The validating sample is composed of nearly half of the total population,
45142 individuals, and the proportion of population with and without VEP100 conditions varies
slightly. Thus, in 2005 16.04% of the validating sample (6241 individuals) had at least one
VEP100 condition and 8.87% (4002 individuals) had at least one VEP50 condition. Results
provided by the predictive ratio analysis support those from the R2. All models (prospective,
concurrent, and hybrid) benefits from including a dummy variable with the presence of VEP100
conditions. Hybrid models improve the predictive ratio for patients in most of CRG categories,
but especially when patients are ordered by deciles of drug expenditures or by presence of
VEP100 or VEP50 conditions.
5. Conclusions
Mixed risk adjustment models for capitation payment have been considered by the literature as
the appropriate approach for allocating resources. However implementation of such models
represents a challenge because of information available and other constraints. A better
prediction of health care expenditures for integrated care organizations allows to control for
excessive risk transfer. Although in a private insurance market the application of risk adjustment
supposes the transfer of financial risk, this transfer is not achieved (at least not complete) under
a publicly funded systems. A transition to reimbursement based on risk adjustment strategies in
publicly funded systems is therefore desirable in order to promote incentives for efficiency.
11
A mixed payment using the hybrid risk adjustment model promotes incentives for efficiency in
the provision for a high proportion of the population through the prospective payment, but it also
reduces excessive risk transfer to integrated care organizations through a concurrent payment
based on actual information either on diagnosis (concurrent risk adjustment) or cost (risk
sharing) for a determined set of patients. A key stage in the application of this hybrid model is
the division between the set of patients with a prospective and a concurrent payment. In this
paper we follow a methodology previously used in the literature based on the presence of 100
verifiable, expensive and predictive conditions (VEP100) in order to be able to compare results.
However, because our sample is different, we provide a check for the validity of the
methodology. Furthermore, because it is not shown in the literature an optimal way of dividing
population between the two groups with concurrent and prospective reimbursement methods,
we provide a sensitivity analysis using only a subset of 50 conditions (VEP50) obtaining positive
results.
The hybrid model has been shown to obtain similar or higher predictive power than purely
prospective or concurrent risk adjustment models through the R2, but the predictive ratio
analysis shows how it is especially powerful at adjusting total health care expenditures for the
set of patients at risk of suffering risk selection.
The application of risk adjustment strategies in the context of a publicly funded health system
should in the future consider the effects of incentives in the standard setting of qualities in the
provision or times of health attendance.
12
Acknowledgements
This research was supported by an unrestricted educational grant awarded jointly to the
Universities Carlos III de Madrid and Pompeu Fabra de Barcelona by The Merck Foundation,
the philanthropic arm of Merck Co. Inc., White House Station, New Jersey, USA. We thank Jordi
Coderch and Jordi Calsina from Serveis de Salut Integrats del Baix Empordà for their support
and comments. We also thank Randy Ellis, Alberto Holly and Pedro Pita for their helpful
comments. Remaining errors are the authors’ responsibility.
References
1. Ash AS, Ellis RP, Pope GC, Ayanian JZ, Bates DW, Burstin H, Iezzoni LI, MacKay E,
Yu W. Using diagnoses to describe populations and predict costs. Health Care Financing
Review 2000; 21:7–28.
2. Van de Ven WPMM, Beck K, et al. Risk Adjustment and Risk Selection on the Sickness
Fund Insurance Market in Five European Countries.Health Policy 2003;65: 75-98.
3. Beck K, Spycher S, Holly A, Gardiol L. Risk Adjustment in Switzerland. Health Policy
2003;65: 63-74.
4. Buchner F, Wasem J. Needs for Further Improvement: Risk Adjustment in the German
Health Insurance System. Health Policy 2003;65: 21-35.
13
5. Lamers LM, Van Vliet RCJA, Van de Ven WPMM: Risk Adjusted Premium Subsidies
and Risk Sharing: Key Elements of the Competitive Sickness Fund Market in the Netherlands.
Health Policy 2003;65: 49-62.
6. Schokkaert E, Van de Voorde C. Belgium: Risk Adjustment and Financial Responisbility
in a Centralised System. Health Policy 2003;65: 5-19.
7. Shmueli A, Chernichovsky D, Zmora I. Risk Adjustment and Risk Sharing: the Israeli
Experience. Health Policy 2003;65: 37-48.
8. Newhouse JP. Reimbursing Health Plans and Health Providers: Efficiency in Production
versus Selection. Journal of Economic Literature 1996;34:1236-1263.
9. Shen Y, Ellis RP. How Profitable is Risk Selection? A Comparison of Four Risk
Adjustment Methods. Health Economics 2002a;11(2): 165-174.
10. Van Barneveld EM, Lamers LM, Van Vliet RCJA, Van de Ven WPMM. Mandatory
Pooling as a Supplement to Risk-Adjustment Capitation Payments in a Competitive Health
Insurance Market. Social Science and Medicine 1997;47:223-232.
11. Van de Ven WPMM, Van Vliet RCJA, Schut E, Van Barneveld EM. Access Coverage
for High-Risks in a Competitive Individual Health Insurance Market: Via Premium Rate
Restrictions or Risk-Adjustment Premium Subsidies?. Journal of Health Economics
2000;19:311-339.
12. Ellis RP, McGuire TG. Insurance Principles and the Design of Prospective Payment
Systems. Journal of Health Economics 1988;7:215-237.
14
13. Keeler EB, Carter T. Insurance Aspects of DRG Outlier Payments. Journal of Health
Economics 1998;7:193-214.
14. Luft HS, Dudley RA. Assessing Risk Adjustment Approaches under Non-Random
Selection. Inquiry 2004;41:203–217.
15. Dudley RA, Medlin CA, Hammann LB, Cisternas MG, Brand R, Rennie DJ, Luft H. The
Best of Both Worlds? The Potential of Hybrid Prospective/Concurrent Risk Adjustment. Medical
Care 2003;41(1):56–69.
16. García-Goñi M, Ibern P, Inoriza JM. Hybrid risk adjustment for pharmaceutical benefits.
Working paper 2008.
17. Van de Ven WPMM, Ellis RP. Risk adjustment in Competitive Health Plan Markets. In
Handbook of Health Economics, edited by A.J. Culyer and J.P. Newhouse. Amsterdam, The
Netherlands: Elsevier (2000).
18. Pope GC, Adamache KW, Walsh EG, Khandker RK. Evaluating Alternative Adjusters
for Medicare. Health Care Financing Review 1998;20(2): 109-129.
19. Weiner JP, Dobson A, Maxwell S, et al. Risk-Adjusted Medicare Capitation Rates Using
Ambulatory and Inpatient Diagnoses. Health Care Financing Review 1996;17: 77-100.
20. Hughes JS, Averill RF, Eisenhandler J, et al. Clinical Risk Groups (CRGs): a
Classification System for Risk-Adjusted Capitation-Based Payment and Health Care
Management. Medical Care 2004;42(1):81-90.
21. Wrobel MV, Doshi J, Stuart BC, Briesacher B. Predictability of prescription drug
expenditures for Medicare beneficiaries. Health Care Financing Review 2003;25(2):37-46.
15
22. Zhao Y, Ash AS, Ellis RP, Ayanian JZ, Pope GC, Bowen B, Weyuker L. Predicting
pharmacy costs and other medical costs using diagnoses and drug claims. Medical Care
2005;43(1):34-43.
23. García-Goñi M, Ibern P. Predictability of drug expenditures: an application using
morbidity data. Health Economics 2008;17(1): 119-126.
24. Zuvekas SH, Cohen JW. Prescription Drugs And The Changing Concentration Of
Health Care Expenditures. Health Affairs 2007;26(1): 249-257.
25. García-Sempere A, Peiró S. Gasto farmacéutico en atención primaria: variables
asociadas y asignación de presupuestos de farmacia por zonas de salud. Gaceta Sanitaria
2001;15:32-40.
26. Healey AT, Yule BF, Reid JP. Variation in general practice prescribing costs and
implications for budget setting. Health Economics 1994;3(1):1-47.
27. Shen Y, Ellis RP. Cost-Minimizing Risk Adjustment. Journal of Health Economics
2002b;21: 515-530.
28. Glazer J, McGuire TG. Optimal Risk Adjustment in Markets with Adverse Selection: An
Application to Managed Care. The American Economic Review 2000;90(4): 1055-1071.
29. Averill RF, Golfield NI, Eisenhandler J et al. Development and Evaluation of Clinical
Risk Groups (CRGs). 3M Health Information Systems Report 9-99. 1999.

16
30. Winkelman R, Mehmud SA. A Comparative Analysis of Claims-Based Tools for Health
Risk Assessment. Society of Actuaries sponsored Research Project [accessed on March 10,
2008]. Available at: http://www.soa.org/files/pdf/risk-assessmentc.pdf (2007).
17
Table 1: Descriptive statistics of the sample.
AverageStd.
Deviation
Age in 2004 40.20 23.17
2004 2005
Total health expenditures 513,2 559,68
Average pharmacy cost 191,33 207,86
N % N %
Gender
Males 45339 50.56 44643 50.55
Females 44328 49.44 43655 49.45
All patients with zero total health expenditure 20904 22.40 19020 20.93
All patients with zero drug expenditure 33669 37.54 32071 35.30
Patients by health conditions
Healthy with zero total health expenditure 20035 22.34 19014 20.92
Healthy with non-zero health expenditures 43539 48.55 43054 47.40
History Of Significant Acute Disease 8398 9.37 8332 9.17
Single Minor Chronic Disease 4776 5.33 5200 5.72
Minor Chronic Disease In Multiple Organ Systems 522 0.58 772 0.85
Single Dominant Or Moderate Chronic Disease 8475 9.45 9754 10.74
Significant Chronic Disease In Multiple Organ Systems 3050 3.40 3942 4.34
Dominant Chronic Disease In Three Or More Organ Systems 258 0.29 309 0.34
Dominant. Metastatic. And Complicated Malignancies 444 0.50 302 0.33
Catastrophic Conditions 170 0.19 170 0.19
18
Table 2: Distribution of health conditions and presence of VEP100 in patients.
Patients with no VEP100 in 2004
Patients with at least one VEP100
in 2004
Patients with no VEP100 in 2005
Patients with at least one VEP100
in 2005Health conditions by Clinical Risk Groups (highest level of aggregation)
N% by CRG
N% by CRG
N% by CRG
N% by CRG
Healthy 60882 95.76 2692 4.24 59411 95.71 2657 4.29
History Of Significant Acute Disease 6481 77.18 1917 22.82 6383 76.61 1949 23.39
Single Minor Chronic Disease 4216 88.27 560 11.73 4536 87.23 664 12.77
Minor Chronic Disease In Multiple Organ Systems
436 83.53 86 16.47 625 80.96 147 19.04
Single Dominant Or Moderate Chronic Disease
4770 56.28 3705 43.72 5688 58.31 4066 41.69
Significant Chronic Disease In Multiple Organ Systems
964 31.61 2086 68.39 1382 35.05 2560 64.95
Dominant Chronic Disease In Three Or More Organ Systems
10 3.87 248 96.13 26 8.42 283 91.58
Dominant, Metastatic, And Complicated Malignancies
5 1.12 439 98.88 6 1.98 296 98.02
Catastrophic Conditions 3 1.76 167 98.24 1 0.005 169 99.99
19
Table 3: Distribution of health conditions and presence of VEP50 in patients.
Patients with no VEP50 in 2004
Patients with at least one VEP50
in 2004
Patients with no VEP50 in 2005
Patients with at least one VEP50
in 2005Health conditions by Clinical Risk Groups (highest level of aggregation)
N% by CRG
N% by CRG
N% by CRG
N% by CRG
Healthy 61763 97.15 1811 2.85 60702 97.79 1336 2.21
History Of Significant Acute Disease 6995 83.30 1403 16.70 7201 86.43 1131 13.57
Single Minor Chronic Disease 4430 92.75 346 7.25 4903 94.28 297 5.72
Minor Chronic Disease In Multiple Organ Systems
476 91.19 46 8.81 699 90.55 73 9.45
Single Dominant Or Moderate Chronic Disease
5417 63.91 3058 36.09 7145 73.25 2609 26.75
Significant Chronic Disease In Multiple Organ Systems
1155 37.87 1895 62.13 1932 49.02 2010 50.98
Dominant Chronic Disease In Three Or More Organ Systems
14 5.42 244 94.58 42 13.59 267 86.41
Dominant, Metastatic, And Complicated Malignancies
65 14.64 379 85.36 37 12.26 265 87.74
Catastrophic Conditions 5 2.94 165 97.06 2 1.17 168 98.83
20
Table 4: Relative cost weights for patients with and without VEP100 and VEP50 conditions
2004 2005
Presence of VEP100 ConditionsMean
Annual Cost
Mean Annual Relative Cost
Weight
Sumpatients
MeanAnnual
Cost
Mean Annual Relative Cost
Weight
Sum patients
Patients with no VEP100 conditions
310.17 0.6077767
(86.73%)331.07 0.59
78058(85.90%)
Patients with at least one VEP100 condition
1840.05 3.5811900
(13.27%)1954.78 3.49
12791(14.10%)
Patients with no VEP50 conditions
329.76 0.6480320
(89.57%)374.03 0.66
82663 (90.99%)
Patients with at least one VEP50 condition
2089.53 4.079347
(10.43%)2434.41 4.34
8186(9.01%)
all patients 513.20 1.0089667(100%)
559.68 1.0090849(100%)
21
Table 5: R-squared of the different risk adjustment models
Predictors
R-squared
total health
expenditures
R-squared
drug
expenditures
Percentage of
patientsTiming N
Number of
parameters
Model using only demographic information
M1: Only demographic information 0.0728 0.0501 100.00% Prospective 90849 12
Prospective models including diagnostic and procedures information
M2a: Only information on CRG conditions 0.1995 0.1281 100.00% Prospective 90849 82
M2b: Demographic and CRG conditions information 0.2187 0.1429 100.00% Prospective 90849 94
M2c: Demographic, CRG and existence of VEP100 information 0.2473 0.1605 100.00% Prospective 88298 194
Concurrent models including diagnostic and procedures information
M3a: Only information on CRG conditions 0.3259 0.1544 100.00% Concurrent 90849 82
M3b: Demographic and CRG conditions information 0.3336 0.1640 100.00% Concurrent 90849 94M3c: Demographic, CRG and existence of VEP100 information 0.4614 0.3393 100.00% Concurrent 90849 194
Dividing the sample between those with and without VEP100 in 2005
M4a: Only information on CRG conditions 0.2211 0.1089 14.07% Concurrent 12791 82
M4b: Demographic and CRG conditions information 0.2300 0.1151 14.07% Concurrent 12791 94
M4c: Demographic, CRG and VEP information 0.4614 0.3393 14.45% Concurrent 12791 194
M5a: Only information on CRG conditions 0.1322 0.0861 85.93% Prospective 78058 82
M5b: Demographic and CRG conditions information 0.1603 0.1213 85.93% Prospective 78058 94
M5c: Demographic, CRG and VEP information 0.1685 0.1313 85.55% Prospective 75717 194
M6a: Hybrid Model (concurrent m4a for 14.07 and prospective m5a for
85.93%) 0.2006 0.1040 85.93%+14.07% Hybrid 90849 82
M6b: Hybrid Model (concurrent m4b for 14.07% and prospective m5b
for 85.93%) 0.2140 0.1164 85.93%+14.07% Hybrid 90849 94
M6c: Hybrid Model (concurrent m4c for 14.45% and prospective m5c
for 85.55%) 0.3571 0.3018 85.55%+14.45% Hybrid 88508 194
Dividing the sample between those with at least one of the 50 VEP100
more expensive conditions in 2005
M7a: Only information on CRG conditions 0.2003 0.0984 9.01% Concurrent 8186 82
M7b: Demographic and CRG conditions information 0.2079 0.1026 9.01% Concurrent 8186 94
M7c: Demographic, CRG and VEP information 0.4618 0.4432 9.26% Concurrent 8186 194
M8a: Only information on CRG conditions 0.1481 0.1017 90.99% Prospective 82663 82
M8b: Demographic and CRG conditions information 0.1761 0.1387 90.99% Prospective 82663 94M8c: Demographic, CRG and VEP information 0.1855 0.1475 90.74% Prospective 80201 194
M9a: Hybrid Model (concurrent m7a for 9.01% and prospective m8a for
90.99%) 0.1849 0.0992 90.99%+9.01% Hybrid 90849 82
M9b: Hybrid Model (concurrent m7b for 9.01% and prospective m8b
for 90.99%) 0.1985 0.1115 90.99%+9.01% Hybrid 90849 94
M9c: Hybrid Model (concurrent m7c for 9.26% and prospective m8c for
90.74%) 0.3800 0.3704 90.74%+9.26% Hybrid 88387 194
22
Table 6: Predictive Ratios for the different risk adjustment models
Prospective models Concurrent modelsHybrid model dividing population by appearance of at least one VEP100
condition in 2005
Hybrid model dividing population by appearance of at least one VEP50 condition
in 2005
N from validating sample of
45142
M1: Only dem.Info
M2a: Only info on CRGs
M2b: Dem. and
CRGsinfo
M2c: Dem.
CRG and VEP100
info
M3a: Only info on CRGs
M3b: Dem. and
CRGsinfo
M3c: Dem. CRG and
VEP100 info
M6a: Hybrid Model. Only
info on CRGs
M6b: HybridModel,
Dem. and
CRGsinfo
M6c: Hybrid Model, Dem.
CRG and VEP100 info
M9a: HybridModel.
Only info on CRGs
M9b: Hybrid Model,
Demo and CRGs info
M9c: Hybrid Model, Demo,
CRG and VEP100 info
total 45142 1,0431 1,0509 1,0525 1,0669 1,0223 1,0520 1,0218 1,0311 1,0312 1,0491 1,0343 1,0356 1,0433
Predictive Ratios by health conditions in 2005
Healthy 30941 2,3963 1,9527 1,8239 1,8187 1,0492 1,0469 1,0419 1,5259 1,4763 1,4898 1,6145 1,5529 1,5563
History Of Significant Acute Disease 4101 0,6037 0,6617 0,6669 0,6610 1,0267 1,0304 1,0601 0,7663 0,7662 0,8084 0,7311 0,7352 0,7276
Single Minor Chronic Disease 2533 0,9438 0,9282 0,9743 0,9732 1,0118 1,0138 1,0021 0,7866 0,8193 0,8184 0,7996 0,8379 0,8289
Minor Chronic Disease In Multiple Organ Systems
381 0,7600 0,7549 0,8374 0,8376 1,0302 1,0493 1,0452 0,7100 0,7612 0,7437 0,6943 0,7518 0,7368
Single Dominant Or Moderate Chronic Disease
4807 0,7253 0,8583 0,9173 0,9294 0,9618 0,9602 0,9993 0,8312 0,8522 0,9046 0,8135 0,8425 0,8914
Significant Chronic Disease In Multiple Organ Systems
1987 0,5038 0,6834 0,7395 0,7504 1,0625 1,0653 1,0012 0,9548 0,9699 0,9061 0,9039 0,9243 0,8643
Dominant Chronic Disease In Three Or
More Organ Systems162 0,2682 0,4425 0,4694 0,5110 0,9399 0,9410 0,9301 0,9119 0,9144 0,9041 0,8741 0,8776 0,8704
Dominant, Metastatic, And Complicated Malignancies
147 0,2594 0,4040 0,4324 0,4432 1,1500 1,1490 1,1685 1,1435 1,1434 1,1676 1,0929 1,0950 1,1543
Catastrophic Conditions 83 0,0603 0,8028 0,7990 0,7295 1,2804 1,2779 1,1780 1,2656 1,2627 1,1611 1,2758 1,2753 1,1551
Predictive Ratios by deciles of drug expenditures in 2005
decile 1 to 5 22628 9,0129 6,5030 5,8186 5,7242 3,6334 3,3458 3,2141 5,0562 4,6936 4,6816 5,3498 4,9659 4,9058
decile 6 4592 2,1210 2,2266 2,0557 2,0338 1,9852 1,9067 2,0293 1,9067 1,8019 2,0018 1,9256 1,8250 1,8172
decile 7 4455 1,5788 1,7229 1,6818 1,6405 1,6514 1,6250 1,5466 1,4896 1,4554 1,4446 1,4875 1,4641 1,4681
decile 8 4530 1,1627 1,2732 1,3030 1,2944 1,3354 1,3506 1,2813 1,1910 1,2028 1,1766 1,1726 1,1910 1,1657
decile 9 4411 0,8480 0,9130 1,0007 1,0156 1,0528 1,0945 1,1137 0,9394 0,9889 1,0196 0,9076 0,9636 1,0038
decile 10 4574 0,3101 0,4367 0,4714 0,4911 0,5604 0,6190 0,6448 0,5506 0,5696 0,5656 0,5460 0,5644 0,5597
Predictive Ratios by appearance of VEP procedures in 2005
no VEP100 in 2005 38901 1,5849 1,4093 1,3785 1,3595 1,1249 1,1735 0,9832 1,0276 1,0307 1,0473 1,1102 1,1107 1,1142
at least one VEP100 in 2005 6241 0,4652 0,6728 0,7097 0,7556 0,9227 0,9321 1,0633 1,0473 1,0441 1,0413 0,9639 0,9661 0,9653
no VEP50 in 2005 41140 1,4306 1,3123 1,2883 1,2727 1,1071 1,1457 1,0025 1,0640 1,0553 1,0471 1,0269 1,0298 1,0412
at least one VEP50 in 2005 4002 0,4212 0,6356 0,6792 0,7344 0,8960 0,9115 1,0534 0,9900 1,0045 1,0426 1,0591 1,0578 1,0355