Australia’s ‘Irish Factor’ as a Source of Cultural Difference from Canada
Policing Australia’s ‘heroin drought’: usingan agent-based model to simulate alternative outcomes
Anne Dray & Lorraine Mazerolle & Pascal Perez &
Alison Ritter
Published online: 15 August 2008# Springer Science + Business Media B.V. 2008
Abstract Our paper examines how street-level drug markets adapt to a macro-leveldisruption to the supply of heroin, under three experimental conditions of street-leveldrug law enforcement: random patrol, hot-spot policing and problem-orientated polic-ing. We utilize an agent-based model to explore the relative impact of abstractions ofthese three law enforcement strategies after simulating an ‘external shock’ to thesupply of heroin to the street-level drug market. We use 3 years of data, which includethe period of the ‘heroin drought’ in Melbourne (Australia) that commenced in late2000 and early 2001, to measure changes in a selected range of crime and harmindicators under the three policing conditions. Our results show that macro-leveldisruptions to drug supply have a limited impact on street-level market dynamics whenthere is a ready replacement drug. By contrast, street-level police interventions areshown to vary in their capacity to alter drug market dynamics. Importantly, ourlaboratory abstraction of problem-orientated policing is shown to be the optimalstrategy to disrupt street-level injecting-drug markets, reduce crimes and minimizeharm, regardless of the type of drug being supplied to the market.
Keywords Agent-based simulation model . Australia . Heroin drought . Illicit drug .
Law enforcement
J Exp Criminol (2008) 4:267–287DOI 10.1007/s11292-008-9057-1
A. Dray (*) : P. PerezRMAP/RSPAS, Coombs Building, Australian National University, Canberra, ACT, Australiae-mail: [email protected]
P. Pereze-mail: [email protected]
L. MazerolleARC Centre of Excellence in Policing and Security (CEPS) & School of Criminologyand Criminal Justice, Griffith University, Mt Gravatt Campus, Brisbane, QLD, Australiae-mail: [email protected]
A. RitterDrug Policy Modelling Program, National Drug and Alcohol Research Centre,University of New South Wales, Sydney, NSW, Australiae-mail: [email protected]

Introduction
From late 2000 to the start of 2001, the global production and supply of opiates wassharply reduced (UNODC 2007), creating a significant ‘heroin drought’ in Australia(Miller et al. 2001; Weatherburn et al. 2001). The Australian Federal Governmentclaimed that the heroin drought was created through its national interdiction effortsand Tough on Drugs law enforcement strategy (AFP 2001). Indeed, it is true that theAustralian Federal police seized 606 kg of heroin and dismantled a major drug-trafficking syndicate a few months before the drought (Gordon 2002). These off-shore and border interdiction efforts were an important cornerstone of Australia’sfederal drug policy. Yet, the fact that the heroin shortage was clearly not isolated toAustralia drove many experts to suggest that external factors such as strategicdecisions and actions of the Asian crime syndicates supplying the Australian marketwere at stake (Bush et al. 2004).
Regardless of the cause of the global supply disruption, local-level drug marketsin Australia experienced an indisputable shortage of heroin, commencing in late2000 (Dietze et al. 2004). This reduction resulted in sudden price rises and reducedheroin purity on local drug markets [National Drug and Alcohol Research Centre(NDARC) 2002, Day et al. 2003, Bush et al. 2004]. At this time, many injectingheroin users adapted to the heroin shortage by increasing their demand for amphet-amines, benzodiazepines, and prescribed opioids, resulting in a fairly constant numberof injecting drug users in Melbourne (Dietze et al. 2004). The heroin drought thuscreated naturally occurring experimental conditions and provided an opportunity toexplore a number of ‘what if’ law enforcement scenarios through artificial crimesimulation techniques (Liu and Eck 2008).
Our paper examines how three street-level policing interventions—randompatrols, hot-spot policing and problem-orientated strategies—influenced drug marketdynamics in response to the macro-level disruption of the heroin supply chain. Weused an agent-based simulation model to create an artificial policing experiment,exploring the relative impact of these three strategies on crime and harm outcomeindicators. First, we describe the agent-based model (SimDrugDrought), created tosimulate agents operating under fluctuating market conditions. Then, we examine theresults of the street-level policing scenarios on crime and harm indicators. Wecompare and contrast our current results with outcomes from an earlier version of themodel, operating under stable market conditions (SimDrugPolicing). Our resultsshow the relative advantages of the problem-orientated strategy compared with thetwo other policing interventions under fluctuating market conditions. These resultshave important theoretical and policy implications for future research and practice.
Model description
Increasingly, agent-based simulation models are being used to explore how individuals(i.e. agents) interact within a given system and how system-level patterns emerge fromthe complex interplay of these local interactions (Epstein and Axtell 1996; Ferber1999; Janssen 2002; Perez and Batten 2006). Without discarding the value ofmathematical modelling (Baveja et al. 2000; Caulkins and Reuter 2006, agent-basedsimulations seem particularly appealing for studying illicit drug use and markets (Agar
268 A. Dray et al.

2005; Brantingham and Brantingham 2004; Liu and Eck 2008). Research on thegeography of crime (Weisburd and Green 1995; Eck 1998; Rengert et al. 2000, 2005),for example, finds street-level drug use and markets driven by local and spatialrelationships within and across various social communities. Unger and colleagues(2004) describe illicit drug use as the result of complex interactions between positedrisk and protective factors that operate at multiple levels of analysis. Previous researchalso suggests that drug markets are adaptive to external shocks affecting the system,such as the introduction of new drugs or new law enforcement policies (Caulkins andReuter 2006; Caulkins et al. 2004). Agent-based simulation models offer theopportunity to explore the consequences of these types of external shocks.
We refer to the agent-based simulation model presented in this paper asSimDrugDrought. SimDrugDrought is an extension of SimDrug (Perez et al. 2006)and SimDrugPolicing (Dray et al. 2008), created with the Common-pool resourcesand multi-agent systems (CORMAS)© environment (Bousquet et al. 1998) tounderstand the dynamics of street-level illicit drug markets better. Like its prede-cessors, SimDrugDrought was designed by an inter-disciplinary group of experts.The simulated dynamics and decision-making processes rely primarily on acollective and iterative analysis of published statistics from the Australian Bureauof Statistics (High Court and Magistrate Court orders), the Australian CrimeCommission (illicit drug seizures), the Ambulance Service Records (attendedoverdoses), the Australian Institute of Health and Welfare (drug treatment services),the Australian Institute of Criminology (drug use monitoring in Australia, DUMA)and the National Drug and Alcohol Centre (illicit drug reporting system, IDRS). Inorder to secure enough consistency across the different data sources, most of thecollected information corresponds to the situation in Melbourne between 1999 and2001, one epicentre of the heroin drought in Australia. However, Dietze et al. (2004)noted that Melbourne was not an isolated case and that most of the major cities inAustralia experienced the ‘drought’ during the same period.
Table 1 describes SimDrugDrought’s main characteristics. We concentrate in thepresent paper on describing specific characteristics of SimDrugDrought; all com-ponents inherited from previous versions are described in Perez and Dray (2005),Perez et al. (2006) or Dray et al. (2008).
Time and repetitions
Simulations are run on a daily time step in order to capture behavioural patterns ofinjecting drug users (IDUs). Each simulation covers a 36-month period and usesinput data on heroin price, purity and availability as monthly reported in Melbournebetween early 1999 and late 2001 (Dietze et al. 2004). When a parameterizationvector is selected, the corresponding simulation is repeated 100 times in order cap-ture the stochasticity attached to random processes embedded in SimDrugDrought(e.g. the initial positioning of agents or friendship networks).
Illicit drug supply under external shock conditions
SimDrugDrought represents an archetypal street-level market under conditions ofexternal shock to the supply of drugs to the local market place. Unlike
Policing Australia’s ‘heroin drought’: using an agent-based model to simulate alternative outcomes 269
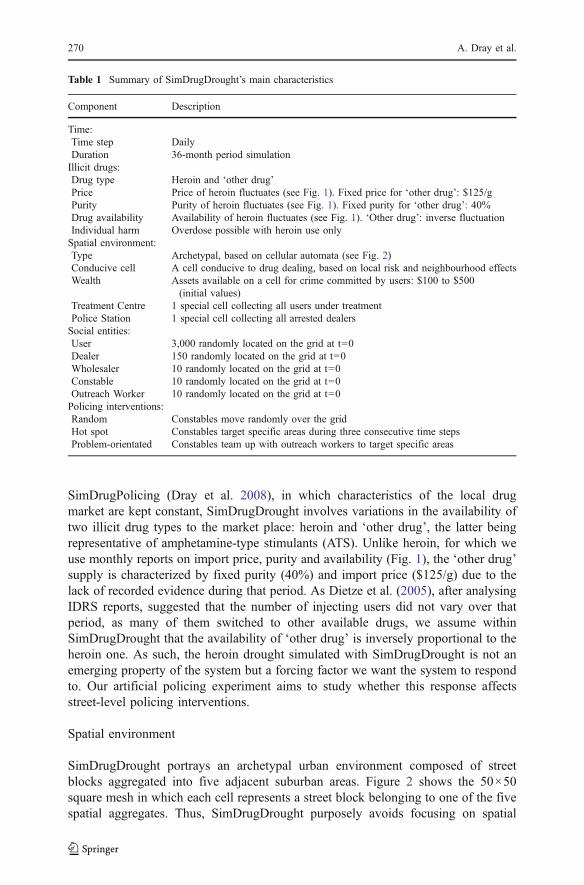
SimDrugPolicing (Dray et al. 2008), in which characteristics of the local drugmarket are kept constant, SimDrugDrought involves variations in the availability oftwo illicit drug types to the market place: heroin and ‘other drug’, the latter beingrepresentative of amphetamine-type stimulants (ATS). Unlike heroin, for which weuse monthly reports on import price, purity and availability (Fig. 1), the ‘other drug’supply is characterized by fixed purity (40%) and import price ($125/g) due to thelack of recorded evidence during that period. As Dietze et al. (2005), after analysingIDRS reports, suggested that the number of injecting users did not vary over thatperiod, as many of them switched to other available drugs, we assume withinSimDrugDrought that the availability of ‘other drug’ is inversely proportional to theheroin one. As such, the heroin drought simulated with SimDrugDrought is not anemerging property of the system but a forcing factor we want the system to respondto. Our artificial policing experiment aims to study whether this response affectsstreet-level policing interventions.
Spatial environment
SimDrugDrought portrays an archetypal urban environment composed of streetblocks aggregated into five adjacent suburban areas. Figure 2 shows the 50×50square mesh in which each cell represents a street block belonging to one of the fivespatial aggregates. Thus, SimDrugDrought purposely avoids focusing on spatial
Table 1 Summary of SimDrugDrought’s main characteristics
Component Description
Time:Time step DailyDuration 36-month period simulationIllicit drugs:Drug type Heroin and ‘other drug’Price Price of heroin fluctuates (see Fig. 1). Fixed price for ‘other drug’: $125/gPurity Purity of heroin fluctuates (see Fig. 1). Fixed purity for ‘other drug’: 40%Drug availability Availability of heroin fluctuates (see Fig. 1). ‘Other drug’: inverse fluctuationIndividual harm Overdose possible with heroin use onlySpatial environment:Type Archetypal, based on cellular automata (see Fig. 2)Conducive cell A cell conducive to drug dealing, based on local risk and neighbourhood effectsWealth Assets available on a cell for crime committed by users: $100 to $500
(initial values)Treatment Centre 1 special cell collecting all users under treatmentPolice Station 1 special cell collecting all arrested dealersSocial entities:User 3,000 randomly located on the grid at t=0Dealer 150 randomly located on the grid at t=0Wholesaler 10 randomly located on the grid at t=0Constable 10 randomly located on the grid at t=0Outreach Worker 10 randomly located on the grid at t=0Policing interventions:Random Constables move randomly over the gridHot spot Constables target specific areas during three consecutive time stepsProblem-orientated Constables team up with outreach workers to target specific areas
270 A. Dray et al.

realism to concentrate on decision-making processes and interactions between lawenforcement, prevention and treatment strategies. While sharing the views ofBrantingham and Brantingham (2004) on the importance of spatial configurationsfor urban crimes, our inter-disciplinary team of experts agreed on an incrementalbuild-up of complexity in order to preserve the experimental nature of SimDrug-Drought, as recently stated by Liu and Eck (2008). As a consequence, the PoliceStation and Treatment Centre represented on the grid operate like synthetic spatialmetaphors rather than realistic geographical entities. The size of the grid itself isselected to accommodate the number of interacting agents comfortably, withoutsacrificing calculus capacities.
An important attribute attached to each cell is its capacity to attract illegalactivities like drug dealing (conducivity). At the beginning of a simulation, 150conducive cells are located on the grid. Their (fixed) initial distribution generates anarbitrary heterogeneity between suburban areas, the top-left area supporting thehighest density of conducive cells (Fig. 2). During the simulation, each conducivecell can host one or more dealer agent. A wealth attribute is also attached to eachcell on the grid. This attribute acts as a proxy for the value of disposable goodsavailable for crime (burglary, street-theft). The value of wealth decreases each time acrime is committed on the cell (Perez and Dray 2005). A third attribute describes therisk attached to a specific cell. This attribute is arbitrarily defined as a function of thenumber of crimes, overdoses and users located on the cell at each time step (t):
riskcell; t ¼ 10X
crimecell; t þX
overdosecell; t� �
þX
usercell; t ð1Þ
Jan 1999 Jul 1999 Jan 2000 Jul 2000 Jan 2001 Jul 2001 Jan 2002
hero
in p
rice (
$/g
)
0
25
50
75
100
125
150
hero
in p
urity
and r
atio (
%)
0
20
40
60
80
100
heroin drought period
price ($/g)
purity (%)
ratio heroin/other (%)
Fig. 1 Evolution of heroin import price (left Y-axis), and purity and relative availability on the market(right Y-axis). Source: Dietze et al. (2004). The shaded area corresponds to the onset of the simulatedheroin drought
Policing Australia’s ‘heroin drought’: using an agent-based model to simulate alternative outcomes 271

Finally, the risk value is used to update the conductivity status of the cell and itsneighbours (for more details, see Perez and Dray 2005).
The Treatment Centre has a maximum capacity of 1,000 enrollments at any giventime step (t), irrespective of the type of treatment (detoxification, therapeuticcommunity or methadone replacement). Probabilities of entry and success rates forthe different types of treatment are derived from the Australian Treatment OutcomeStudy (ATOS) project (Teesson et al. 2006). Ten outreach worker agents are initiallybased at the Treatment Centre. At each time step (t) the Police Station collectsarrested user, dealer and wholesaler agents before they are permanently retrievedfrom the system. Ten constable agents (i.e. patrol officers) are initially located at thePolice Station and are directed to patrol a given area according to different lawenforcement strategies (see below). Constable and outreach worker agents are notlimited by jurisdictions; therefore, they can patrol the entire grid.
Social entities
Like the previous versions, SimDrugDrought includes different social entities: user,dealer and wholesaler, constable and outreach worker agents. A full description ofthese different types of agents is given in Perez and Dray (2005). The ‘modusoperandi’ of each agent in the model derives from rule-based heuristics collectivelydeveloped by the inter-disciplinary panel of experts. A key issue is the deliberatechoice to implement ‘open-system’ simulations whereby a removed agent isautomatically replaced by a new one later on. In the model, when a user succumbsto a fatal overdose or successfully completes treatment, it is removed from the modelat time step (t) and replaced by a new user at time step (t+1). Likewise, when adealer is arrested, it is replaced by a new dealer at the next time step. This strongand rather pessimistic assumption relies on the lack of evidence showing any
Fig. 2 Visualization grid at thebeginning of the simulation.Black dots initial set of cells(150) conducive to illicit drugactivities. Areas with differentshades of grey correspond todistinct suburbs
272 A. Dray et al.

noticeable changes in the numbers of dealers or IDUs in Melbourne over thesimulated period (Dietze et al. 2004).
User
Dietze et al. (2005) suggested that there were between 15,000 and 50,000problematic heroin users in Melbourne in 2000. Assuming an average number of30,000 injecting users over our simulated period, we created a 1:10 scalerepresentation of that population in order to cope with calculus capacities duringthe simulations. Hence, each simulation is initialized with 3,000 users randomlylocated on the grid.
Initially, a user is randomly given a ‘trusted’ dealer and a network of close friends(one to five other users). The daily objective for a user is to ‘score’ from its dealer,according to its degree of dependence. The drug of choice is heroin, but a user mighthave to buy ‘another drug’ according to its dealer’s supply. A user has a probabilityof 0.5% to experience an overdose if one of the following conditions is fulfilled:
(1) the previous drug injected was not heroin(2) the variation in quantity between two injections is greater than 0.02 g(3) the user comes out from a failed treatment period
A user experiencing an overdose has a 90% probability of being rescued if thereis another user around (i.e. on the same street block) to call for an ambulance. Thesetwo probabilities are partially calibrated against values for fatal and non-fataloverdoses in Melbourne (Dietze et al. 2004). Encounters with outreach workers oroverdose experiences progressively influence users’ motivation to undergo treat-ment. Each user receives $200 fortnightly from a welfare-like payment. This amountrepresents between 50% and 80% of actual payments in Australia and takes intoaccount withdrawal for other primary needs. Users can assess their financialsituation against their drug need and decide whether they have to commit a crime toincrease their revenue or whether they have enough money to buy bigger quantitiesof drug and start dealing themselves (becoming user-dealers).
Dealer
Estimating the number of drug dealers in a given area is anything but trivial.Fortunately, statistics on High Court and Magistrate Court orders provide a way toinfer ratios between sentenced wholesalers, street dealers and occasional user-dealers[Australian Bureau of Statistics (ABS) 2004]. We used these proxies to apply aconservative 1:20 ratio between users and dealers in our model, hence creating 150dealers at the beginning of a simulation. Figure 3 shows that a dealer is aneconomically rational agent applying differential mark-ups according to findings
ddeeaalleerr
uusseerr
uusseerr--ddeeaalleerr
wwhhoolleessaalleerr
x3
x1.5
x2
x2Fig. 3 Mark-up chain appliedfor both drugs between whole-salers, dealers and user-dealersin the model. Source: Moore(2005)
Policing Australia’s ‘heroin drought’: using an agent-based model to simulate alternative outcomes 273

from Moore et al. (2005). Currently, dealers can buy only one type of drug at a timefrom their wholesaler and then sell it to users. Dealers are trading on the streetmarket, but they are able to detect the presence of constables in their surroundingsand to freeze temporarily their illegal activities.
Wholesaler
If the same data-mining technique as above are used, and if the usual under-estimateof ‘big fish’ in High Court values are taken into account, a very conservative 1:15ratio is applied between dealers and wholesalers, resulting in the creation of tenwholesalers at the beginning of a simulation. They are able to buy the two types ofdrugs available on the market and to supply the dealers with one or the other. Drawnfrom Moore et al. (2005), mark-up values are shown in Fig. 3.
Constable
Regardless of the policing intervention selected by the Police Station (see below), aconstable (i.e. patrol officer) has a probability of 10% to arrest a dealer and a prob-ability of 40% to arrest a user-dealer when located in the same street block. As thistype of information is not available in the Australian context, we used data fromWeisburd and Green (1995), related to the Jersey City Drug Market Analysis Ex-periment, to calculate these arrest probabilities. In SimDrugDrought, constables donot arrest users unless they are involved in occasional dealing, and the Police Stationhas a probability of 0.25% to receive a ‘tip-off’ about a wholesaler’s location.
Outreach worker
Ten outreach workers are created and initially located at the Treatment Centre. Theiraim is to encourage users to undertake treatment programmes. Depending on thepolicing intervention strategy, the influence of outreach workers on the users’motivation varies (see below).
Policing interventions
Using the classification by Mazerolle et al. (2006) of street-level drug lawenforcement interventions, SimDrugDrought simulates three types of policeintervention strategies: random patrols, hot-spot policing and problem-orientatedstrategy (Table 2). Unlike SimDrugPolicing (Dray et al. 2008), SimDrugDrought
Table 2 Summary of the simulated law enforcement strategies
Parameter Random Patrol Hot Spot Policing Problem-OrientatedStrategy
Constable’sdestination
Random Street blocks with highest risk valuesfor three consecutive time steps
Street blocks withhighest risk values
Outreach worker’sdestination
Street block withhighest overdose rates
Street block with highestoverdose rates
Follows constabledestinations
274 A. Dray et al.

examines the impact of different police interventions under conditions of macro-level disruptions to the drug supply. Table 2 summarizes the characteristics of thedifferent policing scenarios implemented.
Random patrols
Under this scenario, constables (i.e. police patrols) move randomly across the gridwithout targeting any given area, simulating random preventive patrols and attendingquiet suburbs as well as crime hot spots. The Police Station randomly selects tencells (i.e. street blocks) and allocates one constable to each. The Police Station hasno memory of the places already visited. Thus, some places might be visited severaltimes or not at all within one simulation. The Treatment Centre acts independentlyand sends its outreach workers to cells displaying the highest overdose rates.
Hot-spot crackdowns
Under this scenario, the Police Station adapts its strategy to changes in the simulatedenvironment and directs constables to areas identified as ‘hot spots’. A hot spotcorresponds to a conducive cell with a high value of risk. In practice, the PoliceStation selects ten street blocks with the highest values of risk and allocates oneconstable to each (i.e. patrol resource allocation). The Police Station has a memoryof the street blocks previously visited. By default, a targeted street block receivesthree consecutive visits from a constable, reflecting on the higher degree of attentionpaid to hot spots in this scenario. This default value (Np) is, later on, subjected to asensitivity analysis.
Problem-orientated policing
Under this scenario, the Police Station and the Treatment Centre create a partnershipsuch that constables and outreach workers work together as a team on the grid.While acknowledging the diversity of tactics corresponding to problem-orientatedpolicing (Goldstein 1990; Scott 2000), we use SimDrugDrought to simulate ageographically focused partnership (Mazerolle et al. 2006). Hence, constables stilltarget hot spots with the highest value of risk, but, this time, they work jointly withoutreach workers. The underlying assumption is that this kind of partnershipenhances drug user’s motivation to undertake treatment. In order to test thisassumption, we hypothesized that the influence outreach workers have on users is,by default, multiplied by 5 in this scenario. This default value (Iow) is, later on,subjected to a sensitivity analysis.
Analytical approach
Each policing scenario is run through the model 100 times in order to capture thestochastic divergence between simulations due to non-linear interactions and randomprocesses characterizing SimDrugDrought. All graphs presented below includeintervals of error based on calculated standard deviations. Each simulation is run
Policing Australia’s ‘heroin drought’: using an agent-based model to simulate alternative outcomes 275

over the same 36-month period corresponding to the period between January 1999and December 2001. Parametric tests are conducted at different time steps in order todetermine the significance of the differences between scenarios; results are providedfor a probability (P) of 0.05.
Results
The key outcome measures analysed in our model include: (1) the number ofarrested dealers, (2) the number of users under treatment, (3) number of committedcrimes, (4) number of aborted crimes, (5) prevalence of heroin use, (6) occurrence ofoverdoses and (7) spatial evolution of conducive clusters (see also Dray et al. 2008).In order to address the impact of street-level policing interventions on these outcomemeasures under conditions of external shock to the drug market dynamics (i.e. theheroin drought), we compared and contrasted our findings to results establishedunder stable market conditions (heroin and ‘other drug’ covered 50% of the marketeach consistently over the simulated period). We used previously published resultsfrom the SimDrugPolicing model as our base for the comparison (see Dray et al.2008).
Cumulative number of arrested dealers
Figure 4 shows that the random patrol scenario leads to the lowest rate of arresteddealers after 36 months, with an average of 91 arrests. Meanwhile, the problem-
0
50
100
150
200
250
Jan-99
Mar-99
Jun-99
Aug-99
Nov-99
Feb-00
Apr-00
Jul-00
Oct -00
Dec-00
Mar-01
May-01
Aug-01
Nov-01
months
arre
sted
dea
lers
Random PatrolHot SpotProblem Oriented
Fig. 4 Cumulative number of arrested dealers and associated standard deviations for three different lawenforcement strategies. There were 100 repetitions and a daily time step, simulated over a 36-monthperiod. The shaded area corresponds to the onset of the simulated heroin drought
276 A. Dray et al.

orientated scenario leads to an average of 189 arrests, and the hot-spot scenario to anaverage of 174 arrests. Differences between random patrol and the two other scenariosare statistically significant over the whole simulated period. The 8.6% difference inarrests between problem-orientated and hot-spot scenarios is not statistically significant.However, we note that, under stable market conditions, this difference is not to beobserved (Dray et al. 2008). Part of the explanation is to be found in the smaller size ofconducive clusters (see below) under the problem-orientated scenario, especially whenmany users have to turn to the cheaper and more available ‘other drug’. A sensitivityanalysis conducted on the number of consecutive patrols (Np) in the same street block(Np∈ [1, 5]) shows no significant advantage in terms of arrests beyond Np=2.
Percentage of users under treatment
Figure 5 shows that the problem-orientated scenario translates into large numbers ofusers undertaking treatment in the early stages of the simulation. The TreatmentCentre operates at almost full capacity, with 33% of the population of users seekingtreatment. In contrast, it takes 18 months for random patrol and hot spot scenarios toreach a plateau of only 17% of users undergoing treatment. The early oscillationscharacterizing the problem-orientated scenario result from a complex interplay ofentries into and releases from treatment programmes of different durations. However,the reduction in admissions between May 2000 and March 2001, mirrored by theslight inflexion observed with the two other scenarios, corresponds to the onset ofthe ‘drought’. Again, these patterns in treatment admissions are not observed understable market conditions.
The greater effectiveness of the problem-orientated scenario to direct users intotreatment relies on a better capacity of outreach workers to convince users (Iow=5)than in the two other scenarios (Iow=1). Hence, a sensitivity analysis on Iow isperformed with values ranging from 1 to 10. With a value of 1, the problem-
0.0
5.0
10.0
15.0
20.0
25.0
30.0
35.0
40.0
Jan-99
Mar-99
Jun-99
Aug-99
Nov-99
Feb-00
Apr-00
Jul-00
Oct -00
Dec-00
Mar-01
May-01
Aug-01
Nov-01
months
use
rs u
nd
er t
reat
men
t (%
)
Random Patrol
Hot Spot
Problem Oriented
Fig. 5 Percentage of users under treatment and associated standard deviations for three different lawenforcement strategies. There were 100 repetitions and a daily time step, simulated over a 36-monthperiod. The shaded area corresponds to the onset of the simulated heroin drought
Policing Australia’s ‘heroin drought’: using an agent-based model to simulate alternative outcomes 277

orientated scenario performs as poorly as the other scenarios, sending only 18% ofusers for treatment. Conversely, for values of Iow greater than 4, under the problem-orientated policing scenario, the Treatment Centre reaches its full capacity after ashort period of time. These findings have two important consequences in terms oftreatment: (1) problem-solving partnerships need to enhance the influence ofoutreach workers, to be effective, and (2) effective partnerships need to be followedby adequate treatment capacities.
Monthly crimes committed by users
Over 3 years, the problem-orientated scenario leads to a monthly average of 2.6crimes per user. In comparison, the hot spot and random patrol scenarios lead,respectively, to 2.9 and 3.9 crimes per user. Having hypothesized in the model thatusers in desperate need of money commit crimes, we find that the significantly lowercrime rate exhibited by the problem-orientated scenario is partly due to the fact that33% of users are rapidly diverted into treatment. However, the good results alsodisplayed by the hot spot scenario show that repeated crackdowns, partnership ornot, are effective as well.
The initial glut observed in Fig. 6 is an artefact of the model, whereby most users donot have enough money at the beginning of the simulation and commit crimes tofinance their drug addiction. The peak of the crime epidemic is followed by a re-cession phase, as an increasing number of users reach a more stable financial position.The problem-orientated scenario does not display such a glut, as 33% of users arerapidly diverted into treatment. A sensitivity analysis conducted on the number ofconsecutive patrols (Np) into the same street block (Np∈ [1, 5]) shows no significantreduction in the number of daily crimes beyond Np=3. However, the absence ofreplication (Np=1) brings the hot spot scenario to nearly the same level of criminalityas that of the random patrol scenario (409 and 445 daily crimes, respectively).
0
100
200
300
400
500
600
Jan-99
Mar-99
Jun-99
Aug-99
Nov-99
Feb-00
Apr-00
Jul-00
Oct -00
De c-00
Mar-01
May-01
Aug-01
Nov-01
months
mo
nth
ly c
rim
es
Random Patrol
Hot Spot
Problem Oriented
Fig. 6 Monthly averages of crimes committed daily by users and associated standard deviations for threedifferent law enforcement strategies. There were 100 repetitions and a daily time step, simulated over a36-month period. The shaded area corresponds to the onset of the simulated heroin drought
278 A. Dray et al.

A slight inflexion in the number of crimes committed over time (Fig. 6) is theonly noticeable influence of the heroin drought. This moderate effect is partly due tothe fact that the ‘drought’ takes place just after the above-mentioned glut, during itsrecession phase. Other reasons involve the capacity of many users to absorb theheroin price inflation due to already established savings (cash or drug) or to switchto the cheaper ‘other drug’. Nevertheless, the inflexion period is not to be observedunder stable market conditions, crime rates reaching a steady plateau soon after theglut (498, 417 and 397 daily crimes for random patrol, hot spot and problem-orientated scenarios, respectively).
Monthly aborted crimes
The effectiveness of the simulated policing interventions can also be assessed byexamining the number of aborted crimes (i.e. intended crimes that are abortedbecause of the presence of the constables in the neighbourhood). Figure 7 shows themonthly averages of daily aborted crimes. The random patrol scenario confirms itsvery limited impact on criminal activities, compared with the other two strategies,with only 90 aborted crimes by the end of the simulation. By comparison, thehotspot scenario is 2.7-times more effective, with nearly 240 aborted crimes.Interestingly, the problem-orientated policing scenario leads to an average of 156aborted crimes. On closer inspection, we note that the higher proportion of usersundertaking treatment limits the number of users intending to commit a crime.Indeed, the ratio of aborted crimes to committed crimes does not express anysignificant variation between hot spot and problem-orientated scenarios (62% and56%, respectively).
Prevalence of heroin use
Initially, nearly 90% of users are able to score their drug of choice—heroin—independently of police intervention scenarios. While random patrol and hot-spot
0
50
100
150
200
250
300
350
400
450
Jan-99
Mar-99
Jun-99
Aug-99
Nov-99
Feb-00
Apr-00
Jul-00
Oct -00
De c-00
Mar-01
May-01
Aug-01
Nov-01
months
mo
nth
ly a
bo
rted
cri
mes
Random Patrol
Hot Spot
Problem Oriented
Fig. 7 Monthly averages of daily aborted crimes and associated standard deviations for three different lawenforcement strategies. There were 100 repetitions and a daily time step, simulated over a 36-monthperiod. The shaded area corresponds to the onset of the simulated heroin drought
Policing Australia’s ‘heroin drought’: using an agent-based model to simulate alternative outcomes 279

scenarios slowly adjust to the initial conditions of the supply market (80% heroinand 20% ‘other drug’), the problem-orientated scenario experiences a sharp drop to65% of consumption (Fig. 8). Again, this is a direct consequence of the large numberof users undertaking treatment at that time. The onset of the heroin droughtcorresponds to a significant decrease in heroin use across the different scenarios.March 2001 corresponds to the lowest point of heroin availability (35%) but it takesnearly 5 months for the problem-orientated scenario to reach an equivalentpercentage of heroin use, as a consequence of the heroin stocks held by wholesalersand dealers. Interestingly, the random patrol scenario retains a significantly higherrate of heroin consumption (44%), after the drought, as a consequence of (1) largernumbers of crimes being committed (better affordability of heroin) and (2) fasterturnover of drug stocks. As expected, under stable market conditions, the populationof users displays a stable pattern of drug use (56% heroin and 44% ‘other drug’).
Monthly occurrence of overdoses
The occurrence of overdoses in SimDrugDrought is a consequence of complexinteractions between market conditions, prevalence of crimes and treatmentefficiency. Figure 9 shows no statistically significant differences (P=0.05) betweenthe three scenarios, due to the limited number of occurrences (between ten and 40overdoses per month). The problem-orientated scenario seems to perform bestthough. The initial decrease in the number of overdoses matches the early trends inheroin use (Fig. 8). The onset of the heroin drought triggers a second phase ofoverdose decline across the different scenarios, reaching, in March 2001, thefollowing monthly values: 17, 20 and 24 for problem-orientated, hot spot andrandom patrol scenarios, respectively. Again, under stable market conditions thethree scenarios display stable patterns of occurrences much earlier during thesimulation, without statistically significant differences between scenarios. These
0
10
20
30
40
50
60
70
80
90
100
Jan- 99
Mar- 99
Jun- 99
Aug- 99
Nov- 99
Feb- 00
Apr- 00
Jul- 00
Oct- 00
Dec- 00
Mar- 01
May- 01
Aug- 01
Nov- 01
months
Her
oin
use
(%
)
Random Patrol
Hot Spot
Problem Oriented
Fig. 8 Prevalence of heroin use among agents (as a percentage) and associated standard deviations forthree different law enforcement strategies. There were 100 repetitions and a daily time step, simulated overa 36-month period. The shaded area corresponds to the onset of the simulated heroin drought
280 A. Dray et al.

findings confirm that, if a constant number of users and dealers in the system areassumed, police intervention scenarios have a very limited impact on the occurrenceof overdoses, due to the interplay of many different factors.
Spatial evolution of conducive clusters
Figure 10 shows an example of the visualization grid at the end of a simulation (hotspot scenario, one simulation only). Under the influence of drug dealing, criminalactivities and police interventions, conducive cells tend to aggregate into dynamicconducive clusters that can be interpreted as computer metaphors for actualproblematic suburbs. Tracking the footprints of these clusters becomes a challengingobjective under our stochastic and comparative approach. Our cluster density (Cd)variable tries to encapsulate as much information as possible into a rather simpleindicator:
Cd ¼Xi
Xj
Ci: ci;j
!, Xi
Ci
!ð2Þ
with:
Ci the number of clusters of class i with i=1, 2…7.cij, the number of cells belonging to cluster j of class i
We have defined seven classes of clusters according to their number of cells: class 1(one cell), class 2 (two to ten cells), class 3 (11 to 50 cells), class 4 (51 to 100 cells),class 5 (101 to 200 cells), class 6 (201 to 500 cells) and class 7 (501 to 1,000 cells). Ateach time step, we store the distribution of clusters and cells, then, we calculate theaverage value of Cd and its standard deviation over 100 repetitions of the samescenario. Figure 11 shows the evolution of cluster densities for the three policingintervention scenarios. Variations across scenarios are highly significant (P=0.05)
0
10
20
30
40
50
60
Jan-99
Mar-99
Jun-99
Aug-99
No v-99
Feb-00
Apr-00
Jul-00
Oct -00
Dec-00
Mar-01
May-01
Aug-01
Nov-01
months
mo
nth
ly o
verd
ose
s
Random Patrol
Hot Spot
Problem Oriented
Fig. 9 Monthly occurrence of overdoses among users and associated standard deviations for threedifferent law enforcement strategies. There were 100 repetitions and a daily time step, simulated over a36-month period. The shaded area corresponds to the onset of the simulated heroin drought
Policing Australia’s ‘heroin drought’: using an agent-based model to simulate alternative outcomes 281

over the entire simulated period. The random patrol scenario generates the highestdensities, with a final value of 27, corresponding to a topology where one giantcluster (more than 600 cells) is mostly surrounded by isolated unit clusters (one cell).The problem-orientated scenario ends up with the lowest densities and a final valueof 17. It corresponds to a topology where two massive (class 6) clusters aresurrounded by smaller or unit clusters (classes 1, 3 and 4). The hot spot scenariodisplays intermediate densities, with a final value of 22. The corresponding topologydisplays a fluctuating behaviour, regularly switching from one giant cluster to moredistributed configurations.
Under the random patrol scenario, it appears that constables are not able tocontrol the evolution of the first massive cluster forming in the early phase of the
Fig. 10 Visualization grid at theend of the simulation (hot spotscenario). Black dots indicatecells conducive to illicit drugactivities clustered into ‘hotspots’. Areas with differentshades of grey correspond todistinct suburbs
0.0
5.0
10.0
15.0
20.0
25.0
30.0
35.0
Jan-99 Apr-99 Jul-99 Sep-99 Dec-99 Mar-00 Jun-00 Sep-00 Dec-00 Mar-01 Jun-01 Sep-01 Dec-01
months
Mo
nth
ly c
lust
er d
ensi
ty
Random Patrol Hot Spot Problem Oriented
Fig. 11 Evolution of cluster densities and associated standard deviations for three different lawenforcement strategies. There were 100 repetitions and a daily time step, simulated over a 36-monthperiod. The shaded area corresponds to the onset of the simulated heroin drought
282 A. Dray et al.

simulation. Conversely, the problem-orientated scenario depicts a situation wherebythe first massive cluster is maintained at a reasonable size and dealers regularly try tosettle in new and smaller clusters, analogous to the spatial displacement phenome-non. The hot spot scenario displays a kind of punctuated equilibrium, whereby giantclusters are able to form before being dispersed by police crackdowns. Again, theseevolving but resilient patterns exist because of the ‘open-system’ configuration ofour model (i.e. replacement of removed dealers and users).
Conclusion
Our paper describes an agent-based simulation model that explores the relativeimpact of three law enforcement strategies—random patrol, hot-spot policing andproblem-orientated policing—on a street-level drug market. We simulated an‘external shock’ disrupting the macro-level heroin supply chain by using data setscovering the period of the ‘heroin drought’ in Melbourne between 1999 and 2001. Inessence, we used SimDrugDrought to simulate an artificial crime experiment,studying the way our three policing intervention scenarios had an impact on marketdynamics, in response to this external shock. We examined the impact of our threescenarios on several outcome variables, including (1) number of arrested dealers, (2)number of users under treatment, (3) number of committed crimes, (4) number ofaborted crimes, (5) prevalence of heroin use, (6) occurrence of overdoses and (7)spatial evolution of conducive clusters. Our depiction of the naturally occurringexperiment was compared with stable market conditions described in a previouspaper (Dray et al. 2008).
Within the limits of our experimental conditions, three findings emerged from ourresearch:
(1) Street-level policing interventions not only disrupted criminal activities tovarious degrees, but also influenced other aspects of drug market dynamics,such as individual or social harm.
(2) If the overall availability of illicit drugs remained constant, external marketfluctuations had a limited impact on relative responses to street-levelinterventions.
(3) Street-level interventions were more likely to disrupt local markets and illicitdrug use than were macro-level interdiction efforts.
First, the problem-orientated scenario not only succeeds in obtaining the highestpercentage of arrested dealers and the lowest percentage of committed crimes, but italso has a significant impact on the prevalence of heroin use, the percentage of usersundertaking treatment and the spatial extension of conducive clusters. Except for theoccurrence of overdoses, the problem-orientated scenario displays statisticallysignificant (P=0.05) differences from the random patrol scenario over the 36-monthsimulated period. The hot spot scenario demonstrates the same ability to disruptcriminal activities (arrested dealers and committed crimes) but fails to minimizeindividual harm (percentage of users under treatment) or social harm (clusterdensity) in the same proportions. Partnership between constables and outreachworkers also allows a better allocation of policing forces: to maintain the same level
Policing Australia’s ‘heroin drought’: using an agent-based model to simulate alternative outcomes 283

of committed crimes, the hot spot scenario needs 1.8-times as many interventions todeter ill-intentioned users (aborted crimes).
Secondly, the relative responses to the three policing intervention scenariossimulated with SimDrugDrought confirm most of the results previously recordedunder stable market conditions (Dray et al. 2008). Hence, supply-chain disruptionsresulting only in displacements from one illicit drug to another have little chance ofcritically modifying street-level responses to local interventions. Once again, thisconclusion holds within the limits of our experimental conditions, including: (1) aconstant global offer of illicit drugs and (2) a stable structure of criminal networks,regardless of the types of illicit drug available on the street markets. Although thesimulated ‘heroin drought’ did not modify the relative advantages of the differentpolicing interventions, it often influenced the rates at which one response variableevolved over time. This was particularly the case for the prevalence of heroin use,the occurrence of overdoses and, to a more limited extent, the committed and abortedcrimes.
Finally, our findings suggest that a macro-level interdiction effort that results only(directly or indirectly) in a market displacement, whereby one type of illicit drugreplaces another one, has hardly any chance to disrupt street-level markets so long asthe overall offer or the supply chain is not durably affected. By comparison, problem-orientated policing interventions are more likely to disrupt street-level marketseffectively.
From a theoretical perspective, these results are consistent with new research thatrevisits the importance of the community setting of street-level drug markets(Rengert et al. 2005). Mazerolle et al. (2006), in their systematic review of street-level drug law enforcement, conclude that further research is needed to examine thedifferential impacts of different policing approaches on different types of drugmarkets. The results presented in this paper, however, suggests that the dynamics ofstreet-level drug markets are probably better explained by characteristics of thecommunity setting, as described by Rengert et al. (2005), than by the characteristicsof the illicit drug market itself. In this context, computer simulations, as suggestedby Liu and Eck (2008), have much to offer to help us explore the complex interplay ofcriminal activities, police interventions and community responses. SimDrugDroughtis just another link in a long chain of attempts to understand this complexity better,from drug initiation (Agar 2005) to geography of crime (Brantingham andBrantingham 2004).
Acknowledgements This paper was supported by a grant from the Colonial Foundation Trust to theNational Drug and Alcohol Research Centre (with sub-contracts to Griffith University, Australian NationalUniversity and Turning Point Drug and Alcohol Centre). The authors are part of the Drug PolicyModelling Program (DPMP) team and wish to thank Gabriele Bammer, Jonathan Caulkins, Paul Dietze,Tim Moore and Peter Reuter for their contributions to this paper.
References
AFP, Annual report 2000–01: Australian Federal Police, Annual Report 2000–2001 (Australian FederalPolice, Canberra, 2001).
Agar, M. (2005). Agents in living color: towards emic agent-based models. Journal of Artificial Societiesand Social Simulation, 8(1).
284 A. Dray et al.

Australian Bureau of Statistics (2004). Criminal courts 2002–03, Cat No. 5413.0. Canberra: AustralianBureau of Statistics.
Baveja, A., Feichtinger, G., Hartl, R. F., & Haunschmeid, J. L. (2000). A resource-constrained optimalcontrol model for crackdown on illicit drug markets. Journal of Mathematical Analysis andApplications, 249, 53–79.
Bousquet, F., Bakam, I., Proton, H., & Le Page, C. (1998). CORMAS: common-pool resources and multi-agent systems. Lecture Notes in Artificial Intelligence, 1416, 826–837.
Brantingham, P. J., & Brantingham, P. L. (2004). Computer simulation as a tool for environmentalcriminologists. Security Journal, 17, 21–30.
Bush, W., Roberts, M., & Trace, M. (2004). Upheavals in the Australian drug market: heroin drought,stimulant flood. The Beckley Foundation drug policy program. Drugscope Briefing Paper, No 4.
Caulkins, J. P., & Reuter, P. (2006). Illicit drug markets and economic irregularities. Socio-EconomicPlanning Sciences, 40, 1–14. doi:10.1016/j.seps.2004.08.002.
Caulkins, J. P., Behrens, D. A., Knoll, C., Tragler, G., & Zuba, D. (2004). Modeling dynamic trajectoriesof initiation and demand: the case of the US cocaine epidemic. Health Care Management Science, 7(4), 319–329.
Day, C., Topp, L., Rouen, D., Darke, S., Hall, W., & Dolan, K. (2003). Decreased heroin availability inSydney in early 2001. Addiction, 98, 93–95.
Dietze, P., Hickman, M., & Kimber, J. (2005). Monograph No. 03: Estimating the prevalence ofproblematic heroin use in Melbourne. DPMP Monograph Series. Fitzroy: Turning Point Alcohol andDrug Centre.
Dietze, P., Miller, P., Clemens, S., Matthews, S., Gilmour, S., & Collins, L. (2004). The course andconsequences of the heroin shortage in Victoria. NDLERF Monograph, No 6, Adelaide: AustralasianCentre for Policing Research.
Dray, A., Mazerolle, L., Perez, P., & Ritter, A. (2008). Drug law enforcement in an agent-based model:simulating the disruption to street-level drug markets. In: Liu, L. & Eck, J. (Eds.), Artificial crimeanalysis systems: using computing simulations and geographic information systems. InformationScience Reference Publisher.
Eck, J. E. (1998). A general model of the geography of illicit retail market places. In D. Weisburd, & J.Eck (Eds.), Crime prevention studies, vol. 4. Monsey (NY): Criminal Justice Press.
Epstein, J. M., & Axtell, R. (1996). Growing artificial societies: social science from the bottom up. MITPress/Brookings Institution.
Ferber, J. (1999). Multi-agent systems. Addison-Wesley.Goldstein, H. (1990). Problem-oriented policing. New York: McGraw-Hill.Gordon (Jan. 2002): Sandy Gordon, “Drug drought can be sourced to good policing” in Sydney Morning
Herald, Wednesday 23 January 2002, p.11.Janssen, M. A. (ed.) (2002). Complexity and ecosystem management: the theory and practice of multi-
agent systems. Cheltenham: Edward Elgar Publishers.Mazerolle, L., Soole, D., & Rombouts, S. (2006). Street-level drug law enforcement: a meta-analytic
review. Journal of Experimental Criminology. Issue 2, pp 409–435.Miller, P., Fry, C., & Dietze, P. (2001). A study of the impact of the heroin “Drought” in Melbourne: results of
the drug availability monitoring project (DAMP). Fitzroy: Turning Point Drug and Alcohol Centre, Inc.Moore, T. J. (2005). Monograph No. 01: What is Australia’s “drug budget”? The policy mix of illicit
drug-related government spending in Australia. DPMP Monograph Series. Fitzroy: Turning PointAlcohol and Drug Centre.
Moore, T. J., Caulkins, J. P., Ritter, A., Dietze, P., Monagle, S., & Pruden, J. (2005). Monograph No. 09:Heroin markets in Australia: current understandings and future possibilities. DPMP MonographSeries. Fitzroy: Turning Point Alcohol and Drug Centre.
National Drug and Alcohol Research Centre (2002). Changes in patterns of drug use associated with thereduced availability of heroin. Drug trends bulletin. Sydney: National Drug and Alcohol Research Centre.
Perez, P., & Batten, D. (2006). Complex science for a complex world: an introduction. In: Perez, P. &Batten, D. (Eds.), Complex science for a complex world. Exploring human ecosystems with agents(pp. 3–20). Canberra, Australia, ANU E Press.
Perez, P., & Dray, A. (2005). Monograph No. 11: SimDrug: exploring the complexity of heroin use inMelbourne. DPMP Monograph Series. Fitzroy: Turning Point Alcohol and Drug Centre, ISBN1740011724.
Perez, P., Dray, A., Ritter, A., Dietze, P., Moore, T., & Mazerolle, L. (2006). SimDrug: tackling thecomplexity of illicit drug markets. In: Complex Science for a Complex World, Exploring HumanEcosystems with Agents. Edited by D Batten and P. Perez, ANU E-Press.
Policing Australia’s ‘heroin drought’: using an agent-based model to simulate alternative outcomes 285

Rengert, G., Chakravorty, S., Bole, T., & Henderson, K. (2000). A geographic analysis of illegal drugmarkets. In M. Natarajan, & M. Hough (Eds.), Illegal drug markets: from research to preventionpolicy. Monsey, New York: Criminal Justice Press.
Rengert, G., Ratcliffe, J., & Chakravorty, S. (2005). Policing illegal drug markets: geographic approachesto crime reduction. Monsey, New York: Criminal Justice Press.
Scott, M. S. (2000). Problem-oriented policing: reflections on the first 20 years. Washington DC: Officeof Community-Oriented Policing Services, U.S Department of Justice.
Teesson, M., Ross, J., Darke, S., Lynsky, M., Ali, R., & Ritter, A. (2006). One year outcomes for heroindependence: findings from the Australian Treatment Outcome Study (ATOS). Drug and AlcoholDependence, 83(2), 174–180.
Unger, J. B., Baezconde-Garbanati, L., Shakib, S., Palmer, P. H., Nezami, E., & Mora, J. (2004). Acultural psychology approach to drug abuse prevention. Substance Use & Misuse, 39(10–12), 1779–1820.
UNODC (2007). World Drug Report 2007. United Nations Publications, Office of Drugs and Crime,Vienna, Austria, 274 p.
Weatherburn, D., Jones, C., Freeman, K., & Makkai, T. (2001). The Australian heroin drought and itsimplications for drug policy. Crime and justice bulletin, Contemporary Issues in Crime and Justice,Number 59. NSW Bureau of Crime Statistics and Research.
Weisburd, D., & Green, L. (1995). Policing drug hotspots: findings from the Jersey City DMAExperiment. Justice Quarterly, 12(4), 711–735.
Anne Dray Before joining the Human Ecosystems Modelling with Agents (HEMA) Consulting group thisyear, Anne Dray had worked as a Research Fellow at the Australian National University for 4 years. She isan agronomist by training, and her current research focuses on exploring complex systems using agent-based modelling. Relevant stakeholders and policy makers are involved in the early stages of modeldevelopment through participatory modelling. She has applied this approach in diverse contexts, includingequitable water allocation in Tarawa (Republic of Kiribati), coral reef conservation in Mexico and thePhilippines, and groundwater salinity control in Western Australia. In the field of illicit drugs, she hasdeveloped SimDrug, an agent-based model dedicated to exploring illicit drug markets in Australia.
Lorraine Mazerolle is the Director of the Australian Research Council (ARC) Centre of Excellence inPolicing and Security (CEPS) and a Professor in the School of Criminology and Criminal Justice atGriffith University. She received her Ph.D. from Rutgers University, New Jersey, USA in 1993 and spentan additional 7 years as an academic in the USA (at Northeastern University and the University ofCincinnati). She is the recipient of numerous US and Australian national competitive research grants ontopics such as problem-orientated policing, police technologies (e.g. crime mapping, gunshot detectionsystems, 3-1-1 call systems), community crime control, civil remedies, street-level drug enforcement andthe policing of public housing sites. In 2003 Professor Mazerolle was admitted as a Fellow of theAcademy of Experimental Criminologists and now serves as the Vice President of the Academy and as anAssociate Editor of the Journal of Experimental Criminology. Professor Mazerolle is the lead author (withJanet Ransley) of Third Party Policing (Cambridge University Press), sole author of Policing Places withDrug Problems (Sage Publications) and a co-editor, with Jan Roehl, of Civil Remedies and CrimePrevention (Criminal Justice Press). She has written many scholarly articles on policing, drug lawenforcement, displacement of crime, and crime prevention.
Pascal Perez (MSc (Agr) PhD (Envt Mgt)) is currently an Associated Professor at the Research School ofPacific & Asian Studies, the Australian National University. He is also a Graduate School lecturer with theMaster of Applied Anthropology for the Development (MAAPD). He is the representative in Australia ofhis French research agency, CIRAD (Centre for International Research on Agriculture for Development).He is a specialist of Integrative Social Simulation, using Multi-Agent Systems technologies to explorecomplex and adaptive systems. He is a Chief Investigator with the Drug Policy Modelling Program(DPMP), in the charge of integrated model development. In 2002, he received an ARC-InternationalLinkage Fellowship. He is the author of more than 80 scientific articles and co-editor of Complex Sciencefor a Complex World (ANU E Press).
286 A. Dray et al.

Alison Ritter is an Associate Professor at the National Drug and Alcohol Research Centre, with adjunctappointments with the Regulatory Institutions Network, The Australian National University and the KeyCentre for Ethics, Law, Justice and Governance, Griffith University. After completing her Master’s degreein Clinical Psychology, she worked full-time as a clinical psychologist. During this time, she commencedher Ph.D. in treatment outcomes associated with acquired brain injury. A subsequent move to a policyposition with the Victorian Department of Human Services led to a secondment to establish the TurningPoint Alcohol and Drug Centre on behalf of Government in 1994. As Deputy Director of Turning PointAlcohol and Drug Centre from 1995 to 2005, Alison completed numerous clinical research projects,including trials of new medications for the treatment of heroin dependence, and managed epidemiological,health services research and evaluation. With a National Health and Medical Research Council (NHMRC)Research Fellowship and a significant philanthropic grant, Alison is currently director of a major illicit-drug policy research programme, the Drug Policy Modelling Program in collaboration with scholars fromThe Australian National University (ANU), Turning Point Alcohol and Drug Centre and GriffithUniversity School of Criminology. The goal of the work is to advance illicit-drug policy throughimproving the evidence base, developing new policy decision-making tools and understanding the bestmix of policy options (law enforcement, prevention, treatment and harm reduction) and the ways in whichthese different policy options dynamically interact. Associate Professor Ritter is Executive Editor of theDrug and Alcohol Review, President of the Australian Professional Society on Alcohol & Drugs and amember of the College of Problems on Drug Dependence (CPDD). A/Prof. Ritter carries out reviews for arange of competitive funding bodies and international addictions journals.
Policing Australia’s ‘heroin drought’: using an agent-based model to simulate alternative outcomes 287
Copyright © 2022 FDOKUMEN