Elevational gradients of terricolous lichen species richness in the Western Himalaya

DOI 101111j1466-8238200700320x copy 2007 The Authors
668
Journal compilation copy 2007 Blackwell Publishing Ltd wwwblackwellpublishingcomgeb
Global Ecology and Biogeography (Global Ecol Biogeogr)
(2007)
16
668ndash678
RESEARCHPAPER
Blackwell Publishing Ltd
Plant species richness in continental southern Siberia effects of pH and climate in the context of the species pool hypothesis
Milan Chytr
y
1
Ji
r
iacute Danihelka
12
Nikolai Ermakov
3
Michal Haacutejek
12
Petra Haacutejkovaacute
12
Martin Ko
ccedil
iacute
1
Svatava Kube
szlig
ovaacute
14
Pavel Lustyk
1
Zdenka Ot
y
pkovaacute
1
Denis Popov
5
Jan Role
ccedil
ek
1
Marcela
R
ezniacute
ccedil
kovaacute
1
Petr
Iacute
marda
1
amp Milan Valachovi
ccedil
6
ABSTRACT
Aim
Many high-latitude floras contain more calcicole than calcifuge vascular plantspecies The species pool hypothesis explains this pattern through an historicalabundance of high-pH soils in the Pleistocene and an associated opportunity forthe evolutionary accumulation of calcicoles To obtain insights into the history ofcalcicolecalcifuge patterns we studied species richnessndashpHndashclimate relationshipsacross a climatic gradient which included cool and dry landscapes resembling thePleistocene environments of northern Eurasia
Location
Western Sayan Mountains southern Siberia
Methods
Vegetation and environmental variables were sampled at steppe forestand tundra sites varying in climate and soil pH which ranged from 37 to 86 Speciesrichness was related to pH and other variables using linear models and regression trees
Results
Species richness is higher in areas with warmer winters and at mediumaltitudes that are warmer than the mountains and wetter than the lowlands Intreeless vegetation the species richnessndashpH relationship is unimodal In tundravegetation which occurs on low-pH soils richness increases with pH but itdecreases in steppes which have high-pH soils In forests where soils are more acidicthan in the open landscape the species richnessndashpH relationship is monotonicpositive Most species occur on soils with a pH of 6ndash7
Main conclusions
Soil pH in continental southern Siberia is strongly negativelycorrelated with precipitation and species richness is determined by the oppositeeffects of these two variables Species richness increases with pH until the soil is verydry In dry soils pH is high but species richness decreases due to drought stressThus the species richnessndashpH relationship is unimodal in treeless vegetationTrees do not grow on the driest soils which results in a positive species richnessndashpHrelationship in forests If modern species richness resulted mainly from the speciespool effects it would suggest that historically common habitats had moderateprecipitation and slightly acidic to neutral soils
Keywords
Calcicolecalcifuge forest-steppe plant community Pleistocene environments
precipitation soil acidity tundra vascular plants
Correspondence Milan Chytr
y
Department of Botany and Zoology
Masaryk University Kotlaacute
r
skaacute 2
CZ-611 37 Brno Czech Republic
E-mail chytryscimunicz
1
Department of Botany and Zoology Masaryk
University Kotlaacute
reg
skaacute 2 CZ-611 37 Brno Czech
Republic
2
Institute of Botany Academy of
Sciences of the Czech Republic Po
reg
iacute
ccedil
iacute 3a
CZ-603 00 Brno Czech Republic
3
Central
Siberian Botanical Garden Russian Academy of
Sciences Zolotodolinskaya 101 Novosibirsk
630090 Russia
4
Department of Botany
Moravian Museum Hviezdoslavova 29a
CZ-627 00 Brno Czech Republic
5
Institute of
Cytology and Genetics Russian Academy of
Sciences Lavrentrsquoeva 10 Novosibirsk 630090
Russia
6
Institute of Botany Slovak Academy of
Sciences Duacutebravskaacute cesta 14 SK-845 23
Bratislava Slovakia
INTRODUCTION
The distinction between calcicole and calcifuge plant species has
been recognized since the early days of plant ecology (Gigon
1987) Many floras in the temperate and boreal zone have a
higher proportion of calcicole species ie those associated with
high pH or calcium-rich soils than of calcifuge species ie those
confined to low-pH soils (Grubb 1987 Tyler 1996 Ewald 2003)
Species richness pH and climate in southern Siberia
copy 2007 The Authors
Global Ecology and Biogeography
16
668ndash678 Journal compilation copy 2007 Blackwell Publishing Ltd
669
Paumlrtel (2002) demonstrated that at medium and higher latitudes
species richness of vascular plant communities on a local scale
(further referred to as richness) frequently increases with soil pH
He related this pattern to the species pool hypothesis (Taylor
et al
1990) suggesting that the positive richnessndashpH relationships
result from the existence of larger pools of calcicole than calcifuge
species in modern floras He hypothesized that this prevalence of
calcicoles is due to the location of most evolutionary centres for
the temperate and boreal zone in the areas with high-pH soils
Ewald (2003) extended Paumlrtelrsquos hypothesis to consider not only
species accumulation through speciation of calcicoles but also
hypothetically high extinction of calcifuges in the Pleistocene
when the climate was cold and dry and high-pH soils were
maintained over huge areas by decreased leaching of cations aeolian
sedimentation of fine calcium-rich particles and cryoturbation
(Guthrie 2001 Walker
et al
2001) The modern disparity
between the predominance of acidic soils and a considerably
larger species pool of calcicole than calcifuge species in temperate
Europe may be the result of the Pleistocene bottleneck effects on
calcicolecalcifuge species pools (Ewald 2003)
Even at medium and high latitudes however the local richnessndash
pH relationships reported in individual studies vary considerably
from negative to positive and they are often unimodal or non-
significant (Schuster amp Diekmann 2003) Interestingly positive
monotonic relationships are often found in forests while
grasslands of the same areas exhibit unimodal non-significant or
even negative relationships (Chytr
y
et al
2003 Palmer
et al
2003
Schuster amp Diekmann 2003) Besides possible confounding effects
of other environmental variables this may partly be caused by
the different width of the observation window along the pH
gradient in individual studies Plants cannot tolerate either too
low pH (due to aluminium toxicity and poor availability of
some nutrients) or too high pH (due to poor solubility of
some essential elements Tyler 2003) Therefore the richnessndashpH
relationship must be inherently unimodal increasing at low pH
and decreasing at high pH A positive linear relationship is there-
fore more frequently found in studies performed on acidic to
neutral soils and a negative one is more frequently found in
those performed on neutral to base-rich soils If the entire range
of pH values compatible with plant life is considered the appro-
priate question is therefore not whether the richnessndashpH rela-
tionship is positive or negative but whether it is left-skewed
symmetrical or right-skewed
For a better understanding of the richnessndashpH relationship it
is of key importance to study it across the full range of pH values
tolerated by plants and in areas with different evolutionary
and biogeographical histories So far such studies have been rare
being based either on the meta-analyses of local case studies
(Paumlrtel 2002 Schuster amp Diekmann 2003) or on the richness
values extracted from the large phytosociological databases
combined with indicator values used as surrogates for measured
pH (Chytr
y
et al
2003 Wohlgemuth amp Gigon 2003)
With respect to the species pool hypothesis (Paumlrtel 2002
Ewald 2003) it is of great theoretical interest to study the
speciesndashpH relationship in dry continental areas with long and
cold winters which are close modern analogies of Pleistocene
environments and on geographical transects from such areas to
regions with a more oceanic climate The modern vegetation
of temperate Europe has its historical roots in the Pleistocene
tundra steppe and forest-steppe (Berglund
et al
1996) which
has its closest modern analogy in continental southern Siberia
and northern Mongolia (Hilbig 1995) This regionrsquos climate is
locally similar to the Pleistocene climate of central Europe (Frenzel
et al
1992) and its evolutionary history is also similar as
evidenced by the geographical ranges of many plant species that
extend from central Europe to southern Siberia (Meusel
et al
1965ndash1992) In addition Last Glacial Maximum biomes recon-
structed from fossil pollen data for southern Siberia and adjacent
areas of Mongolia include steppe and forests ie the same
biomes as today (Tarasov
et al
2000) Similar biomes were
reconstructed from the full-glacial pollen data from eastern
central Europe (Willis
et al
2000 Jankovskaacute
et al
2002)
In the present study we address the species richnessndashpH rela-
tionship by analysing terrestrial vegetation along a broad-scale
geographical transect in continental southern Siberia which
covers a range of different climates and nearly the entire range of
pH values compatible with plant life Our questions are (1) what
is the richnessndashpH relationship in this landscape which in some
parts preserves conservative features of Pleistocene environments
(2) does the richnessndashpH relationship interact with other variables
in particular climatic ones and (3) does this relationship differ
between treeless and forest vegetation and if so why
MATERIALS AND METHODS
Study area
The study area is located in southern Siberia (Russia) between
the cities of Abakan and Minusinsk in the north and the Russianndash
Mongolian border in the south (50
deg
43
primeminus
53
deg
33
prime
N 91
deg
06
primeminus
93
deg
28
prime
E)
Its northern part includes the Minusinskaya Basin with flat or
gently undulating landforms on Quaternary deposits at altitudes
of 300ndash600 m The largest central part of the study area includes
the Western Sayan Mountains namely the area adjacent to the
Yenisei river valley At altitudes of 350ndash1700 m these mountains
have a rugged topography with steep slopes on metamorphic
rocks mainly base-rich chloride slates with igneous rocks and
limestones occupying small areas Ancient table-lands predominate
at high altitudes (1700ndash2860 m) Similar landforms are typical of
the Tannu-Ola range (2100ndash2930 m) in the southern part of the
study area The area between the Western Sayan and Tannu-Ola
is occupied by the Central Tuvinian Basin with flat landforms at
altitudes of 550ndash1100 m
The climate is strongly continental However the northern
front ranges of the Western Sayan which intercept humid north-
western air masses have a more humid climate in comparison
with the rest of Siberia At low to medium altitudes in the north
January temperature ranges from
minus
11 to
minus
22
deg
C July tempera-
ture from +16 to +19
deg
C and annual precipitation from 500 to
900 mm Winter snow cover is up to 15 m which protects soil
and ground vegetation from frost The Central Tuvinian Basin
and the Tannu-Ola range are in the rain shadow area and have an
M Chytr
yen
et al
copy 2007 The Authors
670
Global Ecology and Biogeography
16
668ndash678 Journal compilation copy 2007 Blackwell Publishing Ltd
arid continental climate with annual precipitation of lt 400 mm
of which 88ndash95 falls from late July to September January
temperature ranges from
minus
27 to
minus
34
deg
C July temperature from
+16 to +18
deg
C and winter snow cover is shallow and irregular in
this region (Gidrometeoizdat 1966ndash1970)
Vegetation formations include steppe on the bottoms of the
Minusinskaya and Central Tuvinian Basins forest-steppe and
forest at medium altitudes and alpine tundra above the timber-
line Forests are abundant in the wetter northern part of the
Western Sayan In contrast in the cool and dry areas adjacent to
the Central Tuvinian Basin steppe extends to higher altitudes
and tundra to lower altitudes while forest is restricted In the forest-
steppe landscapes steppe regularly occurs on south-facing
slopes and forest occurs on north-facing slopes Cold and dry
lowland steppes are characterized by
Artemisia frigida
Willd
Caragana pygmaea
(L) DC and
Stipa krylovii
Roshev and
mountain steppes in the forest-steppe zone are often dominated
by
Artemisia gmelinii
Weber
Carex pediformis
C A Mey and
Spiraea media
Schmidt Some of the mountain steppes occurring
on mesic soils form dense tall-grass species-rich stands called
meadow steppes
Alpine tundra is mostly dominated by dwarf
shrubs (
Betula rotundifolia
Spach
Vaccinium myrtillus
L and
V vitis-idaea
L) on ridges and hillsides and tall forbs on the
valley bottoms The forests of the study area can be divided into
taiga and hemiboreal forests (Ermakov
et al
2000) Taiga occurs
on moist to mesic soils and is mostly dominated by
Abies sibirica
Ledeb
Picea obovata
Ledeb and
Pinus sibirica
Du Tour It
includes
Vaccinium myrtillus
V vitis-idaea
and
Bergenia crassifolia
(L) Fritsch in the herb layer and a well-developed moss layer
Hemiboreal forests also called sub-taiga occupy mesic to dry
soils They contain many shade-intolerant herbs some of which
occur both in steppe and open forests Hemiboreal forests in the
driest and coolest areas are dominated by
Larix sibirica
Ledeb
and are termed ultracontinental forests while those in the wetter
and warmer areas are dominated by
Pinus sylvestris
L or
Betula
pendula
Roth the latter often occurring in post-fire successional
stands
Data sampling
Sampling sites were located on an approximately 300-km long
northndashsouth transect that followed the gradient of increasing
climate continentality and ran roughly perpendicular to the Western
Sayan range The transect started in the lowlands dominated by
steppe and forest-steppe vegetation in the Minusinskaya Basin
crossed the Western Sayan mountain range continued to the
Central Tuvinian Basin and ended at the Tannu-Ola range Along
this transect we sampled vegetation in the zones of steppe forest-
steppe forest and alpine tundra Sampling units were vegetation
plots of 10
times
10 m located in central parts of physiognomically
and ecologically homogeneous vegetation stands Sites affected
by recent disturbances eg early stages of post-fire succession or
human-made habitats were avoided Landscape sectors with
different macroclimates sharply separated by mountain ridges
were used as the basic sampling strata Within each stratum we
placed one plot on each of the following landforms north-facing
slope south-facing slope ridge summit and valley bottom If the
same landform in a given stratum contained vegetation types
of contrasting physiognomy or with different dominant species
(including different dominants of forest undergrowth) we
placed one plot in each of these vegetation types In total 180
plots of treeless vegetation (39 in tundra and 141 in steppe) and
127 plots of forest vegetation (77 in taiga and 50 in hemiboreal
forest) were sampled
In each plot we recorded all species of vascular plants and
measured the following variables (Table 1) (1)
Altitude
was
measured with GPS and checked in a 1100000 topographic
map (2)
Climatic variables
(July and January mean temperature
and mean sums of summer and winter precipitation) were
estimated from a climatic model prepared in the ArcGIS 82
geographical information system (httpwwwesricom) The
model was based on a combination of Russian climate station
data and altitudes from a digitized 1200000 topographic map
Temperature values for different altitudes were computed based
on the adiabatic lapse rate of 065
deg
C per 100 m of altitude
Precipitation was computed from precipitationndashaltitude charts
compiled for each of the aridityndashhumidity sectors of the Altai-
Sayan region (Polikarpov
et al
1986) (3)
Potential solar radiation
above the canopy
was calculated from slope aspect inclination
and latitude and accounted for shading by the surrounding
topographic features Topographic shading was measured from
digital hemispheric photographs taken in a vertical direction
at the height of 15 m above ground at each site Calculation
was performed using Gap Light Analyser 20 software (http
wwwremsfucaforestrydownloadsgap_light_analyzerhtm)
Radiation was estimated as the daily sum of direct and diffuse
radiation for 21 June (4)
Potential solar radiation below the
canopy
was calculated for the forest plots only It was obtained in
the same way as radiation above the canopy but it additionally
accounted for shading by canopy (5)
Slope inclination
was
measured with a clinometer (6)
Soil depth
was measured in three
places in each plot and averaged Soils deeper than 30 cm were
arbitrarily given a value of 30 cm (7)
Soil pH and conductivity of
soil solution
were measured from a mixed soil sample from three
places in each plot Samples were taken from the mineral topsoil
horizon at a depth of 5ndash10 cm or less if the soil was very shallow
Each sample was extracted in distilled water for 24 h (weight
ratio of soilwater was 04) and measured using the digital
PH114 pH-meter and CM113 conductivity meter (Snail Instru-
ments Beroun Czech Republic) Conductivity caused by H
+
ions was subtracted according to Sjoumlrs (1952)
Data analysis
All the statistical analyses were computed in the
71
program (httpwwwstatsoftcom) To simplify the complex
pattern of correlations between environmental variables the
matrix of variables
times
plots was subjected to principal com-
ponents analysis (PCA) computed on a correlation matrix in
order to remove the effect of different measurement units
Additionally least-square linear regressions were calculated for
some univariate relationships that involved pH
Species richness pH and climate in southern Siberia
copy 2007 The Authors
Global Ecology and Biogeography
16
668ndash678 Journal compilation copy 2007 Blackwell Publishing Ltd
671
In ecological data sets sampled across heterogeneous land-
scapes representation of plots with different combinations of
environmental variables is typically more or less unequal This
occurs in spite of the use of a stratified sampling scheme such as
that applied in the current study because some combinations
may be rare or non-existent in some of the studied landscapes
In traditional statistical analyses eg linear models such an
unbalanced structure of the data set can be problematic if several
explanatory variables are involved Therefore we analysed the
relationships between the response variable (species richness)
and several environmental explanatory variables with regression
trees (CART Breiman
et al
1984) This method is suitable for
exploratory analysis of complex unbalanced data sets that involve
higher-order interactions and nonlinear relationships between
predictor variables It is able to reveal ecologically meaningful
relationships that would remain hidden in such data sets if standard
techniques such as linear models were used The regression tree
is constructed by a hierarchical splitting of the data set into
smaller groups which minimizes within-group variation in the
response variable At each split sampling units are divided into
two groups based on a single explanatory variable
We applied regression tree analysis separately to the data sets
of treeless and forest vegetation and used the number of vascular
plants as the response variable To select the optimal tree size
(optimal number of branches also called nodes or splits) we
used the 10-fold cross-validation method This method calculates
regression trees on smaller subsamples of the basic data set and
provides the value of cross-validation cost for the tree of each
size ie the error in predicted values relative to the corresponding
tree calculated with the entire data set The tree with the lowest
cross-validation error is usually accepted as the optimal tree
because it maximizes the variation in the response variable
and simultaneously minimizes the risk of over-learning ie the
danger of erroneous prediction of previously unobserved cases
For selection of the optimal tree based on the cross-validation
results we followed SE Rule = 0 (Breiman
et al 1984) because
SE Rule = 1 led to very simple trees For each node of the tree
we identified not only the primary splitter variable but also
surrogates ie the variables that are able to allocate cases similarly
as the primary splitter To consider a variable as a surrogate we
required that the variable had associated value higher than 06
To assess the relative importance of each predictor variable in the
optimal tree we calculated their Importance values which are rel-
ative to the best predictor variable scored as 100 The importance
values reflect the contribution that each explanatory variable
makes in explaining the variation in the response variable with
Table 1 Descriptive statistics for variables used in the analysis
Mean
Standard
deviation Minimum
Lower
quartile
Upper
quartile Maximum
Treeless vegetation (n = 180)
Altitude (m asl) 1004 480 318 592 1461 2160
July temperature (degC) 149 31 70 140 170 190
January temperature (degC) minus280 55 minus360 minus320 minus265 minus170
Summer precipitation (mm) 475 347 170 231 559 1341
Winter precipitation (mm) 87 83 28 33 117 369
Radiation (mol mminus2 dayminus1) 380 40 260 370 400 420
Inclination (deg) 19 13 0 9 29 52
Soil depth (cm) 16 10 1 6 30 30a
Soil pH 67 11 37 63 75 86
Soil conductivity (microS cmminus1) 120 251 2 49 152 353b
Number of vascular plants 316 124 70 225 410 640
Forests (n = 127)
Altitude (m asl) 968 414 346 614 1241 1948
July temperature (degC) 139 22 90 120 160 180
January temperature (degC) minus250 55 minus370 minus290 minus200 minus170
Summer precipitation (mm) 657 267 171 425 821 1283
Winter precipitation (mm) 144 78 28 76 187 371
Radiation above canopy (mol mminus2 dminus1) 361 35 247 347 390 410
Radiation below canopy (mol mminus2 dminus1) 133 43 60 100 157 330
Inclination (deg) 21 12 0 10 29 46
Soil depth (cm) 20 10 1 10 30 30a
Soil pH 57 09 37 50 63 78
Soil conductivity (microS cmminus1) 56 45 12 29 65 290
Number of vascular plants 293 125 60 190 380 690
aSoils deeper than 30 cm were arbitrarily given a value of 30 cmbIn one plot an outlying conductivity value of 3350 microS cmminus1 was measured
M Chytryen et al
copy 2007 The Authors672 Global Ecology and Biogeography 16 668ndash678 Journal compilation copy 2007 Blackwell Publishing Ltd
its contribution stemming both from the variablersquos role as a
primary splitter of a node and its role as a surrogate to any of
the primary splitters
RESULTS
PCA revealed groups of related environmental variables (Table 2)
The main complex environmental gradient associated with PCA
axis 1 is that of decreasing precipitation and increasing soil
pH The second most important gradient (axis 2) is related to
decreasing altitude and increasing winter temperature the third
gradient (axis 3) to slope steepness and associated variables such
as soil depth and site insolation and the fourth gradient (axis 4)
to canopy closure and light availability above the herb layer An
important relationship revealed by PCA axis 1 is the strong nega-
tive correlation of pH with precipitation this trend is consistent
in both treeless vegetation and forests although the mean pH is
lower in the latter (Fig 1) Another remarkable relationship
revealed by PCA is that precipitation is not correlated with winter
temperature While winter temperature generally decreases with
increasing altitude precipitation in both winter and summer is
to a large extent determined by the position on the windward or
leeward side of the main mountain ranges although at local scale
it also tends to increase with altitude
Univariate regressions of species richness on pH revealed a
positive relationship for both treeless and forest vegetation
(Table 3) In the treeless vegetation pH explained only 25 of
variation in species richness in linear regression but after adding
the quadratic term the variation explained increased to 170
indicating unimodal richnessndashpH relationship with a peak at pH
64 In tundra vegetation which occurred in the pH range of
38ndash61 (minus74) there was a positive linear relationship between
richness and pH that explained 130 of variation (Fig 2a)
However in steppe vegetation which occurred in the pH range
of 59ndash81 (minus86) the linear relationship was negative In forests
variation explained by the linear regression was considerably
higher than in treeless vegetation (258) but it was improved
only to 281 after adding the quadratic term (although the
quadratic model improved the model significantly P lt 005)
The curve of the quadratic relationship was upward convex with
an indistinct peak occurring at pH 72 which did not provide
reliable support for the existence of the unimodal richnessndashpH
Table 2 Coordinates of environmental variables on axes 1ndash4 of the PCA calculated from a matrix of vegetation plots times environmental variables As PCA was based on the correlation matrix the coordinates are identical with the correlations between PCA axes and environmental variables Coordinates ge |060| are set in bold
PCA axis 1 2 3 4
Percentage variation explained 345 188 154 99
Altitude minus049 minus080 011 minus001
July temperature 078 052 minus013 006
January temperature minus013 087 minus039 minus014
Summer precipitation minus090 018 minus010 minus027
Winter precipitation minus088 024 minus018 minus025
Radiation above canopy 030 minus027 minus063 minus049
Radiation below canopy 059 minus028 minus001 minus060
Slope inclination minus009 038 077 minus006
Soil depth 013 minus013 minus062 052
Soil pH 088 minus002 015 minus004
Soil conductivity 031 006 022 minus023
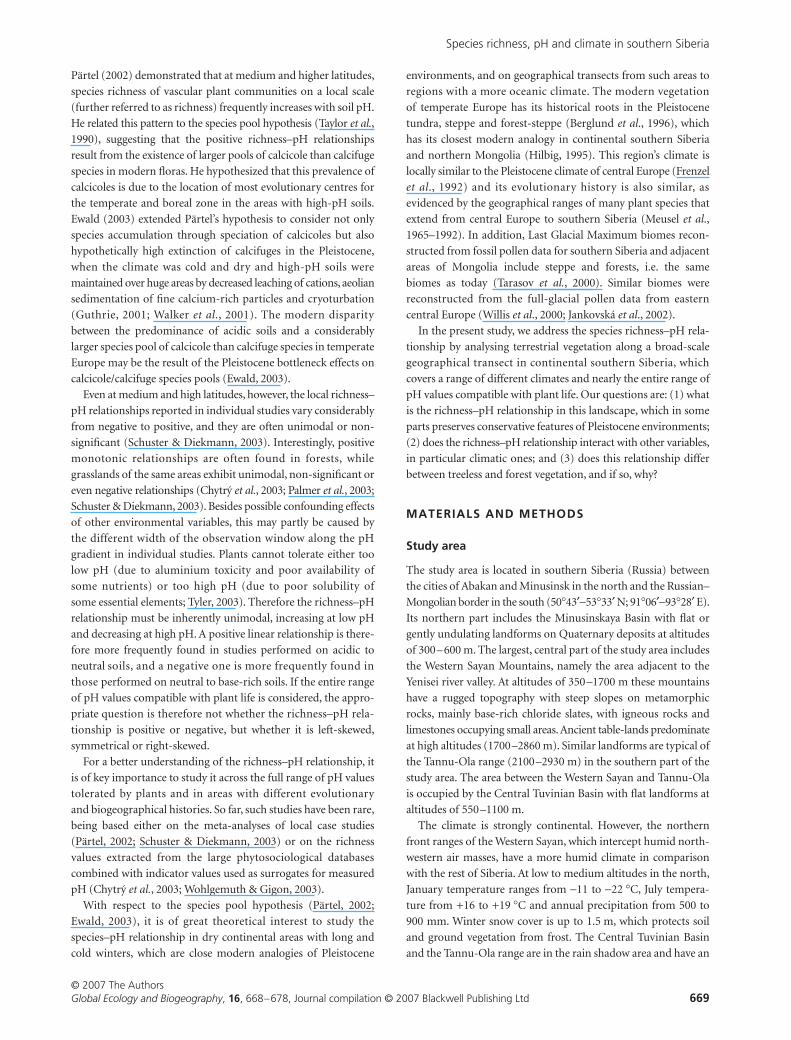
Figure 1 The relationship between pH and summer precipitation in the study area Precipitation values were predicted by the climatic model and soil pH(H20) was measured in vegetation plots Treeless vegetation = 0633 forests = 0325 The slopes of the two regression lines are significant (P lt 0001) but do not differ significantly from each other at P lt 005 The difference in intercept between them is significant (P lt 0001) Values of pH also decrease significantly with winter precipitation at P lt 0001 (not shown treeless vegetation
= 0594 forests = 0332)
Radj2 Radj
2
Radj2 Radj
2
Species richness pH and climate in southern Siberia
copy 2007 The Authors Global Ecology and Biogeography 16 668ndash678 Journal compilation copy 2007 Blackwell Publishing Ltd 673
relationship in forests After splitting the forest data set into
taiga and hemiboreal forests (Fig 2b) a positive relationship
only remained in the more acidic taiga (pH 37ndash69) while no
relationship was detected in the base-rich hemiboreal forests
(pH 52ndash78)
Regression trees were constructed separately for treeless and
forest vegetation In both of them January temperature altitude
and pH were the most important predictors of species richness
(Table 4) For treeless vegetation the optimal regression tree with
the lowest cross-validation cost had seven terminal nodes (Fig 3)
This tree explained 561 of variation in species richness In the
first node the tree split based on mean January temperature
predicting lower species numbers in areas with January means
below minus21 degC and at altitudes above 532 m In low-altitude areas
with warmer winters species richness increased with altitude ie
with precipitation The highest richness was found at altitudes
slightly above 500 m and summer precipitation above 479 mm
Table 3 Standardized regression coefficients (beta) variation explained ( ) and significances (P) of the linear and quadratic regression models of the relationship between species richness and pH for different subsets of vegetation plots Quadratic regressions were not considered for tundra steppe taiga and hemiboreal forests
beta-pH beta-(pH)2 P
Treeless vegetation
both types linear regression 017 mdash 0025 0025
both types quadratic regression 394 minus380 0170 lt 0001
tundra 036 mdash 0130 0022
steppe minus031 mdash 0091 lt 0001
Forests
both types linear regression 052 mdash 0258 lt 0001
both types quadratic regression 236 minus185 0281 lt 0001
taiga 044 mdash 0170 lt 0001
hemiboreal forests 009 mdash 00 0525
Radj
2
Radj
2
Figure 3 Regression tree for species richness of treeless vegetation Numbers at each node indicate the mean number of vascular plant species per 100 m2 plusmn standard deviation and number of plots assigned to that node The primary splitter variable and its split value at each node is given in bold Surrogates ie variables that allocate most cases to the identical group as the primary splitter are given in smaller letters below the primary splitter
Figure 2 Relationships between number of vascular plant species per 100 m2 and pH See Table 3 for regression coefficients The slope of the regression line was not significant for hemiboreal forests therefore the line was not fitted
M Chytryen et al
copy 2007 The Authors674 Global Ecology and Biogeography 16 668ndash678 Journal compilation copy 2007 Blackwell Publishing Ltd
grassland vegetation occurring there included mostly tall-grass
meadow steppes containing on average over 50 species per 100
m2 In the branch of the tree with low January temperatures
the most important predictor of species richness was pH It
discriminated between very poor tundra vegetation on soils with
pH lt 50 and richer vegetation of both tundra and steppe on
more base-rich soils In the latter the poorest vegetation was the
cold short-grass steppe on the flat bottoms of large basins while
mountain steppe and tundra vegetation was richer The latter
types of mountain grasslands were poorer at medium altitudes
(594ndash832 m) where forest forms the landscape matrix and treeless
vegetation mostly occurs in smaller patches surrounded by forest
The optimal regression tree for forest vegetation had only
three terminal nodes (Fig 4) First it separated species-poor dark
taiga forests on acidic soils with pH lt 50 from richer forests on
more base-rich soils Low pH was weakly related to higher summer
precipitation The group of species-richer forests on high-pH
soils was further divided into two subgroups The poorer sub-
group at altitudes above 882 m with low winter temperatures
and low summer precipitation contained ultracontinental
forests of L sibirica and P sibirica The richer subgroup at lower
altitudes with warmer winters and higher summer rainfall
included hemiboreal forests and wet Abies sibirica taiga this
subgroup included the richest forests of the Western Sayan
containing on average 37 species per 100 m2 This regression tree
explained 412 of variation in species richness For com-
parison we fitted a multiple least-square regression model with
the two predictors used as primary splitters in this tree pH and
altitude This model explained only 380 of variation
Higher mean local species richness in steppe and hemiboreal
forests than in tundra and taiga revealed by the regression trees
corresponded to the relative size of species pools for these forma-
tions The relative size of the species pools was estimated as the total
number of all species occurring in 39 plots selected randomly
from each of these formations These relative estimations yielded
305 species for steppe 223 for tundra 303 for hemiboreal forests
and 212 for taiga (means of 10 random selections)
DISCUSSION
The relationship between pH precipitation and species richness
The study area contains bedrocks of varying base status and soils
of different type and depth Yet soil pH was shown to depend
predominantly on precipitation summer precipitation explained
633 of variation in soil pH in sites with treeless vegetation (Fig 1)
Such an amount of variation explicable by a single predictor
variable is surprisingly large given that the precipitation model
used included inaccuracies due to a sparse network of climate
stations In addition the moisture status of particular sites
depends not only on precipitation but also on the topographic
position on the valley bottom or the ridge slope aspect inclination
and soil properties The strong pHndashprecipitation relationship
suggests that on the transition between arid continental and
more humid landscapes the intensity of leaching of basic cations
from soils is crucial for maintaining high or low pH
In forests mean pH was significantly lower than in treeless
vegetation (Fig 1) This partly reflects the fact that in forest-
Treeless vegetation Forests
Variable
Relative
importance Variable
Relative
importance
January temperature 100 Altitude 100
Altitude 821 January temperature 976
Soil pH 723 Soil pH 949
Winter precipitation 618 July temperature 777
Slope inclination 593 Soil conductivity 771
Summer precipitation 569 Summer precipitation 617
Soil conductivity 488 Winter precipitation 462
July temperature 447 Soil depth 196
Soil depth 297 Slope inclination 170
Radiation 160 Radiation above canopy 155
Radiation below canopy 142
Table 4 Ranked values of the relative importance of explanatory variables of the optimal regression trees for treeless and forest vegetation The values reflect the contribution each explanatory variable makes in explaining the variation in species richness with its contribution stemming both from the variablersquos role as a primary splitter of a node and its role as a surrogate to any of the primary splitters The variable with the highest relative importance is scored as 100 in each regression tree
Figure 4 Regression tree for species richness of forests See Fig 3 for a detailed explanation At the first node the best surrogate summer precipitation had only 30 similarity to the primary splitter
Species richness pH and climate in southern Siberia
copy 2007 The Authors Global Ecology and Biogeography 16 668ndash678 Journal compilation copy 2007 Blackwell Publishing Ltd 675
steppe landscapes forest grows in moister places with a higher
intensity of leaching than steppe vegetation However as forest
soils are more acidic than non-forest soils in the precipitation-
rich areas as well more intensive acidification processes probably
occur in forest soils These may result from (1) higher moisture
status and more intensive soil leaching under the forest canopy
which decreases evaporation (2) larger uptake of bases and their
replacement by H+ cations in the more productive forest vegeta-
tion (3) higher abundance of mosses contributing to acidifica-
tion (Vitt 2000) or (4) inputs of organic acids from conifer litter
(Ovington 1953 Finzi et al 1998) A much lower variation in
pH explained by summer precipitation for forest sites (332)
than for treeless sites (633) is another indication of a stronger
effect of vegetation on soil pH in forests than in open landscape
In both treeless and forest vegetation the best correlates of
species richness were January temperature pH and altitude (Figs 3
and 4 Table 4) Climatic variables such as summer temperatures
and precipitation were correlated with them (Table 2) Other
measured variables were either correlated with these variables or
weakly related to the species richness pattern (Tables 2 amp 4) This
corresponds to the alpine vegetation of the Alps where species
richness is mainly determined by the joint effects of temperature
and pH while other variables are less important (Vonlanthen
et al 2006) In the continental climate of the study area with its
very cold winters frost can be an important ecological factor
limiting plant life especially in combination with low winter
precipitation and shallow or discontinuous snow cover Actually
areas with the strongest winter frosts had the species-poorest
vegetation Both treeless and forest vegetation were consistently
poorer on soils with pH lt 50 which corresponds to the value
where toxic Al3+ cations start to solubilize (Tyler 1996) The
relationship between richness and altitude was more complex in
the study area reflecting interactions between climatic variables
At high altitudes richness was lower due to low winter tempera-
tures irrespective of the amount of precipitation whereas at
lower altitudes richness increased with precipitation
The most species-rich treeless vegetation corresponded to
tall-grass meadow steppe occurring at altitudes slightly above
500 m which still have comparatively warm winters but higher
precipitation than dry lowlands The poorest treeless vegetation
was tundra occurring in areas with pronounced winter frosts and
high precipitation which causes soil leaching and acidification
The richest forest vegetation occurred in areas where precipita-
tion was not too high to cause pronounced soil leaching and not
too low to exclude mesic forest species Such habitats supported
either Pinus sylvestris hemiboreal forest or Abies sibirica wet taiga
on footslopes and valley bottoms The poorest forest was dark
taiga with Pinus sibirica Abies sibirica or Picea obovata occurring
on low-pH soils in precipitation-rich areas
Unimodal pHndashrichness relationship in treeless vegetation
A positive richnessndashpH relationship has been more frequently
reported from the temperate boreal and arctic zones than has a
negative one (Paumlrtel 2002) In more detail the sign and shape of
this relationship depends on vegetation types (Chytry et al
2003 Schuster amp Diekmann 2003) The relationship tends to
be positive in vegetation types that grow predominantly on
acidic to neutral soils eg in forests and tundra In contrast
treeless vegetation on neutral to base-rich soils tends to have a
non-significant or negative richnessndashpH relationship
Our study provides a finer and more complete picture than
most others because it covers nearly the whole range of soil pH
compatible with plant life The existence of upper and lower
physiological limits to plant growth on the pH gradient implies
that the relationship is inherently unimodal This is reported by
some studies covering broad ranges of pH values especially
in grasslands (eg Tyler 2000 Loumlbel et al 2006) and mires (eg
Glaser et al 1990) We found a pronounced unimodal richnessndash
pH relationship in treeless vegetation but not in forests
Within treeless vegetation tundra occurred on low-pH soils
in precipitation-rich areas and steppe on high-pH soils in
precipitation-poor areas After splitting these two vegetation
types the former showed a positive linear relationship to soil pH
and the latter showed a negative linear relationship The positive
relationship in the southern Siberian alpine tundra is consistent
with a number of earlier studies from the arctic tundra where
increasing pH was identified as one of the major factors enhancing
species richness (Gough et al 2000 Walker et al 2001 van der
Welle et al 2003) In contrast steppe vegetation which occurred
on soils with pH 59ndash86 exhibited a weak yet significant negative
linear relationship between richness and pH This relationship
appears to be consistent with earlier studies from North
American prairies (Palmer et al 2003) Our data suggest that the
decreasing species richness of steppe vegetation on high-pH soils
could be caused by climatic stress instead of or in addition to the
physiological effect of high pH The highest pH values are found
in the driest soils with strongly limited or no cation leaching
(Fig 1) However these habitats experience not only pronounced
summer droughts but also strong winter frosts without protective
snow cover As most species of the study area are not adapted to
such harsh conditions the negative richnessndashpH correlation
appears The richest vegetation occurs where soil is not too dry
and not too acidic at the same time Our data suggest that for the
treeless vegetation of the study area it is at pH 6ndash7
The putative role of drought stress in limiting species richness
on high-pH soils is supported by the comparison with richnessndash
pH relationships reported for wetlands and mires In these
habitats high pH is usually due to cation saturation from
mineral springs and it is not associated with drought stress
In such environments species richness often increases up to pH
7 or even beyond (Glaser et al 1990 Haacutejkovaacute amp Haacutejek 2003
Guumlsewell et al 2005) However no base-rich wetlands or mires
were included in the current study because they are very rare in
the study area
Positive pHndashrichness relationship in forests
Unlike in treeless vegetation the richnessndashpH relationship in forests
is mostly reported as monotonic positive (Dupreacute et al 2002
Schuster amp Diekmann 2003) while unimodal relationships
M Chytryen et al
copy 2007 The Authors676 Global Ecology and Biogeography 16 668ndash678 Journal compilation copy 2007 Blackwell Publishing Ltd
are rare and negative relationships are exceptional The latter are
usually attributed to the confounding effects of factors other
than pH (Dupreacute et al 2002) Species richness in forests usually
increases steeply in acidic soils but the curve becomes less steep
above pH 55 and often levels off at a pH value close to 70 A
positive relationship is documented both from deciduous forests
of Europe (eg Brunet et al 1997 Dumortier et al 2002 Chytryet al 2003 Wohlgemuth amp Gigon 2003 Coudun amp Geacutegout
2005 Schuster amp Diekmann 2005) and North America (eg Peet
amp Christensen 1980 Brosofske et al 2001 Peet et al 2003) and
from coniferous forests in both continents (Rey Benayas 1995
Brosofske et al 2001 Zinko et al 2006) Palmer et al (2003)
pointed to the contrasting pHndashrichness relationships in Oklahoma
forests and prairies positive in the former and negative in the
latter The same pattern based on entirely different species pools
was found in forests and steppes in our study area (Fig 2)
We hypothesize that the predominance of the positive richnessndash
pH relationship in forests mainly results from the truncated pH
gradient at its base-rich end (Fig 5) There are two reasons for
this truncation First forest cannot grow at extremely dry sites
that only support grassland but these sites tend to have the
highest pH at least in the semi-arid areas such as forest-steppe
Second productive vegetation with trees tends to decrease soil
pH (Fig 1 Tyler 2003) Truncation of the pH gradient in forests
is also apparent in the meta-analysis of German case studies
(Schuster amp Diekmann 2003) where grasslands were often
recorded on soils with pH 7ndash8 but very few studies reported
forests on soils with pH gt 7 Because the truncation removes
habitats where species pool sizes have already started to decrease
due to drought stress most richnessndashpH relationships reported
in the literature from forests are monotonic positive Besides this
main explanation we suggest two other mechanisms that can
explain why the richnessndashpH curve of forest vegetation does not
usually decrease at high-pH conditions (Fig 5) First the species
richness of forests on soils with pH values of about 7 can be
partly increased by the mass effect at the forest-steppe ecotone
Forests on such soils which are usually rather dry contain
several species typical of adjacent dry grasslands These light-
demanding species find a suitable habitat under the open canopy
formed by pine or larch In contrast no such mass effect can
enhance the species richness of grasslands at pH 75ndash85 because
there are no sufficiently large species pools of other vegetation
types available for this pH range in the study area Second in dry
areas such as the forest-steppe zone the forest canopy maintains
higher air humidity in the understorey than in treeless habitats
(Moore et al 2000) Therefore forest richness may not be so
much limited by drought stress as is steppe richness on soils with
pH values of about 70ndash75
Species pools and the Pleistocene bottleneck
The species pool hypothesis predicts that the species richness of
particular habitats is correlated with the historical habitat com-
monness and associated opportunities for species accumulation
over evolutionary time (ie speciation minus extinction Aarssen
amp Schamp 2002) Over most of todayrsquos temperate zone of Eurasia
the Pleistocene climate was not only cool but was also dry (Frenzel
et al 1992) Such a climate supported the development of dry
calcium-rich soils over vast areas of cold steppe the habitat of
large Pleistocene herbivores (Guthrie 2001 Walker et al 2001)
Patches of coniferous forests also occurred in some areas mainly
in the mountains and wet lowland sites they have been recon-
structed from the full-glacial fossil data both from the Russianndash
Mongolian border area (Tarasov et al 2000) and from central
Europe (Willis et al 2000 Jankovskaacute et al 2002) Tundra was
confined to places with higher precipitation or lower evapotran-
spiration eg in the mountains or at non-glaciated higher latitudes
often in the close vicinity of steppe (Tarasov et al 2000)
The present-day landscape in some parts of southern Siberia
and Mongolia is probably the closest modern analogy to the
Pleistocene environments that existed in the non-glaciated part
of northern Eurasia It has to be pointed out that modern
analogies are never perfect Predictions based on analogies must
not be taken too seriously until there is independent and reliable
fossil evidence However if modern analogies exist they may
Figure 5 Conceptual model of species richness in treeless vegetation and forests across the combined gradient of decreasing precipitation and increasing pH On low-pH soils in precipitation-rich areas pools of species adapted to toxic effects of Al3+ and H+ ions are limited and species richness is low With decreasing precipitation and increasing pH richness first increases but subsequently decreases because of a limited pool of species adapted to very dry conditions In contrast forest richness does not decrease or decreases only slightly in precipitation-poor areas for the following reasons (1) forests do not occur in the driest areas so the extreme end of the precipitationndashpH gradient is truncated (2) forests occurring on their ecological limit have an open canopy and their herb layer is saturated by steppe species pools and (3) the protective effect of forest canopy maintains higher air humidity and reduces drought stress
Species richness pH and climate in southern Siberia
copy 2007 The Authors Global Ecology and Biogeography 16 668ndash678 Journal compilation copy 2007 Blackwell Publishing Ltd 677
provide valuable insights and enhance our understanding of
ecological patterns and processes in the past environments
The current study included vegetation types with the same
leading species as reconstructed from the full-glacial central
Europe (Willis et al 2000 Jankovskaacute et al 2002) and parts of
the study area had a climate corresponding to the cool periods
of the Pleistocene (Frenzel et al 1992) In southern Siberia the
richest vegetation is found on soils with a pH of 6ndash7 (Fig 2)
which are associated with moderate precipitation (Fig 1) If the
modern species richness of different habitats resulted from
speciation and extinction in the historically prevailing environ-
ments (species pool effects Aarssen amp Schamp 2002 Paumlrtel
2002 Ewald 2003) this pattern would suggest that such slightly
acidic to neutral soils were common in the pre-Holocene
environments of temperate Eurasia In contrast very dry calcium-
rich steppe or wet acidic tundra probably never supported
species-rich vegetation
Increasing precipitation in the Holocene especially in
areas with an oceanic climate caused large-scale soil acidification
(Roberts 1998) The species-pool hypothesis predicts that todayrsquos
acidic soils although prevailing in large areas are poor in species
because of the lack of calcifuge species which may have become
largely extinct during the Pleistocene (Ewald 2003) Such acidified
habitats are represented in the wetter parts of the study area by
taiga forests (in warmer climate) or by tundra (in cooler climate)
Both of these habitats are generally species poor but exhibit
positive richnessndashpH relationships for which the species pool
hypothesis provides a plausible explanation
ACKNOWLEDGEMENTS
We thank the local staff of our expeditions for their extensive
support during the fieldwork and two anonymous referees
for useful comments on the previous version of this paper
This research was supported from projects IAA6163303 from
the Grant Agency of the Academy of Sciences of the Czech
Republic and long-term research plans MSM0021622416 and
AVOZ60050516
REFERENCES
Aarssen LW amp Schamp BS (2002) Predicting distributions of
species richness and species sizes in regional floras applying the
species pool hypothesis to the habitat templet model Perspec-
tives in Plant Ecology Evolution and Systematics 5 3ndash12
Berglund BE Birks HJB Ralska-Jasiewiczowa M amp
Wright HE (1996) Palaeoecological events during the last
15000 years John Wiley amp Sons Chichester
Breiman L Friedman JH Olshen RA amp Stone CG (1984)
Classification and regression trees Wadsworth International
Group Belmont CA
Brosofske KD Chen J amp Crow TR (2001) Understory vegeta-
tion and site factors implications for a managed Wisconsin
landscape Forest Ecology and Management 146 75ndash87
Brunet J Falkengren-Grerup U Ruumlhling A amp Tyler G (1997)
Regional differences in floristic change in South Swedish oak
forests as related to soil chemistry and land use Journal of
Vegetation Science 8 329ndash336
Chytry M Tichy L amp Roleccedilek J (2003) Local and regional pat-
terns of species richness in Central European vegetation types
along the pHcalcium gradient Folia Geobotanica 38 429ndash
442
Coudun C amp Geacutegout J-C (2005) Ecological behaviour of
herbaceous forest species along a pH gradient a comparison
between oceanic and semicontinental regions in northern
France Global Ecology and Biogeography 14 263ndash270
Dumortier M Butaye J Jacquemyn H Van Camp N Lust N
amp Hermy M (2002) Predicting vascular plant species richness
of fragmented forests in agricultural landscapes in central
Belgium Forest Ecology and Management 158 85ndash102
Dupreacute C Wessberg C amp Diekmann M (2002) Species richness
in deciduous forests Effects of species pools and environmental
variables Journal of Vegetation Science 13 505ndash516
Ermakov N Dring J amp Rodwell J (2000) Classification of con-
tinental hemiboreal forests of North Asia Braun-Blanquetia
28 1ndash131
Ewald J (2003) The calcareous riddle why are there so many
calciphilous species in the Central European flora Folia
Geobotanica 38 357ndash366
Finzi AC Canham CD amp van Breemen N (1998) Canopy
treendashsoil interactions within temperate forests species effects
on pH and cations Ecological Applications 8 447ndash454
Frenzel B Peacutecsi M amp Velichko AA (eds) (1992) Atlas of
paleoclimates and paleoenvironments of the Northern
Hemisphere Geographical Research Institute Budapest amp
Gustav Fischer Verlag Stuttgart
Gidrometeoizdat (1966ndash1970) Spravochnik po klimatu SSSR
[Reference books on the climate of the USSR] Gidrometeoizdat
Leningrad
Gigon A (1987) A hierarchic approach in causal ecosystem
analysis the calcifuge-calcicole problem in alpine grasslands
Ecological Studies 61 228ndash244
Glaser PH Janssens JA amp Siegel DI (1990) The response of
vegetation to chemical and hydrological gradients in the Lost
River peatland northern Minnesota Journal of Ecology 78
1021ndash1048
Gough L Shaver GR Carroll J Royer DL amp Laundre JA
(2000) Vascular plant species richness in Alaskan arctic tundra
the importance of soil pH Journal of Ecology 88 54ndash66
Grubb PJ (1987) Global trends in species-richness in terrestrial
vegetation a view from the northern hemisphere Organiza-
tion of communities past and present (ed by JHR Gee and PS
Giller) pp 99ndash118 Blackwell Science Oxford
Guumlsewell S Bailey KM Roem WJ amp Bedford BL (2005)
Nutrient limitation and botanical diversity in wetlands can
fertilisation raise species richness Oikos 109 71ndash80
Guthrie RD (2001) Origin and causes of the mammoth steppe
a story of cloud cover woolly mammal tooth pits buckles
and inside-out Beringia Quaternary Science Reviews 20 549ndash
574
Haacutejkovaacute P amp Haacutejek M (2003) Species richness and above-
ground biomass of poor and calcareous spring fens in the
M Chytryen et al
copy 2007 The Authors678 Global Ecology and Biogeography 16 668ndash678 Journal compilation copy 2007 Blackwell Publishing Ltd
flysch West Carpathians and their relationships to water and
soil chemistry Preslia 75 271ndash287
Hilbig W (1995) The vegetation of Mongolia SPB Academic
Publishing Amsterdam
Jankovskaacute V Chromy P amp Niznianskaacute M (2002) Iacuteafaacuterka mdash
first palaeobotanical data of the character of Last Glacial
vegetation and landscape in the West Carpathians (Slovakia)
Acta Palaeobotanica 42 39ndash50
Loumlbel S Dengler J amp Hobohm C (2006) Species richness of
vascular plants bryophytes and lichens in dry grasslands the
effects of environment landscape structure and competition
Folia Geobotanica 41 377ndash393
Meusel H Jaumlger EJ Weinert E amp Rauschert S (1965ndash1992)
Vergleichende Chorologie der zentraleuropaumlischen Flora IndashIII
Gustav Fischer Verlag Jena
Moore KE Fitzjarrald DR Sakai RK amp Freedman JM
(2000) Growing season water balance at a boreal jack pine
forest Water Resources Research 36 483ndash493
Ovington JD (1953) Studies of the development of woodland
conditions under different trees I Soil pH Journal of Ecology
4113ndash52
Palmer MW Areacutevalo JR del Carmen Cobo M amp Earls PG
(2003) Species richness and soil reaction in a northeastern
Oklahoma landscape Folia Geobotanica 38 381ndash389
Paumlrtel M (2002) Local plant diversity patterns and evolutionary
history at the regional scale Ecology 83 2361ndash2366
Peet RK amp Christensen NL (1980) Hardwood forest vegeta-
tion of the North Carolina piedmont Veroumlffentlichungen des
Geobotanischen Institutes ETH Stiftung Ruumlbel Zuumlrich 69 14ndash
39
Peet RK Fridley JD amp Gramling JM (2003) Variation in
species richness and species pool size across a pH gradient
in forests of the southern Blue Ridge Mountains Folia
Geobotanica 38 391ndash401
Polikarpov NP Chebakova NM amp Nazimova DI (1986)
Klimat i gornye lesa Sibiri [Climate and mountain forests of
Siberia] Nauka Novosibirsk
Rey Benayas JM (1995) Patterns of diversity in the strata of
boreal montane forest in British Columbia Journal of Vegeta-
tion Science 6 95ndash98
Roberts N (1998) The Holocene an environmental history 2nd
edn Blackwell Science Oxford
Schuster B amp Diekmann M (2003) Changes in species density
along the soil pH gradient mdash evidence from German plant
communities Folia Geobotanica 38 367ndash379
Schuster B amp Diekmann M (2005) Species richness and
environmental correlates in deciduous forests of Northwest
Germany Forest Ecology and Management 206 197ndash205
Sjoumlrs H (1952) On the relation between vegetation and electrolytes
in north Swedish mire waters Oikos 2 241ndash258
Tarasov PE Volkova VS Webb T III Guiot J Andreev AA
Bezusko LG Bezusko TV Bykova GV Dorofeyuk NI
Kvavadze EV Osipova IM Panova NK amp Sevastyanov DV
(2000) Last glacial maximum biomes reconstructed from
pollen and plant macrofossil data from northern Eurasia
Journal of Biogeography 27 609ndash620
Taylor DR Aarssen LW amp Loehle C (1990) On the relationship
between rK selection and environmental carrying capacity
a new habitat templet for plant life history strategies Oikos 58
239ndash250
Tyler G (1996) Soil chemistry and plant distributions in rock
habitats of southern Sweden Nordic Journal of Botany 16
609ndash635
Tyler G (2000) Integrated analysis of conditions accounting
for intersite distribution of grassland plants Nordic Journal of
Botany 20 485ndash500
Tyler G (2003) Some ecophysiological and historical approaches
to species richness and calcicolecalcifuge behaviour mdash
contribution to a debate Folia Geobotanica 38 419ndash428
van der Welle MEW Vermeulen PJ Shaver GR amp Berendse F
(2003) Factors determining plant species richness in Alaskan
arctic tundra Journal of Vegetation Science 14 711ndash720
Vitt DH (2000) Peatlands ecosystems dominated by bryophytes
Bryophyte biology (ed by AJ Shaw and B Goffinet) pp 312ndash
343 Cambridge University Press Cambridge
Vonlanthen CM Kammer PM Eugster W Buumlhler A amp
Veit H (2006) Alpine vascular plant species richness the
importance of daily maximum temperature and pH Plant
Ecology 184 13ndash25
Walker DA Bockheim JG Chapin FS III Eugster W
Nelson FE amp Ping CL (2001) Calcium-rich tundra wildlife
and the lsquoMammoth Steppersquo Quaternary Science Reviews 20
149ndash163
Willis KJ Rudner E amp Suumlmegi P (2000) The full-glacial forests
of central and southeastern Europe Quaternary Research 53
203ndash213
Wohlgemuth T amp Gigon A (2003) Calcicole plant diversity in
Switzerland may reflect a variety of habitat templets Folia
Geobotanica 38 443ndash452
Zinko U Dynesius M Nilsson C amp Seibert J (2006) The role
of soil pH in linking groundwater flow and plant species
density in boreal forest landscapes Ecography 29 515ndash524
Editor Martin Sykes
BIOSKETCH
Milan Chytry is an associate professor of botany in the
Department of Botany and Zoology Masaryk University
Brno Czech Republic His research as well as research
by the co-authors is focused on vegetation ecology and
large-scale diversity patterns of multi-species assemblages
of vascular plants
Species richness pH and climate in southern Siberia
copy 2007 The Authors
Global Ecology and Biogeography
16
668ndash678 Journal compilation copy 2007 Blackwell Publishing Ltd
669
Paumlrtel (2002) demonstrated that at medium and higher latitudes
species richness of vascular plant communities on a local scale
(further referred to as richness) frequently increases with soil pH
He related this pattern to the species pool hypothesis (Taylor
et al
1990) suggesting that the positive richnessndashpH relationships
result from the existence of larger pools of calcicole than calcifuge
species in modern floras He hypothesized that this prevalence of
calcicoles is due to the location of most evolutionary centres for
the temperate and boreal zone in the areas with high-pH soils
Ewald (2003) extended Paumlrtelrsquos hypothesis to consider not only
species accumulation through speciation of calcicoles but also
hypothetically high extinction of calcifuges in the Pleistocene
when the climate was cold and dry and high-pH soils were
maintained over huge areas by decreased leaching of cations aeolian
sedimentation of fine calcium-rich particles and cryoturbation
(Guthrie 2001 Walker
et al
2001) The modern disparity
between the predominance of acidic soils and a considerably
larger species pool of calcicole than calcifuge species in temperate
Europe may be the result of the Pleistocene bottleneck effects on
calcicolecalcifuge species pools (Ewald 2003)
Even at medium and high latitudes however the local richnessndash
pH relationships reported in individual studies vary considerably
from negative to positive and they are often unimodal or non-
significant (Schuster amp Diekmann 2003) Interestingly positive
monotonic relationships are often found in forests while
grasslands of the same areas exhibit unimodal non-significant or
even negative relationships (Chytr
y
et al
2003 Palmer
et al
2003
Schuster amp Diekmann 2003) Besides possible confounding effects
of other environmental variables this may partly be caused by
the different width of the observation window along the pH
gradient in individual studies Plants cannot tolerate either too
low pH (due to aluminium toxicity and poor availability of
some nutrients) or too high pH (due to poor solubility of
some essential elements Tyler 2003) Therefore the richnessndashpH
relationship must be inherently unimodal increasing at low pH
and decreasing at high pH A positive linear relationship is there-
fore more frequently found in studies performed on acidic to
neutral soils and a negative one is more frequently found in
those performed on neutral to base-rich soils If the entire range
of pH values compatible with plant life is considered the appro-
priate question is therefore not whether the richnessndashpH rela-
tionship is positive or negative but whether it is left-skewed
symmetrical or right-skewed
For a better understanding of the richnessndashpH relationship it
is of key importance to study it across the full range of pH values
tolerated by plants and in areas with different evolutionary
and biogeographical histories So far such studies have been rare
being based either on the meta-analyses of local case studies
(Paumlrtel 2002 Schuster amp Diekmann 2003) or on the richness
values extracted from the large phytosociological databases
combined with indicator values used as surrogates for measured
pH (Chytr
y
et al
2003 Wohlgemuth amp Gigon 2003)
With respect to the species pool hypothesis (Paumlrtel 2002
Ewald 2003) it is of great theoretical interest to study the
speciesndashpH relationship in dry continental areas with long and
cold winters which are close modern analogies of Pleistocene
environments and on geographical transects from such areas to
regions with a more oceanic climate The modern vegetation
of temperate Europe has its historical roots in the Pleistocene
tundra steppe and forest-steppe (Berglund
et al
1996) which
has its closest modern analogy in continental southern Siberia
and northern Mongolia (Hilbig 1995) This regionrsquos climate is
locally similar to the Pleistocene climate of central Europe (Frenzel
et al
1992) and its evolutionary history is also similar as
evidenced by the geographical ranges of many plant species that
extend from central Europe to southern Siberia (Meusel
et al
1965ndash1992) In addition Last Glacial Maximum biomes recon-
structed from fossil pollen data for southern Siberia and adjacent
areas of Mongolia include steppe and forests ie the same
biomes as today (Tarasov
et al
2000) Similar biomes were
reconstructed from the full-glacial pollen data from eastern
central Europe (Willis
et al
2000 Jankovskaacute
et al
2002)
In the present study we address the species richnessndashpH rela-
tionship by analysing terrestrial vegetation along a broad-scale
geographical transect in continental southern Siberia which
covers a range of different climates and nearly the entire range of
pH values compatible with plant life Our questions are (1) what
is the richnessndashpH relationship in this landscape which in some
parts preserves conservative features of Pleistocene environments
(2) does the richnessndashpH relationship interact with other variables
in particular climatic ones and (3) does this relationship differ
between treeless and forest vegetation and if so why
MATERIALS AND METHODS
Study area
The study area is located in southern Siberia (Russia) between
the cities of Abakan and Minusinsk in the north and the Russianndash
Mongolian border in the south (50
deg
43
primeminus
53
deg
33
prime
N 91
deg
06
primeminus
93
deg
28
prime
E)
Its northern part includes the Minusinskaya Basin with flat or
gently undulating landforms on Quaternary deposits at altitudes
of 300ndash600 m The largest central part of the study area includes
the Western Sayan Mountains namely the area adjacent to the
Yenisei river valley At altitudes of 350ndash1700 m these mountains
have a rugged topography with steep slopes on metamorphic
rocks mainly base-rich chloride slates with igneous rocks and
limestones occupying small areas Ancient table-lands predominate
at high altitudes (1700ndash2860 m) Similar landforms are typical of
the Tannu-Ola range (2100ndash2930 m) in the southern part of the
study area The area between the Western Sayan and Tannu-Ola
is occupied by the Central Tuvinian Basin with flat landforms at
altitudes of 550ndash1100 m
The climate is strongly continental However the northern
front ranges of the Western Sayan which intercept humid north-
western air masses have a more humid climate in comparison
with the rest of Siberia At low to medium altitudes in the north
January temperature ranges from
minus
11 to
minus
22
deg
C July tempera-
ture from +16 to +19
deg
C and annual precipitation from 500 to
900 mm Winter snow cover is up to 15 m which protects soil
and ground vegetation from frost The Central Tuvinian Basin
and the Tannu-Ola range are in the rain shadow area and have an
M Chytr
yen
et al
copy 2007 The Authors
670
Global Ecology and Biogeography
16
668ndash678 Journal compilation copy 2007 Blackwell Publishing Ltd
arid continental climate with annual precipitation of lt 400 mm
of which 88ndash95 falls from late July to September January
temperature ranges from
minus
27 to
minus
34
deg
C July temperature from
+16 to +18
deg
C and winter snow cover is shallow and irregular in
this region (Gidrometeoizdat 1966ndash1970)
Vegetation formations include steppe on the bottoms of the
Minusinskaya and Central Tuvinian Basins forest-steppe and
forest at medium altitudes and alpine tundra above the timber-
line Forests are abundant in the wetter northern part of the
Western Sayan In contrast in the cool and dry areas adjacent to
the Central Tuvinian Basin steppe extends to higher altitudes
and tundra to lower altitudes while forest is restricted In the forest-
steppe landscapes steppe regularly occurs on south-facing
slopes and forest occurs on north-facing slopes Cold and dry
lowland steppes are characterized by
Artemisia frigida
Willd
Caragana pygmaea
(L) DC and
Stipa krylovii
Roshev and
mountain steppes in the forest-steppe zone are often dominated
by
Artemisia gmelinii
Weber
Carex pediformis
C A Mey and
Spiraea media
Schmidt Some of the mountain steppes occurring
on mesic soils form dense tall-grass species-rich stands called
meadow steppes
Alpine tundra is mostly dominated by dwarf
shrubs (
Betula rotundifolia
Spach
Vaccinium myrtillus
L and
V vitis-idaea
L) on ridges and hillsides and tall forbs on the
valley bottoms The forests of the study area can be divided into
taiga and hemiboreal forests (Ermakov
et al
2000) Taiga occurs
on moist to mesic soils and is mostly dominated by
Abies sibirica
Ledeb
Picea obovata
Ledeb and
Pinus sibirica
Du Tour It
includes
Vaccinium myrtillus
V vitis-idaea
and
Bergenia crassifolia
(L) Fritsch in the herb layer and a well-developed moss layer
Hemiboreal forests also called sub-taiga occupy mesic to dry
soils They contain many shade-intolerant herbs some of which
occur both in steppe and open forests Hemiboreal forests in the
driest and coolest areas are dominated by
Larix sibirica
Ledeb
and are termed ultracontinental forests while those in the wetter
and warmer areas are dominated by
Pinus sylvestris
L or
Betula
pendula
Roth the latter often occurring in post-fire successional
stands
Data sampling
Sampling sites were located on an approximately 300-km long
northndashsouth transect that followed the gradient of increasing
climate continentality and ran roughly perpendicular to the Western
Sayan range The transect started in the lowlands dominated by
steppe and forest-steppe vegetation in the Minusinskaya Basin
crossed the Western Sayan mountain range continued to the
Central Tuvinian Basin and ended at the Tannu-Ola range Along
this transect we sampled vegetation in the zones of steppe forest-
steppe forest and alpine tundra Sampling units were vegetation
plots of 10
times
10 m located in central parts of physiognomically
and ecologically homogeneous vegetation stands Sites affected
by recent disturbances eg early stages of post-fire succession or
human-made habitats were avoided Landscape sectors with
different macroclimates sharply separated by mountain ridges
were used as the basic sampling strata Within each stratum we
placed one plot on each of the following landforms north-facing
slope south-facing slope ridge summit and valley bottom If the
same landform in a given stratum contained vegetation types
of contrasting physiognomy or with different dominant species
(including different dominants of forest undergrowth) we
placed one plot in each of these vegetation types In total 180
plots of treeless vegetation (39 in tundra and 141 in steppe) and
127 plots of forest vegetation (77 in taiga and 50 in hemiboreal
forest) were sampled
In each plot we recorded all species of vascular plants and
measured the following variables (Table 1) (1)
Altitude
was
measured with GPS and checked in a 1100000 topographic
map (2)
Climatic variables
(July and January mean temperature
and mean sums of summer and winter precipitation) were
estimated from a climatic model prepared in the ArcGIS 82
geographical information system (httpwwwesricom) The
model was based on a combination of Russian climate station
data and altitudes from a digitized 1200000 topographic map
Temperature values for different altitudes were computed based
on the adiabatic lapse rate of 065
deg
C per 100 m of altitude
Precipitation was computed from precipitationndashaltitude charts
compiled for each of the aridityndashhumidity sectors of the Altai-
Sayan region (Polikarpov
et al
1986) (3)
Potential solar radiation
above the canopy
was calculated from slope aspect inclination
and latitude and accounted for shading by the surrounding
topographic features Topographic shading was measured from
digital hemispheric photographs taken in a vertical direction
at the height of 15 m above ground at each site Calculation
was performed using Gap Light Analyser 20 software (http
wwwremsfucaforestrydownloadsgap_light_analyzerhtm)
Radiation was estimated as the daily sum of direct and diffuse
radiation for 21 June (4)
Potential solar radiation below the
canopy
was calculated for the forest plots only It was obtained in
the same way as radiation above the canopy but it additionally
accounted for shading by canopy (5)
Slope inclination
was
measured with a clinometer (6)
Soil depth
was measured in three
places in each plot and averaged Soils deeper than 30 cm were
arbitrarily given a value of 30 cm (7)
Soil pH and conductivity of
soil solution
were measured from a mixed soil sample from three
places in each plot Samples were taken from the mineral topsoil
horizon at a depth of 5ndash10 cm or less if the soil was very shallow
Each sample was extracted in distilled water for 24 h (weight
ratio of soilwater was 04) and measured using the digital
PH114 pH-meter and CM113 conductivity meter (Snail Instru-
ments Beroun Czech Republic) Conductivity caused by H
+
ions was subtracted according to Sjoumlrs (1952)
Data analysis
All the statistical analyses were computed in the
71
program (httpwwwstatsoftcom) To simplify the complex
pattern of correlations between environmental variables the
matrix of variables
times
plots was subjected to principal com-
ponents analysis (PCA) computed on a correlation matrix in
order to remove the effect of different measurement units
Additionally least-square linear regressions were calculated for
some univariate relationships that involved pH
Species richness pH and climate in southern Siberia
copy 2007 The Authors
Global Ecology and Biogeography
16
668ndash678 Journal compilation copy 2007 Blackwell Publishing Ltd
671
In ecological data sets sampled across heterogeneous land-
scapes representation of plots with different combinations of
environmental variables is typically more or less unequal This
occurs in spite of the use of a stratified sampling scheme such as
that applied in the current study because some combinations
may be rare or non-existent in some of the studied landscapes
In traditional statistical analyses eg linear models such an
unbalanced structure of the data set can be problematic if several
explanatory variables are involved Therefore we analysed the
relationships between the response variable (species richness)
and several environmental explanatory variables with regression
trees (CART Breiman
et al
1984) This method is suitable for
exploratory analysis of complex unbalanced data sets that involve
higher-order interactions and nonlinear relationships between
predictor variables It is able to reveal ecologically meaningful
relationships that would remain hidden in such data sets if standard
techniques such as linear models were used The regression tree
is constructed by a hierarchical splitting of the data set into
smaller groups which minimizes within-group variation in the
response variable At each split sampling units are divided into
two groups based on a single explanatory variable
We applied regression tree analysis separately to the data sets
of treeless and forest vegetation and used the number of vascular
plants as the response variable To select the optimal tree size
(optimal number of branches also called nodes or splits) we
used the 10-fold cross-validation method This method calculates
regression trees on smaller subsamples of the basic data set and
provides the value of cross-validation cost for the tree of each
size ie the error in predicted values relative to the corresponding
tree calculated with the entire data set The tree with the lowest
cross-validation error is usually accepted as the optimal tree
because it maximizes the variation in the response variable
and simultaneously minimizes the risk of over-learning ie the
danger of erroneous prediction of previously unobserved cases
For selection of the optimal tree based on the cross-validation
results we followed SE Rule = 0 (Breiman
et al 1984) because
SE Rule = 1 led to very simple trees For each node of the tree
we identified not only the primary splitter variable but also
surrogates ie the variables that are able to allocate cases similarly
as the primary splitter To consider a variable as a surrogate we
required that the variable had associated value higher than 06
To assess the relative importance of each predictor variable in the
optimal tree we calculated their Importance values which are rel-
ative to the best predictor variable scored as 100 The importance
values reflect the contribution that each explanatory variable
makes in explaining the variation in the response variable with
Table 1 Descriptive statistics for variables used in the analysis
Mean
Standard
deviation Minimum
Lower
quartile
Upper
quartile Maximum
Treeless vegetation (n = 180)
Altitude (m asl) 1004 480 318 592 1461 2160
July temperature (degC) 149 31 70 140 170 190
January temperature (degC) minus280 55 minus360 minus320 minus265 minus170
Summer precipitation (mm) 475 347 170 231 559 1341
Winter precipitation (mm) 87 83 28 33 117 369
Radiation (mol mminus2 dayminus1) 380 40 260 370 400 420
Inclination (deg) 19 13 0 9 29 52
Soil depth (cm) 16 10 1 6 30 30a
Soil pH 67 11 37 63 75 86
Soil conductivity (microS cmminus1) 120 251 2 49 152 353b
Number of vascular plants 316 124 70 225 410 640
Forests (n = 127)
Altitude (m asl) 968 414 346 614 1241 1948
July temperature (degC) 139 22 90 120 160 180
January temperature (degC) minus250 55 minus370 minus290 minus200 minus170
Summer precipitation (mm) 657 267 171 425 821 1283
Winter precipitation (mm) 144 78 28 76 187 371
Radiation above canopy (mol mminus2 dminus1) 361 35 247 347 390 410
Radiation below canopy (mol mminus2 dminus1) 133 43 60 100 157 330
Inclination (deg) 21 12 0 10 29 46
Soil depth (cm) 20 10 1 10 30 30a
Soil pH 57 09 37 50 63 78
Soil conductivity (microS cmminus1) 56 45 12 29 65 290
Number of vascular plants 293 125 60 190 380 690
aSoils deeper than 30 cm were arbitrarily given a value of 30 cmbIn one plot an outlying conductivity value of 3350 microS cmminus1 was measured
M Chytryen et al
copy 2007 The Authors672 Global Ecology and Biogeography 16 668ndash678 Journal compilation copy 2007 Blackwell Publishing Ltd
its contribution stemming both from the variablersquos role as a
primary splitter of a node and its role as a surrogate to any of
the primary splitters
RESULTS
PCA revealed groups of related environmental variables (Table 2)
The main complex environmental gradient associated with PCA
axis 1 is that of decreasing precipitation and increasing soil
pH The second most important gradient (axis 2) is related to
decreasing altitude and increasing winter temperature the third
gradient (axis 3) to slope steepness and associated variables such
as soil depth and site insolation and the fourth gradient (axis 4)
to canopy closure and light availability above the herb layer An
important relationship revealed by PCA axis 1 is the strong nega-
tive correlation of pH with precipitation this trend is consistent
in both treeless vegetation and forests although the mean pH is
lower in the latter (Fig 1) Another remarkable relationship
revealed by PCA is that precipitation is not correlated with winter
temperature While winter temperature generally decreases with
increasing altitude precipitation in both winter and summer is
to a large extent determined by the position on the windward or
leeward side of the main mountain ranges although at local scale
it also tends to increase with altitude
Univariate regressions of species richness on pH revealed a
positive relationship for both treeless and forest vegetation
(Table 3) In the treeless vegetation pH explained only 25 of
variation in species richness in linear regression but after adding
the quadratic term the variation explained increased to 170
indicating unimodal richnessndashpH relationship with a peak at pH
64 In tundra vegetation which occurred in the pH range of
38ndash61 (minus74) there was a positive linear relationship between
richness and pH that explained 130 of variation (Fig 2a)
However in steppe vegetation which occurred in the pH range
of 59ndash81 (minus86) the linear relationship was negative In forests
variation explained by the linear regression was considerably
higher than in treeless vegetation (258) but it was improved
only to 281 after adding the quadratic term (although the
quadratic model improved the model significantly P lt 005)
The curve of the quadratic relationship was upward convex with
an indistinct peak occurring at pH 72 which did not provide
reliable support for the existence of the unimodal richnessndashpH
Table 2 Coordinates of environmental variables on axes 1ndash4 of the PCA calculated from a matrix of vegetation plots times environmental variables As PCA was based on the correlation matrix the coordinates are identical with the correlations between PCA axes and environmental variables Coordinates ge |060| are set in bold
PCA axis 1 2 3 4
Percentage variation explained 345 188 154 99
Altitude minus049 minus080 011 minus001
July temperature 078 052 minus013 006
January temperature minus013 087 minus039 minus014
Summer precipitation minus090 018 minus010 minus027
Winter precipitation minus088 024 minus018 minus025
Radiation above canopy 030 minus027 minus063 minus049
Radiation below canopy 059 minus028 minus001 minus060
Slope inclination minus009 038 077 minus006
Soil depth 013 minus013 minus062 052
Soil pH 088 minus002 015 minus004
Soil conductivity 031 006 022 minus023
Figure 1 The relationship between pH and summer precipitation in the study area Precipitation values were predicted by the climatic model and soil pH(H20) was measured in vegetation plots Treeless vegetation = 0633 forests = 0325 The slopes of the two regression lines are significant (P lt 0001) but do not differ significantly from each other at P lt 005 The difference in intercept between them is significant (P lt 0001) Values of pH also decrease significantly with winter precipitation at P lt 0001 (not shown treeless vegetation
= 0594 forests = 0332)
Radj2 Radj
2
Radj2 Radj
2
Species richness pH and climate in southern Siberia
copy 2007 The Authors Global Ecology and Biogeography 16 668ndash678 Journal compilation copy 2007 Blackwell Publishing Ltd 673
relationship in forests After splitting the forest data set into
taiga and hemiboreal forests (Fig 2b) a positive relationship
only remained in the more acidic taiga (pH 37ndash69) while no
relationship was detected in the base-rich hemiboreal forests
(pH 52ndash78)
Regression trees were constructed separately for treeless and
forest vegetation In both of them January temperature altitude
and pH were the most important predictors of species richness
(Table 4) For treeless vegetation the optimal regression tree with
the lowest cross-validation cost had seven terminal nodes (Fig 3)
This tree explained 561 of variation in species richness In the
first node the tree split based on mean January temperature
predicting lower species numbers in areas with January means
below minus21 degC and at altitudes above 532 m In low-altitude areas
with warmer winters species richness increased with altitude ie
with precipitation The highest richness was found at altitudes
slightly above 500 m and summer precipitation above 479 mm
Table 3 Standardized regression coefficients (beta) variation explained ( ) and significances (P) of the linear and quadratic regression models of the relationship between species richness and pH for different subsets of vegetation plots Quadratic regressions were not considered for tundra steppe taiga and hemiboreal forests
beta-pH beta-(pH)2 P
Treeless vegetation
both types linear regression 017 mdash 0025 0025
both types quadratic regression 394 minus380 0170 lt 0001
tundra 036 mdash 0130 0022
steppe minus031 mdash 0091 lt 0001
Forests
both types linear regression 052 mdash 0258 lt 0001
both types quadratic regression 236 minus185 0281 lt 0001
taiga 044 mdash 0170 lt 0001
hemiboreal forests 009 mdash 00 0525
Radj
2
Radj
2
Figure 3 Regression tree for species richness of treeless vegetation Numbers at each node indicate the mean number of vascular plant species per 100 m2 plusmn standard deviation and number of plots assigned to that node The primary splitter variable and its split value at each node is given in bold Surrogates ie variables that allocate most cases to the identical group as the primary splitter are given in smaller letters below the primary splitter
Figure 2 Relationships between number of vascular plant species per 100 m2 and pH See Table 3 for regression coefficients The slope of the regression line was not significant for hemiboreal forests therefore the line was not fitted
M Chytryen et al
copy 2007 The Authors674 Global Ecology and Biogeography 16 668ndash678 Journal compilation copy 2007 Blackwell Publishing Ltd
grassland vegetation occurring there included mostly tall-grass
meadow steppes containing on average over 50 species per 100
m2 In the branch of the tree with low January temperatures
the most important predictor of species richness was pH It
discriminated between very poor tundra vegetation on soils with
pH lt 50 and richer vegetation of both tundra and steppe on
more base-rich soils In the latter the poorest vegetation was the
cold short-grass steppe on the flat bottoms of large basins while
mountain steppe and tundra vegetation was richer The latter
types of mountain grasslands were poorer at medium altitudes
(594ndash832 m) where forest forms the landscape matrix and treeless
vegetation mostly occurs in smaller patches surrounded by forest
The optimal regression tree for forest vegetation had only
three terminal nodes (Fig 4) First it separated species-poor dark
taiga forests on acidic soils with pH lt 50 from richer forests on
more base-rich soils Low pH was weakly related to higher summer
precipitation The group of species-richer forests on high-pH
soils was further divided into two subgroups The poorer sub-
group at altitudes above 882 m with low winter temperatures
and low summer precipitation contained ultracontinental
forests of L sibirica and P sibirica The richer subgroup at lower
altitudes with warmer winters and higher summer rainfall
included hemiboreal forests and wet Abies sibirica taiga this
subgroup included the richest forests of the Western Sayan
containing on average 37 species per 100 m2 This regression tree
explained 412 of variation in species richness For com-
parison we fitted a multiple least-square regression model with
the two predictors used as primary splitters in this tree pH and
altitude This model explained only 380 of variation
Higher mean local species richness in steppe and hemiboreal
forests than in tundra and taiga revealed by the regression trees
corresponded to the relative size of species pools for these forma-
tions The relative size of the species pools was estimated as the total
number of all species occurring in 39 plots selected randomly
from each of these formations These relative estimations yielded
305 species for steppe 223 for tundra 303 for hemiboreal forests
and 212 for taiga (means of 10 random selections)
DISCUSSION
The relationship between pH precipitation and species richness
The study area contains bedrocks of varying base status and soils
of different type and depth Yet soil pH was shown to depend
predominantly on precipitation summer precipitation explained
633 of variation in soil pH in sites with treeless vegetation (Fig 1)
Such an amount of variation explicable by a single predictor
variable is surprisingly large given that the precipitation model
used included inaccuracies due to a sparse network of climate
stations In addition the moisture status of particular sites
depends not only on precipitation but also on the topographic
position on the valley bottom or the ridge slope aspect inclination
and soil properties The strong pHndashprecipitation relationship
suggests that on the transition between arid continental and
more humid landscapes the intensity of leaching of basic cations
from soils is crucial for maintaining high or low pH
In forests mean pH was significantly lower than in treeless
vegetation (Fig 1) This partly reflects the fact that in forest-
Treeless vegetation Forests
Variable
Relative
importance Variable
Relative
importance
January temperature 100 Altitude 100
Altitude 821 January temperature 976
Soil pH 723 Soil pH 949
Winter precipitation 618 July temperature 777
Slope inclination 593 Soil conductivity 771
Summer precipitation 569 Summer precipitation 617
Soil conductivity 488 Winter precipitation 462
July temperature 447 Soil depth 196
Soil depth 297 Slope inclination 170
Radiation 160 Radiation above canopy 155
Radiation below canopy 142
Table 4 Ranked values of the relative importance of explanatory variables of the optimal regression trees for treeless and forest vegetation The values reflect the contribution each explanatory variable makes in explaining the variation in species richness with its contribution stemming both from the variablersquos role as a primary splitter of a node and its role as a surrogate to any of the primary splitters The variable with the highest relative importance is scored as 100 in each regression tree
Figure 4 Regression tree for species richness of forests See Fig 3 for a detailed explanation At the first node the best surrogate summer precipitation had only 30 similarity to the primary splitter
Species richness pH and climate in southern Siberia
copy 2007 The Authors Global Ecology and Biogeography 16 668ndash678 Journal compilation copy 2007 Blackwell Publishing Ltd 675
steppe landscapes forest grows in moister places with a higher
intensity of leaching than steppe vegetation However as forest
soils are more acidic than non-forest soils in the precipitation-
rich areas as well more intensive acidification processes probably
occur in forest soils These may result from (1) higher moisture
status and more intensive soil leaching under the forest canopy
which decreases evaporation (2) larger uptake of bases and their
replacement by H+ cations in the more productive forest vegeta-
tion (3) higher abundance of mosses contributing to acidifica-
tion (Vitt 2000) or (4) inputs of organic acids from conifer litter
(Ovington 1953 Finzi et al 1998) A much lower variation in
pH explained by summer precipitation for forest sites (332)
than for treeless sites (633) is another indication of a stronger
effect of vegetation on soil pH in forests than in open landscape
In both treeless and forest vegetation the best correlates of
species richness were January temperature pH and altitude (Figs 3
and 4 Table 4) Climatic variables such as summer temperatures
and precipitation were correlated with them (Table 2) Other
measured variables were either correlated with these variables or
weakly related to the species richness pattern (Tables 2 amp 4) This
corresponds to the alpine vegetation of the Alps where species
richness is mainly determined by the joint effects of temperature
and pH while other variables are less important (Vonlanthen
et al 2006) In the continental climate of the study area with its
very cold winters frost can be an important ecological factor
limiting plant life especially in combination with low winter
precipitation and shallow or discontinuous snow cover Actually
areas with the strongest winter frosts had the species-poorest
vegetation Both treeless and forest vegetation were consistently
poorer on soils with pH lt 50 which corresponds to the value
where toxic Al3+ cations start to solubilize (Tyler 1996) The
relationship between richness and altitude was more complex in
the study area reflecting interactions between climatic variables
At high altitudes richness was lower due to low winter tempera-
tures irrespective of the amount of precipitation whereas at
lower altitudes richness increased with precipitation
The most species-rich treeless vegetation corresponded to
tall-grass meadow steppe occurring at altitudes slightly above
500 m which still have comparatively warm winters but higher
precipitation than dry lowlands The poorest treeless vegetation
was tundra occurring in areas with pronounced winter frosts and
high precipitation which causes soil leaching and acidification
The richest forest vegetation occurred in areas where precipita-
tion was not too high to cause pronounced soil leaching and not
too low to exclude mesic forest species Such habitats supported
either Pinus sylvestris hemiboreal forest or Abies sibirica wet taiga
on footslopes and valley bottoms The poorest forest was dark
taiga with Pinus sibirica Abies sibirica or Picea obovata occurring
on low-pH soils in precipitation-rich areas
Unimodal pHndashrichness relationship in treeless vegetation
A positive richnessndashpH relationship has been more frequently
reported from the temperate boreal and arctic zones than has a
negative one (Paumlrtel 2002) In more detail the sign and shape of
this relationship depends on vegetation types (Chytry et al
2003 Schuster amp Diekmann 2003) The relationship tends to
be positive in vegetation types that grow predominantly on
acidic to neutral soils eg in forests and tundra In contrast
treeless vegetation on neutral to base-rich soils tends to have a
non-significant or negative richnessndashpH relationship
Our study provides a finer and more complete picture than
most others because it covers nearly the whole range of soil pH
compatible with plant life The existence of upper and lower
physiological limits to plant growth on the pH gradient implies
that the relationship is inherently unimodal This is reported by
some studies covering broad ranges of pH values especially
in grasslands (eg Tyler 2000 Loumlbel et al 2006) and mires (eg
Glaser et al 1990) We found a pronounced unimodal richnessndash
pH relationship in treeless vegetation but not in forests
Within treeless vegetation tundra occurred on low-pH soils
in precipitation-rich areas and steppe on high-pH soils in
precipitation-poor areas After splitting these two vegetation
types the former showed a positive linear relationship to soil pH
and the latter showed a negative linear relationship The positive
relationship in the southern Siberian alpine tundra is consistent
with a number of earlier studies from the arctic tundra where
increasing pH was identified as one of the major factors enhancing
species richness (Gough et al 2000 Walker et al 2001 van der
Welle et al 2003) In contrast steppe vegetation which occurred
on soils with pH 59ndash86 exhibited a weak yet significant negative
linear relationship between richness and pH This relationship
appears to be consistent with earlier studies from North
American prairies (Palmer et al 2003) Our data suggest that the
decreasing species richness of steppe vegetation on high-pH soils
could be caused by climatic stress instead of or in addition to the
physiological effect of high pH The highest pH values are found
in the driest soils with strongly limited or no cation leaching
(Fig 1) However these habitats experience not only pronounced
summer droughts but also strong winter frosts without protective
snow cover As most species of the study area are not adapted to
such harsh conditions the negative richnessndashpH correlation
appears The richest vegetation occurs where soil is not too dry
and not too acidic at the same time Our data suggest that for the
treeless vegetation of the study area it is at pH 6ndash7
The putative role of drought stress in limiting species richness
on high-pH soils is supported by the comparison with richnessndash
pH relationships reported for wetlands and mires In these
habitats high pH is usually due to cation saturation from
mineral springs and it is not associated with drought stress
In such environments species richness often increases up to pH
7 or even beyond (Glaser et al 1990 Haacutejkovaacute amp Haacutejek 2003
Guumlsewell et al 2005) However no base-rich wetlands or mires
were included in the current study because they are very rare in
the study area
Positive pHndashrichness relationship in forests
Unlike in treeless vegetation the richnessndashpH relationship in forests
is mostly reported as monotonic positive (Dupreacute et al 2002
Schuster amp Diekmann 2003) while unimodal relationships
M Chytryen et al
copy 2007 The Authors676 Global Ecology and Biogeography 16 668ndash678 Journal compilation copy 2007 Blackwell Publishing Ltd
are rare and negative relationships are exceptional The latter are
usually attributed to the confounding effects of factors other
than pH (Dupreacute et al 2002) Species richness in forests usually
increases steeply in acidic soils but the curve becomes less steep
above pH 55 and often levels off at a pH value close to 70 A
positive relationship is documented both from deciduous forests
of Europe (eg Brunet et al 1997 Dumortier et al 2002 Chytryet al 2003 Wohlgemuth amp Gigon 2003 Coudun amp Geacutegout
2005 Schuster amp Diekmann 2005) and North America (eg Peet
amp Christensen 1980 Brosofske et al 2001 Peet et al 2003) and
from coniferous forests in both continents (Rey Benayas 1995
Brosofske et al 2001 Zinko et al 2006) Palmer et al (2003)
pointed to the contrasting pHndashrichness relationships in Oklahoma
forests and prairies positive in the former and negative in the
latter The same pattern based on entirely different species pools
was found in forests and steppes in our study area (Fig 2)
We hypothesize that the predominance of the positive richnessndash
pH relationship in forests mainly results from the truncated pH
gradient at its base-rich end (Fig 5) There are two reasons for
this truncation First forest cannot grow at extremely dry sites
that only support grassland but these sites tend to have the
highest pH at least in the semi-arid areas such as forest-steppe
Second productive vegetation with trees tends to decrease soil
pH (Fig 1 Tyler 2003) Truncation of the pH gradient in forests
is also apparent in the meta-analysis of German case studies
(Schuster amp Diekmann 2003) where grasslands were often
recorded on soils with pH 7ndash8 but very few studies reported
forests on soils with pH gt 7 Because the truncation removes
habitats where species pool sizes have already started to decrease
due to drought stress most richnessndashpH relationships reported
in the literature from forests are monotonic positive Besides this
main explanation we suggest two other mechanisms that can
explain why the richnessndashpH curve of forest vegetation does not
usually decrease at high-pH conditions (Fig 5) First the species
richness of forests on soils with pH values of about 7 can be
partly increased by the mass effect at the forest-steppe ecotone
Forests on such soils which are usually rather dry contain
several species typical of adjacent dry grasslands These light-
demanding species find a suitable habitat under the open canopy
formed by pine or larch In contrast no such mass effect can
enhance the species richness of grasslands at pH 75ndash85 because
there are no sufficiently large species pools of other vegetation
types available for this pH range in the study area Second in dry
areas such as the forest-steppe zone the forest canopy maintains
higher air humidity in the understorey than in treeless habitats
(Moore et al 2000) Therefore forest richness may not be so
much limited by drought stress as is steppe richness on soils with
pH values of about 70ndash75
Species pools and the Pleistocene bottleneck
The species pool hypothesis predicts that the species richness of
particular habitats is correlated with the historical habitat com-
monness and associated opportunities for species accumulation
over evolutionary time (ie speciation minus extinction Aarssen
amp Schamp 2002) Over most of todayrsquos temperate zone of Eurasia
the Pleistocene climate was not only cool but was also dry (Frenzel
et al 1992) Such a climate supported the development of dry
calcium-rich soils over vast areas of cold steppe the habitat of
large Pleistocene herbivores (Guthrie 2001 Walker et al 2001)
Patches of coniferous forests also occurred in some areas mainly
in the mountains and wet lowland sites they have been recon-
structed from the full-glacial fossil data both from the Russianndash
Mongolian border area (Tarasov et al 2000) and from central
Europe (Willis et al 2000 Jankovskaacute et al 2002) Tundra was
confined to places with higher precipitation or lower evapotran-
spiration eg in the mountains or at non-glaciated higher latitudes
often in the close vicinity of steppe (Tarasov et al 2000)
The present-day landscape in some parts of southern Siberia
and Mongolia is probably the closest modern analogy to the
Pleistocene environments that existed in the non-glaciated part
of northern Eurasia It has to be pointed out that modern
analogies are never perfect Predictions based on analogies must
not be taken too seriously until there is independent and reliable
fossil evidence However if modern analogies exist they may
Figure 5 Conceptual model of species richness in treeless vegetation and forests across the combined gradient of decreasing precipitation and increasing pH On low-pH soils in precipitation-rich areas pools of species adapted to toxic effects of Al3+ and H+ ions are limited and species richness is low With decreasing precipitation and increasing pH richness first increases but subsequently decreases because of a limited pool of species adapted to very dry conditions In contrast forest richness does not decrease or decreases only slightly in precipitation-poor areas for the following reasons (1) forests do not occur in the driest areas so the extreme end of the precipitationndashpH gradient is truncated (2) forests occurring on their ecological limit have an open canopy and their herb layer is saturated by steppe species pools and (3) the protective effect of forest canopy maintains higher air humidity and reduces drought stress
Species richness pH and climate in southern Siberia
copy 2007 The Authors Global Ecology and Biogeography 16 668ndash678 Journal compilation copy 2007 Blackwell Publishing Ltd 677
provide valuable insights and enhance our understanding of
ecological patterns and processes in the past environments
The current study included vegetation types with the same
leading species as reconstructed from the full-glacial central
Europe (Willis et al 2000 Jankovskaacute et al 2002) and parts of
the study area had a climate corresponding to the cool periods
of the Pleistocene (Frenzel et al 1992) In southern Siberia the
richest vegetation is found on soils with a pH of 6ndash7 (Fig 2)
which are associated with moderate precipitation (Fig 1) If the
modern species richness of different habitats resulted from
speciation and extinction in the historically prevailing environ-
ments (species pool effects Aarssen amp Schamp 2002 Paumlrtel
2002 Ewald 2003) this pattern would suggest that such slightly
acidic to neutral soils were common in the pre-Holocene
environments of temperate Eurasia In contrast very dry calcium-
rich steppe or wet acidic tundra probably never supported
species-rich vegetation
Increasing precipitation in the Holocene especially in
areas with an oceanic climate caused large-scale soil acidification
(Roberts 1998) The species-pool hypothesis predicts that todayrsquos
acidic soils although prevailing in large areas are poor in species
because of the lack of calcifuge species which may have become
largely extinct during the Pleistocene (Ewald 2003) Such acidified
habitats are represented in the wetter parts of the study area by
taiga forests (in warmer climate) or by tundra (in cooler climate)
Both of these habitats are generally species poor but exhibit
positive richnessndashpH relationships for which the species pool
hypothesis provides a plausible explanation
ACKNOWLEDGEMENTS
We thank the local staff of our expeditions for their extensive
support during the fieldwork and two anonymous referees
for useful comments on the previous version of this paper
This research was supported from projects IAA6163303 from
the Grant Agency of the Academy of Sciences of the Czech
Republic and long-term research plans MSM0021622416 and
AVOZ60050516
REFERENCES
Aarssen LW amp Schamp BS (2002) Predicting distributions of
species richness and species sizes in regional floras applying the
species pool hypothesis to the habitat templet model Perspec-
tives in Plant Ecology Evolution and Systematics 5 3ndash12
Berglund BE Birks HJB Ralska-Jasiewiczowa M amp
Wright HE (1996) Palaeoecological events during the last
15000 years John Wiley amp Sons Chichester
Breiman L Friedman JH Olshen RA amp Stone CG (1984)
Classification and regression trees Wadsworth International
Group Belmont CA
Brosofske KD Chen J amp Crow TR (2001) Understory vegeta-
tion and site factors implications for a managed Wisconsin
landscape Forest Ecology and Management 146 75ndash87
Brunet J Falkengren-Grerup U Ruumlhling A amp Tyler G (1997)
Regional differences in floristic change in South Swedish oak
forests as related to soil chemistry and land use Journal of
Vegetation Science 8 329ndash336
Chytry M Tichy L amp Roleccedilek J (2003) Local and regional pat-
terns of species richness in Central European vegetation types
along the pHcalcium gradient Folia Geobotanica 38 429ndash
442
Coudun C amp Geacutegout J-C (2005) Ecological behaviour of
herbaceous forest species along a pH gradient a comparison
between oceanic and semicontinental regions in northern
France Global Ecology and Biogeography 14 263ndash270
Dumortier M Butaye J Jacquemyn H Van Camp N Lust N
amp Hermy M (2002) Predicting vascular plant species richness
of fragmented forests in agricultural landscapes in central
Belgium Forest Ecology and Management 158 85ndash102
Dupreacute C Wessberg C amp Diekmann M (2002) Species richness
in deciduous forests Effects of species pools and environmental
variables Journal of Vegetation Science 13 505ndash516
Ermakov N Dring J amp Rodwell J (2000) Classification of con-
tinental hemiboreal forests of North Asia Braun-Blanquetia
28 1ndash131
Ewald J (2003) The calcareous riddle why are there so many
calciphilous species in the Central European flora Folia
Geobotanica 38 357ndash366
Finzi AC Canham CD amp van Breemen N (1998) Canopy
treendashsoil interactions within temperate forests species effects
on pH and cations Ecological Applications 8 447ndash454
Frenzel B Peacutecsi M amp Velichko AA (eds) (1992) Atlas of
paleoclimates and paleoenvironments of the Northern
Hemisphere Geographical Research Institute Budapest amp
Gustav Fischer Verlag Stuttgart
Gidrometeoizdat (1966ndash1970) Spravochnik po klimatu SSSR
[Reference books on the climate of the USSR] Gidrometeoizdat
Leningrad
Gigon A (1987) A hierarchic approach in causal ecosystem
analysis the calcifuge-calcicole problem in alpine grasslands
Ecological Studies 61 228ndash244
Glaser PH Janssens JA amp Siegel DI (1990) The response of
vegetation to chemical and hydrological gradients in the Lost
River peatland northern Minnesota Journal of Ecology 78
1021ndash1048
Gough L Shaver GR Carroll J Royer DL amp Laundre JA
(2000) Vascular plant species richness in Alaskan arctic tundra
the importance of soil pH Journal of Ecology 88 54ndash66
Grubb PJ (1987) Global trends in species-richness in terrestrial
vegetation a view from the northern hemisphere Organiza-
tion of communities past and present (ed by JHR Gee and PS
Giller) pp 99ndash118 Blackwell Science Oxford
Guumlsewell S Bailey KM Roem WJ amp Bedford BL (2005)
Nutrient limitation and botanical diversity in wetlands can
fertilisation raise species richness Oikos 109 71ndash80
Guthrie RD (2001) Origin and causes of the mammoth steppe
a story of cloud cover woolly mammal tooth pits buckles
and inside-out Beringia Quaternary Science Reviews 20 549ndash
574
Haacutejkovaacute P amp Haacutejek M (2003) Species richness and above-
ground biomass of poor and calcareous spring fens in the
M Chytryen et al
copy 2007 The Authors678 Global Ecology and Biogeography 16 668ndash678 Journal compilation copy 2007 Blackwell Publishing Ltd
flysch West Carpathians and their relationships to water and
soil chemistry Preslia 75 271ndash287
Hilbig W (1995) The vegetation of Mongolia SPB Academic
Publishing Amsterdam
Jankovskaacute V Chromy P amp Niznianskaacute M (2002) Iacuteafaacuterka mdash
first palaeobotanical data of the character of Last Glacial
vegetation and landscape in the West Carpathians (Slovakia)
Acta Palaeobotanica 42 39ndash50
Loumlbel S Dengler J amp Hobohm C (2006) Species richness of
vascular plants bryophytes and lichens in dry grasslands the
effects of environment landscape structure and competition
Folia Geobotanica 41 377ndash393
Meusel H Jaumlger EJ Weinert E amp Rauschert S (1965ndash1992)
Vergleichende Chorologie der zentraleuropaumlischen Flora IndashIII
Gustav Fischer Verlag Jena
Moore KE Fitzjarrald DR Sakai RK amp Freedman JM
(2000) Growing season water balance at a boreal jack pine
forest Water Resources Research 36 483ndash493
Ovington JD (1953) Studies of the development of woodland
conditions under different trees I Soil pH Journal of Ecology
4113ndash52
Palmer MW Areacutevalo JR del Carmen Cobo M amp Earls PG
(2003) Species richness and soil reaction in a northeastern
Oklahoma landscape Folia Geobotanica 38 381ndash389
Paumlrtel M (2002) Local plant diversity patterns and evolutionary
history at the regional scale Ecology 83 2361ndash2366
Peet RK amp Christensen NL (1980) Hardwood forest vegeta-
tion of the North Carolina piedmont Veroumlffentlichungen des
Geobotanischen Institutes ETH Stiftung Ruumlbel Zuumlrich 69 14ndash
39
Peet RK Fridley JD amp Gramling JM (2003) Variation in
species richness and species pool size across a pH gradient
in forests of the southern Blue Ridge Mountains Folia
Geobotanica 38 391ndash401
Polikarpov NP Chebakova NM amp Nazimova DI (1986)
Klimat i gornye lesa Sibiri [Climate and mountain forests of
Siberia] Nauka Novosibirsk
Rey Benayas JM (1995) Patterns of diversity in the strata of
boreal montane forest in British Columbia Journal of Vegeta-
tion Science 6 95ndash98
Roberts N (1998) The Holocene an environmental history 2nd
edn Blackwell Science Oxford
Schuster B amp Diekmann M (2003) Changes in species density
along the soil pH gradient mdash evidence from German plant
communities Folia Geobotanica 38 367ndash379
Schuster B amp Diekmann M (2005) Species richness and
environmental correlates in deciduous forests of Northwest
Germany Forest Ecology and Management 206 197ndash205
Sjoumlrs H (1952) On the relation between vegetation and electrolytes
in north Swedish mire waters Oikos 2 241ndash258
Tarasov PE Volkova VS Webb T III Guiot J Andreev AA
Bezusko LG Bezusko TV Bykova GV Dorofeyuk NI
Kvavadze EV Osipova IM Panova NK amp Sevastyanov DV
(2000) Last glacial maximum biomes reconstructed from
pollen and plant macrofossil data from northern Eurasia
Journal of Biogeography 27 609ndash620
Taylor DR Aarssen LW amp Loehle C (1990) On the relationship
between rK selection and environmental carrying capacity
a new habitat templet for plant life history strategies Oikos 58
239ndash250
Tyler G (1996) Soil chemistry and plant distributions in rock
habitats of southern Sweden Nordic Journal of Botany 16
609ndash635
Tyler G (2000) Integrated analysis of conditions accounting
for intersite distribution of grassland plants Nordic Journal of
Botany 20 485ndash500
Tyler G (2003) Some ecophysiological and historical approaches
to species richness and calcicolecalcifuge behaviour mdash
contribution to a debate Folia Geobotanica 38 419ndash428
van der Welle MEW Vermeulen PJ Shaver GR amp Berendse F
(2003) Factors determining plant species richness in Alaskan
arctic tundra Journal of Vegetation Science 14 711ndash720
Vitt DH (2000) Peatlands ecosystems dominated by bryophytes
Bryophyte biology (ed by AJ Shaw and B Goffinet) pp 312ndash
343 Cambridge University Press Cambridge
Vonlanthen CM Kammer PM Eugster W Buumlhler A amp
Veit H (2006) Alpine vascular plant species richness the
importance of daily maximum temperature and pH Plant
Ecology 184 13ndash25
Walker DA Bockheim JG Chapin FS III Eugster W
Nelson FE amp Ping CL (2001) Calcium-rich tundra wildlife
and the lsquoMammoth Steppersquo Quaternary Science Reviews 20
149ndash163
Willis KJ Rudner E amp Suumlmegi P (2000) The full-glacial forests
of central and southeastern Europe Quaternary Research 53
203ndash213
Wohlgemuth T amp Gigon A (2003) Calcicole plant diversity in
Switzerland may reflect a variety of habitat templets Folia
Geobotanica 38 443ndash452
Zinko U Dynesius M Nilsson C amp Seibert J (2006) The role
of soil pH in linking groundwater flow and plant species
density in boreal forest landscapes Ecography 29 515ndash524
Editor Martin Sykes
BIOSKETCH
Milan Chytry is an associate professor of botany in the
Department of Botany and Zoology Masaryk University
Brno Czech Republic His research as well as research
by the co-authors is focused on vegetation ecology and
large-scale diversity patterns of multi-species assemblages
of vascular plants

Species richness pH and climate in southern Siberia
copy 2007 The Authors
Global Ecology and Biogeography
16
668ndash678 Journal compilation copy 2007 Blackwell Publishing Ltd
671
In ecological data sets sampled across heterogeneous land-
scapes representation of plots with different combinations of
environmental variables is typically more or less unequal This
occurs in spite of the use of a stratified sampling scheme such as
that applied in the current study because some combinations
may be rare or non-existent in some of the studied landscapes
In traditional statistical analyses eg linear models such an
unbalanced structure of the data set can be problematic if several
explanatory variables are involved Therefore we analysed the
relationships between the response variable (species richness)
and several environmental explanatory variables with regression
trees (CART Breiman
et al
1984) This method is suitable for
exploratory analysis of complex unbalanced data sets that involve
higher-order interactions and nonlinear relationships between
predictor variables It is able to reveal ecologically meaningful
relationships that would remain hidden in such data sets if standard
techniques such as linear models were used The regression tree
is constructed by a hierarchical splitting of the data set into
smaller groups which minimizes within-group variation in the
response variable At each split sampling units are divided into
two groups based on a single explanatory variable
We applied regression tree analysis separately to the data sets
of treeless and forest vegetation and used the number of vascular
plants as the response variable To select the optimal tree size
(optimal number of branches also called nodes or splits) we
used the 10-fold cross-validation method This method calculates
regression trees on smaller subsamples of the basic data set and
provides the value of cross-validation cost for the tree of each
size ie the error in predicted values relative to the corresponding
tree calculated with the entire data set The tree with the lowest
cross-validation error is usually accepted as the optimal tree
because it maximizes the variation in the response variable
and simultaneously minimizes the risk of over-learning ie the
danger of erroneous prediction of previously unobserved cases
For selection of the optimal tree based on the cross-validation
results we followed SE Rule = 0 (Breiman
et al 1984) because
SE Rule = 1 led to very simple trees For each node of the tree
we identified not only the primary splitter variable but also
surrogates ie the variables that are able to allocate cases similarly
as the primary splitter To consider a variable as a surrogate we
required that the variable had associated value higher than 06
To assess the relative importance of each predictor variable in the
optimal tree we calculated their Importance values which are rel-
ative to the best predictor variable scored as 100 The importance
values reflect the contribution that each explanatory variable
makes in explaining the variation in the response variable with
Table 1 Descriptive statistics for variables used in the analysis
Mean
Standard
deviation Minimum
Lower
quartile
Upper
quartile Maximum
Treeless vegetation (n = 180)
Altitude (m asl) 1004 480 318 592 1461 2160
July temperature (degC) 149 31 70 140 170 190
January temperature (degC) minus280 55 minus360 minus320 minus265 minus170
Summer precipitation (mm) 475 347 170 231 559 1341
Winter precipitation (mm) 87 83 28 33 117 369
Radiation (mol mminus2 dayminus1) 380 40 260 370 400 420
Inclination (deg) 19 13 0 9 29 52
Soil depth (cm) 16 10 1 6 30 30a
Soil pH 67 11 37 63 75 86
Soil conductivity (microS cmminus1) 120 251 2 49 152 353b
Number of vascular plants 316 124 70 225 410 640
Forests (n = 127)
Altitude (m asl) 968 414 346 614 1241 1948
July temperature (degC) 139 22 90 120 160 180
January temperature (degC) minus250 55 minus370 minus290 minus200 minus170
Summer precipitation (mm) 657 267 171 425 821 1283
Winter precipitation (mm) 144 78 28 76 187 371
Radiation above canopy (mol mminus2 dminus1) 361 35 247 347 390 410
Radiation below canopy (mol mminus2 dminus1) 133 43 60 100 157 330
Inclination (deg) 21 12 0 10 29 46
Soil depth (cm) 20 10 1 10 30 30a
Soil pH 57 09 37 50 63 78
Soil conductivity (microS cmminus1) 56 45 12 29 65 290
Number of vascular plants 293 125 60 190 380 690
aSoils deeper than 30 cm were arbitrarily given a value of 30 cmbIn one plot an outlying conductivity value of 3350 microS cmminus1 was measured
M Chytryen et al
copy 2007 The Authors672 Global Ecology and Biogeography 16 668ndash678 Journal compilation copy 2007 Blackwell Publishing Ltd
its contribution stemming both from the variablersquos role as a
primary splitter of a node and its role as a surrogate to any of
the primary splitters
RESULTS
PCA revealed groups of related environmental variables (Table 2)
The main complex environmental gradient associated with PCA
axis 1 is that of decreasing precipitation and increasing soil
pH The second most important gradient (axis 2) is related to
decreasing altitude and increasing winter temperature the third
gradient (axis 3) to slope steepness and associated variables such
as soil depth and site insolation and the fourth gradient (axis 4)
to canopy closure and light availability above the herb layer An
important relationship revealed by PCA axis 1 is the strong nega-
tive correlation of pH with precipitation this trend is consistent
in both treeless vegetation and forests although the mean pH is
lower in the latter (Fig 1) Another remarkable relationship
revealed by PCA is that precipitation is not correlated with winter
temperature While winter temperature generally decreases with
increasing altitude precipitation in both winter and summer is
to a large extent determined by the position on the windward or
leeward side of the main mountain ranges although at local scale
it also tends to increase with altitude
Univariate regressions of species richness on pH revealed a
positive relationship for both treeless and forest vegetation
(Table 3) In the treeless vegetation pH explained only 25 of
variation in species richness in linear regression but after adding
the quadratic term the variation explained increased to 170
indicating unimodal richnessndashpH relationship with a peak at pH
64 In tundra vegetation which occurred in the pH range of
38ndash61 (minus74) there was a positive linear relationship between
richness and pH that explained 130 of variation (Fig 2a)
However in steppe vegetation which occurred in the pH range
of 59ndash81 (minus86) the linear relationship was negative In forests
variation explained by the linear regression was considerably
higher than in treeless vegetation (258) but it was improved
only to 281 after adding the quadratic term (although the
quadratic model improved the model significantly P lt 005)
The curve of the quadratic relationship was upward convex with
an indistinct peak occurring at pH 72 which did not provide
reliable support for the existence of the unimodal richnessndashpH
Table 2 Coordinates of environmental variables on axes 1ndash4 of the PCA calculated from a matrix of vegetation plots times environmental variables As PCA was based on the correlation matrix the coordinates are identical with the correlations between PCA axes and environmental variables Coordinates ge |060| are set in bold
PCA axis 1 2 3 4
Percentage variation explained 345 188 154 99
Altitude minus049 minus080 011 minus001
July temperature 078 052 minus013 006
January temperature minus013 087 minus039 minus014
Summer precipitation minus090 018 minus010 minus027
Winter precipitation minus088 024 minus018 minus025
Radiation above canopy 030 minus027 minus063 minus049
Radiation below canopy 059 minus028 minus001 minus060
Slope inclination minus009 038 077 minus006
Soil depth 013 minus013 minus062 052
Soil pH 088 minus002 015 minus004
Soil conductivity 031 006 022 minus023
Figure 1 The relationship between pH and summer precipitation in the study area Precipitation values were predicted by the climatic model and soil pH(H20) was measured in vegetation plots Treeless vegetation = 0633 forests = 0325 The slopes of the two regression lines are significant (P lt 0001) but do not differ significantly from each other at P lt 005 The difference in intercept between them is significant (P lt 0001) Values of pH also decrease significantly with winter precipitation at P lt 0001 (not shown treeless vegetation
= 0594 forests = 0332)
Radj2 Radj
2
Radj2 Radj
2
Species richness pH and climate in southern Siberia
copy 2007 The Authors Global Ecology and Biogeography 16 668ndash678 Journal compilation copy 2007 Blackwell Publishing Ltd 673
relationship in forests After splitting the forest data set into
taiga and hemiboreal forests (Fig 2b) a positive relationship
only remained in the more acidic taiga (pH 37ndash69) while no
relationship was detected in the base-rich hemiboreal forests
(pH 52ndash78)
Regression trees were constructed separately for treeless and
forest vegetation In both of them January temperature altitude
and pH were the most important predictors of species richness
(Table 4) For treeless vegetation the optimal regression tree with
the lowest cross-validation cost had seven terminal nodes (Fig 3)
This tree explained 561 of variation in species richness In the
first node the tree split based on mean January temperature
predicting lower species numbers in areas with January means
below minus21 degC and at altitudes above 532 m In low-altitude areas
with warmer winters species richness increased with altitude ie
with precipitation The highest richness was found at altitudes
slightly above 500 m and summer precipitation above 479 mm
Table 3 Standardized regression coefficients (beta) variation explained ( ) and significances (P) of the linear and quadratic regression models of the relationship between species richness and pH for different subsets of vegetation plots Quadratic regressions were not considered for tundra steppe taiga and hemiboreal forests
beta-pH beta-(pH)2 P
Treeless vegetation
both types linear regression 017 mdash 0025 0025
both types quadratic regression 394 minus380 0170 lt 0001
tundra 036 mdash 0130 0022
steppe minus031 mdash 0091 lt 0001
Forests
both types linear regression 052 mdash 0258 lt 0001
both types quadratic regression 236 minus185 0281 lt 0001
taiga 044 mdash 0170 lt 0001
hemiboreal forests 009 mdash 00 0525
Radj
2
Radj
2
Figure 3 Regression tree for species richness of treeless vegetation Numbers at each node indicate the mean number of vascular plant species per 100 m2 plusmn standard deviation and number of plots assigned to that node The primary splitter variable and its split value at each node is given in bold Surrogates ie variables that allocate most cases to the identical group as the primary splitter are given in smaller letters below the primary splitter
Figure 2 Relationships between number of vascular plant species per 100 m2 and pH See Table 3 for regression coefficients The slope of the regression line was not significant for hemiboreal forests therefore the line was not fitted
M Chytryen et al
copy 2007 The Authors674 Global Ecology and Biogeography 16 668ndash678 Journal compilation copy 2007 Blackwell Publishing Ltd
grassland vegetation occurring there included mostly tall-grass
meadow steppes containing on average over 50 species per 100
m2 In the branch of the tree with low January temperatures
the most important predictor of species richness was pH It
discriminated between very poor tundra vegetation on soils with
pH lt 50 and richer vegetation of both tundra and steppe on
more base-rich soils In the latter the poorest vegetation was the
cold short-grass steppe on the flat bottoms of large basins while
mountain steppe and tundra vegetation was richer The latter
types of mountain grasslands were poorer at medium altitudes
(594ndash832 m) where forest forms the landscape matrix and treeless
vegetation mostly occurs in smaller patches surrounded by forest
The optimal regression tree for forest vegetation had only
three terminal nodes (Fig 4) First it separated species-poor dark
taiga forests on acidic soils with pH lt 50 from richer forests on
more base-rich soils Low pH was weakly related to higher summer
precipitation The group of species-richer forests on high-pH
soils was further divided into two subgroups The poorer sub-
group at altitudes above 882 m with low winter temperatures
and low summer precipitation contained ultracontinental
forests of L sibirica and P sibirica The richer subgroup at lower
altitudes with warmer winters and higher summer rainfall
included hemiboreal forests and wet Abies sibirica taiga this
subgroup included the richest forests of the Western Sayan
containing on average 37 species per 100 m2 This regression tree
explained 412 of variation in species richness For com-
parison we fitted a multiple least-square regression model with
the two predictors used as primary splitters in this tree pH and
altitude This model explained only 380 of variation
Higher mean local species richness in steppe and hemiboreal
forests than in tundra and taiga revealed by the regression trees
corresponded to the relative size of species pools for these forma-
tions The relative size of the species pools was estimated as the total
number of all species occurring in 39 plots selected randomly
from each of these formations These relative estimations yielded
305 species for steppe 223 for tundra 303 for hemiboreal forests
and 212 for taiga (means of 10 random selections)
DISCUSSION
The relationship between pH precipitation and species richness
The study area contains bedrocks of varying base status and soils
of different type and depth Yet soil pH was shown to depend
predominantly on precipitation summer precipitation explained
633 of variation in soil pH in sites with treeless vegetation (Fig 1)
Such an amount of variation explicable by a single predictor
variable is surprisingly large given that the precipitation model
used included inaccuracies due to a sparse network of climate
stations In addition the moisture status of particular sites
depends not only on precipitation but also on the topographic
position on the valley bottom or the ridge slope aspect inclination
and soil properties The strong pHndashprecipitation relationship
suggests that on the transition between arid continental and
more humid landscapes the intensity of leaching of basic cations
from soils is crucial for maintaining high or low pH
In forests mean pH was significantly lower than in treeless
vegetation (Fig 1) This partly reflects the fact that in forest-
Treeless vegetation Forests
Variable
Relative
importance Variable
Relative
importance
January temperature 100 Altitude 100
Altitude 821 January temperature 976
Soil pH 723 Soil pH 949
Winter precipitation 618 July temperature 777
Slope inclination 593 Soil conductivity 771
Summer precipitation 569 Summer precipitation 617
Soil conductivity 488 Winter precipitation 462
July temperature 447 Soil depth 196
Soil depth 297 Slope inclination 170
Radiation 160 Radiation above canopy 155
Radiation below canopy 142
Table 4 Ranked values of the relative importance of explanatory variables of the optimal regression trees for treeless and forest vegetation The values reflect the contribution each explanatory variable makes in explaining the variation in species richness with its contribution stemming both from the variablersquos role as a primary splitter of a node and its role as a surrogate to any of the primary splitters The variable with the highest relative importance is scored as 100 in each regression tree
Figure 4 Regression tree for species richness of forests See Fig 3 for a detailed explanation At the first node the best surrogate summer precipitation had only 30 similarity to the primary splitter
Species richness pH and climate in southern Siberia
copy 2007 The Authors Global Ecology and Biogeography 16 668ndash678 Journal compilation copy 2007 Blackwell Publishing Ltd 675
steppe landscapes forest grows in moister places with a higher
intensity of leaching than steppe vegetation However as forest
soils are more acidic than non-forest soils in the precipitation-
rich areas as well more intensive acidification processes probably
occur in forest soils These may result from (1) higher moisture
status and more intensive soil leaching under the forest canopy
which decreases evaporation (2) larger uptake of bases and their
replacement by H+ cations in the more productive forest vegeta-
tion (3) higher abundance of mosses contributing to acidifica-
tion (Vitt 2000) or (4) inputs of organic acids from conifer litter
(Ovington 1953 Finzi et al 1998) A much lower variation in
pH explained by summer precipitation for forest sites (332)
than for treeless sites (633) is another indication of a stronger
effect of vegetation on soil pH in forests than in open landscape
In both treeless and forest vegetation the best correlates of
species richness were January temperature pH and altitude (Figs 3
and 4 Table 4) Climatic variables such as summer temperatures
and precipitation were correlated with them (Table 2) Other
measured variables were either correlated with these variables or
weakly related to the species richness pattern (Tables 2 amp 4) This
corresponds to the alpine vegetation of the Alps where species
richness is mainly determined by the joint effects of temperature
and pH while other variables are less important (Vonlanthen
et al 2006) In the continental climate of the study area with its
very cold winters frost can be an important ecological factor
limiting plant life especially in combination with low winter
precipitation and shallow or discontinuous snow cover Actually
areas with the strongest winter frosts had the species-poorest
vegetation Both treeless and forest vegetation were consistently
poorer on soils with pH lt 50 which corresponds to the value
where toxic Al3+ cations start to solubilize (Tyler 1996) The
relationship between richness and altitude was more complex in
the study area reflecting interactions between climatic variables
At high altitudes richness was lower due to low winter tempera-
tures irrespective of the amount of precipitation whereas at
lower altitudes richness increased with precipitation
The most species-rich treeless vegetation corresponded to
tall-grass meadow steppe occurring at altitudes slightly above
500 m which still have comparatively warm winters but higher
precipitation than dry lowlands The poorest treeless vegetation
was tundra occurring in areas with pronounced winter frosts and
high precipitation which causes soil leaching and acidification
The richest forest vegetation occurred in areas where precipita-
tion was not too high to cause pronounced soil leaching and not
too low to exclude mesic forest species Such habitats supported
either Pinus sylvestris hemiboreal forest or Abies sibirica wet taiga
on footslopes and valley bottoms The poorest forest was dark
taiga with Pinus sibirica Abies sibirica or Picea obovata occurring
on low-pH soils in precipitation-rich areas
Unimodal pHndashrichness relationship in treeless vegetation
A positive richnessndashpH relationship has been more frequently
reported from the temperate boreal and arctic zones than has a
negative one (Paumlrtel 2002) In more detail the sign and shape of
this relationship depends on vegetation types (Chytry et al
2003 Schuster amp Diekmann 2003) The relationship tends to
be positive in vegetation types that grow predominantly on
acidic to neutral soils eg in forests and tundra In contrast
treeless vegetation on neutral to base-rich soils tends to have a
non-significant or negative richnessndashpH relationship
Our study provides a finer and more complete picture than
most others because it covers nearly the whole range of soil pH
compatible with plant life The existence of upper and lower
physiological limits to plant growth on the pH gradient implies
that the relationship is inherently unimodal This is reported by
some studies covering broad ranges of pH values especially
in grasslands (eg Tyler 2000 Loumlbel et al 2006) and mires (eg
Glaser et al 1990) We found a pronounced unimodal richnessndash
pH relationship in treeless vegetation but not in forests
Within treeless vegetation tundra occurred on low-pH soils
in precipitation-rich areas and steppe on high-pH soils in
precipitation-poor areas After splitting these two vegetation
types the former showed a positive linear relationship to soil pH
and the latter showed a negative linear relationship The positive
relationship in the southern Siberian alpine tundra is consistent
with a number of earlier studies from the arctic tundra where
increasing pH was identified as one of the major factors enhancing
species richness (Gough et al 2000 Walker et al 2001 van der
Welle et al 2003) In contrast steppe vegetation which occurred
on soils with pH 59ndash86 exhibited a weak yet significant negative
linear relationship between richness and pH This relationship
appears to be consistent with earlier studies from North
American prairies (Palmer et al 2003) Our data suggest that the
decreasing species richness of steppe vegetation on high-pH soils
could be caused by climatic stress instead of or in addition to the
physiological effect of high pH The highest pH values are found
in the driest soils with strongly limited or no cation leaching
(Fig 1) However these habitats experience not only pronounced
summer droughts but also strong winter frosts without protective
snow cover As most species of the study area are not adapted to
such harsh conditions the negative richnessndashpH correlation
appears The richest vegetation occurs where soil is not too dry
and not too acidic at the same time Our data suggest that for the
treeless vegetation of the study area it is at pH 6ndash7
The putative role of drought stress in limiting species richness
on high-pH soils is supported by the comparison with richnessndash
pH relationships reported for wetlands and mires In these
habitats high pH is usually due to cation saturation from
mineral springs and it is not associated with drought stress
In such environments species richness often increases up to pH
7 or even beyond (Glaser et al 1990 Haacutejkovaacute amp Haacutejek 2003
Guumlsewell et al 2005) However no base-rich wetlands or mires
were included in the current study because they are very rare in
the study area
Positive pHndashrichness relationship in forests
Unlike in treeless vegetation the richnessndashpH relationship in forests
is mostly reported as monotonic positive (Dupreacute et al 2002
Schuster amp Diekmann 2003) while unimodal relationships
M Chytryen et al
copy 2007 The Authors676 Global Ecology and Biogeography 16 668ndash678 Journal compilation copy 2007 Blackwell Publishing Ltd
are rare and negative relationships are exceptional The latter are
usually attributed to the confounding effects of factors other
than pH (Dupreacute et al 2002) Species richness in forests usually
increases steeply in acidic soils but the curve becomes less steep
above pH 55 and often levels off at a pH value close to 70 A
positive relationship is documented both from deciduous forests
of Europe (eg Brunet et al 1997 Dumortier et al 2002 Chytryet al 2003 Wohlgemuth amp Gigon 2003 Coudun amp Geacutegout
2005 Schuster amp Diekmann 2005) and North America (eg Peet
amp Christensen 1980 Brosofske et al 2001 Peet et al 2003) and
from coniferous forests in both continents (Rey Benayas 1995
Brosofske et al 2001 Zinko et al 2006) Palmer et al (2003)
pointed to the contrasting pHndashrichness relationships in Oklahoma
forests and prairies positive in the former and negative in the
latter The same pattern based on entirely different species pools
was found in forests and steppes in our study area (Fig 2)
We hypothesize that the predominance of the positive richnessndash
pH relationship in forests mainly results from the truncated pH
gradient at its base-rich end (Fig 5) There are two reasons for
this truncation First forest cannot grow at extremely dry sites
that only support grassland but these sites tend to have the
highest pH at least in the semi-arid areas such as forest-steppe
Second productive vegetation with trees tends to decrease soil
pH (Fig 1 Tyler 2003) Truncation of the pH gradient in forests
is also apparent in the meta-analysis of German case studies
(Schuster amp Diekmann 2003) where grasslands were often
recorded on soils with pH 7ndash8 but very few studies reported
forests on soils with pH gt 7 Because the truncation removes
habitats where species pool sizes have already started to decrease
due to drought stress most richnessndashpH relationships reported
in the literature from forests are monotonic positive Besides this
main explanation we suggest two other mechanisms that can
explain why the richnessndashpH curve of forest vegetation does not
usually decrease at high-pH conditions (Fig 5) First the species
richness of forests on soils with pH values of about 7 can be
partly increased by the mass effect at the forest-steppe ecotone
Forests on such soils which are usually rather dry contain
several species typical of adjacent dry grasslands These light-
demanding species find a suitable habitat under the open canopy
formed by pine or larch In contrast no such mass effect can
enhance the species richness of grasslands at pH 75ndash85 because
there are no sufficiently large species pools of other vegetation
types available for this pH range in the study area Second in dry
areas such as the forest-steppe zone the forest canopy maintains
higher air humidity in the understorey than in treeless habitats
(Moore et al 2000) Therefore forest richness may not be so
much limited by drought stress as is steppe richness on soils with
pH values of about 70ndash75
Species pools and the Pleistocene bottleneck
The species pool hypothesis predicts that the species richness of
particular habitats is correlated with the historical habitat com-
monness and associated opportunities for species accumulation
over evolutionary time (ie speciation minus extinction Aarssen
amp Schamp 2002) Over most of todayrsquos temperate zone of Eurasia
the Pleistocene climate was not only cool but was also dry (Frenzel
et al 1992) Such a climate supported the development of dry
calcium-rich soils over vast areas of cold steppe the habitat of
large Pleistocene herbivores (Guthrie 2001 Walker et al 2001)
Patches of coniferous forests also occurred in some areas mainly
in the mountains and wet lowland sites they have been recon-
structed from the full-glacial fossil data both from the Russianndash
Mongolian border area (Tarasov et al 2000) and from central
Europe (Willis et al 2000 Jankovskaacute et al 2002) Tundra was
confined to places with higher precipitation or lower evapotran-
spiration eg in the mountains or at non-glaciated higher latitudes
often in the close vicinity of steppe (Tarasov et al 2000)
The present-day landscape in some parts of southern Siberia
and Mongolia is probably the closest modern analogy to the
Pleistocene environments that existed in the non-glaciated part
of northern Eurasia It has to be pointed out that modern
analogies are never perfect Predictions based on analogies must
not be taken too seriously until there is independent and reliable
fossil evidence However if modern analogies exist they may
Figure 5 Conceptual model of species richness in treeless vegetation and forests across the combined gradient of decreasing precipitation and increasing pH On low-pH soils in precipitation-rich areas pools of species adapted to toxic effects of Al3+ and H+ ions are limited and species richness is low With decreasing precipitation and increasing pH richness first increases but subsequently decreases because of a limited pool of species adapted to very dry conditions In contrast forest richness does not decrease or decreases only slightly in precipitation-poor areas for the following reasons (1) forests do not occur in the driest areas so the extreme end of the precipitationndashpH gradient is truncated (2) forests occurring on their ecological limit have an open canopy and their herb layer is saturated by steppe species pools and (3) the protective effect of forest canopy maintains higher air humidity and reduces drought stress
Species richness pH and climate in southern Siberia
copy 2007 The Authors Global Ecology and Biogeography 16 668ndash678 Journal compilation copy 2007 Blackwell Publishing Ltd 677
provide valuable insights and enhance our understanding of
ecological patterns and processes in the past environments
The current study included vegetation types with the same
leading species as reconstructed from the full-glacial central
Europe (Willis et al 2000 Jankovskaacute et al 2002) and parts of
the study area had a climate corresponding to the cool periods
of the Pleistocene (Frenzel et al 1992) In southern Siberia the
richest vegetation is found on soils with a pH of 6ndash7 (Fig 2)
which are associated with moderate precipitation (Fig 1) If the
modern species richness of different habitats resulted from
speciation and extinction in the historically prevailing environ-
ments (species pool effects Aarssen amp Schamp 2002 Paumlrtel
2002 Ewald 2003) this pattern would suggest that such slightly
acidic to neutral soils were common in the pre-Holocene
environments of temperate Eurasia In contrast very dry calcium-
rich steppe or wet acidic tundra probably never supported
species-rich vegetation
Increasing precipitation in the Holocene especially in
areas with an oceanic climate caused large-scale soil acidification
(Roberts 1998) The species-pool hypothesis predicts that todayrsquos
acidic soils although prevailing in large areas are poor in species
because of the lack of calcifuge species which may have become
largely extinct during the Pleistocene (Ewald 2003) Such acidified
habitats are represented in the wetter parts of the study area by
taiga forests (in warmer climate) or by tundra (in cooler climate)
Both of these habitats are generally species poor but exhibit
positive richnessndashpH relationships for which the species pool
hypothesis provides a plausible explanation
ACKNOWLEDGEMENTS
We thank the local staff of our expeditions for their extensive
support during the fieldwork and two anonymous referees
for useful comments on the previous version of this paper
This research was supported from projects IAA6163303 from
the Grant Agency of the Academy of Sciences of the Czech
Republic and long-term research plans MSM0021622416 and
AVOZ60050516
REFERENCES
Aarssen LW amp Schamp BS (2002) Predicting distributions of
species richness and species sizes in regional floras applying the
species pool hypothesis to the habitat templet model Perspec-
tives in Plant Ecology Evolution and Systematics 5 3ndash12
Berglund BE Birks HJB Ralska-Jasiewiczowa M amp
Wright HE (1996) Palaeoecological events during the last
15000 years John Wiley amp Sons Chichester
Breiman L Friedman JH Olshen RA amp Stone CG (1984)
Classification and regression trees Wadsworth International
Group Belmont CA
Brosofske KD Chen J amp Crow TR (2001) Understory vegeta-
tion and site factors implications for a managed Wisconsin
landscape Forest Ecology and Management 146 75ndash87
Brunet J Falkengren-Grerup U Ruumlhling A amp Tyler G (1997)
Regional differences in floristic change in South Swedish oak
forests as related to soil chemistry and land use Journal of
Vegetation Science 8 329ndash336
Chytry M Tichy L amp Roleccedilek J (2003) Local and regional pat-
terns of species richness in Central European vegetation types
along the pHcalcium gradient Folia Geobotanica 38 429ndash
442
Coudun C amp Geacutegout J-C (2005) Ecological behaviour of
herbaceous forest species along a pH gradient a comparison
between oceanic and semicontinental regions in northern
France Global Ecology and Biogeography 14 263ndash270
Dumortier M Butaye J Jacquemyn H Van Camp N Lust N
amp Hermy M (2002) Predicting vascular plant species richness
of fragmented forests in agricultural landscapes in central
Belgium Forest Ecology and Management 158 85ndash102
Dupreacute C Wessberg C amp Diekmann M (2002) Species richness
in deciduous forests Effects of species pools and environmental
variables Journal of Vegetation Science 13 505ndash516
Ermakov N Dring J amp Rodwell J (2000) Classification of con-
tinental hemiboreal forests of North Asia Braun-Blanquetia
28 1ndash131
Ewald J (2003) The calcareous riddle why are there so many
calciphilous species in the Central European flora Folia
Geobotanica 38 357ndash366
Finzi AC Canham CD amp van Breemen N (1998) Canopy
treendashsoil interactions within temperate forests species effects
on pH and cations Ecological Applications 8 447ndash454
Frenzel B Peacutecsi M amp Velichko AA (eds) (1992) Atlas of
paleoclimates and paleoenvironments of the Northern
Hemisphere Geographical Research Institute Budapest amp
Gustav Fischer Verlag Stuttgart
Gidrometeoizdat (1966ndash1970) Spravochnik po klimatu SSSR
[Reference books on the climate of the USSR] Gidrometeoizdat
Leningrad
Gigon A (1987) A hierarchic approach in causal ecosystem
analysis the calcifuge-calcicole problem in alpine grasslands
Ecological Studies 61 228ndash244
Glaser PH Janssens JA amp Siegel DI (1990) The response of
vegetation to chemical and hydrological gradients in the Lost
River peatland northern Minnesota Journal of Ecology 78
1021ndash1048
Gough L Shaver GR Carroll J Royer DL amp Laundre JA
(2000) Vascular plant species richness in Alaskan arctic tundra
the importance of soil pH Journal of Ecology 88 54ndash66
Grubb PJ (1987) Global trends in species-richness in terrestrial
vegetation a view from the northern hemisphere Organiza-
tion of communities past and present (ed by JHR Gee and PS
Giller) pp 99ndash118 Blackwell Science Oxford
Guumlsewell S Bailey KM Roem WJ amp Bedford BL (2005)
Nutrient limitation and botanical diversity in wetlands can
fertilisation raise species richness Oikos 109 71ndash80
Guthrie RD (2001) Origin and causes of the mammoth steppe
a story of cloud cover woolly mammal tooth pits buckles
and inside-out Beringia Quaternary Science Reviews 20 549ndash
574
Haacutejkovaacute P amp Haacutejek M (2003) Species richness and above-
ground biomass of poor and calcareous spring fens in the
M Chytryen et al
copy 2007 The Authors678 Global Ecology and Biogeography 16 668ndash678 Journal compilation copy 2007 Blackwell Publishing Ltd
flysch West Carpathians and their relationships to water and
soil chemistry Preslia 75 271ndash287
Hilbig W (1995) The vegetation of Mongolia SPB Academic
Publishing Amsterdam
Jankovskaacute V Chromy P amp Niznianskaacute M (2002) Iacuteafaacuterka mdash
first palaeobotanical data of the character of Last Glacial
vegetation and landscape in the West Carpathians (Slovakia)
Acta Palaeobotanica 42 39ndash50
Loumlbel S Dengler J amp Hobohm C (2006) Species richness of
vascular plants bryophytes and lichens in dry grasslands the
effects of environment landscape structure and competition
Folia Geobotanica 41 377ndash393
Meusel H Jaumlger EJ Weinert E amp Rauschert S (1965ndash1992)
Vergleichende Chorologie der zentraleuropaumlischen Flora IndashIII
Gustav Fischer Verlag Jena
Moore KE Fitzjarrald DR Sakai RK amp Freedman JM
(2000) Growing season water balance at a boreal jack pine
forest Water Resources Research 36 483ndash493
Ovington JD (1953) Studies of the development of woodland
conditions under different trees I Soil pH Journal of Ecology
4113ndash52
Palmer MW Areacutevalo JR del Carmen Cobo M amp Earls PG
(2003) Species richness and soil reaction in a northeastern
Oklahoma landscape Folia Geobotanica 38 381ndash389
Paumlrtel M (2002) Local plant diversity patterns and evolutionary
history at the regional scale Ecology 83 2361ndash2366
Peet RK amp Christensen NL (1980) Hardwood forest vegeta-
tion of the North Carolina piedmont Veroumlffentlichungen des
Geobotanischen Institutes ETH Stiftung Ruumlbel Zuumlrich 69 14ndash
39
Peet RK Fridley JD amp Gramling JM (2003) Variation in
species richness and species pool size across a pH gradient
in forests of the southern Blue Ridge Mountains Folia
Geobotanica 38 391ndash401
Polikarpov NP Chebakova NM amp Nazimova DI (1986)
Klimat i gornye lesa Sibiri [Climate and mountain forests of
Siberia] Nauka Novosibirsk
Rey Benayas JM (1995) Patterns of diversity in the strata of
boreal montane forest in British Columbia Journal of Vegeta-
tion Science 6 95ndash98
Roberts N (1998) The Holocene an environmental history 2nd
edn Blackwell Science Oxford
Schuster B amp Diekmann M (2003) Changes in species density
along the soil pH gradient mdash evidence from German plant
communities Folia Geobotanica 38 367ndash379
Schuster B amp Diekmann M (2005) Species richness and
environmental correlates in deciduous forests of Northwest
Germany Forest Ecology and Management 206 197ndash205
Sjoumlrs H (1952) On the relation between vegetation and electrolytes
in north Swedish mire waters Oikos 2 241ndash258
Tarasov PE Volkova VS Webb T III Guiot J Andreev AA
Bezusko LG Bezusko TV Bykova GV Dorofeyuk NI
Kvavadze EV Osipova IM Panova NK amp Sevastyanov DV
(2000) Last glacial maximum biomes reconstructed from
pollen and plant macrofossil data from northern Eurasia
Journal of Biogeography 27 609ndash620
Taylor DR Aarssen LW amp Loehle C (1990) On the relationship
between rK selection and environmental carrying capacity
a new habitat templet for plant life history strategies Oikos 58
239ndash250
Tyler G (1996) Soil chemistry and plant distributions in rock
habitats of southern Sweden Nordic Journal of Botany 16
609ndash635
Tyler G (2000) Integrated analysis of conditions accounting
for intersite distribution of grassland plants Nordic Journal of
Botany 20 485ndash500
Tyler G (2003) Some ecophysiological and historical approaches
to species richness and calcicolecalcifuge behaviour mdash
contribution to a debate Folia Geobotanica 38 419ndash428
van der Welle MEW Vermeulen PJ Shaver GR amp Berendse F
(2003) Factors determining plant species richness in Alaskan
arctic tundra Journal of Vegetation Science 14 711ndash720
Vitt DH (2000) Peatlands ecosystems dominated by bryophytes
Bryophyte biology (ed by AJ Shaw and B Goffinet) pp 312ndash
343 Cambridge University Press Cambridge
Vonlanthen CM Kammer PM Eugster W Buumlhler A amp
Veit H (2006) Alpine vascular plant species richness the
importance of daily maximum temperature and pH Plant
Ecology 184 13ndash25
Walker DA Bockheim JG Chapin FS III Eugster W
Nelson FE amp Ping CL (2001) Calcium-rich tundra wildlife
and the lsquoMammoth Steppersquo Quaternary Science Reviews 20
149ndash163
Willis KJ Rudner E amp Suumlmegi P (2000) The full-glacial forests
of central and southeastern Europe Quaternary Research 53
203ndash213
Wohlgemuth T amp Gigon A (2003) Calcicole plant diversity in
Switzerland may reflect a variety of habitat templets Folia
Geobotanica 38 443ndash452
Zinko U Dynesius M Nilsson C amp Seibert J (2006) The role
of soil pH in linking groundwater flow and plant species
density in boreal forest landscapes Ecography 29 515ndash524
Editor Martin Sykes
BIOSKETCH
Milan Chytry is an associate professor of botany in the
Department of Botany and Zoology Masaryk University
Brno Czech Republic His research as well as research
by the co-authors is focused on vegetation ecology and
large-scale diversity patterns of multi-species assemblages
of vascular plants

M Chytryen et al
copy 2007 The Authors672 Global Ecology and Biogeography 16 668ndash678 Journal compilation copy 2007 Blackwell Publishing Ltd
its contribution stemming both from the variablersquos role as a
primary splitter of a node and its role as a surrogate to any of
the primary splitters
RESULTS
PCA revealed groups of related environmental variables (Table 2)
The main complex environmental gradient associated with PCA
axis 1 is that of decreasing precipitation and increasing soil
pH The second most important gradient (axis 2) is related to
decreasing altitude and increasing winter temperature the third
gradient (axis 3) to slope steepness and associated variables such
as soil depth and site insolation and the fourth gradient (axis 4)
to canopy closure and light availability above the herb layer An
important relationship revealed by PCA axis 1 is the strong nega-
tive correlation of pH with precipitation this trend is consistent
in both treeless vegetation and forests although the mean pH is
lower in the latter (Fig 1) Another remarkable relationship
revealed by PCA is that precipitation is not correlated with winter
temperature While winter temperature generally decreases with
increasing altitude precipitation in both winter and summer is
to a large extent determined by the position on the windward or
leeward side of the main mountain ranges although at local scale
it also tends to increase with altitude
Univariate regressions of species richness on pH revealed a
positive relationship for both treeless and forest vegetation
(Table 3) In the treeless vegetation pH explained only 25 of
variation in species richness in linear regression but after adding
the quadratic term the variation explained increased to 170
indicating unimodal richnessndashpH relationship with a peak at pH
64 In tundra vegetation which occurred in the pH range of
38ndash61 (minus74) there was a positive linear relationship between
richness and pH that explained 130 of variation (Fig 2a)
However in steppe vegetation which occurred in the pH range
of 59ndash81 (minus86) the linear relationship was negative In forests
variation explained by the linear regression was considerably
higher than in treeless vegetation (258) but it was improved
only to 281 after adding the quadratic term (although the
quadratic model improved the model significantly P lt 005)
The curve of the quadratic relationship was upward convex with
an indistinct peak occurring at pH 72 which did not provide
reliable support for the existence of the unimodal richnessndashpH
Table 2 Coordinates of environmental variables on axes 1ndash4 of the PCA calculated from a matrix of vegetation plots times environmental variables As PCA was based on the correlation matrix the coordinates are identical with the correlations between PCA axes and environmental variables Coordinates ge |060| are set in bold
PCA axis 1 2 3 4
Percentage variation explained 345 188 154 99
Altitude minus049 minus080 011 minus001
July temperature 078 052 minus013 006
January temperature minus013 087 minus039 minus014
Summer precipitation minus090 018 minus010 minus027
Winter precipitation minus088 024 minus018 minus025
Radiation above canopy 030 minus027 minus063 minus049
Radiation below canopy 059 minus028 minus001 minus060
Slope inclination minus009 038 077 minus006
Soil depth 013 minus013 minus062 052
Soil pH 088 minus002 015 minus004
Soil conductivity 031 006 022 minus023
Figure 1 The relationship between pH and summer precipitation in the study area Precipitation values were predicted by the climatic model and soil pH(H20) was measured in vegetation plots Treeless vegetation = 0633 forests = 0325 The slopes of the two regression lines are significant (P lt 0001) but do not differ significantly from each other at P lt 005 The difference in intercept between them is significant (P lt 0001) Values of pH also decrease significantly with winter precipitation at P lt 0001 (not shown treeless vegetation
= 0594 forests = 0332)
Radj2 Radj
2
Radj2 Radj
2
Species richness pH and climate in southern Siberia
copy 2007 The Authors Global Ecology and Biogeography 16 668ndash678 Journal compilation copy 2007 Blackwell Publishing Ltd 673
relationship in forests After splitting the forest data set into
taiga and hemiboreal forests (Fig 2b) a positive relationship
only remained in the more acidic taiga (pH 37ndash69) while no
relationship was detected in the base-rich hemiboreal forests
(pH 52ndash78)
Regression trees were constructed separately for treeless and
forest vegetation In both of them January temperature altitude
and pH were the most important predictors of species richness
(Table 4) For treeless vegetation the optimal regression tree with
the lowest cross-validation cost had seven terminal nodes (Fig 3)
This tree explained 561 of variation in species richness In the
first node the tree split based on mean January temperature
predicting lower species numbers in areas with January means
below minus21 degC and at altitudes above 532 m In low-altitude areas
with warmer winters species richness increased with altitude ie
with precipitation The highest richness was found at altitudes
slightly above 500 m and summer precipitation above 479 mm
Table 3 Standardized regression coefficients (beta) variation explained ( ) and significances (P) of the linear and quadratic regression models of the relationship between species richness and pH for different subsets of vegetation plots Quadratic regressions were not considered for tundra steppe taiga and hemiboreal forests
beta-pH beta-(pH)2 P
Treeless vegetation
both types linear regression 017 mdash 0025 0025
both types quadratic regression 394 minus380 0170 lt 0001
tundra 036 mdash 0130 0022
steppe minus031 mdash 0091 lt 0001
Forests
both types linear regression 052 mdash 0258 lt 0001
both types quadratic regression 236 minus185 0281 lt 0001
taiga 044 mdash 0170 lt 0001
hemiboreal forests 009 mdash 00 0525
Radj
2
Radj
2
Figure 3 Regression tree for species richness of treeless vegetation Numbers at each node indicate the mean number of vascular plant species per 100 m2 plusmn standard deviation and number of plots assigned to that node The primary splitter variable and its split value at each node is given in bold Surrogates ie variables that allocate most cases to the identical group as the primary splitter are given in smaller letters below the primary splitter
Figure 2 Relationships between number of vascular plant species per 100 m2 and pH See Table 3 for regression coefficients The slope of the regression line was not significant for hemiboreal forests therefore the line was not fitted
M Chytryen et al
copy 2007 The Authors674 Global Ecology and Biogeography 16 668ndash678 Journal compilation copy 2007 Blackwell Publishing Ltd
grassland vegetation occurring there included mostly tall-grass
meadow steppes containing on average over 50 species per 100
m2 In the branch of the tree with low January temperatures
the most important predictor of species richness was pH It
discriminated between very poor tundra vegetation on soils with
pH lt 50 and richer vegetation of both tundra and steppe on
more base-rich soils In the latter the poorest vegetation was the
cold short-grass steppe on the flat bottoms of large basins while
mountain steppe and tundra vegetation was richer The latter
types of mountain grasslands were poorer at medium altitudes
(594ndash832 m) where forest forms the landscape matrix and treeless
vegetation mostly occurs in smaller patches surrounded by forest
The optimal regression tree for forest vegetation had only
three terminal nodes (Fig 4) First it separated species-poor dark
taiga forests on acidic soils with pH lt 50 from richer forests on
more base-rich soils Low pH was weakly related to higher summer
precipitation The group of species-richer forests on high-pH
soils was further divided into two subgroups The poorer sub-
group at altitudes above 882 m with low winter temperatures
and low summer precipitation contained ultracontinental
forests of L sibirica and P sibirica The richer subgroup at lower
altitudes with warmer winters and higher summer rainfall
included hemiboreal forests and wet Abies sibirica taiga this
subgroup included the richest forests of the Western Sayan
containing on average 37 species per 100 m2 This regression tree
explained 412 of variation in species richness For com-
parison we fitted a multiple least-square regression model with
the two predictors used as primary splitters in this tree pH and
altitude This model explained only 380 of variation
Higher mean local species richness in steppe and hemiboreal
forests than in tundra and taiga revealed by the regression trees
corresponded to the relative size of species pools for these forma-
tions The relative size of the species pools was estimated as the total
number of all species occurring in 39 plots selected randomly
from each of these formations These relative estimations yielded
305 species for steppe 223 for tundra 303 for hemiboreal forests
and 212 for taiga (means of 10 random selections)
DISCUSSION
The relationship between pH precipitation and species richness
The study area contains bedrocks of varying base status and soils
of different type and depth Yet soil pH was shown to depend
predominantly on precipitation summer precipitation explained
633 of variation in soil pH in sites with treeless vegetation (Fig 1)
Such an amount of variation explicable by a single predictor
variable is surprisingly large given that the precipitation model
used included inaccuracies due to a sparse network of climate
stations In addition the moisture status of particular sites
depends not only on precipitation but also on the topographic
position on the valley bottom or the ridge slope aspect inclination
and soil properties The strong pHndashprecipitation relationship
suggests that on the transition between arid continental and
more humid landscapes the intensity of leaching of basic cations
from soils is crucial for maintaining high or low pH
In forests mean pH was significantly lower than in treeless
vegetation (Fig 1) This partly reflects the fact that in forest-
Treeless vegetation Forests
Variable
Relative
importance Variable
Relative
importance
January temperature 100 Altitude 100
Altitude 821 January temperature 976
Soil pH 723 Soil pH 949
Winter precipitation 618 July temperature 777
Slope inclination 593 Soil conductivity 771
Summer precipitation 569 Summer precipitation 617
Soil conductivity 488 Winter precipitation 462
July temperature 447 Soil depth 196
Soil depth 297 Slope inclination 170
Radiation 160 Radiation above canopy 155
Radiation below canopy 142
Table 4 Ranked values of the relative importance of explanatory variables of the optimal regression trees for treeless and forest vegetation The values reflect the contribution each explanatory variable makes in explaining the variation in species richness with its contribution stemming both from the variablersquos role as a primary splitter of a node and its role as a surrogate to any of the primary splitters The variable with the highest relative importance is scored as 100 in each regression tree
Figure 4 Regression tree for species richness of forests See Fig 3 for a detailed explanation At the first node the best surrogate summer precipitation had only 30 similarity to the primary splitter
Species richness pH and climate in southern Siberia
copy 2007 The Authors Global Ecology and Biogeography 16 668ndash678 Journal compilation copy 2007 Blackwell Publishing Ltd 675
steppe landscapes forest grows in moister places with a higher
intensity of leaching than steppe vegetation However as forest
soils are more acidic than non-forest soils in the precipitation-
rich areas as well more intensive acidification processes probably
occur in forest soils These may result from (1) higher moisture
status and more intensive soil leaching under the forest canopy
which decreases evaporation (2) larger uptake of bases and their
replacement by H+ cations in the more productive forest vegeta-
tion (3) higher abundance of mosses contributing to acidifica-
tion (Vitt 2000) or (4) inputs of organic acids from conifer litter
(Ovington 1953 Finzi et al 1998) A much lower variation in
pH explained by summer precipitation for forest sites (332)
than for treeless sites (633) is another indication of a stronger
effect of vegetation on soil pH in forests than in open landscape
In both treeless and forest vegetation the best correlates of
species richness were January temperature pH and altitude (Figs 3
and 4 Table 4) Climatic variables such as summer temperatures
and precipitation were correlated with them (Table 2) Other
measured variables were either correlated with these variables or
weakly related to the species richness pattern (Tables 2 amp 4) This
corresponds to the alpine vegetation of the Alps where species
richness is mainly determined by the joint effects of temperature
and pH while other variables are less important (Vonlanthen
et al 2006) In the continental climate of the study area with its
very cold winters frost can be an important ecological factor
limiting plant life especially in combination with low winter
precipitation and shallow or discontinuous snow cover Actually
areas with the strongest winter frosts had the species-poorest
vegetation Both treeless and forest vegetation were consistently
poorer on soils with pH lt 50 which corresponds to the value
where toxic Al3+ cations start to solubilize (Tyler 1996) The
relationship between richness and altitude was more complex in
the study area reflecting interactions between climatic variables
At high altitudes richness was lower due to low winter tempera-
tures irrespective of the amount of precipitation whereas at
lower altitudes richness increased with precipitation
The most species-rich treeless vegetation corresponded to
tall-grass meadow steppe occurring at altitudes slightly above
500 m which still have comparatively warm winters but higher
precipitation than dry lowlands The poorest treeless vegetation
was tundra occurring in areas with pronounced winter frosts and
high precipitation which causes soil leaching and acidification
The richest forest vegetation occurred in areas where precipita-
tion was not too high to cause pronounced soil leaching and not
too low to exclude mesic forest species Such habitats supported
either Pinus sylvestris hemiboreal forest or Abies sibirica wet taiga
on footslopes and valley bottoms The poorest forest was dark
taiga with Pinus sibirica Abies sibirica or Picea obovata occurring
on low-pH soils in precipitation-rich areas
Unimodal pHndashrichness relationship in treeless vegetation
A positive richnessndashpH relationship has been more frequently
reported from the temperate boreal and arctic zones than has a
negative one (Paumlrtel 2002) In more detail the sign and shape of
this relationship depends on vegetation types (Chytry et al
2003 Schuster amp Diekmann 2003) The relationship tends to
be positive in vegetation types that grow predominantly on
acidic to neutral soils eg in forests and tundra In contrast
treeless vegetation on neutral to base-rich soils tends to have a
non-significant or negative richnessndashpH relationship
Our study provides a finer and more complete picture than
most others because it covers nearly the whole range of soil pH
compatible with plant life The existence of upper and lower
physiological limits to plant growth on the pH gradient implies
that the relationship is inherently unimodal This is reported by
some studies covering broad ranges of pH values especially
in grasslands (eg Tyler 2000 Loumlbel et al 2006) and mires (eg
Glaser et al 1990) We found a pronounced unimodal richnessndash
pH relationship in treeless vegetation but not in forests
Within treeless vegetation tundra occurred on low-pH soils
in precipitation-rich areas and steppe on high-pH soils in
precipitation-poor areas After splitting these two vegetation
types the former showed a positive linear relationship to soil pH
and the latter showed a negative linear relationship The positive
relationship in the southern Siberian alpine tundra is consistent
with a number of earlier studies from the arctic tundra where
increasing pH was identified as one of the major factors enhancing
species richness (Gough et al 2000 Walker et al 2001 van der
Welle et al 2003) In contrast steppe vegetation which occurred
on soils with pH 59ndash86 exhibited a weak yet significant negative
linear relationship between richness and pH This relationship
appears to be consistent with earlier studies from North
American prairies (Palmer et al 2003) Our data suggest that the
decreasing species richness of steppe vegetation on high-pH soils
could be caused by climatic stress instead of or in addition to the
physiological effect of high pH The highest pH values are found
in the driest soils with strongly limited or no cation leaching
(Fig 1) However these habitats experience not only pronounced
summer droughts but also strong winter frosts without protective
snow cover As most species of the study area are not adapted to
such harsh conditions the negative richnessndashpH correlation
appears The richest vegetation occurs where soil is not too dry
and not too acidic at the same time Our data suggest that for the
treeless vegetation of the study area it is at pH 6ndash7
The putative role of drought stress in limiting species richness
on high-pH soils is supported by the comparison with richnessndash
pH relationships reported for wetlands and mires In these
habitats high pH is usually due to cation saturation from
mineral springs and it is not associated with drought stress
In such environments species richness often increases up to pH
7 or even beyond (Glaser et al 1990 Haacutejkovaacute amp Haacutejek 2003
Guumlsewell et al 2005) However no base-rich wetlands or mires
were included in the current study because they are very rare in
the study area
Positive pHndashrichness relationship in forests
Unlike in treeless vegetation the richnessndashpH relationship in forests
is mostly reported as monotonic positive (Dupreacute et al 2002
Schuster amp Diekmann 2003) while unimodal relationships
M Chytryen et al
copy 2007 The Authors676 Global Ecology and Biogeography 16 668ndash678 Journal compilation copy 2007 Blackwell Publishing Ltd
are rare and negative relationships are exceptional The latter are
usually attributed to the confounding effects of factors other
than pH (Dupreacute et al 2002) Species richness in forests usually
increases steeply in acidic soils but the curve becomes less steep
above pH 55 and often levels off at a pH value close to 70 A
positive relationship is documented both from deciduous forests
of Europe (eg Brunet et al 1997 Dumortier et al 2002 Chytryet al 2003 Wohlgemuth amp Gigon 2003 Coudun amp Geacutegout
2005 Schuster amp Diekmann 2005) and North America (eg Peet
amp Christensen 1980 Brosofske et al 2001 Peet et al 2003) and
from coniferous forests in both continents (Rey Benayas 1995
Brosofske et al 2001 Zinko et al 2006) Palmer et al (2003)
pointed to the contrasting pHndashrichness relationships in Oklahoma
forests and prairies positive in the former and negative in the
latter The same pattern based on entirely different species pools
was found in forests and steppes in our study area (Fig 2)
We hypothesize that the predominance of the positive richnessndash
pH relationship in forests mainly results from the truncated pH
gradient at its base-rich end (Fig 5) There are two reasons for
this truncation First forest cannot grow at extremely dry sites
that only support grassland but these sites tend to have the
highest pH at least in the semi-arid areas such as forest-steppe
Second productive vegetation with trees tends to decrease soil
pH (Fig 1 Tyler 2003) Truncation of the pH gradient in forests
is also apparent in the meta-analysis of German case studies
(Schuster amp Diekmann 2003) where grasslands were often
recorded on soils with pH 7ndash8 but very few studies reported
forests on soils with pH gt 7 Because the truncation removes
habitats where species pool sizes have already started to decrease
due to drought stress most richnessndashpH relationships reported
in the literature from forests are monotonic positive Besides this
main explanation we suggest two other mechanisms that can
explain why the richnessndashpH curve of forest vegetation does not
usually decrease at high-pH conditions (Fig 5) First the species
richness of forests on soils with pH values of about 7 can be
partly increased by the mass effect at the forest-steppe ecotone
Forests on such soils which are usually rather dry contain
several species typical of adjacent dry grasslands These light-
demanding species find a suitable habitat under the open canopy
formed by pine or larch In contrast no such mass effect can
enhance the species richness of grasslands at pH 75ndash85 because
there are no sufficiently large species pools of other vegetation
types available for this pH range in the study area Second in dry
areas such as the forest-steppe zone the forest canopy maintains
higher air humidity in the understorey than in treeless habitats
(Moore et al 2000) Therefore forest richness may not be so
much limited by drought stress as is steppe richness on soils with
pH values of about 70ndash75
Species pools and the Pleistocene bottleneck
The species pool hypothesis predicts that the species richness of
particular habitats is correlated with the historical habitat com-
monness and associated opportunities for species accumulation
over evolutionary time (ie speciation minus extinction Aarssen
amp Schamp 2002) Over most of todayrsquos temperate zone of Eurasia
the Pleistocene climate was not only cool but was also dry (Frenzel
et al 1992) Such a climate supported the development of dry
calcium-rich soils over vast areas of cold steppe the habitat of
large Pleistocene herbivores (Guthrie 2001 Walker et al 2001)
Patches of coniferous forests also occurred in some areas mainly
in the mountains and wet lowland sites they have been recon-
structed from the full-glacial fossil data both from the Russianndash
Mongolian border area (Tarasov et al 2000) and from central
Europe (Willis et al 2000 Jankovskaacute et al 2002) Tundra was
confined to places with higher precipitation or lower evapotran-
spiration eg in the mountains or at non-glaciated higher latitudes
often in the close vicinity of steppe (Tarasov et al 2000)
The present-day landscape in some parts of southern Siberia
and Mongolia is probably the closest modern analogy to the
Pleistocene environments that existed in the non-glaciated part
of northern Eurasia It has to be pointed out that modern
analogies are never perfect Predictions based on analogies must
not be taken too seriously until there is independent and reliable
fossil evidence However if modern analogies exist they may
Figure 5 Conceptual model of species richness in treeless vegetation and forests across the combined gradient of decreasing precipitation and increasing pH On low-pH soils in precipitation-rich areas pools of species adapted to toxic effects of Al3+ and H+ ions are limited and species richness is low With decreasing precipitation and increasing pH richness first increases but subsequently decreases because of a limited pool of species adapted to very dry conditions In contrast forest richness does not decrease or decreases only slightly in precipitation-poor areas for the following reasons (1) forests do not occur in the driest areas so the extreme end of the precipitationndashpH gradient is truncated (2) forests occurring on their ecological limit have an open canopy and their herb layer is saturated by steppe species pools and (3) the protective effect of forest canopy maintains higher air humidity and reduces drought stress
Species richness pH and climate in southern Siberia
copy 2007 The Authors Global Ecology and Biogeography 16 668ndash678 Journal compilation copy 2007 Blackwell Publishing Ltd 677
provide valuable insights and enhance our understanding of
ecological patterns and processes in the past environments
The current study included vegetation types with the same
leading species as reconstructed from the full-glacial central
Europe (Willis et al 2000 Jankovskaacute et al 2002) and parts of
the study area had a climate corresponding to the cool periods
of the Pleistocene (Frenzel et al 1992) In southern Siberia the
richest vegetation is found on soils with a pH of 6ndash7 (Fig 2)
which are associated with moderate precipitation (Fig 1) If the
modern species richness of different habitats resulted from
speciation and extinction in the historically prevailing environ-
ments (species pool effects Aarssen amp Schamp 2002 Paumlrtel
2002 Ewald 2003) this pattern would suggest that such slightly
acidic to neutral soils were common in the pre-Holocene
environments of temperate Eurasia In contrast very dry calcium-
rich steppe or wet acidic tundra probably never supported
species-rich vegetation
Increasing precipitation in the Holocene especially in
areas with an oceanic climate caused large-scale soil acidification
(Roberts 1998) The species-pool hypothesis predicts that todayrsquos
acidic soils although prevailing in large areas are poor in species
because of the lack of calcifuge species which may have become
largely extinct during the Pleistocene (Ewald 2003) Such acidified
habitats are represented in the wetter parts of the study area by
taiga forests (in warmer climate) or by tundra (in cooler climate)
Both of these habitats are generally species poor but exhibit
positive richnessndashpH relationships for which the species pool
hypothesis provides a plausible explanation
ACKNOWLEDGEMENTS
We thank the local staff of our expeditions for their extensive
support during the fieldwork and two anonymous referees
for useful comments on the previous version of this paper
This research was supported from projects IAA6163303 from
the Grant Agency of the Academy of Sciences of the Czech
Republic and long-term research plans MSM0021622416 and
AVOZ60050516
REFERENCES
Aarssen LW amp Schamp BS (2002) Predicting distributions of
species richness and species sizes in regional floras applying the
species pool hypothesis to the habitat templet model Perspec-
tives in Plant Ecology Evolution and Systematics 5 3ndash12
Berglund BE Birks HJB Ralska-Jasiewiczowa M amp
Wright HE (1996) Palaeoecological events during the last
15000 years John Wiley amp Sons Chichester
Breiman L Friedman JH Olshen RA amp Stone CG (1984)
Classification and regression trees Wadsworth International
Group Belmont CA
Brosofske KD Chen J amp Crow TR (2001) Understory vegeta-
tion and site factors implications for a managed Wisconsin
landscape Forest Ecology and Management 146 75ndash87
Brunet J Falkengren-Grerup U Ruumlhling A amp Tyler G (1997)
Regional differences in floristic change in South Swedish oak
forests as related to soil chemistry and land use Journal of
Vegetation Science 8 329ndash336
Chytry M Tichy L amp Roleccedilek J (2003) Local and regional pat-
terns of species richness in Central European vegetation types
along the pHcalcium gradient Folia Geobotanica 38 429ndash
442
Coudun C amp Geacutegout J-C (2005) Ecological behaviour of
herbaceous forest species along a pH gradient a comparison
between oceanic and semicontinental regions in northern
France Global Ecology and Biogeography 14 263ndash270
Dumortier M Butaye J Jacquemyn H Van Camp N Lust N
amp Hermy M (2002) Predicting vascular plant species richness
of fragmented forests in agricultural landscapes in central
Belgium Forest Ecology and Management 158 85ndash102
Dupreacute C Wessberg C amp Diekmann M (2002) Species richness
in deciduous forests Effects of species pools and environmental
variables Journal of Vegetation Science 13 505ndash516
Ermakov N Dring J amp Rodwell J (2000) Classification of con-
tinental hemiboreal forests of North Asia Braun-Blanquetia
28 1ndash131
Ewald J (2003) The calcareous riddle why are there so many
calciphilous species in the Central European flora Folia
Geobotanica 38 357ndash366
Finzi AC Canham CD amp van Breemen N (1998) Canopy
treendashsoil interactions within temperate forests species effects
on pH and cations Ecological Applications 8 447ndash454
Frenzel B Peacutecsi M amp Velichko AA (eds) (1992) Atlas of
paleoclimates and paleoenvironments of the Northern
Hemisphere Geographical Research Institute Budapest amp
Gustav Fischer Verlag Stuttgart
Gidrometeoizdat (1966ndash1970) Spravochnik po klimatu SSSR
[Reference books on the climate of the USSR] Gidrometeoizdat
Leningrad
Gigon A (1987) A hierarchic approach in causal ecosystem
analysis the calcifuge-calcicole problem in alpine grasslands
Ecological Studies 61 228ndash244
Glaser PH Janssens JA amp Siegel DI (1990) The response of
vegetation to chemical and hydrological gradients in the Lost
River peatland northern Minnesota Journal of Ecology 78
1021ndash1048
Gough L Shaver GR Carroll J Royer DL amp Laundre JA
(2000) Vascular plant species richness in Alaskan arctic tundra
the importance of soil pH Journal of Ecology 88 54ndash66
Grubb PJ (1987) Global trends in species-richness in terrestrial
vegetation a view from the northern hemisphere Organiza-
tion of communities past and present (ed by JHR Gee and PS
Giller) pp 99ndash118 Blackwell Science Oxford
Guumlsewell S Bailey KM Roem WJ amp Bedford BL (2005)
Nutrient limitation and botanical diversity in wetlands can
fertilisation raise species richness Oikos 109 71ndash80
Guthrie RD (2001) Origin and causes of the mammoth steppe
a story of cloud cover woolly mammal tooth pits buckles
and inside-out Beringia Quaternary Science Reviews 20 549ndash
574
Haacutejkovaacute P amp Haacutejek M (2003) Species richness and above-
ground biomass of poor and calcareous spring fens in the
M Chytryen et al
copy 2007 The Authors678 Global Ecology and Biogeography 16 668ndash678 Journal compilation copy 2007 Blackwell Publishing Ltd
flysch West Carpathians and their relationships to water and
soil chemistry Preslia 75 271ndash287
Hilbig W (1995) The vegetation of Mongolia SPB Academic
Publishing Amsterdam
Jankovskaacute V Chromy P amp Niznianskaacute M (2002) Iacuteafaacuterka mdash
first palaeobotanical data of the character of Last Glacial
vegetation and landscape in the West Carpathians (Slovakia)
Acta Palaeobotanica 42 39ndash50
Loumlbel S Dengler J amp Hobohm C (2006) Species richness of
vascular plants bryophytes and lichens in dry grasslands the
effects of environment landscape structure and competition
Folia Geobotanica 41 377ndash393
Meusel H Jaumlger EJ Weinert E amp Rauschert S (1965ndash1992)
Vergleichende Chorologie der zentraleuropaumlischen Flora IndashIII
Gustav Fischer Verlag Jena
Moore KE Fitzjarrald DR Sakai RK amp Freedman JM
(2000) Growing season water balance at a boreal jack pine
forest Water Resources Research 36 483ndash493
Ovington JD (1953) Studies of the development of woodland
conditions under different trees I Soil pH Journal of Ecology
4113ndash52
Palmer MW Areacutevalo JR del Carmen Cobo M amp Earls PG
(2003) Species richness and soil reaction in a northeastern
Oklahoma landscape Folia Geobotanica 38 381ndash389
Paumlrtel M (2002) Local plant diversity patterns and evolutionary
history at the regional scale Ecology 83 2361ndash2366
Peet RK amp Christensen NL (1980) Hardwood forest vegeta-
tion of the North Carolina piedmont Veroumlffentlichungen des
Geobotanischen Institutes ETH Stiftung Ruumlbel Zuumlrich 69 14ndash
39
Peet RK Fridley JD amp Gramling JM (2003) Variation in
species richness and species pool size across a pH gradient
in forests of the southern Blue Ridge Mountains Folia
Geobotanica 38 391ndash401
Polikarpov NP Chebakova NM amp Nazimova DI (1986)
Klimat i gornye lesa Sibiri [Climate and mountain forests of
Siberia] Nauka Novosibirsk
Rey Benayas JM (1995) Patterns of diversity in the strata of
boreal montane forest in British Columbia Journal of Vegeta-
tion Science 6 95ndash98
Roberts N (1998) The Holocene an environmental history 2nd
edn Blackwell Science Oxford
Schuster B amp Diekmann M (2003) Changes in species density
along the soil pH gradient mdash evidence from German plant
communities Folia Geobotanica 38 367ndash379
Schuster B amp Diekmann M (2005) Species richness and
environmental correlates in deciduous forests of Northwest
Germany Forest Ecology and Management 206 197ndash205
Sjoumlrs H (1952) On the relation between vegetation and electrolytes
in north Swedish mire waters Oikos 2 241ndash258
Tarasov PE Volkova VS Webb T III Guiot J Andreev AA
Bezusko LG Bezusko TV Bykova GV Dorofeyuk NI
Kvavadze EV Osipova IM Panova NK amp Sevastyanov DV
(2000) Last glacial maximum biomes reconstructed from
pollen and plant macrofossil data from northern Eurasia
Journal of Biogeography 27 609ndash620
Taylor DR Aarssen LW amp Loehle C (1990) On the relationship
between rK selection and environmental carrying capacity
a new habitat templet for plant life history strategies Oikos 58
239ndash250
Tyler G (1996) Soil chemistry and plant distributions in rock
habitats of southern Sweden Nordic Journal of Botany 16
609ndash635
Tyler G (2000) Integrated analysis of conditions accounting
for intersite distribution of grassland plants Nordic Journal of
Botany 20 485ndash500
Tyler G (2003) Some ecophysiological and historical approaches
to species richness and calcicolecalcifuge behaviour mdash
contribution to a debate Folia Geobotanica 38 419ndash428
van der Welle MEW Vermeulen PJ Shaver GR amp Berendse F
(2003) Factors determining plant species richness in Alaskan
arctic tundra Journal of Vegetation Science 14 711ndash720
Vitt DH (2000) Peatlands ecosystems dominated by bryophytes
Bryophyte biology (ed by AJ Shaw and B Goffinet) pp 312ndash
343 Cambridge University Press Cambridge
Vonlanthen CM Kammer PM Eugster W Buumlhler A amp
Veit H (2006) Alpine vascular plant species richness the
importance of daily maximum temperature and pH Plant
Ecology 184 13ndash25
Walker DA Bockheim JG Chapin FS III Eugster W
Nelson FE amp Ping CL (2001) Calcium-rich tundra wildlife
and the lsquoMammoth Steppersquo Quaternary Science Reviews 20
149ndash163
Willis KJ Rudner E amp Suumlmegi P (2000) The full-glacial forests
of central and southeastern Europe Quaternary Research 53
203ndash213
Wohlgemuth T amp Gigon A (2003) Calcicole plant diversity in
Switzerland may reflect a variety of habitat templets Folia
Geobotanica 38 443ndash452
Zinko U Dynesius M Nilsson C amp Seibert J (2006) The role
of soil pH in linking groundwater flow and plant species
density in boreal forest landscapes Ecography 29 515ndash524
Editor Martin Sykes
BIOSKETCH
Milan Chytry is an associate professor of botany in the
Department of Botany and Zoology Masaryk University
Brno Czech Republic His research as well as research
by the co-authors is focused on vegetation ecology and
large-scale diversity patterns of multi-species assemblages
of vascular plants
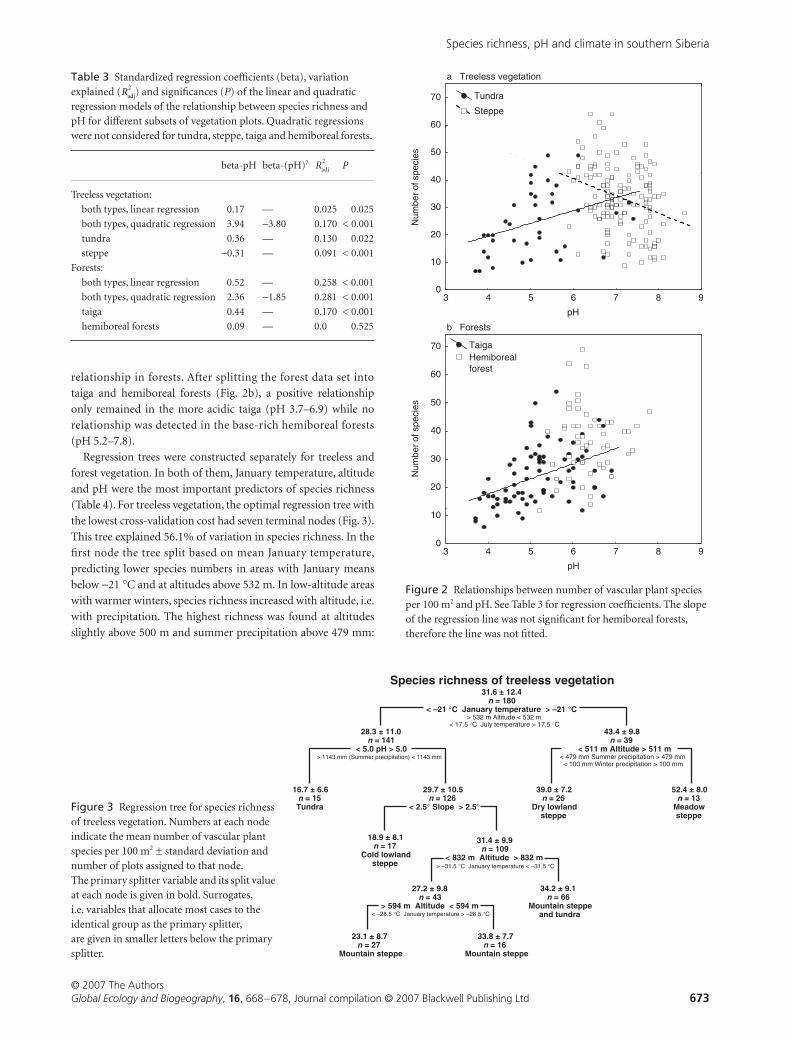
Species richness pH and climate in southern Siberia
copy 2007 The Authors Global Ecology and Biogeography 16 668ndash678 Journal compilation copy 2007 Blackwell Publishing Ltd 673
relationship in forests After splitting the forest data set into
taiga and hemiboreal forests (Fig 2b) a positive relationship
only remained in the more acidic taiga (pH 37ndash69) while no
relationship was detected in the base-rich hemiboreal forests
(pH 52ndash78)
Regression trees were constructed separately for treeless and
forest vegetation In both of them January temperature altitude
and pH were the most important predictors of species richness
(Table 4) For treeless vegetation the optimal regression tree with
the lowest cross-validation cost had seven terminal nodes (Fig 3)
This tree explained 561 of variation in species richness In the
first node the tree split based on mean January temperature
predicting lower species numbers in areas with January means
below minus21 degC and at altitudes above 532 m In low-altitude areas
with warmer winters species richness increased with altitude ie
with precipitation The highest richness was found at altitudes
slightly above 500 m and summer precipitation above 479 mm
Table 3 Standardized regression coefficients (beta) variation explained ( ) and significances (P) of the linear and quadratic regression models of the relationship between species richness and pH for different subsets of vegetation plots Quadratic regressions were not considered for tundra steppe taiga and hemiboreal forests
beta-pH beta-(pH)2 P
Treeless vegetation
both types linear regression 017 mdash 0025 0025
both types quadratic regression 394 minus380 0170 lt 0001
tundra 036 mdash 0130 0022
steppe minus031 mdash 0091 lt 0001
Forests
both types linear regression 052 mdash 0258 lt 0001
both types quadratic regression 236 minus185 0281 lt 0001
taiga 044 mdash 0170 lt 0001
hemiboreal forests 009 mdash 00 0525
Radj
2
Radj
2
Figure 3 Regression tree for species richness of treeless vegetation Numbers at each node indicate the mean number of vascular plant species per 100 m2 plusmn standard deviation and number of plots assigned to that node The primary splitter variable and its split value at each node is given in bold Surrogates ie variables that allocate most cases to the identical group as the primary splitter are given in smaller letters below the primary splitter
Figure 2 Relationships between number of vascular plant species per 100 m2 and pH See Table 3 for regression coefficients The slope of the regression line was not significant for hemiboreal forests therefore the line was not fitted
M Chytryen et al
copy 2007 The Authors674 Global Ecology and Biogeography 16 668ndash678 Journal compilation copy 2007 Blackwell Publishing Ltd
grassland vegetation occurring there included mostly tall-grass
meadow steppes containing on average over 50 species per 100
m2 In the branch of the tree with low January temperatures
the most important predictor of species richness was pH It
discriminated between very poor tundra vegetation on soils with
pH lt 50 and richer vegetation of both tundra and steppe on
more base-rich soils In the latter the poorest vegetation was the
cold short-grass steppe on the flat bottoms of large basins while
mountain steppe and tundra vegetation was richer The latter
types of mountain grasslands were poorer at medium altitudes
(594ndash832 m) where forest forms the landscape matrix and treeless
vegetation mostly occurs in smaller patches surrounded by forest
The optimal regression tree for forest vegetation had only
three terminal nodes (Fig 4) First it separated species-poor dark
taiga forests on acidic soils with pH lt 50 from richer forests on
more base-rich soils Low pH was weakly related to higher summer
precipitation The group of species-richer forests on high-pH
soils was further divided into two subgroups The poorer sub-
group at altitudes above 882 m with low winter temperatures
and low summer precipitation contained ultracontinental
forests of L sibirica and P sibirica The richer subgroup at lower
altitudes with warmer winters and higher summer rainfall
included hemiboreal forests and wet Abies sibirica taiga this
subgroup included the richest forests of the Western Sayan
containing on average 37 species per 100 m2 This regression tree
explained 412 of variation in species richness For com-
parison we fitted a multiple least-square regression model with
the two predictors used as primary splitters in this tree pH and
altitude This model explained only 380 of variation
Higher mean local species richness in steppe and hemiboreal
forests than in tundra and taiga revealed by the regression trees
corresponded to the relative size of species pools for these forma-
tions The relative size of the species pools was estimated as the total
number of all species occurring in 39 plots selected randomly
from each of these formations These relative estimations yielded
305 species for steppe 223 for tundra 303 for hemiboreal forests
and 212 for taiga (means of 10 random selections)
DISCUSSION
The relationship between pH precipitation and species richness
The study area contains bedrocks of varying base status and soils
of different type and depth Yet soil pH was shown to depend
predominantly on precipitation summer precipitation explained
633 of variation in soil pH in sites with treeless vegetation (Fig 1)
Such an amount of variation explicable by a single predictor
variable is surprisingly large given that the precipitation model
used included inaccuracies due to a sparse network of climate
stations In addition the moisture status of particular sites
depends not only on precipitation but also on the topographic
position on the valley bottom or the ridge slope aspect inclination
and soil properties The strong pHndashprecipitation relationship
suggests that on the transition between arid continental and
more humid landscapes the intensity of leaching of basic cations
from soils is crucial for maintaining high or low pH
In forests mean pH was significantly lower than in treeless
vegetation (Fig 1) This partly reflects the fact that in forest-
Treeless vegetation Forests
Variable
Relative
importance Variable
Relative
importance
January temperature 100 Altitude 100
Altitude 821 January temperature 976
Soil pH 723 Soil pH 949
Winter precipitation 618 July temperature 777
Slope inclination 593 Soil conductivity 771
Summer precipitation 569 Summer precipitation 617
Soil conductivity 488 Winter precipitation 462
July temperature 447 Soil depth 196
Soil depth 297 Slope inclination 170
Radiation 160 Radiation above canopy 155
Radiation below canopy 142
Table 4 Ranked values of the relative importance of explanatory variables of the optimal regression trees for treeless and forest vegetation The values reflect the contribution each explanatory variable makes in explaining the variation in species richness with its contribution stemming both from the variablersquos role as a primary splitter of a node and its role as a surrogate to any of the primary splitters The variable with the highest relative importance is scored as 100 in each regression tree
Figure 4 Regression tree for species richness of forests See Fig 3 for a detailed explanation At the first node the best surrogate summer precipitation had only 30 similarity to the primary splitter
Species richness pH and climate in southern Siberia
copy 2007 The Authors Global Ecology and Biogeography 16 668ndash678 Journal compilation copy 2007 Blackwell Publishing Ltd 675
steppe landscapes forest grows in moister places with a higher
intensity of leaching than steppe vegetation However as forest
soils are more acidic than non-forest soils in the precipitation-
rich areas as well more intensive acidification processes probably
occur in forest soils These may result from (1) higher moisture
status and more intensive soil leaching under the forest canopy
which decreases evaporation (2) larger uptake of bases and their
replacement by H+ cations in the more productive forest vegeta-
tion (3) higher abundance of mosses contributing to acidifica-
tion (Vitt 2000) or (4) inputs of organic acids from conifer litter
(Ovington 1953 Finzi et al 1998) A much lower variation in
pH explained by summer precipitation for forest sites (332)
than for treeless sites (633) is another indication of a stronger
effect of vegetation on soil pH in forests than in open landscape
In both treeless and forest vegetation the best correlates of
species richness were January temperature pH and altitude (Figs 3
and 4 Table 4) Climatic variables such as summer temperatures
and precipitation were correlated with them (Table 2) Other
measured variables were either correlated with these variables or
weakly related to the species richness pattern (Tables 2 amp 4) This
corresponds to the alpine vegetation of the Alps where species
richness is mainly determined by the joint effects of temperature
and pH while other variables are less important (Vonlanthen
et al 2006) In the continental climate of the study area with its
very cold winters frost can be an important ecological factor
limiting plant life especially in combination with low winter
precipitation and shallow or discontinuous snow cover Actually
areas with the strongest winter frosts had the species-poorest
vegetation Both treeless and forest vegetation were consistently
poorer on soils with pH lt 50 which corresponds to the value
where toxic Al3+ cations start to solubilize (Tyler 1996) The
relationship between richness and altitude was more complex in
the study area reflecting interactions between climatic variables
At high altitudes richness was lower due to low winter tempera-
tures irrespective of the amount of precipitation whereas at
lower altitudes richness increased with precipitation
The most species-rich treeless vegetation corresponded to
tall-grass meadow steppe occurring at altitudes slightly above
500 m which still have comparatively warm winters but higher
precipitation than dry lowlands The poorest treeless vegetation
was tundra occurring in areas with pronounced winter frosts and
high precipitation which causes soil leaching and acidification
The richest forest vegetation occurred in areas where precipita-
tion was not too high to cause pronounced soil leaching and not
too low to exclude mesic forest species Such habitats supported
either Pinus sylvestris hemiboreal forest or Abies sibirica wet taiga
on footslopes and valley bottoms The poorest forest was dark
taiga with Pinus sibirica Abies sibirica or Picea obovata occurring
on low-pH soils in precipitation-rich areas
Unimodal pHndashrichness relationship in treeless vegetation
A positive richnessndashpH relationship has been more frequently
reported from the temperate boreal and arctic zones than has a
negative one (Paumlrtel 2002) In more detail the sign and shape of
this relationship depends on vegetation types (Chytry et al
2003 Schuster amp Diekmann 2003) The relationship tends to
be positive in vegetation types that grow predominantly on
acidic to neutral soils eg in forests and tundra In contrast
treeless vegetation on neutral to base-rich soils tends to have a
non-significant or negative richnessndashpH relationship
Our study provides a finer and more complete picture than
most others because it covers nearly the whole range of soil pH
compatible with plant life The existence of upper and lower
physiological limits to plant growth on the pH gradient implies
that the relationship is inherently unimodal This is reported by
some studies covering broad ranges of pH values especially
in grasslands (eg Tyler 2000 Loumlbel et al 2006) and mires (eg
Glaser et al 1990) We found a pronounced unimodal richnessndash
pH relationship in treeless vegetation but not in forests
Within treeless vegetation tundra occurred on low-pH soils
in precipitation-rich areas and steppe on high-pH soils in
precipitation-poor areas After splitting these two vegetation
types the former showed a positive linear relationship to soil pH
and the latter showed a negative linear relationship The positive
relationship in the southern Siberian alpine tundra is consistent
with a number of earlier studies from the arctic tundra where
increasing pH was identified as one of the major factors enhancing
species richness (Gough et al 2000 Walker et al 2001 van der
Welle et al 2003) In contrast steppe vegetation which occurred
on soils with pH 59ndash86 exhibited a weak yet significant negative
linear relationship between richness and pH This relationship
appears to be consistent with earlier studies from North
American prairies (Palmer et al 2003) Our data suggest that the
decreasing species richness of steppe vegetation on high-pH soils
could be caused by climatic stress instead of or in addition to the
physiological effect of high pH The highest pH values are found
in the driest soils with strongly limited or no cation leaching
(Fig 1) However these habitats experience not only pronounced
summer droughts but also strong winter frosts without protective
snow cover As most species of the study area are not adapted to
such harsh conditions the negative richnessndashpH correlation
appears The richest vegetation occurs where soil is not too dry
and not too acidic at the same time Our data suggest that for the
treeless vegetation of the study area it is at pH 6ndash7
The putative role of drought stress in limiting species richness
on high-pH soils is supported by the comparison with richnessndash
pH relationships reported for wetlands and mires In these
habitats high pH is usually due to cation saturation from
mineral springs and it is not associated with drought stress
In such environments species richness often increases up to pH
7 or even beyond (Glaser et al 1990 Haacutejkovaacute amp Haacutejek 2003
Guumlsewell et al 2005) However no base-rich wetlands or mires
were included in the current study because they are very rare in
the study area
Positive pHndashrichness relationship in forests
Unlike in treeless vegetation the richnessndashpH relationship in forests
is mostly reported as monotonic positive (Dupreacute et al 2002
Schuster amp Diekmann 2003) while unimodal relationships
M Chytryen et al
copy 2007 The Authors676 Global Ecology and Biogeography 16 668ndash678 Journal compilation copy 2007 Blackwell Publishing Ltd
are rare and negative relationships are exceptional The latter are
usually attributed to the confounding effects of factors other
than pH (Dupreacute et al 2002) Species richness in forests usually
increases steeply in acidic soils but the curve becomes less steep
above pH 55 and often levels off at a pH value close to 70 A
positive relationship is documented both from deciduous forests
of Europe (eg Brunet et al 1997 Dumortier et al 2002 Chytryet al 2003 Wohlgemuth amp Gigon 2003 Coudun amp Geacutegout
2005 Schuster amp Diekmann 2005) and North America (eg Peet
amp Christensen 1980 Brosofske et al 2001 Peet et al 2003) and
from coniferous forests in both continents (Rey Benayas 1995
Brosofske et al 2001 Zinko et al 2006) Palmer et al (2003)
pointed to the contrasting pHndashrichness relationships in Oklahoma
forests and prairies positive in the former and negative in the
latter The same pattern based on entirely different species pools
was found in forests and steppes in our study area (Fig 2)
We hypothesize that the predominance of the positive richnessndash
pH relationship in forests mainly results from the truncated pH
gradient at its base-rich end (Fig 5) There are two reasons for
this truncation First forest cannot grow at extremely dry sites
that only support grassland but these sites tend to have the
highest pH at least in the semi-arid areas such as forest-steppe
Second productive vegetation with trees tends to decrease soil
pH (Fig 1 Tyler 2003) Truncation of the pH gradient in forests
is also apparent in the meta-analysis of German case studies
(Schuster amp Diekmann 2003) where grasslands were often
recorded on soils with pH 7ndash8 but very few studies reported
forests on soils with pH gt 7 Because the truncation removes
habitats where species pool sizes have already started to decrease
due to drought stress most richnessndashpH relationships reported
in the literature from forests are monotonic positive Besides this
main explanation we suggest two other mechanisms that can
explain why the richnessndashpH curve of forest vegetation does not
usually decrease at high-pH conditions (Fig 5) First the species
richness of forests on soils with pH values of about 7 can be
partly increased by the mass effect at the forest-steppe ecotone
Forests on such soils which are usually rather dry contain
several species typical of adjacent dry grasslands These light-
demanding species find a suitable habitat under the open canopy
formed by pine or larch In contrast no such mass effect can
enhance the species richness of grasslands at pH 75ndash85 because
there are no sufficiently large species pools of other vegetation
types available for this pH range in the study area Second in dry
areas such as the forest-steppe zone the forest canopy maintains
higher air humidity in the understorey than in treeless habitats
(Moore et al 2000) Therefore forest richness may not be so
much limited by drought stress as is steppe richness on soils with
pH values of about 70ndash75
Species pools and the Pleistocene bottleneck
The species pool hypothesis predicts that the species richness of
particular habitats is correlated with the historical habitat com-
monness and associated opportunities for species accumulation
over evolutionary time (ie speciation minus extinction Aarssen
amp Schamp 2002) Over most of todayrsquos temperate zone of Eurasia
the Pleistocene climate was not only cool but was also dry (Frenzel
et al 1992) Such a climate supported the development of dry
calcium-rich soils over vast areas of cold steppe the habitat of
large Pleistocene herbivores (Guthrie 2001 Walker et al 2001)
Patches of coniferous forests also occurred in some areas mainly
in the mountains and wet lowland sites they have been recon-
structed from the full-glacial fossil data both from the Russianndash
Mongolian border area (Tarasov et al 2000) and from central
Europe (Willis et al 2000 Jankovskaacute et al 2002) Tundra was
confined to places with higher precipitation or lower evapotran-
spiration eg in the mountains or at non-glaciated higher latitudes
often in the close vicinity of steppe (Tarasov et al 2000)
The present-day landscape in some parts of southern Siberia
and Mongolia is probably the closest modern analogy to the
Pleistocene environments that existed in the non-glaciated part
of northern Eurasia It has to be pointed out that modern
analogies are never perfect Predictions based on analogies must
not be taken too seriously until there is independent and reliable
fossil evidence However if modern analogies exist they may
Figure 5 Conceptual model of species richness in treeless vegetation and forests across the combined gradient of decreasing precipitation and increasing pH On low-pH soils in precipitation-rich areas pools of species adapted to toxic effects of Al3+ and H+ ions are limited and species richness is low With decreasing precipitation and increasing pH richness first increases but subsequently decreases because of a limited pool of species adapted to very dry conditions In contrast forest richness does not decrease or decreases only slightly in precipitation-poor areas for the following reasons (1) forests do not occur in the driest areas so the extreme end of the precipitationndashpH gradient is truncated (2) forests occurring on their ecological limit have an open canopy and their herb layer is saturated by steppe species pools and (3) the protective effect of forest canopy maintains higher air humidity and reduces drought stress
Species richness pH and climate in southern Siberia
copy 2007 The Authors Global Ecology and Biogeography 16 668ndash678 Journal compilation copy 2007 Blackwell Publishing Ltd 677
provide valuable insights and enhance our understanding of
ecological patterns and processes in the past environments
The current study included vegetation types with the same
leading species as reconstructed from the full-glacial central
Europe (Willis et al 2000 Jankovskaacute et al 2002) and parts of
the study area had a climate corresponding to the cool periods
of the Pleistocene (Frenzel et al 1992) In southern Siberia the
richest vegetation is found on soils with a pH of 6ndash7 (Fig 2)
which are associated with moderate precipitation (Fig 1) If the
modern species richness of different habitats resulted from
speciation and extinction in the historically prevailing environ-
ments (species pool effects Aarssen amp Schamp 2002 Paumlrtel
2002 Ewald 2003) this pattern would suggest that such slightly
acidic to neutral soils were common in the pre-Holocene
environments of temperate Eurasia In contrast very dry calcium-
rich steppe or wet acidic tundra probably never supported
species-rich vegetation
Increasing precipitation in the Holocene especially in
areas with an oceanic climate caused large-scale soil acidification
(Roberts 1998) The species-pool hypothesis predicts that todayrsquos
acidic soils although prevailing in large areas are poor in species
because of the lack of calcifuge species which may have become
largely extinct during the Pleistocene (Ewald 2003) Such acidified
habitats are represented in the wetter parts of the study area by
taiga forests (in warmer climate) or by tundra (in cooler climate)
Both of these habitats are generally species poor but exhibit
positive richnessndashpH relationships for which the species pool
hypothesis provides a plausible explanation
ACKNOWLEDGEMENTS
We thank the local staff of our expeditions for their extensive
support during the fieldwork and two anonymous referees
for useful comments on the previous version of this paper
This research was supported from projects IAA6163303 from
the Grant Agency of the Academy of Sciences of the Czech
Republic and long-term research plans MSM0021622416 and
AVOZ60050516
REFERENCES
Aarssen LW amp Schamp BS (2002) Predicting distributions of
species richness and species sizes in regional floras applying the
species pool hypothesis to the habitat templet model Perspec-
tives in Plant Ecology Evolution and Systematics 5 3ndash12
Berglund BE Birks HJB Ralska-Jasiewiczowa M amp
Wright HE (1996) Palaeoecological events during the last
15000 years John Wiley amp Sons Chichester
Breiman L Friedman JH Olshen RA amp Stone CG (1984)
Classification and regression trees Wadsworth International
Group Belmont CA
Brosofske KD Chen J amp Crow TR (2001) Understory vegeta-
tion and site factors implications for a managed Wisconsin
landscape Forest Ecology and Management 146 75ndash87
Brunet J Falkengren-Grerup U Ruumlhling A amp Tyler G (1997)
Regional differences in floristic change in South Swedish oak
forests as related to soil chemistry and land use Journal of
Vegetation Science 8 329ndash336
Chytry M Tichy L amp Roleccedilek J (2003) Local and regional pat-
terns of species richness in Central European vegetation types
along the pHcalcium gradient Folia Geobotanica 38 429ndash
442
Coudun C amp Geacutegout J-C (2005) Ecological behaviour of
herbaceous forest species along a pH gradient a comparison
between oceanic and semicontinental regions in northern
France Global Ecology and Biogeography 14 263ndash270
Dumortier M Butaye J Jacquemyn H Van Camp N Lust N
amp Hermy M (2002) Predicting vascular plant species richness
of fragmented forests in agricultural landscapes in central
Belgium Forest Ecology and Management 158 85ndash102
Dupreacute C Wessberg C amp Diekmann M (2002) Species richness
in deciduous forests Effects of species pools and environmental
variables Journal of Vegetation Science 13 505ndash516
Ermakov N Dring J amp Rodwell J (2000) Classification of con-
tinental hemiboreal forests of North Asia Braun-Blanquetia
28 1ndash131
Ewald J (2003) The calcareous riddle why are there so many
calciphilous species in the Central European flora Folia
Geobotanica 38 357ndash366
Finzi AC Canham CD amp van Breemen N (1998) Canopy
treendashsoil interactions within temperate forests species effects
on pH and cations Ecological Applications 8 447ndash454
Frenzel B Peacutecsi M amp Velichko AA (eds) (1992) Atlas of
paleoclimates and paleoenvironments of the Northern
Hemisphere Geographical Research Institute Budapest amp
Gustav Fischer Verlag Stuttgart
Gidrometeoizdat (1966ndash1970) Spravochnik po klimatu SSSR
[Reference books on the climate of the USSR] Gidrometeoizdat
Leningrad
Gigon A (1987) A hierarchic approach in causal ecosystem
analysis the calcifuge-calcicole problem in alpine grasslands
Ecological Studies 61 228ndash244
Glaser PH Janssens JA amp Siegel DI (1990) The response of
vegetation to chemical and hydrological gradients in the Lost
River peatland northern Minnesota Journal of Ecology 78
1021ndash1048
Gough L Shaver GR Carroll J Royer DL amp Laundre JA
(2000) Vascular plant species richness in Alaskan arctic tundra
the importance of soil pH Journal of Ecology 88 54ndash66
Grubb PJ (1987) Global trends in species-richness in terrestrial
vegetation a view from the northern hemisphere Organiza-
tion of communities past and present (ed by JHR Gee and PS
Giller) pp 99ndash118 Blackwell Science Oxford
Guumlsewell S Bailey KM Roem WJ amp Bedford BL (2005)
Nutrient limitation and botanical diversity in wetlands can
fertilisation raise species richness Oikos 109 71ndash80
Guthrie RD (2001) Origin and causes of the mammoth steppe
a story of cloud cover woolly mammal tooth pits buckles
and inside-out Beringia Quaternary Science Reviews 20 549ndash
574
Haacutejkovaacute P amp Haacutejek M (2003) Species richness and above-
ground biomass of poor and calcareous spring fens in the
M Chytryen et al
copy 2007 The Authors678 Global Ecology and Biogeography 16 668ndash678 Journal compilation copy 2007 Blackwell Publishing Ltd
flysch West Carpathians and their relationships to water and
soil chemistry Preslia 75 271ndash287
Hilbig W (1995) The vegetation of Mongolia SPB Academic
Publishing Amsterdam
Jankovskaacute V Chromy P amp Niznianskaacute M (2002) Iacuteafaacuterka mdash
first palaeobotanical data of the character of Last Glacial
vegetation and landscape in the West Carpathians (Slovakia)
Acta Palaeobotanica 42 39ndash50
Loumlbel S Dengler J amp Hobohm C (2006) Species richness of
vascular plants bryophytes and lichens in dry grasslands the
effects of environment landscape structure and competition
Folia Geobotanica 41 377ndash393
Meusel H Jaumlger EJ Weinert E amp Rauschert S (1965ndash1992)
Vergleichende Chorologie der zentraleuropaumlischen Flora IndashIII
Gustav Fischer Verlag Jena
Moore KE Fitzjarrald DR Sakai RK amp Freedman JM
(2000) Growing season water balance at a boreal jack pine
forest Water Resources Research 36 483ndash493
Ovington JD (1953) Studies of the development of woodland
conditions under different trees I Soil pH Journal of Ecology
4113ndash52
Palmer MW Areacutevalo JR del Carmen Cobo M amp Earls PG
(2003) Species richness and soil reaction in a northeastern
Oklahoma landscape Folia Geobotanica 38 381ndash389
Paumlrtel M (2002) Local plant diversity patterns and evolutionary
history at the regional scale Ecology 83 2361ndash2366
Peet RK amp Christensen NL (1980) Hardwood forest vegeta-
tion of the North Carolina piedmont Veroumlffentlichungen des
Geobotanischen Institutes ETH Stiftung Ruumlbel Zuumlrich 69 14ndash
39
Peet RK Fridley JD amp Gramling JM (2003) Variation in
species richness and species pool size across a pH gradient
in forests of the southern Blue Ridge Mountains Folia
Geobotanica 38 391ndash401
Polikarpov NP Chebakova NM amp Nazimova DI (1986)
Klimat i gornye lesa Sibiri [Climate and mountain forests of
Siberia] Nauka Novosibirsk
Rey Benayas JM (1995) Patterns of diversity in the strata of
boreal montane forest in British Columbia Journal of Vegeta-
tion Science 6 95ndash98
Roberts N (1998) The Holocene an environmental history 2nd
edn Blackwell Science Oxford
Schuster B amp Diekmann M (2003) Changes in species density
along the soil pH gradient mdash evidence from German plant
communities Folia Geobotanica 38 367ndash379
Schuster B amp Diekmann M (2005) Species richness and
environmental correlates in deciduous forests of Northwest
Germany Forest Ecology and Management 206 197ndash205
Sjoumlrs H (1952) On the relation between vegetation and electrolytes
in north Swedish mire waters Oikos 2 241ndash258
Tarasov PE Volkova VS Webb T III Guiot J Andreev AA
Bezusko LG Bezusko TV Bykova GV Dorofeyuk NI
Kvavadze EV Osipova IM Panova NK amp Sevastyanov DV
(2000) Last glacial maximum biomes reconstructed from
pollen and plant macrofossil data from northern Eurasia
Journal of Biogeography 27 609ndash620
Taylor DR Aarssen LW amp Loehle C (1990) On the relationship
between rK selection and environmental carrying capacity
a new habitat templet for plant life history strategies Oikos 58
239ndash250
Tyler G (1996) Soil chemistry and plant distributions in rock
habitats of southern Sweden Nordic Journal of Botany 16
609ndash635
Tyler G (2000) Integrated analysis of conditions accounting
for intersite distribution of grassland plants Nordic Journal of
Botany 20 485ndash500
Tyler G (2003) Some ecophysiological and historical approaches
to species richness and calcicolecalcifuge behaviour mdash
contribution to a debate Folia Geobotanica 38 419ndash428
van der Welle MEW Vermeulen PJ Shaver GR amp Berendse F
(2003) Factors determining plant species richness in Alaskan
arctic tundra Journal of Vegetation Science 14 711ndash720
Vitt DH (2000) Peatlands ecosystems dominated by bryophytes
Bryophyte biology (ed by AJ Shaw and B Goffinet) pp 312ndash
343 Cambridge University Press Cambridge
Vonlanthen CM Kammer PM Eugster W Buumlhler A amp
Veit H (2006) Alpine vascular plant species richness the
importance of daily maximum temperature and pH Plant
Ecology 184 13ndash25
Walker DA Bockheim JG Chapin FS III Eugster W
Nelson FE amp Ping CL (2001) Calcium-rich tundra wildlife
and the lsquoMammoth Steppersquo Quaternary Science Reviews 20
149ndash163
Willis KJ Rudner E amp Suumlmegi P (2000) The full-glacial forests
of central and southeastern Europe Quaternary Research 53
203ndash213
Wohlgemuth T amp Gigon A (2003) Calcicole plant diversity in
Switzerland may reflect a variety of habitat templets Folia
Geobotanica 38 443ndash452
Zinko U Dynesius M Nilsson C amp Seibert J (2006) The role
of soil pH in linking groundwater flow and plant species
density in boreal forest landscapes Ecography 29 515ndash524
Editor Martin Sykes
BIOSKETCH
Milan Chytry is an associate professor of botany in the
Department of Botany and Zoology Masaryk University
Brno Czech Republic His research as well as research
by the co-authors is focused on vegetation ecology and
large-scale diversity patterns of multi-species assemblages
of vascular plants
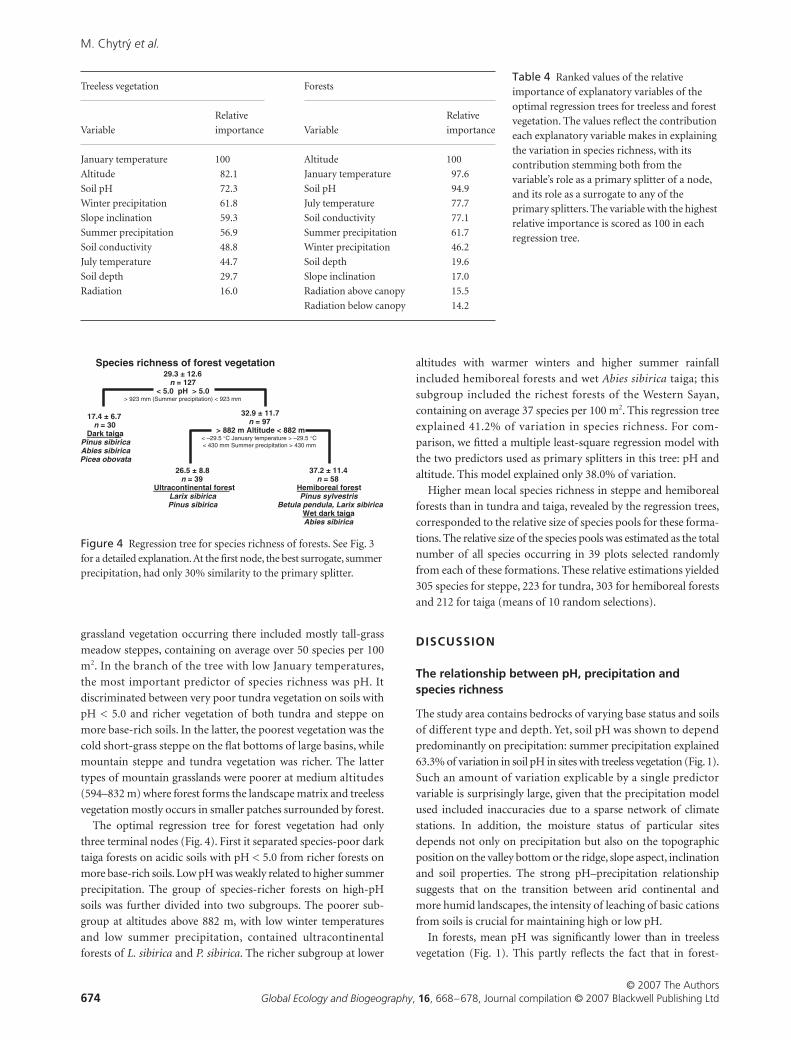
M Chytryen et al
copy 2007 The Authors674 Global Ecology and Biogeography 16 668ndash678 Journal compilation copy 2007 Blackwell Publishing Ltd
grassland vegetation occurring there included mostly tall-grass
meadow steppes containing on average over 50 species per 100
m2 In the branch of the tree with low January temperatures
the most important predictor of species richness was pH It
discriminated between very poor tundra vegetation on soils with
pH lt 50 and richer vegetation of both tundra and steppe on
more base-rich soils In the latter the poorest vegetation was the
cold short-grass steppe on the flat bottoms of large basins while
mountain steppe and tundra vegetation was richer The latter
types of mountain grasslands were poorer at medium altitudes
(594ndash832 m) where forest forms the landscape matrix and treeless
vegetation mostly occurs in smaller patches surrounded by forest
The optimal regression tree for forest vegetation had only
three terminal nodes (Fig 4) First it separated species-poor dark
taiga forests on acidic soils with pH lt 50 from richer forests on
more base-rich soils Low pH was weakly related to higher summer
precipitation The group of species-richer forests on high-pH
soils was further divided into two subgroups The poorer sub-
group at altitudes above 882 m with low winter temperatures
and low summer precipitation contained ultracontinental
forests of L sibirica and P sibirica The richer subgroup at lower
altitudes with warmer winters and higher summer rainfall
included hemiboreal forests and wet Abies sibirica taiga this
subgroup included the richest forests of the Western Sayan
containing on average 37 species per 100 m2 This regression tree
explained 412 of variation in species richness For com-
parison we fitted a multiple least-square regression model with
the two predictors used as primary splitters in this tree pH and
altitude This model explained only 380 of variation
Higher mean local species richness in steppe and hemiboreal
forests than in tundra and taiga revealed by the regression trees
corresponded to the relative size of species pools for these forma-
tions The relative size of the species pools was estimated as the total
number of all species occurring in 39 plots selected randomly
from each of these formations These relative estimations yielded
305 species for steppe 223 for tundra 303 for hemiboreal forests
and 212 for taiga (means of 10 random selections)
DISCUSSION
The relationship between pH precipitation and species richness
The study area contains bedrocks of varying base status and soils
of different type and depth Yet soil pH was shown to depend
predominantly on precipitation summer precipitation explained
633 of variation in soil pH in sites with treeless vegetation (Fig 1)
Such an amount of variation explicable by a single predictor
variable is surprisingly large given that the precipitation model
used included inaccuracies due to a sparse network of climate
stations In addition the moisture status of particular sites
depends not only on precipitation but also on the topographic
position on the valley bottom or the ridge slope aspect inclination
and soil properties The strong pHndashprecipitation relationship
suggests that on the transition between arid continental and
more humid landscapes the intensity of leaching of basic cations
from soils is crucial for maintaining high or low pH
In forests mean pH was significantly lower than in treeless
vegetation (Fig 1) This partly reflects the fact that in forest-
Treeless vegetation Forests
Variable
Relative
importance Variable
Relative
importance
January temperature 100 Altitude 100
Altitude 821 January temperature 976
Soil pH 723 Soil pH 949
Winter precipitation 618 July temperature 777
Slope inclination 593 Soil conductivity 771
Summer precipitation 569 Summer precipitation 617
Soil conductivity 488 Winter precipitation 462
July temperature 447 Soil depth 196
Soil depth 297 Slope inclination 170
Radiation 160 Radiation above canopy 155
Radiation below canopy 142
Table 4 Ranked values of the relative importance of explanatory variables of the optimal regression trees for treeless and forest vegetation The values reflect the contribution each explanatory variable makes in explaining the variation in species richness with its contribution stemming both from the variablersquos role as a primary splitter of a node and its role as a surrogate to any of the primary splitters The variable with the highest relative importance is scored as 100 in each regression tree
Figure 4 Regression tree for species richness of forests See Fig 3 for a detailed explanation At the first node the best surrogate summer precipitation had only 30 similarity to the primary splitter
Species richness pH and climate in southern Siberia
copy 2007 The Authors Global Ecology and Biogeography 16 668ndash678 Journal compilation copy 2007 Blackwell Publishing Ltd 675
steppe landscapes forest grows in moister places with a higher
intensity of leaching than steppe vegetation However as forest
soils are more acidic than non-forest soils in the precipitation-
rich areas as well more intensive acidification processes probably
occur in forest soils These may result from (1) higher moisture
status and more intensive soil leaching under the forest canopy
which decreases evaporation (2) larger uptake of bases and their
replacement by H+ cations in the more productive forest vegeta-
tion (3) higher abundance of mosses contributing to acidifica-
tion (Vitt 2000) or (4) inputs of organic acids from conifer litter
(Ovington 1953 Finzi et al 1998) A much lower variation in
pH explained by summer precipitation for forest sites (332)
than for treeless sites (633) is another indication of a stronger
effect of vegetation on soil pH in forests than in open landscape
In both treeless and forest vegetation the best correlates of
species richness were January temperature pH and altitude (Figs 3
and 4 Table 4) Climatic variables such as summer temperatures
and precipitation were correlated with them (Table 2) Other
measured variables were either correlated with these variables or
weakly related to the species richness pattern (Tables 2 amp 4) This
corresponds to the alpine vegetation of the Alps where species
richness is mainly determined by the joint effects of temperature
and pH while other variables are less important (Vonlanthen
et al 2006) In the continental climate of the study area with its
very cold winters frost can be an important ecological factor
limiting plant life especially in combination with low winter
precipitation and shallow or discontinuous snow cover Actually
areas with the strongest winter frosts had the species-poorest
vegetation Both treeless and forest vegetation were consistently
poorer on soils with pH lt 50 which corresponds to the value
where toxic Al3+ cations start to solubilize (Tyler 1996) The
relationship between richness and altitude was more complex in
the study area reflecting interactions between climatic variables
At high altitudes richness was lower due to low winter tempera-
tures irrespective of the amount of precipitation whereas at
lower altitudes richness increased with precipitation
The most species-rich treeless vegetation corresponded to
tall-grass meadow steppe occurring at altitudes slightly above
500 m which still have comparatively warm winters but higher
precipitation than dry lowlands The poorest treeless vegetation
was tundra occurring in areas with pronounced winter frosts and
high precipitation which causes soil leaching and acidification
The richest forest vegetation occurred in areas where precipita-
tion was not too high to cause pronounced soil leaching and not
too low to exclude mesic forest species Such habitats supported
either Pinus sylvestris hemiboreal forest or Abies sibirica wet taiga
on footslopes and valley bottoms The poorest forest was dark
taiga with Pinus sibirica Abies sibirica or Picea obovata occurring
on low-pH soils in precipitation-rich areas
Unimodal pHndashrichness relationship in treeless vegetation
A positive richnessndashpH relationship has been more frequently
reported from the temperate boreal and arctic zones than has a
negative one (Paumlrtel 2002) In more detail the sign and shape of
this relationship depends on vegetation types (Chytry et al
2003 Schuster amp Diekmann 2003) The relationship tends to
be positive in vegetation types that grow predominantly on
acidic to neutral soils eg in forests and tundra In contrast
treeless vegetation on neutral to base-rich soils tends to have a
non-significant or negative richnessndashpH relationship
Our study provides a finer and more complete picture than
most others because it covers nearly the whole range of soil pH
compatible with plant life The existence of upper and lower
physiological limits to plant growth on the pH gradient implies
that the relationship is inherently unimodal This is reported by
some studies covering broad ranges of pH values especially
in grasslands (eg Tyler 2000 Loumlbel et al 2006) and mires (eg
Glaser et al 1990) We found a pronounced unimodal richnessndash
pH relationship in treeless vegetation but not in forests
Within treeless vegetation tundra occurred on low-pH soils
in precipitation-rich areas and steppe on high-pH soils in
precipitation-poor areas After splitting these two vegetation
types the former showed a positive linear relationship to soil pH
and the latter showed a negative linear relationship The positive
relationship in the southern Siberian alpine tundra is consistent
with a number of earlier studies from the arctic tundra where
increasing pH was identified as one of the major factors enhancing
species richness (Gough et al 2000 Walker et al 2001 van der
Welle et al 2003) In contrast steppe vegetation which occurred
on soils with pH 59ndash86 exhibited a weak yet significant negative
linear relationship between richness and pH This relationship
appears to be consistent with earlier studies from North
American prairies (Palmer et al 2003) Our data suggest that the
decreasing species richness of steppe vegetation on high-pH soils
could be caused by climatic stress instead of or in addition to the
physiological effect of high pH The highest pH values are found
in the driest soils with strongly limited or no cation leaching
(Fig 1) However these habitats experience not only pronounced
summer droughts but also strong winter frosts without protective
snow cover As most species of the study area are not adapted to
such harsh conditions the negative richnessndashpH correlation
appears The richest vegetation occurs where soil is not too dry
and not too acidic at the same time Our data suggest that for the
treeless vegetation of the study area it is at pH 6ndash7
The putative role of drought stress in limiting species richness
on high-pH soils is supported by the comparison with richnessndash
pH relationships reported for wetlands and mires In these
habitats high pH is usually due to cation saturation from
mineral springs and it is not associated with drought stress
In such environments species richness often increases up to pH
7 or even beyond (Glaser et al 1990 Haacutejkovaacute amp Haacutejek 2003
Guumlsewell et al 2005) However no base-rich wetlands or mires
were included in the current study because they are very rare in
the study area
Positive pHndashrichness relationship in forests
Unlike in treeless vegetation the richnessndashpH relationship in forests
is mostly reported as monotonic positive (Dupreacute et al 2002
Schuster amp Diekmann 2003) while unimodal relationships
M Chytryen et al
copy 2007 The Authors676 Global Ecology and Biogeography 16 668ndash678 Journal compilation copy 2007 Blackwell Publishing Ltd
are rare and negative relationships are exceptional The latter are
usually attributed to the confounding effects of factors other
than pH (Dupreacute et al 2002) Species richness in forests usually
increases steeply in acidic soils but the curve becomes less steep
above pH 55 and often levels off at a pH value close to 70 A
positive relationship is documented both from deciduous forests
of Europe (eg Brunet et al 1997 Dumortier et al 2002 Chytryet al 2003 Wohlgemuth amp Gigon 2003 Coudun amp Geacutegout
2005 Schuster amp Diekmann 2005) and North America (eg Peet
amp Christensen 1980 Brosofske et al 2001 Peet et al 2003) and
from coniferous forests in both continents (Rey Benayas 1995
Brosofske et al 2001 Zinko et al 2006) Palmer et al (2003)
pointed to the contrasting pHndashrichness relationships in Oklahoma
forests and prairies positive in the former and negative in the
latter The same pattern based on entirely different species pools
was found in forests and steppes in our study area (Fig 2)
We hypothesize that the predominance of the positive richnessndash
pH relationship in forests mainly results from the truncated pH
gradient at its base-rich end (Fig 5) There are two reasons for
this truncation First forest cannot grow at extremely dry sites
that only support grassland but these sites tend to have the
highest pH at least in the semi-arid areas such as forest-steppe
Second productive vegetation with trees tends to decrease soil
pH (Fig 1 Tyler 2003) Truncation of the pH gradient in forests
is also apparent in the meta-analysis of German case studies
(Schuster amp Diekmann 2003) where grasslands were often
recorded on soils with pH 7ndash8 but very few studies reported
forests on soils with pH gt 7 Because the truncation removes
habitats where species pool sizes have already started to decrease
due to drought stress most richnessndashpH relationships reported
in the literature from forests are monotonic positive Besides this
main explanation we suggest two other mechanisms that can
explain why the richnessndashpH curve of forest vegetation does not
usually decrease at high-pH conditions (Fig 5) First the species
richness of forests on soils with pH values of about 7 can be
partly increased by the mass effect at the forest-steppe ecotone
Forests on such soils which are usually rather dry contain
several species typical of adjacent dry grasslands These light-
demanding species find a suitable habitat under the open canopy
formed by pine or larch In contrast no such mass effect can
enhance the species richness of grasslands at pH 75ndash85 because
there are no sufficiently large species pools of other vegetation
types available for this pH range in the study area Second in dry
areas such as the forest-steppe zone the forest canopy maintains
higher air humidity in the understorey than in treeless habitats
(Moore et al 2000) Therefore forest richness may not be so
much limited by drought stress as is steppe richness on soils with
pH values of about 70ndash75
Species pools and the Pleistocene bottleneck
The species pool hypothesis predicts that the species richness of
particular habitats is correlated with the historical habitat com-
monness and associated opportunities for species accumulation
over evolutionary time (ie speciation minus extinction Aarssen
amp Schamp 2002) Over most of todayrsquos temperate zone of Eurasia
the Pleistocene climate was not only cool but was also dry (Frenzel
et al 1992) Such a climate supported the development of dry
calcium-rich soils over vast areas of cold steppe the habitat of
large Pleistocene herbivores (Guthrie 2001 Walker et al 2001)
Patches of coniferous forests also occurred in some areas mainly
in the mountains and wet lowland sites they have been recon-
structed from the full-glacial fossil data both from the Russianndash
Mongolian border area (Tarasov et al 2000) and from central
Europe (Willis et al 2000 Jankovskaacute et al 2002) Tundra was
confined to places with higher precipitation or lower evapotran-
spiration eg in the mountains or at non-glaciated higher latitudes
often in the close vicinity of steppe (Tarasov et al 2000)
The present-day landscape in some parts of southern Siberia
and Mongolia is probably the closest modern analogy to the
Pleistocene environments that existed in the non-glaciated part
of northern Eurasia It has to be pointed out that modern
analogies are never perfect Predictions based on analogies must
not be taken too seriously until there is independent and reliable
fossil evidence However if modern analogies exist they may
Figure 5 Conceptual model of species richness in treeless vegetation and forests across the combined gradient of decreasing precipitation and increasing pH On low-pH soils in precipitation-rich areas pools of species adapted to toxic effects of Al3+ and H+ ions are limited and species richness is low With decreasing precipitation and increasing pH richness first increases but subsequently decreases because of a limited pool of species adapted to very dry conditions In contrast forest richness does not decrease or decreases only slightly in precipitation-poor areas for the following reasons (1) forests do not occur in the driest areas so the extreme end of the precipitationndashpH gradient is truncated (2) forests occurring on their ecological limit have an open canopy and their herb layer is saturated by steppe species pools and (3) the protective effect of forest canopy maintains higher air humidity and reduces drought stress
Species richness pH and climate in southern Siberia
copy 2007 The Authors Global Ecology and Biogeography 16 668ndash678 Journal compilation copy 2007 Blackwell Publishing Ltd 677
provide valuable insights and enhance our understanding of
ecological patterns and processes in the past environments
The current study included vegetation types with the same
leading species as reconstructed from the full-glacial central
Europe (Willis et al 2000 Jankovskaacute et al 2002) and parts of
the study area had a climate corresponding to the cool periods
of the Pleistocene (Frenzel et al 1992) In southern Siberia the
richest vegetation is found on soils with a pH of 6ndash7 (Fig 2)
which are associated with moderate precipitation (Fig 1) If the
modern species richness of different habitats resulted from
speciation and extinction in the historically prevailing environ-
ments (species pool effects Aarssen amp Schamp 2002 Paumlrtel
2002 Ewald 2003) this pattern would suggest that such slightly
acidic to neutral soils were common in the pre-Holocene
environments of temperate Eurasia In contrast very dry calcium-
rich steppe or wet acidic tundra probably never supported
species-rich vegetation
Increasing precipitation in the Holocene especially in
areas with an oceanic climate caused large-scale soil acidification
(Roberts 1998) The species-pool hypothesis predicts that todayrsquos
acidic soils although prevailing in large areas are poor in species
because of the lack of calcifuge species which may have become
largely extinct during the Pleistocene (Ewald 2003) Such acidified
habitats are represented in the wetter parts of the study area by
taiga forests (in warmer climate) or by tundra (in cooler climate)
Both of these habitats are generally species poor but exhibit
positive richnessndashpH relationships for which the species pool
hypothesis provides a plausible explanation
ACKNOWLEDGEMENTS
We thank the local staff of our expeditions for their extensive
support during the fieldwork and two anonymous referees
for useful comments on the previous version of this paper
This research was supported from projects IAA6163303 from
the Grant Agency of the Academy of Sciences of the Czech
Republic and long-term research plans MSM0021622416 and
AVOZ60050516
REFERENCES
Aarssen LW amp Schamp BS (2002) Predicting distributions of
species richness and species sizes in regional floras applying the
species pool hypothesis to the habitat templet model Perspec-
tives in Plant Ecology Evolution and Systematics 5 3ndash12
Berglund BE Birks HJB Ralska-Jasiewiczowa M amp
Wright HE (1996) Palaeoecological events during the last
15000 years John Wiley amp Sons Chichester
Breiman L Friedman JH Olshen RA amp Stone CG (1984)
Classification and regression trees Wadsworth International
Group Belmont CA
Brosofske KD Chen J amp Crow TR (2001) Understory vegeta-
tion and site factors implications for a managed Wisconsin
landscape Forest Ecology and Management 146 75ndash87
Brunet J Falkengren-Grerup U Ruumlhling A amp Tyler G (1997)
Regional differences in floristic change in South Swedish oak
forests as related to soil chemistry and land use Journal of
Vegetation Science 8 329ndash336
Chytry M Tichy L amp Roleccedilek J (2003) Local and regional pat-
terns of species richness in Central European vegetation types
along the pHcalcium gradient Folia Geobotanica 38 429ndash
442
Coudun C amp Geacutegout J-C (2005) Ecological behaviour of
herbaceous forest species along a pH gradient a comparison
between oceanic and semicontinental regions in northern
France Global Ecology and Biogeography 14 263ndash270
Dumortier M Butaye J Jacquemyn H Van Camp N Lust N
amp Hermy M (2002) Predicting vascular plant species richness
of fragmented forests in agricultural landscapes in central
Belgium Forest Ecology and Management 158 85ndash102
Dupreacute C Wessberg C amp Diekmann M (2002) Species richness
in deciduous forests Effects of species pools and environmental
variables Journal of Vegetation Science 13 505ndash516
Ermakov N Dring J amp Rodwell J (2000) Classification of con-
tinental hemiboreal forests of North Asia Braun-Blanquetia
28 1ndash131
Ewald J (2003) The calcareous riddle why are there so many
calciphilous species in the Central European flora Folia
Geobotanica 38 357ndash366
Finzi AC Canham CD amp van Breemen N (1998) Canopy
treendashsoil interactions within temperate forests species effects
on pH and cations Ecological Applications 8 447ndash454
Frenzel B Peacutecsi M amp Velichko AA (eds) (1992) Atlas of
paleoclimates and paleoenvironments of the Northern
Hemisphere Geographical Research Institute Budapest amp
Gustav Fischer Verlag Stuttgart
Gidrometeoizdat (1966ndash1970) Spravochnik po klimatu SSSR
[Reference books on the climate of the USSR] Gidrometeoizdat
Leningrad
Gigon A (1987) A hierarchic approach in causal ecosystem
analysis the calcifuge-calcicole problem in alpine grasslands
Ecological Studies 61 228ndash244
Glaser PH Janssens JA amp Siegel DI (1990) The response of
vegetation to chemical and hydrological gradients in the Lost
River peatland northern Minnesota Journal of Ecology 78
1021ndash1048
Gough L Shaver GR Carroll J Royer DL amp Laundre JA
(2000) Vascular plant species richness in Alaskan arctic tundra
the importance of soil pH Journal of Ecology 88 54ndash66
Grubb PJ (1987) Global trends in species-richness in terrestrial
vegetation a view from the northern hemisphere Organiza-
tion of communities past and present (ed by JHR Gee and PS
Giller) pp 99ndash118 Blackwell Science Oxford
Guumlsewell S Bailey KM Roem WJ amp Bedford BL (2005)
Nutrient limitation and botanical diversity in wetlands can
fertilisation raise species richness Oikos 109 71ndash80
Guthrie RD (2001) Origin and causes of the mammoth steppe
a story of cloud cover woolly mammal tooth pits buckles
and inside-out Beringia Quaternary Science Reviews 20 549ndash
574
Haacutejkovaacute P amp Haacutejek M (2003) Species richness and above-
ground biomass of poor and calcareous spring fens in the
M Chytryen et al
copy 2007 The Authors678 Global Ecology and Biogeography 16 668ndash678 Journal compilation copy 2007 Blackwell Publishing Ltd
flysch West Carpathians and their relationships to water and
soil chemistry Preslia 75 271ndash287
Hilbig W (1995) The vegetation of Mongolia SPB Academic
Publishing Amsterdam
Jankovskaacute V Chromy P amp Niznianskaacute M (2002) Iacuteafaacuterka mdash
first palaeobotanical data of the character of Last Glacial
vegetation and landscape in the West Carpathians (Slovakia)
Acta Palaeobotanica 42 39ndash50
Loumlbel S Dengler J amp Hobohm C (2006) Species richness of
vascular plants bryophytes and lichens in dry grasslands the
effects of environment landscape structure and competition
Folia Geobotanica 41 377ndash393
Meusel H Jaumlger EJ Weinert E amp Rauschert S (1965ndash1992)
Vergleichende Chorologie der zentraleuropaumlischen Flora IndashIII
Gustav Fischer Verlag Jena
Moore KE Fitzjarrald DR Sakai RK amp Freedman JM
(2000) Growing season water balance at a boreal jack pine
forest Water Resources Research 36 483ndash493
Ovington JD (1953) Studies of the development of woodland
conditions under different trees I Soil pH Journal of Ecology
4113ndash52
Palmer MW Areacutevalo JR del Carmen Cobo M amp Earls PG
(2003) Species richness and soil reaction in a northeastern
Oklahoma landscape Folia Geobotanica 38 381ndash389
Paumlrtel M (2002) Local plant diversity patterns and evolutionary
history at the regional scale Ecology 83 2361ndash2366
Peet RK amp Christensen NL (1980) Hardwood forest vegeta-
tion of the North Carolina piedmont Veroumlffentlichungen des
Geobotanischen Institutes ETH Stiftung Ruumlbel Zuumlrich 69 14ndash
39
Peet RK Fridley JD amp Gramling JM (2003) Variation in
species richness and species pool size across a pH gradient
in forests of the southern Blue Ridge Mountains Folia
Geobotanica 38 391ndash401
Polikarpov NP Chebakova NM amp Nazimova DI (1986)
Klimat i gornye lesa Sibiri [Climate and mountain forests of
Siberia] Nauka Novosibirsk
Rey Benayas JM (1995) Patterns of diversity in the strata of
boreal montane forest in British Columbia Journal of Vegeta-
tion Science 6 95ndash98
Roberts N (1998) The Holocene an environmental history 2nd
edn Blackwell Science Oxford
Schuster B amp Diekmann M (2003) Changes in species density
along the soil pH gradient mdash evidence from German plant
communities Folia Geobotanica 38 367ndash379
Schuster B amp Diekmann M (2005) Species richness and
environmental correlates in deciduous forests of Northwest
Germany Forest Ecology and Management 206 197ndash205
Sjoumlrs H (1952) On the relation between vegetation and electrolytes
in north Swedish mire waters Oikos 2 241ndash258
Tarasov PE Volkova VS Webb T III Guiot J Andreev AA
Bezusko LG Bezusko TV Bykova GV Dorofeyuk NI
Kvavadze EV Osipova IM Panova NK amp Sevastyanov DV
(2000) Last glacial maximum biomes reconstructed from
pollen and plant macrofossil data from northern Eurasia
Journal of Biogeography 27 609ndash620
Taylor DR Aarssen LW amp Loehle C (1990) On the relationship
between rK selection and environmental carrying capacity
a new habitat templet for plant life history strategies Oikos 58
239ndash250
Tyler G (1996) Soil chemistry and plant distributions in rock
habitats of southern Sweden Nordic Journal of Botany 16
609ndash635
Tyler G (2000) Integrated analysis of conditions accounting
for intersite distribution of grassland plants Nordic Journal of
Botany 20 485ndash500
Tyler G (2003) Some ecophysiological and historical approaches
to species richness and calcicolecalcifuge behaviour mdash
contribution to a debate Folia Geobotanica 38 419ndash428
van der Welle MEW Vermeulen PJ Shaver GR amp Berendse F
(2003) Factors determining plant species richness in Alaskan
arctic tundra Journal of Vegetation Science 14 711ndash720
Vitt DH (2000) Peatlands ecosystems dominated by bryophytes
Bryophyte biology (ed by AJ Shaw and B Goffinet) pp 312ndash
343 Cambridge University Press Cambridge
Vonlanthen CM Kammer PM Eugster W Buumlhler A amp
Veit H (2006) Alpine vascular plant species richness the
importance of daily maximum temperature and pH Plant
Ecology 184 13ndash25
Walker DA Bockheim JG Chapin FS III Eugster W
Nelson FE amp Ping CL (2001) Calcium-rich tundra wildlife
and the lsquoMammoth Steppersquo Quaternary Science Reviews 20
149ndash163
Willis KJ Rudner E amp Suumlmegi P (2000) The full-glacial forests
of central and southeastern Europe Quaternary Research 53
203ndash213
Wohlgemuth T amp Gigon A (2003) Calcicole plant diversity in
Switzerland may reflect a variety of habitat templets Folia
Geobotanica 38 443ndash452
Zinko U Dynesius M Nilsson C amp Seibert J (2006) The role
of soil pH in linking groundwater flow and plant species
density in boreal forest landscapes Ecography 29 515ndash524
Editor Martin Sykes
BIOSKETCH
Milan Chytry is an associate professor of botany in the
Department of Botany and Zoology Masaryk University
Brno Czech Republic His research as well as research
by the co-authors is focused on vegetation ecology and
large-scale diversity patterns of multi-species assemblages
of vascular plants
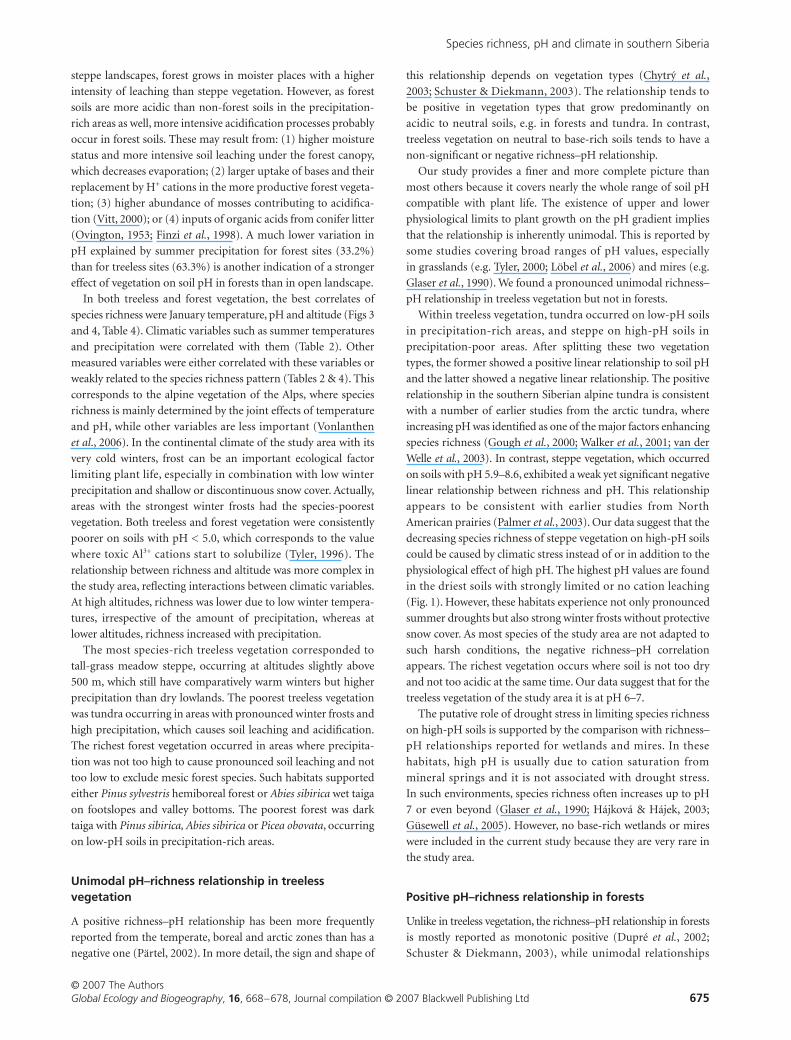
Species richness pH and climate in southern Siberia
copy 2007 The Authors Global Ecology and Biogeography 16 668ndash678 Journal compilation copy 2007 Blackwell Publishing Ltd 675
steppe landscapes forest grows in moister places with a higher
intensity of leaching than steppe vegetation However as forest
soils are more acidic than non-forest soils in the precipitation-
rich areas as well more intensive acidification processes probably
occur in forest soils These may result from (1) higher moisture
status and more intensive soil leaching under the forest canopy
which decreases evaporation (2) larger uptake of bases and their
replacement by H+ cations in the more productive forest vegeta-
tion (3) higher abundance of mosses contributing to acidifica-
tion (Vitt 2000) or (4) inputs of organic acids from conifer litter
(Ovington 1953 Finzi et al 1998) A much lower variation in
pH explained by summer precipitation for forest sites (332)
than for treeless sites (633) is another indication of a stronger
effect of vegetation on soil pH in forests than in open landscape
In both treeless and forest vegetation the best correlates of
species richness were January temperature pH and altitude (Figs 3
and 4 Table 4) Climatic variables such as summer temperatures
and precipitation were correlated with them (Table 2) Other
measured variables were either correlated with these variables or
weakly related to the species richness pattern (Tables 2 amp 4) This
corresponds to the alpine vegetation of the Alps where species
richness is mainly determined by the joint effects of temperature
and pH while other variables are less important (Vonlanthen
et al 2006) In the continental climate of the study area with its
very cold winters frost can be an important ecological factor
limiting plant life especially in combination with low winter
precipitation and shallow or discontinuous snow cover Actually
areas with the strongest winter frosts had the species-poorest
vegetation Both treeless and forest vegetation were consistently
poorer on soils with pH lt 50 which corresponds to the value
where toxic Al3+ cations start to solubilize (Tyler 1996) The
relationship between richness and altitude was more complex in
the study area reflecting interactions between climatic variables
At high altitudes richness was lower due to low winter tempera-
tures irrespective of the amount of precipitation whereas at
lower altitudes richness increased with precipitation
The most species-rich treeless vegetation corresponded to
tall-grass meadow steppe occurring at altitudes slightly above
500 m which still have comparatively warm winters but higher
precipitation than dry lowlands The poorest treeless vegetation
was tundra occurring in areas with pronounced winter frosts and
high precipitation which causes soil leaching and acidification
The richest forest vegetation occurred in areas where precipita-
tion was not too high to cause pronounced soil leaching and not
too low to exclude mesic forest species Such habitats supported
either Pinus sylvestris hemiboreal forest or Abies sibirica wet taiga
on footslopes and valley bottoms The poorest forest was dark
taiga with Pinus sibirica Abies sibirica or Picea obovata occurring
on low-pH soils in precipitation-rich areas
Unimodal pHndashrichness relationship in treeless vegetation
A positive richnessndashpH relationship has been more frequently
reported from the temperate boreal and arctic zones than has a
negative one (Paumlrtel 2002) In more detail the sign and shape of
this relationship depends on vegetation types (Chytry et al
2003 Schuster amp Diekmann 2003) The relationship tends to
be positive in vegetation types that grow predominantly on
acidic to neutral soils eg in forests and tundra In contrast
treeless vegetation on neutral to base-rich soils tends to have a
non-significant or negative richnessndashpH relationship
Our study provides a finer and more complete picture than
most others because it covers nearly the whole range of soil pH
compatible with plant life The existence of upper and lower
physiological limits to plant growth on the pH gradient implies
that the relationship is inherently unimodal This is reported by
some studies covering broad ranges of pH values especially
in grasslands (eg Tyler 2000 Loumlbel et al 2006) and mires (eg
Glaser et al 1990) We found a pronounced unimodal richnessndash
pH relationship in treeless vegetation but not in forests
Within treeless vegetation tundra occurred on low-pH soils
in precipitation-rich areas and steppe on high-pH soils in
precipitation-poor areas After splitting these two vegetation
types the former showed a positive linear relationship to soil pH
and the latter showed a negative linear relationship The positive
relationship in the southern Siberian alpine tundra is consistent
with a number of earlier studies from the arctic tundra where
increasing pH was identified as one of the major factors enhancing
species richness (Gough et al 2000 Walker et al 2001 van der
Welle et al 2003) In contrast steppe vegetation which occurred
on soils with pH 59ndash86 exhibited a weak yet significant negative
linear relationship between richness and pH This relationship
appears to be consistent with earlier studies from North
American prairies (Palmer et al 2003) Our data suggest that the
decreasing species richness of steppe vegetation on high-pH soils
could be caused by climatic stress instead of or in addition to the
physiological effect of high pH The highest pH values are found
in the driest soils with strongly limited or no cation leaching
(Fig 1) However these habitats experience not only pronounced
summer droughts but also strong winter frosts without protective
snow cover As most species of the study area are not adapted to
such harsh conditions the negative richnessndashpH correlation
appears The richest vegetation occurs where soil is not too dry
and not too acidic at the same time Our data suggest that for the
treeless vegetation of the study area it is at pH 6ndash7
The putative role of drought stress in limiting species richness
on high-pH soils is supported by the comparison with richnessndash
pH relationships reported for wetlands and mires In these
habitats high pH is usually due to cation saturation from
mineral springs and it is not associated with drought stress
In such environments species richness often increases up to pH
7 or even beyond (Glaser et al 1990 Haacutejkovaacute amp Haacutejek 2003
Guumlsewell et al 2005) However no base-rich wetlands or mires
were included in the current study because they are very rare in
the study area
Positive pHndashrichness relationship in forests
Unlike in treeless vegetation the richnessndashpH relationship in forests
is mostly reported as monotonic positive (Dupreacute et al 2002
Schuster amp Diekmann 2003) while unimodal relationships
M Chytryen et al
copy 2007 The Authors676 Global Ecology and Biogeography 16 668ndash678 Journal compilation copy 2007 Blackwell Publishing Ltd
are rare and negative relationships are exceptional The latter are
usually attributed to the confounding effects of factors other
than pH (Dupreacute et al 2002) Species richness in forests usually
increases steeply in acidic soils but the curve becomes less steep
above pH 55 and often levels off at a pH value close to 70 A
positive relationship is documented both from deciduous forests
of Europe (eg Brunet et al 1997 Dumortier et al 2002 Chytryet al 2003 Wohlgemuth amp Gigon 2003 Coudun amp Geacutegout
2005 Schuster amp Diekmann 2005) and North America (eg Peet
amp Christensen 1980 Brosofske et al 2001 Peet et al 2003) and
from coniferous forests in both continents (Rey Benayas 1995
Brosofske et al 2001 Zinko et al 2006) Palmer et al (2003)
pointed to the contrasting pHndashrichness relationships in Oklahoma
forests and prairies positive in the former and negative in the
latter The same pattern based on entirely different species pools
was found in forests and steppes in our study area (Fig 2)
We hypothesize that the predominance of the positive richnessndash
pH relationship in forests mainly results from the truncated pH
gradient at its base-rich end (Fig 5) There are two reasons for
this truncation First forest cannot grow at extremely dry sites
that only support grassland but these sites tend to have the
highest pH at least in the semi-arid areas such as forest-steppe
Second productive vegetation with trees tends to decrease soil
pH (Fig 1 Tyler 2003) Truncation of the pH gradient in forests
is also apparent in the meta-analysis of German case studies
(Schuster amp Diekmann 2003) where grasslands were often
recorded on soils with pH 7ndash8 but very few studies reported
forests on soils with pH gt 7 Because the truncation removes
habitats where species pool sizes have already started to decrease
due to drought stress most richnessndashpH relationships reported
in the literature from forests are monotonic positive Besides this
main explanation we suggest two other mechanisms that can
explain why the richnessndashpH curve of forest vegetation does not
usually decrease at high-pH conditions (Fig 5) First the species
richness of forests on soils with pH values of about 7 can be
partly increased by the mass effect at the forest-steppe ecotone
Forests on such soils which are usually rather dry contain
several species typical of adjacent dry grasslands These light-
demanding species find a suitable habitat under the open canopy
formed by pine or larch In contrast no such mass effect can
enhance the species richness of grasslands at pH 75ndash85 because
there are no sufficiently large species pools of other vegetation
types available for this pH range in the study area Second in dry
areas such as the forest-steppe zone the forest canopy maintains
higher air humidity in the understorey than in treeless habitats
(Moore et al 2000) Therefore forest richness may not be so
much limited by drought stress as is steppe richness on soils with
pH values of about 70ndash75
Species pools and the Pleistocene bottleneck
The species pool hypothesis predicts that the species richness of
particular habitats is correlated with the historical habitat com-
monness and associated opportunities for species accumulation
over evolutionary time (ie speciation minus extinction Aarssen
amp Schamp 2002) Over most of todayrsquos temperate zone of Eurasia
the Pleistocene climate was not only cool but was also dry (Frenzel
et al 1992) Such a climate supported the development of dry
calcium-rich soils over vast areas of cold steppe the habitat of
large Pleistocene herbivores (Guthrie 2001 Walker et al 2001)
Patches of coniferous forests also occurred in some areas mainly
in the mountains and wet lowland sites they have been recon-
structed from the full-glacial fossil data both from the Russianndash
Mongolian border area (Tarasov et al 2000) and from central
Europe (Willis et al 2000 Jankovskaacute et al 2002) Tundra was
confined to places with higher precipitation or lower evapotran-
spiration eg in the mountains or at non-glaciated higher latitudes
often in the close vicinity of steppe (Tarasov et al 2000)
The present-day landscape in some parts of southern Siberia
and Mongolia is probably the closest modern analogy to the
Pleistocene environments that existed in the non-glaciated part
of northern Eurasia It has to be pointed out that modern
analogies are never perfect Predictions based on analogies must
not be taken too seriously until there is independent and reliable
fossil evidence However if modern analogies exist they may
Figure 5 Conceptual model of species richness in treeless vegetation and forests across the combined gradient of decreasing precipitation and increasing pH On low-pH soils in precipitation-rich areas pools of species adapted to toxic effects of Al3+ and H+ ions are limited and species richness is low With decreasing precipitation and increasing pH richness first increases but subsequently decreases because of a limited pool of species adapted to very dry conditions In contrast forest richness does not decrease or decreases only slightly in precipitation-poor areas for the following reasons (1) forests do not occur in the driest areas so the extreme end of the precipitationndashpH gradient is truncated (2) forests occurring on their ecological limit have an open canopy and their herb layer is saturated by steppe species pools and (3) the protective effect of forest canopy maintains higher air humidity and reduces drought stress
Species richness pH and climate in southern Siberia
copy 2007 The Authors Global Ecology and Biogeography 16 668ndash678 Journal compilation copy 2007 Blackwell Publishing Ltd 677
provide valuable insights and enhance our understanding of
ecological patterns and processes in the past environments
The current study included vegetation types with the same
leading species as reconstructed from the full-glacial central
Europe (Willis et al 2000 Jankovskaacute et al 2002) and parts of
the study area had a climate corresponding to the cool periods
of the Pleistocene (Frenzel et al 1992) In southern Siberia the
richest vegetation is found on soils with a pH of 6ndash7 (Fig 2)
which are associated with moderate precipitation (Fig 1) If the
modern species richness of different habitats resulted from
speciation and extinction in the historically prevailing environ-
ments (species pool effects Aarssen amp Schamp 2002 Paumlrtel
2002 Ewald 2003) this pattern would suggest that such slightly
acidic to neutral soils were common in the pre-Holocene
environments of temperate Eurasia In contrast very dry calcium-
rich steppe or wet acidic tundra probably never supported
species-rich vegetation
Increasing precipitation in the Holocene especially in
areas with an oceanic climate caused large-scale soil acidification
(Roberts 1998) The species-pool hypothesis predicts that todayrsquos
acidic soils although prevailing in large areas are poor in species
because of the lack of calcifuge species which may have become
largely extinct during the Pleistocene (Ewald 2003) Such acidified
habitats are represented in the wetter parts of the study area by
taiga forests (in warmer climate) or by tundra (in cooler climate)
Both of these habitats are generally species poor but exhibit
positive richnessndashpH relationships for which the species pool
hypothesis provides a plausible explanation
ACKNOWLEDGEMENTS
We thank the local staff of our expeditions for their extensive
support during the fieldwork and two anonymous referees
for useful comments on the previous version of this paper
This research was supported from projects IAA6163303 from
the Grant Agency of the Academy of Sciences of the Czech
Republic and long-term research plans MSM0021622416 and
AVOZ60050516
REFERENCES
Aarssen LW amp Schamp BS (2002) Predicting distributions of
species richness and species sizes in regional floras applying the
species pool hypothesis to the habitat templet model Perspec-
tives in Plant Ecology Evolution and Systematics 5 3ndash12
Berglund BE Birks HJB Ralska-Jasiewiczowa M amp
Wright HE (1996) Palaeoecological events during the last
15000 years John Wiley amp Sons Chichester
Breiman L Friedman JH Olshen RA amp Stone CG (1984)
Classification and regression trees Wadsworth International
Group Belmont CA
Brosofske KD Chen J amp Crow TR (2001) Understory vegeta-
tion and site factors implications for a managed Wisconsin
landscape Forest Ecology and Management 146 75ndash87
Brunet J Falkengren-Grerup U Ruumlhling A amp Tyler G (1997)
Regional differences in floristic change in South Swedish oak
forests as related to soil chemistry and land use Journal of
Vegetation Science 8 329ndash336
Chytry M Tichy L amp Roleccedilek J (2003) Local and regional pat-
terns of species richness in Central European vegetation types
along the pHcalcium gradient Folia Geobotanica 38 429ndash
442
Coudun C amp Geacutegout J-C (2005) Ecological behaviour of
herbaceous forest species along a pH gradient a comparison
between oceanic and semicontinental regions in northern
France Global Ecology and Biogeography 14 263ndash270
Dumortier M Butaye J Jacquemyn H Van Camp N Lust N
amp Hermy M (2002) Predicting vascular plant species richness
of fragmented forests in agricultural landscapes in central
Belgium Forest Ecology and Management 158 85ndash102
Dupreacute C Wessberg C amp Diekmann M (2002) Species richness
in deciduous forests Effects of species pools and environmental
variables Journal of Vegetation Science 13 505ndash516
Ermakov N Dring J amp Rodwell J (2000) Classification of con-
tinental hemiboreal forests of North Asia Braun-Blanquetia
28 1ndash131
Ewald J (2003) The calcareous riddle why are there so many
calciphilous species in the Central European flora Folia
Geobotanica 38 357ndash366
Finzi AC Canham CD amp van Breemen N (1998) Canopy
treendashsoil interactions within temperate forests species effects
on pH and cations Ecological Applications 8 447ndash454
Frenzel B Peacutecsi M amp Velichko AA (eds) (1992) Atlas of
paleoclimates and paleoenvironments of the Northern
Hemisphere Geographical Research Institute Budapest amp
Gustav Fischer Verlag Stuttgart
Gidrometeoizdat (1966ndash1970) Spravochnik po klimatu SSSR
[Reference books on the climate of the USSR] Gidrometeoizdat
Leningrad
Gigon A (1987) A hierarchic approach in causal ecosystem
analysis the calcifuge-calcicole problem in alpine grasslands
Ecological Studies 61 228ndash244
Glaser PH Janssens JA amp Siegel DI (1990) The response of
vegetation to chemical and hydrological gradients in the Lost
River peatland northern Minnesota Journal of Ecology 78
1021ndash1048
Gough L Shaver GR Carroll J Royer DL amp Laundre JA
(2000) Vascular plant species richness in Alaskan arctic tundra
the importance of soil pH Journal of Ecology 88 54ndash66
Grubb PJ (1987) Global trends in species-richness in terrestrial
vegetation a view from the northern hemisphere Organiza-
tion of communities past and present (ed by JHR Gee and PS
Giller) pp 99ndash118 Blackwell Science Oxford
Guumlsewell S Bailey KM Roem WJ amp Bedford BL (2005)
Nutrient limitation and botanical diversity in wetlands can
fertilisation raise species richness Oikos 109 71ndash80
Guthrie RD (2001) Origin and causes of the mammoth steppe
a story of cloud cover woolly mammal tooth pits buckles
and inside-out Beringia Quaternary Science Reviews 20 549ndash
574
Haacutejkovaacute P amp Haacutejek M (2003) Species richness and above-
ground biomass of poor and calcareous spring fens in the
M Chytryen et al
copy 2007 The Authors678 Global Ecology and Biogeography 16 668ndash678 Journal compilation copy 2007 Blackwell Publishing Ltd
flysch West Carpathians and their relationships to water and
soil chemistry Preslia 75 271ndash287
Hilbig W (1995) The vegetation of Mongolia SPB Academic
Publishing Amsterdam
Jankovskaacute V Chromy P amp Niznianskaacute M (2002) Iacuteafaacuterka mdash
first palaeobotanical data of the character of Last Glacial
vegetation and landscape in the West Carpathians (Slovakia)
Acta Palaeobotanica 42 39ndash50
Loumlbel S Dengler J amp Hobohm C (2006) Species richness of
vascular plants bryophytes and lichens in dry grasslands the
effects of environment landscape structure and competition
Folia Geobotanica 41 377ndash393
Meusel H Jaumlger EJ Weinert E amp Rauschert S (1965ndash1992)
Vergleichende Chorologie der zentraleuropaumlischen Flora IndashIII
Gustav Fischer Verlag Jena
Moore KE Fitzjarrald DR Sakai RK amp Freedman JM
(2000) Growing season water balance at a boreal jack pine
forest Water Resources Research 36 483ndash493
Ovington JD (1953) Studies of the development of woodland
conditions under different trees I Soil pH Journal of Ecology
4113ndash52
Palmer MW Areacutevalo JR del Carmen Cobo M amp Earls PG
(2003) Species richness and soil reaction in a northeastern
Oklahoma landscape Folia Geobotanica 38 381ndash389
Paumlrtel M (2002) Local plant diversity patterns and evolutionary
history at the regional scale Ecology 83 2361ndash2366
Peet RK amp Christensen NL (1980) Hardwood forest vegeta-
tion of the North Carolina piedmont Veroumlffentlichungen des
Geobotanischen Institutes ETH Stiftung Ruumlbel Zuumlrich 69 14ndash
39
Peet RK Fridley JD amp Gramling JM (2003) Variation in
species richness and species pool size across a pH gradient
in forests of the southern Blue Ridge Mountains Folia
Geobotanica 38 391ndash401
Polikarpov NP Chebakova NM amp Nazimova DI (1986)
Klimat i gornye lesa Sibiri [Climate and mountain forests of
Siberia] Nauka Novosibirsk
Rey Benayas JM (1995) Patterns of diversity in the strata of
boreal montane forest in British Columbia Journal of Vegeta-
tion Science 6 95ndash98
Roberts N (1998) The Holocene an environmental history 2nd
edn Blackwell Science Oxford
Schuster B amp Diekmann M (2003) Changes in species density
along the soil pH gradient mdash evidence from German plant
communities Folia Geobotanica 38 367ndash379
Schuster B amp Diekmann M (2005) Species richness and
environmental correlates in deciduous forests of Northwest
Germany Forest Ecology and Management 206 197ndash205
Sjoumlrs H (1952) On the relation between vegetation and electrolytes
in north Swedish mire waters Oikos 2 241ndash258
Tarasov PE Volkova VS Webb T III Guiot J Andreev AA
Bezusko LG Bezusko TV Bykova GV Dorofeyuk NI
Kvavadze EV Osipova IM Panova NK amp Sevastyanov DV
(2000) Last glacial maximum biomes reconstructed from
pollen and plant macrofossil data from northern Eurasia
Journal of Biogeography 27 609ndash620
Taylor DR Aarssen LW amp Loehle C (1990) On the relationship
between rK selection and environmental carrying capacity
a new habitat templet for plant life history strategies Oikos 58
239ndash250
Tyler G (1996) Soil chemistry and plant distributions in rock
habitats of southern Sweden Nordic Journal of Botany 16
609ndash635
Tyler G (2000) Integrated analysis of conditions accounting
for intersite distribution of grassland plants Nordic Journal of
Botany 20 485ndash500
Tyler G (2003) Some ecophysiological and historical approaches
to species richness and calcicolecalcifuge behaviour mdash
contribution to a debate Folia Geobotanica 38 419ndash428
van der Welle MEW Vermeulen PJ Shaver GR amp Berendse F
(2003) Factors determining plant species richness in Alaskan
arctic tundra Journal of Vegetation Science 14 711ndash720
Vitt DH (2000) Peatlands ecosystems dominated by bryophytes
Bryophyte biology (ed by AJ Shaw and B Goffinet) pp 312ndash
343 Cambridge University Press Cambridge
Vonlanthen CM Kammer PM Eugster W Buumlhler A amp
Veit H (2006) Alpine vascular plant species richness the
importance of daily maximum temperature and pH Plant
Ecology 184 13ndash25
Walker DA Bockheim JG Chapin FS III Eugster W
Nelson FE amp Ping CL (2001) Calcium-rich tundra wildlife
and the lsquoMammoth Steppersquo Quaternary Science Reviews 20
149ndash163
Willis KJ Rudner E amp Suumlmegi P (2000) The full-glacial forests
of central and southeastern Europe Quaternary Research 53
203ndash213
Wohlgemuth T amp Gigon A (2003) Calcicole plant diversity in
Switzerland may reflect a variety of habitat templets Folia
Geobotanica 38 443ndash452
Zinko U Dynesius M Nilsson C amp Seibert J (2006) The role
of soil pH in linking groundwater flow and plant species
density in boreal forest landscapes Ecography 29 515ndash524
Editor Martin Sykes
BIOSKETCH
Milan Chytry is an associate professor of botany in the
Department of Botany and Zoology Masaryk University
Brno Czech Republic His research as well as research
by the co-authors is focused on vegetation ecology and
large-scale diversity patterns of multi-species assemblages
of vascular plants

M Chytryen et al
copy 2007 The Authors676 Global Ecology and Biogeography 16 668ndash678 Journal compilation copy 2007 Blackwell Publishing Ltd
are rare and negative relationships are exceptional The latter are
usually attributed to the confounding effects of factors other
than pH (Dupreacute et al 2002) Species richness in forests usually
increases steeply in acidic soils but the curve becomes less steep
above pH 55 and often levels off at a pH value close to 70 A
positive relationship is documented both from deciduous forests
of Europe (eg Brunet et al 1997 Dumortier et al 2002 Chytryet al 2003 Wohlgemuth amp Gigon 2003 Coudun amp Geacutegout
2005 Schuster amp Diekmann 2005) and North America (eg Peet
amp Christensen 1980 Brosofske et al 2001 Peet et al 2003) and
from coniferous forests in both continents (Rey Benayas 1995
Brosofske et al 2001 Zinko et al 2006) Palmer et al (2003)
pointed to the contrasting pHndashrichness relationships in Oklahoma
forests and prairies positive in the former and negative in the
latter The same pattern based on entirely different species pools
was found in forests and steppes in our study area (Fig 2)
We hypothesize that the predominance of the positive richnessndash
pH relationship in forests mainly results from the truncated pH
gradient at its base-rich end (Fig 5) There are two reasons for
this truncation First forest cannot grow at extremely dry sites
that only support grassland but these sites tend to have the
highest pH at least in the semi-arid areas such as forest-steppe
Second productive vegetation with trees tends to decrease soil
pH (Fig 1 Tyler 2003) Truncation of the pH gradient in forests
is also apparent in the meta-analysis of German case studies
(Schuster amp Diekmann 2003) where grasslands were often
recorded on soils with pH 7ndash8 but very few studies reported
forests on soils with pH gt 7 Because the truncation removes
habitats where species pool sizes have already started to decrease
due to drought stress most richnessndashpH relationships reported
in the literature from forests are monotonic positive Besides this
main explanation we suggest two other mechanisms that can
explain why the richnessndashpH curve of forest vegetation does not
usually decrease at high-pH conditions (Fig 5) First the species
richness of forests on soils with pH values of about 7 can be
partly increased by the mass effect at the forest-steppe ecotone
Forests on such soils which are usually rather dry contain
several species typical of adjacent dry grasslands These light-
demanding species find a suitable habitat under the open canopy
formed by pine or larch In contrast no such mass effect can
enhance the species richness of grasslands at pH 75ndash85 because
there are no sufficiently large species pools of other vegetation
types available for this pH range in the study area Second in dry
areas such as the forest-steppe zone the forest canopy maintains
higher air humidity in the understorey than in treeless habitats
(Moore et al 2000) Therefore forest richness may not be so
much limited by drought stress as is steppe richness on soils with
pH values of about 70ndash75
Species pools and the Pleistocene bottleneck
The species pool hypothesis predicts that the species richness of
particular habitats is correlated with the historical habitat com-
monness and associated opportunities for species accumulation
over evolutionary time (ie speciation minus extinction Aarssen
amp Schamp 2002) Over most of todayrsquos temperate zone of Eurasia
the Pleistocene climate was not only cool but was also dry (Frenzel
et al 1992) Such a climate supported the development of dry
calcium-rich soils over vast areas of cold steppe the habitat of
large Pleistocene herbivores (Guthrie 2001 Walker et al 2001)
Patches of coniferous forests also occurred in some areas mainly
in the mountains and wet lowland sites they have been recon-
structed from the full-glacial fossil data both from the Russianndash
Mongolian border area (Tarasov et al 2000) and from central
Europe (Willis et al 2000 Jankovskaacute et al 2002) Tundra was
confined to places with higher precipitation or lower evapotran-
spiration eg in the mountains or at non-glaciated higher latitudes
often in the close vicinity of steppe (Tarasov et al 2000)
The present-day landscape in some parts of southern Siberia
and Mongolia is probably the closest modern analogy to the
Pleistocene environments that existed in the non-glaciated part
of northern Eurasia It has to be pointed out that modern
analogies are never perfect Predictions based on analogies must
not be taken too seriously until there is independent and reliable
fossil evidence However if modern analogies exist they may
Figure 5 Conceptual model of species richness in treeless vegetation and forests across the combined gradient of decreasing precipitation and increasing pH On low-pH soils in precipitation-rich areas pools of species adapted to toxic effects of Al3+ and H+ ions are limited and species richness is low With decreasing precipitation and increasing pH richness first increases but subsequently decreases because of a limited pool of species adapted to very dry conditions In contrast forest richness does not decrease or decreases only slightly in precipitation-poor areas for the following reasons (1) forests do not occur in the driest areas so the extreme end of the precipitationndashpH gradient is truncated (2) forests occurring on their ecological limit have an open canopy and their herb layer is saturated by steppe species pools and (3) the protective effect of forest canopy maintains higher air humidity and reduces drought stress
Species richness pH and climate in southern Siberia
copy 2007 The Authors Global Ecology and Biogeography 16 668ndash678 Journal compilation copy 2007 Blackwell Publishing Ltd 677
provide valuable insights and enhance our understanding of
ecological patterns and processes in the past environments
The current study included vegetation types with the same
leading species as reconstructed from the full-glacial central
Europe (Willis et al 2000 Jankovskaacute et al 2002) and parts of
the study area had a climate corresponding to the cool periods
of the Pleistocene (Frenzel et al 1992) In southern Siberia the
richest vegetation is found on soils with a pH of 6ndash7 (Fig 2)
which are associated with moderate precipitation (Fig 1) If the
modern species richness of different habitats resulted from
speciation and extinction in the historically prevailing environ-
ments (species pool effects Aarssen amp Schamp 2002 Paumlrtel
2002 Ewald 2003) this pattern would suggest that such slightly
acidic to neutral soils were common in the pre-Holocene
environments of temperate Eurasia In contrast very dry calcium-
rich steppe or wet acidic tundra probably never supported
species-rich vegetation
Increasing precipitation in the Holocene especially in
areas with an oceanic climate caused large-scale soil acidification
(Roberts 1998) The species-pool hypothesis predicts that todayrsquos
acidic soils although prevailing in large areas are poor in species
because of the lack of calcifuge species which may have become
largely extinct during the Pleistocene (Ewald 2003) Such acidified
habitats are represented in the wetter parts of the study area by
taiga forests (in warmer climate) or by tundra (in cooler climate)
Both of these habitats are generally species poor but exhibit
positive richnessndashpH relationships for which the species pool
hypothesis provides a plausible explanation
ACKNOWLEDGEMENTS
We thank the local staff of our expeditions for their extensive
support during the fieldwork and two anonymous referees
for useful comments on the previous version of this paper
This research was supported from projects IAA6163303 from
the Grant Agency of the Academy of Sciences of the Czech
Republic and long-term research plans MSM0021622416 and
AVOZ60050516
REFERENCES
Aarssen LW amp Schamp BS (2002) Predicting distributions of
species richness and species sizes in regional floras applying the
species pool hypothesis to the habitat templet model Perspec-
tives in Plant Ecology Evolution and Systematics 5 3ndash12
Berglund BE Birks HJB Ralska-Jasiewiczowa M amp
Wright HE (1996) Palaeoecological events during the last
15000 years John Wiley amp Sons Chichester
Breiman L Friedman JH Olshen RA amp Stone CG (1984)
Classification and regression trees Wadsworth International
Group Belmont CA
Brosofske KD Chen J amp Crow TR (2001) Understory vegeta-
tion and site factors implications for a managed Wisconsin
landscape Forest Ecology and Management 146 75ndash87
Brunet J Falkengren-Grerup U Ruumlhling A amp Tyler G (1997)
Regional differences in floristic change in South Swedish oak
forests as related to soil chemistry and land use Journal of
Vegetation Science 8 329ndash336
Chytry M Tichy L amp Roleccedilek J (2003) Local and regional pat-
terns of species richness in Central European vegetation types
along the pHcalcium gradient Folia Geobotanica 38 429ndash
442
Coudun C amp Geacutegout J-C (2005) Ecological behaviour of
herbaceous forest species along a pH gradient a comparison
between oceanic and semicontinental regions in northern
France Global Ecology and Biogeography 14 263ndash270
Dumortier M Butaye J Jacquemyn H Van Camp N Lust N
amp Hermy M (2002) Predicting vascular plant species richness
of fragmented forests in agricultural landscapes in central
Belgium Forest Ecology and Management 158 85ndash102
Dupreacute C Wessberg C amp Diekmann M (2002) Species richness
in deciduous forests Effects of species pools and environmental
variables Journal of Vegetation Science 13 505ndash516
Ermakov N Dring J amp Rodwell J (2000) Classification of con-
tinental hemiboreal forests of North Asia Braun-Blanquetia
28 1ndash131
Ewald J (2003) The calcareous riddle why are there so many
calciphilous species in the Central European flora Folia
Geobotanica 38 357ndash366
Finzi AC Canham CD amp van Breemen N (1998) Canopy
treendashsoil interactions within temperate forests species effects
on pH and cations Ecological Applications 8 447ndash454
Frenzel B Peacutecsi M amp Velichko AA (eds) (1992) Atlas of
paleoclimates and paleoenvironments of the Northern
Hemisphere Geographical Research Institute Budapest amp
Gustav Fischer Verlag Stuttgart
Gidrometeoizdat (1966ndash1970) Spravochnik po klimatu SSSR
[Reference books on the climate of the USSR] Gidrometeoizdat
Leningrad
Gigon A (1987) A hierarchic approach in causal ecosystem
analysis the calcifuge-calcicole problem in alpine grasslands
Ecological Studies 61 228ndash244
Glaser PH Janssens JA amp Siegel DI (1990) The response of
vegetation to chemical and hydrological gradients in the Lost
River peatland northern Minnesota Journal of Ecology 78
1021ndash1048
Gough L Shaver GR Carroll J Royer DL amp Laundre JA
(2000) Vascular plant species richness in Alaskan arctic tundra
the importance of soil pH Journal of Ecology 88 54ndash66
Grubb PJ (1987) Global trends in species-richness in terrestrial
vegetation a view from the northern hemisphere Organiza-
tion of communities past and present (ed by JHR Gee and PS
Giller) pp 99ndash118 Blackwell Science Oxford
Guumlsewell S Bailey KM Roem WJ amp Bedford BL (2005)
Nutrient limitation and botanical diversity in wetlands can
fertilisation raise species richness Oikos 109 71ndash80
Guthrie RD (2001) Origin and causes of the mammoth steppe
a story of cloud cover woolly mammal tooth pits buckles
and inside-out Beringia Quaternary Science Reviews 20 549ndash
574
Haacutejkovaacute P amp Haacutejek M (2003) Species richness and above-
ground biomass of poor and calcareous spring fens in the
M Chytryen et al
copy 2007 The Authors678 Global Ecology and Biogeography 16 668ndash678 Journal compilation copy 2007 Blackwell Publishing Ltd
flysch West Carpathians and their relationships to water and
soil chemistry Preslia 75 271ndash287
Hilbig W (1995) The vegetation of Mongolia SPB Academic
Publishing Amsterdam
Jankovskaacute V Chromy P amp Niznianskaacute M (2002) Iacuteafaacuterka mdash
first palaeobotanical data of the character of Last Glacial
vegetation and landscape in the West Carpathians (Slovakia)
Acta Palaeobotanica 42 39ndash50
Loumlbel S Dengler J amp Hobohm C (2006) Species richness of
vascular plants bryophytes and lichens in dry grasslands the
effects of environment landscape structure and competition
Folia Geobotanica 41 377ndash393
Meusel H Jaumlger EJ Weinert E amp Rauschert S (1965ndash1992)
Vergleichende Chorologie der zentraleuropaumlischen Flora IndashIII
Gustav Fischer Verlag Jena
Moore KE Fitzjarrald DR Sakai RK amp Freedman JM
(2000) Growing season water balance at a boreal jack pine
forest Water Resources Research 36 483ndash493
Ovington JD (1953) Studies of the development of woodland
conditions under different trees I Soil pH Journal of Ecology
4113ndash52
Palmer MW Areacutevalo JR del Carmen Cobo M amp Earls PG
(2003) Species richness and soil reaction in a northeastern
Oklahoma landscape Folia Geobotanica 38 381ndash389
Paumlrtel M (2002) Local plant diversity patterns and evolutionary
history at the regional scale Ecology 83 2361ndash2366
Peet RK amp Christensen NL (1980) Hardwood forest vegeta-
tion of the North Carolina piedmont Veroumlffentlichungen des
Geobotanischen Institutes ETH Stiftung Ruumlbel Zuumlrich 69 14ndash
39
Peet RK Fridley JD amp Gramling JM (2003) Variation in
species richness and species pool size across a pH gradient
in forests of the southern Blue Ridge Mountains Folia
Geobotanica 38 391ndash401
Polikarpov NP Chebakova NM amp Nazimova DI (1986)
Klimat i gornye lesa Sibiri [Climate and mountain forests of
Siberia] Nauka Novosibirsk
Rey Benayas JM (1995) Patterns of diversity in the strata of
boreal montane forest in British Columbia Journal of Vegeta-
tion Science 6 95ndash98
Roberts N (1998) The Holocene an environmental history 2nd
edn Blackwell Science Oxford
Schuster B amp Diekmann M (2003) Changes in species density
along the soil pH gradient mdash evidence from German plant
communities Folia Geobotanica 38 367ndash379
Schuster B amp Diekmann M (2005) Species richness and
environmental correlates in deciduous forests of Northwest
Germany Forest Ecology and Management 206 197ndash205
Sjoumlrs H (1952) On the relation between vegetation and electrolytes
in north Swedish mire waters Oikos 2 241ndash258
Tarasov PE Volkova VS Webb T III Guiot J Andreev AA
Bezusko LG Bezusko TV Bykova GV Dorofeyuk NI
Kvavadze EV Osipova IM Panova NK amp Sevastyanov DV
(2000) Last glacial maximum biomes reconstructed from
pollen and plant macrofossil data from northern Eurasia
Journal of Biogeography 27 609ndash620
Taylor DR Aarssen LW amp Loehle C (1990) On the relationship
between rK selection and environmental carrying capacity
a new habitat templet for plant life history strategies Oikos 58
239ndash250
Tyler G (1996) Soil chemistry and plant distributions in rock
habitats of southern Sweden Nordic Journal of Botany 16
609ndash635
Tyler G (2000) Integrated analysis of conditions accounting
for intersite distribution of grassland plants Nordic Journal of
Botany 20 485ndash500
Tyler G (2003) Some ecophysiological and historical approaches
to species richness and calcicolecalcifuge behaviour mdash
contribution to a debate Folia Geobotanica 38 419ndash428
van der Welle MEW Vermeulen PJ Shaver GR amp Berendse F
(2003) Factors determining plant species richness in Alaskan
arctic tundra Journal of Vegetation Science 14 711ndash720
Vitt DH (2000) Peatlands ecosystems dominated by bryophytes
Bryophyte biology (ed by AJ Shaw and B Goffinet) pp 312ndash
343 Cambridge University Press Cambridge
Vonlanthen CM Kammer PM Eugster W Buumlhler A amp
Veit H (2006) Alpine vascular plant species richness the
importance of daily maximum temperature and pH Plant
Ecology 184 13ndash25
Walker DA Bockheim JG Chapin FS III Eugster W
Nelson FE amp Ping CL (2001) Calcium-rich tundra wildlife
and the lsquoMammoth Steppersquo Quaternary Science Reviews 20
149ndash163
Willis KJ Rudner E amp Suumlmegi P (2000) The full-glacial forests
of central and southeastern Europe Quaternary Research 53
203ndash213
Wohlgemuth T amp Gigon A (2003) Calcicole plant diversity in
Switzerland may reflect a variety of habitat templets Folia
Geobotanica 38 443ndash452
Zinko U Dynesius M Nilsson C amp Seibert J (2006) The role
of soil pH in linking groundwater flow and plant species
density in boreal forest landscapes Ecography 29 515ndash524
Editor Martin Sykes
BIOSKETCH
Milan Chytry is an associate professor of botany in the
Department of Botany and Zoology Masaryk University
Brno Czech Republic His research as well as research
by the co-authors is focused on vegetation ecology and
large-scale diversity patterns of multi-species assemblages
of vascular plants
Copyright © 2022 FDOKUMEN