Ten New Genera of Oryzomyine Rodents (Cricetidae: Sigmodontinae)

DOI 10.1515/mammalia-2012-0050 Mammalia 2012; aop
Giovanni Amori *, Federica Chiozza , Bruce D. Patterson , Carlo Rondinini , Jan Schipper
and Luca Luiselli
Species richness and distribution of Neotropical rodents, with conservation implications
Abstract: The correlates of species richness and conser-
vation status of South American rodents were studied
by analyzing the ranges of 791 species (belonging to 159
genera and 16 families). The distribution data (size of
each species ’ range in km 2 ) and the relative quantity of
each macrohabitat type (in km 2 ) were obtained from the
Global Mammal Assessment data bank of the Interna-
tional Union for Conservation of Nature (IUCN), and the
Global Land Cover 2000, respectively. We excluded mainly
island species from analyses but included those species
that occur on both islands and the mainland. Habitats
were grouped according to seven categories (shrubland,
forest, grassland, savannah, wetlands, desert, and artifi-
cial). Mean range sizes varied significantly among fami-
lies, with members of the family Cuniculidae having larger
ranges than the species belonging to the rest of the fami-
lies. Mean range size did not differ significantly between
endemic and non-endemic taxa. There was a significant
positive relation between total species richness and the
availability of habitat types. Specialized species (i.e.,
those linked to a single habitat type) were found espe-
cially in forests, but shrublands and grasslands were also
important. IUCN threatened species were distributed in a
scattered way, and essentially in forests, grasslands, and
shrublands. No region of the Neotropics housed more
than two to three threatened taxa, apart from a spot in
north-central Peru with five species. The richness of IUCN
threatened species was higher in the montane forest eco-
systems of the Andes, north-central Peru, than in other
areas of South America. There was a mismatch between
the hotspot maps for threatened and endemic species. The
conservation implications of these patterns are discussed.
Keywords: conservation; correlates of distribution;
macro ecology; Rodentia; South America.
*Corresponding author: Giovanni Amori, CNR , Institute of
Ecosystem Studies, Viale dell ’ Universit à 32, 00185 Rome , Italy ,
E-mail: [email protected]
Federica Chiozza: Department of Biology and Biotechnology
‘ Charles Darwin ’ , Viale dell ’ Universit à 32, 00185 Rome , Italy
Bruce D. Patterson: Department of Zoology , Field Museum of Natural
History, 1400 South Lake Shore Drive, Chicago, IL 60605 , USA
Carlo Rondinini: Department of Biology and Biotechnology ‘ Charles
Darwin ’ , Viale dell ’ Universit à 32, 00185 Rome , Italy
Jan Schipper: Big Island Invasive Species Committee , 23 East Kawili
Street, Hilo, HI 96720 , USA
Luca Luiselli: Centre of Environmental Studies Demetra s.r.l. ,
Eni Spa Environmental Department, via Olona 7, 00198 Rome , Italy
Introduction Macroecological spatial diversity patterns are among
the most intriguing issues in modern ecology and bio-
geography theories (e.g., Lennon et al. 2001 , Koleff
et al. 2003a ). Hence, ecologists have spent considerable
effort in distinguishing between different components
of species diversity, including alpha or local diversity
( α ), beta diversity or differentiation ( β ), and gamma or
regional diversity ( γ ) (e.g., Lennon et al. 2001 , Koleff
et al. 2003a,b ). The various components of species
diversity have both biogeographic and ecological under-
pinnings, with the biogeographic aspects explaining
taxonomic distinctiveness and/or endemism rates and
ecological aspects explaining the reasons behind counts
of the number of species in a given geographic area. It is
well demonstrated that areas rich in endemics are often
also species rich, although patterns in species richness
and endemism are not always positively related (Ceballos
and Brown 1995 ).
Several ecological and evolutionary hypotheses have
been formulated during the last 200 years to explain geo-
graphic patterns in richness, with many hypotheses being
conjectural or untestable. As a consequence, there is an
increasing effort to reduce the number of hypotheses into
a minimum set of testable and plausible ones (see Jetz and
Rahbek 2001 , Mittelbach et al. 2007 , Terribile and Diniz -
Filho 2009 ). Obviously, many factors may affect a species ’
geographic distribution (Whittaker et al. 2001 , Anderson
et al. 2002a , Hawkins et al. 2003a ), and the extent of the
main habitats suitable for a given species may play a con-
siderable role in determining the extent of its geographic
range (e.g., Anderson et al. 2002b , Hawkins et al. 2003a,b ,
Willig et al. 2003 , Hawkins 2004 ).
Authenticated | 107.0.125.4Download Date | 9/14/12 5:13 PM

2 G. Amori et al.: South American rodent distributions
Rodents are the most important group of mammals in
terms of the number of species (Wilson and Reeder 2005 ),
and they are widespread and very speciose in the Neo-
tropics (Patterson 2000 ). A number of studies have exam-
ined the determinants of the species distribution of some
select groups of South American rodents (e.g., Arita et al.
1997 , Patterson 2000 , Anderson et al. 2002a,b , Anderson
and Martinez -Meyer 2004 ), and there is also an all-taxon
study on the environmental correlates of species richness
in mammals of South America (Ruggiero and Kitzberger
2004 ). Focusing on rodent species, we analyze in this
article the geographic patterns of species richness and
the richness of those species considered threatened by
the International Union for Conservation of Nature (IUCN
2011 ) in South America and part of Central America also
in relation to the various major habitat types ( = vegetation
zones), and discuss the conservation implications of our
results.
Materials and methods
Data sources
For this study, we included the Neotropical geographic
region ( sensu Udvardy 1975 ), including also central and
northern Mexico but excluding the Caribbean islands and
islets (Udvardy 1975 ; Figure 1 ). Northern Mexico, although
not belonging to the Neotropical region, was included
for practical reasons, as there is no clear demarcation
between Neotropical and Nearctic Mexico in the distri-
bution summaries of IUCN (2011) . The Caribbean islands
were excluded because most of the rodents are endemic or
extinct and their distributions have been grossly altered
by human settlement, both Amerindian and European
(Morgan and Woods 1986 , D á valos and Turvey 2012 ). This
would have greatly confounded the understanding of the
main patterns relative to mainland South America. While
we excluded strictly insular species from analyses, we
nonetheless included those species that occur on both
islands and the mainland.
Overall, we collated range-size data for 791 species
belonging to 159 genera and 16 families (following
the taxonomy adopted by IUCN 2011 ). Habitats were
grouped according to seven categories, mapped using the
GlobCover Land Cover v2 2008 database (2008): culti-
vated, forest, grassland, shrubland, artificial, and bare
( = open areas) (Figure 1). However, for the conservation
analyses, we split one category (forest) into two subcate-
gories (dry forest, simply named as ‘ forest ’ and flooded
forest, renamed as ‘ flooded ’ ) in order to more deeply
evaluate the relative importance of the different types of
forest at the continental level. The total availability of the
various habitat categories across the study region (in km 2 )
was obtained from the GlobCover database (Table 1 ).
Distribution data for each species (size range in km 2 )
were obtained from the 2011 IUCN Red List (IUCN 2011 ). We
removed from analyses those species that were not classi-
fied to defined habitat categories (i.e., unknown, other) in
the original IUCN (2011) table, or that had an incomplete
database. Thus, whereas for analyses of species richness
we considered 791 species, for analyses of habitats we con-
sidered only 701 species. It should be noted that the IUCN
Red List is updated every year, and especially for Roden-
tia it may be dated as new rodent species are continually
LegendCultivatedForestGrasslandShrublandArtificialBare
0 1000 2000 3000 4000km
Figure 1 Map of the Neotropical biogeographic region (modified
from Udvardy 1975 ), including the main macrohabitat types that
have been used for the present study.
Habitat category Surface (km 2 )
Cultivated 2,608,656
Forest (including flooded) 11,519,657
Grassland (including savannahs) 1,675,596
Shrubland 3,412,028
Artificial 14,344
Bare 531,286
Table 1 Relative availability of the various habitat categories
across the studied region.
Data from the Global Land Cover 2000 database.
Authenticated | 107.0.125.4Download Date | 9/14/12 5:13 PM

G. Amori et al.: South American rodent distributions 3
being described. Maps were generated using ArcGIS 10.0
(ESRI 2010 ).
Statistical analyses
All data were checked for normality and homoscedastic-
ity before any tests. When data were normally distributed
(either with or without log transformation), parametric
tests were used. Otherwise, non-parametric tests were
used (Zar 1984 ). Levene ’ s test was used to test for the para-
metric distribution of variables (Zar 1984 ).
Differences in mean range size among rodent families
were tested by one-way univariate analyses of variance
(ANOVAs) followed by Tukey honest significance post hoc
tests. Welch ANOVA design was used when variances were
heterogeneous. To evaluate whether species occurring in
multiple habitat types had larger ranges than more spe-
cialized species, we ran a Spearman ’ s rank correlation
with the range extent of each species as the dependent
variable, and the number of habitat types of occurrence
for that species as the independent variable. For this anal-
ysis, we defined as ‘ specialized ’ those species that were
restricted to a single habitat type.
It should be noted that geographic assignment of
habitat associations may be imprecise, especially for
habitat specialists living in diversified landscapes. For
example, Abrocoma uspallata Braun and Mares, 2002 is
thought to be a creosote specialist but was assigned to
shrublands, savannahs, and flooded because all these
habitats surround its known distribution. Detailed auteco-
logical studies are lacking for many of the species included
in this analysis, so that the uniformity afforded by geo-
graphic land-cover assignments outweighs its imprecision.
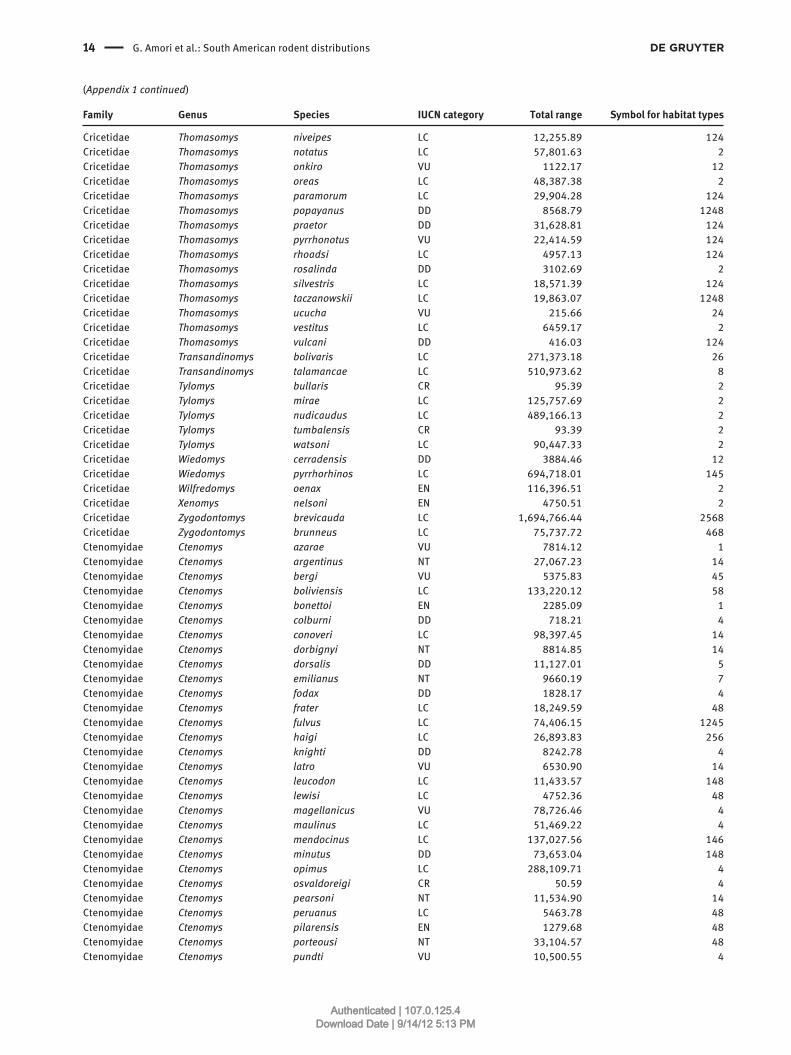
Results The list of species included in this study, with their distri-
bution extent and IUCN (2011) category, is given in Appen-
dix 1 . In terms of species richness, some main areas were
identified (Figure 2 ): (i) Andean Yungas, (ii) Western Ama-
zonia, (iii) Guianan forests, and (iv) Atlantic forests.
The mean sizes of the total ranges (in km 2 ) varied sig-
nificantly among families (one-way ANOVA: F 14,763
= 6.482,
p < 0.000001) (Figure 3 ). Tukey HSD post hoc pairwise
comparisons showed that members of the family Cunicu-
lidae, particularly Cuniculus paca (Linnaeus 1766), had
larger ranges than any other families, followed by Myocas-
toridae, Caviidae, Dasyproctidae, and Erethizontidae. Of
0 1000
>3020–30
10–205–100–5
2000 3000 4000km
Richness
Figure 2 Map of the Neotropical biogeographic region (modified
from Udvardy 1975 ), showing the main areas of rodent species
richness.
(i) Andean Yungas; (ii) Western Amazonia; (iii) Guianan lowlands;
(iv) Brazilian Atlantic forests.
the five above-mentioned families, only the Erethizonti-
dae were not endemic to the Neotropical region. However,
closer inspection of the data revealed that mean range
size did not differ significantly between endemic and non-
endemic taxa (one-way ANOVA: F 1789
= 0.005, p = 0.942).
There was a significant positive relation between total
species richness and the availability of habitat types
(r = 0.453, n = 7, p < 0.001).
Overall, the number of habitats occupied was posi-
tively influenced by range size (Spearman ’ s r = 0.243,
n = 791, p < 0.0001). Species linked to a single habitat type
were found more frequently in forests (n = 224 species)
than in other habitat types, with shrublands coming
second (n = 44) and grassland coming third (n = 7) (overall:
χ 2 = 467.39, df = 3, p < 0.000001). Species occurring only in
single habitat types differed significantly in mean range
sizes (Welch ANOVA for unequal variances: F 3276
= 11.52,
p < 0.001), with forest-only species having larger range
sizes (x = 300,485.7 ± 895,144 km 2 , n = 224) than those
living in shrublands (x = 168,535.5 ± 274,314 km 2 , n = 44),
grasslands (x = 102,419.3 ± 133,993 km 2 , n = 7), and bare
(x = 16,054.1 ± 19,575 km 2 , n = 4). The range size of species
inhabiting a single habitat type was not influenced by
the relative availability of their preferred habitat types
in the region under study (Monte Carlo regression with
Authenticated | 107.0.125.4Download Date | 9/14/12 5:13 PM

4 G. Amori et al.: South American rodent distributions
1000 iterations; observed r = 0.13, mean of the simulated
r = -0.006, simulated variance = 0.0125, p (obs.
≤ exp.)
= 0.422,
p (obs.
≥ exp.)
= 0.588).
IUCN threatened species were geographically scat-
tered, with no area housing more than two to three taxa
apart from an area in north-central Peru (Figure 4 ). Hence,
the distribution of threatened taxa appeared to be mainly
0
1
2
3
4
5
0 1000 2000 3000 4000km
Richnessthreatened species
Figure 4 Map of the Neotropical biogeographic region (modified
from Udvardy 1975 ), showing the main areas of richness of
threatened rodent species according to IUCN (2011) lists.
2e7
1.6e7
1.2e7
8e6
4e6
-4e6
Ran
ge e
xten
t (sq
uare
d km
)
Abr
ocom
idae
Cav
iidae
Chi
nchi
llida
e
Cric
etid
ae
Cte
nom
yida
e
Cun
icul
idae
Das
ypro
ctid
ae
Din
omyi
dae
Ech
imyi
dae
Ere
thiz
ontid
ae
Geo
myi
dae
Het
erom
yida
e
Myo
cast
orid
ae
Oct
odon
tidae
Sci
urid
ae
0
Family
Mean
±Std. dev.±Std. err.
Figure 3 Means and dispersion measures (S.D.) of the total range size of South American rodent species grouped by family.
More statistical details in the text.
parapatric in the studied region. The richness of IUCN
threatened species was higher (n = 5) in the montane
forest ecosystems of the Andes, north-central Peru, than
in other areas of South America (Figure 4). There was an
uneven distribution of the number of threatened species
by habitat type (Monte Carlo χ 2 = 93.05, 1000 random
iterations done; mean of simulated values = 13.76 ± 28.17,
p < 0.000001). Overall, the forest, shrubland, and grass-
land habitat types housed the great majority of threatened
taxa (Figure 5 ), with forest being the principal habitat
type. There was a significant relation between the area of
45
40
35
30
No.
of s
peci
es
25
20
15
10
5
0Forest Shrubland Grassland
Habitat type
CR
EN
VU
Flooded Bare Cultivated
Figure 5 Distribution of the number of threatened South American
rodent species (according to IUCN 2011 Red listing) divided by
habitat type.
VU, vulnerable; EN, endangered; CR, critically endangered. Note
that in this graphic, the category ‘ Cultivated ’ also includes
‘ Artificial ’ .
Authenticated | 107.0.125.4Download Date | 9/14/12 5:13 PM

G. Amori et al.: South American rodent distributions 5
each habitat type (in km 2 ) and the number of threatened
species (Spearman ’ s r s = 0.892, n = 6, p = 0.041).
Discussion A principal result of this study is the identification and
delimitation of three main richness areas for South Ameri-
can rodents: the western margins of the Amazon Basin, the
Guianan Shield, and the Brazilian Shield. Each of these
areas is associated with ancient geological formations that
have persisted as dry land despite the formation of epicon-
tinental seas as recently as the Miocene (Campbell 1990 ,
Hoorn 2006 , Kaandorp et al. 2006 , Velazco and Patterson
2008 ). In addition, each is adjacent to mountain chains
offering an array of neighboring habitats and potential
colonists: the Andes (and proto-Andes before they reached
their present heights; Orme 2007 ) in the case of the western
Amazon, the tepuis in the case of the Guianan Shield, and
the Serra do Mar and adjacent high plateau in the case of the
Brazilian Shield. As a result, each lies adjacent to a diverse
and distinctive center of mammalian endemism (Solari
et al. 2012 ), forming a kind of biological ecotone. The
western Amazon is populated mainly by lowland forest
species (Amazonian region); however, its richness is
enhanced by Andean versant species such as Sciurus ignitus (Gray 1867) and Neacomys spinosus (Thomas 1882)
that extend far into the basin (IUCN 2011 ). Similarly, the
Guianan Shield is populated by a diversity of Amazonian
taxa with widespread distributions, coupled with an
admixture of highland endemics that in many cases have
Andean affinities (Lim 2012 ). The Brazilian Shield harbors
a diverse collection of Atlantic Forest and montane ende-
mics (Costa et al. 2000 , Carmignotto et al. 2012 ), but also
includes the open and savannah formations of the Cerrado,
South America ’ s second most extensive biome (Eiten 1972 ).
Surprisingly, the Brazilian Atlantic forests do not harbor
a remarkable diversity of threatened rodent taxa, in con-
trast with other vertebrate taxa (Fonseca 1985 , Brown and
Brown 1992 , Chiarello 1999 ). This is apparently due to the
low overlap in the respective ranges of the threatened taxa
(for instance, the genus Chaetomys ), which are in general
characterized by very narrow ranges. Hence, the cumula-
tive number of threatened taxa is high but their spatial
overlap is low across this region. Low overlaps in the
ranges of threatened taxa were also observed for the rest of
the South American territory, thus resulting in a generally
low richness of threatened taxa by region (Figure 4).
We also showed that shrublands, grasslands, and
forests are in general the principal habitat types for South
American rodents, and that the forest-specialist species
tended to have wider ranges than those inhabiting only
shrublands or grasslands. This evidence is in contrast with
Rapoport ’ s (1982) rule, which predicts smaller ranges at
the equator where forests predominate. However, it should
be stressed that the Rapoport ’ s rule is a generally local
phenomenon (Rohde 1996 ), restricted to the Palaearctic
and Nearctic above a latitude of approximately 40 – 50 ° N,
and cannot be applied to the tropics (but see Amori et al.
2009a,b , Amori et al. 2010 for different conclusions on
Sciuridae genera). We suggest that the relatively homoge-
neous structure of the Amazon forest may explain the large
ranges of forest rodents in South America. Indeed, several
studies pointed out that the Amazonia is ecologically so
uniform that present-day ecological conditions are rather
insignificant in determining species distribution patterns
and speciation (Tuomisto and Ruokolainen 1997 ). It is
noteworthy that in another study, on the basis of entirely
different methods, habitat heterogeneity was considered
to be a main driver of species richness among South Ameri-
can mammals (Ruggiero and Kitzberger 2004 ).
Our study also pointed out that habitat availabil-
ity also positively influenced rodent species richness,
thus being consistent with the general rules of species-
area relations (e.g., Palmer and White 1994 , Hanski and
Gyllenberg 1997 ). Although our study provided evidence
that shrublands and grasslands have considerable rele-
vance, it is also evident that forests housed the great
majority of threatened rodent species. Thus, it is clear that
conservationists should focus their attention mainly on the
forest habitat type, including of course the montane forests
of the Andes. Nonetheless, focusing our conservation
efforts to the habitat mosaics ‘ forest-grassland-shrubland ’
may probably be very effective in accurately preserving
most of the vulnerable rodent diversity of South America.
In this regard, it would be mentioned, however, that the
apparent prominence of threatened rodent diversity into
forests could be also due to (i) the wider distribution of the
forests relative to other habitat types, and (ii) the fact that
the forest biomes have been until today more studied than
the other biomes with shrub and open habitats, at least in
South America. This latter hypothesis is, however, unlikely,
given the very active mammalogy programs of Argentina
and Chile. In addition, the patterns of species discovery
(especially in the yungas of Peru and Ecuador) also argue
otherwise (see Voss 2003 , Patterson et al. 2012 ).
Acknowledgements: We are indebted to Nate Upham and
two anonymous referees for their helpful suggestions on
the draft version of this article.
Received April 3, 2012; accepted July 17, 2012
Authenticated | 107.0.125.4Download Date | 9/14/12 5:13 PM

6 G. Amori et al.: South American rodent distributions
Family Genus Species IUCN category Total range Symbol for habitat types
Abrocomidae Abrocoma bennettii LC 54,855.38 1
Abrocomidae Abrocoma vaccarum DD 37.18 4
Abrocomidae Abrocoma boliviensis CR 64.74 23
Abrocomidae Abrocoma budini DD 405.50 34
Abrocomidae Abrocoma cinerea LC 443,829.09 34
Abrocomidae Abrocoma famatina DD 3306.52 34
Abrocomidae Abrocoma schistacea DD 715.16 34
Abrocomidae Abrocoma uspallata DD 14.32 145
Abrocomidae Cuscomys ashaninka DD 44.23 2
Caviidae Dolichotis salinicola LC 575,693.97 5
Caviidae Cavia fulgida LC 293,747.55 24
Caviidae Cavia magna LC 50,054.72 24
Caviidae Cavia tschudii LC 632,826.82 246
Caviidae Cavia aperea LC 7,003,978.95 345
Caviidae Dolichotis patagonum NT 1,030,502.13 124
Caviidae Galea musteloides LC 1,925,425.37 14
Caviidae Galea flavidens LC 146,910.79 35
Caviidae Galea spixii LC 2,836,451.08 35
Caviidae Hydrochoerus isthmius DD 298,961.23 26
Caviidae Hydrochoerus hydrochaeris LC 12,393,875.86 256
Caviidae Kerodon rupestris LC 1,172,999.06 35
Caviidae Kerodon acrobata DD 3708.56 235
Caviidae Microcavia niata LC 202,933.59 46
Caviidae Microcavia shiptoni NT 20,783.34 48
Caviidae Microcavia australis LC 1,516,544.82 257
Chinchillidae Lagidium peruanum LC 370,954.56 3
Chinchillidae Lagidium viscacia LC 762,822.31 3
Chinchillidae Lagidium wolffsohni DD 11,213.32 3
Chinchillidae Chinchilla lanigera CR 2070.28 13
Chinchillidae Chinchilla chinchilla CR 11,943.02 34
Chinchillidae Lagostomus maximus LC 1,988,086.68 457
Cricetidae Abrawayaomys ruschii LC 7947.73 2
Cricetidae Abrothrix illuteus NT 35,267.93 2
Cricetidae Abrothrix markhami LC 6091.15 2
Cricetidae Abrothrix sanborni NT 22,140.43 2
Cricetidae Abrothrix lanosus LC 40,594.09 12
Cricetidae Abrothrix andinus LC 612,703.70 14
Cricetidae Abrothrix hershkovitzi LC 281.17 26
Cricetidae Abrothrix jelskii LC 498,019.62 1348
Cricetidae Abrothrix longipilis LC 717,944.26 1246
Cricetidae Abrothrix olivaceus LC 1,083,376.85 124
Cricetidae Aegialomys xanthaeolus LC 258,914.46 1278
Cricetidae Aepeomys lugens LC 9497.29 124
Cricetidae Aepeomys reigi VU 5527.84 124
Cricetidae Akodon aerosus LC 114,173.55 248
Cricetidae Akodon affinis LC 42,194.84 28
Cricetidae Akodon albiventer LC 402,031.20 48
Cricetidae Akodon aliquantulus DD 482.07 4
Cricetidae Akodon azarae LC 1,227,619.52 126
Cricetidae Akodon bogotensis LC 60,127.39 248
Cricetidae Akodon boliviensis LC 217,523.13 148
Cricetidae Akodon budini LC 19,875.90 2
Cricetidae Akodon cursor LC 824,312.28 2
Cricetidae Akodon dayi LC 289,349.54 248
Cricetidae Akodon dolores LC 54,979.73 1
Cricetidae Akodon fumeus LC 151,083.68 1248
Appendix
Authenticated | 107.0.125.4Download Date | 9/14/12 5:13 PM

G. Amori et al.: South American rodent distributions 7
Family Genus Species IUCN category Total range Symbol for habitat types
Cricetidae Akodon iniscatus LC 573,428.25 1248
Cricetidae Akodon juninensis LC 115,443.54 48
Cricetidae Akodon kofordi LC 13,610.45 1234
Cricetidae Akodon latebricola VU 5994.65 124
Cricetidae Akodon leucolimnaeus DD 336.59 4
Cricetidae Akodon lindberghi DD 6824.02 4
Cricetidae Akodon lutescens LC 177,992.51 12468
Cricetidae Akodon mimus LC 57,422.78 28
Cricetidae Akodon molinae LC 429,206.15 138
Cricetidae Akodon mollis LC 265,417.52 148
Cricetidae Akodon montensis LC 1,050,553.53 256
Cricetidae Akodon mystax DD 470.56 146
Cricetidae Akodon neocenus DD 35,745.91 14
Cricetidae Akodon oenos DD 941.89 17
Cricetidae Akodon orophilus LC 33,885.90 1248
Cricetidae Akodon paranaensis LC 323,453.10 2
Cricetidae Akodon pervalens DD 29,100.43 12
Cricetidae Akodon philipmyersi DD 2113.68 124
Cricetidae Akodon reigi LC 65,883.53 26
Cricetidae Akodon sanctipaulensis DD 758.20 14
Cricetidae Akodon serrensis LC 276,085.74 2
Cricetidae Akodon siberiae NT 32,141.03 2
Cricetidae Akodon simulator LC 156,795.27 124
Cricetidae Akodon spegazzinii LC 56,731.75 24
Cricetidae Akodon subfuscus LC 170,890.24 248
Cricetidae Akodon surdus VU 15,831.52 2
Cricetidae Akodon sylvanus LC 39,317.76 24
Cricetidae Akodon toba LC 443,667.53 1
Cricetidae Akodon torques LC 66,655.10 1248
Cricetidae Akodon varius DD 244,626.29 12
Cricetidae Amphinectomys savamis DD 991.19 26
Cricetidae Andalgalomys olrogi LC 57,113.12 1
Cricetidae Andalgalomys pearsoni LC 139,013.47 4
Cricetidae Andinomys edax LC 228,610.36 148
Cricetidae Anotomys leander VU 6989.74 246
Cricetidae Auliscomys boliviensis LC 210,617.12 1346
Cricetidae Auliscomys pictus LC 309,575.48 1348
Cricetidae Auliscomys sublimis LC 393,458.69 134
Cricetidae Bibimys chacoensis LC 27,944.43 1
Cricetidae Bibimys labiosus LC 361,605.07 2
Cricetidae Bibimys torresi NT 4381.17 46
Cricetidae Blarinomys breviceps LC 437,137.28 2
Cricetidae Brucepattersonius albinasus DD 312.08 2
Cricetidae Brucepattersonius griserufescens DD 12,637.11 2
Cricetidae Brucepattersonius guarani DD 1540.06 2
Cricetidae Brucepattersonius igniventris DD 13,350.77 2
Cricetidae Brucepattersonius iheringi LC 178,516.22 28
Cricetidae Brucepattersonius misionensis DD 1517.22 2
Cricetidae Brucepattersonius paradisus DD 1223.81 23
Cricetidae Brucepattersonius soricinus DD 15,508.22 2
Cricetidae Calomys boliviae LC 72,104.40 2
Cricetidae Calomys callidus LC 55,935.80 1
Cricetidae Calomys callosus LC 3,145,719.96 148
Cricetidae Calomys expulsus LC 1,360,005.64 158
Cricetidae Calomys fecundus LC 54,306.21 28
Cricetidae Calomys hummelincki VU 312,461.02 458
Cricetidae Calomys laucha LC 1,437,895.89 1248
(Appendix 1 continued)
Authenticated | 107.0.125.4Download Date | 9/14/12 5:13 PM

8 G. Amori et al.: South American rodent distributions
Family Genus Species IUCN category Total range Symbol for habitat types
Cricetidae Calomys lepidus LC 584,185.24 34
Cricetidae Calomys musculinus LC 2,024,418.25 18
Cricetidae Calomys sorellus LC 244,088.45 1248
Cricetidae Calomys tener LC 1,710,305.23 148
Cricetidae Calomys tocantinsi LC 132,797.92 124
Cricetidae Cerradomys andersoni DD 852.01 145
Cricetidae Cerradomys maracajuensis LC 963,352.90 268
Cricetidae Cerradomys marinhus DD 13,493.48 145
Cricetidae Cerradomys scotti LC 1,644,082.60 1458
Cricetidae Cerradomys subflavus LC 1,461,169.54 28
Cricetidae Chelemys delfini DD 530.12 14
Cricetidae Chelemys macronyx LC 322,053.21 124
Cricetidae Chelemys megalonyx NT 119,249.35 1
Cricetidae Chibchanomys orcesi DD 2,776.44 46
Cricetidae Chibchanomys trichotis DD 29,805.92 46
Cricetidae Chilomys instans LC 197,765.46 2
Cricetidae Chinchillula sahamae LC 160,701.44 13
Cricetidae Delomys collinus LC 88,365.39 24
Cricetidae Delomys dorsalis LC 292,213.87 2
Cricetidae Delomys sublineatus LC 150,911.45 2
Cricetidae Deltamys kempi LC 139,078.22 46
Cricetidae Eligmodontia moreni LC 46,843.32 17
Cricetidae Eligmodontia morgani LC 371,771.93 14
Cricetidae Eligmodontia puerulus LC 447,131.82 14
Cricetidae Eligmodontia typus LC 923,196.30 147
Cricetidae Eremoryzomys polius DD 14,289.81 28
Cricetidae Euneomys chinchilloides DD 76,638.38 12
Cricetidae Euneomys fossor DD 9894.19 1
Cricetidae Euneomys mordax LC 52,343.62 4
Cricetidae Euneomys petersoni LC 591,129.99 134
Cricetidae Euryoryzomys emmonsae DD 240,642.55 2
Cricetidae Euryoryzomys lamia EN 122,790.72 25
Cricetidae Euryoryzomys legatus LC 64,124.64 2
Cricetidae Euryoryzomys macconnelli LC 4,294,741.43 2
Cricetidae Euryoryzomys nitidus LC 1,305,117.76 28
Cricetidae Euryoryzomys russatus LC 1,009,797.25 2
Cricetidae Galenomys garleppi DD 19,189.66 4
Cricetidae Geoxus valdivianus LC 232,669.84 12
Cricetidae Graomys domorum LC 101,510.45 24
Cricetidae Graomys edithae DD 408.06 4
Cricetidae Graomys griseoflavus LC 2,012,535.42 1
Cricetidae Habromys chinanteco CR 21.98 2
Cricetidae Habromys delicatulus CR 18.34 2
Cricetidae Habromys ixtlani CR 92.15 2
Cricetidae Habromys lepturus CR 94.95 2
Cricetidae Habromys lophurus NT 25,199.32 2
Cricetidae Habromys schmidlyi CR 90.34 2
Cricetidae Habromys simulatus EN 1451.40 2
Cricetidae Handleyomys chapmani LC 36,275.81 2
Cricetidae Handleyomys fuscatus LC 79,252.83 28
Cricetidae Handleyomys intectus LC 9776.92 28
Cricetidae Handleyomys melanotis LC 138,366.76 2
Cricetidae Handleyomys rhabdops VU 8208.61 2
Cricetidae Handleyomys rostratus LC 548,410.11 28
Cricetidae Handleyomys saturatior NT 108,654.66 2
Cricetidae Hodomys alleni LC 214,195.02 1
Cricetidae Holochilus brasiliensis LC 2,878,844.39 268
(Appendix 1 continued)
Authenticated | 107.0.125.4Download Date | 9/14/12 5:13 PM

G. Amori et al.: South American rodent distributions 9
Family Genus Species IUCN category Total range Symbol for habitat types
Cricetidae Holochilus chacarius LC 766,912.83 16
Cricetidae Holochilus sciureus LC 9,319,251.59 46
Cricetidae Hylaeamys acritus DD 88,936.93 1245
Cricetidae Hylaeamys laticeps NT 173,883.97 2
Cricetidae Hylaeamys megacephalus LC 5,970,945.45 28
Cricetidae Hylaeamys oniscus VU 19,678.49 2
Cricetidae Hylaeamys perenensis LC 1,991,799.14 2468
Cricetidae Hylaeamys tatei DD 2652.41 2
Cricetidae Hylaeamys yunganus LC 5,299,472.10 28
Cricetidae Ichthyomys hydrobates NT 151,154.41 268
Cricetidae Ichthyomys pittieri VU 5459.89 26
Cricetidae Ichthyomys stolzmanni DD 4513.47 2
Cricetidae Ichthyomys tweedii DD 7181.82 26
Cricetidae Irenomys tarsalis LC 145,043.44 12
Cricetidae Isthmomys flavidus NT 6470.36 2
Cricetidae Isthmomys pirrensis LC 5206.20 2
Cricetidae Juliomys pictipes LC 437,830.88 2
Cricetidae Juliomys rimofrons VU 296.44 2
Cricetidae Juscelinomys guaporensis DD 33.63 45
Cricetidae Juscelinomys huanchacae DD 140.97 45
Cricetidae Kunsia fronto EN 2,158.68 56
Cricetidae Kunsia tomentosus LC 405,933.09 4
Cricetidae Lenoxus apicalis LC 32,875.59 28
Cricetidae Loxodontomys micropus LC 447,676.52 1
Cricetidae Loxodontomys pikumche LC 51,057.45 1
Cricetidae Lundomys molitor LC 295,581.45 246
Cricetidae Megadontomys cryophilus EN 1,540.70 2
Cricetidae Megadontomys nelsoni EN 4981.21 2
Cricetidae Megadontomys thomasi EN 271.89 2
Cricetidae Melanomys caliginosus LC 748,145.23 2
Cricetidae Melanomys robustulus LC 22,782.36 2
Cricetidae Melanomys zunigae CR 228.85 17
Cricetidae Microakodontomys transitorius VU 1750.13 14
Cricetidae Microryzomys altissimus LC 201,792.40 4
Cricetidae Microryzomys minutus LC 638,220.51 234
Cricetidae Microtus guatemalensis NT 23,886.94 2
Cricetidae Microtus mexicanus LC 854,501.41 2
Cricetidae Microtus oaxacensis EN 640.17 2
Cricetidae Microtus quasiater NT 29,255.58 246
Cricetidae Microtus umbrosus EN 1816.62 2
Cricetidae Mindomys hammondi EN 4422.73 2
Cricetidae Neacomys dubosti LC 221,431.79 28
Cricetidae Neacomys guianae LC 319,485.10 2
Cricetidae Neacomys minutus LC 183,729.25 2
Cricetidae Neacomys musseri LC 140,338.25 2
Cricetidae Neacomys paracou LC 955,489.22 2
Cricetidae Neacomys pictus DD 484.14 2
Cricetidae Neacomys spinosus LC 3,102,230.81 28
Cricetidae Neacomys tenuipes LC 224,159.04 2
Cricetidae Necromys amoenus LC 164,455.76 148
Cricetidae Necromys benefactus LC 386,555.86 14
Cricetidae Necromys lactens LC 163,775.06 148
Cricetidae Necromys lasiurus LC 5,616,837.77 2458
Cricetidae Necromys lenguarum LC 592,289.59 1458
Cricetidae Necromys obscurus NT 31,839.69 46
Cricetidae Necromys punctulatus DD 77,904.94 124
Cricetidae Necromys temchuki LC 104,116.83 24
(Appendix 1 continued)
Authenticated | 107.0.125.4Download Date | 9/14/12 5:13 PM

10 G. Amori et al.: South American rodent distributions
Family Genus Species IUCN category Total range Symbol for habitat types
Cricetidae Necromys urichi LC 339,603.37 28
Cricetidae Nectomys apicalis LC 1,077,499.18 246
Cricetidae Nectomys magdalenae DD 46,771.30 26
Cricetidae Nectomys palmipes LC 165,517.37 268
Cricetidae Nectomys rattus LC 7,114,447.90 124568
Cricetidae Nectomys squamipes LC 2,344,405.45 6
Cricetidae Nelsonia goldmani EN 2039.61 2
Cricetidae Neotoma albigula LC 834,317.99 1237
Cricetidae Neotoma angustapalata EN 3326.76 2
Cricetidae Neotoma chrysomelas LC 30,203.17 23
Cricetidae Neotoma leucodon LC 1,076,912.40 137
Cricetidae Neotoma mexicana LC 1,784,438.54 23
Cricetidae Neotoma micropus LC 1,063,787.84 1
Cricetidae Neotoma nelsoni CR 92.98 2
Cricetidae Neotoma phenax NT 42,612.79 2
Cricetidae Neotomodon alstoni LC 27,485.14 2
Cricetidae Neotomys ebriosus LC 688,511.06 146
Cricetidae Nephelomys albigularis LC 398,229.71 2
Cricetidae Nephelomys auriventer LC 14,415.64 24
Cricetidae Nephelomys caracolus LC 4076.92 2
Cricetidae Nephelomys devius LC 9591.18 2
Cricetidae Nephelomys keaysi LC 66,985.65 2
Cricetidae Nephelomys levipes LC 157,161.98 2
Cricetidae Nephelomys meridensis LC 14,353.22 2
Cricetidae Neusticomys ferreirai DD 683.19 2
Cricetidae Neusticomys monticolus LC 65,827.71 26
Cricetidae Neusticomys mussoi EN 4928.14 26
Cricetidae Neusticomys oyapocki DD 70,807.25 26
Cricetidae Neusticomys peruviensis LC 14,429.01 26
Cricetidae Neusticomys venezuelae VU 109,414.16 26
Cricetidae Notiomys edwardsii LC 267,119.73 134
Cricetidae Nyctomys sumichrasti LC 673,104.83 2
Cricetidae Oecomys auyantepui LC 1,088,881.12 2
Cricetidae Oecomys bicolor LC 8,594,000.35 2
Cricetidae Oecomys catherinae LC 3,492,948.24 1456
Cricetidae Oecomys cleberi DD 6483.03 26
Cricetidae Oecomys concolor LC 4,925,508.02 2
Cricetidae Oecomys flavicans LC 42,578.65 2
Cricetidae Oecomys mamorae LC 651,935.24 1258
Cricetidae Oecomys paricola DD 392,838.73 2
Cricetidae Oecomys phaeotis LC 117,455.52 2
Cricetidae Oecomys rex LC 515,092.46 28
Cricetidae Oecomys roberti LC 3,726,862.48 28
Cricetidae Oecomys rutilus LC 1,186,671.64 28
Cricetidae Oecomys speciosus LC 380,155.41 2
Cricetidae Oecomys superans LC 1,547,654.60 8
Cricetidae Oecomys trinitatis LC 4,830,363.92 2
Cricetidae Oligoryzomys andinus LC 260,996.13 18
Cricetidae Oligoryzomys arenalis LC 96,937.65 17
Cricetidae Oligoryzomys brendae DD 161.57 2
Cricetidae Oligoryzomys chacoensis LC 760,948.09 14
Cricetidae Oligoryzomys delticola LC 371,885.72 14
Cricetidae Oligoryzomys destructor LC 661,044.59 24
Cricetidae Oligoryzomys eliurus LC 2,261,092.41 124
Cricetidae Oligoryzomys flavescens LC 3,150,684.09 14
Cricetidae Oligoryzomys fornesi LC 1,735,414.58 145
Cricetidae Oligoryzomys fulvescens LC 2,895,262.93 2
(Appendix 1 continued)
Authenticated | 107.0.125.4Download Date | 9/14/12 5:13 PM

G. Amori et al.: South American rodent distributions 11
Family Genus Species IUCN category Total range Symbol for habitat types
Cricetidae Oligoryzomys griseolus LC 52,671.26 24
Cricetidae Oligoryzomys longicaudatus LC 629,004.92 124
Cricetidae Oligoryzomys magellanicus LC 135,941.99 2
Cricetidae Oligoryzomys microtis LC 2,722,327.53 28
Cricetidae Oligoryzomys moojeni DD 180,602.54 25
Cricetidae Oligoryzomys nigripes LC 3,214,873.69 1245
Cricetidae Oligoryzomys rupestris DD 6039.39 145
Cricetidae Oligoryzomys stramineus LC 530,353.51 1245
Cricetidae Oligoryzomys vegetus LC 9901.69 2
Cricetidae Oreoryzomys balneator DD 11,449.71 2
Cricetidae Oryzomys couesi LC 1,480,757.31 6
Cricetidae Oryzomys dimidiatus LC 1125.61 268
Cricetidae Oryzomys gorgasi EN 437.54 246
Cricetidae Oryzomys palustris LC 1,508,859.97 468
Cricetidae Osgoodomys banderanus LC 179,790.08 2
Cricetidae Otonyctomys hatti LC 127,975.30 2
Cricetidae Ototylomys phyllotis LC 491,818.25 2
Cricetidae Oxymycterus akodontius DD 65.64 2
Cricetidae Oxymycterus amazonicus LC 775,698.23 2
Cricetidae Oxymycterus angularis LC 457,111.79 145
Cricetidae Oxymycterus caparoae LC 63,207.15 2
Cricetidae Oxymycterus dasytrichus LC 284,443.66 126
Cricetidae Oxymycterus delator LC 82,737.39 46
Cricetidae Oxymycterus hiska LC 34,301.25 28
Cricetidae Oxymycterus hispidus LC 437,560.28 2
Cricetidae Oxymycterus hucucha EN 4794.70 28
Cricetidae Oxymycterus inca LC 360,856.16 12458
Cricetidae Oxymycterus josei EN 4184.01 146
Cricetidae Oxymycterus nasutus LC 559,003.35 46
Cricetidae Oxymycterus paramensis LC 197,322.21 28
Cricetidae Oxymycterus quaestor LC 784,246.67 12
Cricetidae Oxymycterus roberti LC 842,645.36 248
Cricetidae Oxymycterus rufus LC 280,628.65 4
Cricetidae Paralomys gerbillus LC 25,228.60 17
Cricetidae Pearsonomys annectens VU 7868.05 2
Cricetidae Peromyscus aztecus LC 218,567.38 28
Cricetidae Peromyscus beatae LC 145,829.19 2
Cricetidae Peromyscus bullatus CR 91.19 124
Cricetidae Peromyscus difficilis LC 546,549.19 247
Cricetidae Peromyscus furvus DD 22,387.11 2
Cricetidae Peromyscus grandis NT 4204.78 2
Cricetidae Peromyscus gratus LC 598,299.74 12348
Cricetidae Peromyscus guatemalensis LC 17,874.98 2
Cricetidae Peromyscus gymnotis LC 40,118,46 28
Cricetidae Peromyscus hylocetes LC 37,379.49 2
Cricetidae Peromyscus levipes LC 160,991.05 123
Cricetidae Peromyscus mayensis CR 127.42 2
Cricetidae Peromyscus megalops LC 44,159.45 2
Cricetidae Peromyscus mekisturus CR 98.57 2
Cricetidae Peromyscus melanocarpus EN 3456.05 2
Cricetidae Peromyscus melanophrys LC 512,460.45 37
Cricetidae Peromyscus melanotis LC 494,793.34 234
Cricetidae Peromyscus melanurus EN 3857.54 2
Cricetidae Peromyscus merriami LC 197,612.45 1
Cricetidae Peromyscus mexicanus LC 367,381.83 1238
Cricetidae Peromyscus pectoralis LC 832,005.28 12347
Cricetidae Peromyscus perfulvus LC 66,532.30 28
(Appendix 1 continued)
Authenticated | 107.0.125.4Download Date | 9/14/12 5:13 PM

12 G. Amori et al.: South American rodent distributions
Family Genus Species IUCN category Total range Symbol for habitat types
Cricetidae Peromyscus sagax DD 202.87 2
Cricetidae Peromyscus schmidlyi LC 19,072.79 2
Cricetidae Peromyscus simulus VU 16,221.02 2
Cricetidae Peromyscus spicilegus LC 125,507.30 2
Cricetidae Peromyscus stirtoni LC 26,279.27 23
Cricetidae Peromyscus winkelmanni EN 926.41 2
Cricetidae Peromyscus yucatanicus LC 137,967.26 2
Cricetidae Peromyscus zarhynchus VU 6012.13 2
Cricetidae Phaenomys ferrugineus VU 12,286.82 2
Cricetidae Phyllotis amicus LC 71,788.91 37
Cricetidae Phyllotis andium LC 124,062.65 1268
Cricetidae Phyllotis anitae DD 330.83 2
Cricetidae Phyllotis bonariensis NT 1804.18 134
Cricetidae Phyllotis caprinus LC 42,365.07 1248
Cricetidae Phyllotis darwini LC 130,473.20 1
Cricetidae Phyllotis definitus EN 4834.42 13
Cricetidae Phyllotis haggardi LC 34,812.36 134
Cricetidae Phyllotis limatus LC 137,890.85 12347
Cricetidae Phyllotis magister LC 58,911.41 1238
Cricetidae Phyllotis osgoodi DD 5305.74 134
Cricetidae Phyllotis osilae LC 343,651.10 348
Cricetidae Phyllotis wolffsohni LC 83,241.75 18
Cricetidae Phyllotis xanthopygus LC 1,499,328.99 12348
Cricetidae Podoxymys roraimae VU 239.46 2
Cricetidae Pseudoryzomys simplex LC 3,116,857.75 145
Cricetidae Punomys kofordi VU 1054.46 148
Cricetidae Punomys lemminus VU 2971.23 134
Cricetidae Reithrodon typicus LC 309,312.42 4
Cricetidae Reithrodon auritus LC 1,191,488.75 14
Cricetidae Reithrodontomys bakeri EN 862.81 2
Cricetidae Reithrodontomys brevirostris LC 20,839.28 2
Cricetidae Reithrodontomys burti DD 51,549.05 1
Cricetidae Reithrodontomys chrysopsis LC 53,814.63 2
Cricetidae Reithrodontomys creper LC 12,286.62 2
Cricetidae Reithrodontomys darienensis LC 43,586.27 2
Cricetidae Reithrodontomys fulvescens LC 2,632,374.21 14
Cricetidae Reithrodontomys gracilis LC 325,029.91 12
Cricetidae Reithrodontomys hirsutus VU 8317.14 7
Cricetidae Reithrodontomys mexicanus LC 540,061.79 128
Cricetidae Reithrodontomys microdon VU 77,650.73 2
Cricetidae Reithrodontomys paradoxus DD 236.34 2
Cricetidae Reithrodontomys rodriguezi LC 1719.88 2
Cricetidae Reithrodontomys sumichrasti LC 328,552.02 2
Cricetidae Reithrodontomys tenuirostris VU 13,659.84 2
Cricetidae Reithrodontomys zacatecae LC 211,207.62 2
Cricetidae Rhagomys longilingua LC 2294.23 28
Cricetidae Rhagomys rufescens NT 119,283.10 28
Cricetidae Rheomys mexicanus EN 90.20 26
Cricetidae Rheomys raptor LC 12,189.32 26
Cricetidae Rheomys thomasi NT 24,193.33 26
Cricetidae Rheomys underwoodi LC 5344.96 26
Cricetidae Rhipidomys caucensis DD 39,005.26 2
Cricetidae Rhipidomys couesi LC 144,563.41 2
Cricetidae Rhipidomys fulviventer LC 52,004.00 2
Cricetidae Rhipidomys austrinus LC 138,615.94 28
Cricetidae Rhipidomys cariri DD 6378.58 468
Cricetidae Rhipidomys emiliae LC 697,563.60 258
(Appendix 1 continued)
Authenticated | 107.0.125.4Download Date | 9/14/12 5:13 PM

G. Amori et al.: South American rodent distributions 13
Family Genus Species IUCN category Total range Symbol for habitat types
Cricetidae Rhipidomys gardneri LC 152,160,47 28
Cricetidae Rhipidomys latimanus LC 157,711.57 2
Cricetidae Rhipidomys leucodactylus LC 4,401,900.16 2
Cricetidae Rhipidomys macconnelli LC 189,756.33 28
Cricetidae Rhipidomys macrurus LC 1,567,006.26 258
Cricetidae Rhipidomys mastacalis LC 634,232.56 2
Cricetidae Rhipidomys modicus NT 74,243.97 2
Cricetidae Rhipidomys nitela LC 1,447,248.25 28
Cricetidae Rhipidomys ochrogaster DD 7579.21 2
Cricetidae Rhipidomys venezuelae LC 172,683.22 2
Cricetidae Rhipidomys venustus LC 8414.52 2
Cricetidae Rhipidomys wetzeli LC 138,912.85 23
Cricetidae Salinomys delicatus DD 41,063.49 1
Cricetidae Scapteromys aquaticus LC 260,133.45 16
Cricetidae Scapteromys tumidus LC 258,563.22 146
Cricetidae Scolomys melanops LC 100,719.04 28
Cricetidae Scolomys ucayalensis LC 197,624.02 2
Cricetidae Scotinomys teguina LC 129,226.55 2
Cricetidae Scotinomys xerampelinus LC 5119.23 24
Cricetidae Sigmodon alleni VU 151,425.01 2
Cricetidae Sigmodon alstoni LC 840,151.95 14
Cricetidae Sigmodon fulviventer LC 464,212.44 124
Cricetidae Sigmodon hirsutus LC 761,227.05 2
Cricetidae Sigmodon inopinatus VU 7172.00 146
Cricetidae Sigmodon leucotis LC 282,568.69 2
Cricetidae Sigmodon mascotensis LC 252,526.33 28
Cricetidae Sigmodon peruanus LC 98,148.73 268
Cricetidae Sigmodon planifrons EN 4313.39 2
Cricetidae Sigmodon toltecus LC 416,841.04 4
Cricetidae Sigmodontomys alfari LC 383,742.62 268
Cricetidae Sigmodontomys aphrastus DD 864.37 2
Cricetidae Sooretamys angouya LC 1,388,660.06 258
Cricetidae Tapecomys primus LC 2330.95 2
Cricetidae Thalpomys cerradensis LC 488,727.99 145
Cricetidae Thalpomys lasiotis LC 555,155.81 145
Cricetidae Thaptomys nigrita LC 1,057,784.53 124
Cricetidae Thomasomys apeco VU 1276.75 2
Cricetidae Thomasomys aureus LC 399,481.91 2
Cricetidae Thomasomys baeops LC 86,495.27 1248
Cricetidae Thomasomys bombycinus DD 6202.75 124
Cricetidae Thomasomys caudivarius LC 34,453.01 2
Cricetidae Thomasomys cinereiventer LC 49,299.06 2
Cricetidae Thomasomys cinereus LC 26,408.22 28
Cricetidae Thomasomys cinnameus LC 27,426.30 23
Cricetidae Thomasomys daphne LC 109,390.83 28
Cricetidae Thomasomys eleusis LC 12,717.61 124
Cricetidae Thomasomys erro LC 13,995.06 28
Cricetidae Thomasomys gracilis NT 35,600.33 46
Cricetidae Thomasomys hudsoni DD 712.73 14
Cricetidae Thomasomys hylophilus EN 3412.19 2
Cricetidae Thomasomys incanus VU 19,614.06 2
Cricetidae Thomasomys ischyrus VU 43,957.11 2
Cricetidae Thomasomys kalinowskii VU 41,985.58 28
Cricetidae Thomasomys ladewi LC 12,757.27 124
Cricetidae Thomasomys laniger LC 55,123.34 1248
Cricetidae Thomasomys macrotis VU 1375.92 124
Cricetidae Thomasomys monochromos EN 3599.95 24
(Appendix 1 continued)
Authenticated | 107.0.125.4Download Date | 9/14/12 5:13 PM
14 G. Amori et al.: South American rodent distributions
Family Genus Species IUCN category Total range Symbol for habitat types
Cricetidae Thomasomys niveipes LC 12,255.89 124
Cricetidae Thomasomys notatus LC 57,801.63 2
Cricetidae Thomasomys onkiro VU 1122.17 12
Cricetidae Thomasomys oreas LC 48,387.38 2
Cricetidae Thomasomys paramorum LC 29,904.28 124
Cricetidae Thomasomys popayanus DD 8568.79 1248
Cricetidae Thomasomys praetor DD 31,628.81 124
Cricetidae Thomasomys pyrrhonotus VU 22,414.59 124
Cricetidae Thomasomys rhoadsi LC 4957.13 124
Cricetidae Thomasomys rosalinda DD 3102.69 2
Cricetidae Thomasomys silvestris LC 18,571.39 124
Cricetidae Thomasomys taczanowskii LC 19,863.07 1248
Cricetidae Thomasomys ucucha VU 215.66 24
Cricetidae Thomasomys vestitus LC 6459.17 2
Cricetidae Thomasomys vulcani DD 416.03 124
Cricetidae Transandinomys bolivaris LC 271,373.18 26
Cricetidae Transandinomys talamancae LC 510,973.62 8
Cricetidae Tylomys bullaris CR 95.39 2
Cricetidae Tylomys mirae LC 125,757.69 2
Cricetidae Tylomys nudicaudus LC 489,166.13 2
Cricetidae Tylomys tumbalensis CR 93.39 2
Cricetidae Tylomys watsoni LC 90,447.33 2
Cricetidae Wiedomys cerradensis DD 3884.46 12
Cricetidae Wiedomys pyrrhorhinos LC 694,718.01 145
Cricetidae Wilfredomys oenax EN 116,396.51 2
Cricetidae Xenomys nelsoni EN 4750.51 2
Cricetidae Zygodontomys brevicauda LC 1,694,766.44 2568
Cricetidae Zygodontomys brunneus LC 75,737.72 468
Ctenomyidae Ctenomys azarae VU 7814.12 1
Ctenomyidae Ctenomys argentinus NT 27,067.23 14
Ctenomyidae Ctenomys bergi VU 5375.83 45
Ctenomyidae Ctenomys boliviensis LC 133,220.12 58
Ctenomyidae Ctenomys bonettoi EN 2285.09 1
Ctenomyidae Ctenomys colburni DD 718.21 4
Ctenomyidae Ctenomys conoveri LC 98,397.45 14
Ctenomyidae Ctenomys dorbignyi NT 8814.85 14
Ctenomyidae Ctenomys dorsalis DD 11,127.01 5
Ctenomyidae Ctenomys emilianus NT 9660.19 7
Ctenomyidae Ctenomys fodax DD 1828.17 4
Ctenomyidae Ctenomys frater LC 18,249.59 48
Ctenomyidae Ctenomys fulvus LC 74,406.15 1245
Ctenomyidae Ctenomys haigi LC 26,893.83 256
Ctenomyidae Ctenomys knighti DD 8242.78 4
Ctenomyidae Ctenomys latro VU 6530.90 14
Ctenomyidae Ctenomys leucodon LC 11,433.57 148
Ctenomyidae Ctenomys lewisi LC 4752.36 48
Ctenomyidae Ctenomys magellanicus VU 78,726.46 4
Ctenomyidae Ctenomys maulinus LC 51,469.22 4
Ctenomyidae Ctenomys mendocinus LC 137,027.56 146
Ctenomyidae Ctenomys minutus DD 73,653.04 148
Ctenomyidae Ctenomys opimus LC 288,109.71 4
Ctenomyidae Ctenomys osvaldoreigi CR 50.59 4
Ctenomyidae Ctenomys pearsoni NT 11,534.90 14
Ctenomyidae Ctenomys peruanus LC 5463.78 48
Ctenomyidae Ctenomys pilarensis EN 1279.68 48
Ctenomyidae Ctenomys porteousi NT 33,104.57 48
Ctenomyidae Ctenomys pundti VU 10,500.55 4
(Appendix 1 continued)
Authenticated | 107.0.125.4Download Date | 9/14/12 5:13 PM

G. Amori et al.: South American rodent distributions 15
Family Genus Species IUCN category Total range Symbol for habitat types
Ctenomyidae Ctenomys rionegrensis EN 1156.89 7
Ctenomyidae Ctenomys sociabilis CR 1062.08 56
Ctenomyidae Ctenomys steinbachi LC 19,201.35 58
Ctenomyidae Ctenomys talarum LC 51,329.04 4
Ctenomyidae Ctenomys tuconax DD 738.62 145
Ctenomyidae Ctenomys tucumanus DD 7703.31 45
Cuniculidae Cuniculus paca LC 12,541,595.43 2
Cuniculidae Cuniculus taczanowskii NT 400,048.39 26
Dasyproctidae Dasyprocta guamara NT 22,949.72 2
Dasyproctidae Dasyprocta mexicana CR 107,850.51 2
Dasyproctidae Myoprocta acouchy LC 993,240.83 2
Dasyproctidae Myoprocta pratti LC 2,337,013.67 2
Dasyproctidae Dasyprocta leporina LC 2,022,290.93 28
Dasyproctidae Dasyprocta prymnolopha LC 1,929,725.46 5
Dasyproctidae Dasyprocta punctata LC 2,160,011.93 28
Dinomyidae Dinomys branickii VU 1,835,557.68 24
Echimyidae Callistomys pictus EN 4897.12 28
Echimyidae Carterodon sulcidens DD 272,973.84 25
Echimyidae Clyomys bishopi DD 179,568.47 25
Echimyidae Clyomys laticeps LC 1,554,514.38 5
Echimyidae Dactylomys boliviensis LC 337,052.67 28
Echimyidae Dactylomys dactylinus LC 3,305,337.14 2
Echimyidae Dactylomys peruanus DD 163.77 2
Echimyidae Diplomys caniceps DD 432.22 2
Echimyidae Diplomys labilis LC 110,967.09 28
Echimyidae Echimys chrysurus LC 1,583,314.65 2
Echimyidae Echimys saturnus DD 131,044,76 2
Echimyidae Echimys vieirai DD 68,147.46 2
Echimyidae Euryzygomatomys spinosus LC 807,898.80 24
Echimyidae Hoplomys gymnurus LC 332,787.01 2
Echimyidae Isothrix bistriata LC 1,479,992.84 24
Echimyidae Isothrix negrensis LC 294,626.38 2
Echimyidae Isothrix pagurus LC 351,391.32 2
Echimyidae Isothrix sinnamariensis LC 4835.34 2
Echimyidae Kannabateomys amblyonyx LC 916,211.02 2
Echimyidae Lonchothrix emiliae LC 378,159.61 24
Echimyidae Makalata didelphoides LC 3,605,726.76 28
Echimyidae Makalata macrura LC 2,457,730.06 28
Echimyidae Makalata rhipidura DD 27,012.30 2
Echimyidae Mesomys hispidus LC 4,948,316.20 28
Echimyidae Mesomys leniceps DD 801.27 2
Echimyidae Mesomys occultus LC 53,277.04 2
Echimyidae Mesomys stimulax LC 437,337.92 2
Echimyidae Olallamys albicauda DD 5976.61 2
Echimyidae Olallamys edax DD 5390.24 12
Echimyidae Pattonomys occasius DD 192,027.44 2
Echimyidae Pattonomys semivillosus LC 349,714.41 25
Echimyidae Phyllomys blainvillii LC 332,323.41 2
Echimyidae Phyllomys dasythrix LC 276,288.43 2
Echimyidae Phyllomys kerri DD 2115.86 2
Echimyidae Phyllomys lamarum DD 93,318.68 2
Echimyidae Phyllomys lundi EN 5314.51 2
Echimyidae Phyllomys mantiqueirensis CR 102.27 2
Echimyidae Phyllomys medius LC 501,984.67 2
Echimyidae Phyllomys nigrispinus LC 174,488.41 2
Echimyidae Phyllomys pattoni LC 302,943.24 2
Echimyidae Phyllomys unicolor CR 150.32 2
(Appendix 1 continued)
Authenticated | 107.0.125.4Download Date | 9/14/12 5:13 PM

16 G. Amori et al.: South American rodent distributions
Family Genus Species IUCN category Total range Symbol for habitat types
Echimyidae Proechimys brevicauda LC 1,460,737.49 28
Echimyidae Proechimys canicollis LC 32,608.66 2
Echimyidae Proechimys chrysaeolus DD 36,745.86 2
Echimyidae Proechimys cuvieri LC 3,499,934.71 28
Echimyidae Proechimys decumanus VU 30,725.47 2
Echimyidae Proechimys echinothrix LC 277,420.79 2
Echimyidae Proechimys gardneri DD 354,806.07 2
Echimyidae Proechimys goeldii VU 1,029,588.63 28
Echimyidae Proechimys guyannensis LC 1,497,167.48 28
Echimyidae Proechimys kulinae DD 86,612.28 2
Echimyidae Proechimys longicaudatus LC 1,349,009.24 2
Echimyidae Proechimys magdalenae DD 51,660.30 2
Echimyidae Proechimys mincae DD 390.61 2
Echimyidae Proechimys oconnelli DD 22,757.26 2
Echimyidae Proechimys pattoni LC 157,591.80 2
Echimyidae Proechimys poliopus VU 13,317.83 2
Echimyidae Proechimys quadruplicatus LC 1,498,624.54 2
Echimyidae Proechimys roberti VU 1,702,715.39 25
Echimyidae Proechimys semispinosus LC 348,113.73 2
Echimyidae Proechimys simonsi LC 1,934,956.10 28
Echimyidae Proechimys steerei LC 1,677,761.14 2
Echimyidae Proechimys urichi LC 15,837.16 2
Echimyidae Thrichomys apereoides LC 1,168,178.79 15
Echimyidae Thrichomys inermis LC 115,404.01 235
Echimyidae Thrichomys pachyurus LC 166,432.45 25
Echimyidae Toromys grandis LC 176,728.97 2
Echimyidae Trinomys albispinus LC 70,214.54 12345
Echimyidae Trinomys dimidiatus LC 64,000.54 1
Echimyidae Trinomys eliasi EN 4167.65 12
Echimyidae Trinomys gratiosus LC 67,225.51 2
Echimyidae Trinomys iheringi LC 702,365.04 2
Echimyidae Trinomys mirapitanga DD 571.00 2
Echimyidae Trinomys moojeni EN 1652.53 25
Echimyidae Trinomys myosuros LC 569,342.22 2
Echimyidae Trinomys paratus DD 28,264.44 2
Echimyidae Trinomys setosus LC 86,401.64 25
Echimyidae Trinomys yonenagae EN 4982.10 5
Echimyidae Chaetomys subspinosus VU 109,582.90 28
Erethizontidae Coendou bicolor LC 1,229,469.44 28
Erethizontidae Coendou nycthemera DD 406,493.64 2
Erethizontidae Coendou prehensilis LC 10,157,531.85 2
Erethizontidae Coendou quichua DD 68,121.81 2
Erethizontidae Coendou rothschildi LC 67,665.22 2
Erethizontidae Coendou sanctamartae DD 12,287.08 2
Erethizontidae Echinoprocta rufescens LC 200,136.91 2
Erethizontidae Sphiggurus ichillus DD 22,857.54 2
Erethizontidae Sphiggurus insidiosus LC 1,077,040.75 28
Erethizontidae Sphiggurus melanurus LC 1,443,333.43 2
Erethizontidae Sphiggurus mexicanus LC 707,140.83 2
Erethizontidae Sphiggurus pruinosus LC 141,092.02 2
Erethizontidae Sphiggurus spinosus LC 1,332,534.83 25
Erethizontidae Sphiggurus vestitus DD 1456.96 28
Erethizontidae Sphiggurus villosus LC 834,766.89 2
Geomyidae Cratogeomys fulvescens LC 2140.59 248
Geomyidae Cratogeomys fumosus LC 41,174.01 248
Geomyidae Cratogeomys merriami LC 6421.38 248
Geomyidae Cratogeomys perotensis LC 4184.99 248
Geomyidae Geomys tropicalis CR 20.50 14
(Appendix 1 continued)
Authenticated | 107.0.125.4Download Date | 9/14/12 5:13 PM

G. Amori et al.: South American rodent distributions 17
Family Genus Species IUCN category Total range Symbol for habitat types
Geomyidae Orthogeomys cavator LC 5661.99 28
Geomyidae Orthogeomys cherriei LC 7520.64 28
Geomyidae Orthogeomys cuniculus DD 270.87 28
Geomyidae Orthogeomys dariensis LC 3839.82 28
Geomyidae Orthogeomys grandis LC 140,753.32 28
Geomyidae Orthogeomys heterodus LC 1191.90 48
Geomyidae Orthogeomys hispidus LC 397,268.13 28
Geomyidae Orthogeomys lanius CR 87.69 2
Geomyidae Orthogeomys matagalpae LC 3004.24 2
Geomyidae Orthogeomys thaeleri LC 9588.99 24
Geomyidae Orthogeomys underwoodi LC 6276.02 28
Geomyidae Pappogeomys alcorni CR 344.32 248
Geomyidae Pappogeomys bulleri LC 35,563.93 124
Geomyidae Thomomys bottae LC 1,541,257.36 2478
Geomyidae Thomomys umbrinus LC 469,401.24 1247
Geomyidae Zygogeomys trichopus EN 612.88 2
Heteromyidae Chaetodipus arenarius LC 77,616.87 7
Heteromyidae Chaetodipus artus LC 89,251.67 7
Heteromyidae Chaetodipus dalquesti VU 11,565.75 7
Heteromyidae Chaetodipus goldmani VU 58,863.38 1
Heteromyidae Chaetodipus hispidus LC 2,300,212.39 14
Heteromyidae Chaetodipus pernix LC 99,046.89 1
Heteromyidae Dipodomys phillipsii LC 176,865.57 17
Heteromyidae Heteromys anomalus LC 296,930.41 28
Heteromyidae Heteromys australis LC 226,892.05 2
Heteromyidae Heteromys desmarestianus LC 476,858.82 2
Heteromyidae Heteromys gaumeri LC 167,160.93 2
Heteromyidae Heteromys nelsoni EN 479.22 2
Heteromyidae Heteromys oasicus EN 56.26 2
Heteromyidae Heteromys oresterus LC 1327.45 2
Heteromyidae Heteromys teleus VU 19,152.42 2
Heteromyidae Liomys adspersus LC 28,432.62 12
Heteromyidae Liomys irroratus LC 606,821.11 1
Heteromyidae Liomys pictus LC 439,272.19 12
Heteromyidae Liomys salvini LC 169,487.37 2
Heteromyidae Liomys spectabilis EN 3178.64 2
Myocastoridae Myocastor coypus LC 3,902,337.33 6
Octodontidae Aconaemys fuscus LC 50,643.19 23
Octodontidae Aconaemys porteri DD 30,176.40 23
Octodontidae Aconaemys sagei DD 10,248.78 23
Octodontidae Octodon bridgesi VU 98,037.08 12
Octodontidae Octodon degus LC 64,667.64 1
Octodontidae Octodon lunatus VU 32,234.68 13
Octodontidae Octodon pacificus CR 532.03 2
Octodontidae Octodontomys gliroides LC 375,210.78 134
Octodontidae Pipanacoctomys aureus CR 602.79 6
Octodontidae Salinoctomys loschalchalerosorum CR 472.87 6
Octodontidae Spalacopus cyanus LC 76,133.89 245
Octodontidae Tympanoctomys barrerae NT 7481.52 5
Sciuridae Glaucomys volans LC 3,848,269.76 2
Sciuridae Microsciurus alfari LC 117,453.37 2
Sciuridae Microsciurus mimulus LC 160,234.70 2
Sciuridae Sciurillus pusillus DD 851,537.02 2
Sciuridae Sciurus aestuans LC 6,940,484.59 28
Sciuridae Sciurus aureogaster LC 6.84 28
Sciuridae Sciurus colliaei LC 81,301.76 2
Sciuridae Sciurus deppei LC 695,004.11 2
Sciuridae Sciurus flammifer DD 121,714.20 2
(Appendix 1 continued)
Authenticated | 107.0.125.4Download Date | 9/14/12 5:13 PM

18 G. Amori et al.: South American rodent distributions
Family Genus Species IUCN category Total range Symbol for habitat types
Sciuridae Sciurus granatensis LC 988,543.45 28
Sciuridae Sciurus ignitus DD 1,498,606.66 2
Sciuridae Sciurus igniventris LC 2,711,158.41 2
Sciuridae Sciurus nayaritensis LC 249,139.45 2
Sciuridae Sciurus oculatus LC 101,822.67 2
Sciuridae Sciurus richmondi NT 21,022.27 2
Sciuridae Sciurus sanborni DD 48,842.21 2
Sciuridae Sciurus spadiceus LC 3,247,840.42 2
Sciuridae Sciurus stramineus LC 156,432.81 28
Sciuridae Sciurus variegatoides LC 392,633.32 28
Sciuridae Sciurus yucatanensis LC 194,219.73 28
Sciuridae Spermophilus annulatus LC 44,720.04 28
Sciuridae Spermophilus mexicanus LC 715,708.25 148
Sciuridae Spermophilus perotensis EN 3073.70 278
Sciuridae Spermophilus variegatus LC 2,304,689.24 138
Sciuridae Syntheosciurus brochus NT 7878.67 2
Appendix 1 Raw data on South American rodents.
Total range are in km 2 . Symbols for habitat types (column 6) are as follows: 1 = shrubland, 2 = forest, 3 = grassland, 4 = savannah, 5 = flooded,
6 = bare, 7 = cultivated/artificial. When multiple habitats are inhabited by a given species (for instance, shrubland + forest + grassland), the
resulting symbol is 123. Each symbol is associated with a specific habitat code (column 6) used in the figures.
(Appendix 1 continued)
References Amori, G., S. Gippoliti, L. Luiselli and C. Battisti. 2009a. Do
interlinks between geography and ecology explain diversity
patterns in Sciuridae ? An approach at the genus level. Can. J.
Zool. 87: 1 – 8.
Amori, G., S. Gippoliti, L. Luiselli and C. Battisti. 2009b. Sciuridae,
Rapoport ’ s effect and the mismatch between range size,
conservation needs, and scientific productivity. Web Ecol. 9:
1 – 7.
Amori, G., S. Gippoliti, L. Luiselli and C. Battisti. 2010. Are there
latitudinal gradients in taxa turnover ? A worldwide study
with Sciuridae (Mammalia: Rodentia). Comm. Ecol. 11:
22 – 26.
Anderson, R.P. and E. Martinez-Meyer. 2004. Modeling species ’
geographic distributions for preliminary conservation
assessments: an implementation with the spiny pocket mice
( Heteromys ) of Ecuador. Biol. Conserv. 116: 167 – 179.
Anderson, R.P., M. G ó mez-Laverde and A.T. Peterson. 2002a.
Geographical distributions of spiny pocket mice in South
America: insights from predictive models. Glob. Ecol.
Biogeogr. 11: 131 – 141.
Anderson, R.P., A.T. Peterson and M. G ó mez-Laverde. 2002b. Using
niche-based GIS modelling to test geographic predictions
of competitive exclusions and competitive release in South
American pocket mice. Oikos 98: 3 – 16.
Arita, H.T., F. Figueroa, A. Frisch, P. Rodriguez and K. Santos-Del-
Prado. 1997. Geographical range size and the conservation of
Mexican mammals. Conserv. Biol. 11: 92 – 100.
Brown, Jr. K.S. and G.G. Brown. 1992. Habitat alteration and species
loss in Brazilian forests. In: (T.C. Whitmore and J.A. Sayer, eds.)
Tropical deforestation and species extinction. Chapman & Hall,
London. pp. 119 – 142.
Campbell, Jr. K.E. 1990. The geological basis of biogeographic
patterns in Amazonia. In: (G. Peters and R. Hutterer, eds.)
Biogeography and systematics in the tropics, Bonn, June 5 – 8
1989. Alexander Koenig Zoological Research Institute and
Zoological Museum, Bonn, Germany. pp. 33 – 43.
Carmignotto, A.P., M. de Vivo and A. Langguth. 2012. Mammals of
the Cerrado and Caatinga: distribution patterns of the tropical
open biomes of Central South America. In: (B.D. Patterson
and L.P. Costa, eds.) Bones, clones, and biomes: the history
and geography of Recent Neotropical mammals. University of
Chicago Press, Chicago. pp. 307 – 350.
Ceballos, G. and J.H. Brown. 1995. Global patterns of mammalian
diversity, endemism, and endangerment. Conserv. Biol. 9:
559 – 568.
Chiarello, A.G. 1999. Effects of fragmentation of the Atlantic
forest on mammal communities in south-eastern Brazil. Biol.
Conserv. 89: 71 – 82.
Costa, L.P., Y.L.R. Leite, G.A.B. da Fonseca and M.T. da Fonseca.
2000. Biogeography of South American forest mammals:
endemism and diversity in the Atlantic Forest. Biotropica 32:
872 – 881.
D á valos, L.M. and S.T. Turvey. 2012. West Indian mammals: the
old, the new, and the recently extinct. In: (B.D. Patterson and
L.P. Costa, eds.) Bones, clones, and biomes: the history and
geography of Recent Neotropical mammals. University of
Chicago Press, Chicago. pp. 157 – 202.
Eiten, G. 1972. The Cerrado vegetation of Brazil. Bot. Rev. 38:
201 – 341.
ESRI. 2010. ArcGIS 10. Redlands, CA.
Fonseca, G.A.B. 1985. The vanishing Brazilian Atlantic forest. Biol.
Conserv. 34: 17 – 34.
Authenticated | 107.0.125.4Download Date | 9/14/12 5:13 PM

G. Amori et al.: South American rodent distributions 19
GlobCover Land Cover v2 2008 database. 2008. European Space
Agency, European Space Agency GlobCover Project, led by
MEDIAS-France. 2008. http://ionia1.esrin.esa.int/index.asp.
Accessed on 7 February 2009.
Hanski, I. and M. Gyllenberg. 1997. Uniting two general patterns in
the distribution of species. Science 275: 397 – 400.
Hawkins, B.A. 2004. Are we making progress toward understanding
the global diversity gradient ? Basic Appl. Ecol. 5: 1 – 3.
Hawkins, B.A., E.E. Porter and J.A.F. Diniz. 2003a. Productivity and
history as predictors of the latitudinal diversity gradient of
terrestrial birds. Ecology 84: 1608 – 1623.
Hawkins, B.A., R. Field, H.V. Cornell, D.J. Currie, J.F. Guegan, D.M.
Kaufman, J.T. Kerr, G.G. Mittelbach, T. Oberdorff, E.M. O ’ Brien,
E.E. Porter and J.R.G. Turner. 2003b. Energy, water, and
broad-scale geographic patterns of species richness. Ecology
84: 3105 – 3117.
Hoorn, C. 2006. The birth of the mighty Amazon. Sci. Am. 294:
52 – 59.
IUCN. 2011. IUCN Red List of Threatened Species. www.iucnredlist.
org. Accessed on 28 December 2011.
Jetz, W. and C. Rahbek. 2001. Geometric constraints explain much
of the species of richness pattern in African birds. Proc. Natl.
Acad. Sci. USA 98: 5661 – 5666.
Kaandorp, R.J.G., F.P. Wesselingh and H.B. Vonhof. 2006. Ecological
implications from geochemical records of Miocene Western
Amazonian bivalves. J. South Am. Earth Sci. 21: 54 – 74.
Koleff, P., J.J. Lennon and K.J. Gaston. 2003a. Measuring beta
diversity for presence-absence data. J. Anim. Ecol. 72: 367 – 382.
Koleff, P., J.J. Lennon and K.J. Gaston. 2003b. Are there latitudinal
gradients in species turnover ? Glob. Ecol. Biogeogr. 12:
483 – 498.
Lennon, J.J., P. Koleff, J.J.D Greenwood and K.J. Gaston. 2001. The
geographical structure of British bird distributions: diversity,
spatial turnover and scale. J. Anim. Ecol. 70: 966 – 979.
Lim, B.K. 2012. Biogeography of mammals from the Guianas of
South America. In: (B.D. Patterson and L.P. Costa, eds.) Bones,
clones, and biomes: the history and geography of Recent
Neotropical mammals. University of Chicago Press, Chicago.
pp. 230 – 258.
Mittelbach, G.G., D.W. Schemske, H.V. Cornell, A.P. Allen, J.M.
Brown, M.B. Bush, S.P. Harrison, A.H. Hurlbert, N. Knowlton,
H.A. Lessios, C.M. McCain, A.R. McCune, L.A. McDade, M.A.
McPeek, T.J. Near, T.D. Price, R.E. Ricklefs, K. Roy, D.F. Sax,
D. Schluter, J.M. Sobel and M. Turelli. 2007. Evolution and
the latitudinal diversity gradient: speciation, extinction and
biogeography. Ecol. Lett. 10: 315 – 331.
Morgan, G.S. and C.A. Woods. 1986. Extinction and the
zoogeography of West Indian land mammals. Biol. J. Linn. Soc.
28: 167 – 203.
Orme, A.R. 2007. The tectonic framework of South America. In:
(T.T. Veblen, K.R. Young and A.R. Orme, eds.) The physical
geography of South America. Oxford University Press, New
York. pp. 3 – 22.
Palmer, M.W. and P.S. White. 1994. Scale dependence and the
species-area relationship. Am. Nat. 144: 717 – 740.
Patterson, B.D. 2000. Patterns and trends in the discovery of new
Neotropical mammals. Divers. Distrib. 6: 145 – 151.
Patterson, B.D., S. Solari and P.M. Velazco. 2012. The role of the
Andes in the diversification and biogeography of Neotropical
mammals. In: (B.D. Patterson and L.P. Costa, eds.) Bones,
clones, and biomes: the history and geography of Recent
Neotropical mammals. University of Chicago Press, Chicago.
pp. 351 – 378.
Rapoport, E. 1982. Aerography: geographical strategies of species.
Pergamon Press, New York. pp. 269.
Rohde, K. 1996. Rapoport ’ s rule is a local phenomenon and cannot
explain latitudinal gradients in species diversity. Biodivers.
Lett. 3: 10 – 13.
Ruggiero, A. and T. Kitzberger. 2004. Environmental correlates of
mammal species richness in South America: effects of spatial
structure, taxonomy and geographic range. Ecography 27:
401 – 416.
Solari, S., P.M. Velazco and B.D. Patterson. 2012. Hierarchical
organization of Neotropical mammal diversity and its
historical basis. In: (B.D. Patterson and L.P. Costa, eds.)
Bones, clones, and biomes: the history and geography of
Recent Neotropical mammals. University of Chicago Press,
Chicago. pp. 145 – 156.
Terribile, L.C. and J.A.F. Diniz-Filho. 2009. Spatial patterns of
species richness in New World coral snakes and the metabolic
theory of ecology. Acta Oecol. 35: 163 – 173.
Tuomisto, H. and K. Ruokolainen. 1997. The role of ecological
knowledge in explaining biogeography and biodiversity in
Amazonia. Biodivers. Conserv. 6: 347 – 357.
Udvardy, M.D.F. 1975. A classification of the biogeographical
provinces of the world. IUCN Occasional Papers no. 18. IUCN,
Gland, Switzerland.
Velazco, P.M. and B.D. Patterson. 2008. Phylogenetics and
biogeography of the broad-nosed bats, genus Platyrrhinus
(Chiroptera: Phyllostomidae). Mol. Phylogen. Evol. 49:
749 – 759.
Voss, R.S. 2003. A new species of Thomasomys (Rodentia: Muridae)
from eastern Ecuador, with remarks on mammalian diversity
and biogeography in the Cordillera Oriental. Am. Mus. Nov.
3421: 1 – 47.
Whittaker, R.J., K.J. Willis and R. Field. 2001. Scale and species
richness: towards a general, hierarchical theory of species
diversity. J. Biogeogr. 28: 453 – 470.
Willig, M.R., D.M. Kaufman and R.D. Stevens. 2003. Latitudinal
gradients of biodiversity: pattern, process, scale and
synthesis. Ann. Rev. Ecol. Evol. Syst. 34: 273 – 309.
Wilson, D.E., and D.A.M. Reeder (eds.). 2005. Mammal species of
the world: a taxonomic and geographic reference. 3rd ed. John
Hopkins Univ. Press, Baltimore, MD. pp. 2142 .
Zar, J.H. 1984. Biostatistical analysis. Prentice-Hall, Englewood
Cliffs, NJ. pp. 736.
Authenticated | 107.0.125.4Download Date | 9/14/12 5:13 PM
Copyright © 2022 FDOKUMEN