Gaze-independent ERP-BCIs: augmenting performance through location-congruent bimodal stimuli
Upload
independentCategory
view
4download
0
ORIGINALARTICLE
Different evolutionary histories underlie
congruent species richness gradients of
birds and mammals1Bradford A. Hawkins1*, Christy M. McCain2, T. Jonathan Davies3,4,
Lauren B. Buckley3,5, Brian Anacker6, Howard V. Cornell6,
Ellen I. Damschen7, John-Arvid Grytnes8, Susan Harrison6,
Robert D. Holt9, Nathan J. B. Kraft10,11 and Patrick R. Stephens3,12
JB
I2
65
5B
Dispa
tch:
28.11.11
Jour
nal:
JBI
CE:V
ijay
JournalName
ManuscriptNo.
Autho
rRec
eive
d:No.
ofpa
ges:
17PE
:Bhu
vana
1Department of Ecology & Evolutionary
Biology, University of California, Irvine, CA
92696, USA, 2Department of Ecology &
Evolutionary Biology, University of Colorado,
and University of Colorado Natural History
Museum, Boulder, CO 80309, USA, 3National
Centre for Ecological Analysis and Synthesis,
University of California, Santa Barbara, CA
93101, USA, 4Department of Biology, McGill
University, Montreal, QC H3A 1B1, Canada,5Department of Biology, University of North
Carolina, Chapel Hill, NC 27599, USA,6Department of Environmental Science &
Policy, University of California, Davis, CA
95616, USA, 7Department of Zoology,
University of Wisconsin, Madison, WI 53706,
USA, 8Department of Biology, University of
Bergen, N-5020 Bergen, Norway, 9Department
of Biology, University of Florida, Gainesville,
FL 32611, USA, 10Department of Integrative
Biology, University of California, Berkeley, CA
94720, USA, 11Biodiversity Research Centre,
University of British Columbia, BC V6T 1Z4,
Canada, 12Odum School of Ecology, University
of Georgia, Athens, GA 30602, USA2
*Correspondence: Bradford A. Hawkins,
Department of Ecology & Evolutionary Biology,
University of California, Irvine, CA 92696, USA.
E-mail: [email protected]
ABSTRACT
Aim The global species richness patterns of birds and mammals are strongly
congruent. This could reflect similar evolutionary responses to the Earth’s history,
shared responses to current climatic conditions, or both. We compare the
geographical and phylogenetic structures of both richness gradients to evaluate
these possibilities.
Location Global.
Methods Gridded bird and mammal distribution databases were used to
compare their species richness gradients with the current environment.
Phylogenetic trees (resolved to family for birds and to species for mammals)
were used to examine underlying phylogenetic structures. Our first prediction is
that both groups have responded to the same climatic gradients. Our
phylogenetic predictions include: (1) that both groups have similar
geographical patterns of mean root distance, a measure of the level of the
evolutionary development of faunas, and, more directly, (2) that richness patterns
of basal and derived clades will differ, with richness peaking in the tropics for
basal clades and in the extra-tropics for derived clades, and that this difference
will hold for both birds and mammals. We also explore whether alternative
taxonomic treatments for mammals can generate patterns matching those of
birds.
Results Both richness gradients are associated with the same current
environmental gradients. In contrast, neither of our evolutionary predictions is
met: the gradients have different phylogenetic structures, and the richness of birds
in the lowland tropics is dominated by many basal species from many basal
groups, whereas mammal richness is attributable to many species from both few
basal groups and many derived groups. Phylogenetic incongruence is robust to
taxonomic delineations for mammals.
Main conclusions Contemporary climate can force multiple groups into
similar diversity patterns even when evolutionary trajectories differ. Thus, as
widely appreciated, our understanding of biodiversity must consider responses to
both past and present climates, and our results are consistent with predictions
that future climate change will cause major, correlated changes in patterns of
diversity across multiple groups irrespective of their evolutionary histories.
Keywords
Bird diversity, climate change, diversity gradients, global biodiversity, mammal
diversity, niche conservatism, species richness, tropical niche conservatism.
Journal of Biogeography (J. Biogeogr.) (2011)
ª 2011 Blackwell Publishing Ltd http://wileyonlinelibrary.com/journal/jbi 1doi:10.1111/j.1365-2699.2011.02655.x
1
2
3
4
5
6
7
8
9
10
11
12
13
14
15
16
17
18
19
20
21
22
23
24
25
26
27
28
29
30
31
32
33
34
35
36
37
38
39
40
41
42
43
44
45
46
47
48
49
50
51
52
53
54
55
56

INTRODUCTION
The decrease in the number of species from the tropics to the
poles is a ubiquitous feature of life on Earth (Hillebrand, 2004
and references therein). Even so, not all taxa have identical
patterns, nor must there be a single explanation for all groups.
Global-scale diversity gradients are complex and can arise from
combinations of, among other things, organisms’ responses to
contemporary and past climates (Hawkins et al., 2003, 2007;
Araujo et al., 2008), geographical variation in the timing of the
origin and spread of clades (Wiens & Donoghue, 2004;
Jablonski et al., 2006; Wiens et al., 2006, 2009; Krug et al.,
2009) and variable diversification rates (Hawkins et al., 2006,
2007; Mittelbach et al., 2007; Weir & Schluter, 2007; Wiens,
2007; Jansson & Davies, 2008). This complexity has resulted in
a plethora of explanations and proposed mechanisms for
broad-scale species richness gradients over the past 200 years
(Whittaker et al., 2001; Willig et al., 2003), and a current
challenge is to identify similarities and differences among
groups3 of taxa.
Among terrestrial organisms, the species richness gradients
of birds and mammals have received by far the most
attention, and their charismatic nature4 has led to the
availability of distributional data across the whole planet.
Global-scale distributional databases have been generated for
birds (Orme et al., 2005; Hawkins et al., 2007; Jetz et al.,
2007) and mammals (Grenyer et al., 2006), and, although it
has long been realized that both groups have many species
in the tropics and few at the poles, the availability of
gridded data across multiple continents has revealed a close
congruence of their diversity gradients. Grenyer et al. (2006),
using a global grid of 9310 km2 cells, reported a correlation
of 0.90 between mammal and bird species richness, with
even stronger correlations at coarser grains. Commonalities
between the groups, including homeothermy and extensive
post-Cretaceous radiations, generate some expectation of
congruence in geographical patterns. However, important
behavioural differences between them might also be expected
to generate different gradients. For example, the extreme
migratory habits found in many bird clades allow the use of
seasonally suitable conditions and the avoidance of stressful
periods, and the burrowing behaviour widespread in small
mammals allows manipulation of the microclimates to
which they are exposed and may permit persistence in
otherwise harsh conditions. But understanding how the
highly similar global richness patterns of these two groups as
a whole have been formed, despite their differences, may
have important implications for understanding biodiversity
in general.
It has been argued that both birds and mammals responded
to the global climate change that occurred during the mid-
Tertiary (35–15 Ma), and that the richness patterns observed
today are at least partially driven by phylogenetic niche
conservatism, which is defined as the retention of ecological
traits over time among related species (Wiens et al., 2010).
Hawkins et al. (2005, 2006, 2007) concluded that bird species
richness patterns derive from a combination of current
climate, operating both directly via physiological stresses and
indirectly via vegetation (which provides nesting sites, protec-
tion from predators, amelioration of climatic extremes, food,
structural heterogeneity, etc.), tropical niche conservatism
(TNC) at 5higher taxonomic levels [see Wiens & Donoghue
(2004) for detailed discussion of TNC], and time for speci-
ation. These inferences rested on three observations. First,
there was a strong correspondence between current richness
patterns and environmental gradients. Second, species in basal
families accounted for a high proportion of richness in the
lowland tropics, suggesting early radiations in the relatively
warm Late Cretaceous (100–65 Ma) and early Eocene (55–
49 Ma) versus a dominance of species in families that radiated
in the colder post-Eocene (34 Ma onwards) at temperate
latitudes and in high-altitude tropics. Third, longitudinal
gradients reflected high richness for specific groups depending
on whether they originated in western or eastern Gondwana
(e.g. suboscine passerines in the west and oscine passerines in
the east).
Buckley et al. (2010) recently analysed the global species
richness gradient of mammals using a phylogenetic perspective
to evaluate four evolutionary scenarios, three of which were
variations on niche conservatism models. They concluded that
the richness gradient reflects ‘strict phylogenetic niche con-
servatism’ in which positive richness–climate correlations are
driven by older mammal groups with tropical origins in the
early Tertiary, whereas younger groups arising after the late
Eocene tend to have negative richness–climate relationships
(they are richer in the extra-tropics). Thus, although the
methods employed by Hawkins et al. (2007) for birds and by
Buckley et al. (2010) for mammals were very different, they
arrived at similar conclusions: tropical niche conservatism in
both groups generates species richness gradients that arise
from the tropical origin of older groups, but with younger
groups that have evolved traits that permit the colonization of
cold post-Eocene climates and that are relatively richer outside
the tropics. If true, the 6similarity of bird and mammals
species richness gradients largely reflects similar evolutionary
responses via a shared mechanism.
Commonality of an evolutionary mechanism is not the only
possible reason why birds and mammals have highly concor-
dant species richness gradients. Evidence for tropical niche
conservatism does not rule out the possibility that both birds
and mammals are also responding to current patterns of
climate and vegetation independently of their evolutionary
histories. If climate and vegetation structures, the latter itself
strongly affected by climate, influence richness gradients, either
because species have inherited particular environmental pref-
erences (phylogenetic niche conservatism) or because climate
limits diversity via either resources or interactions with the
physiological tolerances of species, contemporary processes are
critical for the maintenance of richness patterns. This is
consistent with concerns about the impact of future global
climate change on diversity. Nonetheless, we are left with the
following question. How much does the current species
B. A. Hawkins et al.
2 Journal of Biogeography
ª 2011 Blackwell Publishing Ltd
1
2
3
4
5
6
7
8
9
10
11
12
13
14
15
16
17
18
19
20
21
22
23
24
25
26
27
28
29
30
31
32
33
34
35
36
37
38
39
40
41
42
43
44
45
46
47
48
49
50
51
52
53
54
55
56
richness gradient of endotherms reflect the outcome of long-
term evolutionary processes as opposed to limits to richness
influenced by current environmental conditions? Opinions
about their relative importance divide the literature (see, e.g.
Latham & Ricklefs, 1993; McGlone, 1996; Francis & Currie,
1998, 2003; Currie & Francis, 2004; Qian & Ricklefs, 2004;
Algar et al., 2009; Wiens et al., 2011), and it is not straight-
forward to disentangle their influences. Although analyses of
single taxonomic groups are informative, comparisons among
groups clearly represent7 a stronger test.
In this paper we examine the extent to which the global
richness gradients of birds and mammals reflect similar
evolutionary histories. It is well established that species
richness is correlated with climate, most often with measures
of energy and water availability (Wright et al., 1993; Hawkins
et al., 2003). Perhaps unsurprisingly, therefore, richness gra-
dients themselves may be strongly correlated. This covariation
is most conspicuous in the ‘latitudinal diversity gradient’, but
it is also a fundamental tenet underlying attempts to identify
global conservation priorities, such as Conservation Interna-
tional’s Biodiversity Hotspots (http://www.biodiversityhotspots.
org8 ). More recently, as information on phylogenetic affinities
across species has become available, the evolutionary history of
groups has also been mapped, and the relationship between
evolutionary history and current richness gradients explored
(e.g. Sechrest et al., 2002; Hawkins et al., 2007; Davies et al.,
2008; Wiens et al., 2011). These studies suggest that phyloge-
netic niche conservatism has been an important factor in
structuring the geographical distribution of species richness
(also see a recent review by Wiens et al., 2010). However,
whether taxa display congruent evolutionary histories as well
as congruent richness gradients has not been assessed; here we
aim to fill this gap.
Our analysis focuses on three predictions, the first arising
from the supposition that contemporary climate/vegetation
has a strong influence on patterns, and two based on
evolutionary responses by both groups to post-Eocene climate
change. If diversity gradients for both birds and mammals are a
product of the same underlying mechanism(s) we predict that:
(1) overall mammal diversity should be strongly associated
with the contemporary environmental factors known to
influence birds; (2) the phylogenetic structure of the mammal
gradient should reflect the relative dominance of more basal
clades in the tropics and Southern Hemisphere, with more
derived faunas in the northern temperate zone; and (3) clades
originating in the Cretaceous to Eocene should be rich in the
lowland tropics but depauparate in high-altitude tropics and
the extra-tropics, whereas clades originating in the Miocene or
Pliocene should be relatively rich in cooler climates. If tropical
niche conservatism is the dominant influence on both bird and
mammal diversity, the third prediction should hold true
irrespective of how clades are defined and across multiple
taxonomic levels. Our goal is to explore the extent to which
bird and mammal richnesses reflect similarity in their evolu-
tionary responses to long-term climate change, or if current
climate can account for their convergence of pattern indepen-
dently of the evolutionary histories of these two large
taxonomic groups.
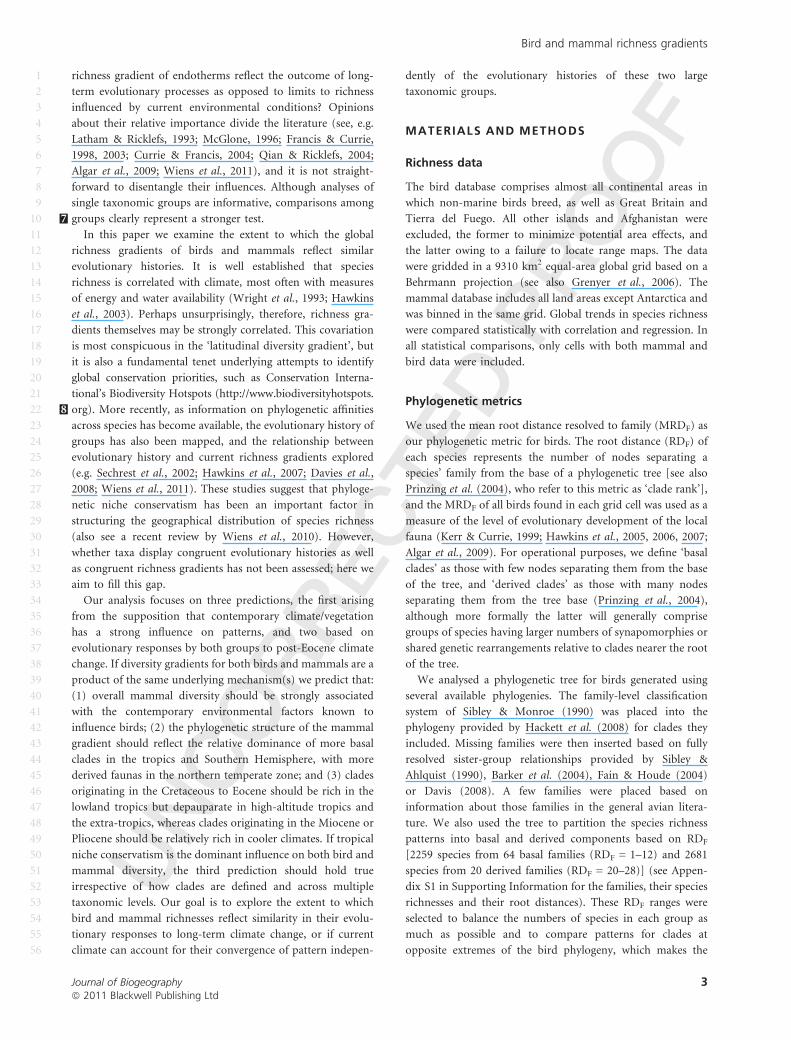
MATERIALS AND METHODS
Richness data
The bird database comprises almost all continental areas in
which non-marine birds breed, as well as Great Britain and
Tierra del Fuego. All other islands and Afghanistan were
excluded, the former to minimize potential area effects, and
the latter owing to a failure to locate range maps. The data
were gridded in a 9310 km2 equal-area global grid based on a
Behrmann projection (see also Grenyer et al., 2006). The
mammal database includes all land areas except Antarctica and
was binned in the same grid. Global trends in species richness
were compared statistically with correlation and regression. In
all statistical comparisons, only cells with both mammal and
bird data were included.
Phylogenetic metrics
We used the mean root distance resolved to family (MRDF) as
our phylogenetic metric for birds. The root distance (RDF) of
each species represents the number of nodes separating a
species’ family from the base of a phylogenetic tree [see also
Prinzing et al. (2004), who refer to this metric as ‘clade rank’],
and the MRDF of all birds found in each grid cell was used as a
measure of the level of evolutionary development of the local
fauna (Kerr & Currie, 1999; Hawkins et al., 2005, 2006, 2007;
Algar et al., 2009). For operational purposes, we define ‘basal
clades’ as those with few nodes separating them from the base
of the tree, and ‘derived clades’ as those with many nodes
separating them from the tree base (Prinzing et al., 2004),
although more formally the latter will generally comprise
groups of species having larger numbers of synapomorphies or
shared genetic rearrangements relative to clades nearer the root
of the tree.
We analysed a phylogenetic tree for birds generated using
several available phylogenies. The family-level classification
system of Sibley & Monroe (1990) was placed into the
phylogeny provided by Hackett et al. (2008) for clades they
included. Missing families were then inserted based on fully
resolved sister-group relationships provided by Sibley &
Ahlquist (1990), Barker et al. (2004), Fain & Houde (2004)
or Davis (2008). A few families were placed based on
information about those families in the general avian litera-
ture. We also used the tree to partition the species richness
patterns into basal and derived components based on RDF
[2259 species from 64 basal families (RDF = 1–12) and 2681
species from 20 derived families (RDF = 20–28)] (see Appen-
dix S1 in Supporting Information for the families, their species
richnesses and their root distances). These RDF ranges were
selected to balance the numbers of species in each group as
much as possible and to compare patterns for clades at
opposite extremes of the bird phylogeny, which makes the
Bird and mammal richness gradients
Journal of Biogeography 3ª 2011 Blackwell Publishing Ltd
1
2
3
4
5
6
7
8
9
10
11
12
13
14
15
16
17
18
19
20
21
22
23
24
25
26
27
28
29
30
31
32
33
34
35
36
37
38
39
40
41
42
43
44
45
46
47
48
49
50
51
52
53
54
55
56

analysis less sensitive to future changes in the structure of the
tree. The RDF cut-offs were also guided by estimates of crown-
group ages using the differences in the 50% dissociation
temperatures between DNA homoduplexes and heteroduplex-
es (DT50Hs) reported by Sibley & Ahlquist (1990). Splitting the
birds at these root distances, and excluding the middle section
of the tree described by root distances between 13 and 19,
allowed us to compare the species richness gradients of clades
whose initial radiations pre-dated the Eocene–Oligocene
climate shift with the youngest clades that radiated in concert
with the episodic global cooling and drying that has charac-
terized the Earth’s climate over the past 34 Myr (Behrensmeyer
et al., 1992), although ages defined by DT50H are by no means
exact and were not analysed explicitly.
The availability of a supertree for mammals (Bininda-
Emonds et al., 2007) allowed us to generate a broader range of
phylogenetic metrics and to estimate clade ages more precisely.
For the direct comparison with birds we first calculated
mammal MRDF as per birds. Because the mammal tree
includes branch lengths, we also calculated time-calibrated
MRDF by replacing the node count with how far from the base
of the tree each crown group arose, measured in millions of
years with the base assumed to be 166 Ma (Bininda-Emonds
et al., 2007). This cannot be directly compared with birds9 , but
it provides an alternative metric of mammalian phylogenetic
structure. Third, we generated mean root distance at the
species level (MRDS) by counting the number of nodes from
the base of the tree to each species. This allows us to examine
the phylogenetic structure of the mammal gradient at a finer
taxonomic level and captures the phylogenetic pattern arising
from all extant radiations spanning the Late Cretaceous to the
Pleistocene. Finally, we used crown-group ages to partition
mammal families into older groups (534 species from 16
families older than 49 Ma) and younger groups (533 species in
46 families younger than 23 Ma), from which families of
intermediate ages were excluded (see Appendix S1 for the
families, their richnesses and their ages). Similar to the case for
birds, the numbers of species in the two groups were as
balanced as possible, and their radiations were initiated either
well before or after the Oligocene climate shift. The extremely
diverse rodent superfamily Muroidea (Musser & Carleton,
2005), estimated to have arisen 48.1 Ma, was examined
separately to enable comparison of their richness gradient
with the other early and mid-Eocene radiations.
A potential criticism of RDF as a comparative phylogenetic
metric stems from the assumption of equivalency among
families both within birds and mammals and between the
groups, which is undoubtedly not the case (Avise & Johns,
1999). For birds, the taxonomic (but not phylogenetic)
treatment follows from DNA–DNA hybridization studies
dating from the late 1970s and 1980s that used thresholds in
melting profiles of the hybridized DNA to delineate taxonomic
ranks (Sibley & Ahlquist, 1990). Therefore, bird families
represent discrete evolutionary units exceeding some mini-
mum threshold in genetic distance, which might translate into
minimum divergence times, assuming a monotonic decay in
similarity over time (Fitch, 1976). This is fundamentally
different from how mammal families are currently defined
(McKenna & Bell, 1997; Wilson & Reeder, 2005). Basically,
taxonomic families are artificial constructs, and the exact
nature of these constructs differs for birds and mammals. To
explore how the designation of families might influence our
comparison, we used a time-based method to generate
alternative classifications of mammals. The phylogeny was
‘sliced’ at 10-Myr intervals (ranging from 20 to 80 Ma), and
family ranks were assigned to each clade descending from
nodes at this time interval or from the next oldest node. Thus,
we generated root distances for each species based on seven
arbitrary family classifications, with families assigned using
various minimum divergence times. These RDFs were used to
generate new MRDFs, which were then compared with the
pattern of bird MRDF. Although the use of familial root
distances will always leave room for doubt about how patterns
compare across different taxonomic groups, by exploring
alternative taxonomic classification schemes we can evaluate
how early (suprafamily) radiations determine MRDF versus
vagaries of taxonomic nomenclature.
Finally, because the lack of a species-level supertree for birds
effectively makes ‘family’ rather than species the basic unit of
comparison across birds and mammals from a phylogenetic
perspective, we compare the richness patterns of families of the
oldest (Cretaceous/Eocene) and most recent (Miocene/Plio-
cene) birds and mammals. This allows us to ascertain if
differences in species richness reflect differences in the early
differentiation of lineages (above the family level) or arise from
exceptional radiations within a few families (young or old). It
is important to bear in mind that the absence of a bird
phylogeny at the species level strongly constrains our analysis
and makes it essentially impossible to address all of the
possible issues related to comparing the phylogenetic structure
of two large, independently evolving groups. Given this, our
strategy is to utilize a ‘weight of evidence’ approach: we
attempt a wide range of comparisons, and, although none of
the approaches is perfect, if all results lead to similar
conclusions it suggests that they are reasonably robust [see
McGill (2003) for discussion of the use of multiple tests in
macroecology].
Environmental data and analysis
The relationships between current environment and bird and
mammal species richness were tested with a path model derived
from the one presented by Hawkins et al. (2007) for birds.
Selection of the optimal model for birds used the program epa2
(Shipley, 2002) followed by d-separation tests of paths using the
program dgraph (Shipley, 2002). Path coefficients were then
obtained iteratively using the maximum Wishart likelihood
method implemented in the RAMONA routine of systat 10.0
(Browne & Mels, 2000) and tested for significance using a
geographically effective degrees of freedom of 200 to control for
residual spatial autocorrelation (as in Hawkins et al., 2007). The
predictors included annual actual evapotranspiration (AET, a
B. A. Hawkins et al.
4 Journal of Biogeography
ª 2011 Blackwell Publishing Ltd
1
2
3
4
5
6
7
8
9
10
11
12
13
14
15
16
17
18
19
20
21
22
23
24
25
26
27
28
29
30
31
32
33
34
35
36
37
38
39
40
41
42
43
44
45
46
47
48
49
50
51
52
53
54
55
56

measure of water–energy balance, available at http://www.grid.
unep.ch/data/data.php?category=atmosphere), Global Vegeta-
tion Index (GVI, available at http://www.osdpd.noaa.gov/ml/
land/gvi.html), range in elevation (Relev) from the gtopo30
digital elevation model (available at http://eros.usgs.gov/#/
Find_Data/Products_and_Data_Available/gtopo30_info) and
mean annual temperature (available at http://www.worldclim.
org/). To capture mesoscale interactions between topography
and macroclimate, we also calculated the interaction between
annual temperature (+21 �C) and range in elevation in each cell
(T · Relev). The five variables in the model are known to have
explanatory power for birds via direct and indirect paths
(Hawkins et al., 2007), and may similarly influence mammals.
Model fits were evaluated by the root mean square error of
approximation (RMESA) and tested against the null model of a
perfect fit (H0: RMESA = 0).
RESULTS
As found by Grenyer et al. (2006), the bird and mammal
species richness gradients are strongly correlated (Fig. 1),
although absolute numbers of bird species in cells are generally
greater than those of mammals. Patterns within biogeograph-
ical regions are also correlated, although some differences
within and among regions exist (r = 0.74–0.90; cf. Figs 2a &
3a). The most noticeable difference at the global extent is the
extremely high richness of birds in the tropical Andes, whereas
mammals, albeit also being rich in the Andes, are richest in the
eastern Africa Rift zone and are relatively more diverse in most
of tropical Africa.
Contemporary environment and richness
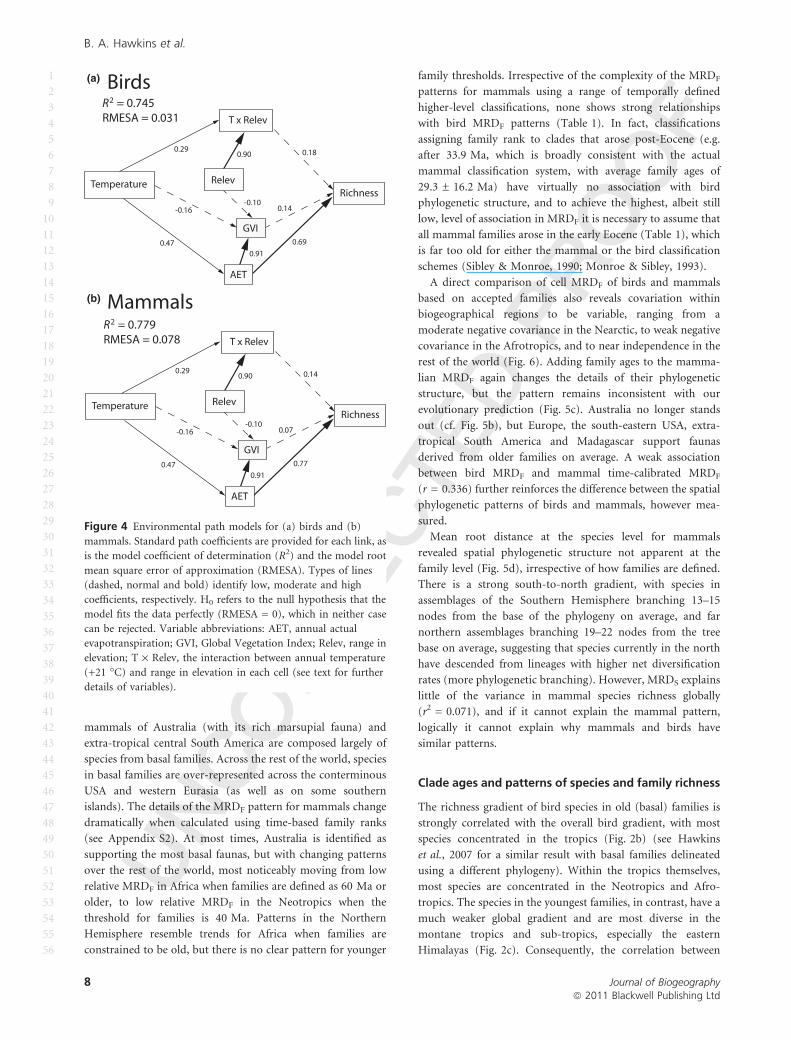
Given the similarity in richness patterns, we expected both bird
and mammal gradients to be associated with similar environ-
mental gradients. This was confirmed by the path models
(Fig. 4). There were small differences in the standardized path
coefficients leading to the richness of each group, but the
model designed to explain bird richness explained as much
variance in mammal richness. Mammals also had a slightly
stronger association with water–energy balance (AET) than
birds, and a weaker direct association with vegetation, but the
rankings of the direct coefficients were identical in both
models. The RMESAs of the two models were not significantly
different from a perfect fit (Fig. 4). Thus, the model optimized
for birds had similar explanatory power for mammals, and we
conclude that both groups respond to broad-scale and
mesoscale climatic gradients and vegetation. That is, congru-
ence in pattern is consistent with shared responses to
contemporary environmental structure, meeting our first
prediction.
Phylogenetic structure of the richness gradients
The familial mean root distance (MRDF) of birds has high
variance and shows strong but complex spatial structure
(Fig. 5a). The fauna with the largest proportion of species
descending from early-diverging families is found in the
eastern Sahara, but fewer than 10 bird species occur there. In
areas with more diverse faunas, the highest richness of species
descending from basal families is found in Amazonia, partially
reflecting the extensive radiations of Trochilidae and Psittac-
idae, but also attributable to a paucity of species from derived
families in Neotropical lowland forest. Generally, bird assem-
blages are from more derived families in deciduous forests in
the Holarctic, Himalayas and mountains of the south-central
Palaearctic (Fig. 5a), reflecting extensive mid-latitude radia-
tions among the most highly derived oscine passerines.
Mammalian MRDF based on accepted families has a global
pattern strikingly different from that of birds (Fig. 5b). The
0
25
50
75
100
125
150
175
200
225
250
275
300
0 50 100 150 200 250 300 350 400 450 500 550 600 650 700 750 800 850 900 950 1000
Number of bird species
Nu
mb
er
of
ma
mm
al s
pe
cie
s
Nearctic (= 0.753)Australia (= 0.759)
Oriental (= 0.850)
Palaearctic (= 0.813)
Neotropics (= 0.864)Afrotropics (= 0.867)
r = 0.903
Figure 1 Relationship between the species richness of birds and mammals in a global 9310 km2 grid. Biogeographical regions are also
distinguished. Correlations in richness patterns are presented across all data and within each region.
COLOR
Bird and mammal richness gradients
Journal of Biogeography 5ª 2011 Blackwell Publishing Ltd
1
2
3
4
5
6
7
8
9
10
11
12
13
14
15
16
17
18
19
20
21
22
23
24
25
26
27
28
29
30
31
32
33
34
35
36
37
38
39
40
41
42
43
44
45
46
47
48
49
50
51
52
53
54
55
56

0
950
475
237
712
0
410
205
102
307
0
410
205
102
307
All birds
Basal groups (r = 0.955)
Derived groups (r = 0.793)
(a)
(b)
(c)
Figure 2 Species richness patterns of birds in a 9310 km2 grid. (a) All species, (b) species belonging to families with a root distance of 1–12,
and (c) species belonging to families with a root distance of 20–28. Correlation coefficients in (b) and (c) are for the associations between the
richness of each subgroup and all birds.
COLOR
B. A. Hawkins et al.
6 Journal of Biogeography
ª 2011 Blackwell Publishing Ltd
1
2
3
4
5
6
7
8
9
10
11
12
13
14
15
16
17
18
19
20
21
22
23
24
25
26
27
28
29
30
31
32
33
34
35
36
37
38
39
40
41
42
43
44
45
46
47
48
49
50
51
52
53
54
55
56
All mammals
0
258
129
65
194
0
46
23
12
35
0
54
27
13
40
0
46
23
12
35
(a)
(b)
(c)
(d)
Cretaceous/Eocene groups (r = 0.915)
Muroidea (r = 0.743)
Miocene/Pliocene groups (r = 0.920)
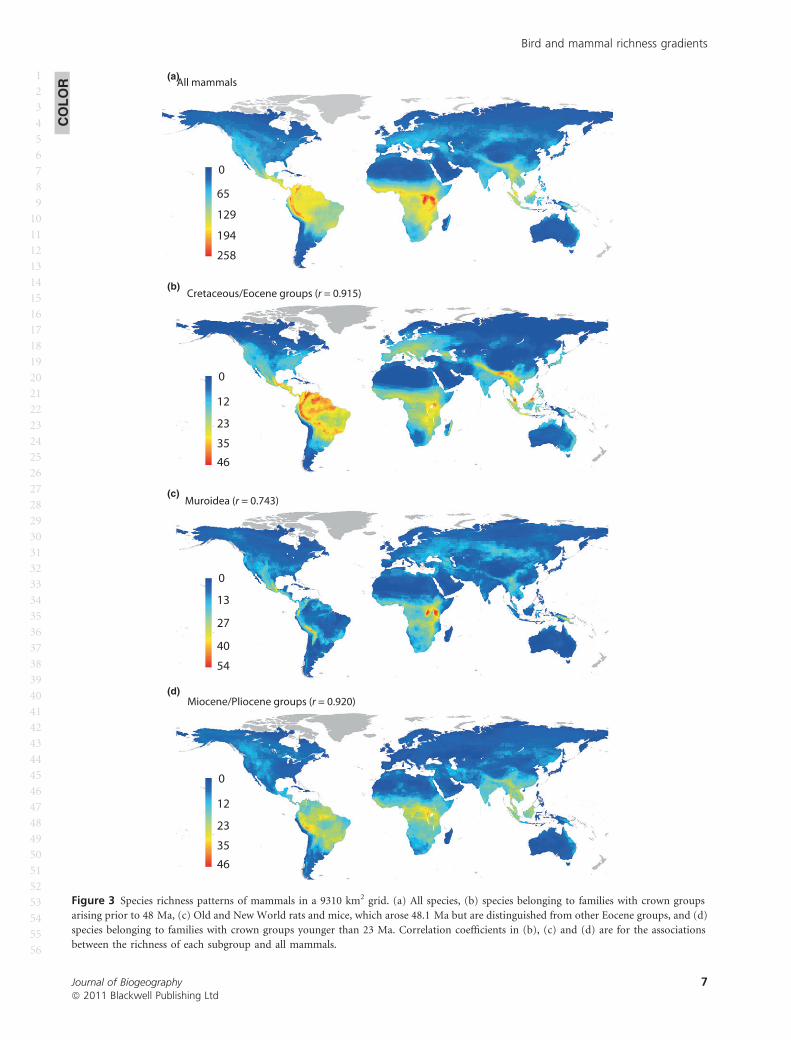
Figure 3 Species richness patterns of mammals in a 9310 km2 grid. (a) All species, (b) species belonging to families with crown groups
arising prior to 48 Ma, (c) Old and New World rats and mice, which arose 48.1 Ma but are distinguished from other Eocene groups, and (d)
species belonging to families with crown groups younger than 23 Ma. Correlation coefficients in (b), (c) and (d) are for the associations
between the richness of each subgroup and all mammals.
COLOR
Bird and mammal richness gradients
Journal of Biogeography 7ª 2011 Blackwell Publishing Ltd
1
2
3
4
5
6
7
8
9
10
11
12
13
14
15
16
17
18
19
20
21
22
23
24
25
26
27
28
29
30
31
32
33
34
35
36
37
38
39
40
41
42
43
44
45
46
47
48
49
50
51
52
53
54
55
56
mammals of Australia (with its rich marsupial fauna) and
extra-tropical central South America are composed largely of
species from basal families. Across the rest of the world, species
in basal families are over-represented across the conterminous
USA and western Eurasia (as well as on some southern
islands). The details of the MRDF pattern for mammals change
dramatically when calculated using time-based family ranks
(see Appendix S2). At most times, Australia is identified as
supporting the most basal faunas, but with changing patterns
over the rest of the world, most noticeably moving from low
relative MRDF in Africa when families are defined as 60 Ma or
older, to low relative MRDF in the Neotropics when the
threshold for families is 40 Ma. Patterns in the Northern
Hemisphere resemble trends for Africa when families are
constrained to be old, but there is no clear pattern for younger
family thresholds. Irrespective of the complexity of the MRDF
patterns for mammals using a range of temporally defined
higher-level classifications, none shows strong relationships
with bird MRDF patterns (Table 1). In fact, classifications
assigning family rank to clades that arose post-Eocene (e.g.
after 33.9 Ma, which is broadly consistent with the actual
mammal classification system, with average family ages of
29.3 ± 16.2 Ma) have virtually no association with bird
phylogenetic structure, and to achieve the highest, albeit still
low, level of association in MRDF it is necessary to assume that
all mammal families arose in the early Eocene (Table 1), which
is far too old for either the mammal or the bird classification
schemes (Sibley & Monroe, 1990; Monroe & Sibley, 1993).
A direct comparison of cell MRDF of birds and mammals
based on accepted families also reveals covariation within
biogeographical regions to be variable, ranging from a
moderate negative covariance in the Nearctic, to weak negative
covariance in the Afrotropics, and to near independence in the
rest of the world (Fig. 6). Adding family ages to the mamma-
lian MRDF again changes the details of their phylogenetic
structure, but the pattern remains inconsistent with our
evolutionary prediction (Fig. 5c). Australia no longer stands
out (cf. Fig. 5b), but Europe, the south-eastern USA, extra-
tropical South America and Madagascar support faunas
derived from older families on average. A weak association
between bird MRDF and mammal time-calibrated MRDF
(r = 0.336) further reinforces the difference between the spatial
phylogenetic patterns of birds and mammals, however mea-
sured.
Mean root distance at the species level for mammals
revealed spatial phylogenetic structure not apparent at the
family level (Fig. 5d), irrespective of how families are defined.
There is a strong south-to-north gradient, with species in
assemblages of the Southern Hemisphere branching 13–15
nodes from the base of the phylogeny on average, and far
northern assemblages branching 19–22 nodes from the tree
base on average, suggesting that species currently in the north
have descended from lineages with higher net diversification
rates (more phylogenetic branching). However, MRDS explains
little of the variance in mammal species richness globally
(r2 = 0.071), and if it cannot explain the mammal pattern,
logically it cannot explain why mammals and birds have
similar patterns.
Clade ages and patterns of species and family richness
The richness gradient of bird species in old (basal) families is
strongly correlated with the overall bird gradient, with most
species concentrated in the tropics (Fig. 2b) (see Hawkins
et al., 2007 for a similar result with basal families delineated
using a different phylogeny). Within the tropics themselves,
most species are concentrated in the Neotropics and Afro-
tropics. The species in the youngest families, in contrast, have a
much weaker global gradient and are most diverse in the
montane tropics and sub-tropics, especially the eastern
Himalayas (Fig. 2c). Consequently, the correlation between
Temperature
T x Relev
Relev
GVI
AET
Richness
0.18
0.14
0.69
0.90
-0.10
0.91
0.29
-0.16
0.47
R = 0.745
RMESA = 0.031
2
Birds
Mammals
Temperature
T x Relev
Relev
GVI
AET
Richness
0.14
0.07
0.77
0.90
-0.10
0.91
0.29
-0.16
0.47
R = 0.779
RMESA = 0.078
2
(a)
(b)
Figure 4 Environmental path models for (a) birds and (b)
mammals. Standard path coefficients are provided for each link, as
is the model coefficient of determination (R2) and the model root
mean square error of approximation (RMESA). Types of lines
(dashed, normal and bold) identify low, moderate and high
coefficients, respectively. H0 refers to the null hypothesis that the
model fits the data perfectly (RMESA = 0), which in neither case
can be rejected. Variable abbreviations: AET, annual actual
evapotranspiration; GVI, Global Vegetation Index; Relev, range in
elevation; T · Relev, the interaction between annual temperature
(+21 �C) and range in elevation in each cell (see text for further
details of variables).
B. A. Hawkins et al.
8 Journal of Biogeography
ª 2011 Blackwell Publishing Ltd
1
2
3
4
5
6
7
8
9
10
11
12
13
14
15
16
17
18
19
20
21
22
23
24
25
26
27
28
29
30
31
32
33
34
35
36
37
38
39
40
41
42
43
44
45
46
47
48
49
50
51
52
53
54
55
56

8.8
13.0
10.9
9.5
11.8
10.4
22.8
16.6
13.5
19.7
Birds (family MRD)
(b) Mammals (family MRD)
121
131
126
136
(c) Mammals (time calibrated family MRD)
141
(d) Mammals (species MRD)
13.4
22.0
17.7
15.5
19.8
(a)
Figure 5 Geographical pattern of mean root distance at the family level for (a) birds and (b) mammals. (c) Time-calibrated mean root
distance at the family level for mammals and (d) mean root distance at the species level for mammals. Units in (c) are 1 · 106 years from the
base of the phylogeny.
COLOR
Bird and mammal richness gradients
Journal of Biogeography 9ª 2011 Blackwell Publishing Ltd
1
2
3
4
5
6
7
8
9
10
11
12
13
14
15
16
17
18
19
20
21
22
23
24
25
26
27
28
29
30
31
32
33
34
35
36
37
38
39
40
41
42
43
44
45
46
47
48
49
50
51
52
53
54
55
56

the species richness of younger families and total richness is
also weaker. Although it is not possible to determine whether
the high richness of older clades is a product of ancient or
recent diversification, the high richness of younger clades must
reflect recent speciation; hence these results suggest that the
history of recent speciation may have been highest in low-
latitude mountains for birds.
In contrast to birds, species in mammal families older than
49 Ma (Cretaceous and early Eocene) and younger than 23 Ma
(Miocene and Pliocene) have similar richness gradients
(r = 0.806), and both are strongly correlated with the overall
gradient (Fig. 3b,d). Old groups are also moderately rich in
North America and Europe (Fig. 3b), indicating that they have
not been excluded from the cool climates found at mid-
latitudes as were most species in old bird families (Fig. 2b).
Species from young families are concentrated in the tropics
(Fig. 3d), despite the fact that these families began radiating
after the Earth’s climate began cooling. Finally, the Muroidea
(New and Old World rats and mice), although a relatively old
group, are diverse in some areas with cold climates and are
especially diverse in parts of the montane tropics (Fig. 3c).
Thus, the evolutionary predictions derived from the bird
gradient are not met for mammals. In mammals, combined
clades of different ages do not have distinct diversity gradients,
and the overall gradient reflects a combination of species in
families that originated in a world much warmer than present
and species in families that originated during periods of severe
climate change.
A comparison of family richness gradients for old and young
groups also provides a stark contrast between birds and
mammals (Figs 7 & 8). Bird family richness (which is
correlated with species richness, r = 0.829) is much more
strongly characterized by the distributions of the oldest
families than by those of the youngest (Fig. 7), suggesting
that the early diversification of bird lineages was key to shaping
present-day gradients of bird species richness. The reverse is
the case for mammals: high family richness (which is even
more strongly correlated with species richness, r = 0.942) in
the tropics is associated with large numbers of young families,
whereas there is little spatial variation in the few old families
(Fig. 8). The tropical diversity gradient for mammals must
have arisen, therefore, after the initial diversification of lineages
Table 1 Correlation matrix (r) for cell mean root distance (MRDF) using actual bird families (Birds), actual mammal families (Mammals)
and seven arbitrary classification systems for mammals derived from the designation of families based on the slicing of the mammal
phylogeny at 10-Myr intervals (20–80 Ma). The final column provides the correlations between the MRDF of birds and those using each
mammal classification.
Time (Ma) 30 40 50 60 70 80 Mammals Birds
20 0.664 0.552 0.165 0.067 0.360 0.221 0.352 0.054
30 1 0.711 0.184 )0.179 0.093 0.121 0.249 0.040
40 1 0.507 0.108 0.138 0.196 0.455 0.119
50 1 0.453 0.045 0.048 0.444 0.332
60 1 0.753 0.779 0.769 0.161
70 1 0.905 0.667 0.146
80 1 0.696 0.174
Mammals 1 0.116
Bird mean root distance
Ma
mm
al m
ea
n r
oo
t d
ista
nce
Nearctic (= - 0.608)Australia (= - 0.055)
Oriental (= - 0.075)
Palaearctic (= 0.061)
Neotropics (= - 0.313)Afrotropics (= 0.152)
r = 0.288
8
9
10
11
12
13
8 9 11 12 13 14 15 16 17 18 19 20 21 22 2310
Figure 6 Relationship between mean root distances of birds and mammals. Presentation as in Fig. 1.
COLOR
B. A. Hawkins et al.
10 Journal of Biogeography
ª 2011 Blackwell Publishing Ltd
1
2
3
4
5
6
7
8
9
10
11
12
13
14
15
16
17
18
19
20
21
22
23
24
25
26
27
28
29
30
31
32
33
34
35
36
37
38
39
40
41
42
43
44
45
46
47
48
49
50
51
52
53
54
55
56

1
71
35
18
53
1
27
15
8
22
1
27
15
8
22
All families(a)
(b)
(c)
Basal families
Derived families
Figure 7 Family richness patterns of birds. (a) All families, (b) families with a root distance of 1–12, and (c) families with a root distance of
20–28.
COLOR
Bird and mammal richness gradients
Journal of Biogeography 11ª 2011 Blackwell Publishing Ltd
1
2
3
4
5
6
7
8
9
10
11
12
13
14
15
16
17
18
19
20
21
22
23
24
25
26
27
28
29
30
31
32
33
34
35
36
37
38
39
40
41
42
43
44
45
46
47
48
49
50
51
52
53
54
55
56

1
47
24
12
35
1
15
8
4
11
1
15
8
4
11
All families(a)
(b)
(c)
Cretaceous/Eocene families
Miocene/Pliocene families
Figure 8 Family richness patterns of mammals. (a) All families, (b) families with crown groups arising prior to 48 Ma, and (c) families with
crown groups younger than 23 Ma.
COLOR
B. A. Hawkins et al.
12 Journal of Biogeography
ª 2011 Blackwell Publishing Ltd
1
2
3
4
5
6
7
8
9
10
11
12
13
14
15
16
17
18
19
20
21
22
23
24
25
26
27
28
29
30
31
32
33
34
35
36
37
38
39
40
41
42
43
44
45
46
47
48
49
50
51
52
53
54
55
56

defining basal families with origins in the Cretaceous to early
Eocene. In summary, lowland tropical bird faunas contain
many species arising from many basal families, whereas
mammal faunas contain both many species arising from a
few basal families and many species from a large number of
more recent families.
DISCUSSION
Of the predictions for the geographical structure of bird and
mammal species richness, the one based on contemporary
climate is met whereas the evolutionary predictions are not. If
both groups are responding similarly to current climate
gradients we would expect congruent diversity gradients and
close similarity of environmental models for richness, and this
is what we find. This aspect of our results is not surprising,
because the similarity of patterns virtually guarantees that they
will be associated with similar environmental gradients. Our
analysis used only a single grain, but this must remain true
across alternative grain sizes at which the analysis could be
conducted because the correlation between bird and mammal
diversity remained very strong at every grain examined by
Grenyer et al. (2006). It is perhaps more surprising that the
phylogenetic structures of the diversity patterns are essentially
independent, and in some cases even in opposite directions,
leading to the conclusion that the evolutionary and biogeo-
graphical pathways by which birds and mammals have arrived
at their current gradients must have been quite different. This
is not evidence that history or evolution do not influence
contemporary diversity patterns; indeed, the two diversity
gradients are not identical, with a high richness of birds in the
Neotropics and of mammals in the Afrotropics. Higher
tropical richness might still be explained by phylogenetic
conservatism of tropical niches in both groups, but the
phylogenetic structures we observe indicate either that the
evolutionary pathways to tropical conservatism were different
or that the biogeographical pathways to the tropics were
different. We suspect that the richness gradients of other
groups that are similar in structure will show equally
incongruent evolutionary histories, perhaps divergent from
both birds and mammals, although we have no data to
evaluate this at present.
Broad-scale richness patterns of most plant and animal
groups are correlated with climate (Wright et al., 1993;
Hawkins et al., 2003), an association so obvious that it formed
the basis of early explanations for richness gradients (Forster,
1778; von Humboldt, 1808). Even after the influence of
evolution became apparent in the mid-19th century, climate
was still invoked to explain ‘latitudinal’ diversity gradients,
with the major distinction being the claim that past climates
also mattered (Wallace, 1876). Despite this history, associa-
tions between climate and richness are sometimes dismissed as
‘mere correlations’ lacking explanatory power (see, e.g.
McGlone, 1996; Ricklefs, 2004). There are a number of
possible explanations for these associations (reviewed by Evans
et al., 2005), but initial empirical tests of the predictions of
some proposed mechanisms have not been supportive (Currie
et al., 2004). On the other hand, a thought experiment
illustrates how contemporary climate shapes geographical
patterns of species richness. Africa currently has a very uneven
distribution of richness, at least partially owing to the complex
geophysical and climatic history of the continent. But if
climate change over the next century were to cause the Sahara
Desert to cover the entire continent, the richness patterns of all
plant and animal groups would be drastically modified.
Clearly, a ‘contemporary’ climate-based process would be
responsible for the resulting spatial pattern of richness, and we
would also predict that African diversity patterns would again
change if we were able to reverse this climate change and
generate significant rainfall over at least part of the continent.
A relatively rapid and broad-scale change in climate as
envisaged in our thought experiment is analogous to what
happened in Canada 10c. 24 times during the Pleistocene glacial
cycles, so the line between what is considered historical or
contemporary climate is actually very blurred. Climate change
is obviously a continuous process, and the claim that richness
patterns must depend entirely on either the past or the present
is almost certainly based on a false dichotomy.
The bird richness gradient has a phylogenetic structure
consistent with tropical niche conservatism: the richness of
older, more basal families as well as the number of basal
families have a strong tropical bias, whereas younger, more
derived families are relatively richer (in terms of both number
of families and number of species) in the extra-tropics and
cool tropics (see also Hawkins et al., 2006, 2007). This results
in a complex spatial pattern of root distances, with high
variance in MRDF within and among continents. It also
generates a strong correlation between the richness of species
from basal families and overall bird richness. In contrast, the
richness gradients of species of basal versus derived mammal
families are more similar, generating a weak MRDF gradient
across all continents except Australia. Although the MRDF
pattern for mammals using a range of possible family
classification systems varied considerably, none approached
patterns observed for birds, and when families were delineated
using node ages that might best approximate minimum ages
for many bird families (20–30 Ma; Sibley & Ahlquist, 1990),
correlations of MRDF were especially weak. For mammals, the
richness patterns of species belonging to basal versus derived
families provide no evidence that the richness of tropical
mammal faunas can be explained by differential radiation of
lineages prior to the Oligocene climate shift, but rather reflect
patterns of more recent diversification within both basal and
derived families.
Because there are no objective criteria for recognizing higher
taxa, it remains possible that the distribution of basal versus
derived family richness reflects a geographical bias in the
circumscription of families. For example, basal families might
simply represent more inclusive clades when compared with
derived families (Scotland & Sanderson, 2004). If this were the
case, however, we would expect basal families to also be more
species-rich than derived families, but the reverse is true for
Bird and mammal richness gradients
Journal of Biogeography 13ª 2011 Blackwell Publishing Ltd
1
2
3
4
5
6
7
8
9
10
11
12
13
14
15
16
17
18
19
20
21
22
23
24
25
26
27
28
29
30
31
32
33
34
35
36
37
38
39
40
41
42
43
44
45
46
47
48
49
50
51
52
53
54
55
56

birds (P < 0.002, data in Appendix S1), and there is no
significant difference for mammals (P > 0.05; data in Appen-
dix S1). Hence, the dominance of tropical lowland bird faunas
by species in basal clades does not result from more inclusive
definitions of basal families in the tropics, and there is no
discernible bias in mammals.
It is perhaps informative that, although the global gradient
of old mammal families is weak (see Fig. 8b), the species
richness gradient within these groups is strong (see Fig. 3b). If
these families arose in areas with tropical climates in the
Cretaceous and early Palaeogene, this suggests that time for
speciation may be contributing to their diversity gradient
(Buckley et al., 2010), as also indicated for birds (Hawkins
et al., 2007). Unlike the case for birds, however, lowland
tropical mammal richness also comprises11 large numbers of
species from the most recent families, of which there are many
(cf. Figs 3c & 8c). Although we lack direct evidence, differen-
tial diversification rates across latitudes may play a larger role
in mammal diversity (Davies et al., 2008) than in the case of
birds, because young bird families are not especially rich in
tropical lowlands. On the other hand, tropical mountains may
represent species pumps for both birds and mammals, as
younger families of both are species-rich there.
Why might the evolutionary underpinnings of the richness
gradient for mammals appear to differ fundamentally from
that for birds, especially when both Hawkins et al. (2007) and
Buckley et al. (2010) have argued that tropical niche conser-
vatism is important for both? If we assume that one or both of
the previous papers are not in error, several scenarios for the
evolution of mammalian diversity are plausible. One possibil-
ity is that the mammalian basal form was cold-adapted, and
global spread resulted from an easier adaptation from cold
tolerance to warm tolerance. Evidence consistent with this
scenario includes (1) the selection for the hair, homeothermy
and extreme energetic efficiency that characterize mammalian
evolution (Kielan-Jaworowska et al., 2004); (2) the persistence
and subsequent radiation of lineages in regions that would
have been temperate in the Late Jurassic and Early Cretaceous
(Australia, South America), which were then contiguous with
Antarctica; (3) the extensive geographical distribution of fossils
from the major early lineages of mammals (prototherians,
metatherians and eutherians) in the Late Jurassic and Creta-
ceous (Kielan-Jaworowska et al., 2004); and (4) the many
northern clades able to colonize and radiate in tropical South
America during the Great American Biotic Interchange
(Vaughan, 1986; Webb, 2006).
Another possibility is that the basal mammalian niche may
result less from climatic conditions and more from their
evolving during a period of dinosaur domination. A dinosaur-
dominated fauna might have restricted the available niche space
for early mammal diversification. The basal mammalian form
was small, insectivorous, nocturnal and sneaky (Kielan-
Jaworowska et al., 2004), relying on tunnels, burrows, and
nests underground or under vegetation. These traits may have
also shielded many mammals from the full impact of extra-
tropical climatic conditions, thus opening up this habitat for
later occupation and diversification, whereas birds are able to
escape extreme climates (i.e. freezing temperatures) only
through torpor or migration. If true, this only reinforces the
biological differences between birds and mammals and makes
their similarity in contemporary diversity patterns even more
surprising. It is also possible that a model of explosive mammal
radiation following the extinction of dinosaurs (Alroy, 1999)
explains why much of mammal diversity, even in the tropics,
belongs to relatively young clades, although phylogenetic
evidence suggests the diversification of modern mammals was
more closely linked to climatic shifts around the Cenozoic and
the Early Eocene Climatic Optimum (Bininda-Emonds et al.,
2007). Modern birds, in contrast, may have been less con-
strained by the presence of dinosaurs and have begun their
radiation in the Late Cretaceous (Clarke et al., 2005; Zhou,
2007), but, again, this is not universally accepted (Chiappe &
Dyke, 2002). If both of these scenarios are true, it would provide
a partial explanation for why the bird richness gradient largely
reflects the spatial distribution of lineages that diverged in the
Cretaceous to early Eocene, whereas the mammal gradient is
derived more from later radiations within lineages arising in the
Miocene and Pliocene. Unfortunately, the fossil record is
currently too incomplete to provide unambiguous answers.
In sum, although spatial patterns of speciation and extinction
must ultimately dictate the number of species on the planet,
contemporary diversity gradients may not all derive from a
single evolutionary process or from a uniform response of all
major taxonomic groups to the Earth’s history. Contemporary
patterns of bird and mammal species richness reflect different
phylogeographical histories, yet display remarkable geograph-
ical congruence at the global scale. Current climate almost
certainly has a role to play in this congruence, although
underlying mechanisms remain elusive. We conclude that
richness patterns reflect complex integrated influences of past
and present climates over evolutionary and ecological time-
scales. Logically, future climate will also have a major impact,
which virtually all ecologists and biogeographers fully realize.
ACKNOWLEDGEMENTS
This work was conducted as part of the Niche Conservatism
and Diversity Gradients Working Group supported by the
National Center for Ecological Analysis and Synthesis
(NCEAS), a centre funded by NSF (Grant No. DEB-00-
72909), the University of California–Santa Barbara and the
State of California. NCEAS also supported T.J.D. and L.B.B. as
postdoctoral fellows during this working group. We thank
J.A.F. Diniz-Filho for generating the path models, and J.A.F.
Diniz-Filho and two anonymous referees for helpful comments
on the manuscript.
REFERENCES
Algar, A.C., Kerr, J.T. & Currie, D.J. (2009) Evolutionary
constraints on regional faunas: whom, but not how many.
Ecology Letters, 12, 57–65.
B. A. Hawkins et al.
14 Journal of Biogeography
ª 2011 Blackwell Publishing Ltd
1
2
3
4
5
6
7
8
9
10
11
12
13
14
15
16
17
18
19
20
21
22
23
24
25
26
27
28
29
30
31
32
33
34
35
36
37
38
39
40
41
42
43
44
45
46
47
48
49
50
51
52
53
54
55
56
Alroy, J. (1999) The fossil record of North American mam-
mals: evidence for a Paleocene evolutionary radiation. Sys-
tematic Biology, 48, 107–118.
Araujo, M.B., Nogues-Bravo, D., Diniz-Filho, J.A.F., Haywood,
A.M., Valdes, P.J. & Rahbek, C. (2008) Quaternary climate
changes explain diversity among reptiles and amphibians.
Ecography, 31, 8–15.
Avise, J.C. & Johns, G.C. (1999) Proposal for a standardized
temporal scheme of biological classification for extant spe-
cies. Proceedings of the National Academy of Sciences USA,
96, 7358–7363.
Barker, F.K., Cibois, A., Schilker, P., Feinstein, J. & Cracraft, J.
(2004) Phylogeny and diversification of the largest avian
radiation. Proceedings of the National Academy of Sciences
USA, 101, 11040–11045.
Behrensmeyer, A.K., Damuth, J.D., DiMichele, W.D., Potts, R.,
Sues, H.-D. & Wing, S.L. (eds) (1992) Terrestrial ecosystems
through time: evolutionary paleoecology of terrestrial plants
and animals. University of Chicago Press, Chicago, IL.
Bininda-Emonds, O.R.P., Cardillo, M., Jones, K.E., MacPhee,
R.D.E., Beck, R.M.D., Grenyer, R., Price, S.A., Vos, R.A.,
Gittleman, J.L. & Purvis, A. (2007) The delayed rise of
present-day mammals. Nature, 446, 507–512.
Browne, M. & Mels, G. (2000) SYSTAT 10: statistics II. SPSS,
Chicago, IL.
Buckley, L.B., Davies, T.J., Ackerly, D.D., Kraft, N.J.B., Har-
rison, S.P., Anacker, B.L., Cornell, H.V., Damschen, E.I.,
Grytnes, J.-A., Hawkins, B.A., McCain, C.M., Stephens, P.R.
& Wiens, J.J. (2010) Phylogeny, niche conservatism, and the
latitudinal diversity gradient in mammals. Proceedings of the
Royal Society B: Biological Sciences, 277, 2131–2138.
Chiappe, L.M. & Dyke, G.J. (2002) The Mesozoic radiation of
birds. Annual Review of Ecology and Systematics, 33, 91–124.
Clarke, J.A., Tambussi, C.P., Noriega, J.I., Erickson, G.M. &
Ketcham, R.A. (2005) First definitive fossil evidence for the
extant avian radiation in the Cretaceous. Nature, 433, 305–
308.
Currie, D.J. & Francis, A.P. (2004) Regional versus climatic
effect on taxon richness in angiosperms: reply to Qian and
Ricklefs. The American Naturalist, 163, 780–785.
Currie, D.J., Mittelbach, G.G., Cornell, H.V., Field, R., Guegan,
J.-F., Hawkins, B.A., Kaufman, D.M., Kerr, J.T., Oberdorff,
T., O’Brien, E. & Turner, J.R.G. (2004) Predictions and tests
of climate-based hypotheses of broad-scale variation in
taxonomic richness. Ecology Letters, 7, 1121–1134.
Davies, T.J., Fritz, S.A., Grenyer, R., Orme, C.D.L., Bielby, J.,
Bininda-Emonds, O.R.P., Cardillo, M., Jones, K.E., Gittle-
man, J.L., Mace, G.M. & Purvis, A. (2008) Phylogenetic trees
and the future of mammalian biodiversity. Proceedings of the
National Academy of Sciences USA, 105(Suppl. 1), 11556–
11563.
Davis, K.E. (2008) Reweaving the tapestry: a supertree of birds.
PhD Thesis, University of Glasgow, UK.
Evans, K.L., Warren, P.H. & Gaston, K.J. (2005) Species–en-
ergy relationships at the macroecological scale: a review of
the mechanisms. Biological Reviews, 80, 1–25.
Fain, M.G. & Houde, P. (2004) Parallel radiations in the pri-
mary clades of birds. Evolution, 58, 2558–2573.
Fitch, W.M. (1976) Molecular evolutionary clocks. Molecular
evolution (ed. by F.J. Ayala), pp. 160–178. Sinauer, Sun-
derland, MA.
Forster, J.R. (1778) Observations made during a voyage round
the world, on physical geography, natural history, and ethnic
philosophy. G. Robinson, London.
Francis, A.P. & Currie, D.J. (1998) Global patterns of tree
species richness in moist forests: another look. Oikos, 81,
598–602.
Francis, A.P. & Currie, D.J. (2003) A globally consistent
richness-climate relationship for angiosperms. The American
Naturalist, 161, 523–536.
Grenyer, R., Orme, C.D.L., Jackson, S.E., Thomas, G.H.,
Davies, R.G., Davies, T.J., Jones, K.E., Olson, V.A., Ridgely,
R.S., Rasmussen, P.C., Ding, T.-S., Bennett, P.M., Black-
burn, T.M., Gaston, K.J., Gittleman, J.L. & Owens, I.P.F.
(2006) Global distribution and conservation of rare and
threatened vertebrates. Nature, 444, 93–96.
Hackett, S.J., Kimball, R.T., Reddy, S., Bowie, R.C.K., Braun,
E.L., Braun, M.J., Chojnowski, J.L., Cox, W.A., Han, K.-L.,
Harshman, J., Huddleston, C.J., Marks, B.D., Miglia, K.J.,
Moore, W.S., Sheldon, F.H., Steadman, D.W., Witt, C.C. &
Yuri, T. (2008) A phylogenetic study of birds reveals their
evolutionary history. Science, 320, 1763–1768.
Hawkins, B.A., Field, R., Cornell, H.V., Currie, D.J., Guegan,
J.-F., Kaufman, D.M., Kerr, J.T., Mittelbach, G.G., Obe-
rdorff, T., O’Brien, E.M., Porter, E.E. & Turner, J.R.G.
(2003) Energy, water, and broad-scale geographic patterns
of species richness. Ecology, 84, 3105–3117.
Hawkins, B.A., Diniz-Filho, J.A.F. & Soeller, S.A. (2005) Water
links the historical and contemporary components of the
Australian bird diversity gradient. Journal of Biogeography,
32, 1035–1042.
Hawkins, B.A., Diniz-Filho, J.A.F., Jaramillo, C.A. & Soeller,
S.A. (2006) Post-Eocene climate change, niche conservatism,
and the latitudinal diversity gradient of New World birds.
Journal of Biogeography, 33, 770–780.
Hawkins, B.A., Diniz-Filho, J.A.F., Jaramillo, C.A. & Soeller,
S.A. (2007) Climate, niche conservatism, and the global
bird diversity gradient. The American Naturalist, 170, S16–
S27.
Hillebrand, H. (2004) On the generality of the latitudinal
diversity gradient. The American Naturalist, 163, 192–211.
von Humboldt, A. (1808) Ansichten der Natur mit wissens-
chaftlichen Erlauterungen. J.G. Cotta, Tubingen.
Jablonski, D., Roy, K. & Valentine, J.W. (2006) Out of the
tropics: evolutionary dynamics of the latitudinal diversity
gradient. Science, 314, 102–106.
Jansson, R. & Davies, T.J. (2008) Global variation in diversi-
fication rates of flowering plants: energy vs. climate change.
Ecology Letters, 11, 173–183.
Jetz, W., Wilcove, D.S. & Dobson, A.P. (2007) Projected im-
pacts of climate and land-use change on the global diversity
of birds. PLoS Biology, 5, e157.
Bird and mammal richness gradients
Journal of Biogeography 15ª 2011 Blackwell Publishing Ltd
1
2
3
4
5
6
7
8
9
10
11
12
13
14
15
16
17
18
19
20
21
22
23
24
25
26
27
28
29
30
31
32
33
34
35
36
37
38
39
40
41
42
43
44
45
46
47
48
49
50
51
52
53
54
55
56

Kerr, J.T. & Currie, D.J. (1999) The relative importance of
evolutionary and environmental controls on broad-scale
patterns of species richness in North America. Ecoscience, 6,
329–337.
Kielan-Jaworowska, Z., Cifelli, R.L. & Luo, Z.-X. (2004)
Mammals from the age of dinosaurs: origins, evolution, and
structure. Columbia University Press, New York.
Krug, A.Z., Jablonski, D., Valentine, J.W. & Roy, K. (2009)
Generation of Earth’s first-order biodiversity pattern.
Astrobiology, 9, 113–124.
Latham, R.E. & Ricklefs, R.E. (1993) Global patterns of tree
species richness in moist forests: energy-diversity theory
does not account for variation in species richness. Oikos, 67,
325–333.
McGill, B. (2003) Strong and weak tests of macroecological
theory. Oikos, 102, 679–685.
McGlone, M.S. (1996) When history matters: scale, time, cli-
mate and tree diversity. Global Ecology and Biogeography
Letters, 5, 309–319.
McKenna, M.C. & Bell, S.K. (1997) Classification of mammals
above the species level. Columbia University Press, New York.
Mittelbach, G.G., Schemske, D.W., Cornell, H.V. et al. (2007)
Evolution and the latitudinal diversity gradient: speciation,
extinction and biogeography. Ecology Letters, 10, 315–331.
Monroe, B.L., Jr & Sibley, C.G. (1993) A world checklist of birds.
Yale University Press, New Haven, CT.
Musser, G.G. & Carleton, M.D. (2005) Superfamily Muroidea.
Mammal species of the world: a taxonomic and geographic
reference, 3rd edn (ed. by D.E. Wilson and D.M. Reeder), pp.
894–1531. Johns Hopkins University Press, Baltimore, MD.
Orme, C.D.L., Davies, R.G., Burgess, M., Eogembrod, F.,
Pickup, N., Olson, V.A., Webster, A.J., Ding, T.-S., Ras-
mussen, P.C., Ridgely, R.S., Stattersfield, A.J., Bennett, P.M.,
Blackburn, T.M., Gaston, K.J. & Owens, P.F. (2005) Global
hotspots of species richness are not congruent with ende-
mism or threat. Nature, 436, 1016–1019.
Prinzing, A., Ozinga, W.A. & Durka, W. (2004) The rela-
tionship between global and regional distribution dimin-
ishes among phylogenetically basal species. Evolution, 58,
2622–2633.
Qian, H. & Ricklefs, R.E. (2004) Taxon richness and climate in
angiosperms: is there a globally consistent relationship that
precludes region effects? The American Naturalist, 163, 773–
779.
Ricklefs, R.E. (2004) A comprehensive framework for global
patterns in biodiversity. Ecology Letters, 7, 1–15.
Scotland, R.W. & Sanderson, M.J. (2004) The significance of
few versus many in the tree of life. Science, 303, 643.12
Sechrest, W., Brooks, T.M., de Fonseca, G.A.B., Konstant,
W.R., Mittermeier, R.A., Purvis, A., Rylands, A.B. & Git-
tleman, J.L. (2002) Hotspots and the conservation of evo-
lutionary history. Proceedings of the National Academy of
Sciences USA, 99, 2067–2071.
Shipley, B. (2002) Cause and correlation in biology: a user’s
guide to path analysis, structural equations and causal infer-
ence. Cambridge University Press, Cambridge.
Sibley, C.G. & Ahlquist, J.E. (1990) Phylogeny and classification
of birds: a study in molecular evolution. Yale University Press,
New Haven, CT.
Sibley, C.G.&Monroe, B.L., Jr (1990)Distribution and taxonomy
of birds of the world. Yale University Press, New Haven, CT.
Vaughan, T.A. (1986) Mammalogy, 3rd edn. Saunders College
Publishing, Philadelphia, PA.
Wallace, A.R. (1876) The geographical distribution of animals:
with a study of the relations of living and extinct faunas as
elucidating the past changes of the Earth’s surface. Harper,
New York.
Webb, S.D. (2006) The Great American Interchange: patterns
and processes. Annals of the Missouri Botanical Garden, 93,
245–257.
Weir, J.T. & Schluter, D. (2007) The latitudinal gradient in
recent speciation and extinction rates in birds and mam-
mals. Science, 315, 1574–1576.
Whittaker, R.J., Willis, K.J. & Field, R. (2001) Scale and species
richness: towards a general, hierarchical theory of species
diversity. Journal of Biogeography, 28, 453–470.
Wiens, J.J. (2007) Global patterns of species richness and
diversification in amphibians. The American Naturalist, 170,
S86–S106.
Wiens, J.J. & Donoghue, M.J. (2004) Historical biogeography,
ecology and species richness. Trends in Ecology and Evolu-
tion, 19, 639–644.
Wiens, J.J., Graham, C.H., Moen, D.S., Smith, S.A. & Reeder,
T.W. (2006) Evolutionary and ecological causes of the lati-
tudinal diversity gradient in hylid frogs: treefrog trees
unearth the roots of high tropical diversity. The American
Naturalist, 168, 579–596.
Wiens, J.J., Sukumaran, J., Pyron, R.A. & Brown, R.M. (2009)
Evolutionary and biogeographic origins of high tropical
diversity in Old World frogs (Ranidae). Evolution, 63, 1217–
1231.
Wiens, J.J., Ackerly, D.D., Allen, A.P., Anacker, B.L., Buckley,
L.B., Cornell, H.V., Damschen, E.I., Davies, T.J., Grytnes, J.-
A., Harrison, S.P., Hawkins, B.A., Holt, R.D., McCain, C.M.
& Stephens, P.R. (2010) Niche conservatism as an emerging
principle in ecology and conservation biology. Ecology Let-
ters, 13, 1310–1324.
Wiens, J.J., Pyron, R.A. & Moen, D.S. (2011) Phylogenetic
origins of local-scale diversity patterns and the causes of
Amazonian megadiversity. Ecology Letters, 14, 643–652.
Willig, M.R., Kaufman, D.M. & Stevens, R.D. (2003) Latitu-
dinal gradients of biodiversity: pattern, process, scale, and
synthesis. Annual Review of Ecology, Evolution, and System-
atics, 34, 273–309.
Wilson, D.E. & Reeder, D.M. (eds) (2005) Mammal species of
the world: a taxonomic and geographic reference, 3rd edn.
Johns Hopkins University Press, Baltimore, MD.
Wright, D.H., Currie, D.J. &Maurer, B.A. (1993) Energy supply
and patterns of species richness on local and regional scales.
Species diversity in ecological communities: historical and geo-
graphical perspectives (ed. by R.E. Ricklefs and D. Schluter),
pp. 66–74. University of Chicago Press, Chicago, IL.
B. A. Hawkins et al.
16 Journal of Biogeography
ª 2011 Blackwell Publishing Ltd
1
2
3
4
5
6
7
8
9
10
11
12
13
14
15
16
17
18
19
20
21
22
23
24
25
26
27
28
29
30
31
32
33
34
35
36
37
38
39
40
41
42
43
44
45
46
47
48
49
50
51
52
53
54
55
56

Zhou, Z. (2007) Cretaceous bird radiation. AccessScience,
McGraw-Hill Co. Available at: http://www.accessscience.
com.
SUPPORTING INFORMATION
Additional Supporting Information may be found in the
online version of this article13 :
Appendix S1 Basal and derived families of birds and mam-
mals used to examine diversity gradients of groups originating
before and after the Eocene–Oligocene climate shift.
Appendix S2 Geographical patterns of mean root distance
(MRDF) for mammal species using seven classification
systems generated by assigning family rank to all currently
extant clades at seven, 10-Myr time periods, ranging from 20
to 80 Ma.
As a service to our authors and readers, this journal provides
supporting information supplied by the authors. Such mate-
rials are peer-reviewed and may be re-organized for online
delivery, but are not copy-edited or typeset. Technical support
issues arising from supporting information (other than
missing files) should be addressed to the authors.
BIOSKETCHES
Our Niche Conservatism and Diversity Gradients Working
Group is composed of a set of ecologists, biogeographers and
phylogeneticists who share an interest in understanding how
evolutionary mechanisms interact with ecological processes to
generate species richness gradients across spatial and temporal
scales.
Author contributions: B.A.H. conceived the idea during the
working group discussions; analyses were conducted by B.A.H.
and J.D.; B.A.H. C.M.M. and J.D. led the writing; and all
participants contributed throughout the process during
working group and draft discussions.
Editor: Michael A. Patten
Bird and mammal richness gradients
Journal of Biogeography 17ª 2011 Blackwell Publishing Ltd
1
2
3
4
5
6
7
8
9
10
11
12
13
14
15
16
17
18
19
20
21
22
23
24
25
26
27
28
29
30
31
32
33
34
35
36
37
38
39
40
41
42
43
44
45
46
47
48
49
50
51
52
53
54
55
56

Author Query Form
Journal: JBI
Article: 2655
Dear Author,
During the copy-editing of your paper, the following queries arose. Please could you respond to these queries
by making the necessary corrections and/or additions directly on the page proof. Please only use the
’Remarks’ column on this form for clarification or comments. When adding your corrections to the proof,
please use e-annotation if possible and, if not, then write clearly, in a strong blue or black ink, and not in
capitals unless these are intended.
Please help us to publish your article quickly and accurately by following these instructions. Illegible mark
ups may delay the publication of your paper.
Many thanks for your assistance.
Journal Production, Blackwell Publishing
Query no. Query Remarks
1 AUTHOR: (a) Do the figure legends match the figures?
(b) Are the figures fully correct with all the labelling in position and
the legends fully annotated?
(c) The content of the tables has to be adjusted, during typesetting,
for layout and style – errors may be introduced. Have you checked
that the table(s) are correct?
(d) Please check the text carefully – the paper has been sent out to
copy editors. It is important not just to check the changes they have
made but to check the whole text to ensure there are no errors.
(e) Please note that it is the responsibility of the author(s) to ensure
that all URLs given in this article are correct and useable.
(f) Please verify that all authors have checked the proofs.
(g) Please initial this box to confirm you have done all these things.
This ms was copy edited by Helen Holt.
2 AUTHOR: Please check that authors and their affiliations are
correct.
3 AUTHOR: Is the change from ‘differences among groups’ OK (to
avoid possible confusion with ‘groups of explanations’?
4 AUTHOR: Is the sense of ‘charismatic’ clear?
5 AUTHOR: TNC isn’t used as an abbreviation in the rest of the
paper. Do you want to delete it or keep it as a search term?
6 AUTHOR: Is the intended sense ‘If these conclusions are true’?
7 AUTHOR: Is the intended sense ‘represent a stronger test of
competing theories’

8 AUTHOR: Please check all website addresses and confirm that they
are correct. (Please note that it is the responsibility of the author(s)
to ensure that all URLs given in this article are correct and
useable.)
9 AUTHOR: By ‘This cannot be directly compared with birds’ do
you mean e.g. ‘This procedure does not have a direct analogue for
birds’
10 AUTHOR: Is the change from ‘analogous to what has happened in
Canada’ OK?
11 AUTHOR: By ‘comprises’ do you mean ‘incorporates/involves’?
12 AUTHOR: Is there a page range for Scotland, R.W. & Sanderson,
M.J. (2004)?
13 AUTHOR: Your paper contains Supporting Information. You
should already have downloaded this from the e-proofing website
when you collected your article proof. Please check that all legends
and content are correct, including updating references where
applicable. (Note that legends as provided with the Supporting
Information itself should be full and complete, while those provided
in the main article are shortened versions, where necessary.) Please
ensure that line numbers are removed and that track-change edits
are accepted so that they do not appear in the published version. If
any changes are necessary, please ensure that you edit the files sent
with the proof, as minor editorial changes may have been made to
the files in the Editorial Office prior to manuscript export.
Corrected Supporting Information files should be emailed to the
Production Editor at the same time that you return your main
article proof corrections, with a brief description of the changes
made. If you have no corrections to your Supporting Information
please inform the Production Editor, otherwise publication of your
paper will be delayed.

USING e-ANNOTATION TOOLS FOR ELECTRONIC PROOF CORRECTION
Required software to e-Annotate PDFs: Adobe Acrobat Professional or Adobe Reader (version 8.0 or
above). (Note that this document uses screenshots from Adobe Reader X)
The latest version of Acrobat Reader can be downloaded for free at: http://get.adobe.com/reader/
Once you have Acrobat Reader open on your computer, click on the Comment tab at the right of the toolbar:
1. Replace (Ins) Tool Î for replacing text.
Strikes a line through text and opens up a text
box where replacement text can be entered.
How to use it
‚ Highlight a word or sentence.
‚ Click on the Replace (Ins) icon in the Annotations
section.
‚ Type the replacement text into the blue box that
appears.
This will open up a panel down the right side of the document. The majority of
tools you will use for annotating your proof will be in the Annotations section,
rkevwtgf"qrrqukvg0"YgÓxg"rkemgf"qwv"uqog"qh"vjgug"vqqnu"dgnqy<
2. Strikethrough (Del) Tool Î for deleting text.
Strikes a red line through text that is to be
deleted.
How to use it
‚ Highlight a word or sentence.
‚ Click on the Strikethrough (Del) icon in the
Annotations section.
3. Add note to text Tool Î for highlighting a section
to be changed to bold or italic.
Highlights text in yellow and opens up a text
box where comments can be entered.
How to use it
‚ Highlight the relevant section of text.
‚ Click on the Add note to text icon in the
Annotations section.
‚ Type instruction on what should be changed
regarding the text into the yellow box that
appears.
4. Add sticky note Tool Î for making notes at
specific points in the text.
Marks a point in the proof where a comment
needs to be highlighted.
How to use it
‚ Click on the Add sticky note icon in the
Annotations section.
‚ Click at the point in the proof where the comment
should be inserted.
‚ Type the comment into the yellow box that
appears.

USING e-ANNOTATION TOOLS FOR ELECTRONIC PROOF CORRECTION
For further information on how to annotate proofs, click on the Help menu to reveal a list of further options:
5. Attach File Tool Î for inserting large amounts of
text or replacement figures.
Inserts an icon linking to the attached file in the
appropriate pace in the text.
How to use it
‚ Click on the Attach File icon in the Annotations
section.
‚ Enkem"qp"vjg"rtqqh"vq"yjgtg"{qwÓf"nkmg"vjg"cvvcejgf"file to be linked.
‚ Select the file to be attached from your computer
or network.
‚ Select the colour and type of icon that will appear
in the proof. Click OK.
6. Add stamp Tool Î for approving a proof if no
corrections are required.
Inserts a selected stamp onto an appropriate
place in the proof.
How to use it
‚ Click on the Add stamp icon in the Annotations
section.
‚ Select the stamp you want to use. (The Approved
stamp is usually available directly in the menu that
appears).
‚ Enkem"qp"vjg"rtqqh"yjgtg"{qwÓf"nkmg"vjg"uvcor"vq"appear. (Where a proof is to be approved as it is,
this would normally be on the first page).
7. Drawing Markups Tools Î for drawing shapes, lines and freeform
annotations on proofs and commenting on these marks.
Allows shapes, lines and freeform annotations to be drawn on proofs and for
comment to be made on these marks..
How to use it
‚ Click on one of the shapes in the Drawing
Markups section.
‚ Click on the proof at the relevant point and
draw the selected shape with the cursor.
‚ To add a comment to the drawn shape,
move the cursor over the shape until an
arrowhead appears.
‚ Double click on the shape and type any
text in the red box that appears.
Copyright © 2022 FDOKUMEN