Environmental determinants of geographic butterfly richness pattern in eastern China
15
ORIGINAL PAPER Environmental determinants of geographic butterfly richness pattern in eastern China Shengbin Chen • Lingfeng Mao • Jinlong Zhang • Kexin Zhou • Jixi Gao Received: 13 June 2013 / Revised: 27 February 2014 / Accepted: 7 March 2014 Ó Springer Science+Business Media Dordrecht 2014 Abstract A long-standing task for ecologists and biogeographers is to reveal the underlying mechanisms accounting for the geographic pattern of species diversity. The number of hypotheses to explain geographic variation in species diversity has increased dramatically during the past half century. The oldest and the most popular one is envi- ronmental determination. However, seasonality, the intra-annual variability in climate variables has been rarely related to species richness. In this study, we assessed the relative importance of three environmental hypotheses: energy, seasonality and heterogeneity in explaining species richness pattern of butterflies in Eastern China. In addition, we also examined how environmental variables affect the relationship between species richness of butterflies and seed plants at geographic scale. All the environmental factors significantly affected butterfly richness, except sampling area and coefficient of variation of mean monthly precipitation. Energy and seasonality hypotheses explained comparable variation in butterfly richness (42.3 vs. 39.3 %), higher than that of heterogeneity hypothesis (25.9 %). Variation partitioning indicated that the independent effect of seasonality was Communicated by Peter J. T. White. Electronic supplementary material The online version of this article (doi:10.1007/s10531-014-0676-8) contains supplementary material, which is available to authorized users. S. Chen K. Zhou J. Gao (&) Nanjing Institute of Environmental Sciences, Ministry of Environmental Protection, No. 8 Jiangwangmiao Street, Xuanwu District, Nanjing 210042, China e-mail: [email protected] S. Chen e-mail: [email protected] L. Mao Department of Plant Biology, Michigan State University, East Lansing, MI 48824, USA J. Zhang Flora Conservation Department, Kadoorie Farm and Botanic Garden, Lam Kam Road, Tai Po, NT, Hong Kong SAR 123 Biodivers Conserv DOI 10.1007/s10531-014-0676-8
Transcript of Environmental determinants of geographic butterfly richness pattern in eastern China

ORI GIN AL PA PER
Environmental determinants of geographic butterflyrichness pattern in eastern China
Shengbin Chen • Lingfeng Mao • Jinlong Zhang • Kexin Zhou •
Jixi Gao
Received: 13 June 2013 / Revised: 27 February 2014 / Accepted: 7 March 2014� Springer Science+Business Media Dordrecht 2014
Abstract A long-standing task for ecologists and biogeographers is to reveal the
underlying mechanisms accounting for the geographic pattern of species diversity. The
number of hypotheses to explain geographic variation in species diversity has increased
dramatically during the past half century. The oldest and the most popular one is envi-
ronmental determination. However, seasonality, the intra-annual variability in climate
variables has been rarely related to species richness. In this study, we assessed the relative
importance of three environmental hypotheses: energy, seasonality and heterogeneity in
explaining species richness pattern of butterflies in Eastern China. In addition, we also
examined how environmental variables affect the relationship between species richness of
butterflies and seed plants at geographic scale. All the environmental factors significantly
affected butterfly richness, except sampling area and coefficient of variation of mean
monthly precipitation. Energy and seasonality hypotheses explained comparable variation
in butterfly richness (42.3 vs. 39.3 %), higher than that of heterogeneity hypothesis
(25.9 %). Variation partitioning indicated that the independent effect of seasonality was
Communicated by Peter J. T. White.
Electronic supplementary material The online version of this article (doi:10.1007/s10531-014-0676-8)contains supplementary material, which is available to authorized users.
S. Chen � K. Zhou � J. Gao (&)Nanjing Institute of Environmental Sciences, Ministry of Environmental Protection,No. 8 Jiangwangmiao Street, Xuanwu District, Nanjing 210042, Chinae-mail: [email protected]
S. Chene-mail: [email protected]
L. MaoDepartment of Plant Biology, Michigan State University, East Lansing, MI 48824, USA
J. ZhangFlora Conservation Department, Kadoorie Farm and Botanic Garden, Lam Kam Road, Tai Po,NT, Hong Kong SAR
123
Biodivers ConservDOI 10.1007/s10531-014-0676-8

much lower (0.0 %) than that of energy (5.5 %) and heterogeneity (6.3 %). However,
seasonality performed better in explaining butterfly richness in topographically complex
areas, reducing spatial autocorrelation in butterfly richness, and more strongly affect the
association between butterflies and seed plants. The positive relationship between seed
plant richness and butterfly richness was most likely the result of environmental variables
(especially seasonality) influencing them in parallel. Insufficient sampling may partly
explain the low explanatory power of environmental model (52.1 %) for geographic
butterfly richness pattern. Our results have important implications for predicting the
response of butterfly diversity to climate change.
Keywords Biogeography � Butterfly fauna � Energy � Heterogeneity � Seasonality �Species richness
Introduction
Understanding the underlying mechanisms shaping the geographic pattern of species
diversity has been a long-standing task for ecologists and biogeographers. This is
increasingly critical not only for biodiversity conservation but also for predicting the
response of species diversity to global change (Kerr et al. 2007). The number of
hypotheses to explain geographic variation in species diversity has increased dramatically
during the past half century (Willig et al. 2003; Field et al. 2009). While different
hypotheses refer to ecological, biogeographic, or evolutionary processes, they all predict
a prominent role of environmental variables (energy, seasonality and heterogeneity) in
explaining geographic species richness patterns (Willig et al. 2003; Field et al. 2009;
Tello and Stevens 2010). In addition, plant diversity is often regarded as the direct driver
of animal richness, especially for herbivores and frugivores (Kissling et al. 2007; Kissling
et al. 2010; Zhang et al. 2013).
The roles of energy and heterogeneity in determining geographic species richness
patterns have been extensively examined (Evans et al. 2005; Field et al. 2009). Energy can
be grouped into two categories, kinetic and potential energy, which potentially control
species number in different ways (Clarke and Gaston 2006; Allen et al. 2007). Kinetic
energy, which directly reflects fluxes of solar radiation, is often represented by measures of
temperature and potential evapotranspiration (Evans et al. 2005; Clarke and Gaston 2006;
Allen et al. 2007), while potential energy directly or indirectly relates to the rate of
conversion of solar radiation to reduced carbon compounds through photosynthesis, and
can be reflected by actual evapotranspiration (Allen et al. 2007). Many studies have found
strong positive relationships between species richness of various taxa and energy-related
variables (Hawkins et al. 2003; Field et al. 2009). The heterogeneity hypothesis assumes
that habitats with complex spatial structure may provide more niches and more diverse
ways of exploiting resources, or that they increase speciation rates and thus species
richness (Ruggiero and Hawkins 2008). Heterogeneity often represents spatial variation of
energy availability at local scales (Tello and Stevens 2010).
Seasonality, the intra-annual variability in climate variables (Williams and Middleton
2008; Ackerly et al. 2010; Carrara and Vazquez 2010), has been rarely related to species
richness and the results were controversial (Kerr 1999; Badgley and Fox 2000; Ruggiero
and Kitzberger 2004; Qian 2008; Carrara and Vazquez 2010; Tello et al. 2010).
Biodivers Conserv
123

Seasonality may have two effects on biodiversity, depending on the characteristics of
specific organisms and on the scale at which ecological and evolutionary processes happen.
On the one hand, seasonality could increase species diversity if species specialize and
occupy different temporal niches (Chesson and Huntly 1997). On the other hand, sea-
sonality could lead to low species diversity because species must evolve broad niches to
survive in highly seasonal habitats, which may make the community more readily saturated
(Tello and Stevens 2010). Our poor understanding on how seasonality controls biodiversity
present a major challenge for predicting the future of biodiversity in a changing climate.
Therefore, more researches are required to elucidate the effect of seasonality on species
diversity of various taxa.
Butterflies, one of the best-known invertebrate taxa worldwide, are an important
component of biodiversity and ecosystem structure. Climatic conditions strongly con-
strain the metabolism and behavior of butterflies; therefore, they are particularly suitable
for examining species richness-environment relationships (White and Kerr 2007) and
predicting potential effect of future climatic change on species distributions (Fleishman
2010). Several studies have found weak direct relationship between butterfly richness and
plant richness at different geographical scales (Hawkins and Porter 2003a, b; Menendez
et al. 2007; Kitahara et al. 2008). However, these analyses were generally conducted at
medium geographic extent and the results were conflicting. So far, almost all geographic
scale studies on butterfly diversity have been carried out in Europe or North America. A
geographic broadening of investigated regions may benefit the aim of finding general
patterns.
The butterfly fauna of China, with 12 families, 375 genera and[1300 species, is more
diverse than that of Europe or North America (Chou 2000). Most species occur in Eastern
China, a topographically complex region that is affected by monsoon climate (Chou 2000).
The local butterfly fauna in many areas (such as nature reserves, national parks and
counties) of east China has been intensively inventoried during the past decades. In the
present study, we used a large dataset on butterfly species richness to test the following two
hypotheses: (1) seasonality plays an important role in explaining geographic variation in
butterfly richness, together with energy and heterogeneity, and (2) seed plant richness
contributes substantially to the geographic pattern of butterfly richness, besides environ-
mental variables.
Materials and methods
Species richness data
We compiled 58 local butterfly surveys from journal papers and books that contained all of
the following information: survey area, topography, location, seed plant richness and
butterfly sampling effort (Online Appendix 1). Twenty-seven localities had data on number
of specimens, 53 localities had data on number of survey years, and 22 localities had both
of them. There was a significant correlation between these two measures of sampling
efforts (r = 0.696, p \ 0.001 for ln-transformed variables). Although all localities have
been extensively surveyed with the aim of providing complete species lists for butterflies,
there was great variation in sampling effort (i.e., 300–5600 specimens, 1–12 years for
survey).
Biodivers Conserv
123
Environmental data
We used mean annual temperature (TEM), annual precipitation (PRE), annual actual
evapotranpiration (AET), and annual potential evapotranspiration (PET) as energy vari-
ables. Standard deviation of mean monthly temperature (TEMsd), coefficient of variation
of mean monthly precipitation (PREcv), coefficient of variation of mean monthly actual
evapotranpiration (AETcv), and coefficient of variation of mean monthly potential
evapotranspiration (PETcv) were regarded as variables reflecting seasonality. Coefficient
of variation can be misleading for variables including both positive and negative values
and meaningful for variables containing only positive values. Since some localities have
monthly temperature\0 �C, we used standard deviation for temperature and coefficient of
variation for the rest variables. Elevational range (ELER, maximum elevation—minimum
elevation) represents heterogeneity because climate usually changes systematically along
altitudinal gradients. We also regarded sampling area (AREA) to reflect heterogeneity
because larger area may cover more diverse climatic conditions and habitats. The average
area of each locality was 426 km2 (±713 SE). Elevational range and sampling area were
significantly correlated (r = 0.422, p = 0.003 for ln-transformed variables).
Data for temperature and precipitation were obtained from WorldClim (Hijmans et al.
2005). Data for the evapotranspiration variables stemmed from the Global Evapotranspi-
ration and Water Balance Data Sets developed by Ahn and Tateishi (1994) and Tateishi
and Ahn (1996). Climatic data were assembled for the 58 localities according to their
geographical midpoints.
Statistical analysis
First, we tested the normality of all variables, and ln-transformed butterfly richness (BR),
seed plant richness (SPR), elevational range, sampling area, number of specimens, and
number of survey years to obtain normal distributions. We used multiple ordinary least
squares regression with linear and quadratic terms to examine the effects of each putative
predictor and each set of variables (energy, seasonality, and heterogeneity) on butterfly
richness. We used adjusted R2 to estimate explained variance. We examined the statistical
significance of the correlations and regressions based on corrected degrees of freedom,
calculated using Dutilleul’s (1993) modified t test.
There were strong correlations between putative predictors (Table S1). To resolve this
problem before modeling analysis, we eliminated the putative predictor with the largest
variance inflation factor each time until all the selected predictors’ variance inflation factor
\5 (Quinn and Keough 2002). We repeated this procedure separately for the three sets of
variables, i.e. energy variables (TEM, PRE, AET and PET), seasonality variables (TEMsd,
PREcv, AETcv and PETcv), and heterogeneity variables (ELER and AREA). For each set
of variables, we used Akaike’s information criterion (AIC) to rank all possible models and
selected the model with the minimum AIC as the best one.
We used variation partitioning approach (Heikkinen et al. 2005) to decompose the
variation in butterfly richness among the three sets of predictors (energy, seasonality and
heterogeneity). Here, variation partitioning lead to eight fractions: pure effect of energy,
seasonality, and heterogeneity; combined variation due to joint effects of energy and
seasonality, energy and heterogeneity, seasonality and heterogeneity, combined effects of
the three groups of explanatory variables, and finally unexplained variation. We used
‘‘permutation of the residuals’’ approach to test the significance of the independent effect
of energy, seasonality and heterogeneity (Legendre and Legendre 1998).
Biodivers Conserv
123
To examine whether seed plant richness provide additional explanation for butterfly
richness, besides environmental variables, we repeated the above regression analyses for
seed plant richness, using energy, seasonality and heterogeneity variables as putative
predictors. Then, we performed residual regression to examine the relationship between
butterfly richness and seed plant richness when the effects of environmental factors were
gradually removed.
Spatial autocorrelation in macroecological species richness data may result in inflation
of type I error and bias the estimation of coefficients in statistical modeling (Diniz-Filho
et al. 2003; Bini et al. 2009). We used Moran’s I of butterfly richness and residuals of
ordinary least squares regression models at different distances to test whether spatial
autocorrelation was present. The significance of Moran’s I was determined by permutation
approach. Moran’s I coefficient indicated that residuals of energy and heterogeneity
models had significant spatial autocorrelation at least at the shortest distance (Table S2).
Therefore, we used simultaneous autoregressive models to repeat multiple regression
analyses, and compared the results from both non-spatial ordinary least squares regression
and simultaneous autoregressive models (Table S3). To determine whether sampling effort
affect local butterfly richness, we regressed the residual butterfly richness of environmental
model against ln-transformed number of specimens and survey years. The data analyses
were performed in R (R Development Core Team 2009) and ‘Spatial Analysis in Mac-
roecology’ (SAM) (Rangel et al. 2010).
Results
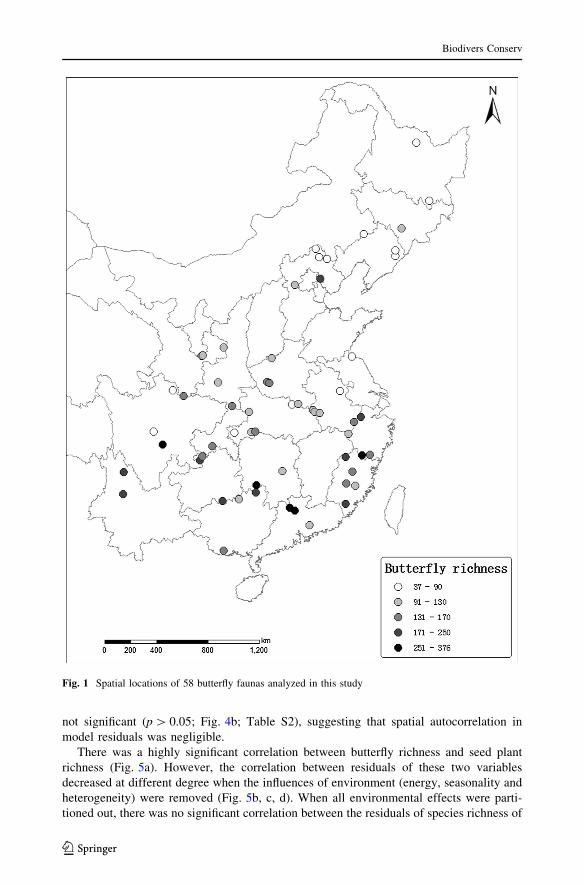
Butterfly richness in eastern China showed evident latitudinal gradient (Fig. S1), averaged
141 and varied from 37 to 376 (Fig. 1). All environmental factors, except sampling area
and coefficient of variation of mean monthly precipitation, significantly affected butterfly
richness in single-predictor models, but their effects differed in some degree. Butterfly
richness generally increased with energy and heterogeneity variables, while decreased with
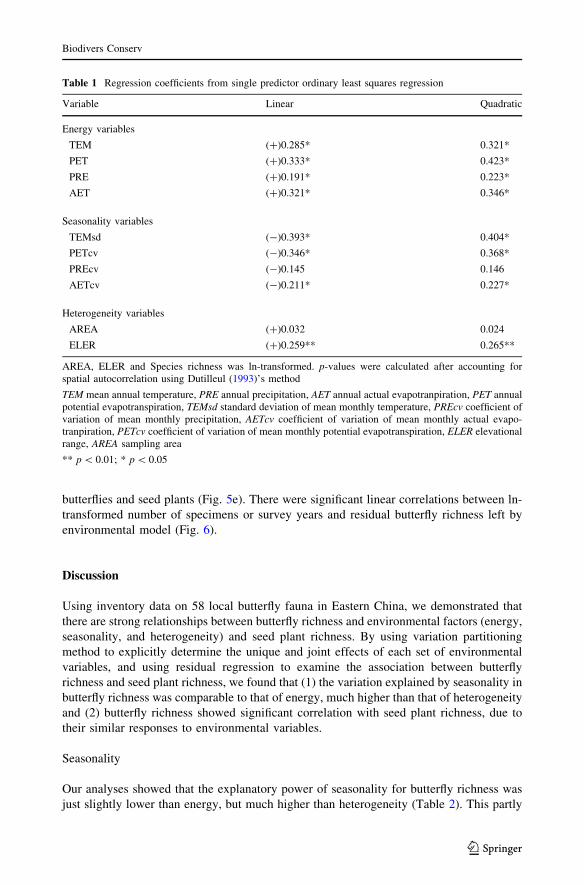
seasonality variables (Table 1).
Multiple ordinary least squares regression analyses showed that, energy model
(PET ? PET2) explained 42.3 % of the variation in butterfly richness, slightly higher than
that of seasonality model (TEMsd) (39.3 %), and much higher than that of heterogeneity
model (ELER) (25.9 %). The environmental model combining all the selected variables
explained 52.1 % of the variation in butterfly richness (Table 2). Simultaneous autore-
gressive models yielded similar results to multiple ordinary least squares regression
models; therefore, the effects of spatial autocorrelation on the results of our analyses are
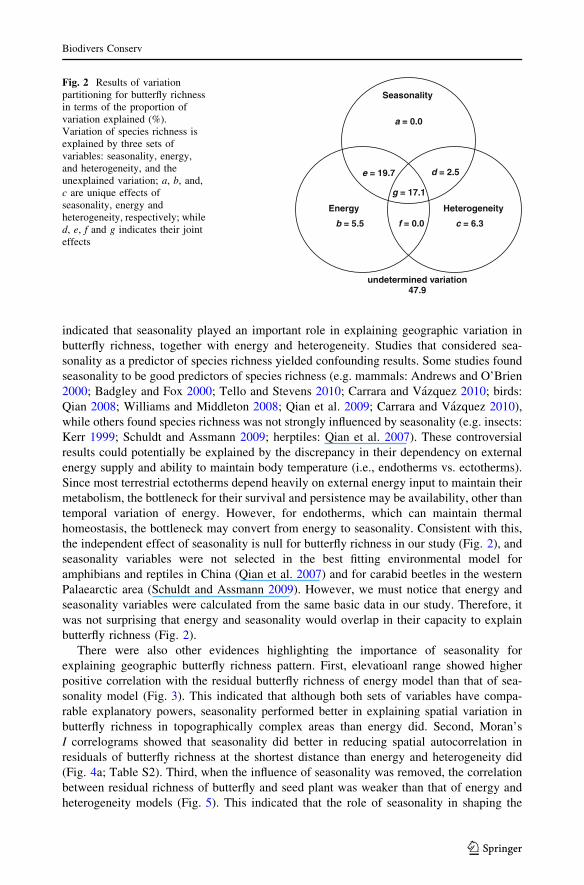
negligible (Table 2, Table S3). Variance partitioning analysis showed that energy
hypothesis had significant independent effect (5.5 %), much higher than that of seasonality
(0.0 %). Heterogeneity had the highest independent effect (6.3 %) among these three sets
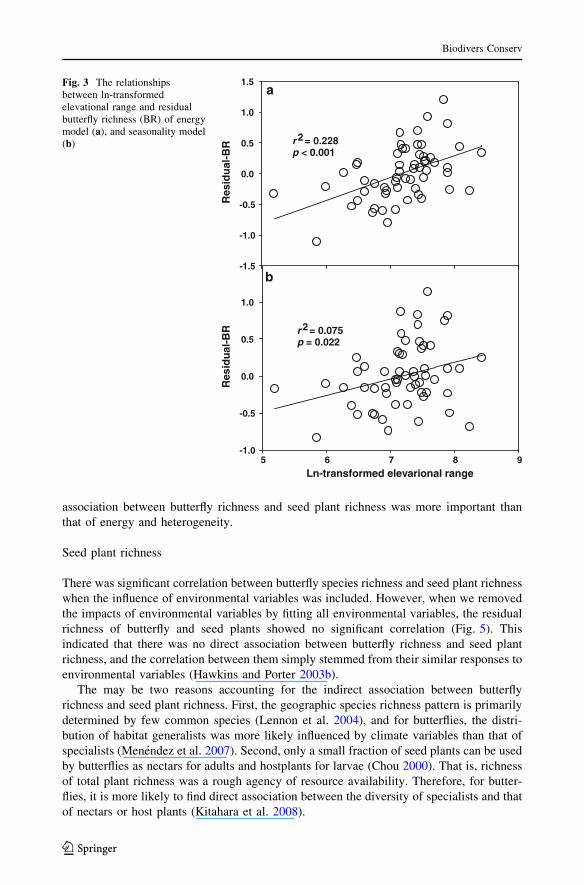
of variables. There were significant positive relationships between elevational range and
residual butterfly richness of energy and seasonality models (Fig. 3).
Correlograms of Moran’s I of butterfly richness, and residuals from energy, seasonality
and heterogeneity models indicated that energy and seasonality removed most positive
spatial autocorrelation at short distances and negative spatial autocorrelation at long dis-
tances, while heterogeneity reduced positive spatial autocorrelation at intermediate dis-
tances but left considerable spatial autocorrelation at short and long distances (Fig. 4a;
Table S2). Spatial autocorrelation in residuals of environmental model at each distance was
Biodivers Conserv
123
not significant (p [ 0.05; Fig. 4b; Table S2), suggesting that spatial autocorrelation in
model residuals was negligible.
There was a highly significant correlation between butterfly richness and seed plant
richness (Fig. 5a). However, the correlation between residuals of these two variables
decreased at different degree when the influences of environment (energy, seasonality and
heterogeneity) were removed (Fig. 5b, c, d). When all environmental effects were parti-
tioned out, there was no significant correlation between the residuals of species richness of
Fig. 1 Spatial locations of 58 butterfly faunas analyzed in this study
Biodivers Conserv
123
butterflies and seed plants (Fig. 5e). There were significant linear correlations between ln-
transformed number of specimens or survey years and residual butterfly richness left by
environmental model (Fig. 6).
Discussion
Using inventory data on 58 local butterfly fauna in Eastern China, we demonstrated that
there are strong relationships between butterfly richness and environmental factors (energy,
seasonality, and heterogeneity) and seed plant richness. By using variation partitioning
method to explicitly determine the unique and joint effects of each set of environmental
variables, and using residual regression to examine the association between butterfly
richness and seed plant richness, we found that (1) the variation explained by seasonality in
butterfly richness was comparable to that of energy, much higher than that of heterogeneity
and (2) butterfly richness showed significant correlation with seed plant richness, due to
their similar responses to environmental variables.
Seasonality
Our analyses showed that the explanatory power of seasonality for butterfly richness was
just slightly lower than energy, but much higher than heterogeneity (Table 2). This partly
Table 1 Regression coefficients from single predictor ordinary least squares regression
Variable Linear Quadratic
Energy variables
TEM (?)0.285* 0.321*
PET (?)0.333* 0.423*
PRE (?)0.191* 0.223*
AET (?)0.321* 0.346*
Seasonality variables
TEMsd (-)0.393* 0.404*
PETcv (-)0.346* 0.368*
PREcv (-)0.145 0.146
AETcv (-)0.211* 0.227*
Heterogeneity variables
AREA (?)0.032 0.024
ELER (?)0.259** 0.265**
AREA, ELER and Species richness was ln-transformed. p-values were calculated after accounting forspatial autocorrelation using Dutilleul (1993)’s method
TEM mean annual temperature, PRE annual precipitation, AET annual actual evapotranpiration, PET annualpotential evapotranspiration, TEMsd standard deviation of mean monthly temperature, PREcv coefficient ofvariation of mean monthly precipitation, AETcv coefficient of variation of mean monthly actual evapo-tranpiration, PETcv coefficient of variation of mean monthly potential evapotranspiration, ELER elevationalrange, AREA sampling area
** p \ 0.01; * p \ 0.05
Biodivers Conserv
123

Ta
ble
2S
um
mar
yo
fth
em
ult
iple
ord
inar
yle
ast
squ
ares
regre
ssio
nm
od
els
eval
uat
ing
the
effe
cto
fen
erg
y,
seas
on
alit
yan
dh
eter
ogen
eity
on
bu
tter
fly
rich
nes
s
Pre
dic
tor
set
Var
iable
sin
model
R2 a
dj
FD
f.P
AIC
En
erg
yP
ET
(2.9
46),
PE
T2
(-2
.36
0)
0.4
23
20
.31
4.5
\0
.00
16
8.9
Sea
sonal
ity
TE
Msd
(-0
.63
6)
0.3
93
37
.91
0.1
\0
.00
16
8.4
Het
erogen
eity
EL
ER
(0.4
99)
0.2
59
18.6
23.5
\0
.00
18
1.7
En
vir
on
men
tP
ET
(1.7
25),
PE
T2
(-1
.27
8),
TE
Msd
(-0
.079
),E
LE
R(0
.44
1)
0.5
21
15
.91
2.4
\0
.00
15
9.9
The
stan
dar
diz
edre
gre
ssio
nco
effi
cien
tsar
ew
ritt
enin
bra
cket
s
Ab
bre
via
tio
ns
of
env
iro
nm
enta
lv
aria
ble
sar
eth
esa
me
asin
Tab
le1
Df.
deg
ree
of
free
do
mco
rrec
ted
by
Du
till
eul
(19
93)’
sm
eth
od
Biodivers Conserv
123
indicated that seasonality played an important role in explaining geographic variation in
butterfly richness, together with energy and heterogeneity. Studies that considered sea-
sonality as a predictor of species richness yielded confounding results. Some studies found
seasonality to be good predictors of species richness (e.g. mammals: Andrews and O’Brien
2000; Badgley and Fox 2000; Tello and Stevens 2010; Carrara and Vazquez 2010; birds:
Qian 2008; Williams and Middleton 2008; Qian et al. 2009; Carrara and Vazquez 2010),
while others found species richness was not strongly influenced by seasonality (e.g. insects:
Kerr 1999; Schuldt and Assmann 2009; herptiles: Qian et al. 2007). These controversial
results could potentially be explained by the discrepancy in their dependency on external
energy supply and ability to maintain body temperature (i.e., endotherms vs. ectotherms).
Since most terrestrial ectotherms depend heavily on external energy input to maintain their
metabolism, the bottleneck for their survival and persistence may be availability, other than
temporal variation of energy. However, for endotherms, which can maintain thermal
homeostasis, the bottleneck may convert from energy to seasonality. Consistent with this,
the independent effect of seasonality is null for butterfly richness in our study (Fig. 2), and
seasonality variables were not selected in the best fitting environmental model for
amphibians and reptiles in China (Qian et al. 2007) and for carabid beetles in the western
Palaearctic area (Schuldt and Assmann 2009). However, we must notice that energy and
seasonality variables were calculated from the same basic data in our study. Therefore, it
was not surprising that energy and seasonality would overlap in their capacity to explain
butterfly richness (Fig. 2).
There were also other evidences highlighting the importance of seasonality for
explaining geographic butterfly richness pattern. First, elevatioanl range showed higher
positive correlation with the residual butterfly richness of energy model than that of sea-
sonality model (Fig. 3). This indicated that although both sets of variables have compa-
rable explanatory powers, seasonality performed better in explaining spatial variation in
butterfly richness in topographically complex areas than energy did. Second, Moran’s
I correlograms showed that seasonality did better in reducing spatial autocorrelation in
residuals of butterfly richness at the shortest distance than energy and heterogeneity did
(Fig. 4a; Table S2). Third, when the influence of seasonality was removed, the correlation
between residual richness of butterfly and seed plant was weaker than that of energy and
heterogeneity models (Fig. 5). This indicated that the role of seasonality in shaping the
Seasonality
a = 0.0
b = 5.5 c = 6.3f = 0.0
d = 2.5e = 19.7
g = 17.1
undetermined variation47.9
Energy Heterogeneity
Fig. 2 Results of variationpartitioning for butterfly richnessin terms of the proportion ofvariation explained (%).Variation of species richness isexplained by three sets ofvariables: seasonality, energy,and heterogeneity, and theunexplained variation; a, b, and,c are unique effects ofseasonality, energy andheterogeneity, respectively; whiled, e, f and g indicates their jointeffects
Biodivers Conserv
123
association between butterfly richness and seed plant richness was more important than
that of energy and heterogeneity.
Seed plant richness
There was significant correlation between butterfly species richness and seed plant richness
when the influence of environmental variables was included. However, when we removed
the impacts of environmental variables by fitting all environmental variables, the residual
richness of butterfly and seed plants showed no significant correlation (Fig. 5). This
indicated that there was no direct association between butterfly richness and seed plant
richness, and the correlation between them simply stemmed from their similar responses to
environmental variables (Hawkins and Porter 2003b).
The may be two reasons accounting for the indirect association between butterfly
richness and seed plant richness. First, the geographic species richness pattern is primarily
determined by few common species (Lennon et al. 2004), and for butterflies, the distri-
bution of habitat generalists was more likely influenced by climate variables than that of
specialists (Menendez et al. 2007). Second, only a small fraction of seed plants can be used
by butterflies as nectars for adults and hostplants for larvae (Chou 2000). That is, richness
of total plant richness was a rough agency of resource availability. Therefore, for butter-
flies, it is more likely to find direct association between the diversity of specialists and that
of nectars or host plants (Kitahara et al. 2008).
Ln-transformed elevarional range5 6 7 8 9
Res
idu
al-B
R
-1.0
-0.5
0.0
0.5
1.0
Res
idu
al-B
R
-1.5
-1.0
-0.5
0.0
0.5
1.0
1.5
r 2 = 0.228p < 0.001
r 2 = 0.075p = 0.022
a
b
Fig. 3 The relationshipsbetween ln-transformedelevational range and residualbutterfly richness (BR) of energymodel (a), and seasonality model(b)
Biodivers Conserv
123

Energy and heterogeneity
Multiple ordinary least squares regression and variation partitioning showed that, energy
was the most important factor explaining the variance in butterfly richness, in accordance
with previous analyses (Hawkins and Porter 2003a, b; Hawkins et al. 2003; White and Kerr
2007). Energy-related variables could influence butterfly richness through several physi-
ological, behavioral and evolutionary processes. Higher temperature not only allows but-
terflies to invest more time in foraging (Turner et al. 1987; Boggs and Murphy 1997), but
also influences egg hatching, growth rate, development and survival (Gotthardt et al. 2000;
Bale et al. 2002) which may result in more generations during one growth season.
Although the explanatory power of heterogeneity model was lower than those of energy
and seasonality, it had the largest unique component (6.3 %) in variation partitioning
(Fig. 2). This indicated that heterogeneity was a complimentary factor of climatic vari-
ables. This has also been shown by previous studies in which heterogeneity variables were
frequently selected in best fitting environmental models for butterfly richness (Kerr et al.
2001; Hawkins and Porter 2003a, b; White and Kerr 2007). The highest pure effect of
Distance (km)500 1000 1500 2000 2500
Mo
ran
's I
Mo
ran
's I
-1.0
-0.5
0.0
0.5
1.0
Butterfly richnessResiduals of environment model
-0.5
0.0
0.5
1.0
Butterfly richnessResiduals of energy modelResiduals of seasonality modelResiduals of heterogeneity model
a
b
Fig. 4 Moran’s I correlograms of butterfly richness and residuals. a butterfly richness and residuals ofenergy model, seasonality model, and heterogeneity model; b butterfly richness and residual ofenvironmental model
Biodivers Conserv
123

heterogeneity in shaping the geographic butterfly richness pattern may be due to strong
niche separation along altitudinal gradients in local butterfly faunas, irrespective of cli-
matic conditions (Chou 2000).
Sampling effort
The insufficient sampling may partly account for the low fraction of variance explained by
environmental variables in our analysis (but see Kerr et al. 2001; Hawkins and Porter
2003a, b). The number of specimen is the best measure of sampling effort (Willott 2001).
The number of survey years is a rough estimation of sampling effort. The significant linear
correlation between number of specimen or survey years and residuals left by
Residual-SPR-1.0 -0.5 0.0 0.5 1.0
Res
idu
al-B
R
-1.0
-0.5
0.0
0.5
1.0
1.5
SPR
6.0 6.5 7.0 7.5 8.0 8.5
BR
3.0
3.5
4.0
4.5
5.0
5.5
6.0
6.5
r2 = 0.378p < 0.001
a
b
r2 = 0.011p = 0.186
Residual-SPR
-1.0 -0.5 0.0 0.5 1.0
Res
idu
al-B
R
-1.0
-0.5
0.0
0.5
1.0
Residual-SPR
-1.0 -0.5 0.0 0.5 1.0
Res
idu
al-B
R
-1.5
-1.0
-0.5
0.0
0.5
1.0
1.5Residual-SPR
-1.0 -0.5 0.0 0.5 1.0
Res
idu
al-B
R
-1.5
-1.0
-0.5
0.0
0.5
1.0
1.5
r2 = 0.176p < 0.001
b c
d e
r2 = 0.181p < 0.001
r2 = 0.115p < 0.005
Fig. 5 Relationships between butterfly species richness (BR) and seed plant richness (SPR). Influence ofenvironmental variables was included or removed by fitting environmental variables prior to drawing thescatter plots. a Influence of environmental variables included; b Influence of energy removed; c Influence ofseasonality removed; d Influence of heterogeneity removed; e Influence of energy, seasonality, andheterogeneity removed
Biodivers Conserv
123

environmental model (Fig. 6a, b) indicated that, some local butterfly fauna are underes-
timated (Chou 2000). However, these factors that reduced the explanatory power of
environmental model may not bias the analytical results, because spatial richness pattern is
mainly determined by common species (Lennon et al. 2004), which are seldom overlooked
during field surveys (Gaston et al. 1995).
Acknowledgments We thank Jan Beck of Universitat Basel, and Hong Qian of Illinois State Museum forcomments on previous versions of the manuscript. We thank three anonymous reviewers for helpful sug-gestions. S. Chen thanks his new son, Jiayou Chen, for his encouragement. Financial support from theNational Key Technology R&D Program (2012BAC01B08) and the Special Public Science and TechnologyResearch Program for Environmental Protection (201209027) was also acknowledged.
References
Ackerly DD, Loarie DR, Cornwell WK, Weiss SB, Hamilton H, Branciforte R, Kraft NJB (2010) Thegeography of climate change: implications for conservation biogeography. Divers Distrib 16:476–487
Ln-transformed number of specimen5 6 7 8 9 10
Res
idu
al-B
R
-0.8
-0.6
-0.4
-0.2
0.0
0.2
0.4
0.6
0.8
Ln-transformed number of survey years0 1 2 3
Res
idu
al-B
R
-0.8
-0.6
-0.4
-0.2
0.0
0.2
0.4
0.6
0.8
a
b
r 2 = 0.387p < 0.001
r 2 = 0.273p < 0.005
Fig. 6 Relationships betweenresidual butterfly species richness(BR) of environmental model anda ln-transformed number ofspecimen; b ln-transformednumber of survey years
Biodivers Conserv
123

Ahn CH, Tateishi R (1994) Development of a global 30-minute grid potential evapotranspiration data set.ISPRS J Photogramm Remote Sens 33:12–21
Allen AP, Gillooly JF, Brown JH (2007) Recasting the species-energy hypothesis: the different roles ofkinetic and potential energy in regulating biodiversity. In: Storch D, Marquet PA, Brown JH (eds)Scaling Biodiversity. Cambridge University Press, Cambridge
Andrews P, O’Brien E (2000) Climate, vegetation, and predictable gradients in mammal species richness insouthern Africa. J Zool 251:205–231
Badgley C, Fox DL (2000) Ecological biogeography of North American mammals: species density andecological structure in relation to environmental gradients. J Biogeogr 27:1437–1467
Bale JS, Masters GJ, Hodkinson ID, Awmack C, Bezemer TM, Brown VK, Butterfield J, Buse A, CoulsonJC, Farrar J, Good JEG, Harrington R, Hartley S, Jones TH, Lindroth RL, Press MC, Symrnioudis I,Watt AD, Whittaker JB (2002) Herbivory in global climate change research: direct effects of risingtemperature on insect herbivores. Glob Change Biol 8:1–16
Bini LM, Diniz-Filho JAF, Rangel TFLVB, Akre TSB, Albaladejo RG, Albuquerque FS, Aparicio A,Araujo MB, Baselga A, Beck J, Bellocq MI, Bohning-Gaese K, Borges PAV, Castro-Parga I, CheyVK, Chown SL, De Marco P Jr, Dobkin DS, Ferrer-Castan D, Field R, Filloy J, Fleishman E, GomezJF, Hortal J, Iverson JB, Kerr JT, Kissling WD, Kitching IJ, Leon-Cortes JL, Lobo JM, Montoya D,Morales-Castilla I, Moreno JC, Oberdorff T, Olalla-Ta0rraga MA, Pausas JG, Qian H, Rahbek C,Rodrıguez MA, Rueda M, Ruggiero A, Sackmann P, Sanders NJ, Terribile LC, Vetaas OR, HawkinsBA (2009) Coefficient shifts in geographical ecology: an empirical evaluation of spatial and non-spatial regression. Ecography 32:193–204
Boggs CL, Murphy DD (1997) Community composition in mountain ecosystems: climatic determinants ofmontane butterfly distributions. Glob Ecol Biogeogr Lett 6:39–48
Carrara R, Vazquez DP (2010) The species-energy theory: a role for energy variability. Ecography33:942–948
Chesson P, Huntly N (1997) The roles of harsh and fluctuating conditions in the dynamics of ecologicalcommunities. Am Nat 150:519–553
Chou I (2000) Monographia Rhopalocerorum Sinensium, 2nd edn. Henan Science and Technology Press,Zhengzhou
Clarke A, Gaston KJ (2006) Climate, energy and diversity. Proc Roy Soc B 273:2257–2266Diniz-Filho JAF, Bini LM, Hawkins BA (2003) Spatial autocorrelation and red herrings in geographical
ecology. Glob Ecol Biogeogr 12:53–64Dutilleul P (1993) Modifying the t test for assessing the correlation between two spatial processes. Bio-
metrics 49:305–314Evans KL, Warren PH, Gaston KJ (2005) Species-energy relationships at the macroecological scale: a
review of the mechanisms. Biol Rev 80:1–25Field R, Hawkins BA, Cornell HV, Currie DJ, Diniz-Filho JAF, Guegan JF, Kaufman DM, Kerr JT,
Mittelbach GG, Oberdorff T, O’Brien EM, Turner JRG (2009) Spatial species-richness gradientsacross scales: a meta-analysis. J Biogeogr 36:132–147
Fleishman E (2010) Understanding species richness gradients informs projected responses to climatechange. J Biogeogr 37:1175–1176
Gaston KJ, Blackburn TM, Loder N (1995) Which species are described first?: the case of North Americanbutterflies. Biodivers Conserv 4:119–127
Gotthardt K, Nylin S, Wiklund C (2000) Mating opportunity and the evolution of sex-specific mortality ratesin a butterfly. Oecologia 122:36–43
Hawkins BA, Porter EE (2003a) Water-energy balance and the geographic pattern of species richness ofwestern Palearctic butterflies. Ecol Entomol 28:678–686
Hawkins BA, Porter EE (2003b) Does herbivore diversity depend on plant diversity? the case of Californiabutterflies. Amer Naturalist 161:40–49
Hawkins BA, Field R, Cornell HV, Currie DJ, Guegan JF, Kaufman D, Kerr JT, Mittelbach G, Oberdorff T,O’Brien EM, Porter EE, Turner JRG (2003) Energy, water, and broad-scale geographic patterns ofspecies richness. Ecology 84:3105–3117
Heikkinen RK, Luoto M, Kuussaari M, Poyry J (2005) New insights into butterfly environment relationshipsusing partitioning methods. Proc R Soc B 272:2203–2210
Hijmans RJ, Cameron SE, Parra JL, Jones PG, Jarvis A (2005) Very high resolution interpolated climatesurfaces for global land areas. Int J Climato 25:1965–1978
Kerr JT (1999) Weak links: ‘‘Rapoport’s rule’’ and large-scale species richness patterns. Global EcolBiogeogr 8:47–54
Kerr JT, Southwood TRE, Cihlar J (2001) Remotely sensed habitat diversity predicts butterfly speciesrichness and community similarity in Canada. Proc Nat Acad Sci USA 98:11365–11370
Biodivers Conserv
123

Kerr JT, Kharouba HM, Currie DJ (2007) The macroecological contribution to global change solutions.Science 316:1581–1584
Kissling WD, Rahbek C, Bohning-Gaese K (2007) Food plant diversity as broad-scale determinant of avianfrugivore richness. Proc R Soc B 274:799–808
Kissling WD, Field R, Korntheuer H, Heyder U, Bohning-Gaese K (2010) Woody plants and the predictionof climate-change impacts on bird diversity. Proc R Soc B 365:2035–2045
Kitahara M, Yumoto M, Kobayashi T (2008) Relationship of butterfly diversity with nectar plant speciesrichness in and around the Aokigahara primary woodland of Mount Fuji, central Japan. BiodiversConserv 17:2713–2734
Legendre P, Legendre L (1998) Numerical Ecology, 2nd, English edn. Elsevier Science BV, AmsterdamLennon JJ, Koleff P, Greenwood JJD, Gaston KJ (2004) Contribution of rarity and commonness to patterns
of species richness. Ecol Lett 7:81–87Menendez R, Gonzalez-Megıas A, Collingham Y, Fox R, Roy DB, Ohlemuller R, Thomas CD (2007) Direct
and indirect effects of climate and habitat factors on butterfly diversity. Ecology 88:605–611Qian H (2008) Effects of historical and contemporary factors on global patterns in avian species richness.
J Biogeogr 35:1362–1373Qian H, Wang X, Wang S, Li Y (2007) Environmental determinants of amphibian and reptile species
richness in China. Ecography 30:471–482Qian H, Wang S, Li Y, Wang X (2009) Breeding bird diversity in relation to environmental gradients in
China. Acta Oecol 35:819–823Quinn GP, Keough MJ (2002) Experimental design and data analysis for biologists. Cambridge University
Press, CambridgeR Development Core Team (2009) R: A language and environment for statistical computing, version 2.12.2.
R Foundation for Statistical Computing (online). Available from: http://www.R-project.orgRangel TF, Diniz-Filho JAF, Bini LM (2010) SAM: a comprehensive application for Spatial Analysis in
Macroecology. Ecography 33:46–50Ruggiero A, Hawkins BA (2008) Why do mountains support so many species of birds? Ecography
31:306–315Ruggiero A, Kitzberger T (2004) Environmental correlates of mammal species richness in South America:
effects of spatial structure, taxonomy and geographic range. Ecography 27:401–416Schuldt A, Assmann T (2009) Environmental and historical effects on richness and endemism patterns of
carabid beetles in the western Palaearctic. Ecography 32:705–714Tateishi R, Ahn CH (1996) Mapping evapotranspiration and water balance for global land surfaces. ISPRS J
Photogram Remote Sens 51:209–215Tello JS, Stevens RD (2010) Multiple environmental determinants of regional species richness and effects of
geographic range size. Ecography 33:796–808Turner JRG, Gatehouse CM, Corey CA (1987) Does solar energy control organic diversity? Butterflies
moths and the British climate. Oikos 48:195–205White PJT, Kerr JT (2007) Human impacts on environment-diversity relationships: evidence for biotic
homogenization from butterfly species richness patterns. Global Ecol Biogeogr 16:290–299Williams SE, Middleton J (2008) Climatic seasonality, resource bottlenecks, and abundance of rainforest
birds: implications for global climate change. Divers Distrib 14:69–77Willig MR, Kaufman DM, Stevens RD (2003) Latitudinal gradients of biodiversity: pattern, process, scale,
and synthesis. Annu Rev Ecol Evol Syst 34:273–309Willott SJ (2001) Species accumulation curves and the measure of sampling effort. J Appl Ecol 38:484–486Zhang J, Kissling WD, He F (2013) Local forest structure, climate and human disturbance determine
regional distribution of boreal bird species richness in Alberta, Canada. J Biogeogr 40:1131–1142
Biodivers Conserv
123