
Distinct Mechanisms Underlie Neurotoxin-Mediated Cell Death in Cultured Dopaminergic Neurons
Upload
independentCategory
view
3download
0
Multiple Biochemical and Morphological FactorsUnderlie the Production of Methylketones inTomato Trichomes1[W][OA]
Imri Ben-Israel, Geng Yu, Michael B. Austin, Nazmul Bhuiyan, Michele Auldridge, Thuong Nguyen,Ines Schauvinhold, Joseph P. Noel, Eran Pichersky, and Eyal Fridman*
Robert H. Smith Institute of Plant Sciences and Genetics in Agriculture, Faculty of Agriculture, Food,and Environment, Hebrew University of Jerusalem, Rehovot 76100, Israel (I.B.-I., E.F.); Department ofMolecular, Cellular, and Developmental Biology, University of Michigan, Ann Arbor, Michigan 48109–1048(G.Y., N.B., T.N., I.S., E.P.); and Jack H. Skirball Center for Chemical Biology and Proteomics, Salk Institute forBiological Studies, La Jolla, California 92037 (M.B.A., M.A., J.P.N.)
Genetic analysis of interspecific populations derived from crosses between the wild tomato species Solanum habrochaites f. sp.glabratum, which synthesizes and accumulates insecticidal methylketones (MK), mostly 2-undecanone and 2-tridecanone, inglandular trichomes, and cultivated tomato (Solanum lycopersicum), which does not, demonstrated that several genetic locicontribute to MKmetabolism in the wild species. A strong correlation was found between the shape of the glandular trichomesand their MK content, and significant associations were seen between allelic states of three genes and the amount of MKproduced by the plant. Two genes belong to the fatty acid biosynthetic pathway, and the third is the previously identifiedMethylketone Synthase1 (MKS1) that mediates conversion to MK of b-ketoacyl intermediates. Comparative transcriptomeanalysis of the glandular trichomes of F2 progeny grouped into low- and high-MK-containing plants identified severaladditional genes whose transcripts were either more or less abundant in the high-MK bulk. In particular, a wild species-specifictranscript for a gene that we named MKS2, encoding a protein with some similarity to a well-characterized bacterialthioesterase, was approximately 300-fold more highly expressed in F2 plants with high MK content than in those with low MKcontent. Genetic analysis in the segregating population showed that MKS2’s significant contribution to MK accumulation ismediated by an epistatic relationship with MKS1. Furthermore, heterologous expression of MKS2 in Escherichia coli resulted inthe production of methylketones in this host.
Plants exhibit a large range of chemical and mor-phological variation, reflecting different adaptations tomediating their interactions with the biotic and abioticenvironment throughout their life cycle (Ehrlich andRaven, 1964). Some plant chemicals are lipophilic(oily) compounds that have high vapor pressure andtherefore volatilize easily when exposed to air. Suchvolatiles can serve as signal molecules that eitherattract or repel animals. Many such compounds are
also toxic and can damage a predatory organismthrough external or internal contact and are oftensynthesized in dedicated cells that also serve to storethem (Wagner et al., 2004). In particular, such com-pounds may be synthesized and accumulated in smallepidermal cell extensions on the surface of leaves, stems,and reproductive tissues called glandular trichomes(Schilmiller et al., 2008). Since the initial work onglandular trichomes in mint (Mentha spp.; Gershenzonet al., 1992), various studies involving transcriptomics,proteomics, and metabolomics have indicated thatentire metabolic pathways responsible for the produc-tion of such compounds operate within the trichomesand that these unique cells require the import of onlythe basic building blocks to make these chemicals(Gang et al., 2001; Fridman et al., 2005; Nagel et al.,2008; Schilmiller et al., 2008; Xie et al., 2008).
The cultivated tomato Solanum lycopersicum and itswild relative Solanum habrochaites f. sp. glabratum rep-resent two of the 12 main taxa found within theSolanum section Lycopersicon (Zuriaga et al., 2008).While only limited genetic diversity is found amongthe cultivated S. lycopersicum accessions, a wide rangeof variance is found in the wild relatives. This richnessof genetic polymorphism is well reflected by the widerepertoire and quantity of specialized compounds
1 This work was supported by the Binational AgriculturalResearch and Development Fund (grant no. IS–3869–06), by theU.S. Department of Agriculture Cooperative State Research, Edu-cation, and Extension Service (National Research Initiative grantno. 2004–35318–14874), by the National Science Foundation (grantno. EEC–0813570), and by the Alon Fellowship and the BirkFoundation (to E.F.).
* Corresponding author; e-mail [email protected] authors responsible for distribution of materials integral to
the findings presented in this article in accordance with the policydescribed in the Instructions for Authors (www.plantphysiol.org)are: Eyal Fridman ([email protected]) and Eran Pichersky([email protected]).
[W] The online version of this article contains Web-only data.[OA] Open Access articles can be viewed online without a sub-
scription.www.plantphysiol.org/cgi/doi/10.1104/pp.109.146415
1952 Plant Physiology�, December 2009, Vol. 151, pp. 1952–1964, www.plantphysiol.org � 2009 American Society of Plant Biologists www.plant.org on November 12, 2014 - Published by www.plantphysiol.orgDownloaded from
Copyright © 2009 American Society of Plant Biologists. All rights reserved.
accumulated in their trichomes, including monoter-penes and sesquiterpenes (van Der Hoeven et al., 2000;Fridman et al., 2006; van Schie et al., 2007), acyl sugars(Ghangas and Steffens, 1993), andmethylketones (MK;Williams et al., 1980; Fridman et al., 2005). Up to seventypes of trichomes have been reported in the variousSolanum species. One of these trichome types that hasbeen investigated in some detail is the type VI glandu-lar trichome,which is composed of a stalk cell with fourcells at the top that form a mushroom-like shape; acuticular sac wrapped around these cells allows accu-mulation of secreted compounds similar to an inflatingballoon (Snyder and Carter, 1985; Werker, 2000).We have recently shown that in the wild species S.habrochaites f. sp. glabratum, the type VI glandulartrichomes, which are present at high density on boththe leaf surfaces and stems, contain two main MKcompounds, 2-tridecanone (2TD; containing a 13-Cbackbone) and 2-undecanone (2UD; containing an11-C backbone), aswell as some 2-pentadecanone (con-taining a 15-C backbone) and a few other unidentifiedMK. These MK are synthesized and accumulated tovery high levels in these trichomes, up to 5,500 mg g21
leaf fresh weight (Antonious, 2001; Fridman et al.,2005).Analysis of a type VI-specific EST database from a
MK-producing S. habrochaites f. sp. glabratum (acces-sion PI126449 [hereafter referred to as PI]) showed thattranscripts of genes encoding plastidic enzymes offatty acid biosynthesis are highly represented, in con-trast to their relatively low representation in anothertomato wild species that does not make MK (accessionLA1777; Fridman et al., 2005). The comparative anal-ysis of the two EST databases also led to the isolationand characterization of a novel gene encoding a pro-tein belonging to the a/b-hydrolase family, which wasspecifically and exclusively expressed in type VI tri-chomes of MK-producing plants but not in nonpro-ducers. Although the protein did not appear to have atransit peptide, the results of plastid import experi-ments indicated that it could be imported into theplastids.Since 3-ketoacids are inherently unstable and un-
dergo spontaneous decarboxylation (Kornberg et al.,1948), albeit at a low rate at ambient temperature, theevidence of elevated levels of fatty acid biosynthesis inthese trichomes suggested that the observed straight-chain MK such as 2TD and 2UD could be derived fromenzymatic or nonenzymatic decarboxylation of therespective Cn+1 3-ketoacids. In plants, 3-ketoacyls offatty acids mostly occur in plastids (as 3-ketoacyl-acyl-carrier proteins [ACPs]) as intermediates in the fattyacid biosynthesis pathway and in peroxisomes (as3-ketoacyl-CoA) as intermediates in the fatty aciddegradation pathway (http://lipids.plantbiology.msu.edu/?q=lipids/genesurvey/). The identification of aplastid-localized putative hydrolase led us to carry outin vitro assays with this enzyme, subsequently desig-nated as METHYLKETONE SYNTHASE1 (MKS1),with the C12, C14, and C16 3-ketoacyl-ACPs as sub-
strates (Fridman et al., 2005). In these assays, therespective C11, C13, and C15 MK were produced,suggesting that MKS1 is capable of both hydrolyzingthe thioester bond and decarboxylating the resulting3-ketoacid intermediate. However, it was noted thatthe turnover rate of the enzyme was unusually low(Fridman et al., 2005).
Crosses between MK-producing and nonproducinglines followed by segregation analysis have indicatedthat the ability to produce MK requires multiplequantitative trait loci in addition to MKS1 (Zamiret al., 1984). Consequently, it has not been possible tobreed cultivated tomato lines that produce high levelsof MK in their glands. It is likely that the trait of MKproduction in S. habrochaites evolved through multiplemorphological and biochemical changes that tookplace gradually during evolution. To uncover theadditional factors influencing MK production, wetook a quantitative genetic approach to identify quan-titative trait loci that might affect MK production,including genes encoding biosynthetic enzymes, andtested the possible relationship between trichomecharacteristics and chemical content. In addition, com-parative transcriptomic analysis was used to identifynew genes whose differential expression is correlatedwith MK production in interspecific populations.
RESULTS
Morphological and Chemical Analyses of InterspecificPopulations Derived from Crosses between the
Cultivated Tomato and S. habrochaites f. sp. glabratum
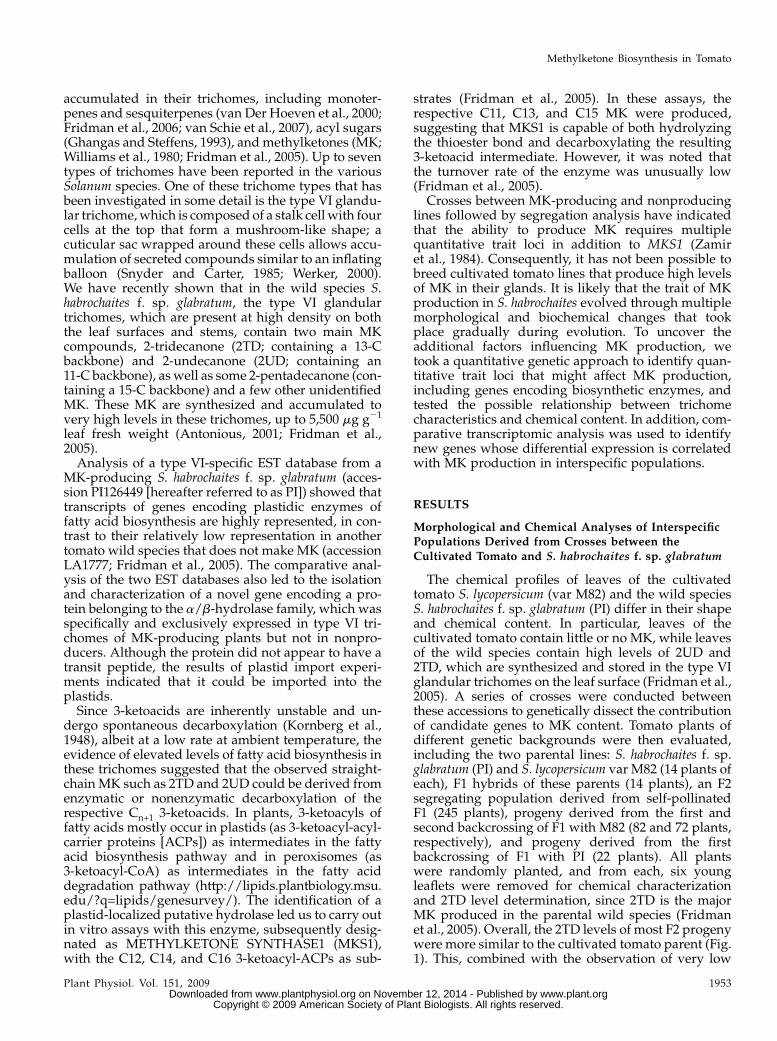
The chemical profiles of leaves of the cultivatedtomato S. lycopersicum (var M82) and the wild speciesS. habrochaites f. sp. glabratum (PI) differ in their shapeand chemical content. In particular, leaves of thecultivated tomato contain little or no MK, while leavesof the wild species contain high levels of 2UD and2TD, which are synthesized and stored in the type VIglandular trichomes on the leaf surface (Fridman et al.,2005). A series of crosses were conducted betweenthese accessions to genetically dissect the contributionof candidate genes to MK content. Tomato plants ofdifferent genetic backgrounds were then evaluated,including the two parental lines: S. habrochaites f. sp.glabratum (PI) and S. lycopersicum var M82 (14 plants ofeach), F1 hybrids of these parents (14 plants), an F2segregating population derived from self-pollinatedF1 (245 plants), progeny derived from the first andsecond backcrossing of F1 with M82 (82 and 72 plants,respectively), and progeny derived from the firstbackcrossing of F1 with PI (22 plants). All plantswere randomly planted, and from each, six youngleaflets were removed for chemical characterizationand 2TD level determination, since 2TD is the majorMK produced in the parental wild species (Fridmanet al., 2005). Overall, the 2TD levels of most F2 progenywere more similar to the cultivated tomato parent (Fig.1). This, combined with the observation of very low
Methylketone Biosynthesis in Tomato
Plant Physiol. Vol. 151, 2009 1953 www.plant.org on November 12, 2014 - Published by www.plantphysiol.orgDownloaded from
Copyright © 2009 American Society of Plant Biologists. All rights reserved.
values in the backcrossed generations, indicated poly-genic inheritance of this trait and suggested the reces-sive characteristic of the wild species alleles thatparticipate in this pathway.
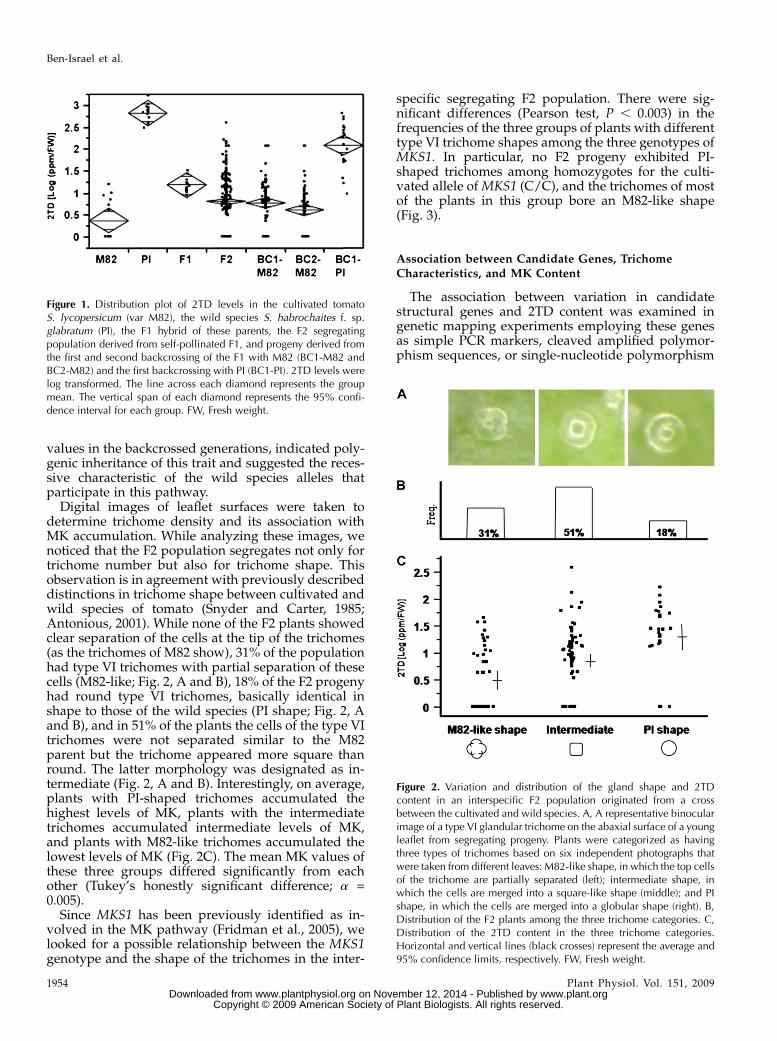
Digital images of leaflet surfaces were taken todetermine trichome density and its association withMK accumulation. While analyzing these images, wenoticed that the F2 population segregates not only fortrichome number but also for trichome shape. Thisobservation is in agreement with previously describeddistinctions in trichome shape between cultivated andwild species of tomato (Snyder and Carter, 1985;Antonious, 2001). While none of the F2 plants showedclear separation of the cells at the tip of the trichomes(as the trichomes of M82 show), 31% of the populationhad type VI trichomes with partial separation of thesecells (M82-like; Fig. 2, A and B), 18% of the F2 progenyhad round type VI trichomes, basically identical inshape to those of the wild species (PI shape; Fig. 2, Aand B), and in 51% of the plants the cells of the type VItrichomes were not separated similar to the M82parent but the trichome appeared more square thanround. The latter morphology was designated as in-termediate (Fig. 2, A and B). Interestingly, on average,plants with PI-shaped trichomes accumulated thehighest levels of MK, plants with the intermediatetrichomes accumulated intermediate levels of MK,and plants with M82-like trichomes accumulated thelowest levels of MK (Fig. 2C). The mean MK values ofthese three groups differed significantly from eachother (Tukey’s honestly significant difference; a =0.005).
Since MKS1 has been previously identified as in-volved in the MK pathway (Fridman et al., 2005), welooked for a possible relationship between the MKS1genotype and the shape of the trichomes in the inter-
specific segregating F2 population. There were sig-nificant differences (Pearson test, P , 0.003) in thefrequencies of the three groups of plants with differenttype VI trichome shapes among the three genotypes ofMKS1. In particular, no F2 progeny exhibited PI-shaped trichomes among homozygotes for the culti-vated allele ofMKS1 (C/C), and the trichomes of mostof the plants in this group bore an M82-like shape(Fig. 3).
Association between Candidate Genes, TrichomeCharacteristics, and MK Content
The association between variation in candidatestructural genes and 2TD content was examined ingenetic mapping experiments employing these genesas simple PCR markers, cleaved amplified polymor-phism sequences, or single-nucleotide polymorphism
Figure 1. Distribution plot of 2TD levels in the cultivated tomatoS. lycopersicum (var M82), the wild species S. habrochaites f. sp.glabratum (PI), the F1 hybrid of these parents, the F2 segregatingpopulation derived from self-pollinated F1, and progeny derived fromthe first and second backcrossing of the F1 with M82 (BC1-M82 andBC2-M82) and the first backcrossing with PI (BC1-PI). 2TD levels werelog transformed. The line across each diamond represents the groupmean. The vertical span of each diamond represents the 95% confi-dence interval for each group. FW, Fresh weight.
Figure 2. Variation and distribution of the gland shape and 2TDcontent in an interspecific F2 population originated from a crossbetween the cultivated and wild species. A, A representative binocularimage of a type VI glandular trichome on the abaxial surface of a youngleaflet from segregating progeny. Plants were categorized as havingthree types of trichomes based on six independent photographs thatwere taken from different leaves: M82-like shape, in which the top cellsof the trichome are partially separated (left); intermediate shape, inwhich the cells are merged into a square-like shape (middle); and PIshape, in which the cells are merged into a globular shape (right). B,Distribution of the F2 plants among the three trichome categories. C,Distribution of the 2TD content in the three trichome categories.Horizontal and vertical lines (black crosses) represent the average and95% confidence limits, respectively. FW, Fresh weight.
Ben-Israel et al.
1954 Plant Physiol. Vol. 151, 2009 www.plant.org on November 12, 2014 - Published by www.plantphysiol.orgDownloaded from
Copyright © 2009 American Society of Plant Biologists. All rights reserved.

(SNP) markers, after aligning the open reading frame(ORF) of the alleles from both species and designingamplicons flanking the insertion/deletion, SNP, orrestriction site (see “Materials and Methods”). Thelatter approach used high-resolution melt technology(HRM Assay Design and Analysis, CorProtocol 6000,2006; Supplemental Fig. S1).Since MK are derived from fatty acids, we examined
the following genes from the fatty acid biosyntheticpathway (http://lipids.plantbiology.msu.edu/?q=lipids/genesurvey/) as genetic markers: acetyl-CoAcarboxylase (ACC), malonyl-CoA:ACP transacylase(MaCoA-ACP trans), 3-ketoacyl-ACP synthase III (KA-SIII), 2,3-trans-enoyl-ACP reductase, 3-ketoacyl-ACPsynthase I (KASI), ACP1, and ACP2. The MKS1 locuswas also included in the genetic screening. Associationtest was conducted by multiple regression analysisusing the allelic state of the different genes in each F2progeny and trichome characters as a predictor of 2TDlevel. This analysis (power = 0.999) showed that seg-regating progeny carrying the wild allele in two loci
(MKS1 and ACC) contain significantly (P, 0.0003 andP , 0.003, respectively) higher amounts of 2TD (Fig.4A), while for the MaCoA-ACP trans locus, the op-posite trend was observed: plants carrying the wildspecies allele had, on average, significantly (P, 0.039)less 2TD content. In addition, a significant positivecorrelation between the density and shape of thetrichomes and the amount of MK in the leaves wasfound (Fig. 4A). This multiple regression reinforcedthe previous results, indicating an association betweentrichome morphology and 2TD levels (Fig. 2), andoverall this model explained approximately one-thirdof the total 2TD phenotypic variation in the F2 popu-lation (r2 = 0.333; Fig. 4B). To test whether the threecandidate genes that are significantly associated with2TD levels in the segregating population (MKS1, ACC,and MaCoA-ACP trans) exhibit differential expressionbetween the wild and cultivated species, a quantitativereverse transcription (qRT)-PCR approach was taken.Primer pairs that fully matched both alleles weredesigned for each gene, and qRT-PCR was conductedusing RNA from trichomes of both accessions (see“Materials and Methods”). MKS1, ACC, and MaCoA-ACP trans showed 355-, 2.7-, and 7.7-fold higher ex-pression, respectively, in the trichomes of the PI parentversus those of the M82 parent (Fig. 4C).
Mapping these three genes on the tomato genomeusing the Solanum pennellii introgression line popula-tion (Eshed and Zamir, 1995; Liu and Zamir, 1999)identified genes ACC and MaCoA-ACP trans on chro-mosome 1, bin 1-B. Based on the F2 mapping popu-lation, the two loci are 8.8 centimorgan (cM) apart (39recombination events in 220 F2 progeny successfullyscored for both loci). MKS1 was localized to bin 1-I,more than 50 cM away (Supplemental Fig. S2). Therewere no significant linkages with any of the other locitested.
Figure 3. Mosaic plot of trichome shape in each of the genotypicclasses ofMKS1. C, Cultivated (M82) allele; W, wild species (PI) allele.
Figure 4. A, Association analysis of can-didate genes and trichome characteristicswith leaf 2TD content. The multiple re-gression model includes all of the testedfactors for which a significant effect wasfound. The effect is defined as the contri-bution of one level/allele of the testedfactor to the 2TD content. B, Accumulatedvariation explained by the model (r 2) witheach additional factor. C, Expression ofMKS1, ACC, and MaCoA-ACP trans intrichomes of the wild species S. habro-chaites f. sp. glabratum (PI) and the culti-vated tomato S. lycopersicum (var M82).mRNA abundance in isolated trichomeswas determined by qRT-PCR. Expressionlevels for the various samples were nor-malized to the expression of Actin. Dataare averages of three biological replicates,and error bars represent SE.
Methylketone Biosynthesis in Tomato
Plant Physiol. Vol. 151, 2009 1955 www.plant.org on November 12, 2014 - Published by www.plantphysiol.orgDownloaded from
Copyright © 2009 American Society of Plant Biologists. All rights reserved.
Transcriptome Analysis of Trichomes from
Bulked Segregants
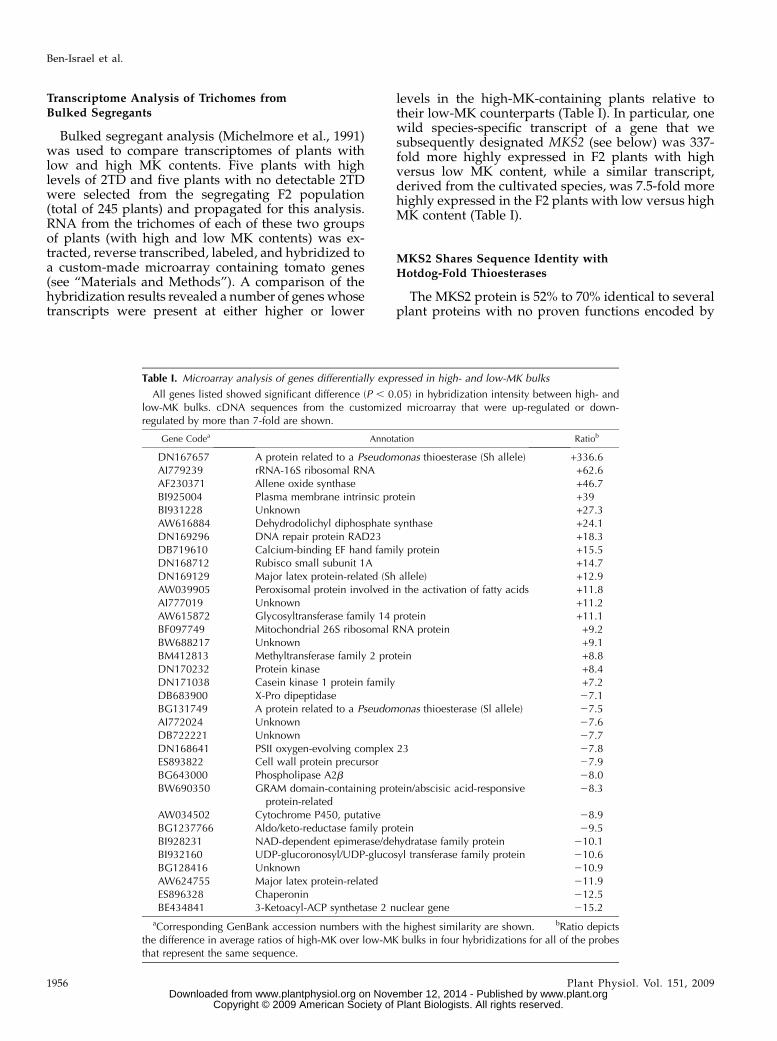
Bulked segregant analysis (Michelmore et al., 1991)was used to compare transcriptomes of plants withlow and high MK contents. Five plants with highlevels of 2TD and five plants with no detectable 2TDwere selected from the segregating F2 population(total of 245 plants) and propagated for this analysis.RNA from the trichomes of each of these two groupsof plants (with high and low MK contents) was ex-tracted, reverse transcribed, labeled, and hybridized toa custom-made microarray containing tomato genes(see “Materials and Methods”). A comparison of thehybridization results revealed a number of geneswhosetranscripts were present at either higher or lower
levels in the high-MK-containing plants relative totheir low-MK counterparts (Table I). In particular, onewild species-specific transcript of a gene that wesubsequently designated MKS2 (see below) was 337-fold more highly expressed in F2 plants with highversus low MK content, while a similar transcript,derived from the cultivated species, was 7.5-fold morehighly expressed in the F2 plants with low versus highMK content (Table I).
MKS2 Shares Sequence Identity withHotdog-Fold Thioesterases
The MKS2 protein is 52% to 70% identical to severalplant proteins with no proven functions encoded by
Table I. Microarray analysis of genes differentially expressed in high- and low-MK bulks
All genes listed showed significant difference (P , 0.05) in hybridization intensity between high- andlow-MK bulks. cDNA sequences from the customized microarray that were up-regulated or down-regulated by more than 7-fold are shown.
Gene Codea Annotation Ratiob
DN167657 A protein related to a Pseudomonas thioesterase (Sh allele) +336.6AI779239 rRNA-16S ribosomal RNA +62.6AF230371 Allene oxide synthase +46.7BI925004 Plasma membrane intrinsic protein +39BI931228 Unknown +27.3AW616884 Dehydrodolichyl diphosphate synthase +24.1DN169296 DNA repair protein RAD23 +18.3DB719610 Calcium-binding EF hand family protein +15.5DN168712 Rubisco small subunit 1A +14.7DN169129 Major latex protein-related (Sh allele) +12.9AW039905 Peroxisomal protein involved in the activation of fatty acids +11.8AI777019 Unknown +11.2AW615872 Glycosyltransferase family 14 protein +11.1BF097749 Mitochondrial 26S ribosomal RNA protein +9.2BW688217 Unknown +9.1BM412813 Methyltransferase family 2 protein +8.8DN170232 Protein kinase +8.4DN171038 Casein kinase 1 protein family +7.2DB683900 X-Pro dipeptidase 27.1BG131749 A protein related to a Pseudomonas thioesterase (Sl allele) 27.5AI772024 Unknown 27.6DB722221 Unknown 27.7DN168641 PSII oxygen-evolving complex 23 27.8ES893822 Cell wall protein precursor 27.9BG643000 Phospholipase A2b 28.0BW690350 GRAM domain-containing protein/abscisic acid-responsive
protein-related28.3
AW034502 Cytochrome P450, putative 28.9BG1237766 Aldo/keto-reductase family protein 29.5BI928231 NAD-dependent epimerase/dehydratase family protein 210.1BI932160 UDP-glucoronosyl/UDP-glucosyl transferase family protein 210.6BG128416 Unknown 210.9AW624755 Major latex protein-related 211.9ES896328 Chaperonin 212.5BE434841 3-Ketoacyl-ACP synthetase 2 nuclear gene 215.2
aCorresponding GenBank accession numbers with the highest similarity are shown. bRatio depictsthe difference in average ratios of high-MK over low-MK bulks in four hybridizations for all of the probesthat represent the same sequence.
Ben-Israel et al.
1956 Plant Physiol. Vol. 151, 2009 www.plant.org on November 12, 2014 - Published by www.plantphysiol.orgDownloaded from
Copyright © 2009 American Society of Plant Biologists. All rights reserved.
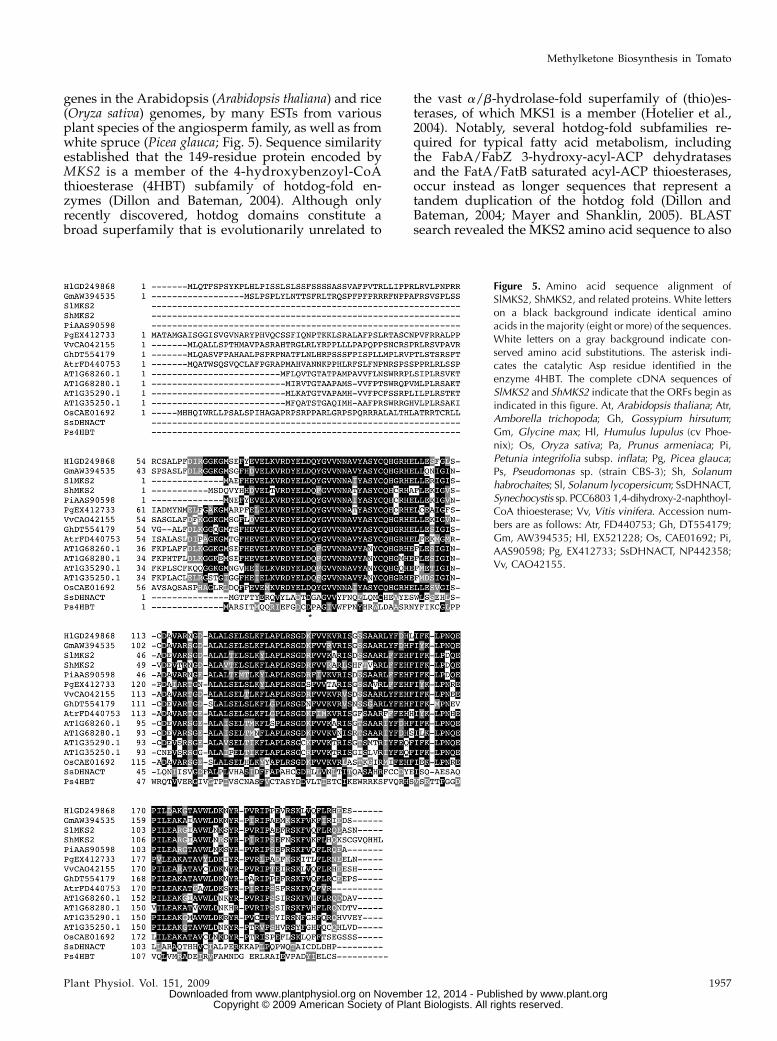
genes in the Arabidopsis (Arabidopsis thaliana) and rice(Oryza sativa) genomes, by many ESTs from variousplant species of the angiosperm family, as well as fromwhite spruce (Picea glauca; Fig. 5). Sequence similarityestablished that the 149-residue protein encoded byMKS2 is a member of the 4-hydroxybenzoyl-CoAthioesterase (4HBT) subfamily of hotdog-fold en-zymes (Dillon and Bateman, 2004). Although onlyrecently discovered, hotdog domains constitute abroad superfamily that is evolutionarily unrelated to
the vast a/b-hydrolase-fold superfamily of (thio)es-terases, of which MKS1 is a member (Hotelier et al.,2004). Notably, several hotdog-fold subfamilies re-quired for typical fatty acid metabolism, includingthe FabA/FabZ 3-hydroxy-acyl-ACP dehydratasesand the FatA/FatB saturated acyl-ACP thioesterases,occur instead as longer sequences that represent atandem duplication of the hotdog fold (Dillon andBateman, 2004; Mayer and Shanklin, 2005). BLASTsearch revealed the MKS2 amino acid sequence to also
Figure 5. Amino acid sequence alignment ofSlMKS2, ShMKS2, and related proteins. White letterson a black background indicate identical aminoacids in the majority (eight or more) of the sequences.White letters on a gray background indicate con-served amino acid substitutions. The asterisk indi-cates the catalytic Asp residue identified in theenzyme 4HBT. The complete cDNA sequences ofSlMKS2 and ShMKS2 indicate that the ORFs begin asindicated in this figure. At, Arabidopsis thaliana; Atr,Amborella trichopoda; Gh, Gossypium hirsutum;Gm, Glycine max; Hl, Humulus lupulus (cv Phoe-nix); Os, Oryza sativa; Pa, Prunus armeniaca; Pi,Petunia integrifolia subsp. inflata; Pg, Picea glauca;Ps, Pseudomonas sp. (strain CBS-3); Sh, Solanumhabrochaites; Sl, Solanum lycopersicum; SsDHNACT,Synechocystis sp. PCC6803 1,4-dihydroxy-2-naphthoyl-CoA thioesterase; Vv, Vitis vinifera. Accession num-bers are as follows: Atr, FD440753; Gh, DT554179;Gm, AW394535; Hl, EX521228; Os, CAE01692; Pi,AAS90598; Pg, EX412733; SsDHNACT, NP442358;Vv, CAO42155.
Methylketone Biosynthesis in Tomato
Plant Physiol. Vol. 151, 2009 1957 www.plant.org on November 12, 2014 - Published by www.plantphysiol.orgDownloaded from
Copyright © 2009 American Society of Plant Biologists. All rights reserved.
be 34% identical (and 48% similar) over 131 alignedresidues to a structurally characterized putative thio-esterase from Thermus thermophilus (Protein Data Bank[PDB] code 1Z54), which in turn shares 26% sequenceidentity and 51% similarity with 4HBTover 91 alignedresidues. The crystallized 1Z54 protein backbonenearly perfectly overlays with known 4HBT structure(PDB code 1L09; Supplemental Fig. S3). This “bridg-ing” 1Z54 sequence and crystal structure firmly estab-lish the homology of MKS2 to the well-characterized4HBT, and 1Z54 facilitates a structural homology-based examination of the MKS2 sequence. In addi-tion, MKS2 conserves the catalytic Asp-17 of 4HBT,although our model predicts extensive substitutionof juxtaposed residues in the MKS2 active-site cav-ity relative to any characterized 4HBT subfamilymember.
MKS2 Is Associated with MK Content and Reveals an
Epistatic Interaction with MKS1
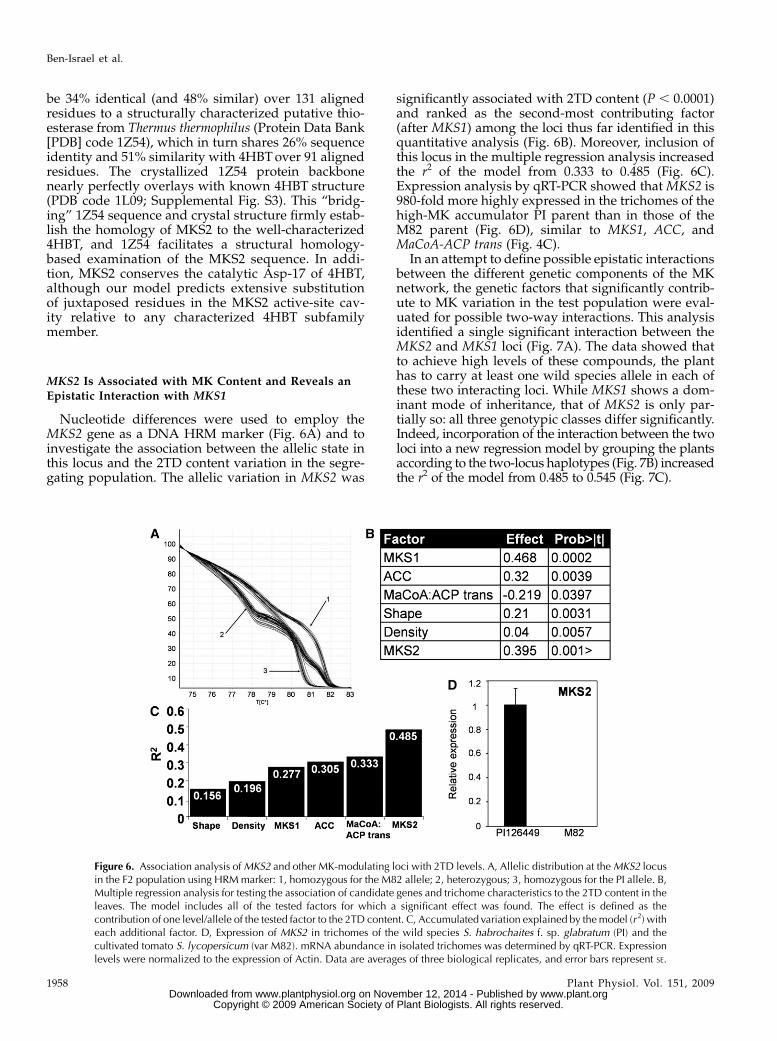
Nucleotide differences were used to employ theMKS2 gene as a DNA HRM marker (Fig. 6A) and toinvestigate the association between the allelic state inthis locus and the 2TD content variation in the segre-gating population. The allelic variation in MKS2 was
significantly associated with 2TD content (P , 0.0001)and ranked as the second-most contributing factor(after MKS1) among the loci thus far identified in thisquantitative analysis (Fig. 6B). Moreover, inclusion ofthis locus in the multiple regression analysis increasedthe r2 of the model from 0.333 to 0.485 (Fig. 6C).Expression analysis by qRT-PCR showed that MKS2 is980-fold more highly expressed in the trichomes of thehigh-MK accumulator PI parent than in those of theM82 parent (Fig. 6D), similar to MKS1, ACC, andMaCoA-ACP trans (Fig. 4C).
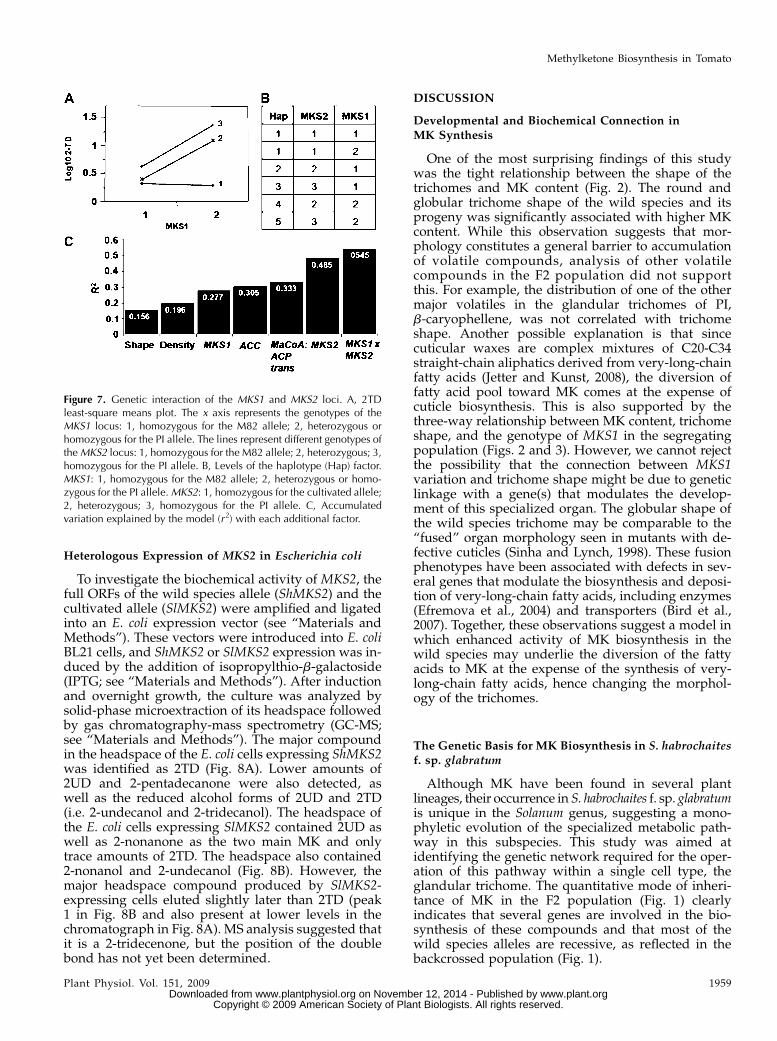
In an attempt to define possible epistatic interactionsbetween the different genetic components of the MKnetwork, the genetic factors that significantly contrib-ute to MK variation in the test population were eval-uated for possible two-way interactions. This analysisidentified a single significant interaction between theMKS2 and MKS1 loci (Fig. 7A). The data showed thatto achieve high levels of these compounds, the planthas to carry at least one wild species allele in each ofthese two interacting loci. While MKS1 shows a dom-inant mode of inheritance, that of MKS2 is only par-tially so: all three genotypic classes differ significantly.Indeed, incorporation of the interaction between the twoloci into a new regression model by grouping the plantsaccording to the two-locus haplotypes (Fig. 7B) increasedthe r2 of the model from 0.485 to 0.545 (Fig. 7C).
Figure 6. Association analysis ofMKS2 and other MK-modulating loci with 2TD levels. A, Allelic distribution at theMKS2 locusin the F2 population using HRMmarker: 1, homozygous for the M82 allele; 2, heterozygous; 3, homozygous for the PI allele. B,Multiple regression analysis for testing the association of candidate genes and trichome characteristics to the 2TD content in theleaves. The model includes all of the tested factors for which a significant effect was found. The effect is defined as thecontribution of one level/allele of the tested factor to the 2TD content. C, Accumulated variation explained by themodel (r 2) witheach additional factor. D, Expression of MKS2 in trichomes of the wild species S. habrochaites f. sp. glabratum (PI) and thecultivated tomato S. lycopersicum (var M82). mRNA abundance in isolated trichomes was determined by qRT-PCR. Expressionlevels were normalized to the expression of Actin. Data are averages of three biological replicates, and error bars represent SE.
Ben-Israel et al.
1958 Plant Physiol. Vol. 151, 2009 www.plant.org on November 12, 2014 - Published by www.plantphysiol.orgDownloaded from
Copyright © 2009 American Society of Plant Biologists. All rights reserved.
Heterologous Expression of MKS2 in Escherichia coli
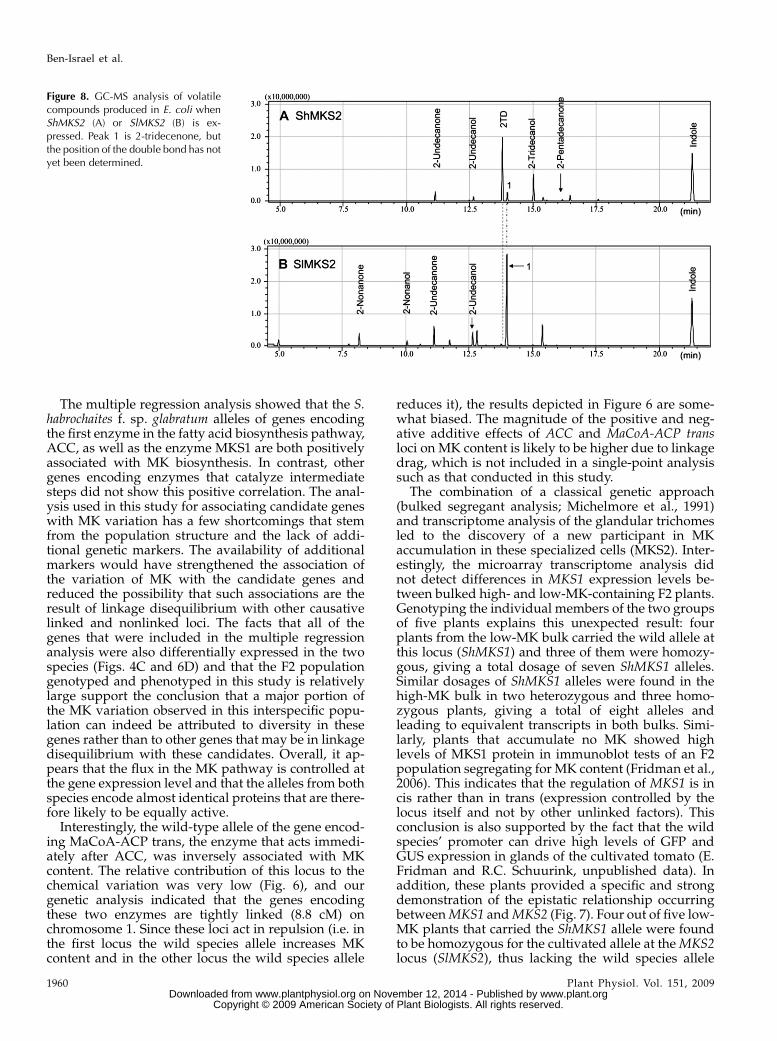
To investigate the biochemical activity of MKS2, thefull ORFs of the wild species allele (ShMKS2) and thecultivated allele (SlMKS2) were amplified and ligatedinto an E. coli expression vector (see “Materials andMethods”). These vectors were introduced into E. coliBL21 cells, and ShMKS2 or SlMKS2 expression was in-duced by the addition of isopropylthio-b-galactoside(IPTG; see “Materials and Methods”). After inductionand overnight growth, the culture was analyzed bysolid-phase microextraction of its headspace followedby gas chromatography-mass spectrometry (GC-MS;see “Materials and Methods”). The major compoundin the headspace of the E. coli cells expressing ShMKS2was identified as 2TD (Fig. 8A). Lower amounts of2UD and 2-pentadecanone were also detected, aswell as the reduced alcohol forms of 2UD and 2TD(i.e. 2-undecanol and 2-tridecanol). The headspace ofthe E. coli cells expressing SlMKS2 contained 2UD aswell as 2-nonanone as the two main MK and onlytrace amounts of 2TD. The headspace also contained2-nonanol and 2-undecanol (Fig. 8B). However, themajor headspace compound produced by SlMKS2-expressing cells eluted slightly later than 2TD (peak1 in Fig. 8B and also present at lower levels in thechromatograph in Fig. 8A). MS analysis suggested thatit is a 2-tridecenone, but the position of the doublebond has not yet been determined.
DISCUSSION
Developmental and Biochemical Connection inMK Synthesis
One of the most surprising findings of this studywas the tight relationship between the shape of thetrichomes and MK content (Fig. 2). The round andglobular trichome shape of the wild species and itsprogeny was significantly associated with higher MKcontent. While this observation suggests that mor-phology constitutes a general barrier to accumulationof volatile compounds, analysis of other volatilecompounds in the F2 population did not supportthis. For example, the distribution of one of the othermajor volatiles in the glandular trichomes of PI,b-caryophellene, was not correlated with trichomeshape. Another possible explanation is that sincecuticular waxes are complex mixtures of C20-C34straight-chain aliphatics derived from very-long-chainfatty acids (Jetter and Kunst, 2008), the diversion offatty acid pool toward MK comes at the expense ofcuticle biosynthesis. This is also supported by thethree-way relationship between MK content, trichomeshape, and the genotype of MKS1 in the segregatingpopulation (Figs. 2 and 3). However, we cannot rejectthe possibility that the connection between MKS1variation and trichome shape might be due to geneticlinkage with a gene(s) that modulates the develop-ment of this specialized organ. The globular shape ofthe wild species trichome may be comparable to the“fused” organ morphology seen in mutants with de-fective cuticles (Sinha and Lynch, 1998). These fusionphenotypes have been associated with defects in sev-eral genes that modulate the biosynthesis and deposi-tion of very-long-chain fatty acids, including enzymes(Efremova et al., 2004) and transporters (Bird et al.,2007). Together, these observations suggest a model inwhich enhanced activity of MK biosynthesis in thewild species may underlie the diversion of the fattyacids to MK at the expense of the synthesis of very-long-chain fatty acids, hence changing the morphol-ogy of the trichomes.
The Genetic Basis for MK Biosynthesis in S. habrochaitesf. sp. glabratum
Although MK have been found in several plantlineages, their occurrence in S. habrochaites f. sp. glabratumis unique in the Solanum genus, suggesting a mono-phyletic evolution of the specialized metabolic path-way in this subspecies. This study was aimed atidentifying the genetic network required for the oper-ation of this pathway within a single cell type, theglandular trichome. The quantitative mode of inheri-tance of MK in the F2 population (Fig. 1) clearlyindicates that several genes are involved in the bio-synthesis of these compounds and that most of thewild species alleles are recessive, as reflected in thebackcrossed population (Fig. 1).
Figure 7. Genetic interaction of the MKS1 and MKS2 loci. A, 2TDleast-square means plot. The x axis represents the genotypes of theMKS1 locus: 1, homozygous for the M82 allele; 2, heterozygous orhomozygous for the PI allele. The lines represent different genotypes oftheMKS2 locus: 1, homozygous for the M82 allele; 2, heterozygous; 3,homozygous for the PI allele. B, Levels of the haplotype (Hap) factor.MKS1: 1, homozygous for the M82 allele; 2, heterozygous or homo-zygous for the PI allele.MKS2: 1, homozygous for the cultivated allele;2, heterozygous; 3, homozygous for the PI allele. C, Accumulatedvariation explained by the model (r 2) with each additional factor.
Methylketone Biosynthesis in Tomato
Plant Physiol. Vol. 151, 2009 1959 www.plant.org on November 12, 2014 - Published by www.plantphysiol.orgDownloaded from
Copyright © 2009 American Society of Plant Biologists. All rights reserved.
The multiple regression analysis showed that the S.habrochaites f. sp. glabratum alleles of genes encodingthe first enzyme in the fatty acid biosynthesis pathway,ACC, as well as the enzyme MKS1 are both positivelyassociated with MK biosynthesis. In contrast, othergenes encoding enzymes that catalyze intermediatesteps did not show this positive correlation. The anal-ysis used in this study for associating candidate geneswith MK variation has a few shortcomings that stemfrom the population structure and the lack of addi-tional genetic markers. The availability of additionalmarkers would have strengthened the association ofthe variation of MK with the candidate genes andreduced the possibility that such associations are theresult of linkage disequilibrium with other causativelinked and nonlinked loci. The facts that all of thegenes that were included in the multiple regressionanalysis were also differentially expressed in the twospecies (Figs. 4C and 6D) and that the F2 populationgenotyped and phenotyped in this study is relativelylarge support the conclusion that a major portion ofthe MK variation observed in this interspecific popu-lation can indeed be attributed to diversity in thesegenes rather than to other genes that may be in linkagedisequilibrium with these candidates. Overall, it ap-pears that the flux in the MK pathway is controlled atthe gene expression level and that the alleles from bothspecies encode almost identical proteins that are there-fore likely to be equally active.
Interestingly, the wild-type allele of the gene encod-ing MaCoA-ACP trans, the enzyme that acts immedi-ately after ACC, was inversely associated with MKcontent. The relative contribution of this locus to thechemical variation was very low (Fig. 6), and ourgenetic analysis indicated that the genes encodingthese two enzymes are tightly linked (8.8 cM) onchromosome 1. Since these loci act in repulsion (i.e. inthe first locus the wild species allele increases MKcontent and in the other locus the wild species allele
reduces it), the results depicted in Figure 6 are some-what biased. The magnitude of the positive and neg-ative additive effects of ACC and MaCoA-ACP transloci on MK content is likely to be higher due to linkagedrag, which is not included in a single-point analysissuch as that conducted in this study.
The combination of a classical genetic approach(bulked segregant analysis; Michelmore et al., 1991)and transcriptome analysis of the glandular trichomesled to the discovery of a new participant in MKaccumulation in these specialized cells (MKS2). Inter-estingly, the microarray transcriptome analysis didnot detect differences in MKS1 expression levels be-tween bulked high- and low-MK-containing F2 plants.Genotyping the individual members of the two groupsof five plants explains this unexpected result: fourplants from the low-MK bulk carried the wild allele atthis locus (ShMKS1) and three of them were homozy-gous, giving a total dosage of seven ShMKS1 alleles.Similar dosages of ShMKS1 alleles were found in thehigh-MK bulk in two heterozygous and three homo-zygous plants, giving a total of eight alleles andleading to equivalent transcripts in both bulks. Simi-larly, plants that accumulate no MK showed highlevels of MKS1 protein in immunoblot tests of an F2population segregating for MK content (Fridman et al.,2006). This indicates that the regulation of MKS1 is incis rather than in trans (expression controlled by thelocus itself and not by other unlinked factors). Thisconclusion is also supported by the fact that the wildspecies’ promoter can drive high levels of GFP andGUS expression in glands of the cultivated tomato (E.Fridman and R.C. Schuurink, unpublished data). Inaddition, these plants provided a specific and strongdemonstration of the epistatic relationship occurringbetweenMKS1 andMKS2 (Fig. 7). Four out of five low-MK plants that carried the ShMKS1 allele were foundto be homozygous for the cultivated allele at theMKS2locus (SlMKS2), thus lacking the wild species allele
Figure 8. GC-MS analysis of volatilecompounds produced in E. coli whenShMKS2 (A) or SlMKS2 (B) is ex-pressed. Peak 1 is 2-tridecenone, butthe position of the double bond has notyet been determined.
Ben-Israel et al.
1960 Plant Physiol. Vol. 151, 2009 www.plant.org on November 12, 2014 - Published by www.plantphysiol.orgDownloaded from
Copyright © 2009 American Society of Plant Biologists. All rights reserved.
ShMKS2. The fifth plant, on the other hand, presentedthe opposite pattern (i.e. heterozygous at the MKS2locus but homozygous for the cultivated allele at theMKS1 locus, SlMKS1), thus lacking the wild speciesallele ShMKS1. Conversely, analysis of the two-locushaplotype in the high-MK bulk plants showed thatthey carried at least one wild allele at both the MKS1and MKS2 loci (ShMKS1 and ShMKS2).
The Role of MKS1 and MKS2 in MK Biosynthesis
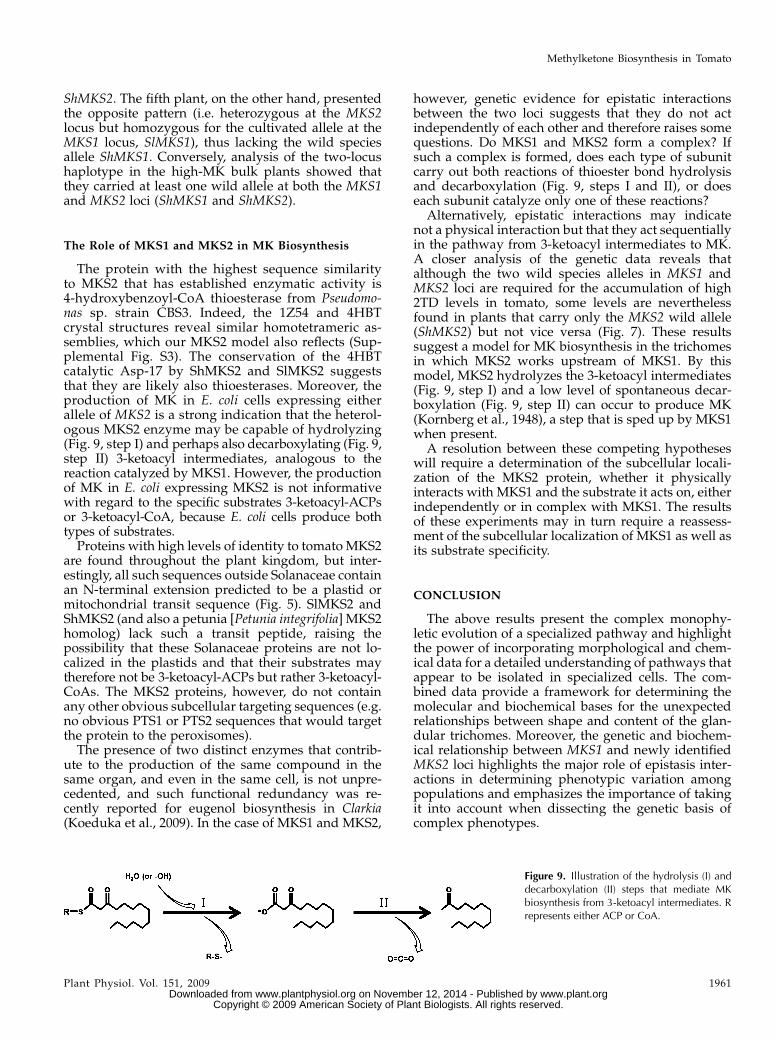
The protein with the highest sequence similarityto MKS2 that has established enzymatic activity is4-hydroxybenzoyl-CoA thioesterase from Pseudomo-nas sp. strain CBS3. Indeed, the 1Z54 and 4HBTcrystal structures reveal similar homotetrameric as-semblies, which our MKS2 model also reflects (Sup-plemental Fig. S3). The conservation of the 4HBTcatalytic Asp-17 by ShMKS2 and SlMKS2 suggeststhat they are likely also thioesterases. Moreover, theproduction of MK in E. coli cells expressing eitherallele of MKS2 is a strong indication that the heterol-ogous MKS2 enzyme may be capable of hydrolyzing(Fig. 9, step I) and perhaps also decarboxylating (Fig. 9,step II) 3-ketoacyl intermediates, analogous to thereaction catalyzed by MKS1. However, the productionof MK in E. coli expressing MKS2 is not informativewith regard to the specific substrates 3-ketoacyl-ACPsor 3-ketoacyl-CoA, because E. coli cells produce bothtypes of substrates.Proteins with high levels of identity to tomato MKS2
are found throughout the plant kingdom, but inter-estingly, all such sequences outside Solanaceae containan N-terminal extension predicted to be a plastid ormitochondrial transit sequence (Fig. 5). SlMKS2 andShMKS2 (and also a petunia [Petunia integrifolia] MKS2homolog) lack such a transit peptide, raising thepossibility that these Solanaceae proteins are not lo-calized in the plastids and that their substrates maytherefore not be 3-ketoacyl-ACPs but rather 3-ketoacyl-CoAs. The MKS2 proteins, however, do not containany other obvious subcellular targeting sequences (e.g.no obvious PTS1 or PTS2 sequences that would targetthe protein to the peroxisomes).The presence of two distinct enzymes that contrib-
ute to the production of the same compound in thesame organ, and even in the same cell, is not unpre-cedented, and such functional redundancy was re-cently reported for eugenol biosynthesis in Clarkia(Koeduka et al., 2009). In the case of MKS1 and MKS2,
however, genetic evidence for epistatic interactionsbetween the two loci suggests that they do not actindependently of each other and therefore raises somequestions. Do MKS1 and MKS2 form a complex? Ifsuch a complex is formed, does each type of subunitcarry out both reactions of thioester bond hydrolysisand decarboxylation (Fig. 9, steps I and II), or doeseach subunit catalyze only one of these reactions?
Alternatively, epistatic interactions may indicatenot a physical interaction but that they act sequentiallyin the pathway from 3-ketoacyl intermediates to MK.A closer analysis of the genetic data reveals thatalthough the two wild species alleles in MKS1 andMKS2 loci are required for the accumulation of high2TD levels in tomato, some levels are neverthelessfound in plants that carry only the MKS2 wild allele(ShMKS2) but not vice versa (Fig. 7). These resultssuggest a model for MK biosynthesis in the trichomesin which MKS2 works upstream of MKS1. By thismodel, MKS2 hydrolyzes the 3-ketoacyl intermediates(Fig. 9, step I) and a low level of spontaneous decar-boxylation (Fig. 9, step II) can occur to produce MK(Kornberg et al., 1948), a step that is sped up by MKS1when present.
A resolution between these competing hypotheseswill require a determination of the subcellular locali-zation of the MKS2 protein, whether it physicallyinteracts with MKS1 and the substrate it acts on, eitherindependently or in complex with MKS1. The resultsof these experiments may in turn require a reassess-ment of the subcellular localization of MKS1 as well asits substrate specificity.
CONCLUSION
The above results present the complex monophy-letic evolution of a specialized pathway and highlightthe power of incorporating morphological and chem-ical data for a detailed understanding of pathways thatappear to be isolated in specialized cells. The com-bined data provide a framework for determining themolecular and biochemical bases for the unexpectedrelationships between shape and content of the glan-dular trichomes. Moreover, the genetic and biochem-ical relationship between MKS1 and newly identifiedMKS2 loci highlights the major role of epistasis inter-actions in determining phenotypic variation amongpopulations and emphasizes the importance of takingit into account when dissecting the genetic basis ofcomplex phenotypes.
Figure 9. Illustration of the hydrolysis (I) anddecarboxylation (II) steps that mediate MKbiosynthesis from 3-ketoacyl intermediates. Rrepresents either ACP or CoA.
Methylketone Biosynthesis in Tomato
Plant Physiol. Vol. 151, 2009 1961 www.plant.org on November 12, 2014 - Published by www.plantphysiol.orgDownloaded from
Copyright © 2009 American Society of Plant Biologists. All rights reserved.
MATERIALS AND METHODS
Plant Material, and Interspecific F2 andBackcross Populations
Solanum lycopersicum var M82 indeterminate and Solanum habrochaites f. sp.
glabratum (PI) were obtained from the Tomato Seed Stock Center at the
University of California and from the U.S. Department of Agriculture Agri-
cultural Research Service. A single PI plant served as the male to fertilize S.
lycopersicum. The hybrids (1) were selfed to obtain the F2 population, (2)
served as the male for fertilizing M82 to obtain BC1-M82, or (3) served as the
female for a PI male to obtain BC1-PI. Seeds were sprouted in trays for 2 d in a
closed room at 25�C and 95% humidity and were then grown in an open
greenhouse for 3 weeks. Seedlings were transplanted to the greenhouse,
trellised with ropes, and grown in red loam soil with 1 m3 of water and 50 mL
of fertilizer (Shefer; ICL Fertilizer) per day. For bulk analysis, F2 plants were
propagated by cuttings using rooting powder with 0.3% indole-3-butyric acid.
Cuttings were rooted in germination trays held under spraying water for 0.5 h
twice a day.
Volatile Analysis
Six young leaflets (the first, second, and third from the first or second
leaves) were sampled into scintillation vials on ice, and volatiles were
extracted and analyzed as described by Fridman et al. (2005).
Morphology Indexes
Six young leaflets (opposite those taken for volatile analysis) were sampled
into scintillation vials, and a digital photograph of the central upper surface
was taken. Mean trichome number per square millimeter was calculated, and
trichome shape was classified as follows: wild shape (PI shape), intermediate
shape (intermediate), and cultivated-like shape (M82-like shape).
Genotyping
DNA samples were extracted from approximately 100 mg of fresh young
tomato leaves and buds following the protocol described by Murray and
Thompson (1980). See Supplemental Table S1 for PCR conditions and primers.
KASI PCR products (15 mL) were digested with 1 mL of Taq restriction enzyme
(New England Biolabs) for 1 h at 65�C in a reaction that included 2 mL of 103buffer and 10 mg of bovine serum albumin (20 mL total).
HRM Genotyping
Sequences were aligned using the Align function in the Vector NTI
software package (Invitrogen) to identify SNPs between the sequences of
the S. lycopersicum and S. habrochaites alleles. The S. habrochaites sequences
were taken from an EST library produced from the glandular trichomes of PI,
and the S. lycopersicum alleles were retrieved from the total tomato EST
repository (SOL database; http://www.sgn.cornell.edu/index.pl). Three dif-
ferent pairs of primers flanking the identified SNPs (amplicon size varied
from 60 to 100 bp per SNP) were selected for each gene using the Primer3
software (http://primer3.sourceforge.net). First, PCR was conducted with a
test panel that included the parental lines M82 and PI and their hybrid (F1).
PCR products were analyzed on an agarose gel (3%), and reactions that pro-
duced a single product with no primer dimers were selected for HRM analysis
on a Rotor-Gene 6000 (Corbett Research). Primers that showed the best allelic
discrimination by HRM examination were selected to score the genotype of
the F2 population. HRMwas performed immediately after the PCR cycles as a
single run following themanufacturer’s default parameters (see Supplemental
Table S2).
Transcriptome Analysis
Trichome isolation was performed as described by Fridman et al. (2005).
The tomato microarray design, cDNA synthesis, hybridization, and analysis
were performed by Genotypic Technology. The microarray was a complex of
44,000 probes of 25 bp each representing all of the tomato ESTs (Tomato Gene
Index; http://compbio.dfci.harvard.edu/tgi/cgi-bin/tgi/gimain.pl?gudb=
tomato). Total trichome RNA (5 mg) was labeled with Cy3 and Cy5, and
hybridization was repeated four times (two repeats for each dye swap be-
tween RNA samples) in a 4 3 44 format following the version 5.5.X protocol
for a two-color array. Results were analyzed following the GE-v5_95_Feb07
protocol (Agilent). More details can be found at the National Center for
Biotechnology Information Gene Expression Omnibus under GSE16431.
qRT-PCR
Total RNA was isolated from isolated glandular trichomes as described
previously (Fridman et al., 2005). The RNAwas subjected to DNase treatment
using a DNA-free kit (Ambion), and first-strand cDNA was synthesized by
SuperScript II reverse transcriptase (Invitrogen) with poly-T primers in
parallel with a negative control reaction in which no SuperScript II reverse
transcriptase was added. qPCR utilizing power SYBR-Green PCR master mix
(Applied Biosystems), gene-specific primers, and a dilution series of each
cDNAwas performed as described previously (Varbanova et al., 2007). qPCR
was performed using the StepOnePlus Real-Time PCR System (Applied
Biosystems), and the conditions were as follows: 95�C for 3 min, 50 cycles of
95�C for 15 s, 60�C for 30 s, and 72�C for 30 s, followed by a melting cycle of
55�C to 95�C with an increasing gradient of 0.5�C and a 10-s pause at each
temperature. All reactions were performed in triplicate, and each experiment
was repeated twice. ShMKS2 and SlMKS2 allele-specific primers were de-
signed as follows: ShMKS2 forward, 5#-GCCTATATTGGAGGCAAGAG-
GA-3#, and ShMKS2 reverse, 5#-TGTACACCGCAACTCTTCTGGT-3#;SlMKS2 forward, 5#-ATGCAAGTTATTGCCAACATGG-3#, and SlMKS2 re-
verse, 5#-GAAAAACAAACGAGCAGCTGAA-3#; ACC forward, 5#-CTGCT-
AGGAAAGCTCATCGTATGG-3#, and ACC reverse, 5#-GTGGTAGGAACTC-
CAGTGATAACG-3#; MaCoA-ACP trans forward, 5#-GAATGACGGTACGTC-
TAGCTGTTG-3#, and MaCoA-ACP trans reverse, 5#-GGTGAAGTCACCTG-
GCTAGCTAAT-3#. Actin transcript amplification was used as an internal
control, with the forward primer 5#-AACACCCTGTTCTCCTGACTGA-3#and the reverse primer 5#-AACACCATCACCAGAGTCCAAC-3#.
Sequence Analysis
Alignment of multiple protein sequences was performed using the
ClustalW program (Thompson et al., 1997).
Statistical Analysis
Statistical analyses were conducted with JMP software (SAS Institute).
Since phenotypic data of the segregating F2 and backcrossed plants did not fit
the normal distribution, they were log transformed. A nonparametric test
(Wilcoxon) was used to test the MKS1 genotype effect on 2TD levels of 221
plants under the Fit Y by X function (because of unequal variances). The
association between trichome shape and the 2TD levels was tested for 164
plants by ANOVA under the Fit Y by X function. For these two tests, the tested
factor was set as a character and the 2TD levels were continuous. Association
between the MKS1 locus genotype and trichome shape was tested in 134
plants by Pearson test for category parameters under the Fit Y by X function.
Data of 122 individuals were used for multiple regression analysis that
performed by choosing the “stepwise” option in the Fit model function, and
the “forward” direction was used for building the final regression model. All
factors included in the analysis were set as continuous. Power was calculated
with G*Power 3.1.0 software (Faul et al. 2007). Regression analysis, including
the MKS1 and MKS2 interaction, was performed by replacing these two
singular factors with a new factor representing the haplotype at those loci.
Interactions between genes were tested by two-way ANOVA under the Fit
model function.
Isolation of Full-Length ShMKS2 and SlMKS2 cDNAsand Expression in Escherichia coli
The following primers were used to amplify the full ORF of MKS2 from PI
(ShMKS2) or M82 (SlMKS2) leaf cDNA into the TA cloning vector (pCRT7/CT
TOPO-TA; Invitrogen): forward, 5#-ATGAGTGATCAGGTCTATCACC-3#; re-verse, 5#-CTCTTGATCTGGAAGCTTGA-3#. The sequences of these cDNAs
were verified and transferred into the E. coli expression vector pET28
(Novagene). The pET28 vectors carrying ShMKS2 or SlMKS2 were mobilized
into E. coli BL21(DES) cells, and gene expression was induced by the addition
of 2 mM IPTG after the culture optical density at 595 nm value had reached 0.6
Ben-Israel et al.
1962 Plant Physiol. Vol. 151, 2009 www.plant.org on November 12, 2014 - Published by www.plantphysiol.orgDownloaded from
Copyright © 2009 American Society of Plant Biologists. All rights reserved.
to 0.7. After IPTG addition, ShMKS2- and SlMKS2-expressing bacterial cells
were grown at 30�C or 18�C overnight.
Headspace Analysis of Spent Media of E. coli CulturesExpressing ShMKS2 and SlMKS2
After induction with IPTG and growth overnight, 1 mL of culture was
placed in a glass vial at 42�C. The vial was capped with a screw cap in which a
small hole had been bored. The needle of a solid-phase microextraction device
was inserted into the vial through the hole in the cap and the fiber was
extended for 30 min for volatile collection, after which the fiber was with-
drawn and then injected into the GC device. GC-MS analysis was performed
as described previously (Fridman et al., 2005). Labeled peaks in Figure 8 were
identified by comparison of retention time and MS of authentic standards
(MK) or MS and Kovac indices (alcohols).
Homology Modeling
The MKS2 homology model was constructed using MODELLER (Sali
and Blundell, 1993), and the illustration was prepared using MOLSCRIPT
(Kraulis, 1991), with final rendering by POV-Ray (Persistence of Vision Ray
tracer; available at www.povray.org).
Sequence data from this article have been deposited with the GenBank
data library under the following accession numbers: ShMKS2 from S.
habrochaites f. sp. glabratum (accession PI126449), EU883793; ShMKS2 from S.
lycopersicum (var M82), EU908050. The Gene Expression Omnibus accession
number for raw microarray data and platform description is GSE16431.
Supplemental Data
The following materials are available in the online version of this article.
Supplemental Figure S1. Markers developed for the candidate genes in
the MK pathway and genotyping of an interspecific F2 population.
Supplemental Figure S2. Genetic mapping using Solanum pennellii intro-
gression lines (ILs) with the HRM technology.
Supplemental Figure S3.Homology model of tomato MKS2 templated on
the structure of a putative thioesterase from Thermus thermophilus (PDB
code 1Z54).
Supplemental Table S1. Primers and PCR conditions.
Supplemental Table S2. Primers and HRM conditions.
ACKNOWLEDGMENTS
We thank Dr. Raja Mugasimangalam and Rohit Shukla (Genotypic Tech-
nology, Bangalore, India) for their valuable help in designing and performing
the microarray experiments. The technical help of Orly Oren, Leah Zucker,
Dorit Fink, and Shula Blum (Robert H. Smith Institute of Plant Sciences and
Genetics in Agriculture, Hebrew University of Jerusalem, Rehovot) is greatly
appreciated.
Received August 20, 2009; accepted September 29, 2009; published October 2,
2009.
LITERATURE CITED
Antonious GF (2001) Production and quantification of methyl ketones in
wild tomato accessions. J Environ Sci Health B 36: 835–848
Bird D, Beisson F, Brigham A, Shin J, Greer S, Jetter R, Kunst L, Wu XW,
Yephremov A, Samuels L (2007) Characterization of Arabidopsis
ABCG11/WBC11, an ATP binding cassette (ABC) transporter that is
required for cuticular lipid secretion. Plant J 52: 485–498
Dillon SC, Bateman A (2004) The Hotdog fold: wrapping up a superfamily
of thioesterases and dehydratases. BMC Bioinformatics 5: 109
Efremova N, Schreiber L, Bar S, Heidmann I, Huijser P, Wellesen K,
Schwarz-Sommer Z, Saedler H, Yephremov A (2004) Functional con-
servation and maintenance of expression pattern of FIDDLEHEAD-like
genes in Arabidopsis and Antirrhinum. Plant Mol Biol 56: 821–837
Ehrlich PR, Raven PH (1964) Butterflies and plants: a study in coevolution.
Evolution 18: 586–608
Eshed Y, Zamir D (1995) An introgression line population of Lycopersicon
pennellii in the cultivated tomato enables the identification and fine
mapping of yield-associated QTL. Genetics 141: 1147–1162
Faul F, Erdfelder E, Lang AG, Buchner A (2007) G*Power 3: a flexible
statistical power analysis program for the social, behavioral, and bio-
medical sciences. Behav Res Methods 39: 175–191
Fridman E, Koezuka T, Auldridge M, Austin MB, Noel JP, Pichersky E
(2006) Tomato glandular trichomes as a model system for exploring
evolution of specialized metabolism in a single cell. Recent Adv
Phytochem 40: 115–130
Fridman E, Wang J, Iijima Y, Froehlich JE, Gang DR, Ohlrogge J,
Pichersky E (2005) Metabolic, genomic, and biochemical analyses of
glandular trichomes from the wild tomato species Lycopersicon hirsutum
identify a key enzyme in the biosynthesis of methylketones. Plant Cell
17: 1252–1267
Gang DR, Wang JH, Dudareva N, Nam KH, Simon JE, Lewinsohn E,
Pichersky E (2001) An investigation of the storage and biosynthesis of
phenylpropenes in sweet basil. Plant Physiol 125: 539–555
Gershenzon J, McCaskill D, Rajaonarivony JI, Mihaliak C, Karp F,
Croteau R (1992) Isolation of secretory cells from plant glandular
trichomes and their use in biosynthetic studies of monoterpenes and
other gland products. Anal Biochem 200: 130–138
Ghangas GS, Steffens JC (1993) UDPglucose: fatty acid transglucosylation
and transacylation in triacylglucose biosynthesis. Proc Natl Acad Sci
USA 90: 9911–9915
Hotelier T, Renault L, Cousin X, Negre V, Marchot P, Chatonnet A (2004)
ESTHER, the database of the alpha/beta-hydrolase fold superfamily of
proteins. Nucleic Acids Res 32: D145–D147
Jetter R, Kunst L (2008) Plant surface lipid biosynthetic pathways and their
utility for metabolic engineering of waxes and hydrocarbon biofuels.
Plant J 54: 670–683
Koeduka T, Orlova I, Baiga TJ, Noel JP, Dudareva N, Pichersky E (2009)
The lack of floral synthesis and emission of isoeugenol in Petunia
axillaris subsp. parodii is due to a mutation in the isoeugenol synthase
gene. Plant J 58: 961–969
Kornberg A, Ochoa S, Mehler AH (1948) Spectrophotometric studies on
the decarboxylation of beta-keto acids. J Biol Chem 174: 159–172
Kraulis PJ (1991) MOLSCRIPT: a program to produce both detailed and
schematic plots of protein structures. J Appl Cryst 24: 946–950
Liu YS, Zamir D (1999) Second generation L. pennellii introgression lines
and the concept of bin mapping. Tomato Genet Coop 49: 26–30
Mayer KM, Shanklin J (2005) A structural model of the plant acyl-acyl
carrier protein thioesterase FatB comprises two helix/4-stranded sheet
domains, the N-terminal domain containing residues that affect spec-
ificity and the C-terminal domain containing catalytic residues. J Biol
Chem 280: 3621–3627
Michelmore RW, Paran I, Kesseli RV (1991) Identification of markers
linked to disease-resistance genes by bulked segregant analysis: a rapid
method to detect markers in specific genomic regions by using segre-
gating populations. Proc Natl Acad Sci USA 88: 9828–9832
Murray MG, Thompson WF (1980) Rapid isolation of high molecular
weight plant DNA. Nucleic Acids Res 8: 4321–4325
Nagel J, Culley LK, Lu YP, Liu EW, Matthews PD, Stevens JF, Page JE
(2008) EST analysis of hop glandular trichomes identifies an O-methyl-
transferase that catalyzes the biosynthesis of xanthohumol. Plant Cell
20: 186–200
Sali A, Blundell TL (1993) Comparative protein modelling by satisfaction
of spatial restraints. J Mol Biol 234: 779–815
Schilmiller AL, Last RL, Pichersky E (2008) Harnessing plant trichome
biochemistry for the production of useful compounds. Plant J 54:
702–711
Sinha N, Lynch M (1998) Fused organs in the adherent1 mutation in maize
show altered epidermal walls with no perturbations in tissue identities.
Planta 206: 184–195
Snyder JC, Carter CD (1985) Trichomes on leaves of Lycopersicon hirsutum,
Lycopersicon esculentum and their hybrids. Euphytica 34: 53–64
Thompson JD, Gibson TJ, Plewniak F, Jeanmougin F, Higgins DG (1997)
The CLUSTAL_X Windows interface: flexible strategies for multiple
Methylketone Biosynthesis in Tomato
Plant Physiol. Vol. 151, 2009 1963 www.plant.org on November 12, 2014 - Published by www.plantphysiol.orgDownloaded from
Copyright © 2009 American Society of Plant Biologists. All rights reserved.

sequence alignment aided by quality analysis tools. Nucleic Acids Res
25: 4876–4882
van Der Hoeven RS, Monforte AJ, Breeden D, Tanksley SD, Steffens JC
(2000) Genetic control and evolution of sesquiterpene biosynthesis in
Lycopersicon esculentum and L. hirsutum. Plant Cell 12: 2283–2294
van Schie CCN, Haring MA, Schuurink RC (2007) Tomato linalool
synthase is induced in trichomes by jasmonic acid. Plant Mol Biol 64:
251–263
Varbanova M, Yamaguchi S, Yang Y, McKelvey K, Hanada A, Borochov R,
Yu F, Jikumaru Y, Ross J, Cortes D, et al (2007) Methylation of
gibberellins by Arabidopsis GAMT1 and GAMT2. Plant Cell 19: 32–45
Wagner GJ, Wang E, Shepherd RW (2004) New approaches for studying
and exploiting an old protuberance, the plant trichome. Ann Bot (Lond)
93: 3–11
Werker E (2000) Trichome diversity and development. Adv Bot Res 31: 1–35
Williams WG, Kennedy GG, Yamamoto RT, Thacker JD, Bordner J (1980)
2-Tridecanone: naturally-occurring insecticide from the wild tomato
Lycopersicon hirsutum f glabratum. Science 207: 888–889
Xie Z, Kapteyn J, Gang DR (2008) A systems biology investigation of the
MEP/terpenoid and shikimate/phenylpropanoid pathways points to
multiple levels of metabolic control in sweet basil glandular trichomes.
Plant J 54: 349–361
Zamir D, Selilaben-David T, Rudich J, Juvik JA (1984) Frequency-
distributions and linkage relationships of 2-tridecadone in interspecific
segregating generations of tomato. Euphytica 33: 481–488
Zuriaga E, Blanca J, Nuez F (2008) Classification and phylogenetic rela-
tionships in Solanum section Lycopersicon based on AFLP and two
nuclear gene sequences. Genet Resour Crop Evol 56: 663–678
Ben-Israel et al.
1964 Plant Physiol. Vol. 151, 2009 www.plant.org on November 12, 2014 - Published by www.plantphysiol.orgDownloaded from
Copyright © 2009 American Society of Plant Biologists. All rights reserved.
Copyright © 2022 FDOKUMEN


![Biochemical acclimation, stomatal limitation and precipitationpatterns underlie decreases in photosynthetic stimulation of soybean(Glycine max) at elevated [CO2] and temperatures under](https://static.fdokumen.com/doc/165x107/631fe62c02108aeec703411e/biochemical-acclimation-stomatal-limitation-and-precipitationpatterns-underlie.jpg)