Subtle metabolic and liver gene transcriptional changes underlie diet-induced fatty liver...
13
ARTICLE Subtle metabolic and liver gene transcriptional changes underlie diet-induced fatty liver susceptibility in insulin-resistant mice A. A. Toye & M. E. Dumas & C. Blancher & A. R. Rothwell & J. F. Fearnside & S. P. Wilder & M. T. Bihoreau & O. Cloarec & I. Azzouzi & S. Young & R. H. Barton & E. Holmes & M. I. McCarthy & R. Tatoud & J. K. Nicholson & J. Scott & D. Gauguier Received: 5 February 2007 / Accepted: 24 May 2007 / Published online: 6 July 2007 # Springer-Verlag 2007 Abstract Aims/hypothesis Complex changes in gene expression are associated with insulin resistance and non-alcoholic fatty liver disease (NAFLD) promoted by feeding a high-fat diet (HFD). We used functional genomic technologies to document molecular mechanisms associated with diet- induced NAFLD. Materials and Methods Male 129S6 mice were fed a diet containing 40% fat (high-fat diet, HFD) for 15 weeks. Glucose tolerance, in vivo insulin secretion, plasma lipid profile and adiposity were determined. Plasma metabonomics and liver transcriptomics were used to identify changes in gene expression associated with HFD-induced NAFLD. Results In HFD-fed mice, NAFLD and impaired glucose and lipid homeostasis were associated with increased hepatic transcription of genes involved in fatty acid uptake, intracellular transport, modification and elongation, whilst genes involved in beta-oxidation and lipoprotein secretion were, paradoxically, also upregulated. NAFLD developed despite strong and sustained downregulation of transcrip- tion of the gene encoding stearoyl-coenzyme A desaturase 1(Scd1) and uncoordinated regulation of transcription of Scd1 and the gene encoding sterol regulatory element binding factor 1c (Srebf1c) transcription. Inflammatory mechanisms appeared to be stimulated by HFD. Conclusions/interpretation Our results provide an accurate representation of subtle changes in metabolic and gene expression regulation underlying disease-promoting and compensatory mechanisms, collectively contributing to diet- induced insulin resistance and NAFLD. They suggest that proposed models of NAFLD pathogenesis can be enriched with novel diet-reactive genes and disease mechanisms. Keywords Gene transcription . Genome . Insulin resistance . High-fat diet . Metabonomics . NMR spectroscopy . Transcriptomics Abbreviations CD carbohydrate diet EST expressed sequence tag HFD high-fat diet IPA ingenuity systems pathway knowledge base analysis IPGTT intraperitoneal glucose tolerance test Diabetologia (2007) 50:1867–1879 DOI 10.1007/s00125-007-0738-5 Electronic supplementary material The online version of this article (doi:10.1007/s00125-007-0738-5) contains supplementary material, which is available to authorised users. A. A. Toye : C. Blancher : A. R. Rothwell : J. F. Fearnside : S. P. Wilder : M. T. Bihoreau : I. Azzouzi : S. Young : M. I. McCarthy : D. Gauguier (*) The Wellcome Trust Centre for Human Genetics, University of Oxford, Roosevelt Drive, Oxford OX3 7BN, UK e-mail: [email protected] M. E. Dumas : O. Cloarec : R. H. Barton : E. Holmes : J. K. Nicholson Department of Biomolecular Medicine, Division of Surgery, Oncology, Reproductive Biology and Anaesthetics, Faculty of Medicine, Imperial College London, London, UK R. Tatoud : J. Scott Faculty of Medicine, Imperial College London, London, UK
-
Upload
independent -
Category
Documents
-
view
1 -
download
0
Transcript of Subtle metabolic and liver gene transcriptional changes underlie diet-induced fatty liver...

ARTICLE
Subtle metabolic and liver gene transcriptional changesunderlie diet-induced fatty liver susceptibilityin insulin-resistant mice
A. A. Toye & M. E. Dumas & C. Blancher &
A. R. Rothwell & J. F. Fearnside & S. P. Wilder &
M. T. Bihoreau & O. Cloarec & I. Azzouzi & S. Young &
R. H. Barton & E. Holmes & M. I. McCarthy & R. Tatoud &
J. K. Nicholson & J. Scott & D. Gauguier
Received: 5 February 2007 /Accepted: 24 May 2007 /Published online: 6 July 2007# Springer-Verlag 2007
AbstractAims/hypothesis Complex changes in gene expression areassociated with insulin resistance and non-alcoholic fattyliver disease (NAFLD) promoted by feeding a high-fat diet(HFD). We used functional genomic technologies todocument molecular mechanisms associated with diet-induced NAFLD.Materials and Methods Male 129S6 mice were fed a dietcontaining 40% fat (high-fat diet, HFD) for 15 weeks.Glucose tolerance, in vivo insulin secretion, plasma lipidprofile and adiposity were determined. Plasma metabonomicsand liver transcriptomics were used to identify changes in
gene expression associated with HFD-induced NAFLD.Results In HFD-fed mice, NAFLD and impaired glucoseand lipid homeostasis were associated with increasedhepatic transcription of genes involved in fatty acid uptake,intracellular transport, modification and elongation, whilstgenes involved in beta-oxidation and lipoprotein secretionwere, paradoxically, also upregulated. NAFLD developeddespite strong and sustained downregulation of transcrip-tion of the gene encoding stearoyl-coenzyme A desaturase1 (Scd1) and uncoordinated regulation of transcription ofScd1 and the gene encoding sterol regulatory elementbinding factor 1c (Srebf1c) transcription. Inflammatorymechanisms appeared to be stimulated by HFD.Conclusions/interpretation Our results provide an accuraterepresentation of subtle changes in metabolic and geneexpression regulation underlying disease-promoting andcompensatory mechanisms, collectively contributing to diet-induced insulin resistance and NAFLD. They suggest thatproposed models of NAFLD pathogenesis can be enrichedwith novel diet-reactive genes and disease mechanisms.
Keywords Gene transcription . Genome .
Insulin resistance . High-fat diet . Metabonomics .
NMR spectroscopy . Transcriptomics
AbbreviationsCD carbohydrate dietEST expressed sequence tagHFD high-fat dietIPA ingenuity systems pathway knowledge base
analysisIPGTT intraperitoneal glucose tolerance test
Diabetologia (2007) 50:1867–1879DOI 10.1007/s00125-007-0738-5
Electronic supplementary material The online version of this article(doi:10.1007/s00125-007-0738-5) contains supplementary material,which is available to authorised users.
A. A. Toye :C. Blancher :A. R. Rothwell : J. F. Fearnside :S. P. Wilder :M. T. Bihoreau : I. Azzouzi : S. Young :M. I. McCarthy :D. Gauguier (*)The Wellcome Trust Centre for Human Genetics,University of Oxford,Roosevelt Drive,Oxford OX3 7BN, UKe-mail: [email protected]
M. E. Dumas :O. Cloarec :R. H. Barton : E. Holmes :J. K. NicholsonDepartment of Biomolecular Medicine, Division of Surgery,Oncology, Reproductive Biology and Anaesthetics,Faculty of Medicine, Imperial College London,London, UK
R. Tatoud : J. ScottFaculty of Medicine, Imperial College London,London, UK

IRI immunoreactive insulinNAFLD non-alcoholic fatty liver diseasePUFA polyunsaturated fatty acidSCD1 stearoyl-coenzyme A desaturase 1SREBF1C sterol regulatory element binding factor 1c
Introduction
The increasing incidence of type 2 diabetes mellitus andobesity is paralleled by a progression in a wide spectrum ofclinical conditions often associated with insulin resistance.Non-alcoholic fatty liver disease (NAFLD) is the mostcommon liver disease associated with insulin resistance [1,2]. Genetic and environmental factors, including dietaryexcess and inadequate exercise, contribute to NAFLDeither directly or indirectly through inter-organ hormonalor metabolic signalling events [3, 4].
A composite description of molecular mechanismsassociated with liver triacylglycerol accumulation, e.g.increased fatty acid uptake and synthesis and reduced fattyacid beta-oxidation and export, is emerging from clinicaland experimental data [5]. Progress in gene expressionprofiling technologies and genome functional annotationscan help improve knowledge of NAFLD-associatedmarkers. Functional genomic tools, including transcriptomicsand metabonomics, a technology designed to quantifymetabolites in biological samples [6], generate high-densitydata sets underlying disease-related mechanisms at eitherend of the regulation of gene expression. Alterations intranscription regulation of hepatic carbohydrate and lipo-genic pathways have a central role in mechanismscontributing to insulin resistance and NAFLD [7, 8].
Owing to the complex aetiology and pathogenesis ofdiabetes and obesity and ethical issues in relation togenomic investigations in patients and controls, rodentmodels are important tools for studying human diseaseconditions in controlled genetic and environmental situa-tions [9]. Feeding rodents a high-fat diet (HFD) provides anefficient system for consistently promoting obesity, insulinresistance and NAFLD in the vast majority of strains [10,11], even after short periods of fat feeding [12]. We andothers have shown that 129S6 mice are susceptible to HFD-induced diabetes, obesity and fatty liver and that themolecular mechanisms involved are multifaceted [13, 14].
Here we report the detailed characterisation of physio-logical, metabolic and liver transcriptional responses toprolonged HFD feeding in 129S6 mice. Upregulatedexpression of genes involved in fatty acid uptake, intracel-lular transport, modification and elongation in response toHFD contributes to NAFLD despite enhanced expression ofgenes involved in beta-oxidation and lipoprotein secretion.
These results indicate that mice susceptible to experimen-tally induced obesity and NAFLD adapt to HFD feedingwith a complex pattern of transcriptional changes, whichprobably involve disease-causative mechanisms and sec-ondary hepatic adaptations to obesity, glucose intolerance,hyperinsulinaemia and hyperlipidaemia.
Materials and Methods
Animals Male mice from the 129S6/SvEv and BALB/cinbred strains were used. Mice were weaned at 3 weeks ofage and housed in groups of ten. Mice were maintained ona 12-h light and dark cycle and fed ad libitum a standardcarbohydrate (CD) chow (ERB, Witham, UK) from wean-ing. At 5 weeks of age, one group of mice was transferredto an HFD (Special Diets Services, Witham, UK), contain-ing 32% lard oil and 8% corn oil. A separate age-matchedgroup remained on the CD. All procedures were carried outin accordance with national license conditions.
Intraperitoneal glucose tolerance test At 5 months 129S6mice were fasted overnight and subjected to a simplifiedintraperitoneal glucose tolerance test (IPGTT) as previouslydescribed [15]. Mice were anaesthetised by i.p. injection ofsodium pentobarbital (Sagatal; Rhône Mérieux, Harlow,UK) and injected i.p. with a single dose of 2 g glucose/kgbody weight. Blood samples were collected before glucoseinjection and 15, 30 and 75 min afterwards. Blood glucoseconcentrations were determined immediately using aglucose meter (Accucheck; Roche Diagnostics, WelwynGarden City, UK). Blood samples were centrifuged andplasma was collected for insulin assays. Cumulativeglycaemia (CumG) and insulinaemia (CumIRI; IRI isimmunoreactive insulin) were calculated as the incrementof the values of plasma glucose and insulin, respectively,during the IPGTT. Glucose-induced insulin secretion wascalculated as the insulinogenic index (ΔIRI/ΔG), which isthe ratio of incremental plasma insulin values abovebaseline, integrated over 75 min after glucose injection(ΔIRI), to the corresponding incremental plasma glucosevalues (ΔG) integrated over the same period.
Tissue sampling Mice were allowed to recover for 4 daysafter the IPGTT. They were separately housed inmetabolic cages for one night to determine food consump-tion. Body weight (BW) and length (BL) (distance fromthe tip of the nose to the base of the tail) weredetermined and BMI was calculated as BW/BL2. Follow-ing an overnight fast, mice were killed by cerebraldislocation and cardiac puncture. Blood was centrifugedand plasma was removed for lipid assay and metabonomicprofiling. Heart, brown fat, and epididymal and retroperi-
1868 Diabetologia (2007) 50:1867–1879
toneal white fat pads were dissected and weighed. Adipos-ity index was calculated as the ratio between epididymal orretroperitoneal fat weight and body weight. Liver sampleswere snap-frozen in liquid nitrogen and stored at −80°C forRNA preparation. A similar procedure was applied tocollect blood and organs from 129S6 mice maintained onan HFD for 3, 7 and 23 weeks, and from age-matched CD-fed controls.
Analytical assays Plasma IRI was determined using anELISA kit (Mercodia, Uppsala, Sweden). Plasma lipidswere measured using colorimetric detection assays (ABXDiagnostics, Shefford, UK) on a COBAS MIRA clinicalchemistry analyser (ABX Diagnostics).
1H-NMR spectroscopy of mouse plasma 1H-NMR spectraof individual mice were acquired at 600.22 MHz on aBruker Avance-600 spectrometer (Bruker, Coventry, UK)using a 100 μl plasma aliquot. Standard monodimensionalspectra were acquired using a selective presaturation pulsesequence for water signal suppression as described else-where [16]. For each acquisition, 128 transient-free induc-tion decays (FID) were collected into 32,768 data pointsusing a spectral width of 20 ppm. The FIDs wereconvoluted with an exponential weighting functioncorresponding to a line broadening of 0.3 Hz before Fouriertransform. The acquired NMR spectra were corrected forphase and baseline distortions using in-house software andreferenced to glucose α-anomeric signal (δ5.23) [16]. The1H-NMR spectra were imported as full-spectrum data [17].To remove the effects of variation in the suppression ofthe water resonance, the region (δ4.5–5.0) was discarded. Thedata were normalised using noise variance normalisation. Thefinal data set was then mean-centred prior to analysis [17].
RNA preparation Total RNA was extracted from frozenliver using Trizol reagent (Invitrogen Life Technologies,Paisley, UK) and cleaned with RNeasy columns (Qiagen,Crawley, UK). RNA concentrations and integrity wereassessed using an Agilent 2100 Bioanalyser (AgilentTechnologies, Waldbronn, Germany).
Array hybridisation and scanning Gene transcription pro-filing was carried out using Affymetrix expression arraysU430A and B (Affymetrix UK, High Wycombe, UK),which contain 22,690 (U430A) and 22,576 (U430B) probesets, allowing the interrogation of the transcription level of13 250 (U430A) and 7577 (U430B) independent gene andexpressed sequence tag (EST) sequences. Hybridisationwas carried out following cDNA synthesis and biotin-labelled cRNA synthesis was performed using 10 μg oftotal RNA from each liver sample. cRNA concentrationsand integrity were assessed using an Agilent 2100
Bioanalyser. Biotinylated cRNAs were fragmented andindividually hybridised in an Affymetrix oven to the arrays.Washing and staining procedures were performed in anAffymetrix Fluidics Station 450. Arrays were scanned at560 nm using an Agilent array scanner (Affymetrix UK). Allmicroarray experiments were compliant with MIAME (Min-imum Information about a Microarray Experiment) and bothprotocols and data are publicly available through the ArrayEx-press repository (http://www.ebi.ac.uk/arrayexpress/, lastaccessed in June 2007) under the accession E-MEXP-893.
Statistical analysis of microarray data Microarray datawere obtained from liver samples of 12 mice (six from eachgroup). Analysis of the Affymetrix. CEL file data wasperformed using the Bioconductor packages in the Rlanguage and environment. The U430A and B chips werenormalised separately. The analysis of significant differ-ences between test groups for each probe set was alsoperformed separately for each chip data set. Gene chip datawere normalised by RMA quantile normalisation [18]. Weused the RMA expression index, ignoring mismatch (MM)values for background correction, even though the methodmay underestimate transcription ratio values. A linearmodel for microarray data (LIMMA) was used to calculatesignificant differences between groups. To correct formultiple testing, we used the false discovery rate [19],which provides a measure of the number false positives fora given t statistic level.
Pathways and biological network analyses To assess thesignificance of difference in expression of gene categoriesbetween fat-fed and control mice, array-wide false discov-ery probability was derived from analysis of 1,000 falsedata sets, each created by permuting the class labels (GO orKEGG term) among the probe sets. Data are presented assignificantly differentially expressed GO and KEGG geneclusters (chip-wide p<0.05) or not significant. Ingenuitysystems pathway knowledge base analysis (IPA) (IngenuitySystems, Mountain View, CA, USA) was used to identifyknown biological networks and pathways associated withgene expression differences in response to HFD.
Quantitative real-time PCR Assays were performed on aRotor-Gene 3000 system (Corbett Research, Milton, UK)using the QuantiTect SYBR Green PCR kit (Qiagen).Analysis was performed using the standard curve method(Rotor-Gene Software 5.0.47; Corbett Research, Milton,UK). This software allowed further verification that a singlePCR product signal was quantified. Gene expression wasnormalised against the expression of beta actin. Experi-ments were performed in duplicate with samples preparedfrom six animals per group. Statistical significance wasdetermined by the two-tailed independent sample t test.
Diabetologia (2007) 50:1867–1879 1869
Statistical analysis of 1H NMR data Orthogonal partialleast squares discriminant analysis (O-PLS-DA) allowsenhanced focus on diet-related variation whilst minimisingother biological/analytical variation. The two experimentalgroups were modelled using the O-PLS algorithm, whichderives from the PLS regression method, as describedpreviously [14, 17]. The method was also applied todetermine global metabolic changes derived from plasma1H NMR data in response to short-term and prolonged fatfeeding in 129S6 mice. Further details of standard O-PLSimplementation in metabonomics have been given previously[17, 20].
Results
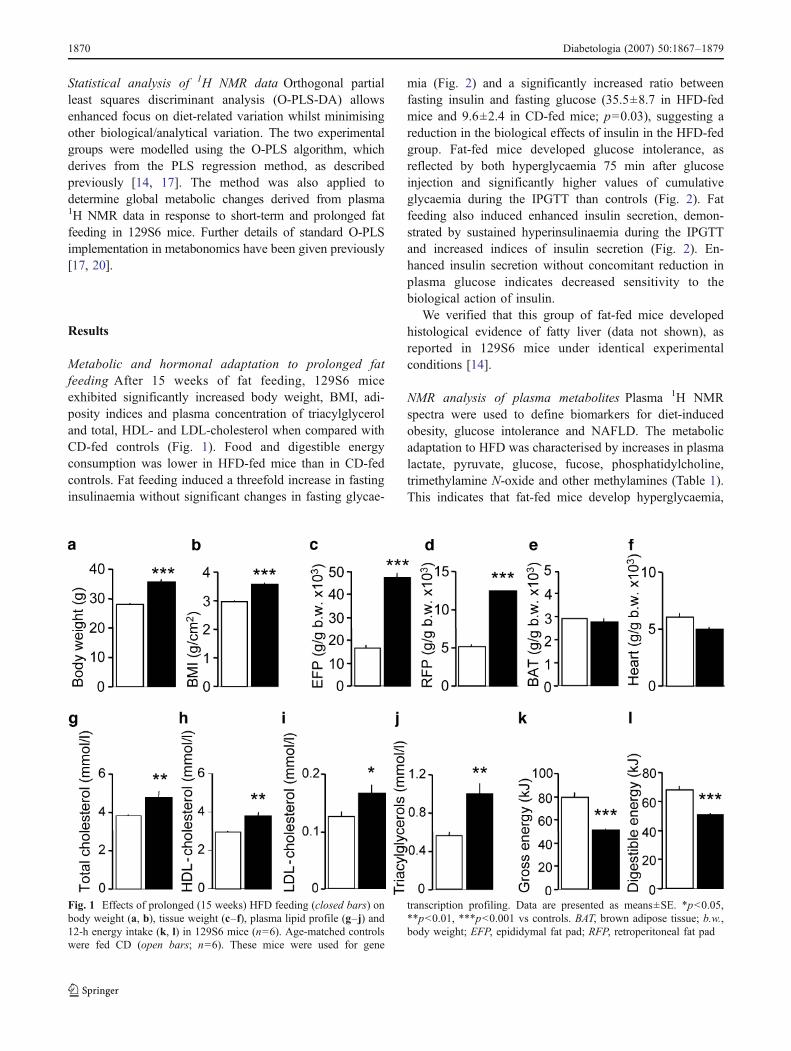
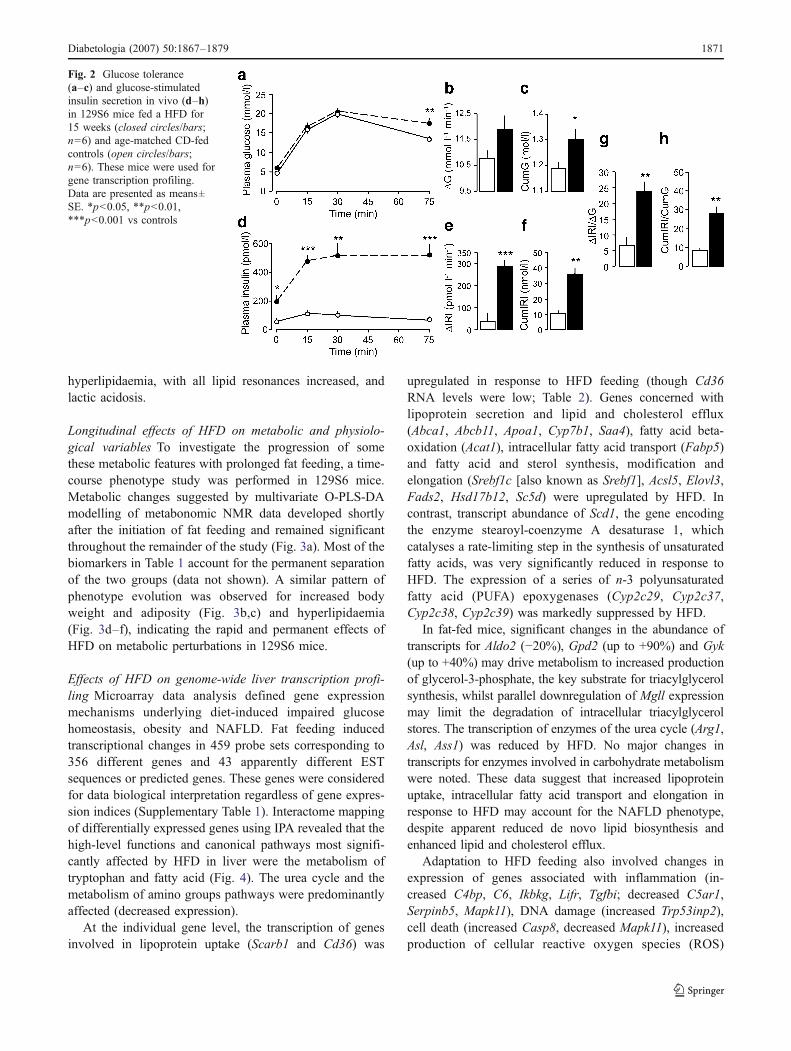
Metabolic and hormonal adaptation to prolonged fatfeeding After 15 weeks of fat feeding, 129S6 miceexhibited significantly increased body weight, BMI, adi-posity indices and plasma concentration of triacylglyceroland total, HDL- and LDL-cholesterol when compared withCD-fed controls (Fig. 1). Food and digestible energyconsumption was lower in HFD-fed mice than in CD-fedcontrols. Fat feeding induced a threefold increase in fastinginsulinaemia without significant changes in fasting glycae-
mia (Fig. 2) and a significantly increased ratio betweenfasting insulin and fasting glucose (35.5±8.7 in HFD-fedmice and 9.6±2.4 in CD-fed mice; p=0.03), suggesting areduction in the biological effects of insulin in the HFD-fedgroup. Fat-fed mice developed glucose intolerance, asreflected by both hyperglycaemia 75 min after glucoseinjection and significantly higher values of cumulativeglycaemia during the IPGTT than controls (Fig. 2). Fatfeeding also induced enhanced insulin secretion, demon-strated by sustained hyperinsulinaemia during the IPGTTand increased indices of insulin secretion (Fig. 2). En-hanced insulin secretion without concomitant reduction inplasma glucose indicates decreased sensitivity to thebiological action of insulin.
We verified that this group of fat-fed mice developedhistological evidence of fatty liver (data not shown), asreported in 129S6 mice under identical experimentalconditions [14].
NMR analysis of plasma metabolites Plasma 1H NMRspectra were used to define biomarkers for diet-inducedobesity, glucose intolerance and NAFLD. The metabolicadaptation to HFD was characterised by increases in plasmalactate, pyruvate, glucose, fucose, phosphatidylcholine,trimethylamine N-oxide and other methylamines (Table 1).This indicates that fat-fed mice develop hyperglycaemia,
Fig. 1 Effects of prolonged (15 weeks) HFD feeding (closed bars) onbody weight (a, b), tissue weight (c–f), plasma lipid profile (g–j) and12-h energy intake (k, l) in 129S6 mice (n=6). Age-matched controlswere fed CD (open bars; n=6). These mice were used for gene
transcription profiling. Data are presented as means±SE. *p<0.05,**p<0.01, ***p<0.001 vs controls. BAT, brown adipose tissue; b.w.,body weight; EFP, epididymal fat pad; RFP, retroperitoneal fat pad
1870 Diabetologia (2007) 50:1867–1879
hyperlipidaemia, with all lipid resonances increased, andlactic acidosis.
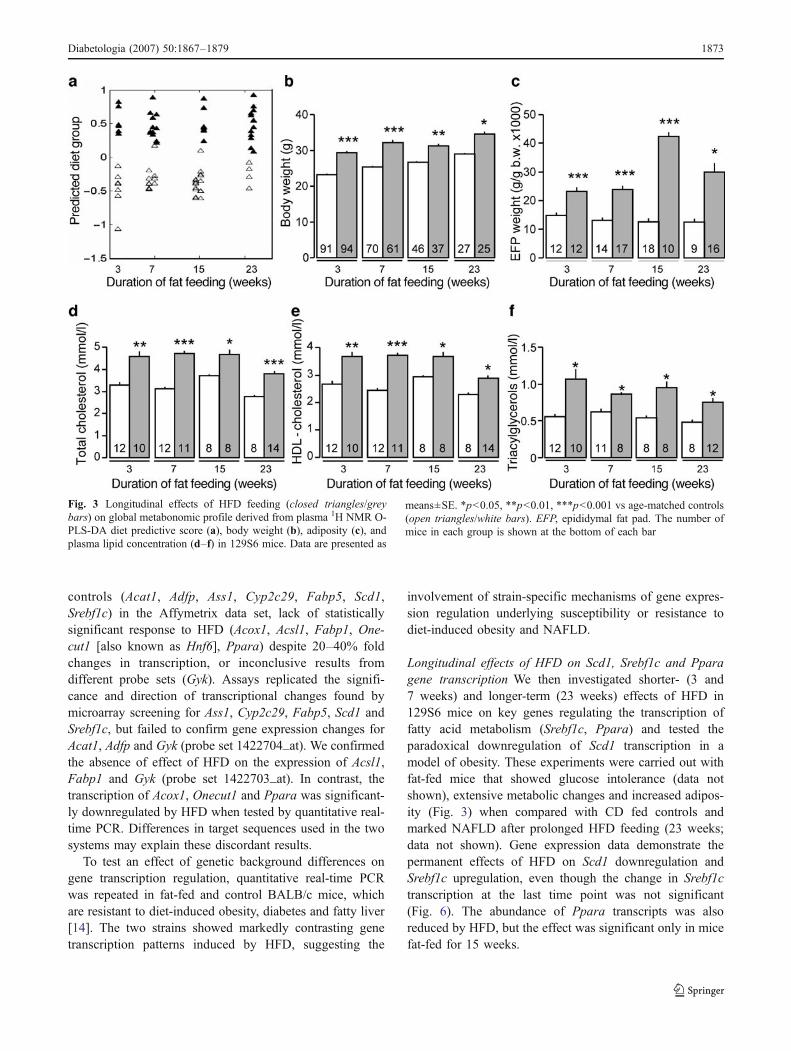
Longitudinal effects of HFD on metabolic and physiolo-gical variables To investigate the progression of somethese metabolic features with prolonged fat feeding, a time-course phenotype study was performed in 129S6 mice.Metabolic changes suggested by multivariate O-PLS-DAmodelling of metabonomic NMR data developed shortlyafter the initiation of fat feeding and remained significantthroughout the remainder of the study (Fig. 3a). Most of thebiomarkers in Table 1 account for the permanent separationof the two groups (data not shown). A similar pattern ofphenotype evolution was observed for increased bodyweight and adiposity (Fig. 3b,c) and hyperlipidaemia(Fig. 3d–f), indicating the rapid and permanent effects ofHFD on metabolic perturbations in 129S6 mice.
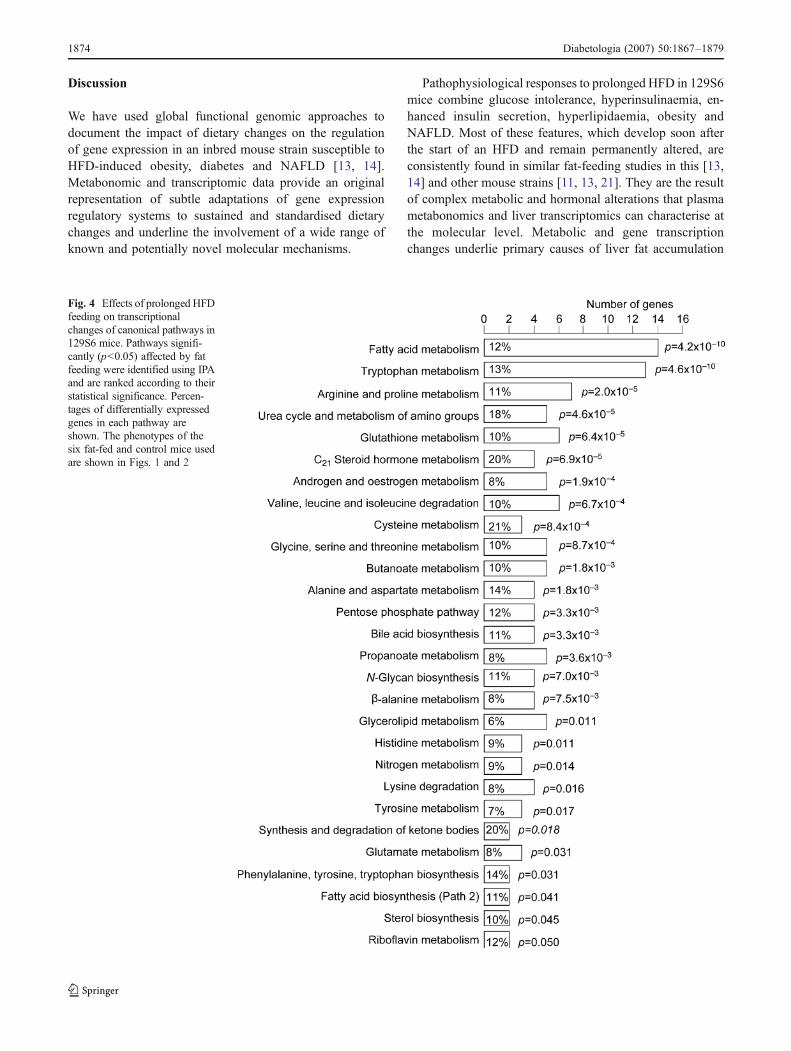
Effects of HFD on genome-wide liver transcription profi-ling Microarray data analysis defined gene expressionmechanisms underlying diet-induced impaired glucosehomeostasis, obesity and NAFLD. Fat feeding inducedtranscriptional changes in 459 probe sets corresponding to356 different genes and 43 apparently different ESTsequences or predicted genes. These genes were consideredfor data biological interpretation regardless of gene expres-sion indices (Supplementary Table 1). Interactome mappingof differentially expressed genes using IPA revealed that thehigh-level functions and canonical pathways most signifi-cantly affected by HFD in liver were the metabolism oftryptophan and fatty acid (Fig. 4). The urea cycle and themetabolism of amino groups pathways were predominantlyaffected (decreased expression).
At the individual gene level, the transcription of genesinvolved in lipoprotein uptake (Scarb1 and Cd36) was
upregulated in response to HFD feeding (though Cd36RNA levels were low; Table 2). Genes concerned withlipoprotein secretion and lipid and cholesterol efflux(Abca1, Abcb11, Apoa1, Cyp7b1, Saa4), fatty acid beta-oxidation (Acat1), intracellular fatty acid transport (Fabp5)and fatty acid and sterol synthesis, modification andelongation (Srebf1c [also known as Srebf1], Acsl5, Elovl3,Fads2, Hsd17b12, Sc5d) were upregulated by HFD. Incontrast, transcript abundance of Scd1, the gene encodingthe enzyme stearoyl-coenzyme A desaturase 1, whichcatalyses a rate-limiting step in the synthesis of unsaturatedfatty acids, was very significantly reduced in response toHFD. The expression of a series of n-3 polyunsaturatedfatty acid (PUFA) epoxygenases (Cyp2c29, Cyp2c37,Cyp2c38, Cyp2c39) was markedly suppressed by HFD.
In fat-fed mice, significant changes in the abundance oftranscripts for Aldo2 (−20%), Gpd2 (up to +90%) and Gyk(up to +40%) may drive metabolism to increased productionof glycerol-3-phosphate, the key substrate for triacylglycerolsynthesis, whilst parallel downregulation of Mgll expressionmay limit the degradation of intracellular triacylglycerolstores. The transcription of enzymes of the urea cycle (Arg1,Asl, Ass1) was reduced by HFD. No major changes intranscripts for enzymes involved in carbohydrate metabolismwere noted. These data suggest that increased lipoproteinuptake, intracellular fatty acid transport and elongation inresponse to HFD may account for the NAFLD phenotype,despite apparent reduced de novo lipid biosynthesis andenhanced lipid and cholesterol efflux.
Adaptation to HFD feeding also involved changes inexpression of genes associated with inflammation (in-creased C4bp, C6, Ikbkg, Lifr, Tgfbi; decreased C5ar1,Serpinb5, Mapk11), DNA damage (increased Trp53inp2),cell death (increased Casp8, decreased Mapk11), increasedproduction of cellular reactive oxygen species (ROS)
Fig. 2 Glucose tolerance(a–c) and glucose-stimulatedinsulin secretion in vivo (d–h)in 129S6 mice fed a HFD for15 weeks (closed circles/bars;n=6) and age-matched CD-fedcontrols (open circles/bars;n=6). These mice were used forgene transcription profiling.Data are presented as means±SE. *p<0.05, **p<0.01,***p<0.001 vs controls
Diabetologia (2007) 50:1867–1879 1871
(Nox4) and decreased chaperones and free radical scav-engers (Mt1) (Table 2).
In addition, expression of several genes encodingglutathione S-transferases (Gsta1, Gsta2, Gstm1, Gsto1,Gstt2, Gstt3), an aldo-keto reductase (Akr1c19) and analdehyde dehydrogenase (Aldh1b1) was downregulated byHFD, suggesting reduced glutathione conjugation andresulting in reduced ROS deactivation processes andincreased proinflammatory activities. These patterns of
gene expression suggest further deterioration of liverhistopathological features in fat-fed mice.
Gene transcription regulation assessed by quantitative real-time PCR Quantitative real-time PCR was used to detectpossible false positive and false negative results frommicroarray analysis for key genes biologically relevant toinsulin resistance and NAFLD (Figs. 5 and 6), selected onthe basis of differential expression between fat fed mice and
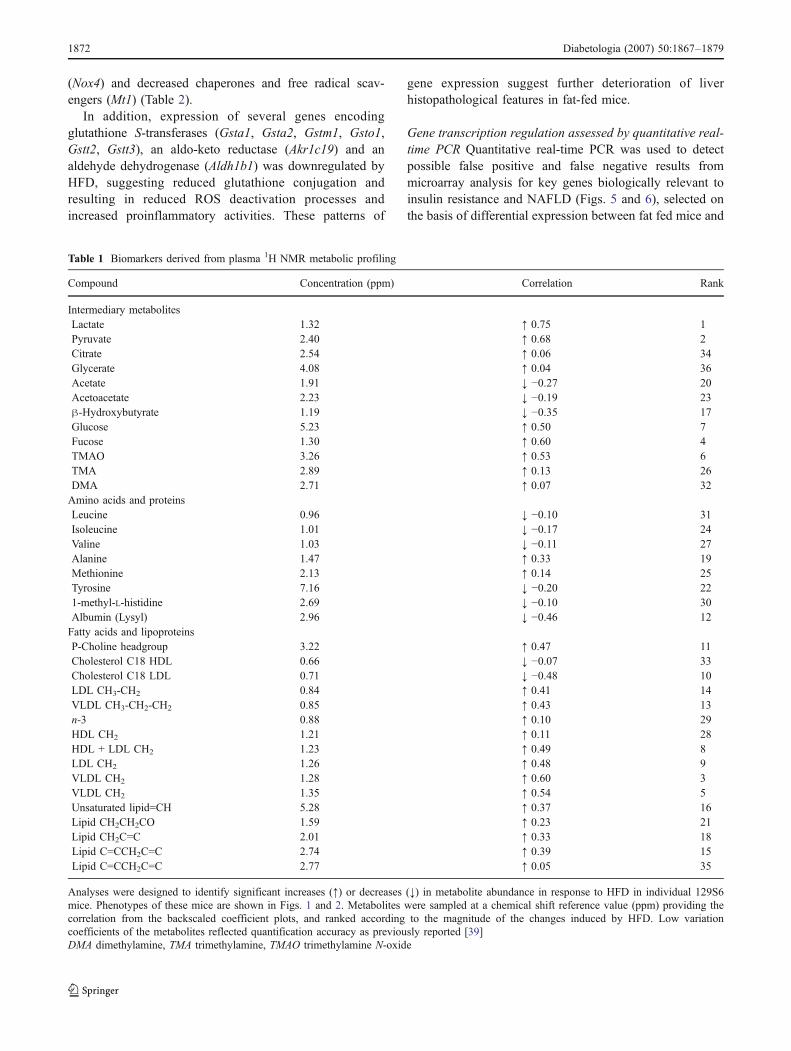
Table 1 Biomarkers derived from plasma 1H NMR metabolic profiling
Compound Concentration (ppm) Correlation Rank
Intermediary metabolitesLactate 1.32 ↑ 0.75 1Pyruvate 2.40 ↑ 0.68 2Citrate 2.54 ↑ 0.06 34Glycerate 4.08 ↑ 0.04 36Acetate 1.91 ↓ −0.27 20Acetoacetate 2.23 ↓ −0.19 23β-Hydroxybutyrate 1.19 ↓ −0.35 17Glucose 5.23 ↑ 0.50 7Fucose 1.30 ↑ 0.60 4TMAO 3.26 ↑ 0.53 6TMA 2.89 ↑ 0.13 26DMA 2.71 ↑ 0.07 32Amino acids and proteinsLeucine 0.96 ↓ −0.10 31Isoleucine 1.01 ↓ −0.17 24Valine 1.03 ↓ −0.11 27Alanine 1.47 ↑ 0.33 19Methionine 2.13 ↑ 0.14 25Tyrosine 7.16 ↓ −0.20 221-methyl-L-histidine 2.69 ↓ −0.10 30Albumin (Lysyl) 2.96 ↓ −0.46 12Fatty acids and lipoproteinsP-Choline headgroup 3.22 ↑ 0.47 11Cholesterol C18 HDL 0.66 ↓ −0.07 33Cholesterol C18 LDL 0.71 ↓ −0.48 10LDL CH3-CH2 0.84 ↑ 0.41 14VLDL CH3-CH2-CH2 0.85 ↑ 0.43 13n-3 0.88 ↑ 0.10 29HDL CH2 1.21 ↑ 0.11 28HDL + LDL CH2 1.23 ↑ 0.49 8LDL CH2 1.26 ↑ 0.48 9VLDL CH2 1.28 ↑ 0.60 3VLDL CH2 1.35 ↑ 0.54 5Unsaturated lipid=CH 5.28 ↑ 0.37 16Lipid CH2CH2CO 1.59 ↑ 0.23 21Lipid CH2C=C 2.01 ↑ 0.33 18Lipid C=CCH2C=C 2.74 ↑ 0.39 15Lipid C=CCH2C=C 2.77 ↑ 0.05 35
Analyses were designed to identify significant increases (↑) or decreases (↓) in metabolite abundance in response to HFD in individual 129S6mice. Phenotypes of these mice are shown in Figs. 1 and 2. Metabolites were sampled at a chemical shift reference value (ppm) providing thecorrelation from the backscaled coefficient plots, and ranked according to the magnitude of the changes induced by HFD. Low variationcoefficients of the metabolites reflected quantification accuracy as previously reported [39]DMA dimethylamine, TMA trimethylamine, TMAO trimethylamine N-oxide
1872 Diabetologia (2007) 50:1867–1879
controls (Acat1, Adfp, Ass1, Cyp2c29, Fabp5, Scd1,Srebf1c) in the Affymetrix data set, lack of statisticallysignificant response to HFD (Acox1, Acsl1, Fabp1, One-cut1 [also known as Hnf6], Ppara) despite 20–40% foldchanges in transcription, or inconclusive results fromdifferent probe sets (Gyk). Assays replicated the signifi-cance and direction of transcriptional changes found bymicroarray screening for Ass1, Cyp2c29, Fabp5, Scd1 andSrebf1c, but failed to confirm gene expression changes forAcat1, Adfp and Gyk (probe set 1422704_at). We confirmedthe absence of effect of HFD on the expression of Acsl1,Fabp1 and Gyk (probe set 1422703_at). In contrast, thetranscription of Acox1, Onecut1 and Ppara was significant-ly downregulated by HFD when tested by quantitative real-time PCR. Differences in target sequences used in the twosystems may explain these discordant results.
To test an effect of genetic background differences ongene transcription regulation, quantitative real-time PCRwas repeated in fat-fed and control BALB/c mice, whichare resistant to diet-induced obesity, diabetes and fatty liver[14]. The two strains showed markedly contrasting genetranscription patterns induced by HFD, suggesting the
involvement of strain-specific mechanisms of gene expres-sion regulation underlying susceptibility or resistance todiet-induced obesity and NAFLD.
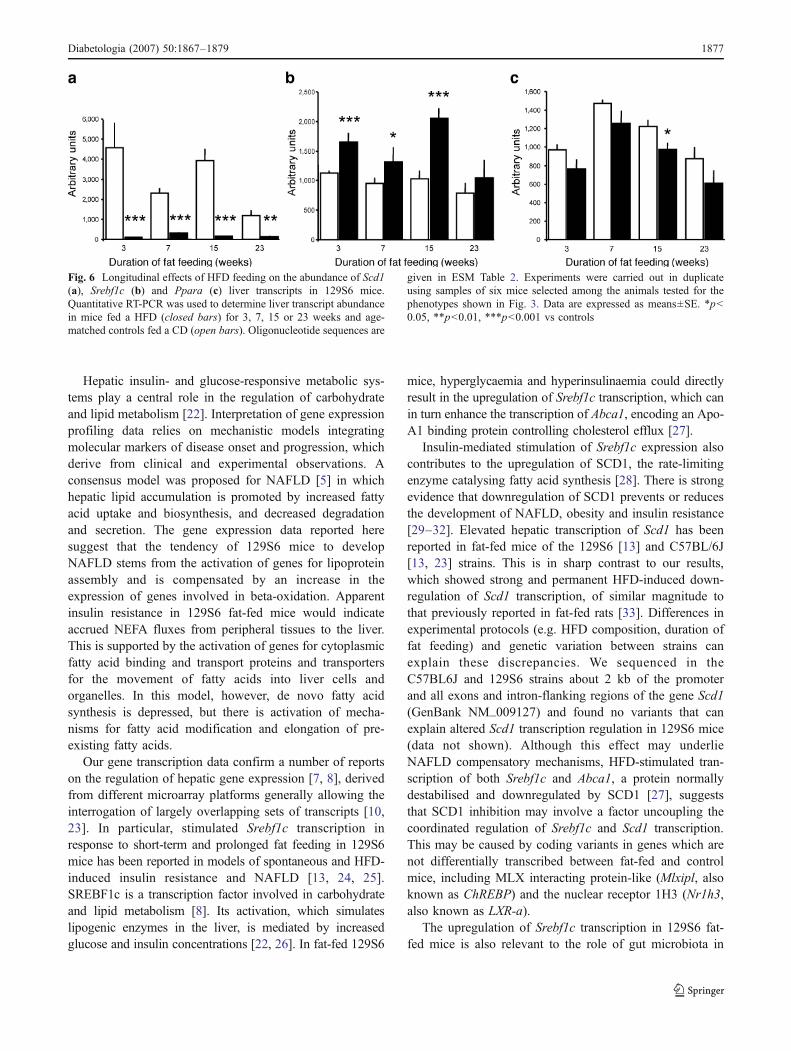
Longitudinal effects of HFD on Scd1, Srebf1c and Pparagene transcription We then investigated shorter- (3 and7 weeks) and longer-term (23 weeks) effects of HFD in129S6 mice on key genes regulating the transcription offatty acid metabolism (Srebf1c, Ppara) and tested theparadoxical downregulation of Scd1 transcription in amodel of obesity. These experiments were carried out withfat-fed mice that showed glucose intolerance (data notshown), extensive metabolic changes and increased adipos-ity (Fig. 3) when compared with CD fed controls andmarked NAFLD after prolonged HFD feeding (23 weeks;data not shown). Gene expression data demonstrate thepermanent effects of HFD on Scd1 downregulation andSrebf1c upregulation, even though the change in Srebf1ctranscription at the last time point was not significant(Fig. 6). The abundance of Ppara transcripts was alsoreduced by HFD, but the effect was significant only in micefat-fed for 15 weeks.
Fig. 3 Longitudinal effects of HFD feeding (closed triangles/greybars) on global metabonomic profile derived from plasma 1H NMR O-PLS-DA diet predictive score (a), body weight (b), adiposity (c), andplasma lipid concentration (d–f) in 129S6 mice. Data are presented as
means±SE. *p<0.05, **p<0.01, ***p<0.001 vs age-matched controls(open triangles/white bars). EFP, epididymal fat pad. The number ofmice in each group is shown at the bottom of each bar
Diabetologia (2007) 50:1867–1879 1873
Discussion
We have used global functional genomic approaches todocument the impact of dietary changes on the regulationof gene expression in an inbred mouse strain susceptible toHFD-induced obesity, diabetes and NAFLD [13, 14].Metabonomic and transcriptomic data provide an originalrepresentation of subtle adaptations of gene expressionregulatory systems to sustained and standardised dietarychanges and underline the involvement of a wide range ofknown and potentially novel molecular mechanisms.
Pathophysiological responses to prolonged HFD in 129S6mice combine glucose intolerance, hyperinsulinaemia, en-hanced insulin secretion, hyperlipidaemia, obesity andNAFLD. Most of these features, which develop soon afterthe start of an HFD and remain permanently altered, areconsistently found in similar fat-feeding studies in this [13,14] and other mouse strains [11, 13, 21]. They are the resultof complex metabolic and hormonal alterations that plasmametabonomics and liver transcriptomics can characterise atthe molecular level. Metabolic and gene transcriptionchanges underlie primary causes of liver fat accumulation
Fig. 4 Effects of prolonged HFDfeeding on transcriptionalchanges of canonical pathways in129S6 mice. Pathways signifi-cantly (p<0.05) affected by fatfeeding were identified using IPAand are ranked according to theirstatistical significance. Percen-tages of differentially expressedgenes in each pathway areshown. The phenotypes of thesix fat-fed and control mice usedare shown in Figs. 1 and 2
1874 Diabetologia (2007) 50:1867–1879
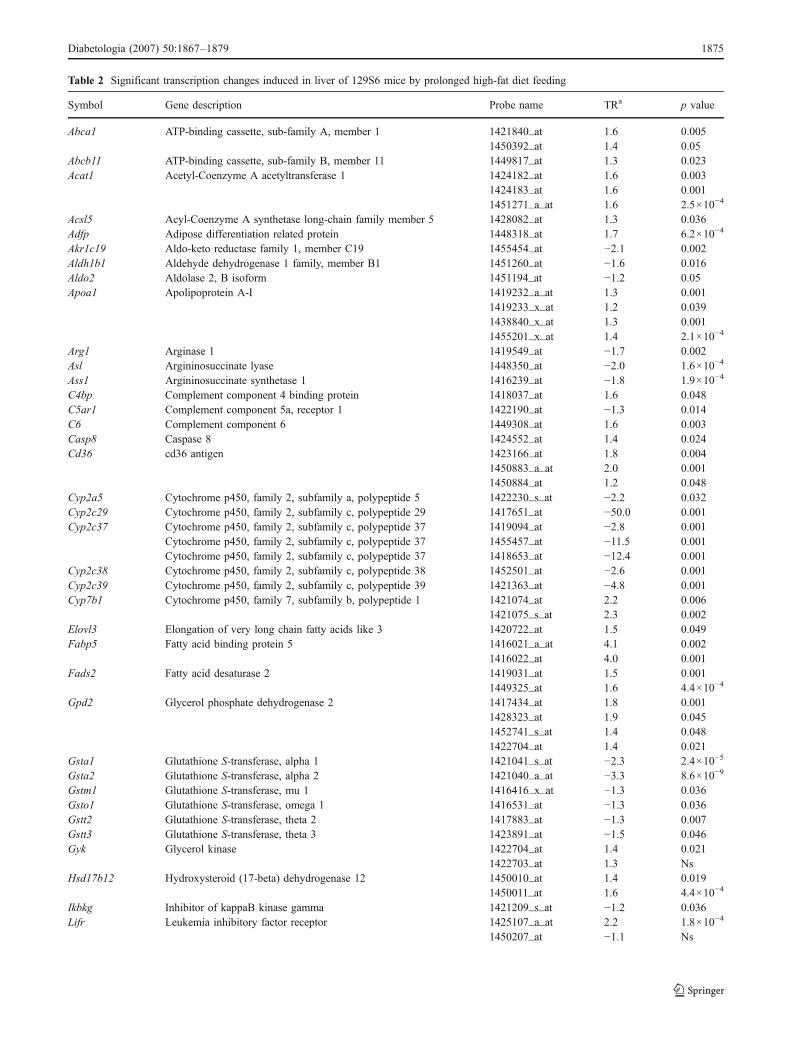
Table 2 Significant transcription changes induced in liver of 129S6 mice by prolonged high-fat diet feeding
Symbol Gene description Probe name TRa p value
Abca1 ATP-binding cassette, sub-family A, member 1 1421840_at 1.6 0.0051450392_at 1.4 0.05
Abcb11 ATP-binding cassette, sub-family B, member 11 1449817_at 1.3 0.023Acat1 Acetyl-Coenzyme A acetyltransferase 1 1424182_at 1.6 0.003
1424183_at 1.6 0.0011451271_a_at 1.6 2.5×10⁻⁴
Acsl5 Acyl-Coenzyme A synthetase long-chain family member 5 1428082_at 1.3 0.036Adfp Adipose differentiation related protein 1448318_at 1.7 6.2×10⁻⁴
Akr1c19 Aldo-keto reductase family 1, member C19 1455454_at −2.1 0.002Aldh1b1 Aldehyde dehydrogenase 1 family, member B1 1451260_at −1.6 0.016Aldo2 Aldolase 2, B isoform 1451194_at −1.2 0.05Apoa1 Apolipoprotein A-I 1419232_a_at 1.3 0.001
1419233_x_at 1.2 0.0391438840_x_at 1.3 0.0011455201_x_at 1.4 2.1×10⁻⁴
Arg1 Arginase 1 1419549_at −1.7 0.002Asl Argininosuccinate lyase 1448350_at −2.0 1.6×10⁻⁴
Ass1 Argininosuccinate synthetase 1 1416239_at −1.8 1.9×10⁻⁴
C4bp Complement component 4 binding protein 1418037_at 1.6 0.048C5ar1 Complement component 5a, receptor 1 1422190_at −1.3 0.014C6 Complement component 6 1449308_at 1.6 0.003Casp8 Caspase 8 1424552_at 1.4 0.024Cd36 cd36 antigen 1423166_at 1.8 0.004
1450883_a_at 2.0 0.0011450884_at 1.2 0.048
Cyp2a5 Cytochrome p450, family 2, subfamily a, polypeptide 5 1422230_s_at −2.2 0.032Cyp2c29 Cytochrome p450, family 2, subfamily c, polypeptide 29 1417651_at −50.0 0.001Cyp2c37 Cytochrome p450, family 2, subfamily c, polypeptide 37 1419094_at −2.8 0.001
Cytochrome p450, family 2, subfamily c, polypeptide 37 1455457_at −11.5 0.001Cytochrome p450, family 2, subfamily c, polypeptide 37 1418653_at −12.4 0.001
Cyp2c38 Cytochrome p450, family 2, subfamily c, polypeptide 38 1452501_at −2.6 0.001Cyp2c39 Cytochrome p450, family 2, subfamily c, polypeptide 39 1421363_at −4.8 0.001Cyp7b1 Cytochrome p450, family 7, subfamily b, polypeptide 1 1421074_at 2.2 0.006
1421075_s_at 2.3 0.002Elovl3 Elongation of very long chain fatty acids like 3 1420722_at 1.5 0.049Fabp5 Fatty acid binding protein 5 1416021_a_at 4.1 0.002
1416022_at 4.0 0.001Fads2 Fatty acid desaturase 2 1419031_at 1.5 0.001
1449325_at 1.6 4.4×10⁻⁴
Gpd2 Glycerol phosphate dehydrogenase 2 1417434_at 1.8 0.0011428323_at 1.9 0.0451452741_s_at 1.4 0.0481422704_at 1.4 0.021
Gsta1 Glutathione S-transferase, alpha 1 1421041_s_at −2.3 2.4×10⁻⁵
Gsta2 Glutathione S-transferase, alpha 2 1421040_a_at −3.3 8.6×10⁻⁹
Gstm1 Glutathione S-transferase, mu 1 1416416_x_at −1.3 0.036Gsto1 Glutathione S-transferase, omega 1 1416531_at −1.3 0.036Gstt2 Glutathione S-transferase, theta 2 1417883_at −1.3 0.007Gstt3 Glutathione S-transferase, theta 3 1423891_at −1.5 0.046Gyk Glycerol kinase 1422704_at 1.4 0.021
1422703_at 1.3 NsHsd17b12 Hydroxysteroid (17-beta) dehydrogenase 12 1450010_at 1.4 0.019
1450011_at 1.6 4.4×10⁻⁴
Ikbkg Inhibitor of kappaB kinase gamma 1421209_s_at −1.2 0.036Lifr Leukemia inhibitory factor receptor 1425107_a_at 2.2 1.8×10⁻⁴
1450207_at −1.1 Ns
Diabetologia (2007) 50:1867–1879 1875
and impaired glucose regulation induced by HFD, second-ary physiological adaptations to perturbed metabolism,hyperinsulinaemia and liver morphological alterations, anddiet-specific transitions between fed and fasting states.
Metabonomic data reported here provide detailed analysisof quantitative changes in individual plasma metabolites thatare contributed to by multiple organs, each having specificeffects on the regulation of lipid, protein and carbohydratefuel physiology, and showing specific responses to hormonaland neural stimuli. For example, elevated plasma lactateconcentration in fat-fed mice may reflect the effect ofhyperglycaemia on enhanced muscle lactate production.High concentrations of plasma lactate, pyruvate and alaninein fasted mice of the fat-fed group indicate increasedavailability of gluconeogenic substrates. Some diet-inducedchanges in metabolite concentrations can be linked toalterations in liver gene expression regulation. In fat-fedmice, elevated plasma alanine, which is used for the transportof nitrogen for excretion as urea in the liver, may be causedby the downregulation of genes encoding enzymes of the ureacycle. Increased plasma n-3 fatty acids and PUFA classes inHFD-fed mice may reflect the transcription downregulationof liver epoxygenases, resulting in PUFA-sparing function.The definition of coordinated changes in plasma metabolitesand gene expression could help test causal relationshipsbetween insulin resistance and NAFLD.
Table 2 (continued)
Symbol Gene description Probe name TRa p value
Mapk11 Mitogen-activated protein kinase 11 1421925_at −1.2 0.034Mgll Monoglyceride lipase 1431331_at −1.3 0.01Mt1 Metallothionein 1 1422557_s_at −3.5 0.001Nox4 NADPH oxidase 4 1451827_a_at 1.5 0.013Saa4 Serum amyloid A4 1419318_at 1.9 0.006
1419319_at 1.8 0.003Sc5d Sterol C5 desaturase 1451457_at 1.6 0.041Scarb1 Scavenger receptor class B, member 1 1437378_x_at 1.5 0.01Scd1 Stearoyl-coenzyme A desaturase 1 1415964_at −12 8.2×10⁻⁷
1415965_at −4.2 8.4×10⁻⁶
Serpinb5 Serine (or cysteine) proteinase inhibitor, clade B, member 5 1438856_x_at −1.3 0.026Srebf1c Sterol regulatory element binding factor 1 1426690_a_at 1.8 0.001Tsc-22 Transforming growth factor beta 1 induced transcript 4 1425742_a_at 4.8 4.4×10⁻⁴
1433899_x_at 1.5 0.0051454758_a_at 3.9 7.4×10⁻⁶
1454971_x_at 4.6 1.5×10⁻⁴
Tgfbi Transforming growth factor, beta induced 1448123_s_at 1.4 0.044Trp53inp2 Tumour protein p53 inducible nuclear protein 2 1444396_at 1.5 0.047
The full list of genes differentially expressed (p<0.05) along with gene expression indices are given in ESM Table 1. When several probe setswere designed for the same gene, results are given for individual probe sets. Transcription ratio (TR) between groups and statistical significanceare reported. Phenotype data of the mice used are in Figs. 1 and 2. Details of Affymetrix probe set name designations are available from http://www.affymetrix.com/support/downloads/manuals/data_analysis_fundamentals_manual.pdf (last accessed in June 2007).
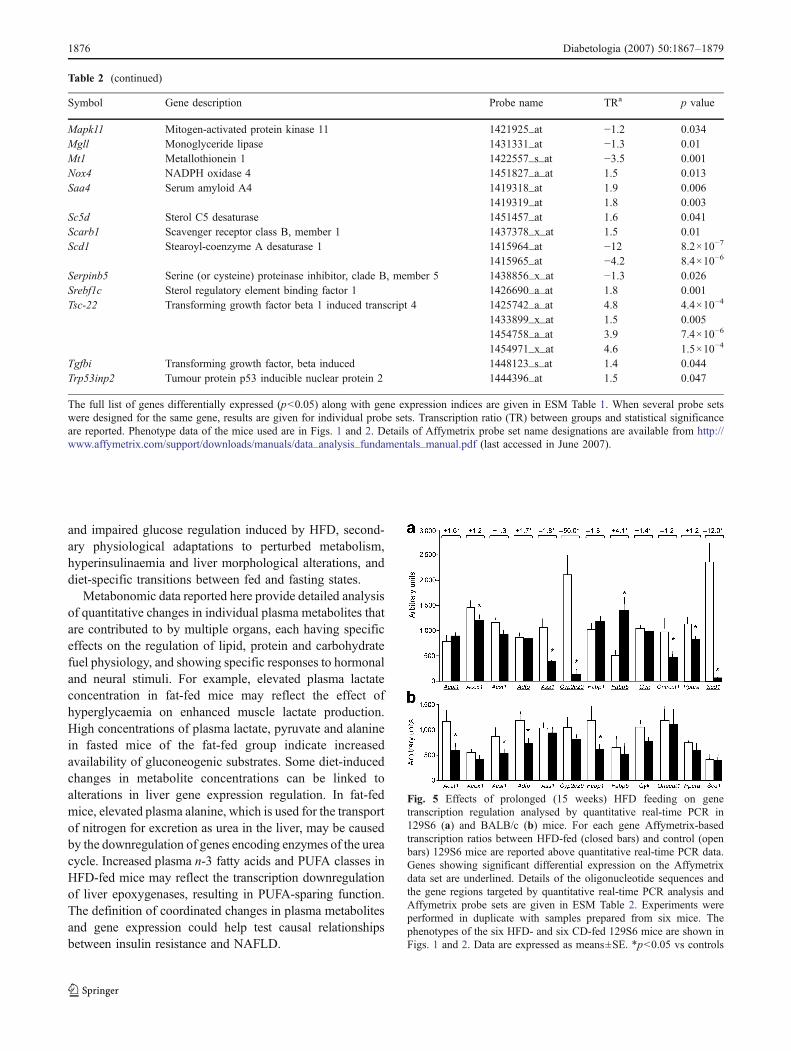
Fig. 5 Effects of prolonged (15 weeks) HFD feeding on genetranscription regulation analysed by quantitative real-time PCR in129S6 (a) and BALB/c (b) mice. For each gene Affymetrix-basedtranscription ratios between HFD-fed (closed bars) and control (openbars) 129S6 mice are reported above quantitative real-time PCR data.Genes showing significant differential expression on the Affymetrixdata set are underlined. Details of the oligonucleotide sequences andthe gene regions targeted by quantitative real-time PCR analysis andAffymetrix probe sets are given in ESM Table 2. Experiments wereperformed in duplicate with samples prepared from six mice. Thephenotypes of the six HFD- and six CD-fed 129S6 mice are shown inFigs. 1 and 2. Data are expressed as means±SE. *p<0.05 vs controls
1876 Diabetologia (2007) 50:1867–1879
Hepatic insulin- and glucose-responsive metabolic sys-tems play a central role in the regulation of carbohydrateand lipid metabolism [22]. Interpretation of gene expressionprofiling data relies on mechanistic models integratingmolecular markers of disease onset and progression, whichderive from clinical and experimental observations. Aconsensus model was proposed for NAFLD [5] in whichhepatic lipid accumulation is promoted by increased fattyacid uptake and biosynthesis, and decreased degradationand secretion. The gene expression data reported heresuggest that the tendency of 129S6 mice to developNAFLD stems from the activation of genes for lipoproteinassembly and is compensated by an increase in theexpression of genes involved in beta-oxidation. Apparentinsulin resistance in 129S6 fat-fed mice would indicateaccrued NEFA fluxes from peripheral tissues to the liver.This is supported by the activation of genes for cytoplasmicfatty acid binding and transport proteins and transportersfor the movement of fatty acids into liver cells andorganelles. In this model, however, de novo fatty acidsynthesis is depressed, but there is activation of mecha-nisms for fatty acid modification and elongation of pre-existing fatty acids.
Our gene transcription data confirm a number of reportson the regulation of hepatic gene expression [7, 8], derivedfrom different microarray platforms generally allowing theinterrogation of largely overlapping sets of transcripts [10,23]. In particular, stimulated Srebf1c transcription inresponse to short-term and prolonged fat feeding in 129S6mice has been reported in models of spontaneous and HFD-induced insulin resistance and NAFLD [13, 24, 25].SREBF1c is a transcription factor involved in carbohydrateand lipid metabolism [8]. Its activation, which simulateslipogenic enzymes in the liver, is mediated by increasedglucose and insulin concentrations [22, 26]. In fat-fed 129S6
mice, hyperglycaemia and hyperinsulinaemia could directlyresult in the upregulation of Srebf1c transcription, which canin turn enhance the transcription of Abca1, encoding an Apo-A1 binding protein controlling cholesterol efflux [27].
Insulin-mediated stimulation of Srebf1c expression alsocontributes to the upregulation of SCD1, the rate-limitingenzyme catalysing fatty acid synthesis [28]. There is strongevidence that downregulation of SCD1 prevents or reducesthe development of NAFLD, obesity and insulin resistance[29–32]. Elevated hepatic transcription of Scd1 has beenreported in fat-fed mice of the 129S6 [13] and C57BL/6J[13, 23] strains. This is in sharp contrast to our results,which showed strong and permanent HFD-induced down-regulation of Scd1 transcription, of similar magnitude tothat previously reported in fat-fed rats [33]. Differences inexperimental protocols (e.g. HFD composition, duration offat feeding) and genetic variation between strains canexplain these discrepancies. We sequenced in theC57BL6J and 129S6 strains about 2 kb of the promoterand all exons and intron-flanking regions of the gene Scd1(GenBank NM_009127) and found no variants that canexplain altered Scd1 transcription regulation in 129S6 mice(data not shown). Although this effect may underlieNAFLD compensatory mechanisms, HFD-stimulated tran-scription of both Srebf1c and Abca1, a protein normallydestabilised and downregulated by SCD1 [27], suggeststhat SCD1 inhibition may involve a factor uncoupling thecoordinated regulation of Srebf1c and Scd1 transcription.This may be caused by coding variants in genes which arenot differentially transcribed between fat-fed and controlmice, including MLX interacting protein-like (Mlxipl, alsoknown as ChREBP) and the nuclear receptor 1H3 (Nr1h3,also known as LXR-a).
The upregulation of Srebf1c transcription in 129S6 fat-fed mice is also relevant to the role of gut microbiota in
Fig. 6 Longitudinal effects of HFD feeding on the abundance of Scd1(a), Srebf1c (b) and Ppara (c) liver transcripts in 129S6 mice.Quantitative RT-PCR was used to determine liver transcript abundancein mice fed a HFD (closed bars) for 3, 7, 15 or 23 weeks and age-matched controls fed a CD (open bars). Oligonucleotide sequences are
given in ESM Table 2. Experiments were carried out in duplicateusing samples of six mice selected among the animals tested for thephenotypes shown in Fig. 3. Data are expressed as means±SE. *p<0.05, **p<0.01, ***p<0.001 vs controls
Diabetologia (2007) 50:1867–1879 1877
NAFLD and insulin resistance [14]. Srebf1c is overex-pressed in experiments on the microbial colonisation of thegastrointestinal tract in germ-free mice [34]. Gut microbiotacould promote storage of triacylglycerol in hepatocytes andadipocytes by indirect modulation of cellular fatty aciduptake [14, 34]. There is growing evidence from studies inanimals [35] and humans [36] that variation in gutmicrobial composition is an important factor in obesityand insulin resistance. The increased level of microbial-related metabolites (dimethylamine, trimethylamine, trime-thylamine N-oxide) in the plasma of 129S6 fat-fed miceindicates important changes in gut microbiota that couldcontribute to NAFLD, obesity and insulin resistance. Thismodel provides a useful system to test causal links betweenchanges in gut microbiota and these pathologies.
We show here detailed changes in gene transcription andmetabolic regulation that favour NAFLD and possiblysubsequent phenotype progression involving inflammatoryprocesses in 129S6 mice, despite activation of compensa-tory homeostatic mechanisms. Our results help establishconsensus and strain-specific patterns of gene expressionassociated with NAFLD, obesity and diabetes, and identifygene targets for validation studies at the proteome level[37]. With the emergence of transcriptomic data setsderived from NAFLD-susceptible strains [10, 13, 23], ourresults contribute to enrichment of the model proposed fordisease pathogenesis [5] with novel insights into mecha-nisms regulating gene expression and novel diet-reactivemolecular components, including predicted or poorlyannotated genes. Further investigations in a genetic crossbetween 129S6 and a strain resistant to diet-inducedNAFLD, obesity and diabetes are required to investigatecausal relationships between altered transcriptomic andmetabonomic patterns and disease traits [38].
Acknowledgements The authors thank C. Hetherington (Biomedi-cal Services, University of Oxford) for invaluable help with theimplementation of the mouse colony. A. A. Toye, M. E. Dumas and C.Blancher contributed equally to this work. This work was funded bythe Wellcome Functional Genomics Initiative BAIR (Biological Atlasof Insulin Resistance) (066786). D. Gauguier holds a Wellcome SeniorFellowship in Basic Biomedical Science (057733). S. P. Wilder is arecipient of a Wellcome Prize Studentship in Bioinformatics andStatistical Genetics.
Duality of interest The authors declare that there is no duality ofinterest associated with this manuscript.
References
1. Roden M (2006) Mechanisms of disease: hepatic steatosis in type2 diabetes—pathogenesis and clinical relevance. Nat Clin PractEndocrinol Metab 2:335–348
2. Marchesini G, Brizi M, Bianchi G et al (2001) Nonalcoholic fattyliver disease: a feature of the metabolic syndrome. Diabetes50:1844–1850
3. Chitturi S, Farrell GC (2001) Etiopathogenesis of nonalcoholicsteatohepatitis. Semin Liver Dis 21:27–41
4. Festi D, Colecchia A, Sacco T, Bondi M, Roda E, Marchesini G(2004) Hepatic steatosis in obese patients: clinical aspects andprognostic significance. Obes Rev 5:27–42
5. Browning JD, Horton JD (2004) Molecular mediators of hepaticsteatosis and liver injury. J Clin Invest 114:147–152
6. Nicholson JK, Wilson ID (2003) Opinion: understanding ‘global’systems biology: metabonomics and the continuum of metabo-lism. Nat Rev Drug Discov 2:668–676
7. Desvergne B, Michalik L, Wahli W (2006) Transcriptionalregulation of metabolism. Physiol Rev 86:465–514
8. Foufelle F, Ferre P (2002) New perspectives in the regulation ofhepatic glycolytic and lipogenic genes by insulin and glucose: arole for the transcription factor sterol regulatory element bindingprotein-1c. Biochem J 366:377–391
9. den Boer M, Voshol PJ, Kuipers F, Havekes LM, Romijn JA(2004) Hepatic steatosis: a mediator of the metabolic syndrome.Lessons from animal models. Arterioscler Thromb Vasc Biol24:644–649
10. Almind K, Kahn CR (2004) Genetic determinants of energyexpenditure and insulin resistance in diet-induced obesity in mice.Diabetes 53:3274–3285
11. Rossmeisl M, Rim JS, Koza RA, Kozak LP (2003) Variation intype 2 diabetes-related traits in mouse strains susceptible to diet-induced obesity. Diabetes 52:1958–1966
12. Samuel VT, Liu ZX, Qu X et al (2004) Mechanism of hepaticinsulin resistance in non-alcoholic fatty liver disease. J Biol Chem279:32345–32353
13. Biddinger SB, Almind K, Miyazaki M, Kokkotou E, Ntambi JM,Kahn CR (2005) Effects of diet and genetic background on sterolregulatory element-binding protein-1c, stearoyl-CoA desaturase 1,and the development of the metabolic syndrome. Diabetes54:1314–1323
14. Dumas ME, Barton RH, Toye A et al (2006) Metabolic profilingreveals a contribution of gut microbiota to fatty liver phenotype ininsulin-resistant mice. Proc Natl Acad Sci USA 103:12511–12516
15. Solberg LC, Valdar W, Gauguier D et al (2006) A protocol forhigh-throughput phenotyping, suitable for quantitative trait anal-ysis in mice. Mamm Genome 17:129–146
16. Nicholson JK, Foxall PJ, Spraul M, Farrant RD, Lindon JC (1995)750 MHz 1H and 1H-13C NMR spectroscopy of human bloodplasma. Anal Chem 67:793–811
17. Cloarec O, Dumas ME, Trygg J et al (2005) Evaluation of theorthogonal projection on latent structure model limitations causedby chemical shift variability and improved visualization ofbiomarker changes in 1H NMR spectroscopic metabonomicstudies. Anal Chem 77:517–526
18. Irizarry RA, Hobbs B, Collin F et al (2003) Exploration,normalization, and summaries of high density oligonucleotidearray probe level data. Biostatistics 4:249–264
19. Benjamini Y, Hochberg Y (1995) Controlling the false discoveryrate: a practical and powerful approach to multiple testing. J RStat Soc 57:289–300
20. Trygg J, Wold S (2003) O2-PLS, a two-block (X–Y) latentvariable regression (LVR) method with an integral OSC filter.J Chemometrics 17:53–64
21. West DB, Boozer CN, Moody DL, Atkinson RL (1992) Dietaryobesity in nine inbred mouse strains. Am J Physiol 262:R1025–R1032
22. Weickert MO, Pfeiffer AF (2006) Signalling mechanisms linkinghepatic glucose and lipid metabolism. Diabetologia 49:1732–1741
1878 Diabetologia (2007) 50:1867–1879
23. de Fourmestraux V, Neubauer H, Poussin C et al (2004) Transcriptprofiling suggests that differential metabolic adaptation of mice toa high fat diet is associated with changes in liver to muscle lipidfluxes. J Biol Chem 279:50743–50753
24. Shimomura I, Bashmakov Y, Horton JD (1999) Increasedlevels of nuclear SREBP-1c associated with fatty livers in twomouse models of diabetes mellitus. J Biol Chem 274:30028–30032
25. Shimomura I, Matsuda M, Hammer RE, Bashmakov Y, Brown MS,Goldstein JL (2000) Decreased IRS-2 and increased SREBP-1clead to mixed insulin resistance and sensitivity in livers oflipodystrophic and ob/ob mice. Mol Cell 6:77–86
26. Shimomura I, Bashmakov Y, Ikemoto S, Horton JD, Brown MS,Goldstein JL (1999) Insulin selectively increases SREBP-1cmRNA in the livers of rats with streptozotocin-induced diabetes.Proc Natl Acad Sci USA 96:13656–13661
27. Wang Y, Kurdi-Haidar B, Oram JF (2004) LXR-mediatedactivation of macrophage stearoyl-CoA desaturase generatesunsaturated fatty acids that destabilize ABCA1. J Lipid Res45:972–980
28. Dobrzyn A, Ntambi JM (2004) The role of stearoyl-CoA desaturasein body weight regulation. Trends Cardiovasc Med 14:77–81
29. Cohen P, Miyazaki M, Socci ND et al (2002) Role for stearoyl-CoA desaturase-1 in leptin-mediated weight loss. Science297:240–243
30. Yahagi N, Shimano H, Hasty AH et al (2002) Absence of sterolregulatory element-binding protein-1 (SREBP-1) ameliorates fattylivers but not obesity or insulin resistance in Lep(ob)/Lep(ob)mice. J Biol Chem 277:19353–19357
31. Jiang G, Li Z, Liu F et al (2005) Prevention of obesity in mice byantisense oligonucleotide inhibitors of stearoyl-CoA desaturase-1.J Clin Invest 115:1030–1038
32. Gutierrez-Juarez R, Pocai A, Mulas C et al (2006) Critical role ofstearoyl-CoA desaturase-1 (SCD1) in the onset of diet-inducedhepatic insulin resistance. J Clin Invest 116:1686–1695
33. Kakuma T, Lee Y, Unger RH (2002) Effects of leptin, troglita-zone, and dietary fat on stearoyl CoA desaturase. BiochemBiophys Res Commun 297:1259–1263
34. Backhed F, Ding H, Wang T et al (2004) The gut microbiota as anenvironmental factor that regulates fat storage. Proc Natl Acad SciU S A 101:15718–15723
35. Turnbaugh PJ, Ley RE, Mahowald MA, Magrini V, Mardis ER,Gordon JI (2006) An obesity-associated gut microbiome withincreased capacity for energy harvest. Nature 444:1027–1131
36. Ley RE, Turnbaugh PJ, Klein S, Gordon JI (2006) Microbialecology: human gut microbes associated with obesity. Nature444:1022–1023
37. Mijalski T, Harder A, Halder T et al (2005) Identification ofcoexpressed gene clusters in a comparative analysis of tran-scriptome and proteome in mouse tissues. Proc Natl Acad SciUSA 102:8621–8626
38. DumasME,Wilder SP, BihoreauMTet al (2007) Direct quantitativetrait locus mapping of mammalian metabolic phenotypes in diabeticand normoglycemic rat models. Nat Genet 39:666–672
39. Dumas ME, Maibaum EC, Teague C et al (2006) Assessment ofanalytical reproducibility of 1H NMR spectroscopy basedmetabonomics for large-scale epidemiological research: theINTERMAP Study. Anal Chem 78:2199–2208
Diabetologia (2007) 50:1867–1879 1879