PLANT PHYSIOLOGY - NCBI
10
PLANT PHYSIOLOGY VOLUME 29 MAY, 1954 NUMBER 3 THE GROWTH AND INORGANIC NUTRITION OF SCENEDESMUS OBLIQUUS IN MASS CULTURE 1"2'3 ROBERT W. KRAUSS AND WILLIAM H. THOMAS DEPARTMENT OF BOTANY, UNIVERSITY OF MARYLAND, COLLEGE PARK, MARYLAND Current interest in the possible commercial use of algae resulting from the investigations of Spoehr and Milner (30), Spoehr (29), Coombs (7), and Burlew (6), as well as continued recognition of their value as tools in many fields of research, has emphasized the desirability of an understanding of the factors which may limit algal growth under conditions of mass cul- ture. The first requirement is a culture apparatus which can maintain constant light and temperature. The second demand is for a technique which will pro- vide a constant supply of nutrients in the medium over an extended period of time. The investigation of other factors affecting the photosynthetic efficiency of mass cultures can proceed only after these requi- sites are satisfied. The bulk of the earlier work on growth andl inorganic nutrition of algae prior to 1942, reviewed by Bold (4), has been concerned primarily with the growth of algae in small pure cultures which were allowed to grow to maturity. The adequacy of the initial medium supplied stuch " batch " or discon- tinuous cultures is determined by the amount of growth resulting during a given period of time with- out regard to the progressive environmental changes in the medium. However, Ketchum and Redfield (13) developed an apparatus using an artificially il- luminated carboy for the continuous culture of marine diatoms to test the principle of the optimum catch delineated by Hjort, Jahn, and Ottestatt (11). This technique was modified by Scott (27) in determining the growth and inorganic content of Chlorella under varying nutrient concentrations of magnesium, cal- cium, potassium, and sodium. AIyers and Clark (19) also achieved a continuous system approaching the steady state by controlling photoelectrically the dilu- tion of the culture with fresh medium which serves to replace the inorganic nutrients, to maintain a con- stant population density, and to measure growth by overflow. This technique has been used to determine 1 Receiv-ed March 23, 1953. 2 The investigations reported her-e were aided by a contra(ct between the Office of Naval Research, Depart- ment of the Navy, and the University of Maryland (Nonr 556(00)). Additional support was made possible through the cooperation of the Carnegie Institution of WN'ashington. 3 Paper No. A403, Contribution No. 2431 of the Maryland Agricultural Experiment Station (Dept. of Botany). the effecti'veness of various inorganic and organic nu- trient solutions on growth. The present state of our knowledge of inorganic nutrition derived from both continuous and discontinuous culture of the algae has been reviewed by Myers (18) and Krauss (15). The extension and application of this knowledge to pro- duce optimum yields from open cultures has uncov- ered specific problems, demanding further investiga- tion for which mass cultures permitting large and frequent samples are uniquely suited. The study re- ported in this paper was designed to determine the inorganic requirements and growth characteristics of Scenedesmus obliquus (Turp.) Kiutz. in a continuous mass culture. It is the initial step in an effort to elucidate all factors limiting the growth of algae in mass cultures. MATERIALS AND METHODS APPARATUS: The culture apparatus is diagrammed in figure 1. The algae were grown in glass-covered, polyethylene-lined, white, plywood vats having an il- luminated surface area of 2 m2 and a depth of 20 cm (A). In all experiments the vats were filled to a depth of 15 cm giving cultures of 300 liters. Motors (B) driving stainless steel propellers mounted in diagonal corners of the vat provided rapid circula- tion to prevent sedimentation. Water for the cultures heated to 70°C was passed through a cooling coil in a cold water bath (I) and then through an ion ex- change column (J). Such water with less than 2 ppm of electrolyte (as NaCl) was essentially free of con- taminating organisms. A mixture of 5 % C02-in-air metered by flow meters (CC) was supplied to the culture through a porous carbon pipe (C) at a rate of 50 1/hr. Each vat was illuminated by a battery of lights containing 16 fluorescent and 12 incandescent lights mounted on a reflector (S) which was lowered over the vats during culture. The value of a balanced combination of incandescent and fluorescent lamps has been discussed by Parker and Borthwick (22). Such a source gives constant light, of as high an in- tensity and with a spectral distribution as near to that of sunlight as is feasible with artificial sources. Bal- lasts (R) for the fluorescent tubes were mounted out- side the chamber to exclude heat. The light inten- sities read from a Weston Illumination Meter (Model 756) are plotted in figure 2. After burning the bulbs 205
-
Upload
khangminh22 -
Category
Documents
-
view
0 -
download
0
Transcript of PLANT PHYSIOLOGY - NCBI
PLANT PHYSIOLOGYVOLUME 29 MAY, 1954 NUMBER 3
THE GROWTH AND INORGANIC NUTRITION OF SCENEDESMUSOBLIQUUS IN MASS CULTURE1"2'3
ROBERT W. KRAUSS AND WILLIAM H. THOMASDEPARTMENT OF BOTANY, UNIVERSITY OF MARYLAND, COLLEGE PARK, MARYLAND
Current interest in the possible commercial use ofalgae resulting from the investigations of Spoehr andMilner (30), Spoehr (29), Coombs (7), and Burlew(6), as well as continued recognition of their value astools in many fields of research, has emphasized thedesirability of an understanding of the factors whichmay limit algal growth under conditions of mass cul-ture. The first requirement is a culture apparatuswhich can maintain constant light and temperature.The second demand is for a technique which will pro-vide a constant supply of nutrients in the mediumover an extended period of time. The investigationof other factors affecting the photosynthetic efficiencyof mass cultures can proceed only after these requi-sites are satisfied. The bulk of the earlier work ongrowth andl inorganic nutrition of algae prior to 1942,reviewed by Bold (4), has been concerned primarilywith the growth of algae in small pure cultures whichwere allowed to grow to maturity. The adequacy ofthe initial medium supplied stuch " batch " or discon-tinuous cultures is determined by the amount ofgrowth resulting during a given period of time with-out regard to the progressive environmental changesin the medium. However, Ketchum and Redfield(13) developed an apparatus using an artificially il-luminated carboy for the continuous culture of marinediatoms to test the principle of the optimum catchdelineated by Hjort, Jahn, and Ottestatt (11). Thistechnique was modified by Scott (27) in determiningthe growth and inorganic content of Chlorella undervarying nutrient concentrations of magnesium, cal-cium, potassium, and sodium. AIyers and Clark (19)also achieved a continuous system approaching thesteady state by controlling photoelectrically the dilu-tion of the culture with fresh medium which servesto replace the inorganic nutrients, to maintain a con-stant population density, and to measure growth byoverflow. This technique has been used to determine
1 Receiv-ed March 23, 1953.2 The investigations reported her-e were aided by a
contra(ct between the Office of Naval Research, Depart-ment of the Navy, and the University of Maryland(Nonr 556(00)). Additional support was made possiblethrough the cooperation of the Carnegie Institution ofWN'ashington.
3 Paper No. A403, Contribution No. 2431 of theMaryland Agricultural Experiment Station (Dept. ofBotany).
the effecti'veness of various inorganic and organic nu-trient solutions on growth. The present state of ourknowledge of inorganic nutrition derived from bothcontinuous and discontinuous culture of the algae hasbeen reviewed by Myers (18) and Krauss (15). Theextension and application of this knowledge to pro-duce optimum yields from open cultures has uncov-ered specific problems, demanding further investiga-tion for which mass cultures permitting large andfrequent samples are uniquely suited. The study re-ported in this paper was designed to determine theinorganic requirements and growth characteristics ofScenedesmus obliquus (Turp.) Kiutz. in a continuousmass culture. It is the initial step in an effort toelucidate all factors limiting the growth of algae inmass cultures.
MATERIALS AND METHODSAPPARATUS: The culture apparatus is diagrammed
in figure 1. The algae were grown in glass-covered,polyethylene-lined, white, plywood vats having an il-luminated surface area of 2 m2 and a depth of 20 cm(A). In all experiments the vats were filled to adepth of 15 cm giving cultures of 300 liters. Motors(B) driving stainless steel propellers mounted indiagonal corners of the vat provided rapid circula-tion to prevent sedimentation. Water for the culturesheated to 70°C was passed through a cooling coil ina cold water bath (I) and then through an ion ex-change column (J). Such water with less than 2 ppmof electrolyte (as NaCl) was essentially free of con-taminating organisms. A mixture of 5 % C02-in-airmetered by flow meters (CC) was supplied to theculture through a porous carbon pipe (C) at a rateof 50 1/hr.
Each vat was illuminated by a battery of lightscontaining 16 fluorescent and 12 incandescent lightsmounted on a reflector (S) which was lowered overthe vats during culture. The value of a balancedcombination of incandescent and fluorescent lampshas been discussed by Parker and Borthwick (22).Such a source gives constant light, of as high an in-tensity and with a spectral distribution as near to thatof sunlight as is feasible with artificial sources. Bal-lasts (R) for the fluorescent tubes were mounted out-side the chamber to exclude heat. The light inten-sities read from a Weston Illumination Meter (Model756) are plotted in figure 2. After burning the bulbs
205

PLANT PHYSIOLOGY
,.'.sst GeV
1. A:....9IRd'.,.. >t
FIG. 1. Diagram of the controlled environmeiber and algal culture apparatus: white, polyelined, plywood vat (A); 1/30 HP motor drivingsteel propeller at 1600 RPM (B); porous carlivery pipe for C02 (C); air compressor (D); diivalve (E); C02 cylinder (F); cold water (G); h(H); cold water bath (I); cation-anion exchaumn (J); air conditioners (K); main light conti(L); individual bank switches (M); power linesrescent batteries (N) (0); power lines to inca:batteries (P) (Q); 430 milliampere ballasts (:view, right reflector board in operating positi4500° white 72-T-12 General Electric fluorescercombined power 9600 watts per panel (T); incalamps, frosted, combined power 7200 watts p(U); chain and turnbuckle support (V); solitype chemical centrifuge (X); reservoir (Y); ce:pump (Z); hygrothermograph (AA); glass woolton air filters (BB); variable-area, float-type flov(CC).
200 hours to remove the abnormally high intensity, the maximum illuminance at the cthe culture surface was 1700 fc, averagingfor the entire surface. Irradiance at the sarreached 0.17 gm cal/cm2 x sec and averaged Ical/cm2 x sec as measured by a General Elect:ation meter Type DW-60. Temperature wasstatically controlled by means of two air conc(K) mounted in the wall of the chamber. Itemperatures of 22°C were required to hold tperatures in the cultures to the desired 280Cperature was recorded on a hygrothermograp]Harvesting of the cells from the culture wasby siphoning the culture through a continuoierating stainless steel centrifuge (X). Thenatant medium discharged to a porcelain rfrom which it was returned to the vat by na rubber centrifugal pump (Z).
GROWTH: A strain of Scenedesmus obliqua
nated " WH 50 " obtained from the Biological Lab-oratory at Woods Hole in 1950 and maintained onagar slants was used in all experiments. For inoculathe algae were subcultured in a 1-liter Erlenmeyerflask supplied with 5 % C02-in-air plus a basal nutri-ent medium. A total packed cell volume of 0.01 mladded to 300 1, giving the very low concentration of1,000 cells per ml, was the initial inoculation for eachexperiment.
Growth in the cultures was followed by threemethods: cell count using a hemacytometer, packedcell volume per 100 ml (hereafter referred to as pcv)measured by centrifugation in Goetz phosphoroustubes according to the method of Ketchum and Red-field (14), and dry weight of packed cells resuspendedin distilled water and transferred to tared aluminum
4 cups for drying to constant weight in a vacuum ovenat 40°C.
The bacterial counts were made from plates ofnuitrient agar incubated for 48 hours at 300C accord-ing to the method of Scott (28).
nt cham- ANALYTICAL METHODS: Samples of the culture3thylene- medium and of the cells were taken every 12 hours.stainless The cell samples were dried in vacuo and ground inrbon de- a Wiley Mill to pass a 40-mesh screen prior to re-aphragm weighing for ashing. The samples of the mediumkot water were centrifuged free of cells and stabilized with 3Lnge col- ppm of mercury as bichloride to prevent biologicalrol panel modification of the solution during the interval be-to fluo- tween sampling and analysis. Nitrate N in the me-
ndescent dium was determined by nitration of 4-hydroxy-1,3-R); top dimethylbenzene, as modified from the method of vonion (S); Alten et al (32). The 4-hydroxy-5-nitro-1,3-di-it tubes, methylbenzene was distilled, collected in 12N NaOH,ndescent brought to volume, and the transmission read in aer panel Fisher electrophotometer. In the medium, nitrated-basket and ammoniacal N, designated " total nitrogen," werentrifugal measured by the Devarda method as given in AOACand cot- (16). The cells were analyzed for total N by thew meters semi-micro adaption of the Kjeldahl method of
Ranker (24) using copper and selenium catalysts andthe Kemmerer-Hallett distillation unit. By this
iitial in- method loss of nitrate nitrogen is prevented by addi-enter of tion of salicylic acid. Phosphate in the medium was1,000 fc determined colorimetrically by the ammonium molyb-ne level0.12 gmric radi-thermo-litionerskmbienthe tem-
I. Tem-h (AA).effectedusly op-> super-reservoiraeans of
is desig-
0 30 60 90 i20 .500C0S
FIG. 2. Diagrammatic representation, expressed in fc,of illuminance at the surface of a culture from a batteryof fluorescent and incandescent lamps.
206
.1-.d
.t
;. i..... I}
KRAUSS AND THOMAS-SCENEDESMUS IN MASS CULTURE
date method as given by Lindner (17). In this an-alysis greater precision was obtained by omitting thesodium hydroxide normally required to prevent theexcess acidity found in ashed samples dissolved inhydrochloric acid. Phosphate in the dried cells wasanalyzed by the method in AOAC (16). The sulfatecontent of the medium was determined by the semi-micro method of Reitemeier (25) involving the titra-tion of benzedine sulfate with sodium hydroxide. Thecells were ashed with magnesium nitrate after whichsulfate was precipitated as BaCl2 according to thegravimetric procedcure of AOAC (16). Potassiumanalvses were obtained for both the medium and plantmaterial by flame photometry in a Perkin ElmerFlame Photometer (Model 52-C), using an internallithium standard for all samples. Calcium in the me-diUm was also determined by means of the flamephotometer. The analyses of the cells were carriedout by precipitation of calcium as calcium oxalate asgiven by Blasdale (3). Magnesium analyses of themedium were made with the Titan Yellow method ofPeech and English (23). However this method aswell as the soap titration technique of Burgess andBreazeale (5) proved to be highly erratic and theanalyses showing no absorption of the magnesium ionfrom the solution are considered unsatisfactory. Thegravimetric analyses of the cells by precipitation ofmagnesium as magnesium-ammonium-phosphate (16)proved entirelv satisfactory and reproducible. Thechloride concentration in the medium was determinedbv the silver nitrate titration as given by AOAC (16).Bicarbonate and carbonate values were obtained bytitrating the cell free medium to the phenolphthaleinand methyl orange end points immediately after cen-trifugation of the samples. The method employedwas that of AOAC (16). A Model H Beckman pHmeter was used for all determinations of hydrogenioIn concentration.
RESULTS AND DISCUSSIONThe first five cultures were grown in Detmer's
medium having the following composition: 100.0 gmCa(NO3)2 4H2O; 25.0 gm KCl; 25.0 gm MgSO4.7H20; 25.0 gm KH2PO4; 0.2 gm FeCl3; water tomake 300 1. This medium has been successfully em-ploved for the culture of many species of algae andit was used for introductory studies, first without theaddition of micronutrients and in later experimentswith micronutrients supplied.
In view of the work by Osterlind (20, 21), whichindicated that certain algae could utilize bicarbonatesas readily as dissolved CO2 for a carbon source, thefirst experiment was run to determine if the periodicaddition of pure CO2 would serve as an adequatesupply of CO2. It was considered possible that theintermittent addition of pure CO2 would form suffi-cient bicarbonates to supply the cells adequately dur-ing the periods when gas was not being delivered. Ifthis were true the necessity of maintaining a con-tinuous supply of 5 % C02-in-air would be removed.Therefore pure CO2 was bubbled through the culture
for one hour during each 24-hour period. In 21 daysthe culture had grown from an inoculum of 1,000cells/ml to a concentration of 21,000,000 cells/ml indi-cating that considerable growth could be obtained inthis fashion. Of greater interest was the effect of theone hour of bubbling of CO2 on the pH in the solu-tion. During the course of growth there is a rise intlle pH of all nutrient solutions supplying nitrogenin the form of nitrate as shown bv Urham (31), Ger-loff et al (10), Fowden (9), and others. At, the endof the 10th day the pH of the first culture had risenfrom 6.2 to 10.0. Immediately after one hour ofbubbling carbon dioxide, however, the pH droppedto 6.5 from which level it climbed rapidly to 10.5indicating an efficient removal from solution of eitherdissolved CO2 or buffering bicarbonate ions. Thisfluctuation in pH was observed repeatedly during theculture. In a second culture a continuous mixture of5 % C02-in-air was supplied delivering a constantsupply of carbon and maintaining a steady pH level.This technique resulted in more rapid growth and wasadopted for all subsequent cultures. Neverthelessthese more satisfactory results obtained with theclassical 5 % C02-in-air mixture do not preclude theeffective use of frequent intermittent injections ofpure CO2. Davis (8) has pointed out that maximumgrowth with Chlorella could be obtained with a CO2concentration slightly above 0.03 % as long as rapiddispersal of the gas maintained a saturated conditionthroughout the culture. The problem of rapid dis-persal of pure CO2 to prevent toxic concentrations,however, can be most easily handled by advance dilu-tion with air. In spite of the preferential removal ofinorganic anions the pH of the second culture roseonly to pH 8.0. The conductivity, reflecting bothcation and anion uptake, was reduced from the initial65.0 (K x 105) mhos to 44.0 (K x 105) mhos by the15th dav.
In order to determine the rate of N uptake fromthe medium, analyses for N content were made dur-ing 18 days of growth in a third culture. The nitratecontent of the medium declined from the initial 175ppm to 0 ppm by the 14th day. Growth neverthelesscontinued indicating subsequent sharing of previouslyabsorbed N by daughter cells. Analyses for each ofthe other major nutrients demonstrated that only Nwas exhausted early in the period of culture. Nitro-gen could presumably be replaced by periodic addi-tions of dilute HNO3 thus leaving only one majorlimiting factor to be controlled-the reduction oflight available per cell unit resulting from the increasein cell concentration.
Cultures 4 and 5 were run to investigate theeffects of both a supplemental supply of N and theremoval of the dailv cell increment to prevent pro-gressive reduction in light per unit cell. On theeighth day after inoculation at a concentration of1.3 x 106 cells/ml centrifugation was begun in culturefive. At this point the populations of the two cultureswere similar. The nitrate level in both cultures wasmaintained by periodic addition of dilute HNO3.
207
PLANT PHYSIOLOGY
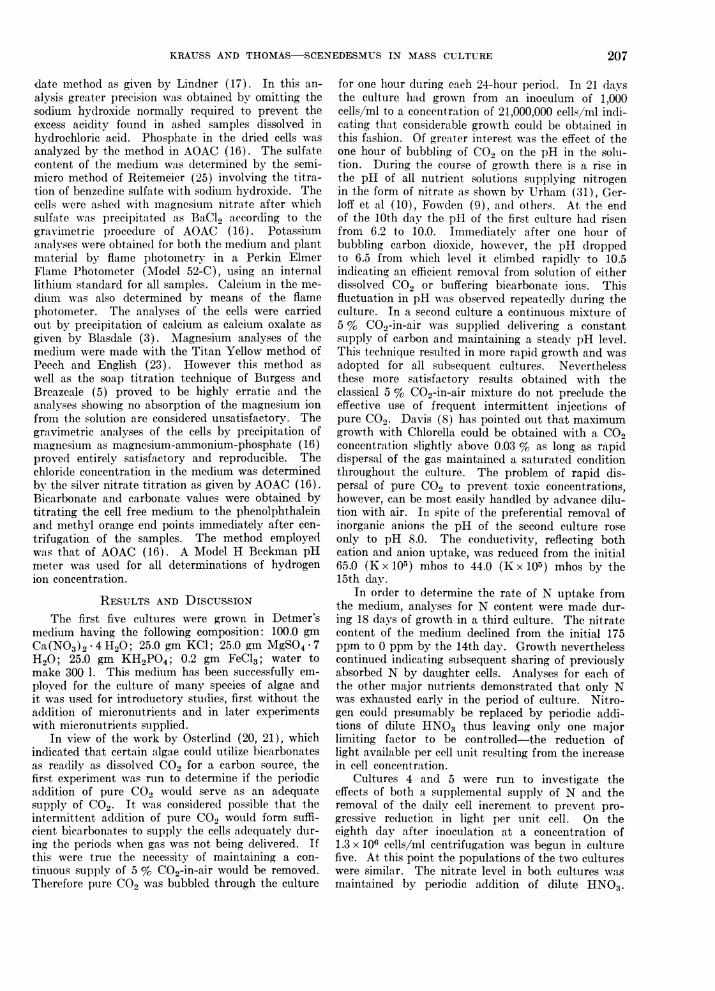
TABLE IDRY CELL WA"EIGHT AND INORGANIC ANALYSES OF THE MEDIUM DURING GROWTH OF
SCENEDESMUS OBLIQUUS IN CULTURE FOUR
SAMPLE MILLI-EQUIVALENTS PER LITER GM DRYDAYS AFTER PH WEIGHTINOCULATION K Ca NO3 PO4 SO4 Cl HCO3 CO3 PER 300 L
0 1.74 2.80 2.65 1.80 0.67 1.17 0.17 0.0 5.0 00.02 1.79 2.80 2.81 1.82 0.66 1.20 0.17 0.0 5.14 1.76 2.80 2.76 1.80 0.70 1.17 0.14 0.0 5.4 12 66 1.76 2.65 2.27 1.64 0.67 1.20 0.75 0.0 6.9 27.28 1.81 2.10 1.65 1.66 0.61 1.20 1.31 0.0 7.2 45.910* 1.76 2.55 2.84 1.24 0.59 1.19 0.17 0.0 4.8 61.212 1.69 2.45 2.45 1.14 0.54 1.18 0.46 0.0 6.7 63.914 1.69 1.80 1.74 0.56 0.49 1.20 1.20 0.0 7.6 105.616 1.61 2.35 1.14 0.80 0.33 1.19 1.93 0.0 7.3 141.618 1.51 1.70 0.46 0.56 0.30 1.18 2.50 0.0 7.5 165.620 1.51 1.65 0.00 0.28 0.28 1.17 3.00 0.0 8.4 209.9
* By the addition of dilute HNO3 the nitrate level was increased 1.4 mEq/1 on the tenth day.
However the daily removal of the cell increment fromculture 5 resulted in no increase in the total drvweight of cells produced by culture 5 nor was there a
major increase in weight in either culture. A factorother than light or nitrogen had become limiting.The reduction in growth could either be attributed tothe accumulation of toxic material or the depletion ofa required nutrient. To test whether certain micro-nutrients may have become limiting, manganese,boron, and zinc in the concentrations used by Craigand Trelease, given by Bold (4), were added to bothcultures on the twelfth day. Growth immediately re-sumed. During the first two subsequent days theyield was greater in the centrifuged culture; on thesucceeding days this total yield was matched and thenexceeded by the non-centrifuged culture suggestingsubtraction, by daily harvest, of micronutrients whichmight otherwise have been shared by subsequent gen-
erations in culture 5. In neither culture was thehigher growth rate prolonged. Clearly micronutrientsintroduced only as impurities in the macronutrientsalts are insufficient to support continued growth inmass cultures, nor can rapid growth rates be sustainedby the addition of only manganese, boron, and zinc.Even though water may have appeared to supply ade-quate micronutrients in innumerable cultures in thepast the effect here obtained would render explicitconclusions based on such cultures open to question.
Inorganic analyses showing iron removal from themedium in culture 4 are given in table I. The 'Mganalyses using the Titan Yellow technique of Peechand English (23), which proved troublesome as a re-sult of some interfering substance in the samples, areomitted. The 1.4 mEq of HNO3 per liter added onthe tenth day is reflected in the analyses. It is alsoreflected in the reduction of the pH to 4.2 and 4.8rather than to the initial 5.0. The preferential uip-take of anions, primarily nitrate, results in an increas-ing concentration of HC03- which is reduced tem-porarily by the addition of the supplementary nitrateand readjustment of pH. The cell counts and weightsshowing lower concentrations of cells in culture 5 in-
dicate some injurv resulting from the sudden drop inpH. From the information delineating comparativerates of ion uptake from the medium, a nutrient solu-tion was prepared which reflected more nearly the re-quirements of the algae for both major and minornutrients. The formula adopted for subsequent cul-tures is given in table II.
Chlorine and calcium were omitted from the majornutrient complement. The concentration of majornutrients was increased by a factor of three except
TABLE IIINORGANIC MEDIUM FOR SCENEDESMUS OBLIQUUS
MACRONUTRIENTSCmpd. mEq/l
KN03 9.9MgSO4*7H20 2.0KH2PO4 5.5
MICRONUTRIENTS *
Stock soluttion 0.1 ml/l givesCmpd. gm/li ppm of themetal
H2B04.2.860 0.05MnCI2 *4H2O.1.810 0.05ZnSO0 .7 H20 .......... 0.222 0.005CtiSO4 5 H20 .......... 0.079 0.002MoO3 .................. 0.015 0.001Ca(NOa)2 4 H20 ....... 59.000 1.00CoCI2 6 H20 ........... 0.04 0.001
IRON SOLUTION **
Cmpl. Stock solution 1 ml/l givesgm/l ppm of Fe
Ferri ic (itrate(FeCoH.O7. - 3 H20) ... 5.30 1.0
Citric acid .... .. 5.30 0.0
* These salts are dissolved in 1 liter 0.1 % HCl.Modified from Ar-non (2).
** Modified from Rodhe (25).
208
KRAUSS AND THOMAS-SCENEDESMUS IN MASS CULTURE
for potassium which was present in excess. A morecomplete micronutrient solution modified from Arnon(2) was included. Boron, cobalt, and molybdenumwere also added although the essentiality of these ionshas not yet been demonstrated for the algae. The pHof the medium was adjusted to 7 by the addition of1.6 ml of 5 % KOH per liter which gave a total valuefor potassium of 13.1 mEq/l. The adoption of thismedium supplied succeeding cultures with nutrientsmore closely related to their quiantitative and quali-tative requirements than Detmer's solution and pro-vided a starting point for a more detailed study ofnutrient supply.
40[
30
201
10
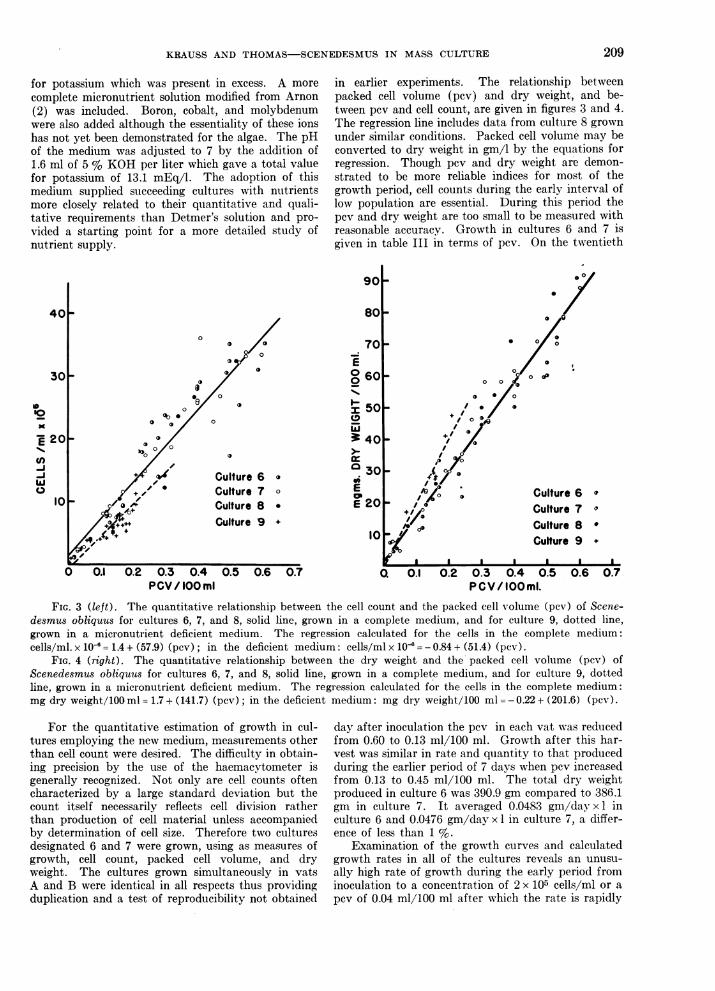
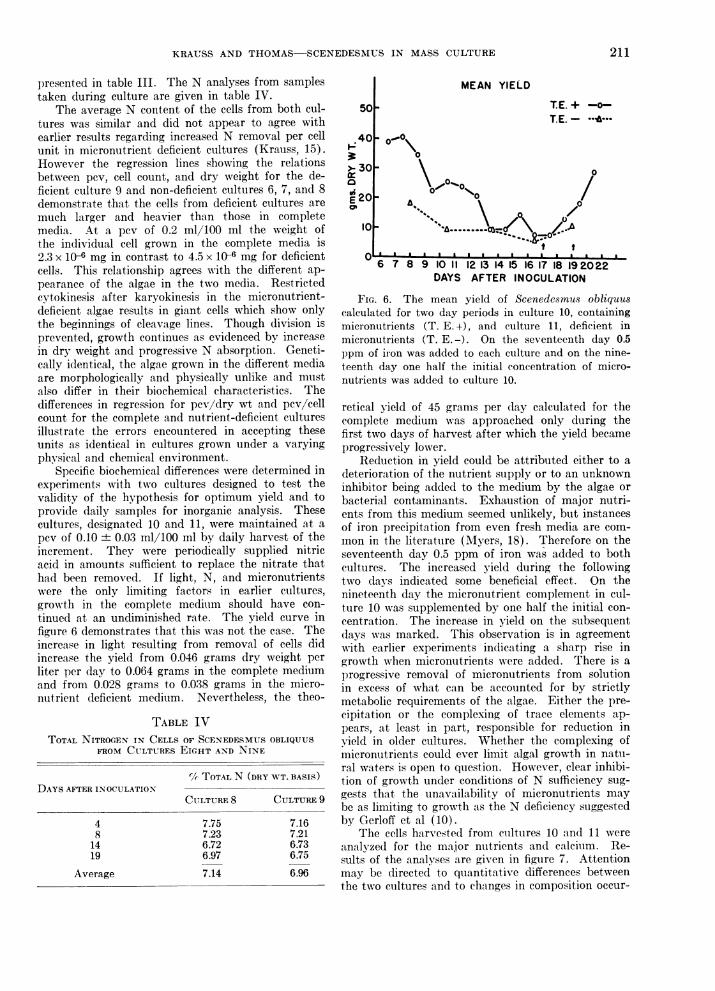
in earlier experiments. The relationship betweenpacked cell volume (pcv) and dry weight, and be-tween pcv and cell count, are given in figures 3 and 4.The regression line includes data from culture 8 grownunder similar conditions. Packed cell volume may beconverted to dry weight in gm/l by the equations forregression. Though pcv and dry weight are demon-strated to be more reliable indices for most of thegrowth period, cell counts during the early interval oflow population are essential. During this period thepcv and dry weight are too small to be measured withreasonable accuracy. Growth in cultures 6 and 7 isgiven in table III in terms of pcv. On the twentieth
90
80
00 0O
0
00
/
* 0
o0
a00o00
+,2 Culture 6 0
+ * Culture 7 o
/0o Culture 8.Culture 9 +
49 .4.S ++/
/
70
8 6050
x 50
3 40
a 30
E 20
10
0 0.1 0.2 0.3 0.4 0.5 0.6 0.7PCV/1OOml
a 0 /
0I
,o* 0/
/o0 0°
+f/* ~~// */0
0
Culture 6 Y
+* , Culture 7 aA co Culture 8 e
Culture 9 +a@ I I
Q 0.1 0.2 0.3 0.4 0.5 0.6 0.7PCV/lOOml.
FIG. 3 (left). The quantitative relationship between the cell count and the packed cell volume (pcv) of Scene-desmus obliquus for cultures 6, 7, and 8, solid line, grown in a complete medium, and for culture 9, dotted line,grown in a micronutrient deficient medium. The regression calculated for the cells in the complete medium:cells/ml. x 10-6= 1.4 + (57.9) (pcv); in the deficient medium: cells/ml x 106 = -0.84 + (51.4) (pcv).
FIG. 4 (right). The quantitative relationship between the dry weight and the packed cell volume (pcv) ofScenedesmus obliquus for cultures 6, 7, and 8, solid line, grown in a complete medium, and for culture 9, dottedline, grown in a micronutrient deficient medium. The regression calculated for the cells in the complete medium:mg dry weight/100 ml = 1.7 + (141.7) (pev); in the deficient medium: mg dry weight/100 ml = - 0.22 + (201.6) (pcv).
For the quantitative estimation of growth in cul-tures emploving the new medium, measurements otherthan cell count were desired. The difficulty in obtain-ing precision by the use of the haemacytometer isgenerally recognized. Not only are cell counts oftencharacterized by a large standard deviation but thecount itself necessarily reflects cell division ratherthan production of cell material unless accompaniedby determination of cell size. Therefore two culturesdesignated 6 and 7 were grown, using as measures ofgrowth, cell count, packed cell volume, and dryweight. The cultures grown simultaneously in vatsA and B were identical in all respects thus providingduplication and a test of reproducibility not obtained
day after inoculation the pcv in each vat was reducedfrom 0.60 to 0.13 ml/100 ml. Growth after this har-vest was similar in rate and quantity to that producedduring the earlier period of 7 days when pcv increasedfrom 0.13 to 0.45 ml/100 ml. The total dry weightproduced in culture 6 was 390.9 gm compared to 386.1gmi in culture 7. It averaged 0.0483 gm/dayxl inculture 6 and 0.0476 gm/day x 1 in culture 7, a differ-ence of less than 1 %.
Examination of the growth curves and calculatedgrowth rates in all of the cultures reveals an unusu-ally high rate of growth during the early period frominoculation to a concentration of 2 x 10⁵ cells/ml or apcv of 0.04 ml/100 ml after which the rate is rapidly
I
209
m

PLANT PHYSIOLOGY
reduced. However established, an accurate estimateof growth during this period is difficult because of therelatively small population. Using the division rateestablished by cell count in the formula:
log. C- = K(T2 - T1)C1
where C1 is the concentration at time T, C2 the con-centration at a later time T2, and using logs to thebase 2 (3.32 x logl0), the reciprocal of the generationtime can be plotted. Figure 5 gives the growth rate,K, for cultures 6, 7, and 8. Though the peak rate of4.72 log2 units may be high due to measurement error,the average rate for the first and second days is 3.93log2 units and this may be considered nearly themaximum rate attainable under ideal conditions.
To secure the maximum yield from a populationcharacterized by a growth rate which decreases as thepopulation increases, a harvesting regime should beestablished to remove any increment to the popula-tion beyond the point where the product of growthrate multiplied by concentration gives the maximumvalue (11, 12). This value will not be at the point ofmaximum rate but will be found at a lower ratewhich, applied to a higher population base, results ina greater yield. In these cultures the maximum isattained when the pcv is 0.10 ml/100 ml, the cellcount 7.5 x 10⁶/ml, and the dry weight 15 mg/100 ml.At this point, 4.5 days after inoculation, the growthrate is 1.0 log2 units. Therefore if this rate could bemaintained (light is the only limiting factor) the cul-ture should produce 45 gm dry weight every 24 hours.Essentially the same point is calculated using eithercell count or pcv as an index of growth.
Before testing the hypothetical productivity of aculture over a period of many days, it was essential
z
-
0'
Culture 6 *Culture 7 0
Culture 8 0
TABLE IIIGROWTH MEASUREMENTS OF SCENEDESMUS OBLIQUUS DUR-ING CULTURES SIX, SEVEN, EIGHT WITH MICRONUTRIENTS
AND CULTURE NINE DEFICIENT IN MICRONUTRIENTS
DAYS CULTURE 6 CULTURE 7 CULTURE 8 CULTURE 9AFTER PCV PCV PCV PCVINOCU-LATION ML/100 ML
00.511.522.533.544.555.566.577.588.599.51010.51111.51212.51313.51414.51515.51616.51717.51818.51919.52020.52121.52222.52323.52424.52525.52626.5
0.000.000.000.010.010.020.030.040.060.120.120.120.150.130.150.170.190.220.230.240.280.260.300.280.320.400.400.400.400.410.440.490.520.530.600.500.550.500.520.590.110.150.160.170.170.230.240.280.320.300.320.320.450.50
0.000.000.000.000.010.020.030.050.070.110.120.120.130.130.160.17
0.240.250.270.310.310.360.360.380.410.410.400.450.400.450.470.500.530.550.550.520.550.600.600.600.610.130.130.150.190.220.240.290.280.280.320.450.45
0.000.000.000.010.010.010.010.020.040.070.100.11
0.160.190.220.240.300.300.300.300.250.260.260.300.310.300.310.340.340.370.370.400.380.390.500.650.520.520.54
0.000.000.000.010.010.010.010.010.010.040.060.07
0.100.110.120.140.140.140.140.140.160.160.140.180.160.150.120.160.160.170.170.180.190.200210.230.210.210.21
DAYS AFTER INOCULATION to know more closely how much N must be returnedFIG. 5. Growth rates (K) for Scenedesmus obliquus to the medium each day. It was also of interest to
during cultures 6, 7, and 8 calculated from the formula determine the total N content of cells grown underC2
- TO. The term, , is equivalent to the micronutrient deficiency. Cultures 8 and 9 were de-l,o signed to give this information as well as to providereciprocal of the generation time in days and equals additional data concerning the relationships betweenlog,s x 3.32. pcv, cell count, and dry weight. The growth data are
210
KRAUSS AND THOMAS-SCENEDESMUS IN MASS CULTURE
p)resented in table III. The N analyses from samplestaken during culture are given in table IV.
The average N content of the cells from both cul-tures was similar and did not appear to agree withearlier results regarding increased N removal per cellunit in micronutrient deficient cultures (Krauss, 15).However the regression lines showing the relationsbetween pcv, cell count, and dry weight for the de-ficient culture 9 and non-deficient cultures 6, 7, and 8demonstrate that the cells from deficient cultures aremuch larger and heavier than those in completemedia. At a pcv of 0.2 ml/100 ml the weight ofthe individual cell grown in the complete media is2.3 x 10-6 mg in contrast to 4.5 x 10⁶ mg for deficientcells. This relationship agrees with the different ap-pearance of the algae in the two media. Restrictedevtokinesis after karyokinesis in the micronutrient-deficient algae results in giant cells which show onlythe beginnings of cleavage lines. Though division isprevented, growth continues as evidenced by increasein dry weight and progressive N absorption. Geneti-cally identical, the algae grown in the different mediaare morphologically and physically unlike and mustalso differ in their biochemical characteristics. Thedifferences in regression for pcv/dry wt and pcv/cellcount for the complete and nutrient-deficient culturesillustrate the errors encountered in accepting theseunits as identical in cultures grown under a varyingphysical and chemical environment.
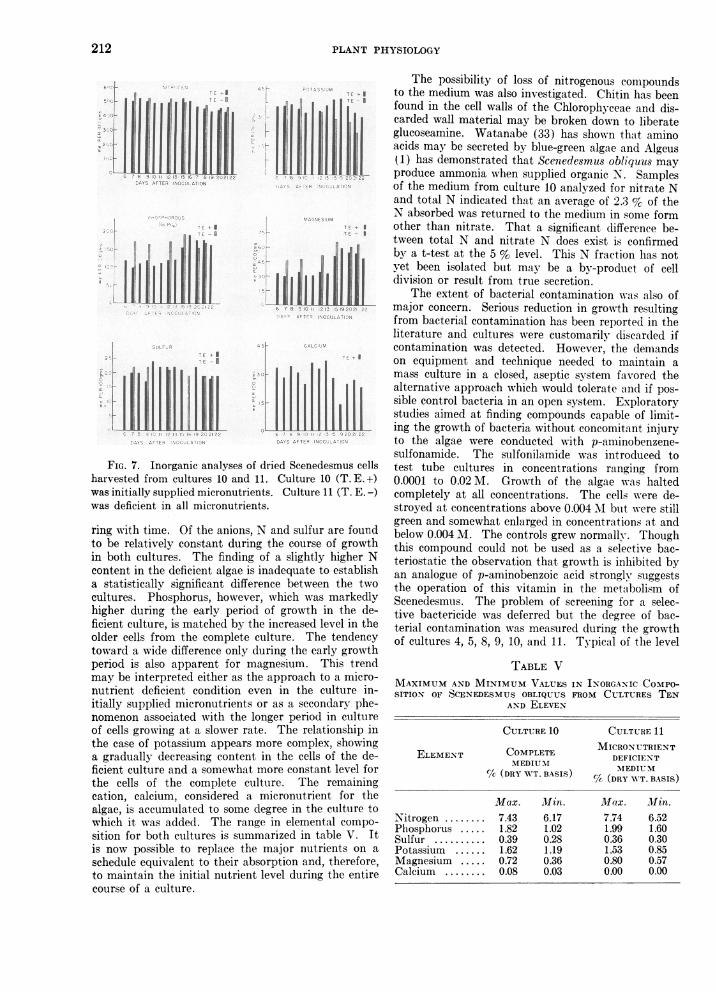
Specific biochemical differences were determined inexperiments with two cultures designed to test thevalidity of the hypothesis for optimum yield and toprovide daily samples for inorganic analysis. Thesecultures, designated 10 and 11, were maintained at apcv of 0.10 + 0.03 ml/100 ml by daily harvest of theincrement. They were periodically supplied nitricacid in amounts sufficient to replace the nitrate thathad been removed. If light, N, and micronutrientswere the only limiting factors in earlier cultures,growth in the complete meditum should have con-tinued at an undiminished rate. The yield curve infigure 6 demonstrates that this was not the case. Theincrease in light resulting from removal of cells didincrease the yield from 0.046 grams dry weight perliter per day to 0.064 grams in the complete mediumand from 0.028 grams to 0.038 grams in the micro-nutrient deficient medium. Nevertheless, the theo-
TABLE IVTOTAL NITROGEN IN CELLS OF SCENEDESMUS OBLIQUUS
FROM CULTURES EIGHT AND NINE
%/( TOTAL N (DRY WT. BASIS)DAYS AFTER INOCULATION
CULTURE 8 CULTURE 9
4 7.75 7.168 7.23 7.2114 6.72 6.7319 6.97 6.75
Average 7.14 6.96
50[
40
>- 30
E 20
1o0
MEAN YIELD
T.E.+ -o-T.E.- '-
0.1,O..o*\-a,,A,, \- 0/0
t t
6 7 8 9 10 II 12 13 14 15 16 I7 18 192022DAYS AFTER INOCULATION
FIG. 6. The mean yield of Scenedesmus obliquuscalculated for two day periods in culture 10, containingmicronutrients (T. E.+), and culture 11, deficient inmicronutrients (T. E.-). On the seventeenth day 0.5ppm of iron was added to each culture and on the nine-teenth day one half the initial concentration of micro-nutrients was added to culture 10.
retical yield of 45 grams per day calculated for thecomplete medium was approached only during thefirst two days of harvest after which the yield becameprogressively lower.
Reduction in yield could be attributed either to adeterioration of the nutrient supply or to an unknowninhibitor being added to the medium by the algae orbacterial contaminants. Exhaustion of major nutri-ents from this medium seemed unlikely, but instancesof iron precipitation from even fresh media are com-mon in the literature (Myers, 18). Therefore on theseventeenth day 0.5 ppm of iron was added to bothcultures. The increased yield during the followingtwo days indicated some beneficial effect. On thenineteenth day the micronutrient complement in cul-ture 10 was supplemented by one half the initial con-centration. The increase in yield on the subsequentdays was marked. This observation is in agreementwith earlier experiments indicating a sharp rise ingrowth when micronutrients were added. There is aprogressive removal of micronutrients from solutionin excess of what can be accounted for by strictlymetabolic requirements of the algae. Either the pre-cipitation or the complexing of trace elements ap-pears, at least in part, responsible for reduction inyield in older cultures. Whether the complexing ofmicronutrients could ever limit algal growth in natu-ral waters is open to question. However, clear inhibi-tion of growth under conditions of N sufficiency sug-gests that the unavailability of micronutrients maybe as limiting to growth as the N deficiency suggestedby Gerloff et al (10).
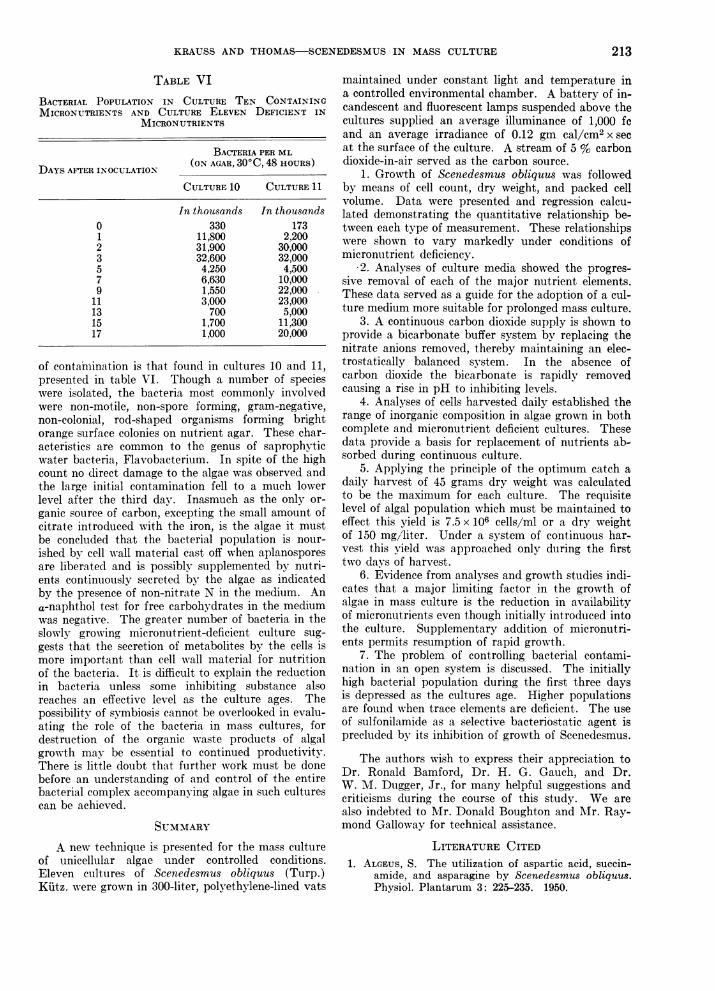
The cells harvested from cultures 10 and 11 wereanalyzed for the major nutrients and calcium. Re-sults of the analyses are given in figure 7. Attentionmay be directed to quantitative differences betweenthe two cutltures and to changes in composition occur-
211
PLANT PHYSIOLOGY
harvested from cultures 10 and 11. Culture 10 (T.E.1+)was initially supplie'd micronutrients. Culture 11 (T. E. -)
was deficient in all micronutrients.
ring with time. Of the anions, N and sulfur are found
to be relatively constant during the course of growthin both cultures. The finding of a slightly higher N
content in the deficient algae is inadequate to establish
a statistically significant, difference between the two
cultures. Phosphorus, however, which was markedly
higher during, the early period of growth in the de-
ficient culture, is matched by the increased level in the
older cells from the complete culture. The tendency
toward a wide difference only during the early growth
period is also apparent for magnesium. This trend
may be interpreted either as the approach to a micro-
nutrient deficient condition even in the culture in-
itially supplied micronutrients or as a secondary phe-nomenon associated with the longer period in culture
of cells growing at a slower rate. The relationship in
the case of potassium appears more complex, showing-a gradually decreasing, content in the cells of the de-
ficient culture and a somewhat more constant level for
the cells of the complete culture. The remaining
cation, calcium, considered a micronutrient for the
alg,ae, is accumulated to some deg~ree in the culture to
which it was added. The range in elemental compo-
sition for both cultures is summarized in table V. It
is now possible to replace the major nutrients on a
schedule equivalent to their absorption and, therefore,
to maintain the initial nutrient level during the en-tire
course of a culture.
The possibility of loss of nitrogenous compoundsto the medium was also investigated. Chitin has beenfound in the cell walls of the Chlorophyceae and dis-carded wall material may be broken down to liberateglucoseamine. Watanabe (33) has shown that aminoacids may be secreted by blue-green algae and Algeus(1) has demonstrated that Scenedesmuts obliquas mayproduce ammonia when supplied organic N. Samplesof the medium from culture 10 analyzed for nitrate Nand total N indicated that an average of 2.3 % of theN absorbed was returned to the medium in some formother than nitrate. That a significant lifference be-tween total N and nitrate N does exist is confirmedby a t-test at the 5 % level. This N fraction has notyet been isolated but may be a by-product of celldivision or result from true secretion.
The extent of bacterial contamination was also ofmajor concern. Serious reduction in growth resultingfrom bacterial contamination has been reported in theliterature and cultures were customarily discarded ifcontamination was detected. However, the demandson equipment and technique needed to maintain amass culture in a closed, aseptic system favored thealternative approach which would tolerate and if pos-sible control bacteria in an open system. Exploratorystudies aimed at finding compounds capable of limit-ing the growth of bacteria without concomitant injuryto the algae were conducted with p-aminobenzene-sulfonamide. The sulfonilamide was introduced totest tube cultures in concentrations ranging from0.0001 to 0.02M. Growth of the algae was haltedcompletely at all concentrations. The cells were de-stroyed at concentrations above 0.004 M but were stillgreen and somewhat enlarged in concentrations at andbelow 0.004 M. The controls grew normally. Thoughthis compound could not be used as a selective bac-teriostatic the observation that growth is inhibited byan analogue of p-aminobenzoic acid strongly suggeststhe operation of this vitamin in the metabolism ofScenedesmus. The problem of screening for a selee-tive bactericide was deferred but the degree of bac-terial contamination was measured during the growthof cultures 4, 5, 8, 9, 10, and 11. Typical of the level
TABLE VMAXIMUM AND MINIMUM VALUES IN INORGANIC COMPO-SITION OF SCENEDESMUS OBLIQUUS FROM CULTIURES TEN
AND ELEVEN
CULTURE 10 CULTURE 11
COMPLETE MICRO-N-UTRIEN_~-TELEMENT MPETE DEFICIENTMEDIUM-EDIUMC/C (DRY WT. BASIS) CMC(DRY IUT. BASIS)
Max. Min. Max. Min.Nitrogen ........ 7.43 6.17 7.74 6.52Phosphorus ..... 1.82 1.02 1.99 1.60Sulfur .......... 0.39 0.28 0.36 0.30Potassium ...... 1.62 1.19 1.53 0.85Magnesium ..... 0.72 0.36 0.80 0.57Calcium ........ 0.08 0.03 0.00 0.00
212
KRAUSS AND THOMAS-SCENEDESMUS IN MASS CULTURE
TABLE VIBACTERIAL POPULATION IN CULTURE TEN CONTAININGMICRONUTRIENTS AND CULTURE ELEVEN DEFICIENT IN
MICRONUTRIENTS
BACTERIA PER ML
DAYS AFTER INOCULATION (ON AGAR, 30'C, 48 HOURS)
CULTURE 10 CULTURE 11
In thousands In thousands0 330 1731 11,800 2,2002 31,900 30,0003 32,600 32,0005 4,250 4,5007 6,630 10,0009 1,550 22,000
11 3,000 23,00013 700 5,00015 1,700 11,30017 1,000 20,000
of contamaination is that found in cultures 10 and 11,presented in table VI. Though a number of specieswere isolated, the bacteria most commonly involvedwere non-motile, non-spore forming, gram-negative,non-colonial, rod-shaped organisms forming brightorange surface colonies on nutrient agar. These char-acteristics are common to the genus of saprophyticwater bacteria, Flavobacterium. In spite of the highcount no direct damage to the algae was observed andthe large initial contamination fell to a much lowerlevel after the third day. Inasmuch as the only or-
ganic source of carbon, excepting the small amount ofcitrate introduced with the iron, is the algae it mustbe concluded that the bacterial population is nour-
ished by cell wall material cast off when aplanosporesare liberated and is possibly supplemented by nutri-ents continuously secreted by the algae as indicatedby the presence of non-nitrate N in the medium. Ana-naphthol test for free carbohydrates in the mediumwas negative. The greater number of bacteria in theslowly growing micronutrient-deficient culture sug-gests that the secretion of metabolites by the cells ismore important than cell wall material for nutritionof the bacteria. It is difficult to explain the reductionin bacteria unless some inhibiting substance alsoreaches an effective level as the culture ages. Thepossibility of symbiosis cannot be overlooked in evalu-ating the role of the bacteria in mass cultures, fordestruction of the organic waste products of algalgrowth may be essential to continued productivity.There is little doubt that further work must be donebefore an understanding of and control of the entirebacterial complex accompanying algae in such culturescan be achieved.
SUMMARYA new technique is presented for the mass culture
of unicellular algae under controlled conditions.Eleven cultures of Scenedesmus obliquus (Turp.)Kiutz. were grown in 300-liter, polyethylene-lined vats
maintained under constant light and temperature ina controlled environmental chamber. A battery of in-candescent and fluorescent lamps suspended above thecultures supplied an average illuminance of 1,000 fcand an average irradiance of 0.12 gm cal/cm2x secat the surface of the culture. A stream of 5 % carbondioxide-in-air served as the carbon source.
1. Growth of Scenedesmus obliquus was followedby means of cell count, dry weight, and packed cellvolume. Data were presented and regression calcu-lated demonstrating the quantitative relationship be-tween each type of measurement. These relationshipswere shown to vary markedly under conditions ofmicronutrient deficiency.
2. Analyses of culture media showed the progres-sive removal of each of the major nutrient elements.These data served as a guide for the adoption of a cul-ture medium more suitable for prolonged mass culture.
3. A continuous carbon dioxide supply is shown toprovide a bicarbonate buffer system bv replacing thenitrate anions removed, thereby maintaining an elec-trostatically balanced system. In the absence ofcarbon dioxide the bicarbonate is rapidly removedcausing a rise in pH to inhibiting levels.
4. Analyses of cells harvested daily established therange of inorganic composition in algae grown in bothcomplete and micronutrient deficient cultures. Thesedata provide a basis for replacement of nutrients ab-sorbed during continuous culture.
5. Applying the principle of the optimum catch adaily harvest of 45 grams dry weight was calculatedto be the maximum for each culture. The requisitelevel of algal population which must be maintained toeffect this yield is 7.5 x 10⁶ cells/ml or a dry weightof 150 mg/liter. Under a system of continuous har-vest this yield was approached only during the firsttwo days of harvest.
6. Evidence from analyses and growth studies indi-cates that a major limiting factor in the growth ofalgae in mass culture is the reduction in availabilityof micronutrients even though initially introduced intothe culture. Supplementary addition of micronutri-ents permits resumption of rapid growth.
7. The problem of controlling bacterial contami-nation in an open system is discussed. The initiallyhigh bacterial population during the first three daysis depressed as the cultures age. Higher populationsare found when trace elements are deficient. The useof sulfonilamide as a selective bacteriostatic agent isprecluded by its inhibition of growth of Scenedesmus.
The authors wish to express their appreciation toDr. Ronald Bamford, Dr. H. G. Gauch, and Dr.W. M. Dugger, Jr., for many helpful suggestions andcriticisms during the course of this study. We arealso indebted to Mr. Donald Boughton and Mr. Ray-mond Galloway for technical assistance.
LITERATURE CITED1. ALGEUS, S. The utilization of aspartic acid, succin-
amide, and asparagine by Scenedesmus obliquus.Physiol. Plantarum 3: 225-235. 1950.
213
PLANT PHYSIOLOGY
2. ARNON, D. I. Micro-elements in culture solutionexperiments with higher plants. Amer. Jour. Bot.25: 322-325. 1938.
3. BLASDALE, W. C. The quantitative separation ofcalcium from magnesium. Jour. Amer. Chem.Soc. 31: 917-922. 1909.
4. BOLD, H. C. The cultivation of algae. Bot. Rev. 8:69-138. 1942.
5. BURGESS, P. S. and BREAZEALE, J. F. Methods fordetermining the replaceable bases of soils either inthe presence or absence of alkali salts. Univ. Ari-zona Tech. Bull. No. 9: 187-207. 1926.
6. BURLEW, J. S., Editor. Algal Culture: From Labora-tory to Pilot Plant. Carnegie Inst. Wash. Publ.No. 600. 1952.
7. COMBS, G. F. Algae (Chlorella) as a source ofnutrients for the chick. Science 116: 453454.1952.
8. DAVIS, E. A. Quantitative studies of factors influ-encing the growth of Chlorella pyrenoidosa. Car-negie Inst. Wash. Yearbook No. 51: 135-138. 1952.
9. FOWDEN, L. The effect of age on the bulk proteincomposition of Chlorella vulgaris. Biochem. Jour.52: 310-314. 1952.
10. GERLOFF, G. C., FITZGERALD, G. P., and SKOOG, F.The mineral nutrition of Microcystis aeruginosa.Amer. Jour. Bot. 39: 26-32. 1952.
11. HJORT, J., JAHN, G., and OTTESTAD, P. Essays onpopulation: the optimum catch. Hvalradets Skrif-ter 7: 92-127. 1933.
12. KETCHUM, B. H., LILLICK, L., and REDFIELD, A. Thegrowth and optimum yields of unicellular algae inmass culture. Jour. Cell. Comp. Physiol. 33: 267-280. 1949.
13. KETCHUM, B. H. and REDFIELD, A. C. A method formaintaining a continuous supply of marine di-atoms by culture. Biol. Bull. 75: 165-169. 1938.
14. KETCHUM, B. H. and REDFiELD, A. C. Some physi-cal and chemical characteristics of algae grown inmass culture. Jour. Cell. Comp. Physiol. 33: 281-299. 1949.
15. KRAUSS, R. W. The inorganic nutrition of algae.In: Algal Culture: From Laboratory to PilotPlant. J. S. Burlew, Editor. Carnegie Inst. Wash.Publ. No. 600: 85-102. 1952.
16. LEPPER, H. A., Chairman. Official and TentativeMethods of Analysis of the Association of OfficialAgricultural Chemists. 6th Ed. Assoc. Offic. Agr.Chemists, Washington, D. C. 1945.
17. LINDNER, R. C. Rapid analytical methods for someof the more common inorganic constituents ofplant tissues. Plant Physiol. 19: 76-89. 1944.
18. MYERS, J. Physiology of the algae. Ann. Rev.Microbiol. 3: 157-180. 1951.
19. MYERS, J. and CLARK, L. B. Culture conditions andthe development of the photosynthetic mecha-nism. II. An apparatus for the continuous cul-ture of Chlorella. Jour. Gen. Physiol. 28: 103-112.1944.
20. OSTERLIND, S. The retarding effect of high concen-trations of carbon dioxide and carbonate ions onthe growth of a green alga. Physiol. Plantarum 1:170-175. 1948.
21. OSTERLIND, S. Inorganic carbon sources of greenalgae. I. Growth experiments with Scenedesmusquadricauda and Chlorella pyrenoidosa. Physiol.Plantarum 3: 353-360. 1950.
22. PARKER, M. W. and BORTHWICK, H. A. Influence oflight on plant growth. Ann. Rev. Plant Physiol.1: 43-58. 1950.
23. PEECH, M. and ENGLISH, L. Rapid micro-chemicalsoil tests. Soil Sci. 57: 167-195. 1944.
24. RANKER, E. R. A modification of the salicylicthio-sulfate methods suitable for the determination oftotal N in plants, plant solutions, and soil extracts.Jour. Assoc. Offic. Agr. Chemists 10: 230-251.1927.
25. REITEMEIER, R. F. Semimicroanalysis of saline soilsolutions. Ind. Eng. Chem. Anal. Ed. 15: 393.1943.
26. RODHE, W. Environmental requirements of fresh-water plankton algae. Symbolae Bot. Upsalienses10: 1-149. 1948.
27. ScoTT, G. T. The mineral composition of Chlorellapyrenoidosa grown in culture media containingvarying concentrations of calcium, magnesium,potassium, and sodium. Jour. Cell. Comp. Physiol.21: 327-328. 1943.
28. ScorT, W. W. Standard Methods of ChemicalAnalysis. Vol. II. 5th Ed. D. van Nostrand Co.,Inc., New York. 1939.
29. SPOEHR, H. A. Chlorella as a source of food. Proc.Amer. Phil. Soc. 95: 62-67. 1951.
30. SPOEHR, H. A. and MILNER, H. W. The chemicalcomposition of Chlorella: effect of environmentalconditions. Plant Physiol. 24: 120-149. 1949.
31. URHAM, 0. Beitriige zur Kenntnis der Stickstoff-assimilation von Chlorella und Scenedesmus.Jahrb. wiss. Bot. 75: 1-44. 1932.
32. VON ALTEN, F., WONDROWSKY, B., and HILLE, E. DieBestimmung des Nitratstickstoffes in Pflanzensub-stanzen als Nitroxylenol. Bodenkunde Pflanzener-niihr. 1: 340-348. 1936.
33. WATANABE, A. Production in cultural solution ofsome amino acids by the atmospheric nitrogenfixing blue-green algae. Arch. Biochem. Biophys.34: 50-55. 1951.
214