PIONEERING APPROACH FOR INDUSTRIAL WASTE BY FREQUENCY ANALYSIS THROUGH SPSS SOFTWARE IN CHAROTAR...
26
Journal of International Academic Research for Multidisciplinary ISSN 2320 -5083 A Scholarly, Peer Reviewed, Monthly, Open Access, Online Research Journal Impact Factor – 1.393 VOLUME 1 ISSUE 11 DECEMBER 2013 A GLOBAL SOCIETY FOR MULTIDISCIPLINARY RESEARCH www.jiarm.com A GREEN PUBLISHING HOUSE
-
Upload
marwadieducation -
Category
Documents
-
view
2 -
download
0
Transcript of PIONEERING APPROACH FOR INDUSTRIAL WASTE BY FREQUENCY ANALYSIS THROUGH SPSS SOFTWARE IN CHAROTAR...
Journal of International Academic Research for Multidisciplinary
ISSN 2320 -5083
A Scholarly, Peer Reviewed, Monthly, Open Access, Online Research Journal
Impact Factor – 1.393
VOLUME 1 ISSUE 11 DECEMBER 2013
A GLOBAL SOCIETY FOR MULTIDISCIPLINARY RESEARCH
www.jiarm.com
A GREEN PUBLISHING HOUSE
Editorial Board
Dr. Kari Jabbour, Ph.D Curriculum Developer, American College of Technology, Missouri, USA.
Er.Chandramohan, M.S System Specialist - OGP ABB Australia Pvt. Ltd., Australia.
Dr. S.K. Singh Chief Scientist Advanced Materials Technology Department Institute of Minerals & Materials Technology Bhubaneswar, India
Dr. Jake M. Laguador Director, Research and Statistics Center, Lyceum of the Philippines University, Philippines.
Prof. Dr. Sharath Babu, LLM Ph.D Dean. Faculty of Law, Karnatak University Dharwad, Karnataka, India
Dr.S.M Kadri, MBBS, MPH/ICHD, FFP Fellow, Public Health Foundation of India Epidemiologist Division of Epidemiology and Public Health, Kashmir, India
Dr.Bhumika Talwar, BDS Research Officer State Institute of Health & Family Welfare Jaipur, India
Dr. Tej Pratap Mall Ph.D Head, Postgraduate Department of Botany, Kisan P.G. College, Bahraich, India.
Dr. Arup Kanti Konar, Ph.D Associate Professor of Economics Achhruram, Memorial College, SKB University, Jhalda,Purulia, West Bengal. India
Dr. S.Raja Ph.D Research Associate, Madras Research Center of CMFR , Indian Council of Agricultural Research, Chennai, India
Dr. Vijay Pithadia, Ph.D, Director - Sri Aurobindo Institute of Management Rajkot, India.
Er. R. Bhuvanewari Devi M. Tech, MCIHT Highway Engineer, Infrastructure, Ramboll, Abu Dhabi, UAE Sanda Maican, Ph.D. Senior Researcher, Department of Ecology, Taxonomy and Nature Conservation Institute of Biology of the Romanian Academy, Bucharest, Romania Dr. Reynalda B. Garcia Professor, Graduate School & College of Education, Arts and Sciences Lyceum of the Philippines University Philippines Dr.Damarla Bala Venkata Ramana Senior Scientist Central Research Institute for Dryland Agriculture (CRIDA) Hyderabad, A.P, India PROF. Dr.S.V.Kshirsagar, M.B.B.S,M.S Head - Department of Anatomy, Bidar Institute of Medical Sciences, Karnataka, India. Dr Asifa Nazir, M.B.B.S, MD, Assistant Professor, Dept of Microbiology Government Medical College, Srinagar, India. Dr.AmitaPuri, Ph.D Officiating Principal Army Inst. Of Education New Delhi, India Dr. Shobana Nelasco Ph.D Associate Professor, Fellow of Indian Council of Social Science Research (On Deputation}, Department of Economics, Bharathidasan University, Trichirappalli. India M. Suresh Kumar, PHD Assistant Manager, Godrej Security Solution, India. Dr.T.Chandrasekarayya,Ph.D Assistant Professor, Dept Of Population Studies & Social Work, S.V.University, Tirupati, India.
JOURNAL OF INTERNATIONAL ACADEMIC RESEARCH FOR MULTIDISCIPLINARY Impact Factor 1.393, ISSN: 2320-5083, Volume 1, Issue 11, December 2013
301 www.jiarm.com
PIONEERING APPROACH FORINDUSTRIAL WASTE BY FREQUENCY ANALYSIS THROUGH SPSS SOFTWARE IN CHAROTAR REGION OF CENTRAL GUJARAT
VIRENDRAKUMAR B. BHATT*
ASHISH H. MAKWANA**
JAYESHKUMAR PITRODA***
*Final Year B. E. Civil Engg., B.V.M. Engg. College, Vallabh Vidyanagar, Gujarat, India
** Final Year M.E. C. E. & M., B.V.M. Engg. College, Vallabh Vidyanagar, Gujarat, India ***Assistant Professor & Research Scholar, Dept. of Civil Engg., B.V.M. Engg. College, Vallabh Vidyanagar , Gujarat, India
ABSTRACT Industrialization has become an important factor to the development of a country’s
economy, through the establishment of plants and factories. However, the waste or by-
products discharged from them are severely disastrous to the environment consists various
kind of contaminant which contaminate the surface water, ground water and soil. There are a
number of reasons the waste are not safely treated. One of the reasons is mainly due to the
lacking of highly efficient and economic treatment technology. Ever since the Industrial
Revolution, industrial activities have been accompanied by a problem: industrial waste. The
commensurate increase in industrialization, urbanization and population growth are leading
to production of enormous quantities of industrial wastes that may cause degradation in
environment and health hazards. On the other hand, the desire for a healthy environment
increases, which leads to the need for better ways of waste minimization, pollution
prevention and better use of resources in achieving the required industrial and environmental
standards. During this research work various factors interrelated to industrial waste are being
identified and converted into questionnaire to carry out surveys. Software like Microsoft
Excel and SPSS Statistics (Statistical Package for the Social Sciences) are adopted to
evaluate the responses collected from the people by frequency distribution analysis.
KEYWORDS: Construction Activity, Construction and Demolition, Environment,
Construction Industry, Technology, Industrial Revolution, Industrial Wastes.
INTRODUCTION Waste is an unavoidable by-product of most human activity. Economic development
and rising living standards have led to increases in the quantity and complexity of generated
waste, whilst industrial diversification and the provision of expanded health-care facilities
have added substantial quantities of industrial hazardous waste and biomedical waste into the
waste stream with potentially severe environmental and human health consequences.
JOURNAL OF INTERNATIONAL ACADEMIC RESEARCH FOR MULTIDISCIPLINARY Impact Factor 1.393, ISSN: 2320-5083, Volume 1, Issue 11, December 2013
302 www.jiarm.com
Industrial waste is the waste produced by industrial activity which includes any material that
is rendered useless during a manufacturing process such as that of factories, mills and mines.
It has existed since the outset of the industrial revolution. Sewage treatment can be used to
clean water tainted with industrial waste. Some examples of industrial waste are paints, sand
paper, paper products, industrial by-products, metals, radioactive wastes, etc.
Toxic waste, chemical waste, Industrial solid waste and Municipal solid waste are
designations of industrial waste. Sewage treatment can be used to clean water tainted with
industrial waste.
TYPES AND DETAILS OF WASTES
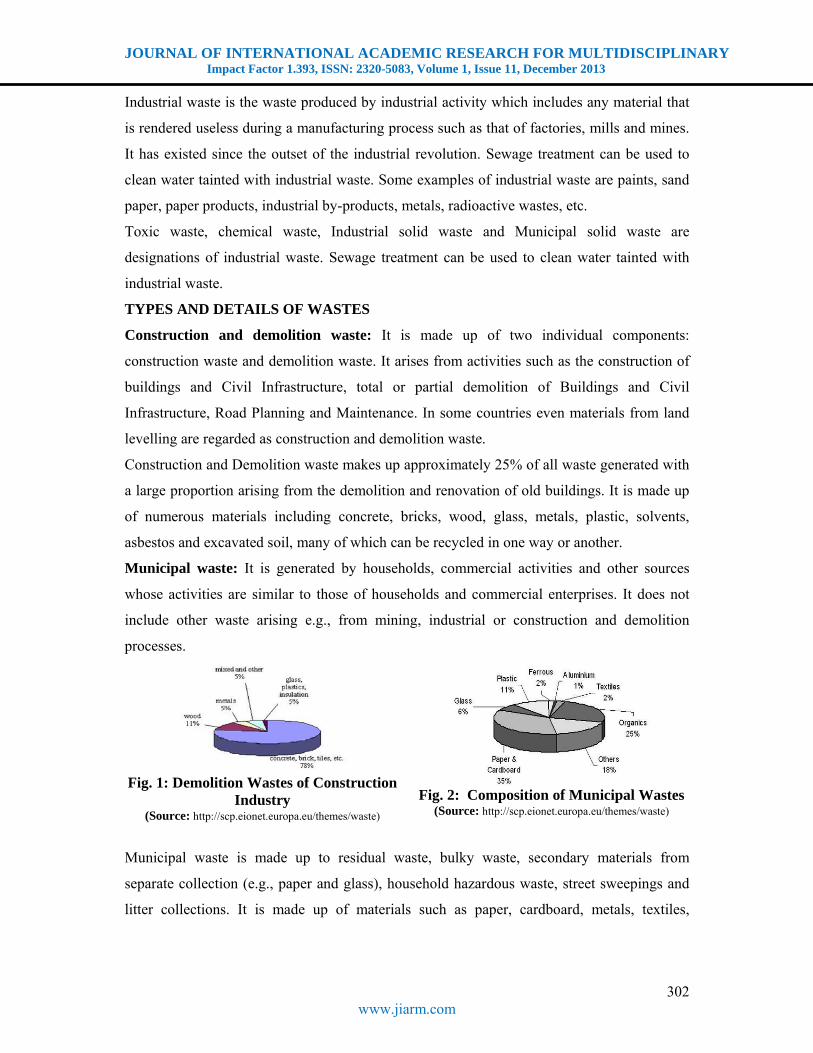
Construction and demolition waste: It is made up of two individual components:
construction waste and demolition waste. It arises from activities such as the construction of
buildings and Civil Infrastructure, total or partial demolition of Buildings and Civil
Infrastructure, Road Planning and Maintenance. In some countries even materials from land
levelling are regarded as construction and demolition waste.
Construction and Demolition waste makes up approximately 25% of all waste generated with
a large proportion arising from the demolition and renovation of old buildings. It is made up
of numerous materials including concrete, bricks, wood, glass, metals, plastic, solvents,
asbestos and excavated soil, many of which can be recycled in one way or another.
Municipal waste: It is generated by households, commercial activities and other sources
whose activities are similar to those of households and commercial enterprises. It does not
include other waste arising e.g., from mining, industrial or construction and demolition
processes.
Fig. 1: Demolition Wastes of Construction
Industry (Source: http://scp.eionet.europa.eu/themes/waste)
Fig. 2: Composition of Municipal Wastes
(Source: http://scp.eionet.europa.eu/themes/waste)
Municipal waste is made up to residual waste, bulky waste, secondary materials from
separate collection (e.g., paper and glass), household hazardous waste, street sweepings and
litter collections. It is made up of materials such as paper, cardboard, metals, textiles,
JOURNAL OF INTERNATIONAL ACADEMIC RESEARCH FOR MULTIDISCIPLINARY Impact Factor 1.393, ISSN: 2320-5083, Volume 1, Issue 11, December 2013
303 www.jiarm.com
organics (food and garden waste) and wood. Municipal waste represents approximately 14%
of all waste generated.
Manufacturing industry waste: It comprises many different waste streams arising from a
wide range of industrial processes which are metals, food, beverage and tobacco products,
wood and wood products and paper and paper products.
Hazardous waste: It arises from a wide range of different sources including households,
commercial activities and industry. The main disposal route for hazardous waste is landfill,
incineration and physical or chemical treatment. On the recovery side, a significant
proportion of hazardous waste is recycled or burned as a fuel.
Mining waste: It arises from prospecting, extraction, treatment and storage of minerals. It
has been shown that approximately 50% of the material extracted during extraction and
mining activities. It is made up of topsoil, overburden, waste rock, and waste from the
processing of the ore body (tailings) which may also include process water, process
chemicals and portions of the remaining materials.
Biodegradable Municipal Waste (BMW): It is waste from households and commercial
activities that is capable of undergoing biological decomposition. Food waste and garden
waste, paper and cardboard are all classified as biodegradable municipal waste.
Packaging is defined as any material which is used to contain, protect, handle, deliver and
present goods. Items like glass bottles, plastic containers, aluminium cans, food wrappers,
timber pallets and drums are all classified as packaging. Packaging waste can arise from a
wide range of sources including supermarkets, retail outlets, manufacturing industries,
households, hotels, hospitals, restaurants and transport companies.
LITERATURE REVIEW
Industrial liquid effluents can be traced as far back as the nineteenth century. If researchers
define pollution as that amount of industrial contamination that causes interference with the
best usage of the receiving water, researchers can probably agree that this type of pollution
did not begin until the turn of the twentieth century. Basic industries such as coal, power
production, dairy, textile, cannery, tannery, and paper, which produce goods necessary for the
sustenance of life, were the first to face the pollution problem.
Chemical industries, mainly inorganic, such as salt and salt degradation products including
chlorine, lye, and soda ash, were next chronologically and in importance. These were
followed by basic organic chemical plants, such as sugar, starch, and cellulosic wastes.
JOURNAL OF INTERNATIONAL ACADEMIC RESEARCH FOR MULTIDISCIPLINARY Impact Factor 1.393, ISSN: 2320-5083, Volume 1, Issue 11, December 2013
304 www.jiarm.com
In the 1930s, all these industries began to be aware of the eventual danger of their wastes
when sent untreated into waterways. It was natural for industry at that time to follow the lead
of municipalities in using similar treatments to attempt to resolve their pollution problems.
Then came World War II and its accelerated industrial production activity. New products and
new wastes evolved and the quantity of older ones, such as metal plating, oil refining, and
textiles increased tremendously. Radioactivity, petrochemical, and synthetic organic
chemicals were largely developed and surfaced in the environment in the 1940s and 1950s.
During this period, major environmental problems surfaced with rapid and serious
consequences.
ABOUT FREQUENCY DISTRIBUTION
Definition: A frequency distribution is the organizing of raw data in table form, using classes
and frequencies.
The next step after the completion of data collection is to organize the data into a meaningful
form so that a trend, if any, emerging out of the data can be seen easily. One of the common
methods for organizing data is to construct frequency distribution. Frequency distribution is
an organized tabulation/graphical representation of the number of individuals in each
category on the scale of measurement. It allows the researcher to have a glance at the entire
data conveniently. It shows whether the observations are high or low and also whether they
are concentrated in one area or spread out across the entire scale. Thus, frequency distribution
presents a picture of how the individual observations are distributed in the measurement scale.
A Frequency Distribution is a table that divides a set of data into a suitable number of classes,
showing also the number of items belonging to each class. Such a table sacrifices some of the
information contained in the data. Properties of frequency distribution relating to their shape
are best exhibited through the use of graph.
DATA ANALYSIS AND INTERPRETATION
Regarding Construction Industry waste questionnaires are designed with the suitable criteria
with the expert advice. Then this survey questionnaire was supplied to Contractor, Consultant
for getting opinion for this research work. Collected research data are analyzed with the
Frequency Distribution Method.
Frequency Distribution Pie Charts are mentioned below where research data analysis is based
on respondents’ opinion.
ANALYSIS AND INTERPRETATION OF FREQUENCY DISTRIBUTION
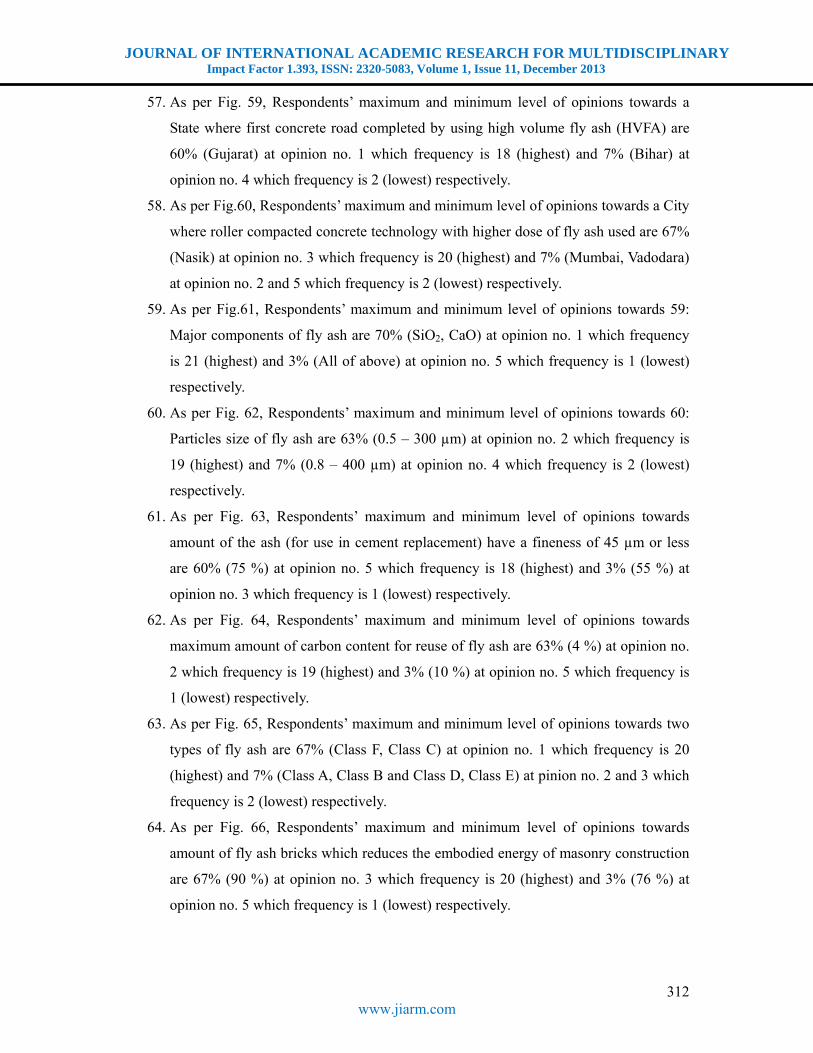
1. As per Fig.3, Respondents’ maximum and minimum level of opinions towards
available type of industrial waste are 60% (All of above) at opinion no. 5 which
JOURNAL OF INTERNATIONAL ACADEMIC RESEARCH FOR MULTIDISCIPLINARY Impact Factor 1.393, ISSN: 2320-5083, Volume 1, Issue 11, December 2013
305 www.jiarm.com
frequency is 18 (highest) and 7% (Construction debris) at opinion no. 4 which
frequency is 2 (lowest) respectively.
2. As per Fig.4, Respondents’ maximum and minimum level of opinions towards
disposal amount of Industrial wastes in India are 73% (250 – 300 million) at opinion
no. 1 which frequency is 22 (highest) and 3% (400 – 450 million and 450 – 500
million) at opinion no. 4 and 5 which frequency is 1 (lowest) respectively.
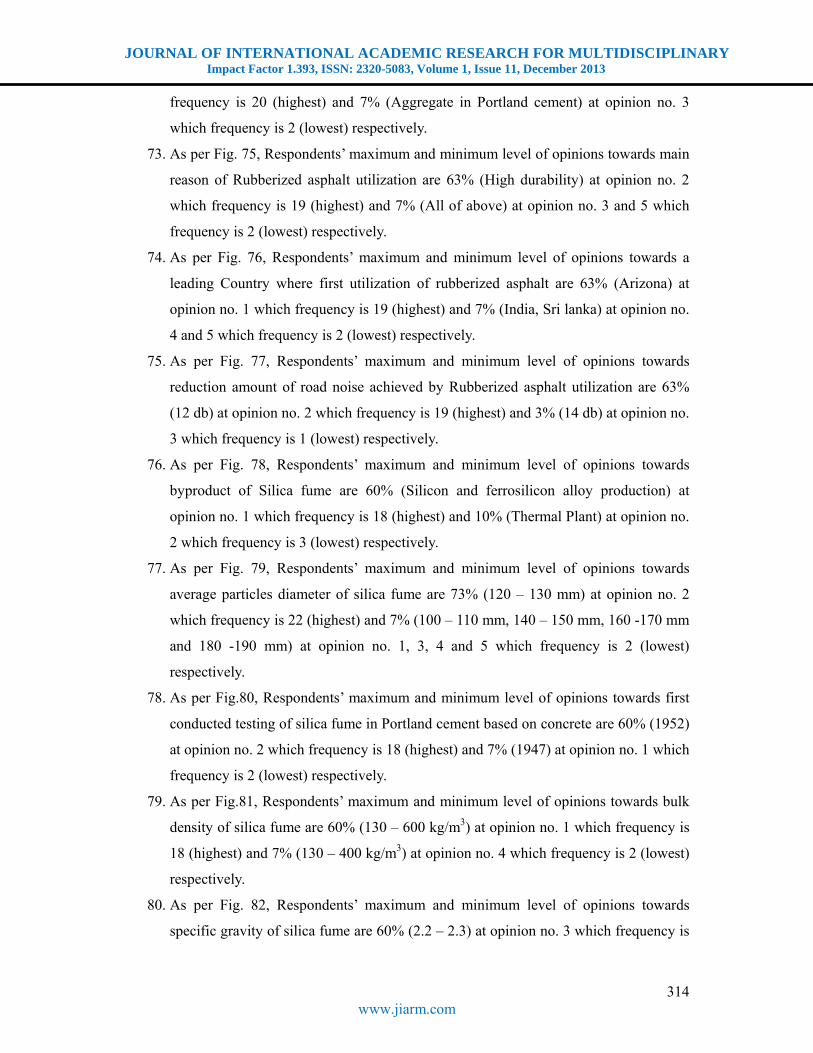
3. As per Fig.5, Respondents’ maximum and minimum level of opinions towards
recyclable amount of Industrial wastes are 53% (3.05 – 3.10 MT) at opinion no. 2
which frequency is 16 (highest) and 7% (3.20 – 3.25 MT) at opinion no. 5 which
frequency is 2 (lowest) respectively.
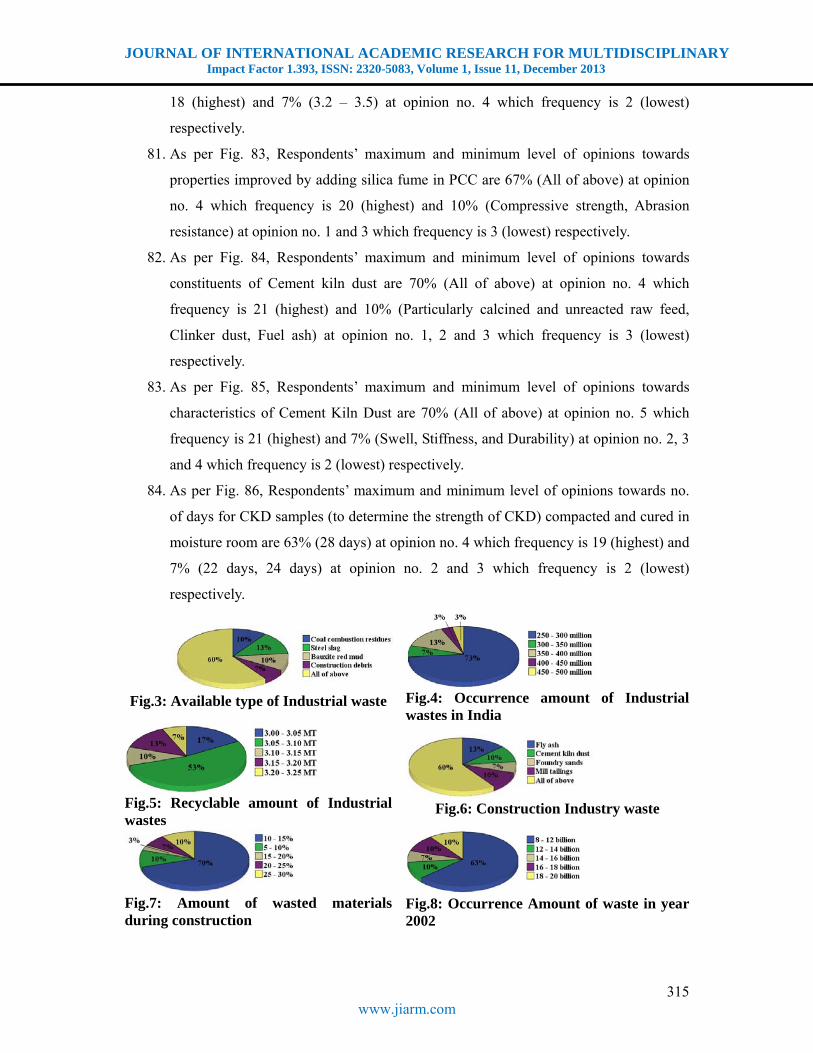
4. As per Fig. 6, Respondents’ maximum and minimum level of opinions towards
construction Industry waste are 60% (All of above) at opinion no. 5 which frequency
is 18 (highest) and 7% Foundry sands) at opinion no. 3 which frequency is 2 (lowest)
respectively.
5. As per Fig.7, Respondents’ maximum and minimum level of opinions towards amount
of wasted materials during construction are 70% (10 – 15%) at opinion no. 1 which
frequency is 21 (highest) and 3% (15 – 20%) at opinion no. 3 which frequency is 1
(lowest) respectively.
6. As per Fig.8, Respondents’ maximum and minimum level of opinions towards
occurrence Amount of waste in year 2002 are 63% (8 – 12 billion) at opinion no. 1
which frequency is 19 (highest) and 7% (14 – 16 billion) at opinion no. 3 which
frequency is 2 (lowest) respectively.
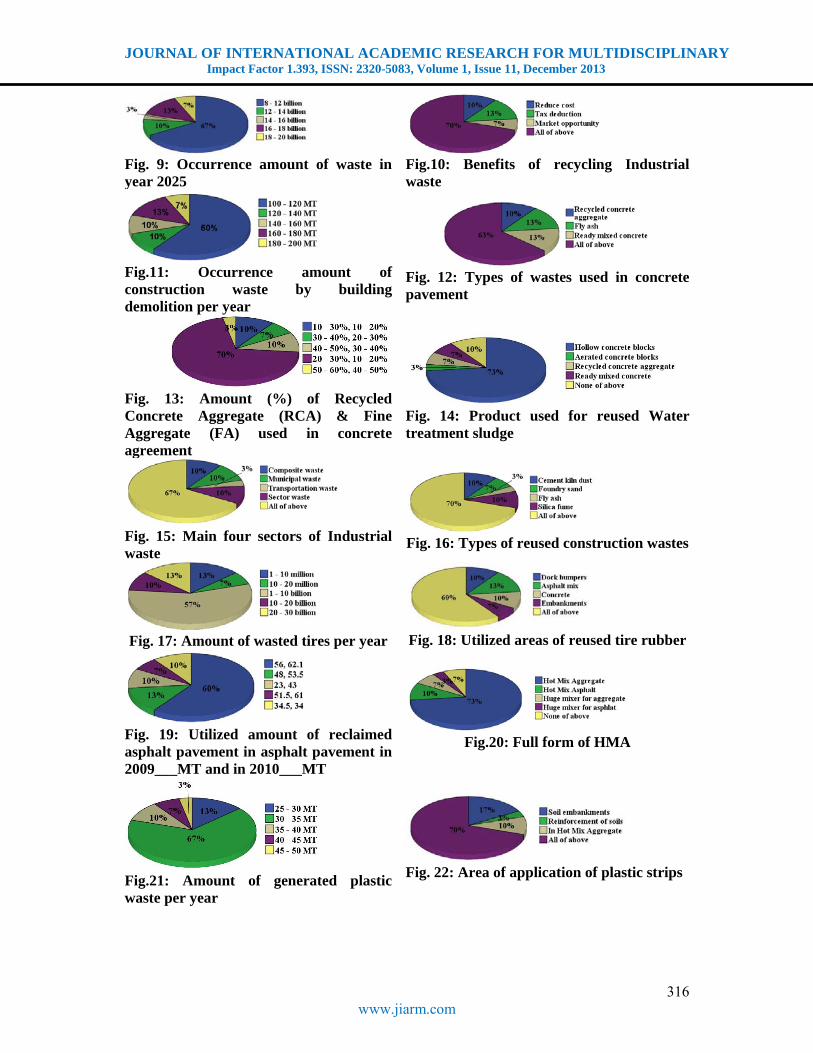
7. As per Fig.9, Respondents’ maximum and minimum level of opinions towards
occurrence amount of waste in year 2025 are 67% (8 – 12 billion) at opinion no. 1
which frequency is 20 (highest) and 3% (14 – 16 billion) at opinion no. 3 which
frequency is 1 (lowest) respectively.
8. As per Fig.10, Respondents’ maximum and minimum level of opinions towards
benefits of recycling Industrial waste are 70% (All of above) at opinion no. 4 which
frequency is 21 (highest) and 7% (Market opportunity) at opinion no. 3which
frequency is 2 (lowest) respectively.
9. As per Fig.11, Respondents’ maximum and minimum level of opinions towards
occurrence amount of construction waste by building demolition per year are 60%
JOURNAL OF INTERNATIONAL ACADEMIC RESEARCH FOR MULTIDISCIPLINARY Impact Factor 1.393, ISSN: 2320-5083, Volume 1, Issue 11, December 2013
306 www.jiarm.com
(100 – 120 MT) at opinion no. 1 which frequency is 18 (highest) and 7% (180 – 200
MT) at opinion no. 5 which frequency is 2 (lowest) respectively.
10. As per Fig. 12, Respondents’ maximum and minimum level of opinions towards types
of wastes used in concrete pavement are 63% (All of above) at opinion no. 4 which
frequency is 19 (highest) and 10% (Recycled concrete aggregate) at opinion no. 1
which frequency is 3 (lowest) respectively.
11. As per Fig. 13, Respondents’ maximum and minimum level of opinions towards
amount (%) of Recycled Concrete Aggregate (RCA) & Fine Aggregate (FA) used in
concrete agreement are 70% (20 – 30%, 10 – 20%) at opinion no. 4 which frequency
is 21 (highest) and 3% (50 – 60%, 40 – 50%) at opinion no. 5 which frequency is 1
(lowest) respectively.
12. As per Fig. 14, Respondents’ maximum and minimum level of opinions towards
product used for reused Water treatment sludge are 73% (Hollow concrete blocks) at
opinion no. 1 which frequency is 22 (highest) and 3% (Aerated concrete blocks) at
opinion no. 2 which frequency is 1 (lowest) respectively.
13. As per Fig. 15, Respondents’ maximum and minimum level of opinions towards main
four sectors of Industrial waste are 67% (All of them) at opinion no. 5 which
frequency is 20 (highest) and 3% (Transportation waste) at opinion no. 3 which
frequency is 1 (lowest) respectively.
14. As per Fig. 16, Respondents’ maximum and minimum level of opinions towards types
of reused construction wastes are 70% (All of above) at opinion no. 5 which
frequency is 21 (highest) and 3% (Fly ash) at opinion no. 3 which frequency is 1
(lowest) respectively.
15. As per Fig. 17, Respondents’ maximum and minimum level of opinions towards
amount of wasted tires per year are 57% (1 – 10 billion) at opinion no. 3 which
frequency is 17 (highest) and 7% (10 – 20 million) at opinion no. 2 which frequency
is 2 (lowest) respectively.
16. As per Fig. 18, Respondents’ maximum and minimum level of opinions towards
utilized areas of reused tire rubber are 60% (All of above) at opinion no. 5 which
frequency is 18 (highest) and 7% (Embankments) at opinion no. 4 which frequency is
2 (lowest) respectively.
17. As per Fig. 19, Respondents’ maximum and minimum level of opinions towards
utilized amount of reclaimed asphalt pavement in asphalt pavement in 2009___MT
JOURNAL OF INTERNATIONAL ACADEMIC RESEARCH FOR MULTIDISCIPLINARY Impact Factor 1.393, ISSN: 2320-5083, Volume 1, Issue 11, December 2013
307 www.jiarm.com
and in 2010___MT are 60% (56, 62.1) at opinion no. 1 which frequency is 18
(highest) and 7% (51.5, 61) at opinion no. 4 which frequency is 2 (lowest)
respectively.
18. As per Fig.20, Respondents’ maximum and minimum level of opinions towards full
form of HMA are 73% (Hot Mix Aggregate) at opinion no. 1 which frequency is 22
(highest) and 3% (Huge mixer for asphalt) at opinion no. 4 which frequency is 1
(lowest) respectively.
19. As per Fig.21, Respondents’ maximum and minimum level of opinions towards
amount of generated plastic waste per year are 67% (30 – 35 MT) at opinion no. 2
which frequency is 20 (highest) and 3% (45 – 50 MT) at opinion no. 5 which
frequency is 1 (lowest) respectively.
20. As per Fig. 22, Respondents’ maximum and minimum level of opinions towards area
of application of plastic strips are 70% (All of above) at opinion no. 4 which
frequency is 21 (highest) and 3% (Reinforcement of soils) at opinion no. 2 which
frequency is 1 (lowest) respectively.
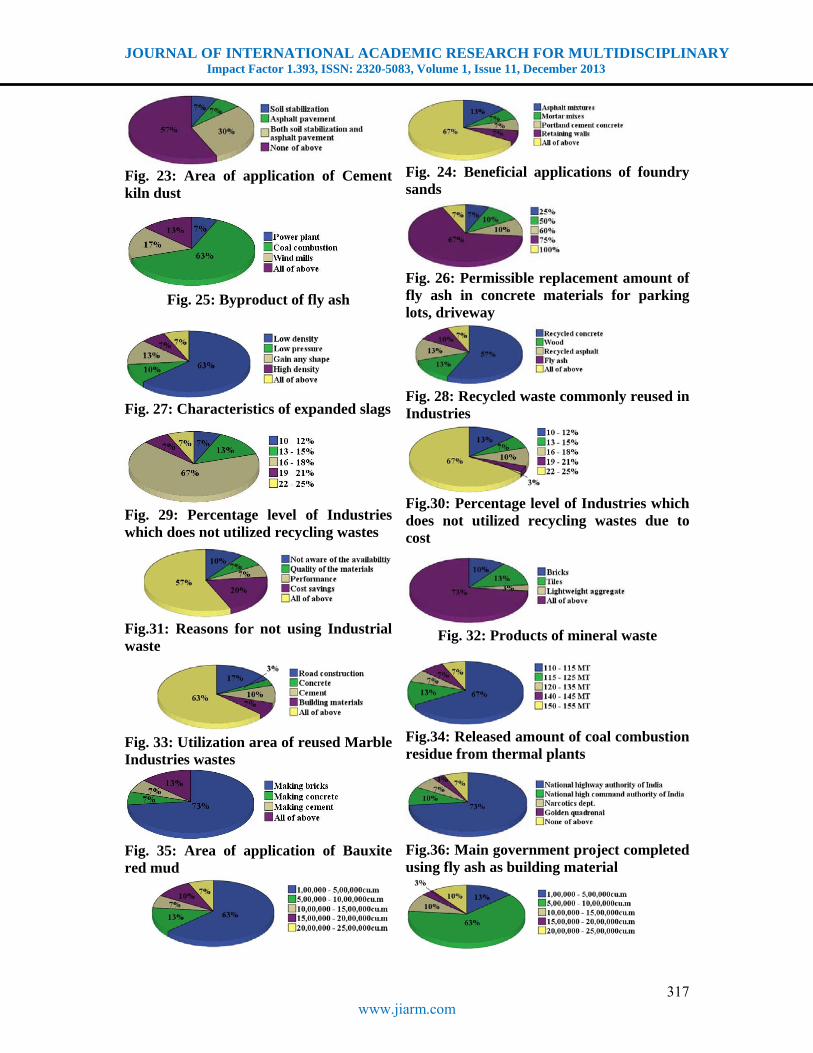
21. As per Fig. 23, Respondents’ maximum and minimum level of opinions towards area
of application of Cement kiln dust are 57% (None of above) at opinion no. 4 which
frequency is 17 (highest) and 7% (Soil stabilization, Asphalt pavement) at opinion no.
1 and 2 which frequency is 2 (lowest) respectively.
22. As per Fig. 24, Respondents’ maximum and minimum level of opinions towards
beneficial applications of foundry sands are 67% (All of above) at opinion no. 5
which frequency is 20 (highest) and 7% (Mortar mixes, Portland cement concrete,
Retaining walls) at opinion no. 2, 3 and 4 which frequency is 2 (lowest) respectively.
23. As per Fig. 25, Respondents’ maximum and minimum level of opinions towards
byproduct of fly ash are 63% (Coal combustion) at opinion no. 2 which frequency is
19 (highest) and 7% (Power plant) at opinion no. 1 which frequency is 2 (lowest)
respectively.
24. As per Fig. 26, Respondents’ maximum and minimum level of opinions towards
permissible replacement amount of fly ash in concrete materials for parking lots,
driveway are 67% (75%) at opinion no. 4 which frequency is 20 (highest) and 7%
(25%, 100%) at opinion no. 1 and 5 which frequency is 2 (lowest) respectively.
25. As per Fig. 27, Respondents’ maximum and minimum level of opinions towards
characteristics of expanded slags are 63% (Low density) at opinion no. 1 which
JOURNAL OF INTERNATIONAL ACADEMIC RESEARCH FOR MULTIDISCIPLINARY Impact Factor 1.393, ISSN: 2320-5083, Volume 1, Issue 11, December 2013
308 www.jiarm.com
frequency is 19 (highest) and 7% (High density, all of above) at opinion no. 4 and 5
which frequency is 2 (lowest) respectively.
26. As per Fig. 28, Respondents’ maximum and minimum level of opinions towards
recycled waste commonly reused in Industries are 57% (Recycled concrete) at
opinion no. 1 which frequency is 17 (highest) and 7% (All of above) at opinion no. 5
which frequency is 2 (lowest) respectively.
27. As per Fig. 29, Respondents’ maximum and minimum level of opinions towards
percentage level of Industries which does not utilized recycling wastes are 67% (16 –
18%) at opinion no. 3 which frequency is 20 (highest) and 7% (10 – 12%, 19 – 21%,
22 – 25%) at opinion no. 1, 4 and 5 which frequency is 2 (lowest) respectively.
28. As per Fig.30, Respondents’ maximum and minimum level of opinions towards
percentage level of Industries which does not utilized recycling wastes due to cost are
67% (22 – 25%) at opinion no. 5 which frequency is 20 (highest) and 3% (≤19 – 21%)
at opinion no. 4 which frequency is 1 (lowest) respectively.
29. As per Fig.31, Respondents’ maximum and minimum level of opinions towards
reasons for not using industrial waste are 57% (All of above) at opinion no. 5 which
frequency is 17 (highest) and 7% (Quality of the materials, Performance) at opinion
no. 2 and 3 which frequency is 2 (lowest) respectively.
30. As per Fig. 32, Respondents’ maximum and minimum level of opinions towards
products of mineral waste are 73% (All of above) at opinion no. 4 which frequency is
22 (highest) and 3% (Lightweight aggregate) at opinion no. 3 which frequency is 1
(lowest) respectively.
31. As per Fig. 33, Respondents’ maximum and minimum level of opinions towards
utilization area of reused Marble Industries wastes are 63% (All of above) at opinion
no. 5 which frequency is 19 (highest) and 3% (Concrete) at opinion no. 2 which
frequency is 2 (lowest) respectively.
32. As per Fig. 34, Respondents’ maximum and minimum level of opinions towards
released amount of coal combustion residue from thermal plants are 67% (110 – 115
MT) at opinion no. 1 which frequency is 20 (highest) and 7% (120 – 135 MT, 140 –
145 MT, 150 – 155 MT) at opinion no. 3, 4 and 5 which frequency is 2 (lowest)
respectively.
33. As per Fig. 35, Respondents’ maximum and minimum level of opinions towards area
of application of Bauxite red mud are 73% (Making bricks) at opinion no. 1 which
JOURNAL OF INTERNATIONAL ACADEMIC RESEARCH FOR MULTIDISCIPLINARY Impact Factor 1.393, ISSN: 2320-5083, Volume 1, Issue 11, December 2013
309 www.jiarm.com
frequency is 22 (highest) and 7% (Making concrete, Making cement) at opinion no. 2
and 3 which frequency is 2 (lowest) respectively.
34. As per Fig. 36, Respondents’ maximum and minimum level of opinions towards main
government project completed using fly ash as building material are 73% (National
highway authority of India) at opinion no. 1 which frequency is 22 (highest) and 3%
(Golden quadronal) at opinion no. 4 which frequency is 1 (lowest) respectively.
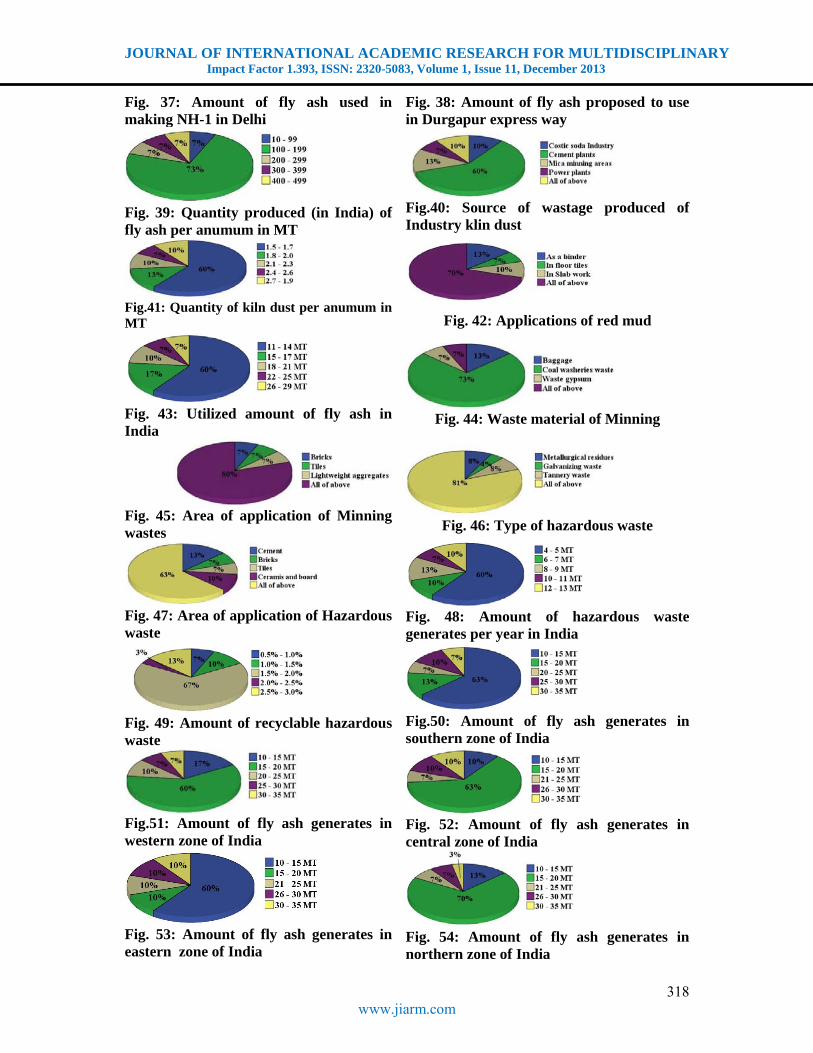
35. As per Fig. 37, Respondents’ maximum and minimum level of opinions towards
amount of fly ash used in making NH-1 in Delhi are 63% (1,00,000 – 5,00,000 cu.m)
at opinion no. 1 which frequency is 19 (highest) and 7% (10,00,000 – 15,00,000 cu.m,
20,00,000 – 25,00,000 cu.m) at opinion no. 3 and 5 which frequency is 2 (lowest)
respectively.
36. As per Fig. 38, Respondents’ maximum and minimum level of opinions towards
amount of fly ash proposed to use in Durgapur express way are 63% (5,00,000 –
10,00,000 cu.m) at opinion no. 2 which frequency is 19 (highest) and 3% (15,00,000 –
20,00,000 cu.m) at opinion no. 4 which frequency is 1 (lowest) respectively.
37. As per Fig. 39, Respondents’ maximum and minimum level of opinions towards
quantity produced (in India) of fly ash per anumum in MT are 73% (100 - 199) at
opinion no. 2 which frequency is 22 (highest) and 7% (10 – 99, 200 – 299, 300 – 399,
400 - 499) at opinion no. 1, 3, 4 and 5 which frequency is 2 (lowest) respectively.
38. As per Fig.40, Respondents’ maximum and minimum level of opinions towards
source of wastage produced of Industry kiln dust are 60% (Cement plants) at opinion
no. 2 which frequency is 18 (highest) and 7% (Power plants) at opinion no. 4 which
frequency is 2 (lowest) respectively.
39. As per Fig.41, Respondents’ maximum and minimum level of opinions towards
quantity of kiln dust per anumum in MT are 60% (1.5 – 1.7) at opinion no. 1 which
frequency is 18 (highest) and 7% (2.4 – 2.6) at opinion no. 4 which frequency is 2
(lowest) respectively.
40. As per Fig. 42, Respondents’ maximum and minimum level of opinions towards
applications of red mud are 70% (All of above) at opinion no. 4 which frequency is 21
(highest) and 7% (In floor tiles) at opinion no. 2 which frequency is 2 (lowest)
respectively.
41. As per Fig. 43, Respondents’ maximum and minimum level of opinions towards
utilized amount of fly ash in India are 60% (11 – 14 MT) at opinion no. 1 which
JOURNAL OF INTERNATIONAL ACADEMIC RESEARCH FOR MULTIDISCIPLINARY Impact Factor 1.393, ISSN: 2320-5083, Volume 1, Issue 11, December 2013
310 www.jiarm.com
frequency is 18 (highest) and 7% (22 – 25 MT, 26 – 29 MT) at opinion no. 4 and 5
which frequency is 2 (lowest) respectively.
42. As per Fig. 44, Respondents’ maximum and minimum level of opinions towards
waste material of Minning are 73% (Baggage) at opinion no. 2 which frequency is 22
(highest) and 7% (Waste gypsum, all of above) at opinion no. 3 and 4 which
frequency is 2 (lowest) respectively.
43. As per Fig. 45, Respondents’ maximum and minimum level of opinions towards area
of application of Minning wastes are 803% (All of above) at opinion no. 4 which
frequency is 24 (highest) and 7% (Bricks, Tiles, Lightweight aggregates) at opinion
no. 1, 2 and 3 which frequency is 2 (lowest) respectively.
44. As per Fig. 46, Respondents’ maximum and minimum level of opinions towards type
of hazardous waste are 83% (All of above) at opinion no. 4 which frequency is 25
(highest) and 3% (Galvanizing waste) at opinion no. 2 which frequency is 1 (lowest)
respectively.
45. As per Fig. 47, Respondents’ maximum and minimum level of opinions towards area
of application of Hazardous waste are 63% (All of above) at opinion no. 5 which
frequency is 19 (highest) and 7% (Bricks, Tiles) at opinion no. 2 and 3 which
frequency is 2 (lowest) respectively.
46. As per Fig. 48, Respondents’ maximum and minimum level of opinions towards
amount of hazardous waste generates per year in India are 60% (4 – 5 MT) at opinion
no. 1 which frequency is 18 (highest) and 7% (10 – 11 MT) at opinion no. 4 which
frequency is 2 (lowest) respectively.
47. As per Fig. 49, Respondents’ maximum and minimum level of opinions towards
amount of recyclable hazardous waste are 67% (1.5 – 2.0) at opinion no. 3 which
frequency is 20 (highest) and 3% (2.0 – 2.5) at opinion no. 4 which frequency is 1
(lowest) respectively.
48. As per Fig.50, Respondents’ maximum and minimum level of opinions towards
amount of fly ash generates in southern zone of India are 63% (10 – 15 MT) at
opinion no. 1 which frequency is 19 (highest) and 7% (20 – 25 MT, 30 – 35 MT) at
opinion no. 3 and 5 which frequency is 2 (lowest) respectively.
49. As per Fig.51, Respondents’ maximum and minimum level of opinions towards
amount of fly ash generates in western zone of India are 60% (15 – 20 MT) at opinion
JOURNAL OF INTERNATIONAL ACADEMIC RESEARCH FOR MULTIDISCIPLINARY Impact Factor 1.393, ISSN: 2320-5083, Volume 1, Issue 11, December 2013
311 www.jiarm.com
no. 2 which frequency is 18 (highest) and 7% (25 – 25 MT, 30 – 35 MT) at opinion
no. 4 and 5 which frequency is 2 (lowest) respectively.
50. As per Fig. 52, Respondents’ maximum and minimum level of opinions towards
amount of fly ash generates in central zone of India are 63% (15 – 20 MT) at opinion
no. 2 which frequency is 19 (highest) and 7% (21 – 25 MT) at opinion no. 3 which
frequency is 2 (lowest) respectively.
51. As per Fig. 53, Respondents’ maximum and minimum level of opinions towards
amount of fly ash generates in eastern zone of India are 60% (10 – 15 MT) at opinion
no. 1 which frequency is 18 (highest) and 10% (15 – 20 MT, 21 – 25 MT, 26 – 30 MT,
30 – 35 MT) at opinion no. 2, 3, 4 and 5 which frequency is 3 (lowest) respectively.
52. As per Fig. 54, Respondents’ maximum and minimum level of opinions towards
amount of fly ash generates in northen zone of India are 70% (15 – 20 MT) at opinion
no. 2 which frequency is 21 (highest) and 3% (30 – 35 MT) at opinion no. 5 which
frequency is 1 (lowest) respectively.
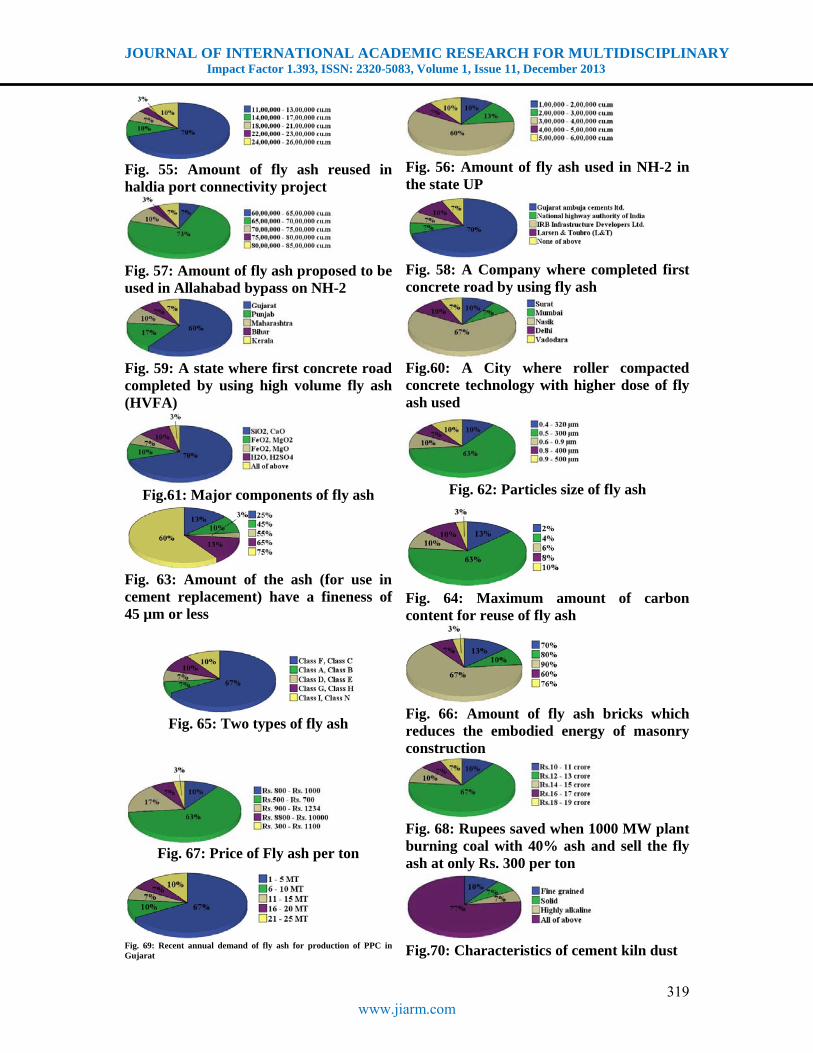
53. As per Fig. 55, Respondents’ maximum and minimum level of opinions towards
amount of fly ash reused in haldia port connectivity project are 70% (11, 00,000 – 13,
00,000 cu.m) at opinion no. 1 which frequency is 21 (highest) and 3% (22, 00,000 –
23, 00,000 cu.m) at opinion no. 4 which frequency is1 (lowest) respectively.
54. As per Fig. 56, Respondents’ maximum and minimum level of opinions towards
amount of fly ash used in NH-2 in the state UP are 60% (3,00,000 – 4,00,000 cu.m) at
opinion no. 3 which frequency is 18 (highest) and 7% (4,00,000 – 5,00,000 cu.m) at
opinion no. 4 which frequency is 2 (lowest) respectively.
55. As per Fig. 57, Respondents’ maximum and minimum level of opinions towards
amount of fly ash proposed to be used in Allahabad bypass on NH-2 are 73%
(65,00,000 – 65,00,000 cu.m) at opinion no. 2 which frequency is 22 (highest) and 3%
(75,00,000 – 80,00,000 cu.m) at opinion no. 4 which frequency is 1 (lowest)
respectively.
56. As per Fig. 58, Respondents’ maximum and minimum level of opinions towards a
Company where completed first concrete road by using fly ash are 70% (Gujarat
ambuja cements ltd.) at opinion no. 21 which frequency is 19 (highest) and 7%
(National highway authority of India, IRB, ) at opinion no. 2, 3 and 5 which
frequency is 2 (lowest) respectively.
JOURNAL OF INTERNATIONAL ACADEMIC RESEARCH FOR MULTIDISCIPLINARY Impact Factor 1.393, ISSN: 2320-5083, Volume 1, Issue 11, December 2013
312 www.jiarm.com
57. As per Fig. 59, Respondents’ maximum and minimum level of opinions towards a
State where first concrete road completed by using high volume fly ash (HVFA) are
60% (Gujarat) at opinion no. 1 which frequency is 18 (highest) and 7% (Bihar) at
opinion no. 4 which frequency is 2 (lowest) respectively.
58. As per Fig.60, Respondents’ maximum and minimum level of opinions towards a City
where roller compacted concrete technology with higher dose of fly ash used are 67%
(Nasik) at opinion no. 3 which frequency is 20 (highest) and 7% (Mumbai, Vadodara)
at opinion no. 2 and 5 which frequency is 2 (lowest) respectively.
59. As per Fig.61, Respondents’ maximum and minimum level of opinions towards 59:
Major components of fly ash are 70% (SiO2, CaO) at opinion no. 1 which frequency
is 21 (highest) and 3% (All of above) at opinion no. 5 which frequency is 1 (lowest)
respectively.
60. As per Fig. 62, Respondents’ maximum and minimum level of opinions towards 60:
Particles size of fly ash are 63% (0.5 – 300 µm) at opinion no. 2 which frequency is
19 (highest) and 7% (0.8 – 400 µm) at opinion no. 4 which frequency is 2 (lowest)
respectively.
61. As per Fig. 63, Respondents’ maximum and minimum level of opinions towards
amount of the ash (for use in cement replacement) have a fineness of 45 µm or less
are 60% (75 %) at opinion no. 5 which frequency is 18 (highest) and 3% (55 %) at
opinion no. 3 which frequency is 1 (lowest) respectively.
62. As per Fig. 64, Respondents’ maximum and minimum level of opinions towards
maximum amount of carbon content for reuse of fly ash are 63% (4 %) at opinion no.
2 which frequency is 19 (highest) and 3% (10 %) at opinion no. 5 which frequency is
1 (lowest) respectively.
63. As per Fig. 65, Respondents’ maximum and minimum level of opinions towards two
types of fly ash are 67% (Class F, Class C) at opinion no. 1 which frequency is 20
(highest) and 7% (Class A, Class B and Class D, Class E) at pinion no. 2 and 3 which
frequency is 2 (lowest) respectively.
64. As per Fig. 66, Respondents’ maximum and minimum level of opinions towards
amount of fly ash bricks which reduces the embodied energy of masonry construction
are 67% (90 %) at opinion no. 3 which frequency is 20 (highest) and 3% (76 %) at
opinion no. 5 which frequency is 1 (lowest) respectively.
JOURNAL OF INTERNATIONAL ACADEMIC RESEARCH FOR MULTIDISCIPLINARY Impact Factor 1.393, ISSN: 2320-5083, Volume 1, Issue 11, December 2013
313 www.jiarm.com
65. As per Fig. 67, Respondents’ maximum and minimum level of opinions towards price
of Fly ash per ton are 63% (Rs.500 – Rs.700) at opinion no. 2 which frequency is 19
(highest) and 3% (Rs.300 – Rs.1100) at opinion no.5 which frequency is 1 (lowest)
respectively.
66. As per Fig. 68, Respondents’ maximum and minimum level of opinions towards
rupees saved when 1000 MW plant burning coal with 40% ash and sell the fly ash at
only Rs. 300 per ton are 67% (Rs.12 – 13 crore) at opinion no. 2 which frequency is
20 (highest) and 7% (Rs. 16 – 17 crores, Rs. 18 – 19 crore) at opinion no. 4 and 5
which frequency is 2 (lowest) respectively.
67. As per Fig. 69, Respondents’ maximum and minimum level of opinions towards
recent annual demand of fly ash for production of PPC in Gujarat are 67% (1 – 5 MT)
at opinion no. 1 which frequency is 20 (highest) and 7% (11 – 15 MT, 16 – 20 MT) at
opinion no. 3 and 4 which frequency is 2 (lowest) respectively.
68. As per Fig.70, Respondents’ maximum and minimum level of opinions towards
characteristics of cement kiln dust are 77% (All of above) at opinion no. 4 which
frequency is 23 (highest) and 7% (Solid, Highly alkaline) at opinion no. 2 and 3
which frequency is 2 (lowest) respectively.
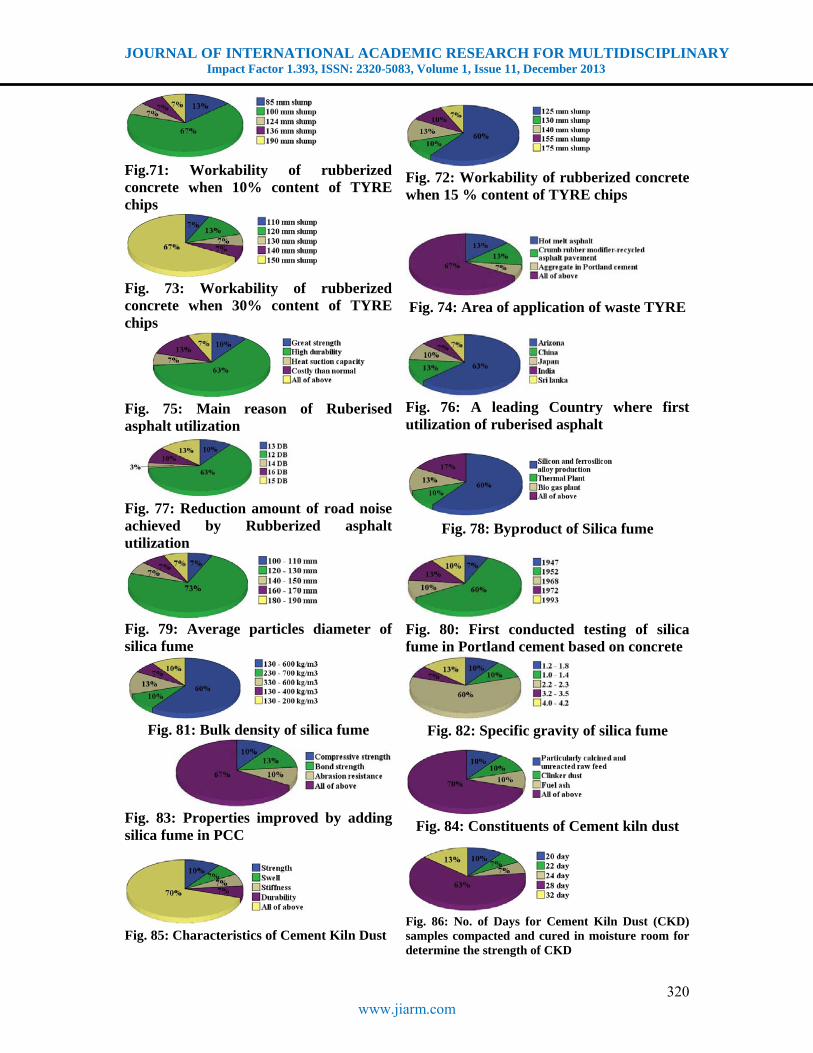
69. As per Fig.71, Respondents’ maximum and minimum level of opinions towards
workability of rubberized concrete when 10% content of TYRE chips are 67% (100
mm slump) at opinion no. 2 which frequency is 20 (highest) and 7% (124 mm slump,
136 mm slump and 190 mm slump) at opinion no. 3, 4 and 5 which frequency is 2
(lowest) respectively.
70. As per Fig. 72, Respondents’ maximum and minimum level of opinions towards
workability of rubberized concrete when 15 % content of TYRE chips are 60% (125
mm slump) at opinion no. 1 which frequency is 18 (highest) and 7% (175 mm slump)
at opinion no. 5 which frequency is 2 (lowest) respectively.
71. As per Fig. 73, Respondents’ maximum and minimum level of opinions towards
workability of rubberized concrete when 67% content of TYRE chips are 67% (150
mm slump) at opinion no. 5 which frequency is 20 (highest) and 7% (110 mm slump,
130 mm slump, 140 mm slump) at opinion no. 1, 3 and 4 which frequency is 2
(lowest) respectively.
72. As per Fig. 74, Respondents’ maximum and minimum level of opinions towards area
of application of waste TYRE are 67% (All of above) at opinion no. 4 which
JOURNAL OF INTERNATIONAL ACADEMIC RESEARCH FOR MULTIDISCIPLINARY Impact Factor 1.393, ISSN: 2320-5083, Volume 1, Issue 11, December 2013
314 www.jiarm.com
frequency is 20 (highest) and 7% (Aggregate in Portland cement) at opinion no. 3
which frequency is 2 (lowest) respectively.
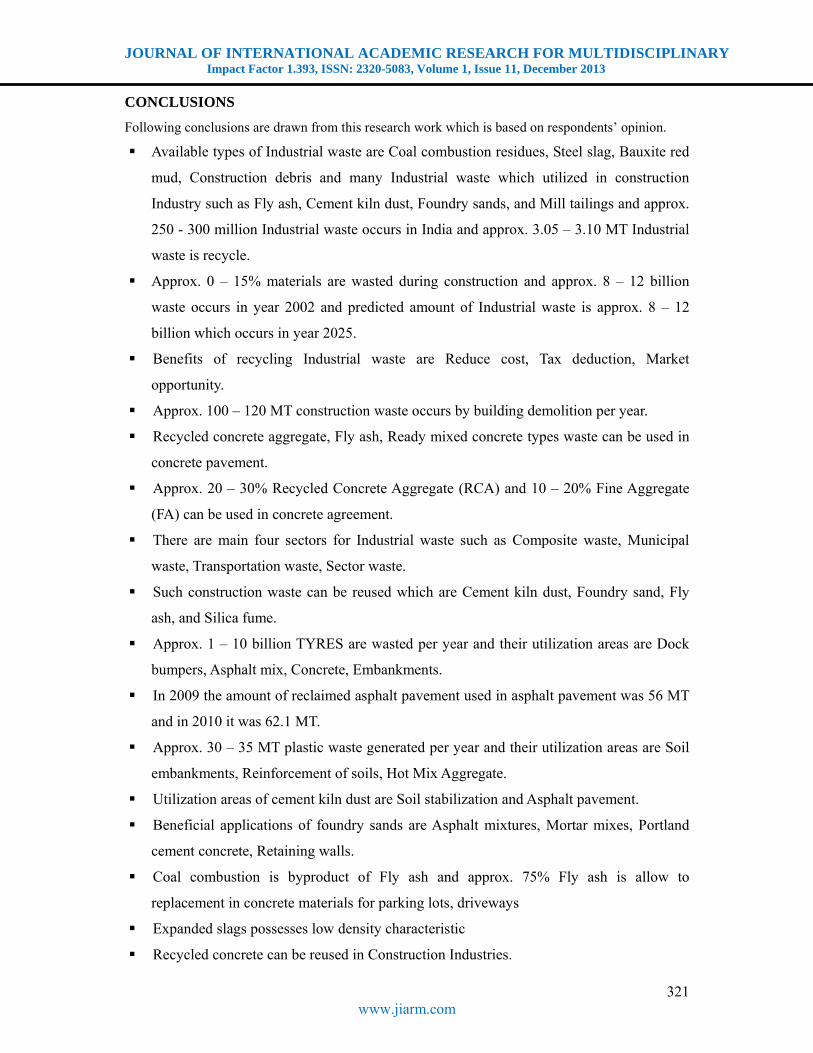
73. As per Fig. 75, Respondents’ maximum and minimum level of opinions towards main
reason of Rubberized asphalt utilization are 63% (High durability) at opinion no. 2
which frequency is 19 (highest) and 7% (All of above) at opinion no. 3 and 5 which
frequency is 2 (lowest) respectively.
74. As per Fig. 76, Respondents’ maximum and minimum level of opinions towards a
leading Country where first utilization of rubberized asphalt are 63% (Arizona) at
opinion no. 1 which frequency is 19 (highest) and 7% (India, Sri lanka) at opinion no.
4 and 5 which frequency is 2 (lowest) respectively.
75. As per Fig. 77, Respondents’ maximum and minimum level of opinions towards
reduction amount of road noise achieved by Rubberized asphalt utilization are 63%
(12 db) at opinion no. 2 which frequency is 19 (highest) and 3% (14 db) at opinion no.
3 which frequency is 1 (lowest) respectively.
76. As per Fig. 78, Respondents’ maximum and minimum level of opinions towards
byproduct of Silica fume are 60% (Silicon and ferrosilicon alloy production) at
opinion no. 1 which frequency is 18 (highest) and 10% (Thermal Plant) at opinion no.
2 which frequency is 3 (lowest) respectively.
77. As per Fig. 79, Respondents’ maximum and minimum level of opinions towards
average particles diameter of silica fume are 73% (120 – 130 mm) at opinion no. 2
which frequency is 22 (highest) and 7% (100 – 110 mm, 140 – 150 mm, 160 -170 mm
and 180 -190 mm) at opinion no. 1, 3, 4 and 5 which frequency is 2 (lowest)
respectively.
78. As per Fig.80, Respondents’ maximum and minimum level of opinions towards first
conducted testing of silica fume in Portland cement based on concrete are 60% (1952)
at opinion no. 2 which frequency is 18 (highest) and 7% (1947) at opinion no. 1 which
frequency is 2 (lowest) respectively.
79. As per Fig.81, Respondents’ maximum and minimum level of opinions towards bulk
density of silica fume are 60% (130 – 600 kg/m3) at opinion no. 1 which frequency is
18 (highest) and 7% (130 – 400 kg/m3) at opinion no. 4 which frequency is 2 (lowest)
respectively.
80. As per Fig. 82, Respondents’ maximum and minimum level of opinions towards
specific gravity of silica fume are 60% (2.2 – 2.3) at opinion no. 3 which frequency is
JOURNAL OF INTERNATIONAL ACADEMIC RESEARCH FOR MULTIDISCIPLINARY Impact Factor 1.393, ISSN: 2320-5083, Volume 1, Issue 11, December 2013
315 www.jiarm.com
18 (highest) and 7% (3.2 – 3.5) at opinion no. 4 which frequency is 2 (lowest)
respectively.
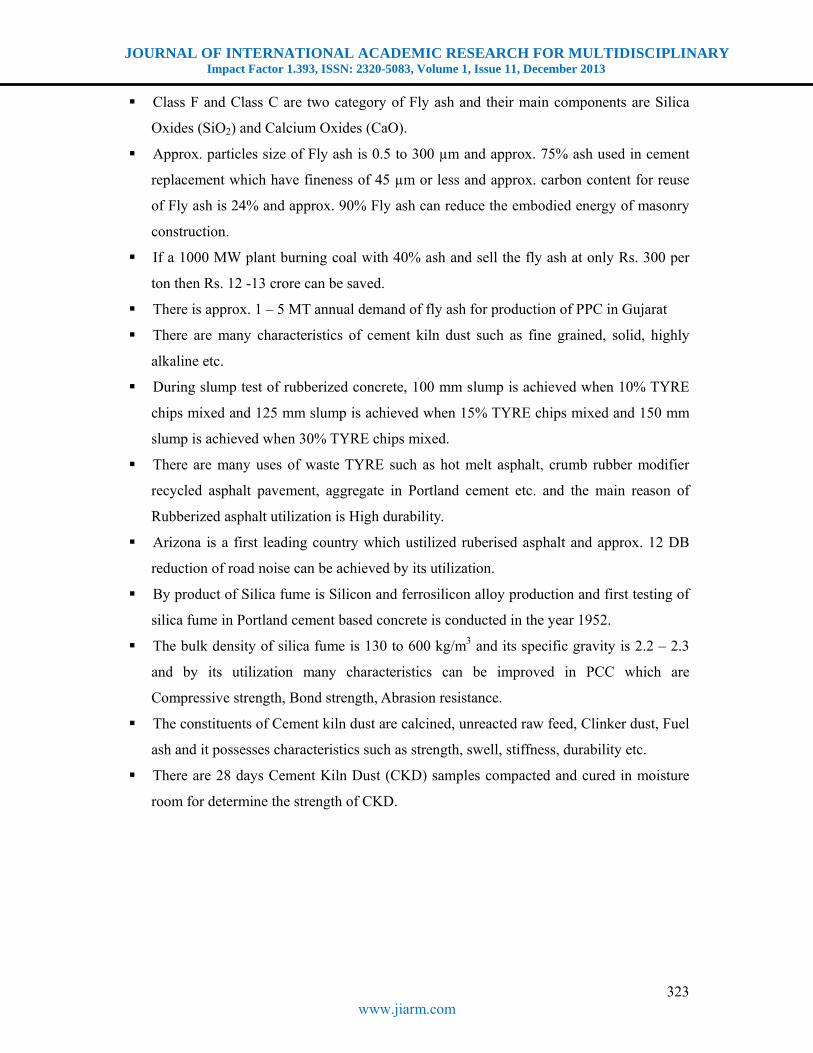
81. As per Fig. 83, Respondents’ maximum and minimum level of opinions towards
properties improved by adding silica fume in PCC are 67% (All of above) at opinion
no. 4 which frequency is 20 (highest) and 10% (Compressive strength, Abrasion
resistance) at opinion no. 1 and 3 which frequency is 3 (lowest) respectively.
82. As per Fig. 84, Respondents’ maximum and minimum level of opinions towards
constituents of Cement kiln dust are 70% (All of above) at opinion no. 4 which
frequency is 21 (highest) and 10% (Particularly calcined and unreacted raw feed,
Clinker dust, Fuel ash) at opinion no. 1, 2 and 3 which frequency is 3 (lowest)
respectively.
83. As per Fig. 85, Respondents’ maximum and minimum level of opinions towards
characteristics of Cement Kiln Dust are 70% (All of above) at opinion no. 5 which
frequency is 21 (highest) and 7% (Swell, Stiffness, and Durability) at opinion no. 2, 3
and 4 which frequency is 2 (lowest) respectively.
84. As per Fig. 86, Respondents’ maximum and minimum level of opinions towards no.
of days for CKD samples (to determine the strength of CKD) compacted and cured in
moisture room are 63% (28 days) at opinion no. 4 which frequency is 19 (highest) and
7% (22 days, 24 days) at opinion no. 2 and 3 which frequency is 2 (lowest)
respectively.
Fig.3: Available type of Industrial waste
Fig.4: Occurrence amount of Industrial wastes in India
Fig.5: Recyclable amount of Industrial wastes
Fig.6: Construction Industry waste
Fig.7: Amount of wasted materials during construction
Fig.8: Occurrence Amount of waste in year 2002
JOURNAL OF INTERNATIONAL ACADEMIC RESEARCH FOR MULTIDISCIPLINARY Impact Factor 1.393, ISSN: 2320-5083, Volume 1, Issue 11, December 2013
316 www.jiarm.com
Fig. 9: Occurrence amount of waste in year 2025
Fig.10: Benefits of recycling Industrial waste
Fig.11: Occurrence amount of construction waste by building demolition per year
Fig. 12: Types of wastes used in concrete pavement
Fig. 13: Amount (%) of Recycled Concrete Aggregate (RCA) & Fine Aggregate (FA) used in concrete agreement
Fig. 14: Product used for reused Water treatment sludge
Fig. 15: Main four sectors of Industrial waste
Fig. 16: Types of reused construction wastes
Fig. 17: Amount of wasted tires per year
Fig. 18: Utilized areas of reused tire rubber
Fig. 19: Utilized amount of reclaimed asphalt pavement in asphalt pavement in 2009___MT and in 2010___MT
Fig.20: Full form of HMA
Fig.21: Amount of generated plastic waste per year
Fig. 22: Area of application of plastic strips
JOURNAL OF INTERNATIONAL ACADEMIC RESEARCH FOR MULTIDISCIPLINARY Impact Factor 1.393, ISSN: 2320-5083, Volume 1, Issue 11, December 2013
317 www.jiarm.com
Fig. 23: Area of application of Cement kiln dust
Fig. 24: Beneficial applications of foundry sands
Fig. 25: Byproduct of fly ash
Fig. 26: Permissible replacement amount of fly ash in concrete materials for parking lots, driveway
Fig. 27: Characteristics of expanded slags
Fig. 28: Recycled waste commonly reused in Industries
Fig. 29: Percentage level of Industries which does not utilized recycling wastes
Fig.30: Percentage level of Industries which does not utilized recycling wastes due to cost
Fig.31: Reasons for not using Industrial waste
Fig. 32: Products of mineral waste
Fig. 33: Utilization area of reused Marble Industries wastes
Fig.34: Released amount of coal combustion residue from thermal plants
Fig. 35: Area of application of Bauxite red mud
Fig.36: Main government project completed using fly ash as building material
JOURNAL OF INTERNATIONAL ACADEMIC RESEARCH FOR MULTIDISCIPLINARY Impact Factor 1.393, ISSN: 2320-5083, Volume 1, Issue 11, December 2013
318 www.jiarm.com
Fig. 37: Amount of fly ash used in making NH-1 in Delhi
Fig. 38: Amount of fly ash proposed to use in Durgapur express way
Fig. 39: Quantity produced (in India) of fly ash per anumum in MT
Fig.40: Source of wastage produced of Industry klin dust
Fig.41: Quantity of kiln dust per anumum in MT
Fig. 42: Applications of red mud
Fig. 43: Utilized amount of fly ash in India
Fig. 44: Waste material of Minning
Fig. 45: Area of application of Minning wastes
Fig. 46: Type of hazardous waste
Fig. 47: Area of application of Hazardous waste
Fig. 48: Amount of hazardous waste generates per year in India
Fig. 49: Amount of recyclable hazardous waste
Fig.50: Amount of fly ash generates in southern zone of India
Fig.51: Amount of fly ash generates in western zone of India
Fig. 52: Amount of fly ash generates in central zone of India
Fig. 53: Amount of fly ash generates in eastern zone of India
Fig. 54: Amount of fly ash generates in northern zone of India
JOURNAL OF INTERNATIONAL ACADEMIC RESEARCH FOR MULTIDISCIPLINARY Impact Factor 1.393, ISSN: 2320-5083, Volume 1, Issue 11, December 2013
319 www.jiarm.com
Fig. 55: Amount of fly ash reused in haldia port connectivity project
Fig. 56: Amount of fly ash used in NH-2 in the state UP
Fig. 57: Amount of fly ash proposed to be used in Allahabad bypass on NH-2
Fig. 58: A Company where completed first concrete road by using fly ash
Fig. 59: A state where first concrete road completed by using high volume fly ash (HVFA)
Fig.60: A City where roller compacted concrete technology with higher dose of fly ash used
Fig.61: Major components of fly ash
Fig. 62: Particles size of fly ash
Fig. 63: Amount of the ash (for use in cement replacement) have a fineness of 45 µm or less
Fig. 64: Maximum amount of carbon content for reuse of fly ash
Fig. 65: Two types of fly ash
Fig. 66: Amount of fly ash bricks which reduces the embodied energy of masonry construction
Fig. 67: Price of Fly ash per ton
Fig. 68: Rupees saved when 1000 MW plant burning coal with 40% ash and sell the fly ash at only Rs. 300 per ton
Fig. 69: Recent annual demand of fly ash for production of PPC in Gujarat
Fig.70: Characteristics of cement kiln dust
JOURNAL OF INTERNATIONAL ACADEMIC RESEARCH FOR MULTIDISCIPLINARY Impact Factor 1.393, ISSN: 2320-5083, Volume 1, Issue 11, December 2013
320 www.jiarm.com
Fig.71: Workability of rubberized concrete when 10% content of TYRE chips
Fig. 72: Workability of rubberized concrete when 15 % content of TYRE chips
Fig. 73: Workability of rubberized concrete when 30% content of TYRE chips
Fig. 74: Area of application of waste TYRE
Fig. 75: Main reason of Ruberised asphalt utilization
Fig. 76: A leading Country where first utilization of ruberised asphalt
Fig. 77: Reduction amount of road noise achieved by Rubberized asphalt utilization
Fig. 78: Byproduct of Silica fume
Fig. 79: Average particles diameter of silica fume
Fig. 80: First conducted testing of silica fume in Portland cement based on concrete
Fig. 81: Bulk density of silica fume
Fig. 82: Specific gravity of silica fume
Fig. 83: Properties improved by adding silica fume in PCC
Fig. 84: Constituents of Cement kiln dust
Fig. 85: Characteristics of Cement Kiln Dust
Fig. 86: No. of Days for Cement Kiln Dust (CKD) samples compacted and cured in moisture room for determine the strength of CKD
JOURNAL OF INTERNATIONAL ACADEMIC RESEARCH FOR MULTIDISCIPLINARY Impact Factor 1.393, ISSN: 2320-5083, Volume 1, Issue 11, December 2013
321 www.jiarm.com
CONCLUSIONS
Following conclusions are drawn from this research work which is based on respondents’ opinion.
Available types of Industrial waste are Coal combustion residues, Steel slag, Bauxite red
mud, Construction debris and many Industrial waste which utilized in construction
Industry such as Fly ash, Cement kiln dust, Foundry sands, and Mill tailings and approx.
250 - 300 million Industrial waste occurs in India and approx. 3.05 – 3.10 MT Industrial
waste is recycle.
Approx. 0 – 15% materials are wasted during construction and approx. 8 – 12 billion
waste occurs in year 2002 and predicted amount of Industrial waste is approx. 8 – 12
billion which occurs in year 2025.
Benefits of recycling Industrial waste are Reduce cost, Tax deduction, Market
opportunity.
Approx. 100 – 120 MT construction waste occurs by building demolition per year.
Recycled concrete aggregate, Fly ash, Ready mixed concrete types waste can be used in
concrete pavement.
Approx. 20 – 30% Recycled Concrete Aggregate (RCA) and 10 – 20% Fine Aggregate
(FA) can be used in concrete agreement.
There are main four sectors for Industrial waste such as Composite waste, Municipal
waste, Transportation waste, Sector waste.
Such construction waste can be reused which are Cement kiln dust, Foundry sand, Fly
ash, and Silica fume.
Approx. 1 – 10 billion TYRES are wasted per year and their utilization areas are Dock
bumpers, Asphalt mix, Concrete, Embankments.
In 2009 the amount of reclaimed asphalt pavement used in asphalt pavement was 56 MT
and in 2010 it was 62.1 MT.
Approx. 30 – 35 MT plastic waste generated per year and their utilization areas are Soil
embankments, Reinforcement of soils, Hot Mix Aggregate.
Utilization areas of cement kiln dust are Soil stabilization and Asphalt pavement.
Beneficial applications of foundry sands are Asphalt mixtures, Mortar mixes, Portland
cement concrete, Retaining walls.
Coal combustion is byproduct of Fly ash and approx. 75% Fly ash is allow to
replacement in concrete materials for parking lots, driveways
Expanded slags possesses low density characteristic
Recycled concrete can be reused in Construction Industries.
JOURNAL OF INTERNATIONAL ACADEMIC RESEARCH FOR MULTIDISCIPLINARY Impact Factor 1.393, ISSN: 2320-5083, Volume 1, Issue 11, December 2013
322 www.jiarm.com
Percentage level of Industries which does not utilized recycling wastes is approx. 16 –
18% and Percentage level of Industries which does not utilized recycling wastes due to
cost is approx. 22 -25%
There are several reasons which restrict utilization of Industrial waste are not aware of
the availability and Lack of Information regarding Quality of the materials, Performance,
Cost saving.
There are many mineral waste products such as Bricks, Tiles and Lightweight aggregate.
Utilization areas of reused marble wastes are road construction, concrete, Cement,
Building materials etc.
Approx. 110 – 115 MT coal combustion residue are releases from thermal plants.
Bauxite red mud is used for bricks production.
National highway authority of India’s government project is completed by Fly ash as
building material and approx. 1,00,000 – 5,00,000 cu.m Fly ash is utilized for NH-1 in
Delhi and approx. 5,00,000 – 10,00,000 cu.m Fly ash is utilized in Durgapur express way
and approx. 100 – 199 MT Fly ash is producing per year in India.
Cement plants is the source of wastage produced of Industry kiln dust and approx. 1.5 –
1.7 MT kiln dust is producing per year.
There are many application areas of red mud such as binder, in floor tiles, in slab work etc.
There are approx. 11 -14 MT Fly ash utilized in India.
There are many applied areas of mining waste such as Bricks, Tiles, Lightweight
aggregates etc. and Coal washeries waste is a type of mining waste
There are many types of hazardous wastes such as Metallurgical residues, Galvanizing
waste, Tannery waste etc. and their application areas are Cement, Bricks, Tiles, Cement
and board etc. and approx. 4 – 5 MT hazardous waste generates per year in India and
approx. 1.5 – 2.0% hazardous waste is recyclable.
There are approx. 10 – 15 MT Fly ash generates in southern and eastern zone of India,
approx. 15 -20 MT Fly ash generates in western and central zone of India, approx.
There are approx. 11,00,000 – 13,00,000 cu.m Fly ash is reused in haldia port
connectivity project and approx. 3,00,000 – 4,00,000 cu.m Fly ash is used in NH-2 in the
state UP and approx. 65,00,000 – 70,00,000 cu.m Fly ash is used in Allahabad bypass on NH-2.
Gujarat ambuja cement ltd has constructed first concrete road by using Fly ash and in
Nasik city higher dose of fly ash is used for roller compacted concrete technology and its
price is approx. between Rs.500 – 700.
JOURNAL OF INTERNATIONAL ACADEMIC RESEARCH FOR MULTIDISCIPLINARY Impact Factor 1.393, ISSN: 2320-5083, Volume 1, Issue 11, December 2013
323 www.jiarm.com
Class F and Class C are two category of Fly ash and their main components are Silica
Oxides (SiO2) and Calcium Oxides (CaO).
Approx. particles size of Fly ash is 0.5 to 300 µm and approx. 75% ash used in cement
replacement which have fineness of 45 µm or less and approx. carbon content for reuse
of Fly ash is 24% and approx. 90% Fly ash can reduce the embodied energy of masonry
construction.
If a 1000 MW plant burning coal with 40% ash and sell the fly ash at only Rs. 300 per
ton then Rs. 12 -13 crore can be saved.
There is approx. 1 – 5 MT annual demand of fly ash for production of PPC in Gujarat
There are many characteristics of cement kiln dust such as fine grained, solid, highly
alkaline etc.
During slump test of rubberized concrete, 100 mm slump is achieved when 10% TYRE
chips mixed and 125 mm slump is achieved when 15% TYRE chips mixed and 150 mm
slump is achieved when 30% TYRE chips mixed.
There are many uses of waste TYRE such as hot melt asphalt, crumb rubber modifier
recycled asphalt pavement, aggregate in Portland cement etc. and the main reason of
Rubberized asphalt utilization is High durability.
Arizona is a first leading country which ustilized ruberised asphalt and approx. 12 DB
reduction of road noise can be achieved by its utilization.
By product of Silica fume is Silicon and ferrosilicon alloy production and first testing of
silica fume in Portland cement based concrete is conducted in the year 1952.
The bulk density of silica fume is 130 to 600 kg/m3 and its specific gravity is 2.2 – 2.3
and by its utilization many characteristics can be improved in PCC which are
Compressive strength, Bond strength, Abrasion resistance.
The constituents of Cement kiln dust are calcined, unreacted raw feed, Clinker dust, Fuel
ash and it possesses characteristics such as strength, swell, stiffness, durability etc.
There are 28 days Cement Kiln Dust (CKD) samples compacted and cured in moisture
room for determine the strength of CKD.
JOURNAL OF INTERNATIONAL ACADEMIC RESEARCH FOR MULTIDISCIPLINARY Impact Factor 1.393, ISSN: 2320-5083, Volume 1, Issue 11, December 2013
324 www.jiarm.com
REFERENCES
1. Ashish H. Makwana, Prof. Jayeshkumar Pitroda, “A Study on Region wise Price Variation of Construction Raw Materials using Frequency Analysis through SPSS Software”, International Journal of Engineering Trends and Technology (IJETT), Impact Factor 0.537, ISSN: 2231-5381, Volume 4, Issue 7, July 2013, Pg. 3233 – 3242.
2. Bharat G. Bhudiya, Sanjay S. Narola, Ashish H. Makwana, Jayeshkumar Pitroda, “Assessment on Autoclaved Aerated Concrete Blocks using Frequency Analysis through SPSS software in Charotar Region of Central Gujarat”, Journal of International Academic Research for Multidisciplinary (JIARM), Impact Factor 1.393, ISSN: 2320-5083, Volume 1, Issue 10, November 2013, Pg. 367 – 386.
3. Chapter Eight, Waste http://www.unescap.org/esd/environment/soe/2000/documents/CH08.PDF
4. Darsh Belani, Ashish H. Makwana, Jayeshkumar Pitroda, “A study of evaluation Criterias for Renewable Energy Resources using Frequency Analysis through SPSS software”, Journal of International Academic Research for Multidisciplinary (JIARM), Impact Factor 1.393, ISSN: 2320-5083, Volume 1, Issue 10, November 2013, Pg. 350 – 366.
5. Dhrumil S. Chokshi, Ashish H. Makwana, Jayeshkumar Pitroda, “A Preliminary Study on Importances of Fly-ash Bricks and Clay Bricks in Construction Industry through SPSS software”, International Journal of Civil, Structural, Environmental and Infrastructure Engineering Research and Development (IJCSEIERD), Impact Factor 5.4829, ISSN(P): 2249-6866; ISSN(E): 2249-7978, Vol. 3, Issue 5, December 2013, 125-132, © TJPRC Pvt. Ltd. 5.
6. European Topic Centre on Sustainable Consumption and Production, http://scp.eionet.europa.eu/themes/waste
7. Hitesh D. Bambhava, Prof. Jayeshkumar Pitroda, Prof. Jaydev J. Bhavsar, “A Comparative Study On Bamboo Scaffolding And Metal Scaffolding In Construction Industry Using Statistical Methods”, International Journal of Engineering Trends and Technology (IJETT), Impact Factor 0.537, ISSN: 2231-5381, Volume 4, Issue 6, June 2013, Pg. 2330 – 2337.
8. Industrial waste, http://en.wikipedia.org/wiki/Industrial_waste 9. King County Industrial Waste Enforcement Response Plan,
http://www.kingcounty.gov/operations/policies/rules/utilities/put8121pr.aspx 10. P. Ganesh Prabhu, D. Ambika, “Study on Behaviour of Workers in Construction Industry to
Improve Production Efficiency”, International Journal of Civil, Structural, Environmental and Infrastructure Engineering Research and Development (IJCSEIERD), Impact Factor 5.4829, ISSN 2249-6866 Vol. 3, Issue 1, Mar 2013, 59-66, © TJPRC Pvt Ltd. 5.
11. Richard A Johnson, “Miller & Freund’s Probability and Statistics for Engineers”, Seventh Edition, Prentice-Hall of India Private Limited, New Delhi-110 001, 2005