SPSS & Data Management
10
Khan Sarfaraz Ali / [email protected] / www.lifebangladesh.com Page 1 of 10 Data Management & SPSS Khan Sarfaraz Ali Course Objective: This course has been designed to give a basic understanding of Data Management and SPSS. Specially, how does SPSS works and how to run simple statistical analysis of data for research purpose. The students in the class will have a hands-on experience using SPSS for doing statistics, graphics, and data management. Learning Outcomes: 1. Defining Data and Information 2. Describing Management 3. Identifying Database Management System 4. Understanding the layout and interface of SPSS 5. Introducing the main menus 6. Opening and creating new datasets Course Outline: 1. Definition of Data and Information 2. What is Data Management? 3. What is a Database Management System? 4. Fundamentals of SPSS a) Introduction to what SPSS can do b) Descriptive information and statistics c) An overview of statistical tests in SPSS d) Exploring data with graphics 2. Reading Raw Data into SPSS a) Inputting raw data into SPSS b) Inputting data directly into the SPSS Data Editor c) Reading dates into SPSS and using date variables 3. Basic Data Management in SPSS a) Creating and recoding variables b) Using SPSS functions for making/recoding variables c) Sub setting variables and observations 4. Intermediate Data Management in SPSS 5. Analyzing data using descriptive statistics
Transcript of SPSS & Data Management
Khan Sarfaraz Ali / [email protected] / www.lifebangladesh.com Page 1 of 10
Data Management & SPSS
Khan Sarfaraz Ali
Course Objective:
This course has been designed to give a basic understanding of Data Management and SPSS.
Specially, how does SPSS works and how to run simple statistical analysis of data for research
purpose. The students in the class will have a hands-on experience using SPSS for doing
statistics, graphics, and data management.
Learning Outcomes:
1. Defining Data and Information
2. Describing Management
3. Identifying Database Management System
4. Understanding the layout and interface of SPSS
5. Introducing the main menus
6. Opening and creating new datasets
Course Outline:
1. Definition of Data and Information
2. What is Data Management?
3. What is a Database Management System?
4. Fundamentals of SPSS
a) Introduction to what SPSS can do
b) Descriptive information and statistics
c) An overview of statistical tests in SPSS
d) Exploring data with graphics
2. Reading Raw Data into SPSS
a) Inputting raw data into SPSS
b) Inputting data directly into the SPSS Data Editor
c) Reading dates into SPSS and using date variables
3. Basic Data Management in SPSS
a) Creating and recoding variables
b) Using SPSS functions for making/recoding variables
c) Sub setting variables and observations
4. Intermediate Data Management in SPSS
5. Analyzing data using descriptive statistics
Khan Sarfaraz Ali / [email protected] / www.lifebangladesh.com Page 2 of 10
SPSS (Statistical Package for the Social Sciences)
Khan Sarfaraz Ali
(BSS (Hons)-1st Class, MSS-1
st Class, PGDPM-1
st Class, ITD (Tanzania), M. Phil, PhD (Fellow)-Malaysia)
Background
SPSS is a software package used for statistical analysis. Long produced by SPSS Inc., it was
acquired by IBM in 2009. The current versions (2014) are officially named IBM SPSS
Statistics. Companion products in the same family are used for survey authoring and
deployment (IBM SPSS Data Collection), data mining (IBM SPSS Modeler), text analytics,
and collaboration and deployment (batch and automated scoring services). The software name
stands for Statistical Package for the Social Sciences (SPSS), reflecting the original market,
although the software is now popular in other fields as well, including the health sciences and
marketing. SPSS is a very easy-to-use statistical package that runs on Windows, Macintosh and
UNIX platforms. This class is designed for people who are just starting to use SPSS. These
notes were developed using SPSS version 17, but most of the material should work with
slightly earlier or later versions of SPSS.
Significance of SPSS
SPSS is one of the most widely used programs for statistical analysis in social science. SPSS
helps in analyzing obtained data in a more systematic and computerized way. By using SPSS it
is easy to get analytical result within a short period of time. SPSS directly assist in getting all
statistical results like: Central tendency, Frequency distribution, Standard deviation, Test of
hypothesis etc. In addition, by using SPSS any type of chart or diagram also can be drawn and
shown in different table. In brief, SPSS helps exclusively in compiling, preparing and
presenting all research data in a befitting way.
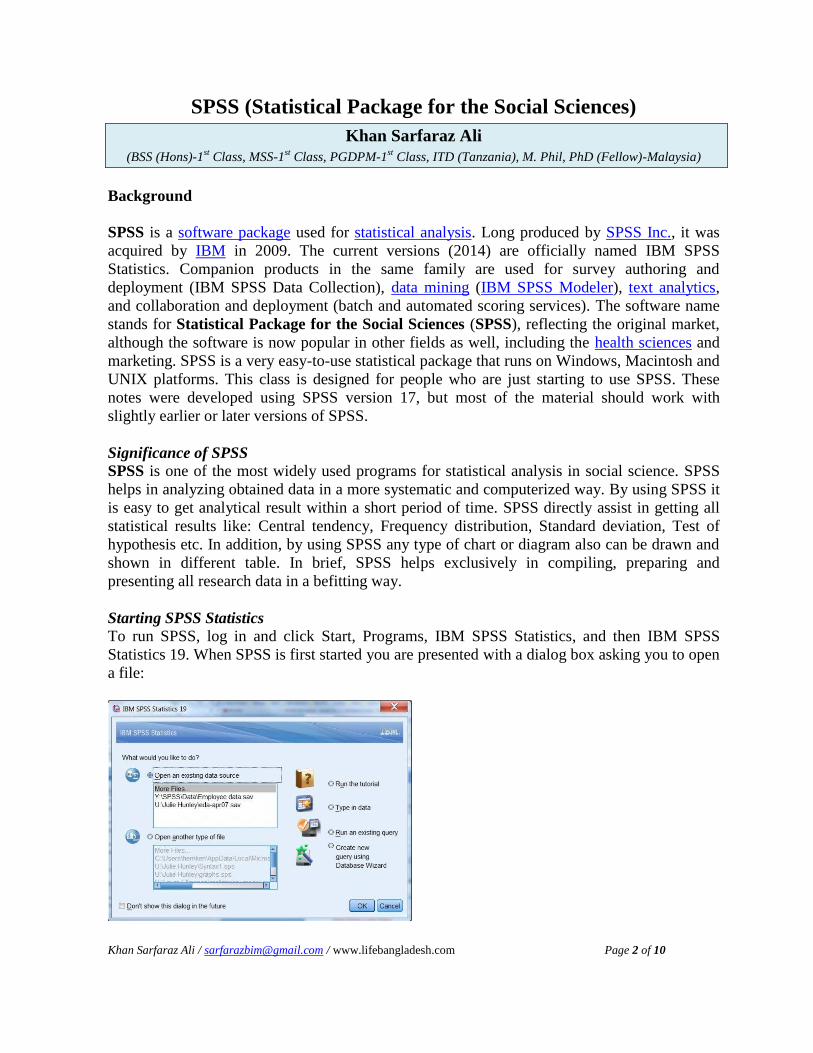
Starting SPSS Statistics
To run SPSS, log in and click Start, Programs, IBM SPSS Statistics, and then IBM SPSS
Statistics 19. When SPSS is first started you are presented with a dialog box asking you to open
a file:
Khan Sarfaraz Ali / [email protected] / www.lifebangladesh.com Page 3 of 10
Typically you start your SPSS session by opening the data file that you need to work with.
The SPSS Windows and Files
SPSS Statistics has three main windows, plus a menu bar at the top. These allow you to (1) see
your data, (2) see your statistical output, and (3) see any programming commands you have
written. Each window corresponds to a separate type of SPSS file.
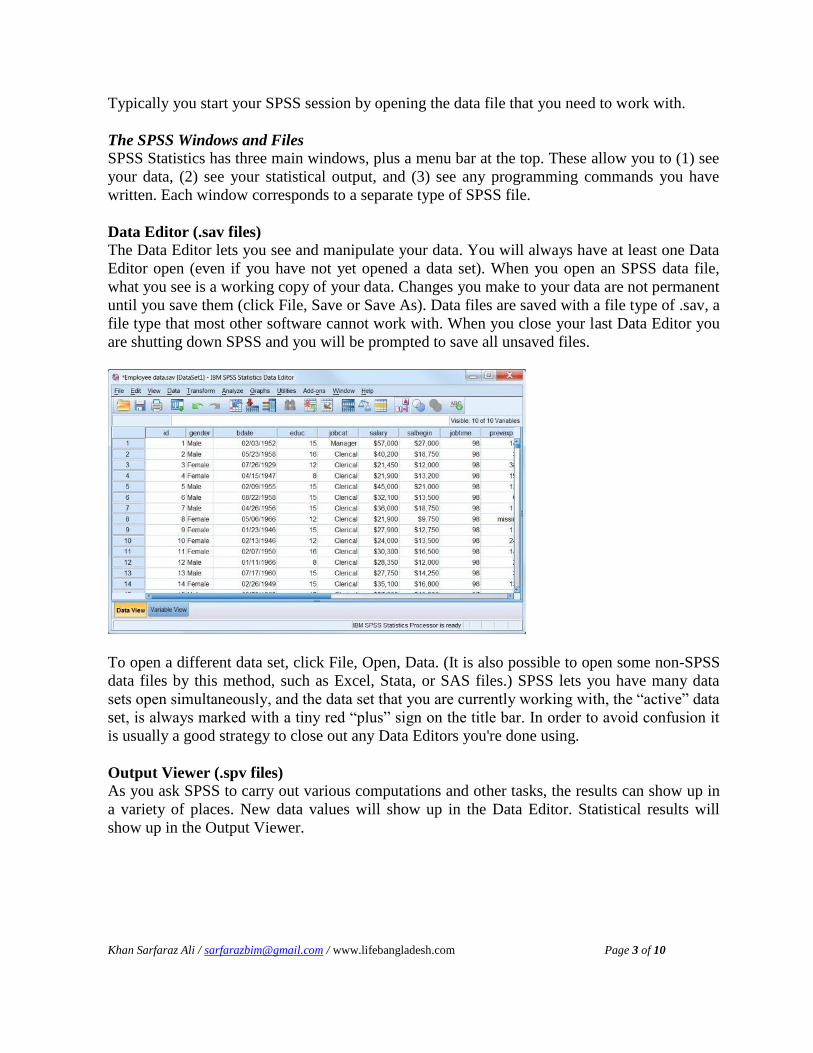
Data Editor (.sav files)
The Data Editor lets you see and manipulate your data. You will always have at least one Data
Editor open (even if you have not yet opened a data set). When you open an SPSS data file,
what you see is a working copy of your data. Changes you make to your data are not permanent
until you save them (click File, Save or Save As). Data files are saved with a file type of .sav, a
file type that most other software cannot work with. When you close your last Data Editor you
are shutting down SPSS and you will be prompted to save all unsaved files.
To open a different data set, click File, Open, Data. (It is also possible to open some non-SPSS
data files by this method, such as Excel, Stata, or SAS files.) SPSS lets you have many data
sets open simultaneously, and the data set that you are currently working with, the “active” data
set, is always marked with a tiny red “plus” sign on the title bar. In order to avoid confusion it
is usually a good strategy to close out any Data Editors you're done using.
Output Viewer (.spv files)
As you ask SPSS to carry out various computations and other tasks, the results can show up in
a variety of places. New data values will show up in the Data Editor. Statistical results will
show up in the Output Viewer.
Khan Sarfaraz Ali / [email protected] / www.lifebangladesh.com Page 4 of 10
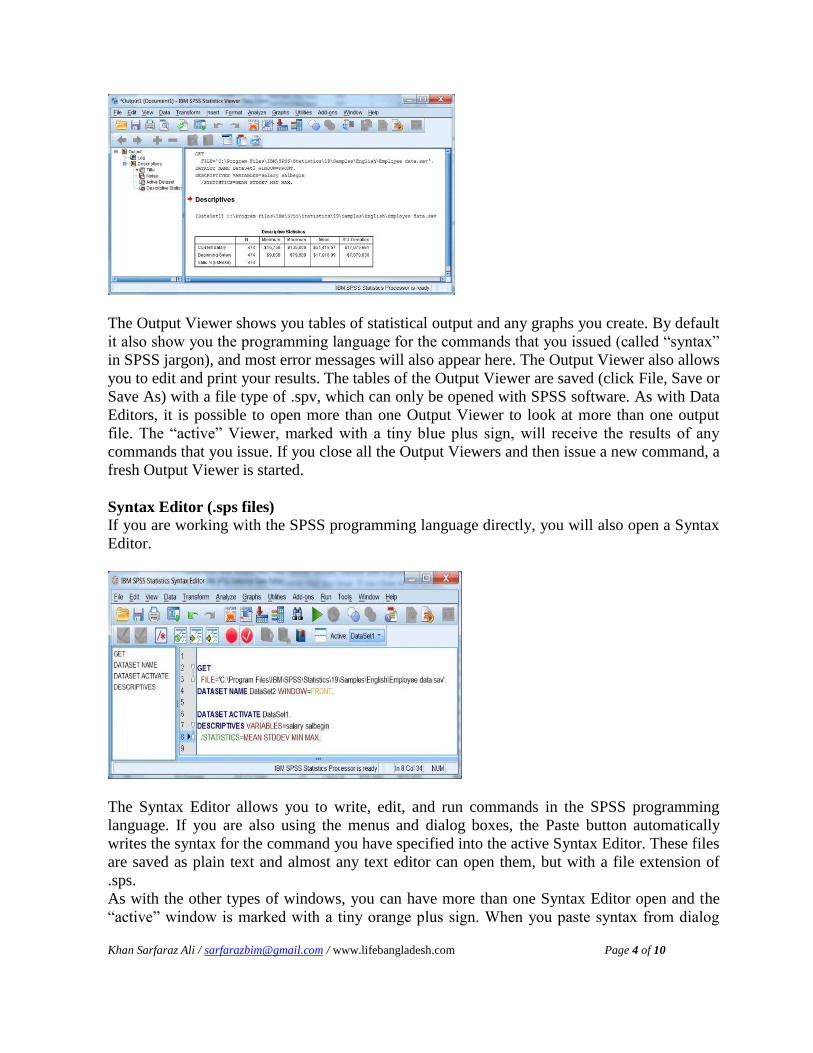
The Output Viewer shows you tables of statistical output and any graphs you create. By default
it also show you the programming language for the commands that you issued (called “syntax”
in SPSS jargon), and most error messages will also appear here. The Output Viewer also allows
you to edit and print your results. The tables of the Output Viewer are saved (click File, Save or
Save As) with a file type of .spv, which can only be opened with SPSS software. As with Data
Editors, it is possible to open more than one Output Viewer to look at more than one output
file. The “active” Viewer, marked with a tiny blue plus sign, will receive the results of any
commands that you issue. If you close all the Output Viewers and then issue a new command, a
fresh Output Viewer is started.
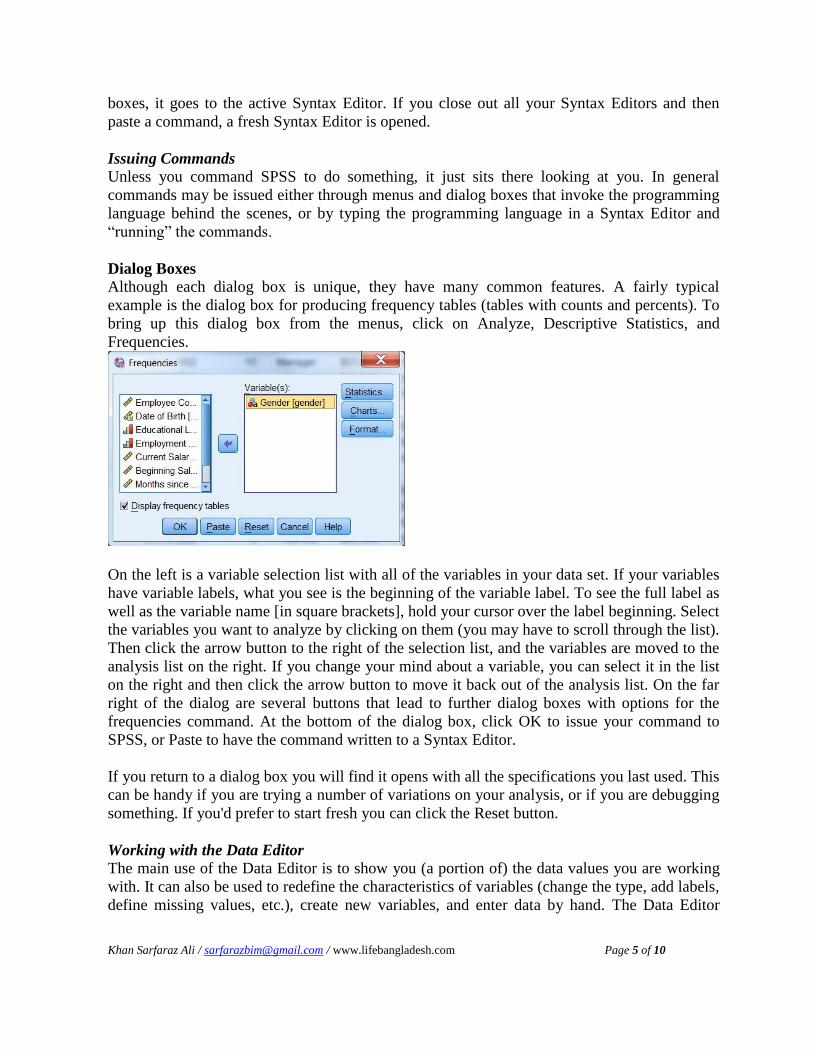
Syntax Editor (.sps files)
If you are working with the SPSS programming language directly, you will also open a Syntax
Editor.
The Syntax Editor allows you to write, edit, and run commands in the SPSS programming
language. If you are also using the menus and dialog boxes, the Paste button automatically
writes the syntax for the command you have specified into the active Syntax Editor. These files
are saved as plain text and almost any text editor can open them, but with a file extension of
.sps.
As with the other types of windows, you can have more than one Syntax Editor open and the
“active” window is marked with a tiny orange plus sign. When you paste syntax from dialog
Khan Sarfaraz Ali / [email protected] / www.lifebangladesh.com Page 5 of 10
boxes, it goes to the active Syntax Editor. If you close out all your Syntax Editors and then
paste a command, a fresh Syntax Editor is opened.
Issuing Commands
Unless you command SPSS to do something, it just sits there looking at you. In general
commands may be issued either through menus and dialog boxes that invoke the programming
language behind the scenes, or by typing the programming language in a Syntax Editor and
“running” the commands.
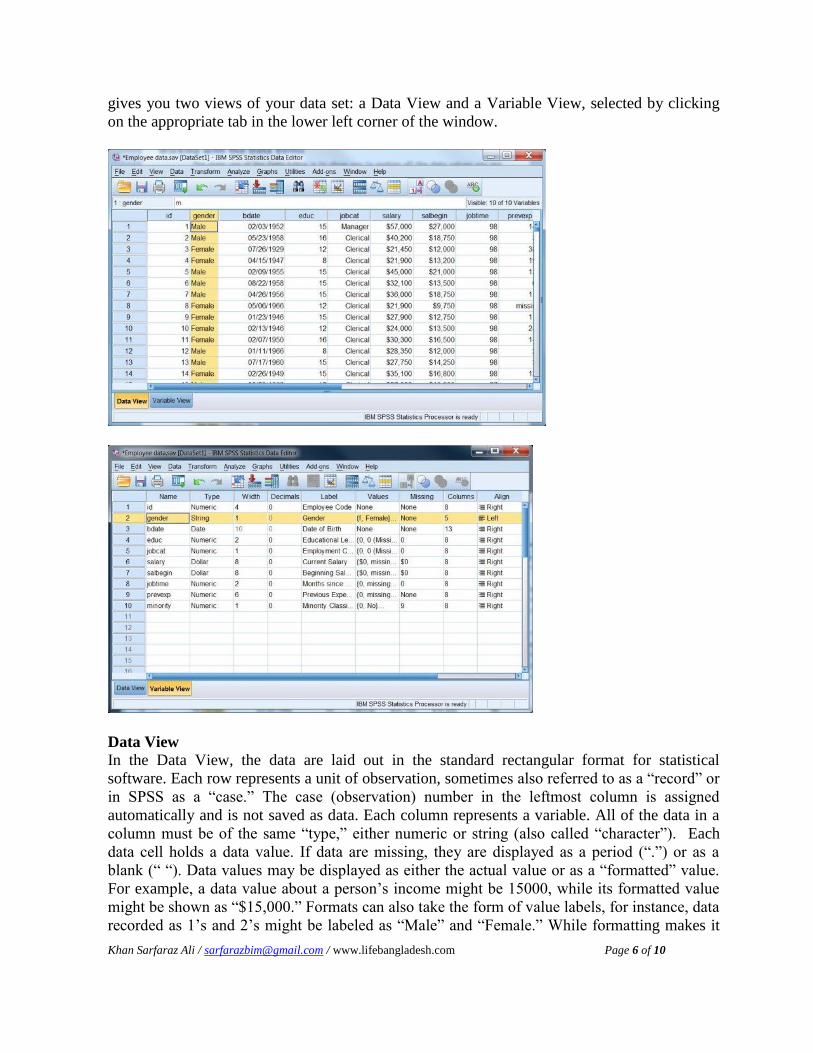
Dialog Boxes
Although each dialog box is unique, they have many common features. A fairly typical
example is the dialog box for producing frequency tables (tables with counts and percents). To
bring up this dialog box from the menus, click on Analyze, Descriptive Statistics, and
Frequencies.
On the left is a variable selection list with all of the variables in your data set. If your variables
have variable labels, what you see is the beginning of the variable label. To see the full label as
well as the variable name [in square brackets], hold your cursor over the label beginning. Select
the variables you want to analyze by clicking on them (you may have to scroll through the list).
Then click the arrow button to the right of the selection list, and the variables are moved to the
analysis list on the right. If you change your mind about a variable, you can select it in the list
on the right and then click the arrow button to move it back out of the analysis list. On the far
right of the dialog are several buttons that lead to further dialog boxes with options for the
frequencies command. At the bottom of the dialog box, click OK to issue your command to
SPSS, or Paste to have the command written to a Syntax Editor.
If you return to a dialog box you will find it opens with all the specifications you last used. This
can be handy if you are trying a number of variations on your analysis, or if you are debugging
something. If you'd prefer to start fresh you can click the Reset button.
Working with the Data Editor
The main use of the Data Editor is to show you (a portion of) the data values you are working
with. It can also be used to redefine the characteristics of variables (change the type, add labels,
define missing values, etc.), create new variables, and enter data by hand. The Data Editor
Khan Sarfaraz Ali / [email protected] / www.lifebangladesh.com Page 6 of 10
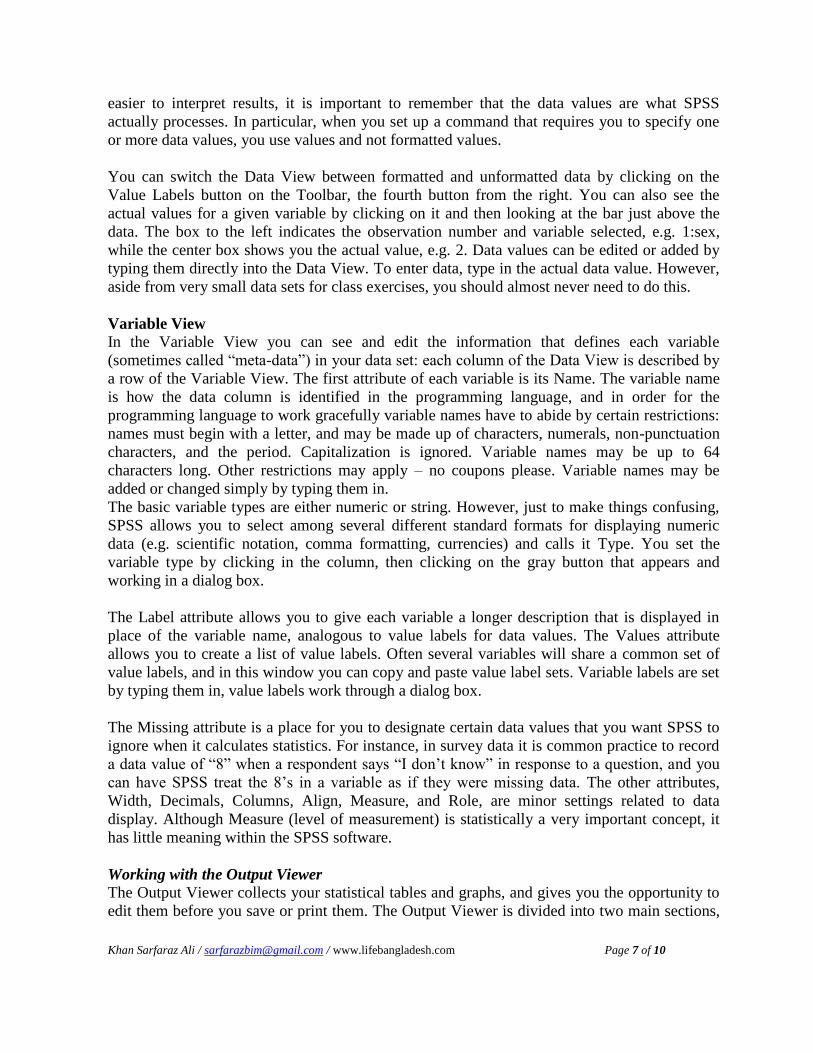
gives you two views of your data set: a Data View and a Variable View, selected by clicking
on the appropriate tab in the lower left corner of the window.
Data View
In the Data View, the data are laid out in the standard rectangular format for statistical
software. Each row represents a unit of observation, sometimes also referred to as a “record” or
in SPSS as a “case.” The case (observation) number in the leftmost column is assigned
automatically and is not saved as data. Each column represents a variable. All of the data in a
column must be of the same “type,” either numeric or string (also called “character”). Each
data cell holds a data value. If data are missing, they are displayed as a period (“.”) or as a
blank (“ “). Data values may be displayed as either the actual value or as a “formatted” value.
For example, a data value about a person’s income might be 15000, while its formatted value
might be shown as “$15,000.” Formats can also take the form of value labels, for instance, data
recorded as 1’s and 2’s might be labeled as “Male” and “Female.” While formatting makes it
Khan Sarfaraz Ali / [email protected] / www.lifebangladesh.com Page 7 of 10
easier to interpret results, it is important to remember that the data values are what SPSS
actually processes. In particular, when you set up a command that requires you to specify one
or more data values, you use values and not formatted values.
You can switch the Data View between formatted and unformatted data by clicking on the
Value Labels button on the Toolbar, the fourth button from the right. You can also see the
actual values for a given variable by clicking on it and then looking at the bar just above the
data. The box to the left indicates the observation number and variable selected, e.g. 1:sex,
while the center box shows you the actual value, e.g. 2. Data values can be edited or added by
typing them directly into the Data View. To enter data, type in the actual data value. However,
aside from very small data sets for class exercises, you should almost never need to do this.
Variable View
In the Variable View you can see and edit the information that defines each variable
(sometimes called “meta-data”) in your data set: each column of the Data View is described by
a row of the Variable View. The first attribute of each variable is its Name. The variable name
is how the data column is identified in the programming language, and in order for the
programming language to work gracefully variable names have to abide by certain restrictions:
names must begin with a letter, and may be made up of characters, numerals, non-punctuation
characters, and the period. Capitalization is ignored. Variable names may be up to 64
characters long. Other restrictions may apply – no coupons please. Variable names may be
added or changed simply by typing them in.
The basic variable types are either numeric or string. However, just to make things confusing,
SPSS allows you to select among several different standard formats for displaying numeric
data (e.g. scientific notation, comma formatting, currencies) and calls it Type. You set the
variable type by clicking in the column, then clicking on the gray button that appears and
working in a dialog box.
The Label attribute allows you to give each variable a longer description that is displayed in
place of the variable name, analogous to value labels for data values. The Values attribute
allows you to create a list of value labels. Often several variables will share a common set of
value labels, and in this window you can copy and paste value label sets. Variable labels are set
by typing them in, value labels work through a dialog box.
The Missing attribute is a place for you to designate certain data values that you want SPSS to
ignore when it calculates statistics. For instance, in survey data it is common practice to record
a data value of “8” when a respondent says “I don’t know” in response to a question, and you
can have SPSS treat the 8’s in a variable as if they were missing data. The other attributes,
Width, Decimals, Columns, Align, Measure, and Role, are minor settings related to data
display. Although Measure (level of measurement) is statistically a very important concept, it
has little meaning within the SPSS software.
Working with the Output Viewer
The Output Viewer collects your statistical tables and graphs, and gives you the opportunity to
edit them before you save or print them. The Output Viewer is divided into two main sections,
Khan Sarfaraz Ali / [email protected] / www.lifebangladesh.com Page 8 of 10
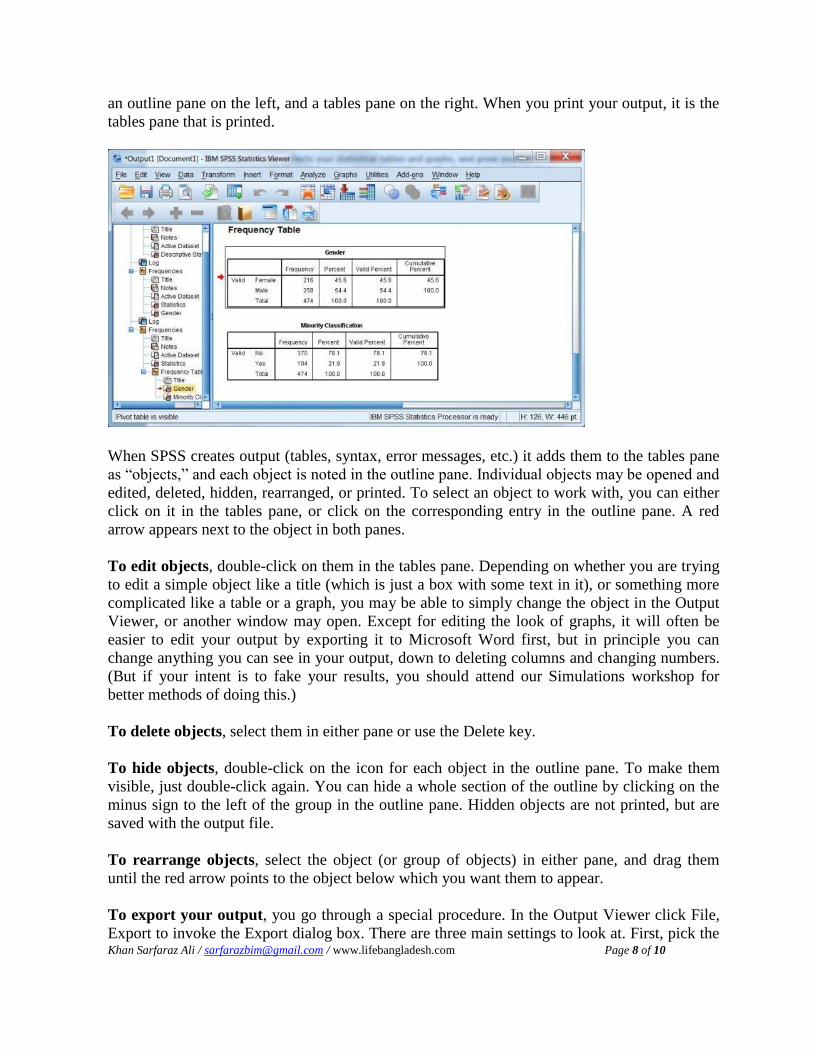
an outline pane on the left, and a tables pane on the right. When you print your output, it is the
tables pane that is printed.
When SPSS creates output (tables, syntax, error messages, etc.) it adds them to the tables pane
as “objects,” and each object is noted in the outline pane. Individual objects may be opened and
edited, deleted, hidden, rearranged, or printed. To select an object to work with, you can either
click on it in the tables pane, or click on the corresponding entry in the outline pane. A red
arrow appears next to the object in both panes.
To edit objects, double-click on them in the tables pane. Depending on whether you are trying
to edit a simple object like a title (which is just a box with some text in it), or something more
complicated like a table or a graph, you may be able to simply change the object in the Output
Viewer, or another window may open. Except for editing the look of graphs, it will often be
easier to edit your output by exporting it to Microsoft Word first, but in principle you can
change anything you can see in your output, down to deleting columns and changing numbers.
(But if your intent is to fake your results, you should attend our Simulations workshop for
better methods of doing this.)
To delete objects, select them in either pane or use the Delete key.
To hide objects, double-click on the icon for each object in the outline pane. To make them
visible, just double-click again. You can hide a whole section of the outline by clicking on the
minus sign to the left of the group in the outline pane. Hidden objects are not printed, but are
saved with the output file.
To rearrange objects, select the object (or group of objects) in either pane, and drag them
until the red arrow points to the object below which you want them to appear.
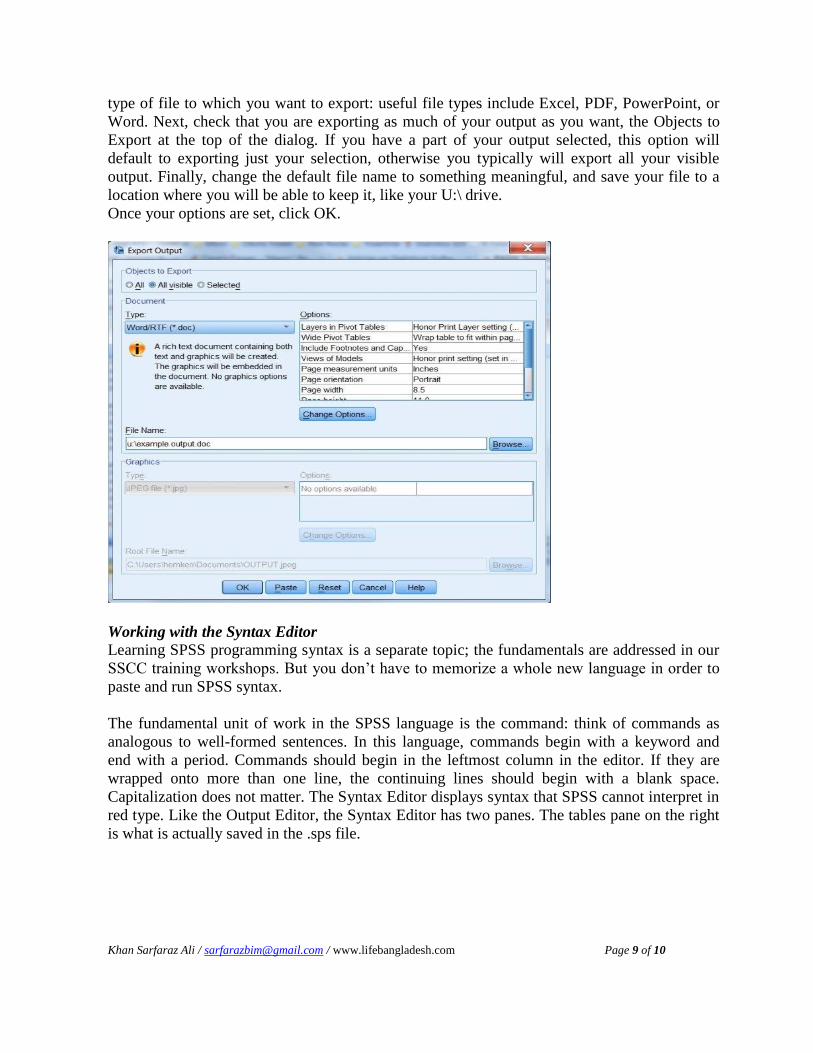
To export your output, you go through a special procedure. In the Output Viewer click File,
Export to invoke the Export dialog box. There are three main settings to look at. First, pick the
Khan Sarfaraz Ali / [email protected] / www.lifebangladesh.com Page 9 of 10
type of file to which you want to export: useful file types include Excel, PDF, PowerPoint, or
Word. Next, check that you are exporting as much of your output as you want, the Objects to
Export at the top of the dialog. If you have a part of your output selected, this option will
default to exporting just your selection, otherwise you typically will export all your visible
output. Finally, change the default file name to something meaningful, and save your file to a
location where you will be able to keep it, like your U:\ drive.
Once your options are set, click OK.
Working with the Syntax Editor
Learning SPSS programming syntax is a separate topic; the fundamentals are addressed in our
SSCC training workshops. But you don’t have to memorize a whole new language in order to
paste and run SPSS syntax.
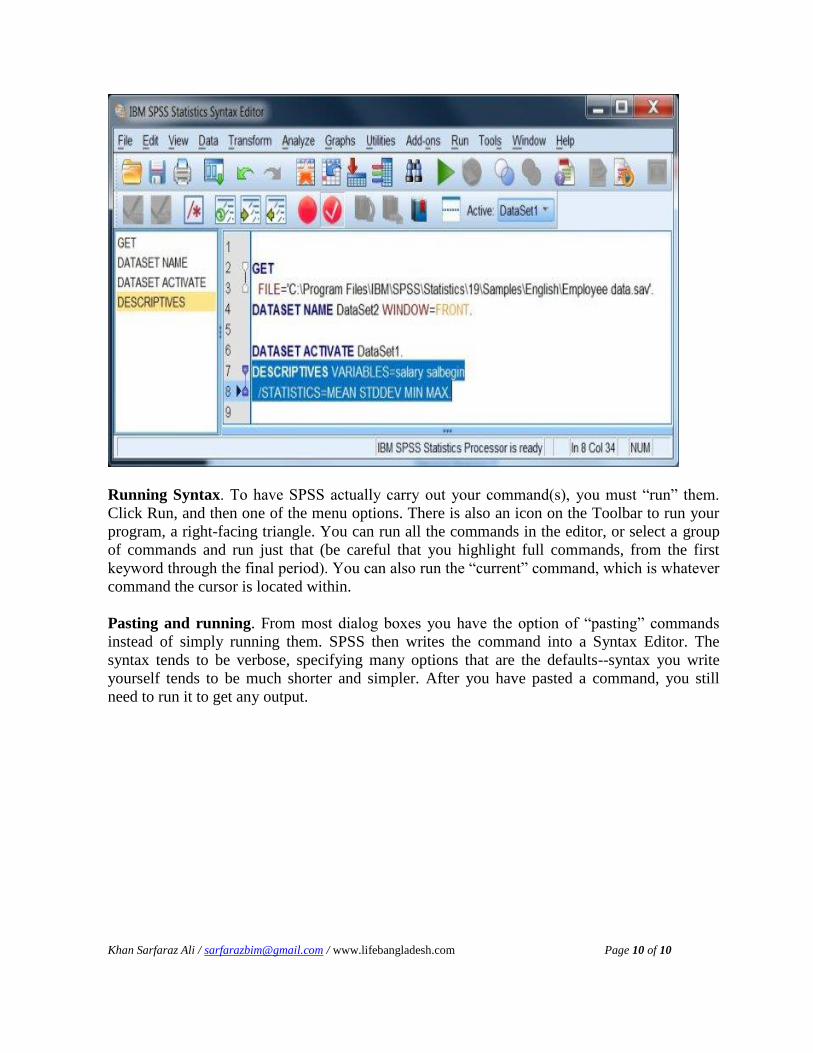
The fundamental unit of work in the SPSS language is the command: think of commands as
analogous to well-formed sentences. In this language, commands begin with a keyword and
end with a period. Commands should begin in the leftmost column in the editor. If they are
wrapped onto more than one line, the continuing lines should begin with a blank space.
Capitalization does not matter. The Syntax Editor displays syntax that SPSS cannot interpret in
red type. Like the Output Editor, the Syntax Editor has two panes. The tables pane on the right
is what is actually saved in the .sps file.
Khan Sarfaraz Ali / [email protected] / www.lifebangladesh.com Page 10 of 10
Running Syntax. To have SPSS actually carry out your command(s), you must “run” them.
Click Run, and then one of the menu options. There is also an icon on the Toolbar to run your
program, a right-facing triangle. You can run all the commands in the editor, or select a group
of commands and run just that (be careful that you highlight full commands, from the first
keyword through the final period). You can also run the “current” command, which is whatever
command the cursor is located within.
Pasting and running. From most dialog boxes you have the option of “pasting” commands
instead of simply running them. SPSS then writes the command into a Syntax Editor. The
syntax tends to be verbose, specifying many options that are the defaults--syntax you write
yourself tends to be much shorter and simpler. After you have pasted a command, you still
need to run it to get any output.