National and regional implications of internet data center growth in the US
Upload
khangminh22Category
view
2download
0
sensors
Article
Distributed Data Service for Data Management inInternet of Things Middleware
Ruben Cruz Huacarpuma 1,†, Rafael Timoteo de Sousa Junior 1,†, Maristela Terto de Holanda 2,†,Robson de Oliveira Albuquerque 1,†, Luis Javier García Villalba 3,*,† and Tai-Hoon Kim 4,†
1 Cybersecurity INCT Unit 6, Decision Technologies Laboratory—LATITUDE, Electrical EngineeringDepartment (ENE), Technology College, University of Brasília (UnB), Brasília-DF, CEP 70910-900, Brazil;[email protected] (R.C.H.); [email protected] (R.T.d.S.J.); [email protected] (R.d.O.A.)
2 Department of Computer Science, University of Brasília (UnB), Brasília-DF, CEP 70910-900, Brazil;[email protected]
3 Group of Analysis, Security and Systems (GASS), Department of Software Engineering and ArtificialIntelligence (DISIA), Faculty of Computer Science and Engineering, Office 431, Universidad Complutensede Madrid (UCM), Calle Profesor José García Santesmases, 9, Ciudad Universitaria, Madrid 28040, Spain
4 Department of Convergence Security, Sungshin Women’s University, 249-1 Dongseon-Dong 3-ga,Seoul 136-742, Korea; [email protected]
* Correspondence: [email protected]; Tel.: +34-91-394-7638† These authors contributed equally to this work.
Academic Editors: Muhammad Imran, Athanasios V. Vasilakos, Thaier Hayajneh and Neal N. XiongReceived: 17 December 2016; Accepted: 21 April 2017; Published: 27 April 2017
Abstract: The development of the Internet of Things (IoT) is closely related to a considerable increasein the number and variety of devices connected to the Internet. Sensors have become a regularcomponent of our environment, as well as smart phones and other devices that continuously collectdata about our lives even without our intervention. With such connected devices, a broad range ofapplications has been developed and deployed, including those dealing with massive volumes ofdata. In this paper, we introduce a Distributed Data Service (DDS) to collect and process data forIoT environments. One central goal of this DDS is to enable multiple and distinct IoT middlewaresystems to share common data services from a loosely-coupled provider. In this context, we proposea new specification of functionalities for a DDS and the conception of the corresponding techniquesfor collecting, filtering and storing data conveniently and efficiently in this environment. Anothercontribution is a data aggregation component that is proposed to support efficient real-time dataquerying. To validate its data collecting and querying functionalities and performance, the proposedDDS is evaluated in two case studies regarding a simulated smart home system, the first case devotedto evaluating data collection and aggregation when the DDS is interacting with the UIoT middleware,and the second aimed at comparing the DDS data collection with this same functionality implementedwithin the Kaa middleware.
Keywords: Internet of Things (IoT); IoT middleware; data collection; data aggregation; real time;NoSQL
1. Introduction
In the near future, the Internet of Things (IoT) is expected to connect an ever increasing numberof smart and embedded devices, giving way to new opportunities to build applications that aremore integrated to real-time situations in the physical world. It is estimated that the number ofinterconnected devices will reach 50 billion by 2020 [1–3], considering that there are currently over fourbillion mobile phone users who already have the ability to access the Internet. Intelligent systems anddevices, such as smart phones, smart transport means (for instance, cars, bikes, boats), smart factories,
Sensors 2017, 17, 977; doi:10.3390/s17050977 www.mdpi.com/journal/sensors

Sensors 2017, 17, 977 2 of 25
smart machines and even smart clothes (for instance, glasses and watches), are already connecting andinteracting automatically with sensors that generate and transmit data without human intervention,as well as with actuators able to intervene in the physical world.
While IoT offers new opportunities in application development, the management of large volumesof data produced in this environment continues to be a challenge. For example, it is worth consideringa city transport monitoring system, with several sensors for the lights, cameras and poles, and whereevery 5 s, each sensor sends data posts of 160 bytes in length. In a single day the volume of dataproduced by each of these sensors would be 2.64 MB, in a month, 81.74 MB and, in a year, 962.40 MB.Thus, if this monitoring system comprises around 10 thousand sensors, it can generate more than9.6 TB per day. In this class of application, the number of sensors tends to grow every day.
A common architectural component supporting these simultaneous and parallel IoT applications,which we define as IoT instances, is the IoT middleware, a system that effectively manages thevarious heterogeneous components that must interconnect and interoperate [4,5]. Specifically, the IoTmiddleware is a software layer between the physical layer of devices and their interfaces and theapplication layer that integrates the logic and control of the IoT instance. In order to facilitate theintegration and the communication of heterogeneous components, it is required of the IoT middlewareto provide a set of programming abstractions, including device discovery, access and administrationservices, among others. For this class of systems, large-scale data transmission throughout the Internetis a standard requirement, given the need of sharing data pervasively in the network. Managing thecorresponding enormous volume of data is still a formidable challenge. In addition, each middlewarecan use a specific data format, such as, for example, the XML format in some middleware and theJSON format in others. Consequently, it is challenging to integrate all data coming from different IoTenvironments, with different formats, arising in large volume and high variety, and this challengerequires better approaches on how to collect, process and store these data; otherwise, it remains forevery application to cope with the related issues.
For managing the large volume of data within IoT environments, IoT middleware systemsimplement particular data collectors, using particular data formats and different storage architectures,ranging from centralized relational database management systems to NoSQL distributed systems.In general, these data collectors are logically tied and strongly coupled to the middleware architecture,as in, for example, EcoDif [6], Xively [7], OpenIoT [8], RestThing [9], WSO2 [10] and Kaa [11].In a common structure for an IoT system instance, one or more of these middleware will manage IoTdevices that must send data to an Internet application server, this being the application server and themanaged devices owned by the same organization. However, it is foreseen that future IoT systemswill involve applications to access data collected from devices owned by different individuals andorganizations. In such future systems, largely distributed and reliable data management services willbe required to cope with heterogeneity and support data analytics and learning processes for IoT.
In this paper, to tackle the challenge of managing the data produced in IoT network instances,a different approach is taken in the form of a DDS to collect and process data coming from differentIoT middleware. Thus, the central objective of our proposal is to provide IoT data managementservices specified and developed to work with different IoT middleware, i.e., not being coupled toa specific middleware. This service provider is then required to integrate different IoT middlewaresimultaneously to collect and manage IoT data. An expected result is that for new middlewaredevelopment, rather than creating for each one a new component for data management, they canuse the proposed data service, which would be ever improved for managing large volumes of data.Additionally, the proposed service may support Big Data produced by IoT instances and, as a resultof processing this massive amount of generated data, can generate knowledge that is crucial to drivebetter decisions that are common to various IoT instances.
The proposed DDS is also designed to support multiple data sources simultaneously, since it is notcoupled to a specific middleware. This allows DDS to serve different IoT middleware, simultaneously,to collect and manage IoT data, which is interesting since improvements in managing large volumes of
Sensors 2017, 17, 977 3 of 25
data within the proposed data service benefits all of the client middleware instead of each middlewarehaving to create a new component. Furthermore, the proposed service may provide support toacquiring knowledge from Big Data produced by IoT instances, a feature that seems to be crucialin making common decisions regarding various IoT instances [12]. Regarding Big Data support,the proposed DDS is designed to collect huge data volumes from distributed sources and then tostore large datasets in different physical nodes, for the sake of scalability. Furthermore, by meansof its data aggregation component, DDS can deal with historical data. To cope with the variety ofdata formats used by IoT platforms, including data objects, which are not relational, in the proposedDDS communications interface, incoming data is converted to a generic structure (JSON message).Moreover, since many IoT objects generate data at high rate data streams, specific data flow processingcan be instantiated within DDS to cope with this velocity aspect of IoT Big Data.
Thus, the proposed data service is developed to distribute processing and to adapt at differentlevels to computing parallelism, according to the needs of IoT instances. The DDS comprises twomain components: data collection and data aggregation, both of them able to collect and process datain distributed and parallel processing. While the collection component should have the ability toefficiently capture data produced from a large network of devices, the data aggregation component isrequired to efficiently summarize huge volumes of data in real-time. These requirements imply thatthe data service must tackle several challenges, such as storing data, avoiding processing bottlenecks,dealing with device/sensor heterogeneity and presenting high throughput, as described in this paper.To deal with a huge volume of data, the DDS architecture is characterized as a distributed architectureto process and store data. Data heterogeneity in this architecture is handled both by a communicationsinterface that converts different data formats and a metadata creation module, able to manage differentmetadata characteristics.
To validate the proposed architecture and its supporting protocols, a corresponding prototypewas developed and implemented. Then, this prototype was submitted to testing and simulations bymeans of which we verified its functional characteristics and its performance. The proposed serviceevaluation is firstly carried out within the simulation of a smart home system that is used as a scenariofor analyzing data collection and aggregation functionalities in the interactions of DDS with theexisting UIoT middleware [13]. Then, the same scenario serves to compare the performance of DDSdata collection compared with a similar data collector within the Kaa middleware [11].
The remainder of this paper is organized as follows: Section 2 discusses requirements regardingBig Data management within IoT; Section 3 is a brief survey of related works; in Section 4,the distributed data service is proposed for supporting the management of data in IoT, the componentssupporting this proposed service are outlined together with their functional specification; Section 5presents the implementation of this DDS with the choice of software modules and the processingtopology; Section 6 presents a case study (smart home system) to validate our approach; Section 7presents the observed results, which are discussed in Section 8; and finally, Section 9 presents theconclusions and possible future works.
2. Big Data Management for IoT Middleware
The ever-increasing number of IoT instances generates a continuous flow of large amounts ofdata chunks that are usually time-stamped and possibly geo-stamped. These data can come in theform of simple key-value pairs, or they may contain rich audio/image/video content. The structuralcomplexity of data chunks and the data flow characteristics can considerably vary according to datacontent. This massive and heterogeneous dataset, generated by IoT environments, presents a numberchallenges regarding storage and processing. In this context, the data volume generated and consumedby IoT applications can be characterized as Big Data and the IoT instances as a Big Data sources [14,15].
As IoT devices/sensors capture real-time events, also possibly involving mobility,these devices/sensors produce a high volume of highly varied data at high speeds. Subsequently,this collected data needs to be analyzed in order to extract knowledge. Even when this processing can

Sensors 2017, 17, 977 4 of 25
be performed in a traditional computing environment (centralized servers), this operation mode isprone to capacity limitations regarding processing power and storage volume [16,17]. In counterpoint,there are emerging distributed environments with more adequate features, including scalability meansand parallel processing, to overcome the cited limitations of centralized architectures.
Most definitions of Big Data have been focusing on the so-called 3V characteristics [18]: volume,variety and velocity. However, the concept of Big Data has evolved to comprise the so-called 7Vcharacteristics [19], thus including veracity or validity, value, volatility and visualization. Veracity orvalidity requires that data are verifiable and truthful. Value is related to the importance, worth orusefulness of information derived from exploiting Big Data. Volatility refers to data meaning,which is constantly changing, and visualization relates to all means that make a vast amount ofdata comprehensible in a manner that is easy to understand and read. Moreover, there are severalother V’s that may be considered: viability, volatility, vitality, and others. IoT data characteristicsare compatible with these multiple V definitions as argued by some authors [20–23], and the IoTmiddleware is required to bring answers to the corresponding challenges, by way of its modularstructure and functions, as described in the following subsections.
2.1. IoT Middleware
The IoT middleware is a system piece that effectively manages the various heterogeneouscomponents (sensors, aggregators, actuators and others) that comprise an IoT environment [4,5].Figure 1 shows a general view of the different layers that compose an IoT middleware. In general,the upper layer is a component that has direct interaction with the application layer within the IoTarchitecture. The application layer receives request messages and sends responses related to servicesprovided by the middleware. The lower layer interacts with the physical layer and exchanges binaryinformation and control commands/responses with the physical devices.
Sensors 2017, 17, 977 4 of 25
performed in a traditional computing environment (centralized servers), this operation mode is proneto capacity limitations regarding processing power and storage volume [16,17]. In counterpoint, thereare emerging distributed environments with more adequate features, including scalability means andparallel processing, to overcome the cited limitations of centralized architectures.
Most definitions of Big Data have been focusing on the so-called 3V characteristics [18]: volume,variety and velocity. However, the concept of Big Data has evolved to comprise the so-called 7Vcharacteristics [19], thus including veracity or validity, value, volatility and visualization. Veracityor validity requires that data are verifiable and truthful. Value is related to the importance, worthor usefulness of information derived from exploiting Big Data. Volatility refers to data meaning,which is constantly changing, and visualization relates to all means that make a vast amount of datacomprehensible in a manner that is easy to understand and read. Moreover, there are several other V’sthat may be considered: viability, volatility, vitality, and others. IoT data characteristics are compatiblewith these multiple V definitions as argued by some authors [20–23], and the IoT middleware isrequired to bring answers to the corresponding challenges, by way of its modular structure andfunctions, as described in the following subsections.
2.1. IoT Middleware
The IoT middleware is a system piece that effectively manages the various heterogeneouscomponents (sensors, aggregators, actuators and others) that comprise an IoT environment [4,5].Figure 1 shows a general view of the different layers that compose an IoT middleware. In general,the upper layer is a component that has direct interaction with the application layer within the IoTarchitecture. The application layer receives request messages and sends responses related to servicesprovided by the middleware. The lower layer interacts with the physical layer and exchanges binaryinformation and control commands/responses with the physical devices.
Figure 1. IoT architecture.
In order to meet requirements related to IoT, an IoT middleware provides for applicationsthe necessary abstractions of things and offers multiple services based on these abstractions.These abstractions and related services are used for addressing interoperability and adaptation acrossheterogeneous devices, context awareness, scalability, device discovery, management of large volumesof data and the security aspects of the IoT environment [24]. Among the middleware features, one ofparamount importance is the ability to hide details of different technologies, thus helping programmersto focus on the development of the control logic for IoT applications. Specifically, the IoT middlewarehelps to bring together a multitude of devices and data in a way that enables developers to create
Figure 1. IoT architecture.
In order to meet requirements related to IoT, an IoT middleware provides for applicationsthe necessary abstractions of things and offers multiple services based on these abstractions.These abstractions and related services are used for addressing interoperability and adaptation acrossheterogeneous devices, context awareness, scalability, device discovery, management of large volumesof data and the security aspects of the IoT environment [24]. Among the middleware features, one ofparamount importance is the ability to hide details of different technologies, thus helping programmersto focus on the development of the control logic for IoT applications. Specifically, the IoT middlewarehelps to bring together a multitude of devices and data in a way that enables developers to createand deploy new IoT services without having to write different codes for each kind of device or data

Sensors 2017, 17, 977 5 of 25
format [25]. For this reason, IoT middleware packages are gaining importance in recent years dueto their major role in simplifying the development of new services and the integration of legacytechnologies into new ones [26], exempting the programmer from the need to have proficiency in therich set of technologies adopted by the lower layers.
According to [27], a common IoT middleware functional component is a module devoted tomanaging the data volume, which is expected to be very large indeed. Therefore, it is really importantto create novel methods to find, fetch and transfer data in this context, solving challenges that involvequerying, indexing, process and transaction handling models, considering that they must deal withidentification, positional, environmental, historical and descriptive data, as presented in [28]. In general,the necessary component uses database management systems (DBMS) to manage data, as well asspecific software technologies to process the huge volume of data.
2.2. Database Requirements for IoT Environments
The Internet of Things presents a new set of challenges for database management systems, such asabsorbing large volumes of data in real time or near real time, processing events as they flow ratherthan on a schedule of fixed intervals and dealing with significantly larger volumes of data thanthose often encountered in enterprise applications [17]. In order to properly handle IoT data and itsrequirements, a critical choice concerns the necessary database or set of databases.
There are many factors to keep in mind when choosing a database for IoT data management,and these factors do not always align with the characteristics of more traditional database systems [17].In this context, among the many requirements to consider, some of the most important are scalability,ability to absorb data at high rates, schema flexibility, integration with analytics tools and costs.
Ideally, IoT databases would be linearly scalable, so, for example, adding one more serverto a 10-node cluster would increase throughput by 10%, but coordination and communicationoperations usually preclude this linear extension. However, considering that IoT is a distributedsystem, IoT databases will usually be distributed ones unless the application collects only a smallamount of data that will not grow substantially. Distributed databases can run on commodity hardwareand scale by adding new servers instead of swapping out a server for a larger one.
An IoT database should also be fault tolerant and highly available. If a node in the databasecluster is down, the database service should still be able to accept read and write requests. Distributeddatabases make copies, or replicas, of data and write them to multiple servers. In the case of the failureof one of the servers that stores a particular dataset, then one of the other servers storing a replica ofthis dataset can respond to a read query. Regarding write requests, if the server that would normallyaccept a request is down, another node in the server cluster can accept the request and forward it tothe target server when it is back to an operational status.
Moreover, since IoT databases must be as flexible as required by IoT applications, it is noticeablethat NoSQL databases, either key-value, columnar and document databases, easily accommodatedifferent data types and structures without the need for predefined, fixed schemas. NoSQL databasesare a valuable option when it is necessary to accommodate multiple data types and those data typeswill likely change over time.
In relational database systems, which are mainly storage-centric, the data volume generally iscollected from predefined and finite sources and stored according to strict normalization rules forrelationships. In this kind of database, the transaction management mechanisms apply the so-calledACID—Atomicity, Consistency, Isolation, Durability - properties in order to enforce overall dataintegrity [29,30]. NoSQL databases try to solve some of the traditional database limitations by relaxingsome of the ACID properties, given that relaxing certain constraints may be a good measure forseveral applications. For example, NoSQL databases can perform quite well in circumstances whereconsistency constraints are not necessary [31]. By doing so, these NoSQL databases can become tolerantto network partitions, thus enabling adding servers to the setup when the number of devices/sensorsincreases, instead of adding more capacity to a single server [32].

Sensors 2017, 17, 977 6 of 25
In the context of IoT, columnar database features seem to be suitable for managing IoT datacompared to other types of NoSQL databases. First, since key-value databases are totally schema-less,the storing of metadata definitions regarding IoT data can be difficult. Oppositely, columnar databaseshave column families to support metadata creation. Second, IoT data are not characterized to presentmany relationships (in the traditional sense); consequently, a graph database can be less suitablefor IoT data, while a columnar database can, if needed, efficiently support a reasonable number ofrelationships. Finally, document and columnar databases can accommodate different data types andstructures without the need for predefined, fixed schemas.
2.3. Data Processing Flow Requirements for IoT
In order to deal with the complex environment of IoT and its associated Big Data, it is essential todefine appropriate techniques to support the structural complexity and performance requirements forprocessing data flows within this environment. This involves issues in the articulation of techniques,such as messaging systems and real-time computing. In the IoT context, messaging systems canbe used to collect data coming from numerous devices/sensors and being processed by differentsubscribed clients, while real-time systems are very important to process real-time data coming fromIoT instances.
Messaging in this context is defined as the exchange of messages among computing programsconveying specially-formatted data describing events, requests and replies. This is performedby means of a messaging server that provides a communications interface for client programs.This server also provides administrative and control functionalities, including data persistenceand reliability [33]. There are two major messaging system models: the point-to-point and thepublish-subscribe models [33]. In the point-to-point model, source programs send messages to queues,and the receivers, which are registered with some specific queues, can asynchronously retrieve themessages and then acknowledge them. The publish-subscribe model is based on the use of topicsthat can be subscribed to by several clients. Messages that are sent to topics are then received inan asynchronous way by all of the subscriber clients.
Real-time systems are defined as those systems in which the correctness of the system depends notonly on the logical result of computation, but also on the time at which the results are produced [34].There are three major components, as well as their interplay, which characterizes real-time systems:time, reliability and environment [35]. These components are crucial to avoid serious harm,both economical or in terms of loss of lives.
3. Related Works
Much effort has been made in the area of IoT data storage and processing, indicating that onecentral objective in this domain is to efficiently gather data generated by heterogeneous devices,then processing and storing both original and resulting data in a persistent data store. As mentionedbefore, to achieve this, IoT middleware systems usually implement a data collector.
In [36], a data collector, specifically projected for an IoT environment, is available through a RESTAPI. Data are received in a message array format, and the collector splits these into single messagepackets and authenticates the sensor. After having been identified, the packets are put into a messagequeue in order to be processed. Before storing data in the database, a preprocessing task is carriedout. Specific handling protocols exist to run on data coming from a given class of sensors, such as forverifying the relevance of data.
Web ecosystem of physical devices, EcoDiF [37] is a IoT middleware that has a publish-subscribecomponent that manages the registration of devices and performs the receiving of information comingfrom devices and sensors. Based on Java API specifications for RESTful web services (JAX-RS), it usesa RESTEasy implementation for service creation for receiving information. Data from the sensors areconverted to the XML format and sent via HTTP PUT messages to be stored in a MySQL database.

Sensors 2017, 17, 977 7 of 25
The Xively platform [38] has a so-called ‘time series’ component that provides services for thecollection, management and querying of data from devices. This component stores the data in a cloudarchitecture based on MySQL and Cassandra databases. While similar to EcoDif, Xively is based onREST principles and web standards. In Xively, data are organized into feeds, data points and datastreams. A feed is the data of a monitored environment (i.e., a living room). Data streams representdata sent by a particular sensor within a feed (i.e., the temperature of the monitored environment),and a data point represents a single value of a data stream at a given time.
In [39], an Intelligent Transportation System (ITS), based on IoT technology, unfolds in three stages:data collection, data transmission and information processing. In the collection stage, Radio FrequencyIdentification Technology (RFID) is used to identify and recognize objects.
The OpenIoT middleware [8] supports a discovery and collection service for sensor data comingfrom mobile sensors. These services are achieved through a publish-subscribe middleware calledCloud-based Publish-Subscribe for IoT (CUPUS). This middleware uses a cloud database allowingparallel subscriptions. The data collection is done through serial ports, by means of UDP andHTTP requests.
The RestThing middleware [9] comprises a data collector devoted to embedded devices anda database that is responsible for storing the data and the characteristics differentiating the datasources. The storage is based in XML and JSON files.
The WSO2 (Web Services oxygenated) middleware [10] has a monitoring module named “businessactivity”. This module can collect data streams and process them in batch, real-time, interactive andpredictive modes. Moreover, it is able to receive data from almost any event source through javaagents, JavaScript clients, regarding IoT events. Furthermore, it publishes events through an API forreal-time, batch or combined processing. Similar to other middleware, such as Xively, WSO2 usesa distributed storage database, such as Cassandra.
The Kaa project middleware [11] implements data collection through a specialized application tosynchronously collect data for a specified IoT application. This application is developed accordingto the required endpoint. For this reason, the Kaa platform provides a set of options to specify theIoT data structure coming from endpoints. The collected data can be stored into a MongoDB orCassandra database.
As a common data collection characteristic, the mentioned IoT middleware implement their owndata collector component, although each one uses different storage systems ranging from the traditionalcentralized relational database to distributed NoSQL systems. It is important to highlight that thesedata collectors are tightly coupled to the respective IoT middleware architectures. Though thesedifferent IoT middleware systems have common features, especially in terms of integration andinteroperability between heterogeneous physical devices, their feature implementations are designedfor the specific middleware in which they operate.
The approach presented in this paper differs from the described approaches in that our DDS isdesigned to work with different IoT middleware, non-intrusively. Moreover, the proposed DDS isdesigned with parallel and distributed processing ability to support the large volume of data from IoTenvironments. Thus, the proposed DDS required functionalities and performance are studied to allowthis DDS to perform both as an IoT data storage and a data manager for IoT data. This is supported bydata collection and aggregation components that are intended to store and manage IoT data either inreal-time and batch processing.
In our approach to the challenge of managing data produced from different IoT middleware, inorder to cope with these heterogeneous middleware, the proposed DDS defines different componentsfor data collection and aggregation. Inside each of these components, there is a specialized module todeal with metadata complexity and with the concurrent requirements of batch and real-time processing.In this sense, the proposed DDS architecture is similar to the Lambda architecture [40] for IoT datamanagement, which comprises three layers, namely the batch, speed and serving layer. In DDS,the same functionality of Lambda’s batch and speed layers is integrated into a single streaming engine

Sensors 2017, 17, 977 8 of 25
designed for handling both batch and real-time processing, and ingesting the related volumes ofdata, a feature that is possible due the temporal nature of IoT data. This integration overcomes thecomplexity of programing in two different distributed platforms, such as the speed and batch layer,to produce compatible batch and real-time outcomes.
4. Distributed Data Service for IoT Middleware
Since data generated by the sensors and devices of an IoT network must typically be deliveredto storage and processing system servers, then we define a data management model for systems inwhich data come from a large number of devices and are funneled into the DDS for further processing.Thus, the DDS has the capacity to support, simultaneously, multiple connections with different IoTmiddleware; a feature of its communication interface.
The DDS also comprises two main components (Figure 2): data collection and data aggregation.The data collection component receives data coming from different IoT middleware. In addition,the data collection stores captured data in the database to be used as input for the aggregationcomponent. Stored historical data can be reprocessed in the future. While data are being collected,the data aggregation component summarizes the collected data in different periods.
Sensors 2017, 17, 977 8 of 25
management, which comprises three layers, namely the batch, speed and serving layer. In DDS, thesame functionality of Lambda’s batch and speed layers is integrated into a single streaming enginedesigned for handling both batch and real-time processing, and ingesting the related volumes ofdata, a feature that is possible due the temporal nature of IoT data. This integration overcomes thecomplexity of programing in two different distributed platforms, such as the speed and batch layer,to produce compatible batch and real-time outcomes.
4. Distributed Data Service for IoT Middleware
Since data generated by the sensors and devices of an IoT network must typically be deliveredto storage and processing system servers, then we define a data management model for systems inwhich data come from a large number of devices and are funneled into the DDS for further processing.Thus, the DDS has the capacity to support, simultaneously, multiple connections with different IoTmiddleware; a feature of its communication interface.
The DDS also comprises two main components (Figure 2): data collection and data aggregation.The data collection component receives data coming from different IoT middleware. In addition, thedata collection stores captured data in the database to be used as input for the aggregation component.Stored historical data can be reprocessed in the future. While data are being collected, the dataaggregation component summarizes the collected data in different periods.
Figure 2. DDS components.
The data collection component comprises five modules:
• Communication interface: responsible for establishing communications between each middlewareand the DDS. This interface makes it possible to translate the messages used by a middleware tothe message structure managed by DDS.
• Data capture: carries out the collection of messages exchanged throughout the IoTmiddleware layers.
• Data filtering: verifies the domain of the messages collected by the data capture module analyzingif the readings from the devices/sensors are among the values specified for them. The messagesoutside of the domain are discarded.
• Metadata creation: obtains important metadata such as timestamp, geo-location, unit ofmeasurement and type of data. Other metadata can be included in the collection, accordingto the characteristics of IoT environments and applications.
• Time series compaction: this module groups the collected data, reorganizing it based on a timewindow. This module can be configured according to the volume and speed of data generation,in regards to the number of items collected by the data capture module.
Figure 2. DDS components.
The data collection component comprises five modules:
• Communication interface: responsible for establishing communications between each middlewareand the DDS. This interface makes it possible to translate the messages used by a middleware tothe message structure managed by DDS.
• Data capture: carries out the collection of messages exchanged throughout the IoTmiddleware layers.
• Data filtering: verifies the domain of the messages collected by the data capture module analyzingif the readings from the devices/sensors are among the values specified for them. The messagesoutside of the domain are discarded.
• Metadata creation: obtains important metadata such as timestamp, geo-location, unit ofmeasurement and type of data. Other metadata can be included in the collection, according to thecharacteristics of IoT environments and applications.
• Time series compaction: this module groups the collected data, reorganizing it based on a timewindow. This module can be configured according to the volume and speed of data generation,in regards to the number of items collected by the data capture module.
The data aggregation component is responsible for the process in which the collected data areexpressed in a summarized form. In general, the aggregated information is more significant than

Sensors 2017, 17, 977 9 of 25
an isolated reading of a device. For example, the average number of readings for a device/sensor fora time period can be more significant than an isolated reading at a specific moment in time. A commonguideline for data aggregation is to obtain more information about specific groups, with specificvariables, as, for example, the time period or the function performed by each device/sensor. The dataaggregation component comprises two modules:
• Data summarization: responsible for summarizing the data being collected. This component’smain objective is to reduce the data query volume. The aggregation of data reduces the numberof lines to be retrieved, thereby improving the performance of consultations.
• Context extraction: responsible for the extraction of context and environment variables, such as,for example, the location of the devices/sensors, among others.
4.1. Data Collection Component
The data collection component (Figure 3) is designed using a message system, a real-timecomputation system and a data storage system. The data capture module (consumers) of thiscomponent uses the message system, while the filter (filters) and metadata creation (metadata) modulesuse the real-time computation system. In addition, the series data compaction module was integratedwithin the data store system.
In Figure 3, processes related to consumers, filters and metadata are designed to handle largeprocessing volumes since they can adapt to different parallel computing levels depending onenvironmental needs. These processes are executed according to a specific data flow, beginning withinthe consumer, passing through the filter to reach the metadata creator. The modules for data capture,data filtering and metadata creation can be instantiated in multiple different processes, each one withits respective consumers, filters and metadata.
Sensors 2017, 17, 977 9 of 25
The data aggregation component is responsible for the process in which the collected data areexpressed in a summarized form. In general, the aggregated information is more significant than anisolated reading of a device. For example, the average number of readings for a device/sensor for atime period can be more significant than an isolated reading at a specific moment in time. A commonguideline for data aggregation is to obtain more information about specific groups, with specificvariables, as, for example, the time period or the function performed by each device/sensor. The dataaggregation component comprises two modules:
• Data summarization: responsible for summarizing the data being collected. This component’smain objective is to reduce the data query volume. The aggregation of data reduces the numberof lines to be retrieved, thereby improving the performance of consultations.
• Context extraction: responsible for the extraction of context and environment variables, such as,for example, the location of the devices/sensors, among others.
4.1. Data Collection Component
The data collection component (Figure 3) is designed using a message system, a real-timecomputation system and a data storage system. The data capture module (consumers) of thiscomponent uses the message system, while the filter (filters) and metadata creation (metadata) modulesuse the real-time computation system. In addition, the series data compaction module was integratedwithin the data store system.
In Figure 3, processes related to consumers, filters and metadata are designed to handle largeprocessing volumes since they can adapt to different parallel computing levels depending onenvironmental needs. These processes are executed according to a specific data flow, beginningwithin the consumer, passing through the filter to reach the metadata creator. The modules for datacapture, data filtering and metadata creation can be instantiated in multiple different processes, eachone with its respective consumers, filters and metadata.
Figure 3. Data collection component.
The communication interface is responsible for establishing communications between an IoTmiddleware and the DDS. Since this interface must translate the messages used by each middleware tothe message structure managed by DDS, it allows an IoT middleware to specify fields of messages
Figure 3. Data collection component.
The communication interface is responsible for establishing communications between an IoTmiddleware and the DDS. Since this interface must translate the messages used by each middleware tothe message structure managed by DDS, it allows an IoT middleware to specify fields of messagessent to the DDS, so this service is enabled to transform these fields and send them through a specificchannel for the desired purpose. Besides this, the data communication interface does not interfere withthe normal flow of the IoT middleware data.

Sensors 2017, 17, 977 10 of 25
Figure 4 illustrates the DDS interaction with an IoT middleware through the communicationsinterface module, for defining the communication port and JSON messages specifically for this IoTmiddleware. Then, each registered middleware must send a copy of every exchanged message, and theDDS listens to this port to capture the copies. Using JSON for this operation enables the receptionof messages from different middleware, as the message structure containing the device/sensor inquestion is known. To cope with the heterogeneity of IoT data, most IoT middleware systems use JSONmessages that differentiate several data sources. In DDS, the used JSON structure includes differentattributes, such as: middleware name, device identifier and service identification, which includes thestate variable and the new value of the reading. This JSON message also includes metadata, such asgeo-location and type of data, and for more detailed metadata, an additional attribute is included inthe form of a list of metadata describing specific data for particular IoT applications.
Sensors 2017, 17, 977 10 of 25
sent to the DDS, so this service is enabled to transform these fields and send them through a specificchannel for the desired purpose. Besides this, the data communication interface does not interfere withthe normal flow of the IoT middleware data.
Figure 4 illustrates the DDS interaction with an IoT middleware through the communicationsinterface module, for defining the communication port and JSON messages specifically for this IoTmiddleware. Then, each registered middleware must send a copy of every exchanged message, andthe DDS listens to this port to capture the copies. Using JSON for this operation enables the receptionof messages from different middleware, as the message structure containing the device/sensor inquestion is known. To cope with the heterogeneity of IoT data, most IoT middleware systems use JSONmessages that differentiate several data sources. In DDS, the used JSON structure includes differentattributes, such as: middleware name, device identifier and service identification, which includes thestate variable and the new value of the reading. This JSON message also includes metadata, such asgeo-location and type of data, and for more detailed metadata, an additional attribute is included inthe form of a list of metadata describing specific data for particular IoT applications.
Figure 4. Communication interface between the DDS and the IoT middleware.
Data capture is designed to carry out the collection of messages exchanged within an IoTmiddleware. After being captured, the data are stored in the DDS without any modification, in order tokeep a historical data log, whose retention time can be configured. This means that data coming fromIoT environments is stored without any processing and can be removed according to the retentiontime. This data capture module performs several simultaneous processes using publish/subscribecommunications and has the capacity to support different data sources (IoT middleware) publishinginformation in specific communication channels. Meanwhile, other processes can subscribe to theinformation that they want to receive from a communication channel. The basic interaction model usesan event service for signatures’ storage and management and efficient message delivery. This so-calledbroker represents a mediator between publishing and consumer processes. The broker sends messagesto each consumer process, so that the publish processes do not need to know about consumer processesand vice versa. This constitutes a loosely coupled interface structure between IoT middleware systemsand the DDS.
Data filtering verifies the domain of the messages collected by the data capture module, a featurethat is realized through distributed processes executed in parallel. Data filtering requires queryingthe information database to make decisions according to filtering rules. For example, the verificationanalyzes if the readings from the devices/sensors are in the range of values specified for them.The messages that do not match the rule are discarded. The data filtering carried out according toa specific type of packaging by which the IoT middleware includes a plurality of devices/sensors.The filtering methods include the input data and a deploy rule, which allows implementing the rule
Figure 4. Communication interface between the DDS and the IoT middleware.
Data capture is designed to carry out the collection of messages exchanged within an IoTmiddleware. After being captured, the data are stored in the DDS without any modification, in order tokeep a historical data log, whose retention time can be configured. This means that data coming fromIoT environments is stored without any processing and can be removed according to the retentiontime. This data capture module performs several simultaneous processes using publish/subscribecommunications and has the capacity to support different data sources (IoT middleware) publishinginformation in specific communication channels. Meanwhile, other processes can subscribe to theinformation that they want to receive from a communication channel. The basic interaction model usesan event service for signatures’ storage and management and efficient message delivery. This so-calledbroker represents a mediator between publishing and consumer processes. The broker sends messagesto each consumer process, so that the publish processes do not need to know about consumer processesand vice versa. This constitutes a loosely coupled interface structure between IoT middleware systemsand the DDS.
Data filtering verifies the domain of the messages collected by the data capture module, a featurethat is realized through distributed processes executed in parallel. Data filtering requires queryingthe information database to make decisions according to filtering rules. For example, the verificationanalyzes if the readings from the devices/sensors are in the range of values specified for them.The messages that do not match the rule are discarded. The data filtering carried out according toa specific type of packaging by which the IoT middleware includes a plurality of devices/sensors.The filtering methods include the input data and a deploy rule, which allows implementing the ruleby means of at least one process to be executed. These filtering processes can be executed in parallel,according to the demands of the IoT environment.
Metadata creation obtains relevant metadata from filtered messages, such as: the location inwhich the devices/sensors are operating, the time when a measurement was carried out and the
Sensors 2017, 17, 977 11 of 25
specification of included data, which are frequently used to describe device/sensor measurements.Similar to the data filtering module, this module can be distributed and executed in parallel. In ourproposal, we define two metadata groups: required and additional metadata. The required metadataare specified by time, geo-location, unit of measurement and type of data, which are consideredessential in order to describe data coming from IoT environments. The required metadata fields areorganized into a schema with predefined relationships to support efficient retrieval of data at laterstages of processing. Typically, the measurement of each device/sensor must add metadata describingthe data formats, a feature that is important for later query response and optimization, which impliesthat query processing has to adapt to a wide range of data formats that may not fully be knownbeforehand. Furthermore, metadata can be used to describe IoT data, IoT environments and IoTapplications. For example, some metadata can be used to describe a specific domain application, suchas an IoT application for agriculture. In order to receive additional metadata, an attribute named“additional metadata” is defined as a list of specific metadata to describe, for instance, a particularapplication domain.
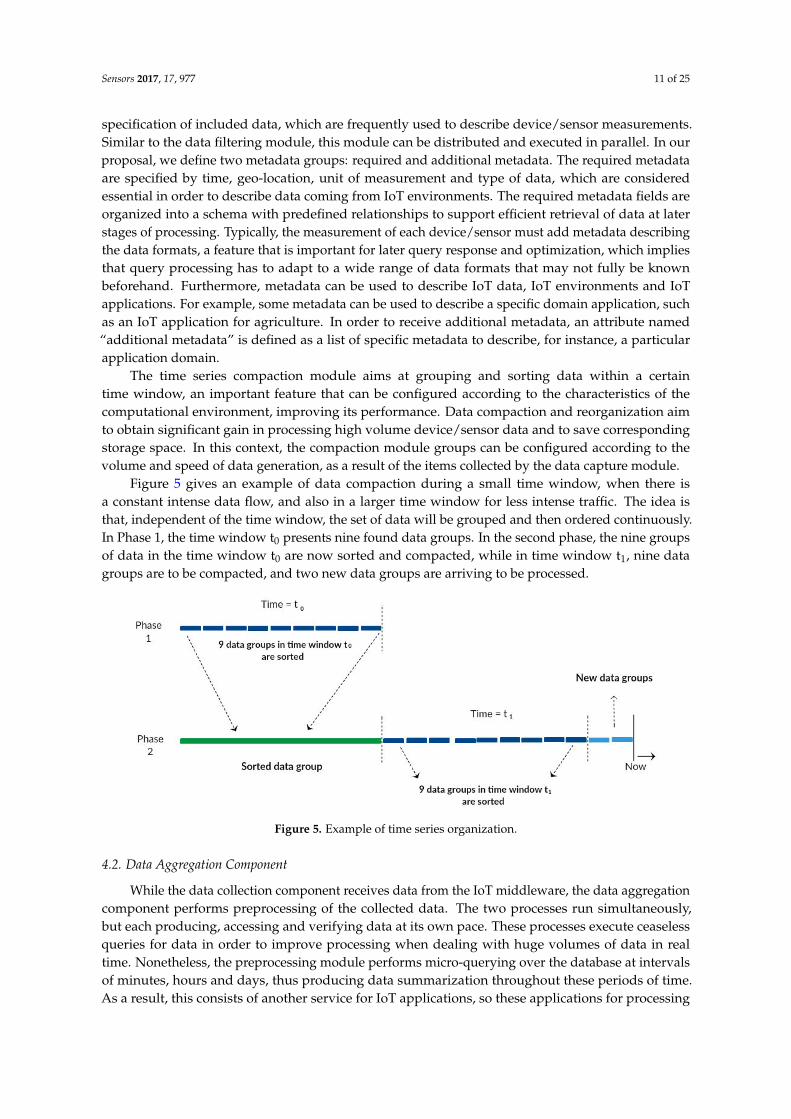
The time series compaction module aims at grouping and sorting data within a certaintime window, an important feature that can be configured according to the characteristics of thecomputational environment, improving its performance. Data compaction and reorganization aimto obtain significant gain in processing high volume device/sensor data and to save correspondingstorage space. In this context, the compaction module groups can be configured according to thevolume and speed of data generation, as a result of the items collected by the data capture module.
Figure 5 gives an example of data compaction during a small time window, when there isa constant intense data flow, and also in a larger time window for less intense traffic. The idea isthat, independent of the time window, the set of data will be grouped and then ordered continuously.In Phase 1, the time window t0 presents nine found data groups. In the second phase, the nine groupsof data in the time window t0 are now sorted and compacted, while in time window t1, nine datagroups are to be compacted, and two new data groups are arriving to be processed.
Sensors 2017, 17, 977 11 of 25
by means of at least one process to be executed. These filtering processes can be executed in parallel,according to the demands of the IoT environment.
Metadata creation obtains relevant metadata from filtered messages, such as: the location inwhich the devices/sensors are operating, the time when a measurement was carried out and thespecification of included data, which are frequently used to describe device/sensor measurements.Similar to the data filtering module, this module can be distributed and executed in parallel. In ourproposal, we define two metadata groups: required and additional metadata. The required metadataare specified by time, geo-location, unit of measurement and type of data, which are consideredessential in order to describe data coming from IoT environments. The required metadata fields areorganized into a schema with predefined relationships to support efficient retrieval of data at laterstages of processing. Typically, the measurement of each device/sensor must add metadata describingthe data formats, a feature that is important for later query response and optimization, which impliesthat query processing has to adapt to a wide range of data formats that may not fully be knownbeforehand. Furthermore, metadata can be used to describe IoT data, IoT environments and IoTapplications. For example, some metadata can be used to describe a specific domain application, suchas an IoT application for agriculture. In order to receive additional metadata, an attribute named“additional metadata” is defined as a list of specific metadata to describe, for instance, a particularapplication domain.
The time series compaction module aims at grouping and sorting data within a certaintime window, an important feature that can be configured according to the characteristics of thecomputational environment, improving its performance. Data compaction and reorganization aimto obtain significant gain in processing high volume device/sensor data and to save correspondingstorage space. In this context, the compaction module groups can be configured according to thevolume and speed of data generation, as a result of the items collected by the data capture module.
Figure 5 gives an example of data compaction during a small time window, when there is aconstant intense data flow, and also in a larger time window for less intense traffic. The idea is that,independent of the time window, the set of data will be grouped and then ordered continuously.In Phase 1, the time window t0 presents nine found data groups. In the second phase, the nine groupsof data in the time window t0 are now sorted and compacted, while in time window t1, nine datagroups are to be compacted, and two new data groups are arriving to be processed.
Figure 5. Example of time series organization.
4.2. Data Aggregation Component
While the data collection component receives data from the IoT middleware, the data aggregationcomponent performs preprocessing of the collected data. The two processes run simultaneously,but each producing, accessing and verifying data at its own pace. These processes execute ceaseless
Figure 5. Example of time series organization.
4.2. Data Aggregation Component
While the data collection component receives data from the IoT middleware, the data aggregationcomponent performs preprocessing of the collected data. The two processes run simultaneously,but each producing, accessing and verifying data at its own pace. These processes execute ceaselessqueries for data in order to improve processing when dealing with huge volumes of data in realtime. Nonetheless, the preprocessing module performs micro-querying over the database at intervalsof minutes, hours and days, thus producing data summarization throughout these periods of time.As a result, this consists of another service for IoT applications, so these applications for processing

Sensors 2017, 17, 977 12 of 25
a huge data volume in real-time are not required for querying over raw data, but rather over the datasummarized by the aggregation component (Figure 6).
Data aggregation is one of the solutions to the problem of providing efficient solution processes torespond to real-time requests, considering resource limitations. The messages collected with the datacollection component have metadata fields, including location, time and information about the datasource. While the collection component is constantly receiving raw device/sensor data, these dataare also being aggregated and summarized for individual sensor recordings. In the aggregationprocess, the data streaming from devices/sensors is separated for the modules’ data summarizationand context extraction.
The data summarization module represents the grouping of a set of raw device/sensor dataover a period of time. This reduces memory and computational cost related to massive amountsof real-time data produced by devices/sensors. For this reason, the semantic representation of thesummarized data is as important as the annotation of the raw stream data, so this module reducesand creates this new form of representation. Since the data collection component stores data beingcollected into an event table, which is monitored by the data aggregation component, later the modulecan produce results that are stored into an aggregated table. Figure 6 shows the summarized tablesby_minute, by_hour and by_day. The by_minute table has six attributes: id_device, date, by_min(minute), total (total value in a minute), count (number of readings in a minute) and context (the lastreading place). The by_hour table is similar to the by_minute table. Finally, the by_day table has fourattributes: id_device, date, total (total value in a day) and count (number of readings in a day).
Sensors 2017, 17, 977 12 of 25
queries for data in order to improve processing when dealing with huge volumes of data in realtime. Nonetheless, the preprocessing module performs micro-querying over the database at intervalsof minutes, hours and days, thus producing data summarization throughout these periods of time.As a result, this consists of another service for IoT applications, so these applications for processing ahuge data volume in real-time are not required for querying over raw data, but rather over the datasummarized by the aggregation component (Figure 6).
Data aggregation is one of the solutions to the problem of providing efficient solution processesto respond to real-time requests, considering resource limitations. The messages collected with thedata collection component have metadata fields, including location, time and information about thedata source. While the collection component is constantly receiving raw device/sensor data, thesedata are also being aggregated and summarized for individual sensor recordings. In the aggregationprocess, the data streaming from devices/sensors is separated for the modules’ data summarizationand context extraction.
The data summarization module represents the grouping of a set of raw device/sensor data overa period of time. This reduces memory and computational cost related to massive amounts of real-timedata produced by devices/sensors. For this reason, the semantic representation of the summarizeddata is as important as the annotation of the raw stream data, so this module reduces and creates thisnew form of representation. Since the data collection component stores data being collected into anevent table, which is monitored by the data aggregation component, later the module can produceresults that are stored into an aggregated table. Figure 6 shows the summarized tables by_minute,by_hour and by_day. The by_minute table has six attributes: id_device, date, by_min (minute), total(total value in a minute), count (number of readings in a minute) and context (the last reading place).The by_hour table is similar to the by_minute table. Finally, the by_day table has four attributes:id_device, date, total (total value in a day) and count (number of readings in a day).
Figure 6. Data aggregation component.
The context extraction module captures contextual metadata. Context is important because itallows using the environmental information in order to facilitate decision making when necessary.Context is considered as a dynamic process, constructed through the interaction of devices/sensorsaround the world, and over time. Several applications can use contextual information, such as location,time and data source, to make recommendations. In this scenario, the context extraction moduleexecutes three parallel processes, similar to the summarization module, to get for instance the locationof devices in the last minute, the last hour and the last day.
5. Implementation of the DDS
In this section, the implementation of the proposed DDS for IoT middleware is presented withthe discussion of component choices. The architecture implementation acts as a bridge betweenthe proposed architecture and a set of implementation technologies, providing key elements inconformance to the prescriptions and constraints of the architecture. In this context, the DDSimplementation must define which technology is used to support the architecture features such
Sensors 2017, 17, 977 13 of 25
as parallel and distributed processing. The implemented prototype is an important tool for validatingthe specification of requirements, the design of the DDS and the expected performance.
5.1. Used Technologies
To implement the different components and modules of the DDS architecture, we had to integratesome technologies. For the data collection component, the Apache Kafka platform was used, since thisplatform satisfies the requirements of the data collection component regarding the implementation ofthe capture module. The filtering and metadata modules are implemented with the Apache Stormframework, which is projected to process data in real time. To store data produced by the data collectioncomponent, the Apache Cassandra database is also a choice that also allows the time series compactionmodule to be implemented by this database. Apache Cassandra supports the implementation ofdifferent modules of the data aggregation component. Since our proposal requires the definition ofa distributed architecture capable of processing different tasks in parallel, the chosen technologies tobe used by the DDS prototype must support distributed and parallel processing.
Apache Kafka is an open source, distributed, publish-subscribed, messaging system, often usedas a kernel for architectures that deal with data streams [41]. Designed with features such as persistentmessaging, high performance, easy distribution, the ability to support multiple customers and performreal-time processing, Kafka has three main elements [42]: topics, producers and consumers. A topicis simply an abstract place where messages are published, while Kafka producers are processes thatpublish or create messages for a Kafka topic. Consumers access a topic and process the messagesposted therein.
Apache Storm is an open source, distributed, real-time computation system [43]. A Storm clusteris composed by a Nimbus server, one Supervisor and Zookeeper. The Nimbus is responsible fordistributing processes across the cluster and monitoring it. The Storm cluster may have one or moresupervisor nodes, where processes are executed. The Supervisor nodes communicate with the Nimbusthrough the Zookeeper [44]. The Nimbus sends signals to the supervisor to start or stop processes.The Zookeeper is a distributed high performance coordination service to maintain informationregarding configuration, delegation, to providing distributed synchronization and service groups.
Apache Cassandra is a NoSQL database system that intends to achieve the following requirements:high availability, high performance, reliability and a scalable architecture to support large andever-increasing amounts of data [45,46]. Although Cassandra follows a column-oriented model,thus representing a columnar database, it internally works based on the key-value concept.Cassandra is the choice for data storage in our proposal because it includes a strategy for handlingtime series called ‘DateTieredCompactionStrategy’, which can improve the performance of the timeseries computations.
Finally, the Streamparse platform was also considered in our prototype implementation becauseit lets users run Python code modules to deal with real-time streams of data via the Apache Storm [47].This tool takes advantage of parallel and distributed processing provided by the Apache Storm,and their combination is an important alternative for real-time processing systems since Streamparseoffers the map/reduce processing style in real time for data streams. Moreover, it can be a way to scalePython processes with high parallelism. In our proposal prototype, this tool allows the integrationof Kafka, Storm and Python libraries; tools that comprise the core of the current data processinginfrastructure, able to process a huge amount of time series data.
5.2. Implementation of Data Collection and Data Aggregation Components
Figure 7 presents the implementation architecture with each data collection and aggregationcomponents. The first one is the data capture module, in which every captured message is stored intoa topic, a kind of database. These messages are stored without any transformation and can be usedas historical data to be reprocessed for futures analyses. More than one job instance for reprocessing

Sensors 2017, 17, 977 14 of 25
can be executed, but each one starting from a different position in the historical dataset. Additionally,this feature increases the parallelism level and allows replaying data history very quickly.
The data capture module comprises an arbitrary number of consumer processes implementedwith the Kafka message system, called Kafkaspout [42]. Each module is distributed and executed inparallel using the different nodes of the cluster, which allows the processes that make up each moduleto be executed simultaneously.
Sensors 2017, 17, 977 14 of 25
5.2. Implementation of Data Collection and Data Aggregation Components
Figure 7 presents the implementation architecture with each data collection and aggregationcomponents. The first one is the data capture module, in which every captured message is stored intoa topic, a kind of database. These messages are stored without any transformation and can be usedas historical data to be reprocessed for futures analyses. More than one job instance for reprocessingcan be executed, but each one starting from a different position in the historical dataset. Additionally,this feature increases the parallelism level and allows replaying data history very quickly.
The data capture module comprises an arbitrary number of consumer processes implementedwith the Kafka message system, called Kafkaspout [42]. Each module is distributed and executed inparallel using the different nodes of the cluster, which allows the processes that make up each moduleto be executed simultaneously.
Figure 7. DDS topology.
The data filtering module has two well-defined stages in its topology: JsonParser and filters.These processes are implemented using the Apache Storm real-time processing system together withKafka. The JsonParser bolts [43] are processes that receive messages from the consumer KafkaSpoutand divide these JSON messages into smaller units. The filter bolts implement the filtering of themessages, guaranteeing the integrity of the domain, by verifying for instance whether the valuesof sensor readings are within the allowable range. After the message filtering, they are stored in aCassandra database [48].
The metadata creation module was implemented with the Apache Storm/Kafka architecture [49],where the metadata bolts allow the creation of metadata from messages already filtered. The metadataprocess is the third stage in the Storm/Kafka topology. It is noticeable that the three stages ofthe topology (JsonParser processes, filters and metadata) can be executed in parallel. To deal withthe variety of collected data from IoT environments, two tables are defined to store the unit ofmeasurements. The first table has the source unit, the International System of Units (SI) equivalentand the conversion formula to transform from the original to the SI unit. The second table comprisesthe SI unit, the source unit and the conversion formula to transform from the SI to the original unit.In this context, the metadata process uses the first table to convert the source measurement value tothe SI unit and the second table for the inverse conversion. For example, it is possible to convert fromCelsius degrees to Kelvin degrees, using the conversion formulas for each case.
Finally, to record the data in the Cassandra database, a key was developed that is composed ofthe timestamp of the sensor/device reading and the sensor/device identifier. This key guarantees thesingularity of the data, once the sensor/device readings, together with the sensor/device identifier,
Figure 7. DDS topology.
The data filtering module has two well-defined stages in its topology: JsonParser and filters.These processes are implemented using the Apache Storm real-time processing system together withKafka. The JsonParser bolts [43] are processes that receive messages from the consumer KafkaSpoutand divide these JSON messages into smaller units. The filter bolts implement the filtering of themessages, guaranteeing the integrity of the domain, by verifying for instance whether the valuesof sensor readings are within the allowable range. After the message filtering, they are stored ina Cassandra database [48].
The metadata creation module was implemented with the Apache Storm/Kafka architecture [49],where the metadata bolts allow the creation of metadata from messages already filtered. The metadataprocess is the third stage in the Storm/Kafka topology. It is noticeable that the three stages ofthe topology (JsonParser processes, filters and metadata) can be executed in parallel. To deal withthe variety of collected data from IoT environments, two tables are defined to store the unit ofmeasurements. The first table has the source unit, the International System of Units (SI) equivalentand the conversion formula to transform from the original to the SI unit. The second table comprisesthe SI unit, the source unit and the conversion formula to transform from the SI to the original unit.In this context, the metadata process uses the first table to convert the source measurement value tothe SI unit and the second table for the inverse conversion. For example, it is possible to convert fromCelsius degrees to Kelvin degrees, using the conversion formulas for each case.
Finally, to record the data in the Cassandra database, a key was developed that is composed ofthe timestamp of the sensor/device reading and the sensor/device identifier. This key guarantees thesingularity of the data, once the sensor/device readings, together with the sensor/device identifier,are distinct. In addition, to increase the rate of the insertion of the data in the proposed service,a micro-batching insertion approach [50] is used, which accumulates the reception of messages overa short interval of time (2 s, for example). Later, these messages can be inserted together in the database,which improves the corresponding insertion rate. The data are recorded in the event table with thefollowing attributes: timestamp, id_device, status, id_variable, value and localization.
Sensors 2017, 17, 977 15 of 25
5.2.1. Configuration of the Cassandra Database
The Cassandra database was configured to support time series data coming from the IoTmiddleware. First, the data are stored in a regular column family, but with a specialized strategy forcompaction called “DateTieredCompactionStrategy”, which is used by the time series compactionmodule. This compaction strategy is used in every column family that stores time series data in thedata collection and data aggregation components.
For each IoT middleware integrated with the proposed DDS, a key space is created in Cassandra.This is important since it is a measure that provides better organization, both by allowing the separationof data into different key spaces, although some data obey the same schema, and by setting a replicationfactor to ensure reliability and fault tolerance. In our validation, we adopt the value of three forthis factor.
5.2.2. Kafka Consumer Configuration
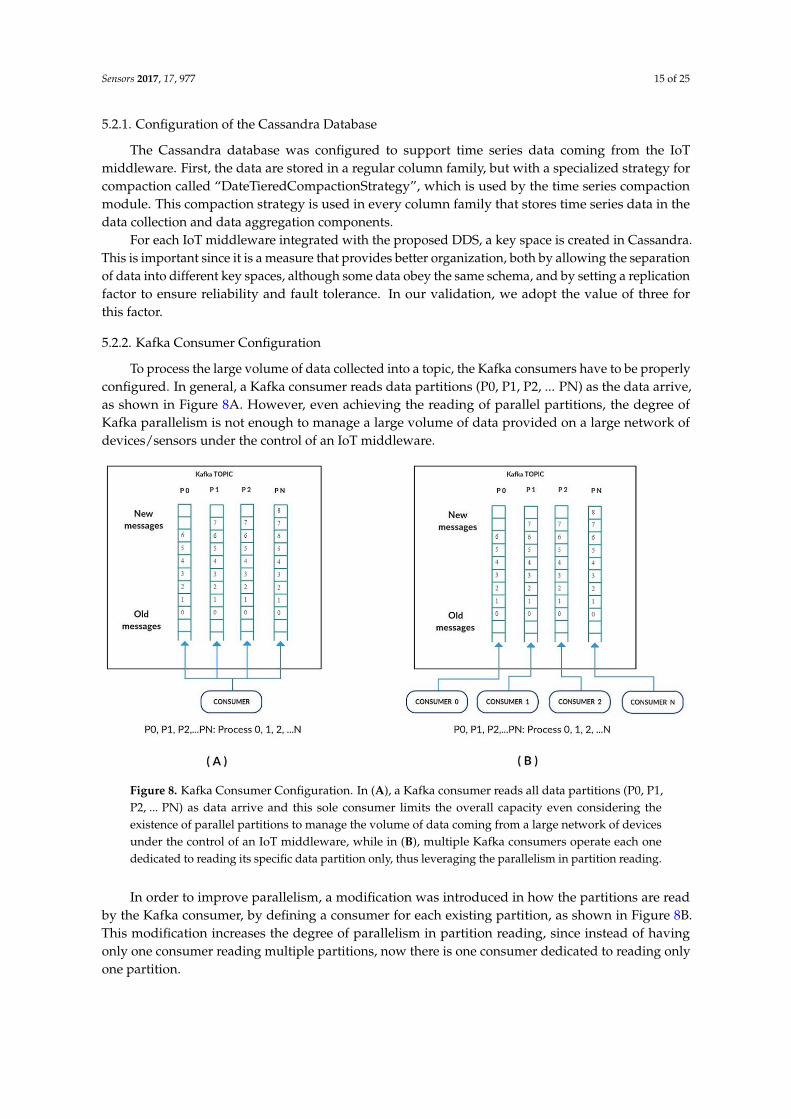
To process the large volume of data collected into a topic, the Kafka consumers have to be properlyconfigured. In general, a Kafka consumer reads data partitions (P0, P1, P2, ... PN) as the data arrive,as shown in Figure 8A. However, even achieving the reading of parallel partitions, the degree ofKafka parallelism is not enough to manage a large volume of data provided on a large network ofdevices/sensors under the control of an IoT middleware.
1
Figure 8. Kafka Consumer Configuration. In (A), a Kafka consumer reads all data partitions (P0, P1,P2, ... PN) as data arrive and this sole consumer limits the overall capacity even considering theexistence of parallel partitions to manage the volume of data coming from a large network of devicesunder the control of an IoT middleware, while in (B), multiple Kafka consumers operate each onededicated to reading its specific data partition only, thus leveraging the parallelism in partition reading.
In order to improve parallelism, a modification was introduced in how the partitions are readby the Kafka consumer, by defining a consumer for each existing partition, as shown in Figure 8B.This modification increases the degree of parallelism in partition reading, since instead of havingonly one consumer reading multiple partitions, now there is one consumer dedicated to reading onlyone partition.

Sensors 2017, 17, 977 16 of 25
5.3. Implementation Details of Data Aggregation Components
The data aggregation component was implemented with two modules (Figure 7): data summarizationand context extraction.
The data summarization module implements the summarization of data, which are stored in theevent table by the data collection component. The summarization process establishes connectionswith the Cassandra database and performs queries over the event table. This program implementsthree processes respectively for summarizing data either by minute, by hour or by day intervals.Results from these processes are stored in summarized tables that contain the number of messagesreceived and the total value of the measurements during a period of time. This allows differentcalculations from the summarized data, such as the average for a period of time.
The context extraction module implements the location extraction, which is especially usefulwhen a device/sensor is attached to a moving thing such as a car or a bike. The device’s/sensor’slocation either is frequently changing, or its location can be relatively static according to the objectmobility. In addition, data coming from remote sensors, such as images and video from camerasand satellites, require the location from where data are coming [51]. Thus, the extraction module isimplemented similarly to the summarization module, using the event table as a data source. In this case,the process aims at extracting the location attribute from the event table to store into the summarizedtables. After the location field is selected, the process fetches the last localization of device/sensor, i.e.,when a device/sensor reading was done.
6. Case Study: Smart Home System Simulation
To evaluate the performance of the designed DDS, this section presents measurements fromtwo experiments comprising the simulation of a home automation IoT instance. The first simulationprocesses data generated by thousand of homes with home appliances and devices managed by theUIoT middleware [52]. In this experiment, we aim to evaluate the two DDS components (data collectionand data aggregation). Hereinafter, this experiment is named the UIoT-DDS study. The secondsimulation is set up to compare the DDS data collector to a similar collector in the Kaa middleware [11],in a home automation IoT similar to the first simulation. The objective of this second study is to showthe performance of the DDS data collector compared to a Kaa collector in terms of capacity to ingesta huge volume of data. Hereinafter, this second experiment is named the Kaa collector study. In bothexperiments the emulated smart home system includes seven devices that are listed in Table 1.
Table 1. Devices of the home automation system.
Device Name State Variable (SV) SV Allowed Values Reading Circuit Write Circuit
TelevisionChannel 1 to 1000 - IR circuitVolume 1 to 100 - IR circuitPower On, Off - IR circuit
Curtain Movement Open, Close - IR circuit
Microwave oven Power On, Off Voltage sensor Switch circuit
Coffee pot Power On, Off Voltage sensor Switch circuit
GateMovement Open, Close, Stop - IR circuitDistance 2 to 700 Distance detector -
Alarm clock Power On, Off Voltage sensor Switch circuit
StereoPower On, Off - Switch circuit
Volume 1 to 100 - IR circuitStation 1 to 6 - IR circuit

Sensors 2017, 17, 977 17 of 25
6.1. UIoT-DDS Study
To achieve the case study tests for data collection and data aggregation, we implementeda computational environment with a cluster composed of four machines, each with the followingspecifications: Intel Xeon 2.5-GHz processor with eight cores, 8 GB of RAM, 500 GB of HD and 1 GbEthernet. The operating system Ubuntu Linux 14.04 was configured in each nodes with Apache Kafka0.8.2, Apache Storm 0.9.5, Apache Cassandra 2.2.6 and Streamparse 2.0.0.
For message interchange simulation between the UIoT and the DDS, Kafka producers areprogramed to create eight million messages simultaneously, each message having 160 bytes. Table 2shows the number of homes and the number of devices that the simulation represents. Moreover,it presents the data volume for different periods. The calculation is based on an operation that proceedsby reading devices every 10 s and sending the corresponding 160 byte messages.
Table 2. Number of devices for UIoT-DDS.
Number of Producers Number of Homes Day Month Year
1 33,600 0.29 TB 8.87 TB 107.92 TB2 63,492 0.56 TB 16.76 TB 203.96 TB3 95,238 0.84 TB 25.15 TB 305.92 TB4 142,857 1.26 TB 37.72 TB 458.91 TB
In order to support the huge data volume, the distributed data service was projected to functionon a computational cluster based on a messaging system. Then, the DDS is cluster based and usespublish-subscribe messaging to handle read and write operations. One of the cluster nodes is selectedas a master server node for the data collector. The other cluster nodes are slave servers that receivemessages from the master server for storing and processing purposes.
It is important to note that a physical cluster, as a shown in Figure 9, was implemented. This clusterinternally supports three virtual clusters, respectively: the Kafka, the Storm and the Cassandra cluster.
Sensors 2017, 17, 977 17 of 25
Table 1. Devices of the home automation system.
DeviceName State Variable (SV) SV
Allowed ValuesReadingCircuit
WriteCircuit
TelevisionChannel 1 to 1000 - IR circuitVolume 1 to 100 - IR circuitPower On, Off - IR circuit
Curtain Movement Open, Close - IR circuit
Microwave oven Power On, Off Voltage sensor Switch circuit
Coffee pot Power On, Off Voltage sensor Switch circuit
Gate Movement Open, Close, Stop - IR circuitDistance 2 to 700 Distance detector -
Alarm clock Power On, Off Voltage sensor Switch circuit
StereoPower On, Off - Switch circuit
Volume 1 to 100 - IR circuitStation 1 to 6 - IR circuit
Table 2. Number of devices for UIoT-DDS.
Number of Producers Number of Homes Day Month Year
1 33,600 0.29 TB 8.87 TB 107.92 TB2 63,492 0.56 TB 16.76 TB 203.96 TB3 95,238 0.84 TB 25.15 TB 305.92 TB4 142,857 1.26 TB 37.72 TB 458.91 TB
In order to support the huge data volume, the distributed data service was projected to functionon a computational cluster based on a messaging system. Then, the DDS is cluster based and usespublish-subscribe messaging to handle read and write operations. One of the cluster nodes is selectedas a master server node for the data collector. The other cluster nodes are slave servers that receivemessages from the master server for storing and processing purposes.
It is important to note that a physical cluster, as a shown in Figure 9, was implemented. This clusterinternally supports three virtual clusters, respectively: the Kafka, the Storm and the Cassandra cluster.
Figure 9. Computational environment of DDS.Figure 9. Computational environment of DDS.
The Kafka cluster was set up on four machines, and this cluster was tested with a replication factorof four. The replication factor is proportional to the number of nodes in the Kafka cluster. In orderto get the maximum parallel processing, the replication factor must be equal to the number of nodesin the Kafka cluster. In order to scale the Kafka cluster horizontally, it was necessary to add morepartitions and spread data onto more machines.
The Storm cluster was implemented with four machines; one of them reserved to operate as themaster node (Nimbus) and the other three as slave nodes (Supervisor). In the Storm architecture,
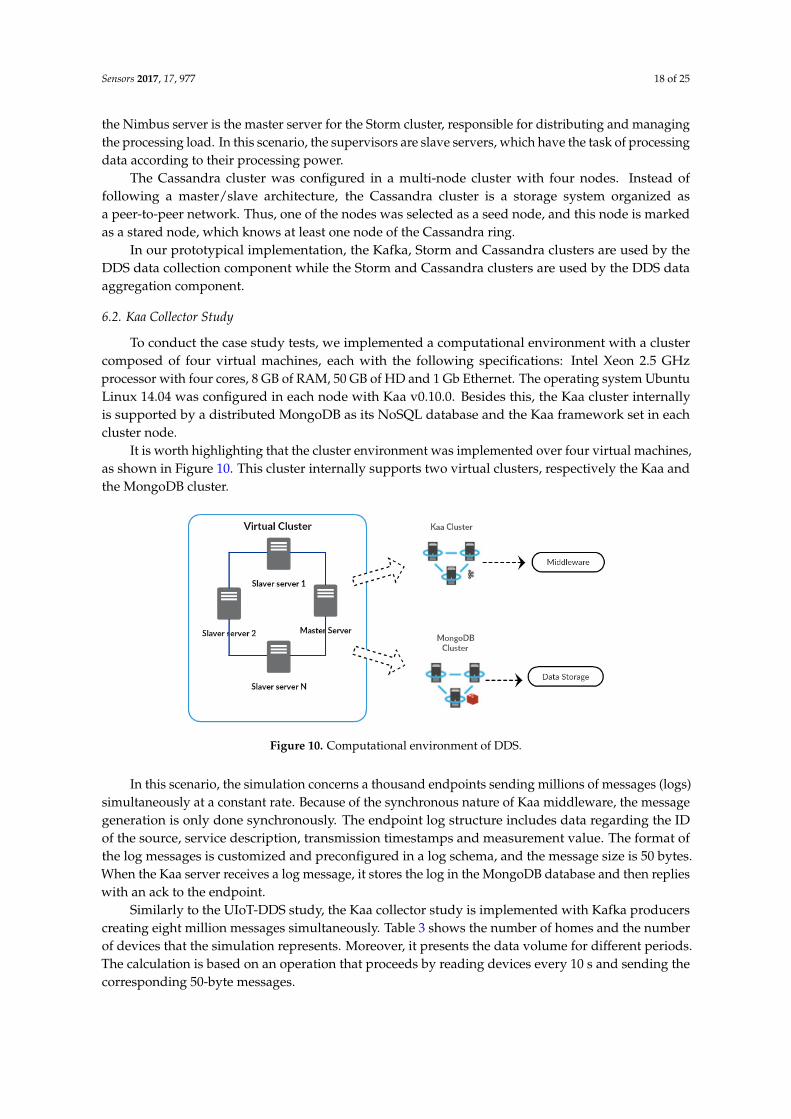
Sensors 2017, 17, 977 18 of 25
the Nimbus server is the master server for the Storm cluster, responsible for distributing and managingthe processing load. In this scenario, the supervisors are slave servers, which have the task of processingdata according to their processing power.
The Cassandra cluster was configured in a multi-node cluster with four nodes. Instead offollowing a master/slave architecture, the Cassandra cluster is a storage system organized asa peer-to-peer network. Thus, one of the nodes was selected as a seed node, and this node is markedas a stared node, which knows at least one node of the Cassandra ring.
In our prototypical implementation, the Kafka, Storm and Cassandra clusters are used by theDDS data collection component while the Storm and Cassandra clusters are used by the DDS dataaggregation component.
6.2. Kaa Collector Study
To conduct the case study tests, we implemented a computational environment with a clustercomposed of four virtual machines, each with the following specifications: Intel Xeon 2.5 GHzprocessor with four cores, 8 GB of RAM, 50 GB of HD and 1 Gb Ethernet. The operating system UbuntuLinux 14.04 was configured in each node with Kaa v0.10.0. Besides this, the Kaa cluster internallyis supported by a distributed MongoDB as its NoSQL database and the Kaa framework set in eachcluster node.
It is worth highlighting that the cluster environment was implemented over four virtual machines,as shown in Figure 10. This cluster internally supports two virtual clusters, respectively the Kaa andthe MongoDB cluster.
Sensors 2017, 17, 977 18 of 25
The Kafka cluster was set up on four machines, and this cluster was tested with a replication factorof four. The replication factor is proportional to the number of nodes in the Kafka cluster. In orderto get the maximum parallel processing, the replication factor must be equal to the number of nodesin the Kafka cluster. In order to scale the Kafka cluster horizontally, it was necessary to add morepartitions and spread data onto more machines.
The Storm cluster was implemented with four machines; one of them reserved to operate as themaster node (Nimbus) and the other three as slave nodes (Supervisor). In the Storm architecture, theNimbus server is the master server for the Storm cluster, responsible for distributing and managing theprocessing load. In this scenario, the supervisors are slave servers, which have the task of processingdata according to their processing power.
The Cassandra cluster was configured in a multi-node cluster with four nodes. Instead offollowing a master/slave architecture, the Cassandra cluster is a storage system organized as apeer-to-peer network. Thus, one of the nodes was selected as a seed node, and this node is marked asa stared node, which knows at least one node of the Cassandra ring.
In our prototypical implementation, the Kafka, Storm and Cassandra clusters are used by theDDS data collection component while the Storm and Cassandra clusters are used by the DDS dataaggregation component.
6.2. Kaa Collector Study
To conduct the case study tests, we implemented a computational environment with a clustercomposed of four virtual machines, each with the following specifications: Intel Xeon 2.5 GHzprocessor with four cores, 8 GB of RAM, 50 GB of HD and 1 Gb Ethernet. The operating system UbuntuLinux 14.04 was configured in each node with Kaa v0.10.0. Besides this, the Kaa cluster internallyis supported by a distributed MongoDB as its NoSQL database and the Kaa framework set in eachcluster node.
It is worth highlighting that the cluster environment was implemented over four virtual machines,as shown in Figure 10. This cluster internally supports two virtual clusters, respectively the Kaa andthe MongoDB cluster.
Figure 10. Computational environment of DDS.
In this scenario, the simulation concerns a thousand endpoints sending millions of messages(logs) simultaneously at a constant rate. Because of the synchronous nature of Kaa middleware, themessage generation is only done synchronously. The endpoint log structure includes data regardingthe ID of the source, service description, transmission timestamps and measurement value. The formatof the log messages is customized and preconfigured in a log schema, and the message size is 50 bytes.When the Kaa server receives a log message, it stores the log in the MongoDB database and then replieswith an ack to the endpoint.
Figure 10. Computational environment of DDS.
In this scenario, the simulation concerns a thousand endpoints sending millions of messages (logs)simultaneously at a constant rate. Because of the synchronous nature of Kaa middleware, the messagegeneration is only done synchronously. The endpoint log structure includes data regarding the IDof the source, service description, transmission timestamps and measurement value. The format ofthe log messages is customized and preconfigured in a log schema, and the message size is 50 bytes.When the Kaa server receives a log message, it stores the log in the MongoDB database and then replieswith an ack to the endpoint.
Similarly to the UIoT-DDS study, the Kaa collector study is implemented with Kafka producerscreating eight million messages simultaneously. Table 3 shows the number of homes and the numberof devices that the simulation represents. Moreover, it presents the data volume for different periods.The calculation is based on an operation that proceeds by reading devices every 10 s and sending thecorresponding 50-byte messages.

Sensors 2017, 17, 977 19 of 25
Table 3. Number of devices for Kaa.
No. of Prod. No. of Homes Day Month Year
1 33,600 0.09 TB 2.86 TB 33.73 TB2 63,492 0.17 TB 5.41 TB 63.74 TB3 95,238 0.26 TB 8.12 TB 95.61 TB4 142,857 0.39 TB 12.18 TB 143.41 TB
7. Results
The results are divided according to the two described studies. In the case of the UIoT-DDSsimulation results, data collection and data aggregation were evaluated, while in the Kaa simulation,only data collection was evaluated. In order to ensure equity, the DDS and Kaa environmentimplementations were carried out in a similar fashion, in terms of the quantity of cluster nodes, memory,processing power and operational systems. However, there were some differences. For example,the DDS environment was implemented by physical computers, while the Kaa environment wasimplemented by virtual machines.
7.1. DDS Results
The DDS simulation involved the creation of both synchronous and asynchronous messages.The results of this simulation are presented, with the number of messages created per second bya different number of producers which are either broker or server nodes. This process was testedin an incremental way, from one producer to four producers. Figure 11 presents the results, withthe synchronous producer showing that the performance is proportional to the number of producersbeing executed. In addition, the number of homes that can be supported in the synchronous scenariois presented. For example, for two producers, the number of messages per second is 20,000 (2934homes). Figure 12 presents the results of the asynchronous producer compared to the synchronousproducer. Similar to the synchronous producer experiment, this process was tested in an incrementalway, from one producer (broker or server node) to four producers.
Sensors 2017, 17, 977 19 of 25
Similarly to the UIoT-DDS study, the Kaa collector study is implemented with Kafka producerscreating eight million messages simultaneously. Table 3 shows the number of homes and the numberof devices that the simulation represents. Moreover, it presents the data volume for different periods.The calculation is based on an operation that proceeds by reading devices every 10 s and sending thecorresponding 50-byte messages.
Table 3. Number of devices for Kaa.
No. of Prod. No. of Homes Day Month Year
1 33,600 0.09 TB 2.86 TB 33.73 TB2 63,492 0.17 TB 5.41 TB 63.74 TB3 95,238 0.26 TB 8.12 TB 95.61 TB4 142,857 0.39 TB 12.18 TB 143.41 TB
7. Results
The results are divided according to the two described studies. In the case of the UIoT-DDSsimulation results, data collection and data aggregation were evaluated, while in the Kaa simulation,only data collection was evaluated. In order to ensure equity, the DDS and Kaa environmentimplementations were carried out in a similar fashion, in terms of the quantity of cluster nodes, memory,processing power and operational systems. However, there were some differences. For example,the DDS environment was implemented by physical computers, while the Kaa environment wasimplemented by virtual machines.
7.1. DDS Results
The DDS simulation involved the creation of both synchronous and asynchronous messages.The results of this simulation are presented, with the number of messages created per second by adifferent number of producers which are either broker or server nodes. This process was tested inan incremental way, from one producer to four producers. Figure 11 presents the results, with thesynchronous producer showing that the performance is proportional to the number of producers beingexecuted. In addition, the number of homes that can be supported in the synchronous scenario ispresented. For example, for two producers, the number of messages per second is 20,000 (2934 homes).Figure 12 presents the results of the asynchronous producer compared to the synchronous producer.Similar to the synchronous producer experiment, this process was tested in an incremental way, fromone producer (broker or server node) to four producers.
Figure 11. UIoT data producer: synchronous.
After the data aggregation processes completed the preprocessing, data coming from the eventtable were stored in the summarized tables. To show the performance improvement in the query
Figure 11. UIoT data producer: synchronous.
After the data aggregation processes completed the preprocessing, data coming from the eventtable were stored in the summarized tables. To show the performance improvement in the queryresponse time using the aggregation approach, we refer to the query time using the event table whereevery message is stored and collected by the data collection, and we compare this result with thequery time of the aggregation processes from the summarized table. The Event table stores every

Sensors 2017, 17, 977 20 of 25
filtered message coming from an IoT middleware with any type of aggregation. Table 4 shows thatquerying data from the event table is more expensive compared to querying from the summarizedtable. This becomes more evident over a longer period.
These results show that our DDS prototype in Kafka performs very well with multiple brokersin the cluster. In the case study presented, Kafka supports the ingestion of millions of IoT messagescreated by the Kafka producer, thus supporting high stress requests. Meanwhile, the KafkaSpoutconsumer easily supports the ingestion of data from the producers. This is a result of the multiplepartitions created in a Kafka topic. The partitions enable read and write operations in parallel.In general, while some partitions are read by the Kafka consumer, other partitions are written by theKafka producer. Furthermore, the results show that Storm adequately performs the defined DDStopology, enabling the mounting of a cluster to process data in a distributed and parallel way, using theprocessing resources of every cluster node to process all of the data in real time.
Sensors 2017, 17, 977 20 of 25
response time using the aggregation approach, we refer to the query time using the event table whereevery message is stored and collected by the data collection, and we compare this result with thequery time of the aggregation processes from the summarized table. The Event table stores everyfiltered message coming from an IoT middleware with any type of aggregation. Table 4 shows thatquerying data from the event table is more expensive compared to querying from the summarizedtable. This becomes more evident over a longer period.
These results show that our DDS prototype in Kafka performs very well with multiple brokers inthe cluster. In the case study presented, Kafka supports the ingestion of millions of IoT messages createdby the Kafka producer, thus supporting high stress requests. Meanwhile, the KafkaSpout consumereasily supports the ingestion of data from the producers. This is a result of the multiple partitionscreated in a Kafka topic. The partitions enable read and write operations in parallel. In general, whilesome partitions are read by the Kafka consumer, other partitions are written by the Kafka producer.Furthermore, the results show that Storm adequately performs the defined DDS topology, enabling themounting of a cluster to process data in a distributed and parallel way, using the processing resourcesof every cluster node to process all of the data in real time.
Figure 12. UIoT data producer (synchronous and asynchronous).
Table 4. Query time over the event and the summarized tables.
Query Time
Period Event (s) Summarized (ms)
By minute 1.51 4By hour 2.12 3By day 43.94 3
7.2. Kaa Results
Unlike the UIoT-DDS simulation, the Kaa simulation involved exclusively the creation ofsynchronous messages. This is due to the fact that data collection in a Kaa platform can only store thereceived messages in the database and then reply with a confirmation or acknowledgment back to theendpoint. Figure 13 displays the relationship between the message receiving speed and the number ofhomes supported by different numbers of Kaa nodes.
The results of this Kaa simulation are presented with the number of messages created per secondby a different number of producers. This process was tested in an incremental way, from one producerto four producers. While the producer is incremented, the number of Kaa nodes is also incrementedproportionally. Figure 13 presents the results showing that performance is proportional to the numberof producers being executed. In addition, the number of homes that can be supported is shown.For example, for two producers, the number of messages per second is 10,094 (1,442 homes).
Figure 12. UIoT data producer (synchronous and asynchronous).
Table 4. Query time over the event and the summarized tables.
Query Time
Period Event (s) Summarized (ms)
By minute 1.51 4By hour 2.12 3By day 43.94 3
7.2. Kaa Results
Unlike the UIoT-DDS simulation, the Kaa simulation involved exclusively the creation ofsynchronous messages. This is due to the fact that data collection in a Kaa platform can only store thereceived messages in the database and then reply with a confirmation or acknowledgment back to theendpoint. Figure 13 displays the relationship between the message receiving speed and the number ofhomes supported by different numbers of Kaa nodes.
The results of this Kaa simulation are presented with the number of messages created per secondby a different number of producers. This process was tested in an incremental way, from one producerto four producers. While the producer is incremented, the number of Kaa nodes is also incrementedproportionally. Figure 13 presents the results showing that performance is proportional to the numberof producers being executed. In addition, the number of homes that can be supported is shown.For example, for two producers, the number of messages per second is 10,094 (1442 homes).

Sensors 2017, 17, 977 21 of 25Sensors 2017, 17, 977 21 of 25
Figure 13. Kaa collector results.
8. Discussion
In this section, we intend to analyze first the data collection and data aggregation results ofthe UIoT-DDS study, second, the Kaa collector results and, finally, the data collection comparing theUIoT-DDS to the Kaa collector in terms of data ingestion of a huge data volume. This comparisonshows the better performance of DDS when facing a huge volume of data coming from differentsources. It is important to highlight that for the sake of fairness, this comparison is done in termsof data ingesting when UIoT-DDS operates synchronously, since the Kaa collector only operates insynchronous mode.
In the first case study (UIoT-DDS), we can see the performance of the asynchronous producerpresenting better results than the synchronous one (see Figure 12). The rapid data ingestion bythe asynchronous producer is due to the fact that there is no need to confirm that a message wassuccessfully received. This allows sending messages without having to wait for an answer regarding aprevious message. For this reason, the data ingestion for the asynchronous simulation is faster thana synchronous equivalent. The results show that the data collection can support data ingestion atthe rate of a million messages per second. For example, for two producers, the number of messagesper second is 400,000 (63,492 homes). Figure 12 shows the scalability regarding data ingestion by theproposed setup, meaning that the data ingestion by the DDS can support a huge number of devicessending data at the same time, since it is possible to add more brokers to the cluster topology.
About the data aggregation process, the event and summarized tables do not have any particularconfiguration, such as index creation. Table 4 presents an event column, which represents the querytime over a period of time. In this context, since one million devices/sensors can generate about 8640million records in one day, a query over this volume of data can take a long time to be processed. Withthis in mind, querying data by day is slower compared to querying by hour or by minute. It is clearlyobserved that the query time over summarized data is very fast, and apparently, it has a constantprocessing time. This is a consequence of a decreased volume of data and the respective preprocessing.This means that there are fewer rows to consider, and thus, less processing is required to get a response.
In the second case study (Kaa collector), we can see the performance of data collection using theKaa platform whose scalability is illustrated in Figure 13. Incrementing the number of Kaa nodes,the data collection capacity is incremented proportionally. In this context, the average number ofcollected messages is about five thousand messages per second, considering the increment of thenumber of producers.
Comparing data collection results between the DDS and Kaa collectors, we can see that DDScollection shows better results compared with data collection within the Kaa platform. For example,for just one node, the DDS can collect 11 thousand messages per second, and the Kaa collector cancollect about five thousand messages per second. Another example is when comparing with threenodes, the result is about 25 and 15 thousand messages per second, respectively. It is important toagain highlight that this comparison is done with DDS synchronous producers. Comparing the DDSasynchronous producer with the Kaa collector is not fair, given the evident better performance of the
Figure 13. Kaa collector results.
8. Discussion
In this section, we intend to analyze first the data collection and data aggregation results ofthe UIoT-DDS study, second, the Kaa collector results and, finally, the data collection comparing theUIoT-DDS to the Kaa collector in terms of data ingestion of a huge data volume. This comparisonshows the better performance of DDS when facing a huge volume of data coming from differentsources. It is important to highlight that for the sake of fairness, this comparison is done in termsof data ingesting when UIoT-DDS operates synchronously, since the Kaa collector only operates insynchronous mode.
In the first case study (UIoT-DDS), we can see the performance of the asynchronous producerpresenting better results than the synchronous one (see Figure 12). The rapid data ingestion bythe asynchronous producer is due to the fact that there is no need to confirm that a message wassuccessfully received. This allows sending messages without having to wait for an answer regardinga previous message. For this reason, the data ingestion for the asynchronous simulation is faster thana synchronous equivalent. The results show that the data collection can support data ingestion atthe rate of a million messages per second. For example, for two producers, the number of messagesper second is 400,000 (63,492 homes). Figure 12 shows the scalability regarding data ingestion by theproposed setup, meaning that the data ingestion by the DDS can support a huge number of devicessending data at the same time, since it is possible to add more brokers to the cluster topology.
About the data aggregation process, the event and summarized tables do not have any particularconfiguration, such as index creation. Table 4 presents an event column, which represents the querytime over a period of time. In this context, since one million devices/sensors can generate about8640 million records in one day, a query over this volume of data can take a long time to be processed.With this in mind, querying data by day is slower compared to querying by hour or by minute.It is clearly observed that the query time over summarized data is very fast, and apparently, it hasa constant processing time. This is a consequence of a decreased volume of data and the respectivepreprocessing. This means that there are fewer rows to consider, and thus, less processing is requiredto get a response.
In the second case study (Kaa collector), we can see the performance of data collection using theKaa platform whose scalability is illustrated in Figure 13. Incrementing the number of Kaa nodes,the data collection capacity is incremented proportionally. In this context, the average number ofcollected messages is about five thousand messages per second, considering the increment of thenumber of producers.
Comparing data collection results between the DDS and Kaa collectors, we can see that DDScollection shows better results compared with data collection within the Kaa platform. For example,for just one node, the DDS can collect 11 thousand messages per second, and the Kaa collector cancollect about five thousand messages per second. Another example is when comparing with three

Sensors 2017, 17, 977 22 of 25
nodes, the result is about 25 and 15 thousand messages per second, respectively. It is important toagain highlight that this comparison is done with DDS synchronous producers. Comparing the DDSasynchronous producer with the Kaa collector is not fair, given the evident better performance of theDDS collection data due to the asynchronous operation mode. In this case, for example, for four nodes,the DDS can collect about one million messages per second, while the Kaa collector can collect justabout 20 thousand messages per second.
9. Conclusions and Future Works
The next generation of the Internet is moving in an important developmental direction, as theIoT increasingly captures the attention of industry and academia. Selecting and applying databasemiddleware technology, in a reasonable way, is a key question to solving the problem of IoT datamanagement for a massive volume of data generated in real time.
In this context, our results show that the designed DDS supports data management for IoTmiddleware performs well in collecting and retrieving data from an IoT middleware. The choice ofcomponents and their articulation for collaborative data treatment are key factors for high velocitydata collecting and analyzing. Besides this, the proposed DDS is able to process a variety of datacoming from different IoT environments through a specific communications interface and metadatacreation modules. Finally, the proposed DDS was shown to have better performance compared witha typical data collector, the Kaa middleware.
In our proposed DDS prototype, the Kafka database has shown adequate performance incollecting massive amounts of messages managed by the UIoT middleware in the simulated setup.Repetitive tests show that the performance of Kafka is optimal regarding the utilization of a Stormcluster for real-time processing. In this configuration, the data aggregation component was shownto be efficient in querying incoming data from millions of IoT devices, which are expected in largeIoT networks. The results show that the proposed loosely coupled DDS supports a high stress load ofincoming data from an IoT middleware managing millions of IoT devices to collect and process thedata they create. Loosely coupling these systems seems to be a reasonable approach if we considerthat there are data management tasks common to various IoT middleware systems; these tasks beingfactored and separated from the IoT control middleware can be offered as a distributed softwareservice that can be independently developed and, if needed, can be transformed to a software libraryfor tightly-coupled systems. Loose coupling can also be important in providing interoperability amongdifferent IoT middleware and IoT applications.
Future work may include further implementation and a more detailed performance evaluation ofthe data collection and the data aggregation components. In addition, massive data analysis allowinglearning from the IoT environment, as well as data prediction based on sensor serial time data are alsoto be studied. Finally, we intend to implement a real-life, smart environment, to collect and processactual data produced by devices and sensors in this environment.
Acknowledgments: This research work has the support of the Brazilian research and innovation AgenciesCAPES—Coordination for the Improvement of Higher Education Personnel (Grant 23038.007604/2014-69FORTE—Tempestive Forensics Project), FINEP—Funding Authority for Studies and Projects (Grant 01.12.0555.00RENASIC/PROTO—Secure Protocols Laboratory of the National Information Security and CryptographyNetwork) and FAPDF—Research Support Foundation of the Federal District (Grants 0193.001366/2016UIoT—Universal Internet of Things and 0193.001365/2016—Secure Software Defined Data Center (SSDDC)),as well as the Brazilian Ministry of Justice (Grant 001/2015 SENACON—National Consumer Secretariat),the Ministry of Planning, Development and Management (Grants 005/2016 DIPLA—Planning and ManagementDirectorate and 11/2016 SEST—Secretariat of State-owned Federal Companies) and the DPGU—Brazilian UnionPublic Defender (Grant 066/2016).
Author Contributions: R.C.H. and M.T.d.H. conceived the general architecture of the proposed distributed dataservice and developed the validation prototype; R.T.d.S.J. and R.d.O.A. modeled IoT needs, specified the relatedfunctional and performance requirements for data collection and aggregation, and analyzed data resulting fromexperiments; L.J.G.V and T.H.K. conceived and designed the experiments. All authors contributed equally toperforming the experiments and writing the paper.
Sensors 2017, 17, 977 23 of 25
Conflicts of Interest: The authors declare no conflict of interest. The founding sponsors had no role in the designof the study; in the collection, analyses or interpretation of data; in the writing of the manuscript; nor in thedecision to publish the results.
Abbreviations
The following abbreviations are used in this manuscript:
IoT Internet of ThingsDDS Distributed Data ServiceNoSQL Not only SQLWSO2 Web Services oxygenatedCUPUS CloUd-based Publish-SubscribeREST Representational State TransferITS Intelligent Transportation SystemIC Integrated CircuitsSV State VariableIR InfraredRFID Radio Frequency IdentificationGPS Global Positioning SystemUDP User Datagram ProtocolX-GSN Extended Global Sensor NetworksJSON JavaScript Object NotationXML EXtensible Markup LanguageHTTP Hypertext Transfer ProtocolUIoT Universal Internet of Things
References
1. Misra, P.; Simmhan, Y.L.; Warrior, J. Towards a Practical Architecture for the Next Generation Internet ofThings. CoRR 2015, arXiv:1502.00797.
2. Mashal, I.; Alsaryrah, O.; Chung, T.Y.; Yang, C.Z.; Kuo, W.H.; Agrawal, D.P. Choices for interaction withthings on internet and underlying issues. Ad Hoc Netw. 2015, 28, 68–90. [CrossRef]
3. Saied, Y.B.; Olivereau, A.; Zeghlache, D.; Laurent, M. Lightweight collaborative key establishment schemefor the Internet of Things. Comput. Netw. 2014, 64, 273–295. [CrossRef]
4. Razzaque, M.A.; Milojevic-Jevric, M.; Palade, A.; Clarke, S. Middleware for Internet of Things: A Survey.IEEE Internet Things J. 2016, 3, 70–95. [CrossRef]
5. Fersi, G. Middleware for Internet of Things: A Study. In Proceedings of the International Conference onDistributed Computing in Sensor Systems 2015, Fortaleza, Brazil, 10–12 June 2015; pp. 230–235.
6. Delicato, F.C.; Pires, P.F.; Batista, T.; Cavalcante, E.; Costa, B.; Barros, T. Towards an IoT ecosystem.In Proceedings of the First International Workshop on Software Engineering for Systems of Systems(SESoS 2013), New York, NY, USA, 1 July 2013; pp. 25–28.
7. Sinha, N.; Pujitha, K.E.; Alex, J.S.R. Xively based sensing and monitoring system for IoT. In Proceedingsof the International Conference on Computer Communication and Informatics (ICCCI 2015), Coimbatore,India, 8–10 January 2015; pp. 1–6.
8. Soldatos, J.; Kefalakis, N.; Hauswirth, M.; Serrano, M.; Calbimonte, J.P.; Riahi, M.; Aberer, K.; Jayaraman, P.P.;Zaslavsky, A.; Žarko, I.P.; et al. OpenIoT: Open Source Internet-of-Things in the Cloud. In Interoperabilityand Open-Source Solutions for the Internet of Things; Chapter OpenIoT: Open Source Internet-of-Things in theCloud; Springer International Publishing: Cham, Germany, 2015.
9. Qin, W.; Li, Q.; Sun, L.; Zhu, H.; Liu, Y. RestThing: A Restful Web Service Infrastructure for Mash-UpPhysical and Web Resources. In Proceedings of the 9th International Conference Embedded and UbiquitousComputing (EUC) 2011, Melbourne, Australia, 24–16 October 2011; pp. 197–204.
10. Fremantle, P. A Reference Architecture for the Internet of Things. Available online: https://www.kaaproject.org (accessed on 27 April 2017).

Sensors 2017, 17, 977 24 of 25
11. Webinar: Building a Private, Enterprise-Grade IoT Cloud with Kaa. Available online: https://www.researchgate.net/profile/Paul_Fremantle/publication/308647314_A_Reference_Architecture_for_the_Internet_of_Things/links/57ea00b708aef8bfcc963153.pdf (accessed on 27 April 2017).
12. Park, T.; Abuzainab, N.; Saad, W. Learning how to communicate in the Internet of Things: Finite resourcesand heterogeneity. IEEE Access 2016, 4, 7063–7073. [CrossRef]
13. Ferreira, H.G.C. Arquitetura de Middleware Para Internet Das Coisas. Master’s Thesis, University of Brasília,Brasília, Brazil, 2014.
14. O’Leary, D.E. Big Data, the Internet of Things and the Internet of Signs. Intell. Syst. Account. Financ. Manag.2013, 64, 53–65. [CrossRef]
15. Assunção, M.D.; Calheiros, R.N.; Bianchi, S.; Netto, M.A.; Buyya, R. Big Data computing and clouds:Trends and future directions. J. Parallel Distrib. Comput. 2015, 79, 3–15. [CrossRef]
16. Zaslavsky, A.; Perera, C.; Georgakopoulos, D. Sensing as a service and Big Data. arXiv 2013, arXiv:1301.0159.17. Abu-Elkheir, M.; Hayajneh, M.; Ali, N.A. Data management for the internet of things: Design primitives and
solution. Sensors 2013, 13, 15582–15612. [CrossRef] [PubMed]18. Russom, P. Big Data Analytics; Technical Report; The Data Warehousing Institute (TDWI): Munich,
Germany, 2011.19. Ali-ud-din Khan, M.; Uddin, M.F.; Gupta, N. Seven V’s of Big Data understanding Big Data to extract
value. In Proceeedings of the Conference of the American Society for Engineering Education (ASEE Zone 1),Bridgeport, CT, USA, 3–5 April 2014.
20. Li, M.; Liu, Y.; Cai, Y. A dynamic processing system for sensor data in IoT. Int. J. Distrib. Sens. Netw. 2015,2015, 18–28. [CrossRef]
21. Vongsingthong, S.; Smanchat, S. A Review of Data Management in Internet of Things. Khon Kaen Univ. KKURes. J. 2015, 20, 215–240.
22. Hashem, I.A.T.; Yaqoob, I.; Anuar, N.B.; Mokhtar, S.; Gani, A.; Khan, S.U. The rise of “Big Data” on cloudcomputing: Review and open research issues. Inf. Syst. 2015, 47, 98–115. [CrossRef]
23. Chen, M.; Mao, S.; Liu, Y. Big data: A survey. Mob. Netw. Appl. 2014, 19, 171–209. [CrossRef]24. Yang, D.L.; Liu, F.; Liang, Y.D. A survey of the internet of things. In Proceedings of the 1st International
Conference on E-Business Intelligence (ICEBI2010), Kunming, China, 19–21 December 2010.25. Whitmore, A.; Agarwal, A.; Xu, L.D. The Internet of Things—A survey of topics and trends. Inf. Syst. Front.
2015, 17, 261–274. [CrossRef]26. Atzori, L.; Iera, A.; Morabito, G. The Internet of Things: A survey. Comput. Netw. 2010, 54, 2787–2805.
[CrossRef]27. Bandyopadhyay, S.; Sengupta, M.; Maiti, S.; Dutta, S. Role of middleware for internet of things: A study.
Int. J. Comput. Sci. Eng. Surv. 2011, 2, 94–105. [CrossRef]28. Cooper, J.; James, A. Challenges for database management in the internet of things. IETE Tech. Rev. 2009, 26,
320–329. [CrossRef]29. Ramakrishnan, R.; Gehrke, J. Database Management Systems; McGraw-Hill: New York, NY, USA, 2000.30. Özsu, M.T.; Valduriez, P. Principles of Distributed Database Systems; Springer: Berlin, Germany, 2011.31. Luo, C.; Wu, F.; Sun, J.; Chen, C.W. Compressive data gathering for large-scale wireless sensor networks.
In Proceedings of the 15th Annual International Conference on Mobile Computing and Networking, Beijing,China, 20–25 September 2009; pp. 145–156.
32. Van der Veen, J.S.; Van der Waaij, B.; Meijer, R.J. Sensor data storage performance: Sql or nosql, physical orvirtual. In Proceedings of the 5th International Conference of Cloud Computing (CLOUD) 2012, Honolulu,HI, USA, 24–29 June 2012; pp. 431–438.
33. Musolesi, M.; Mascolo, C.; Hailes, S. Adapting asynchronous messaging middleware to ad hoc networking.In Proceedings of the 2nd Workshop on Middleware for Pervasive and Ad-Hoc Computing, Toronto, ON,Canada, 18–22 October 2004; pp. 121–126.
34. Stankovic, J.A. Real-Time Computing. Available online: http://citeseerx.ist.psu.edu/viewdoc/download?doi=10.1.1.19.5916&rep=rep1&type=pdf (accessed on 27 April 2017).
35. Shin, K.G.; Ramanathan, P. Real-time computing: A new discipline of computer science and engineering.Proc. IEEE 1994, 82, 6–24. [CrossRef]
Sensors 2017, 17, 977 25 of 25
36. Cecchinel, C.; Jimenez, M.; Mosser, S.; Riveill, M. An Architecture to Support the Collection of Big Datain the Internet of Things. In Proceedings of IEEE 10th World Congress on Services, Anchorage, AK, USA,27 June–2 July 2014; pp. 442–449.
37. Pires, P.F.; Cavalcante, E.; Barros, T.; Delicato, F.C.; Batista, T.; Costa, B. A platform for integrating physicaldevices in the Internet of Things. In Proceedings of the International Conference of Embedded andUbiquitous Computing (EUC) IEEE 2014, Milano, Italy, 26–28 August 2014; pp. 234–241.
38. LogMeIn, I. Xively Platform. 2016. Available online: http://xively.com (accessed on 6 June 2016).39. Deng, X.; Zhang, M.; Xiao, F. Design and Application of Intelligent Transportation System Based on
The Internet of Things. Available online: http://ascelibrary.org/doi/pdf/10.1061/9780784413753.005(accessed on 6 June 2016).
40. Marz, N.; Warren, J. Big Data: Principles and Best Practices of Scalable Realtime Data Systems; ManningPublications Co.: Shelter Island, NY, USA, 2015.
41. Garg, N. Apache Kafka; Packt Publishing: Birmingham, UK, 2013.42. Kreps, J.; Narkhede, N.; Rao, J. Kafka: A distributed messaging system for log processing. In Proceedings of
the 6th International Workshop on Networking Meets Databases (NetDB), Athens, Greece, 12–16 June 2011.43. Jain, A.; Nalya, A. Learning Storm; Packt Publishing: Birmingham, UK, 2014.44. Zookeeper, A. Apache Zookeeper 2016. Available online: https://zookeeper.apache.org/ (accessed on
6 June 2016).45. Cassandra, A. Apache Cassandra 2016. Available online: http://cassandra.apache.org (accessed on
6 June 2016).46. Lakshman, A.; Malik, P. Cassandra: Structured Storage System on a P2P Network. In Proceedings of the
28th ACM Symposium on Principles of Distributed Computing, New York, NY, USA, 10–12 August 2009.47. Streamparse. Available online: http://streamparse.readthedocs.io/en/stable/index.html (accessed on
6 June 2016).48. Tudorica, B.G.; Bucur, C. A comparison between several NoSQL databases with comments and notes.
In Proceedings of the 10th Edition of Networking in Education and Research (RoEduNet) InternationalConference, Iasi, Romania, 23–25 June 2011; pp. 1–5.
49. Toshniwal, A.; Taneja, S.; Shukla, A.; Ramasamy, K.; Patel, J.M.; Kulkarni, S.; Jackson, J.; Gade, K.; Fu, M.;Donham, J.; et al. Storm@Twitter. In Proceedings of the International Conference on Management of Data(SIGMOD) ACM 2014, Snowbird, UT, USA, 22–17 June 2014.
50. Shahrivari, S. Beyond batch processing: Towards real-time and streaming Big Data. Computers 2014, 3,117–129. [CrossRef]
51. Sheth, A.; Henson, C.; Sahoo, S.S. Semantic sensor web. IEEE Internet Comput. 2008, 12, 78–83. [CrossRef]52. Ferreira, H.G.C.; Canedo, E.D.; de Sousa, R.T. IoT architecture to enable intercommunication through
REST API and UPnP using IP, ZigBee and arduino. In Proceedings of the 9th International Conferenceon Wireless and Mobile Computing, Networking and Communications (WiMob) IEEE 2013, Lyon, France,7–9 October 2013; pp. 53–60.
© 2017 by the authors. Licensee MDPI, Basel, Switzerland. This article is an open accessarticle distributed under the terms and conditions of the Creative Commons Attribution(CC BY) license (http://creativecommons.org/licenses/by/4.0/).
Copyright © 2022 FDOKUMEN