OSIRIS Internet - Data Guide - UC3M Business
176
OSIRIS Internet - Data Guide
-
Upload
khangminh22 -
Category
Documents
-
view
0 -
download
0
Transcript of OSIRIS Internet - Data Guide - UC3M Business

OSIRIS Internet - Data Guide


iii
Table Of Contents Introduction to OSIRIS.....................................................................................................1
Database Description .......................................................................................................1
OSIRIS inclusion goal.......................................................................................................2
Applications of Osiris........................................................................................................2
Applications of OSIRIS...................................................................................................3
Transfer Pricing ............................................................................................................3
AnFoode: Transfer Pricing Analysis ..................................................................................3
Background .................................................................................................................3
Application to AnFoode Transactions................................................................................4
Methodology ................................................................................................................4
Search Results .............................................................................................................4
Financial Analysis .........................................................................................................8
Analysis Result .............................................................................................................9
Conclusion...................................................................................................................9
Configuration Requirements ..............................................................................................9
User Support ................................................................................................................10
OSIRIS Data.................................................................................................................11
Data Methodology .........................................................................................................11
Industrial Financials ....................................................................................................11
Bank Financials ..........................................................................................................12
Insurance Financials....................................................................................................12
Data Quality .................................................................................................................12
Data Collection & Updating .............................................................................................13
Account formats ............................................................................................................15
Account Formats.........................................................................................................15
Industrials Template ...................................................................................................16
Cash Flow Statement - Industrial companies...................................................................18
Banks Template..........................................................................................................19
Insurance Template ....................................................................................................20
Status of the company ...................................................................................................21
Activity Classification .....................................................................................................21
Account Header.............................................................................................................23
Consolidation Codes.......................................................................................................26
Accounting Practice........................................................................................................27
General information ....................................................................................................27
Accounting practice on OSIRIS .....................................................................................28
Geographic Location ......................................................................................................28

OSIRIS Internet - Data Guide
iv
Earnings Estimates - Additional Estimates .........................................................................30
Earnings Estimates .....................................................................................................30
Additional Estimates....................................................................................................30
Ratings ........................................................................................................................31
Edgar Online Filings .......................................................................................................32
News ...........................................................................................................................32
Company identification numbers ......................................................................................32
ID numbers for industrial companies on Osiris ................................................................32
OSIRIS Software Overview .............................................................................................37
Accessing .....................................................................................................................37
Accessing ..................................................................................................................37
Search ......................................................................................................................37
Text Search instructions ..............................................................................................38
List...........................................................................................................................39
Report ......................................................................................................................41
Save.........................................................................................................................43
Upload companies.......................................................................................................43
Peer groups/Peer reports ................................................................................................44
Peer Groups...............................................................................................................44
Peer Reports ..............................................................................................................44
Peer Analyses.............................................................................................................45
Presenting....................................................................................................................46
Glossary.......................................................................................................................47
Information Providers ....................................................................................................57
Industry Classification Benchmark....................................................................................60
Data Definitions ............................................................................................................62
Ratios definitions...........................................................................................................76
Industrial company ratios ............................................................................................76
Bank ratios ................................................................................................................78
Insurance company ratios - Life Ratios...........................................................................82
Insurance company ratios - Non-Life Ratios ....................................................................84
Insurance company ratios - Composite Ratios .................................................................87
Stock Data Ratios .......................................................................................................88
WVB Ratios................................................................................................................89
Rating definitions ........................................................................................................ 101
Ratings Definitions.................................................................................................... 101
Fitch Ratings............................................................................................................ 101
Moody’s................................................................................................................... 104
Standard and Poor’s.................................................................................................. 109

Table Of Contents
v
Templates - Industrial .................................................................................................. 111
Global (Industrial - All) .............................................................................................. 111
Global detailed (Industrial - Life)................................................................................. 114
Spreadsheet ( Industrial - Anglo ) .............................................................................. 119
Spreadsheet (Industrial - Continental) ......................................................................... 123
Spreadsheet (Industrial - Hybrid)................................................................................ 127
Cash Flow Statement (Industrial – All) ......................................................................... 131
Cash flow Statement (US accounts)............................................................................. 132
Analyst-WVB (Industrial - All)..................................................................................... 136
Master-WVB (Industrial - All)...................................................................................... 136
Templates - Bank ........................................................................................................ 137
Banks Template........................................................................................................ 137
Global (Bank)........................................................................................................... 138
Global detailed (Bank) ............................................................................................... 139
Templates - Insurance ................................................................................................. 145
Insurance Template .................................................................................................. 145
Global (Insurance - All) ............................................................................................. 147
Global (Insurance - All) ............................................................................................. 147
Global detailed (Insurance – Non-Life) ......................................................................... 149
Global detailed (Insurance- Composite)........................................................................ 152
Edgar Online Filings ..................................................................................................... 156
Filing Times for Annual Reports – World’Vest Base............................................................ 159
Corporate actions: event glossary and useful terms.......................................................... 160
Dividends: event glossary and useful terms..................................................................... 163
ID numbers for industrial companies on Osiris ................................................................. 164


1
Introduction to OSIRIS
1
Introduction to OSIRIS
OSIRIS is a fully integrated public company database and analytical information solution produced by Bureau van Dijk Electronic Publishing, SA (BvD). Working with specialist data providers from around the world, BvD makes OSIRIS the most accurate, comprehensive, and user-friendly information tool available for the world’s public companies.
OSIRIS is available on DVD, Internet, and Intranet. It is updated 12 times per year on DVD and 52 times per year on the Internet.
A Japanese language version of OSIRIS is also available.
Copyright © 2011 Last updated September 2011
1
Database Description
OSIRIS provides financials, ownership, news, ratings, earnings and stock data for the world’s publicly quoted companies, including banks and insurance firms from over 130 countries.
Note: A publicly quoted company on OSIRIS is defined as a company with publicly listed equity. This definition could be different from other, broader definitions which might also include companies with listed bonds or other certificates. This definition has an impact on the inclusion criteria for companies on OSIRIS.
The industrial company financial data on OSIRIS is provided by World’Vest Base (WVB) and three regionally specialized providers: Thomson Reuters (US companies and additional accounts for non-US companies listed in USA), Korea Information Service - KIS (Korean companies), Dun & Bradstreet TSR - D&B TSR (Japanese unconsolidated accounts since April 2009).
The combined industrial company dataset contains standardized and as reported financials, including restated accounts, for up to 30 years on approximately*:
46.181 listed companies (9.942 US, and 36.239 non-US)
4.165 unlisted companies (148 US and 4.017 non-US)
14.390 delisted companies (3.948 US and 10.442 non-US)
FitchRatings provides the bank financials for OSIRIS. This data is collected both from annual reports and government registries offering up to 8 years of financial data for more than 2,400 listed banks, including 1,000 US banks.
Insurance company financials, collected from annual reports and the NAIC, are also provided by FitchRatings and cover up to 20 years of data on about 400 listed insurance companies, 140 of which are from the US.
All financial information is complemented with data from the following sources to make OSIRIS a comprehensive public company research and analysis tool:
Bureau van Dijk Electronic Publishing - Ownership Database
Edgar Online – SEC Filings
Exchange Data International (EDI) - Stock data
FitchRatings – Ratings

OSIRIS Internet - Data Guide
2
FactSet/JCF - Earnings Estimates
Moody’s – Ratings
Reuters - News
Standard and Poor’s - Ratings
* Situation as of November 2010.
Copyright © 2011 Last updated September 2011
OSIRIS inclusion goal
Publicly listed companies
OSIRIS strives to cover all publicly listed companies worldwide. The OSIRIS database is continuously in development in order to achieve this goal. Companies are updated and included on a regular basis.
However there exist several companies with stock listed on the OTC markets and their accounts might be difficult to obtain. There are also new IPO's every day in the world, but note there could be a delay between the actual IPO of a company and the inclusion on OSIRIS because for inclusion we need at least one year financial accounts (these can be pro forma).
Note: A publicly quoted company on OSIRIS is defined as a company with publicly listed equity. This definition could be different from other, broader definitions which might also include companies with listed bonds or other certificates. This definition has an impact on the inclusion criteria for companies on OSIRIS.
Private companies
In addition also some non-listed companies can be found on OSIRIS. There are mainly three reasons for this:
• Mayor private companies when they are primary subsidiaries of publicly listed companies; or in certain cases when private companies were included at special requests of clients.
• Companies with good updating and listed bonds, mainly in Latin America (WVB included them and we decided not to exclude them)
• Companies with LAY before 2000, or even before 1995. These companies existed in the WVB population when OSIRIS was started (these can be non-listed or delisted, it is not known).
Note: We will no longer add unlisted companies at clients' request. This was done in the past, but from now on unlisted companies should be retrieved on Orbis or other BvD products (August 2010)
Delisted companies
OSIRIS main goal is to follow up all publicly listed companies and when a company becomes delisted it will stay on OSIRIS, but is no longer supposed to be updated on OSIRIS.
Note: Korean delisted companies might disappear from the product as delisted companies are not covered by the terms of agreement we have with KIS.
For the definition of a delisted company please go to the glossary in the Appendices.
Applications of Osiris

Introduction to OSIRIS
3
1
Applications of OSIRIS
OSIRIS is an ideal information solution for research and analysis in the following fields:
Corporate Finance
Mergers & Acquisitions
Investment Portfolio Management
Equity Research
Competitive Intelligence
Corporate Treasury
Commercial Lending and Loan Syndication
Tax and Audit
Transfer Pricing
Academia
Copyright © 2011 Last updated September 2011
1
Transfer Pricing
OSIRIS is a unique resource for transfer pricing analyses.
This section of the OSIRIS user guide contains excerpts from a transfer pricing study and demonstrates how OSIRIS can be used to identify and analyze sets of comparable companies. Notes have been added in order to explain the OSIRIS applications.
Copyright © 2011 Last updated September 2011
1
AnFoode: Transfer Pricing Analysis
This study is undertaken in order to establish arm’s length compensation for intra-group supply of tangible products produced by AnFoode* for affiliated companies. The purpose of this report is to develop the transfer pricing documentation necessary to support AnFoode’s intercompany transfer pricing policies and results for the year under analysis. This documentation will be used by AnFoode in satisfying the local tax authority’s annual transfer pricing documentation requirements and should substantially assist AnFoode in the avoidance of a local transfer pricing penalty.
* AnFoode is a non existing company.
Copyright © 2011 Last updated September 2011
1
Background

OSIRIS Internet - Data Guide
4
AnFoode is part of the Parent Company (PC), an international company, which manufactures and sells tangible products. Currently AnFoode is considered to be a pure service entity regarding sales/manufacturing of the PC.
Copyright © 2011 Last updated September 2011
1
Application to AnFoode Transactions
We relied on publicly available electronic sources of company financial data to perform our analysis. Our search focused on manufacturers with similar functions, assets, and risks to AnFoode in the tangible products industry.
We determined the Mark up on Total Costs ratio (MoTC) based on a Transactional Net-Margin Method (TNMM) is the most reliable indicator of the arm’s length profits earned by independent manufacturers and supported our research with this analysis.
Copyright © 2011 Last updated September 2011
1
Methodology
To obtain financial information on independent listed manufacturers similar to AnFoode, Bureau van Dijk Electronic Publishing's OSIRIS database*, which offers financial and basic textual information on listed companies worldwide, has been consulted; relying on the financial information available in this database to be accurate.
To identify possible comparable companies we use one of the codes of the United States Standard Industrial Classification system (US SIC code) which are linked to worldwide companies on OSIRIS. In order to perform this search, we focused on US SIC codes 2047 and 2048 (Dog and cat food manufacturing, and Prepared feeds and feed ingredients for animals and fowls, except dogs and cats manufacturing).
Since the sales affiliates are located and conduct operations throughout the world, no country restrictions were applied. The comparable sample includes worldwide companies.
Search Results
*For this study, which was prepared in 2006, we searched the December 2006 update of OSIRIS on DVD.
Copyright © 2011 Last updated September 2011
1
Search Results
Initially, OSIRIS (DVD) was searched, locating a total of 22 companies satisfying the selected US SIC code, independent company and full text search criteria (shown below).

Introduction to OSIRIS
5
* All companies with the keywords “design…” (as well as all derivatives of the words) in the English trade description were eliminated. This was done using the Boolean search logic.
This resulting list of the 22 companies was manually reviewed by formatting a list on OSIRIS to include Operating Rev./Turnover and Operating P/L for three years 2003-2005 and the companies' business descriptions (shown below).
This screening resulted in an exclusion of 5 companies for the following reasons:
1. 4 companies were eliminated for having an average negative result over the financial years 2003, 2004 and 2005.
2. 1 company was eliminated for having less than two years of data between 2003, 2004, and 2005.
These companies were removed from the set of 22 by marking and deleting the marked companies from the list view. The 17 remaining companies comprise the final refined sample of comparables located in various worldwide countries.

OSIRIS Internet - Data Guide
6
The business descriptions for the refined set of 17 comparable companies (below) were exported to spreadsheet from a user-formatted list on OSIRIS.
COMPARABLE COMPANY BUSINESS DESCRIPTIONS
Company name Country Summary business description
ALANHERI NV NETHERLANDS ALANHERI embodies a holding company, incorporated in the Netherlands and a number of internationally active subsidiaries which operate from the Netherlands, South Africa and Switzerland. The Group trades worldwide in cereals, various seeds, pulses, rice, dried fruits, dehydrated vegetables, spices, edible nuts, bakery ingredients, pet food, birdfeed and animal health & care products. In the Netherlands, ALANHERI manufactures birdfeed and pet food and in South Africa processes, packages, distributes and trades beans, rice, and dried fruits.
CHAROEN POKPHAND ENTERPRISE (TAIWAN) COMPANY LIMITED
TAIWAN The main activity of the Company is the manufacture and sale of animal feeds. It further operates chicken and pig farms and processes meat products.
CHAROEN POKPHAND FOODS PUBLIC COMPANY LIMITED
THAILAND The principal operations in our livestock business involves chicken, swine and table duck, with main activities comprising feed production and distribution, animal farming and meat processing. In the aquaculture business, operations comprise mainly shrimp feed production and distribution, and shrimp processing.
CHUBU SHIRYO CO LTD JAPAN Chubu Shiryo manufactuers feedstuff and diversifying into peripheral businesses, such as manure processing machine sales, organic compound fertilizers and stock raising.

Introduction to OSIRIS
7
DEL MONTE FOODS COMPANY
UNITED STATES OF AMERICA
Del Monte Foods Company and its subsidiaries (Del Monte) is a producer, distributor and marketer of branded food and pet products for the United States retail market. The segments in which the Company operates include The Consumer Products segment and The Pet Products segment. The Consumer Products segment includes the Del Monte Brands and StarKist Seafood operating segments, which manufacture, market and sell branded and private-label, shelf-stable products, including fruit, vegetable, tomato, broth and tuna products. The Pet Products segment includes the Pet Products operating segment, which manufactures, markets and sells branded and private-label dry and wet pet food and pet snacks. Its food brands include Del Monte, StarKist, Contadina, S&W, College Inn and other brand names, and the Company's pet food and pet snacks brands include 9Lives, Kibbles 'n Bits, Pup-Peroni, Snausages, Pounce and other brand names. It also produces private-label food and pet products.
GREATWALL ENTERPRISE TAIWAN The Company principle activities are manufacturer of feedstuff, edible oil & chicken.
KYODO SHIRYO CO LTD JAPAN Company is a major manufacturer of cattle, poultry and hog feeds, also produces and markets meats and eggs.
KYUNG CHUK CO.,LTD KOREA REPUBLIC OF
Earning growth slumped due to a cut in product price and fierce market competition. Operating profit and net income surged thanks to improved profitability and cost reduction. Financial status remained solid and the company takes up 9.5 percent of the market in southeastern region of the nation. Fiercer competition and price cuts in mixed feeds eroded its sales in spite of the overall improvement in the number of chicken rearing. Amid the overall price cut and fierce market competition, it is hard to predict a bright outlook for its business conditions. In spite of an additional cut in product price, profitability is expected to improve thanks to strong won and decrease in prices of imported raw materials. Synergy effect is expected if the company's efforts to take over Korea Ind. pays off. The company currently joins the bidding process.
LEE FEED MILL PCL THAILAND Lee Feed Mill Co Ltd principal activities are (1) the manufacturer of animal feed (2) crop drying, silo business and the distribution of raw materials for animal feed manufacture (3) day-old chicken farming, and (4) experimental farming.
MENU FOODS INCOME FUND
CANADA The Fund was created to hold directly or indirectly, investmemts in entities engaged in the manufacture and sale of pet food products, including that of Menu Foods Limited.
NIPPON FORMULA FEED MFG CO LTD
JAPAN Nippon Formula Feed MFG is a medium size manufacturer of all types of feed, with poultry feed as mainline.
NOSAN CORPORATION JAPAN Company is an integrated feed producer and is the largest among the non-Zenno group.
PT JAPFA COMFEED INDONESIA TBK
INDONESIA PT Japfa Comfeed Indonesia's principal activities comprise: Processing all kinds of materials for the manufacture/production of animal fodder; Breeding, poultry, and other farms.
RIDLEY CORPORATION LIMITED
AUSTRALIA The Company is in the business of stockfeed milling, production of crude salt, salt refining and marketing and rural products and services.
SIN HENG CHAN (MALAYA) BHD
MALAYSIA The Company is principally involved in the business of manufacturing and trading of formulated animal feeds and trading of formulated mineral poultry products.
SUNJIN CO.,LTD. KOREA REPUBLIC OF
Sales increased on a rise in sales of feed grains, but its meat business remained in a slump. Its operating income ratio stood at over 8% on expanded sales networks. Financial status remained stable on low debt and increased cash reserves. Sales are expected to increased on rising demand for meats, although its feed grains business is unlikely to improve. Profitability is unlikely to improve on a rise in prices of raw materials such as soy beans and wheat's. The company plans to establish a plant that can produce 100,000 tons of feed grains in China.
UNICHARM PETCARE CORPORATION
JAPAN Production and marketing of Pet Food and Pet Toiletry
Financial Analysis

OSIRIS Internet - Data Guide
8
Copyright © 2011 Last updated September 2011
1
Financial Analysis
The financial ratio used in this analysis is the Mark-up on total cost (“MoTC”) [Operating P/L Total Costs]. The MoTC is typically used when evaluating the profitability of manufacturing entities. Total Costs was calculated by subtracting Operating P/L from Operating Rev./Turnover. Both Total Costs and MoTC were entered directly into OSIRIS as User Defined Variables. These figures were then available for use in company reports, lists, peer analyses and exports.
A presentation of the set of comparable companies’ financial data, including 3 years of data and four variables, was made using the Group Report feature on OSIRIS. This chart was later exported to an Excel spreadsheet.
The OECD “Transfer Pricing Guidelines for Multinational Enterprises and Tax Administrations” (1995) advocate the use of multiple year data analysis. Based on this recommended weighted average method, we calculated the MoTC for the most recent three years for which complete data was available (2003, 2004, 2005) and a three year weighted average for each company was determined. The median interquartile ranges were then calculated for MoTC using the individual sample companies’ three year weighted averages.
This calculation was based on the refined sample of 17 companies using the User Defined Variables and OSIRIS data exported to spreadsheet for customized analysis.
Analysis Result
Copyright © 2011 Last updated September 2011
1

Introduction to OSIRIS
9
Analysis Result
The summary table below presents 2003, 2004, 2005 and 3-year average MoTC results for the AnFoode sample. The 17 companies in the sample exhibited a weighted average interquartile range for the MoTC of 2,44% to 7,36% with a median of 4,32%.
OPERATING P/L / TOTAL COSTS
Weighted Average 2005 2004 2003
COUNT 17 17 17 15 MEDIAN 4,32 4,07 3,14 3,37 UPPER IQ 7,36 8,50 6,58 5,50 LOWER IQ 2,44 2,21 1,51 1,60
MAX 12,10 12,66 14,32 13,78 MIN 0,07 -1,39 -0,25 -2,16
Conclusion
Copyright © 2011 Last updated September 2011
1
Conclusion
With OSIRIS a relevant group of comparable companies within the appropriate industry can easily be defined. The necessary financial data can then be isolated and analyzed by applying such OSIRIS software features as the List, User Defined Variable, Format, Group Report, and Export.
Using OSIRIS for worldwide Transfer Pricing studies provides a solid foundation for creating and presenting a benchmark to the tax authorities, and aids in receiving a favourable ruling for the client company.
Click here to download the PDF version
Copyright © 2011 Last updated September 2011
Configuration Requirements
The following hardware configuration is required for a smooth use:
Processor Pentium 266 Mhz or higher
Operating System Windows 2000, XP or Vista
Screen SVGA
Memory 256 Mb RAM
Browser Internet Explorer 6 or Netscape 8 or Firefox 1.5
However, Bureau van Dijk Electronic Publishing recommends the following system specifications:
Processor Pentium IV
Operating System Windows 2000, XP or Vista
Screen SVGA

OSIRIS Internet - Data Guide
10
Memory 512 Mb RAM
Browser Internet Explorer 6or higher
1
User Support
Bureau van Dijk offers all users full support for both data and technical questions. For assistance, please visit our client support website or contact your account manager or the nearest Bureau van Dijk Electronic Publishing office:
Location Email Help Line Telephone Number
Office Manager
Amsterdam [email protected] +31 20 5400 110 Wessels, Mark
Bahrain [email protected] +973 17 570 406 Costers, Paul
Beijing [email protected] +86 10 8515 2255 Wu, Leo
Bratislava [email protected] + 421 (2) 682 86 760 Cevela, Rudolf
Brussels [email protected] + 32 2 639 06 06 Van de Walle, Christophe
Copenhagen [email protected] + 45 33 4545 20 Klentz, Michael
Edinburgh [email protected] + 44 131 200 7110 Walker, Harry
Frankfurt [email protected] + 49 (69) 96 36 65 - 0 Schwerzel, Mark
Geneva [email protected] + 41 22 830 05 44 Lescroart, Philippe
Lisbon [email protected] + 351 21 321 01 55 Bouchet, Rein
London [email protected] + 44 20 7549 5050 Pringle, Tony
Madrid [email protected] + 34 91 454 70 98 Bouchet, Rein
Milan [email protected] + 39 02 43 98 22 77 Provenza, Alfredo
Moscow [email protected] + 7 495 681 86 71 Cevela, Rudolf
New York [email protected] + 1 212 797 3560 Baskind, Tom
Paris [email protected] + 33 1 53 45 46 00 Leray, Vincent
Rome [email protected] + 39 06 85 23 71 Mazza, Fabian
San Francisco
[email protected] + 1 415 773 1107 Cowley, Andrew
Seoul [email protected] + 82 16 9580 0211 Park, Myoungseok
Singapore [email protected] + 65 6325 1230 Soo-Lid, Tan
Sydney [email protected] + 61 (2) 923 82 100 Saad, Alexander
Tokyo [email protected] + 81 3 3580 0561 Wakatsuki, Noboru
Vienna [email protected] + 43 1 606 11 98 Jansa, Emmanuel
Copyright © 2011 Last updated September 2011

11
OSIRIS data in detail
1
OSIRIS Data
Global financial accounting practices vary widely by country, region and industry. Everything from tax issues, legal regulations, government practices, historical, linguistic, and cultural differences impact the presentation of accounts and the requirements for filing corporate accounts worldwide. These differences make the development of a globally comparable database, like OSIRIS, a detailed and complex process.
Bureau van Dijk and its data providers present accounts on OSIRIS in seven templates under the three categories Industrial, Bank and Insurance. This is done to achieve both an accurate presentation of individual company accounts and to offer the opportunity for effective cross-border account analysis and comparison.
Copyright © 2011 Last updated September 2011
1
Data Methodology
Financial data on OSIRIS is presented in three categories and seven templates reflecting the differences in accounting for industrial companies, banks, and insurance firms. Specialized analysts at each information provider have developed the templates and their varying levels of format detail with the goal of retaining data accuracy while also allowing for global comparisons. The seven templates are listed below, under their respective categories:
Industrial Bank Insurance Anglo Banks Life Continental Non-Life Hybrid Composite
In addition, OSIRIS contains five Key Financials, five Key Ratios and a Number of employees figure that are independent of template and valid across country borders and industries.
For all templates, OSIRIS presents financials in a Raw data format and at least two additional levels of standardized formats. The standardized formats visibly link from the Raw data format through the levels of standardized formats with a unique unfolding account presentation, enabling users to easily follow the accounting logic. This account presentation strategy facilitates searching and analytical comparisons between countries and geographic regions, while maintaining a high level of data transparency and accuracy. Presenting accounts according to type of institution and regional practices also helps ensure complete data clarity and accuracy on OSIRIS.
Using standardised formats assists those users primarily concerned with peer group and cross-border study without sacrificing accuracy or detail.
The source of each statement is indicated at the top of each year’s financial data. (i.e. AR indicates Annual Report.) Accounts following IFRS are taken as priority when available; it is then indicated in the financial heading.
Industrial Financials
The industrial financials on OSIRIS from World’Vest Base, Reuters/Multex, KIS, and D&B TSR are collected through direct company contact and directly from the original annual reports issued by the companies.

OSIRIS Internet - Data Guide
12
The as reported data is entered into an OSIRIS Raw data format that represents the companies’ country-specific and regional accounting standards. The regional accounting practices are retained with the use of the Anglo, Hybrid and Continental templates, which present differing Spreadsheet formats. Accuracy is retained in the Global detailed and Global formats as the accounts are further condensed and the format presentations are synchronized across the three industrial templates.
The Anglo template is mostly used for American, English and Nordic companies, while the Continental template is mostly used for European companies, and the Hybrid template is mainly used for Asian and Australian companies. The difference between the three templates is related only to how the accounts are being presented by the company. They do not depend on specific countries or on the accounting practices used for the financial accounts.
The Balance Sheet is the same for all templates. The differences appear in the Income Statement, mainly in items like Cost of Goods Sold, Other Operating Items and Unusual Items. Each template reflects they way items are presented - type of split and level of detail - in the annual report. For instance, European companies frequently report distinctly personnel and social expenses, which is not the case for 'Anglo' companies.
The Hybrid template is, as its name says, a mix between the Anglo template and the Continental template.
E.g. The Continental template has ten more items included in "Other Operating Items", such as 'Personnel Expenses' and 'Social Expenses', than the Hybrid template or Anglo template. The same counts for "Other non Operating/Financial Income/Expenses". While for "Unusual/Exceptional Items" the Anglo template has more sub-items than the Continental template and the Hybrid template.
Bank Financials
Bank financials are compiled by Fitch Ratings analysts primarily from annual reports collected directly from the banks and input into the various Raw data formats. Some countries have more than one Raw data format because of different types of bank specialisation (e.g. Japanese securities houses or U.S. bank holding companies).
The bank account formats used on OSIRIS are the same as those used on the well-known BankScope database.
Insurance Financials
Fitch Ratings collects annual financial statements from the insurance companies for inclusion in OSIRIS, except in the case of US accounts, where the data comes from the statutory statements prepared for the NAIC.
Insurance accounts are presented in separate Life, Non-Life, and Composite templates. The country-specific and regional accounting presentation standards are reflected in the Raw data format level. The Global format is a standard account presentation available for all three templates.
The insurance company formats were designed by analysts at Fitch Ratings and have already been widely used and accepted on the ISIS database.
In addition to these financials, OSIRIS offers some US SEC filings from Edgar Online.
Copyright © 2011 Last updated September 2011
1
Data Quality
OSIRIS data in detail
13
OSIRIS maintains only the highest degree of data quality, with each data provider implementing its own rigorous combination of quality control measures. WVB, Fitch Ratings, Reuters/Multex, and KIS employ expert analysts to manually enter, review, and cross check data with senior analysts, who often perform random audits. Customized software programs scrutinize accounts at all levels for inconsistencies and errors.
Finally, before each OSIRIS update is released to the clients, Bureau van Dijk Electronic Publishing also implements a series of quality control measures to check the software and the data.
Copyright © 2011 Last updated September 2011
1
Data Collection & Updating
Company financials are collected and processed by each of the financial information providers. In addition, Bureau van Dijk Electronic Publishing also collects annual reports.
World’Vest Base procedures
Annual reports are generally obtained directly from the companies. WVB has employees, contractors, and drop off points located in numerous countries around the world. In some countries, such as Australia, South Africa and certain countries in Asia, WVB works with a local party to collect the annual reports.
Reports are collected using WVB’s own program designed to track, monitor and contact companies directly for report collection. Each month, appropriate requests are sent to companies based on various factors including the previous years’ report dates, the update priority and the planned report release date.
When reports are received, companies are processed according to their relevant update priority. Companies included in a global index are processed within 48 hours. For companies in the International Classification Benchmark index, interim data is also collected. Companies in a local index and large market cap stocks outside of the global indexes are processed within 5 working days. Small cap companies are processed in 2-3 weeks.
For further details on annual report filing times by country, please refer to the WVB Filing Times appendix.
More information on the timeliness of updating can be found in the WVB manual which is available in the appendices.
Reuters/Multex procedures
Reuters/Multex provides the accounts of companies which have the obligation to file with the Securities and Exchange Commission (SEC). Reuters/Multex US fundamental information is collected from regulatory filings with the SEC, corporate press releases, and other relevant sources.
In general, company financials are updated within 24 hours of source documents being available to Reuters. Exceptions occur during 'busy periods'. Companies are then updated in a priority order with largest companies or companies with sufficient investor interest being updated first. Preliminary numbers from the company press releases are available on the same day they are announced. For companies about to go public, a complete set of company information is added (from S-1 documents) before the IPO launch. To deliver on the promise of comprehensive, accurate, timely information, Reuters/Multex employs stringent data collection processes, which include:
Every data collection analyst undergoes a rigorous training program.

OSIRIS Internet - Data Guide
14
Numerous automated and manual error checks prevent the entry of suspicious data into the system.
All senior staff is very experienced and reviews all complex or unusual filings.
Independent client audits are conducted to test timeliness and accuracy.
More information on the timeliness of updating can be found in the Reuters manual which is available in the appendices.
Note: Please note that for some OTC companies the updating on OSIRIS can be limited to the years for which the company had the obligation to file with the SEC. Companies getting listed on the OTC may no longer be obliged to file SEC filings and as a consequence, their updating on OSIRIS will appear to be poor.
Edgar Online procedures
EDGAR Online receives all documents filed electronically within seconds of their submission to the SEC.
Fitch Ratings Bank Data procedures
The primary source of bank data on the Fitch Ratings database is the annual reports produced by the entities themselves. The reports are obtained through various methods in order to ensure the greatest timeliness of data capture. The methods used to collect accounts are:
1. Direct correspondence with the entities
2. Internet tracking for released statements
3. Correspondent co-operation (Where clients of the entities mail copies of the annual report direct to Fitch Ratings for spreading.)
For certain countries, the main source of information is the relevant banking association or superintendency. This is the case for countries where regulatory authorities publish full annual report information in electronic or book format. Some of these countries include the US (FDIC and SEC), Japan (MOF) and various South American countries.
Once received, the information from the annual reports is mapped directly to the country or sector-specific input sheet (Raw data) developed by Fitch Ratings. This information is then verified by the Fitch Ratings banking analysts and entered into the Fitch Ratings database. Consistency checks are then performed against each individual statement to ensure the highest quality of data.
The data entry process normally takes up to 5 working days.
Fitch Ratings Insurance Company procedures
Through direct contact with insurance companies and agreements with certain regulatory bodies, Fitch Ratings is able to quickly collect and add accounts to its insurance company database.
Account requests are automatically generated to go out to all insurance companies on the Fitch Ratings database. These are sent just before the anticipated release of the company account. When the reports are received, they are given to an account analyst who keys in the data. After this, the accounts must pass two manual Quality Control checks done by separate analysts. Fitch Ratings strives to complete this data entry process within one week.
Fitch Ratings obtains data feeds from NAIC (National Association of Insurance Commissioners) for the US and Hoppenstedt for Germany. In addition, for some South American countries, where the

OSIRIS data in detail
15
direct sourcing of financial reports is extremely difficult, Fitch Ratings obtains company financial data from recognised government and statutory bodies.
When financial information is derived from a third party, data is matched to data items in the Fitch Ratings country specific templates. Only when the conversion templates are correctly designed will Fitch Ratings import third party data. Various reasonableness and control checks are then performed to ensure that the data is of suitable quality for export into the OSIRIS product.
Korea Information Service procedures
KIS gathers information from multiple sources including the online disclosure system of the Financial Supervisory Service (FSS), credit reports and direct contact. FSS provides KIS the annual auditor’s reports, semi-annual reports reviewed by auditor’s and quarterly reports of Korean companies.
The accuracy of the database is consistently checked by over 100 KIS database management employees who enter, input and verify the corporate information daily.
Within 120 days from fiscal year end, the annual auditor’s reports are entered and available on the system. Semi-annual reports and quarterly reports take at most 60 days. All corporate information is updated at least four times per year.
The agreement we have with KIS indicates that we receive the information on listed companies only for inclusion on Osiris. The delisted Korean companies are not covered by the terms of agreement.
Bureau van Dijk procedures
As Bureau van Dijk collects annual reports for ownership information, it sends them on to the data providers, which serves to assist and supplement their internal collection procedures. In addition, Bureau van Dijk constantly monitors company websites to retrieve annual reports and collects US SEC filings.
Any publicly listed company’s annual report sent to BvD by a client will be processed with priority for inclusion on OSIRIS. Non-listed company reports will also be processed if they satisfy the inclusion criteria for the database.
These reports can be sent to:
Laurent Potty Bureau van Dijk 250 Avenue Louise, mailbox 14 B-1050 Brussels BELGIUM Tel:32 (0)2 639 0606 Email: [email protected]
Copyright © 2011 Last updated September 2011
Account formats
Account Formats
Company accounts on OSIRIS are categorized into seven industrial, bank and insurance templates. Screening of the entire OSIRIS database without considering borders, industries or templates is possible using the Key Financials, Market Capitalisation, Key Ratios, and Number of employees variables common to all templates. These key financials and ratios are :
Key Financials Key Ratios Total Assets Return on Shareholders Funds (%) Shareholders’ Funds Profit Margin (%) Operating Revenue/Turnover Return on Total Assets (%)

OSIRIS Internet - Data Guide
16
P/L before Taxation Current ratio Net Income Solvency ratio (%) Market Capitalisation Price earnings ratio
The industrial, bank and insurance templates each provide account formats in varying levels of detail designed specifically for these three types of institutions. The Global, Global detailed, and Spreadsheet accounts on OSIRIS are outlined, along with data definitions, in the Appendices. A description of the breakdown of each of the seven templates and their formats follows below.
Industrials Template
Cash Flow Statement - Industrial companies
Banks Template
Insurance Template
1
Industrials Template
There are three templates for industrial companies on OSIRIS: Anglo, Hybrid and Continental. These templates are presented in varying levels of detail for each company, using the eight account formats explained below.
Four industrial account formats on OSIRIS are inter-linked, offering users the ability to easily move between the formats for a single company via the software’s unique unfolding interface. These formats are called Global, Global detailed, Spreadsheet, and Raw data.
Two additional formats designed by World’Vest Base are also available for non-US companies and are inter-linked - Analyst-WVB and Master-WVB. These formats will be especially helpful to those users familiar with the standard WVB formats.
Finally, two more formats (combined industrial and utilities companies) developed by Multex are also available and are inter-linked. These Standard-Multex and Company Specific-Multex formats are only available for US industrial company accounts.

OSIRIS data in detail
17
Please note that only financial line items from the Global, Global detailed, and Spreadsheet formats are available in the search feature for screening the OSIRIS database.
Global
This is the most general, international format on OSIRIS. The presentation of the Global format is the same for all industrial companies regardless of template. Searching across all industrial companies is possible using the financials from this format, enabling reliable cross-border comparisons.
The Global format presents a 24 line Balance Sheet and 20 line Income Statement. The lines of the Global format expand to reveal associated accounts from the more detailed formats, Global detailed and Spreadsheet, and further down to the Raw data.
The line numbers of the Global format are built up following the structure 3xxxx.
Global detailed
This is also an international format that is fully searchable across industrial templates. This format offers more detail than the presentation in the Global format. The Balance Sheet contains 86 lines of data. The Income Statement offers slightly more detail than in the Global format, breaking out items such as Adjustments/ Excise tax, Other revenues, Dividends as well as additional sub-total lines like Earnings Before Interest & Tax.
The financials in this format can also be unfolded to reveal items from the Spreadsheet and the Raw data formats.
The line numbers of the Global detailed format are built up following the structure 13xxx, 2xxxx or 14xxx.
Spreadsheet
The Spreadsheet format is representative of the three differing accounting theories that makeup the three industrial templates: Anglo, Continental and Hybrid.
The Spreadsheet offers much the same information as the Global detailed format, but the differing presentations in three templates allows for more detail to appear in the Income Statement under Other Operating Items, Other Non-operating/ Financial Income or Expenses, and Other. Memo line items and Supplementary Data are now visible as well.
The Balance Sheet detail has the same 86-line format in all three templates. However, the Income Statement presents differing amounts of data in each template with 34 lines in the Anglo template, 37 lines in the Continental and 36 lines in the Hybrid.
Line items in this format can be opened up to reveal the detailed Raw data.
The line numbers of the Spreadsheet format are built up following the structure 13xxx, 2xxxx or 14xxx.
Raw data
This format offers the most detail available, having been taken from the annual reports of the companies. It is considered ‘as reported’ and contains the same information as the Master-WVB format, but presented in a different order. The detail under Supplementary Data is finally available in the Raw data format.
Users will only have access to the Raw data level of detail if they have a premium subscription.

OSIRIS Internet - Data Guide
18
The line numbers of the Raw data format are built up following the structure 10xxx. Lines with structure 2xxxx, 13xxx, and 14xxx are those from the Global detailed or Spreadsheet format.
Analyst-WVB
This is, in fact, the Analyst format created by World'Vest Base. Analyst-WVB retains the presentation of local accounting methods (anglo, hybrid, continental) and is available for non-US company financials. It is slightly less detailed than the Spreadsheet level format.
The line numbers of the Analyst-WVB format are built up following the structure 13xxx or 14xxx.
Master-WVB
This is the most detailed format created by World’Vest Base, containing as reported and restated data directly from non-US company annual reports. The data in this format is the same as the Raw data format, but presented in a different arrangement.
The line numbers of the Master-WVB format are built up following the structure 10xxx.
Only users with a premium subscription have access to this format.
Standard- Multex
This is the same as the standard Multex account format already familiar to many Multex users. It provides a similar level of detail as the Spreadsheet format for US companies.
Each item of the Standard Multex format is assigned a COA (Chart of Accounts) code, which is a three to four letter combination which might be followed by one or two numbers.
Company Specific - Multex
The Company Specific – Multex format presents the most detailed account format available on OSIRIS. It is the OSIRIS format available for US companies that most closely matches the as reported financials, with line item labels appearing precisely as they are filed by the companies.
Each item of the Company Specific Multex format is assigned a COA (Chart of Accounts) code, which is a three to four letter combination which might be followed by one or two numbers.
Only users with premium subscriptions have access to this format.
Copyright © 2011 Last updated September 2011
Cash Flow Statement - Industrial companies
The Cash Flow statement is part of the yearly set of accounts published by a company. The source is similar to what is used for the balance sheet or income statement. The Cash Flow statement is specific to industrial companies; it is not available for banks and insurance companies.
The presentation of the CF statement varies considerably amongst the countries and the companies within a country, except the U.S. where it is rather standardised.
• For U.S. companies and additional accounts of non-U.S. companies sourced from Reuters OSIRIS presents a standard Cash Flow Statement which can be unfolded into 'as reported' items.

OSIRIS data in detail
19
• For non-U.S. companies, we present two CF statements in OSIRIS: a standard Cash Flow Statement and a WVB Detailed CF Format.
WVB Detailed CF Format
In the WVB Detailed CF Format section the 'as reported' CF statement is provided. These figures are sourced from the actual Cash Flow statement of the company and are as reported in the annual report. The CF statement is done by the company using items which are not all disclosed in the balance sheet or income statement from the annual report, therefore can not be easily recalculated on the basis of the balance sheet and the income statement.
The line numbers of the WVB Detailed CF Format are built up following the structure 16xxx.
Cash Flow Statement
The standard Cash Flow Statement has been designed as a compromise due to the wide diversity of Cash Flow statements outside the U.S. which makes it difficult to create a standard Cash Flow statement based on the 'as reported' CF statements.
Previously the standard Cash Flow Statements were calculated by WVB on the basis of the figures from the income statement and the balance sheet. As a consequence, the figures did not systematically reconcile with the Cash Flow statement from the annual report and were not available for years which have been restated.
Since May 2008 a new set of formulas is used in order to derive the standard CF from the Detailed CF statements. The figures in the standard CF statements now completely match the Detailed Cash Flow statements and can be reconciled more easily with annual reports.
The line numbers of the Cash Flow Statement are built up following the structure 15xxx.
Banks Template
For the bank data on OSIRIS, accounts are available in three main formats: Global, Global detailed and Raw data.
Global format [*]
This is the most general bank format available on OSIRIS, enabling cross-border searching on a completely standardized account format. The Global format contains 37 line items, including 9 memo lines. The Global format can be used for searching all banks on OSIRIS.
Global detailed format [**]
This format provides more detail while retaining a globally comparable structure of 145 lines (51 lines for the Assets, 42 lines for the Liabilities & equity, 37 lines for the

OSIRIS Internet - Data Guide
20
Income Statement and 15 lines of Notes) with more financials for searching and analysis compared with the Global format. The line items in Global detailed can be opened to show the related information from Raw data format.
Raw data format
The Raw data for banks on OSIRIS offers the complete detail from the bank’s annual report. This information is shown in one of multiple country-specific Raw data models used on OSIRIS; many countries are associated with more than one model reflecting varying account presentations. Each bank is presented in the model best corresponding to its annual report presentation. As with the Industrials template, Raw data items cannot be searched.
Access to the Raw data is available to premium subscribers.
The line numbers of the three formats are built up following the structure 4xxxx.
[*]This is equivalent to the Global Summary format on BANKSCOPE.
[**] This is equivalent to the Global Detailed format on BANKSCOPE.
Insurance Template
There are three templates for insurance companies on OSIRIS: Life, Non-Life and Composite. Each insurance company is included only once in OSIRIS, in the template that corresponds to its primary insurance activity.
The insurance companies in each template are presented in three levels of format detail - Global, Global detailed and Raw data. The Global format has been developed for users interested in comprehensive insurance searching and screening. The Global detailed and Raw data formats provide more detailed data and reflect the differences in the three types of insuring entities according their associated templates.
Global Format
This is an international format relevant to all insurance companies, irrespective of the template. The Global format contains the key financials of the firm and provides a format for screening across all insurance companies on OSIRIS. The line items from the Global format can be opened up to reveal their Global detailed and Raw data components for a company.

OSIRIS data in detail
21
Global detailed format [*]
This is a transnational format presented in standard Life, Non-Life and Composite templates. Each of the Global detailed formats offers more financial information than the Global format: a 76-line statement in Life template, 67 in the Non-Life and 77 lines in the Composite templates.
The Global detailed format also unfolds to reveal the more specific Raw data format items related to it.
Raw data format [**]
The Raw data format is the basic accounting format derived from the ‘as reported’ financial accounts of a company. Given this, the Raw data format is developed as a country specific format and is presented in models reflecting the accounting practices of the associated countries. There are approximately 30 models, each model being associated to one or several countries.
As in the Global detailed format, the user can expect to see each of these models presented in accordance with the three insurance templates.
The line numbers of the three formats are built up following the structure 2xxxxx.
[*] This is equivalent to the International format on ISIS. [**] This is equivalent to the National format on ISIS.
Status of the company
This refers to the trading status of the company and includes the following cases on OSIRIS:
• Active: the company is active
• Active, no longer with accounts on OSIRIS: it is also possible a company is still active, though its accounts are no longer updated on OSIRIS following an acquisition by another company with accounts on OSIRIS integrating the accounts of its subsidiary in its consolidated accounts; or because the company became privately held and has been delisted.
• Active (receivership): the company remains active, though is in administration or receivership (US - Chapter 11)
• Bankruptcy: the company no longer exists because it has ceased its activities since it is in the process of bankruptcy.
• Dissolved: the company no longer exists as a legal entity, but the reason for this is not precised.
• Dissolved (merger): the company no longer exists as a legal entity because the company has been included in a merger.
• Dissolved (demerger): the company no longer exists as a legal entity, the reason for this is a demerger - the company has been "split".
• In liquidation: the company no longer exists because it has ceased its activities, since it is in the process of liquidation.
• Inactive: the company is no longer active and the precise reason for inactivity is unknown.
When a company has been delisted, text in the header of the company report indicates the reason for delisting whenever possible.
Activity Classification
The main purpose of an activity classification is to classify productive economic activities. The aim is to provide a set of activity categories that can be used when dissecting statistics according to such activities. There exist several activity classifications. The ones presented in OSIRIS* are as follows:

OSIRIS Internet - Data Guide
22
• GICS codes (Global Industry Classification Standard): The Global Industry Classification Standard (GICS) was developed by Morgan Stanley Capital International (MSCI) and Standard & Poor's in 1999. The GICS methodology is widely accepted as an industry analysis framework for investment research, portfolio management and asset allocation. The GICS is presented as a 'market-oriented' (rather than a production-oriented) classification system. The GICS structure consists of 10 sectors, 24 industry groups, 67 industries and 147 sub-industries.
There was a revision of the GIGS in August 2008 and an update has been done accordingly on our products.
• Financial Times Industry Class: Activity classification system used by The Financial Times.
• US SIC codes: The SIC (Standard Industrial Classification) codes were used since the 1930s and have been revised periodically to reflect changes in the economic structure of the United States. The US SIC was last revised in 1987; however the overall structure of the SIC remained essentially unchanged since the first version.
• NAICS codes: In 1997 the NAICS (North American Industry Classification System) were introduced. The NAICS reflects the structure of today's economy in the United States, Canada, and Mexico, including the emergence and growth of the service sector and new and advanced technologies. In 2002 there was a revision of the NAICS 1997. The NAICS 2002 is the same as the NAICS 1997 for fourteen of the twenty sectors. Construction and wholesale trade are substantially changed, but the revisions also modify a number of retail classifications and the organization of the information sector. Very minor boundary adjustments affect administrative and support services and mining. More recently the NAICS 2002 were replaced by the NAICS 2007. This update is available on OSIRIS since the end of 2008. There are some minor changes between the two versions. NAICS 2007 is exactly the same as NAICS 2002 for thirteen of the twenty sectors. There was restructuring within part of the information sector. Industry changes affect the boundaries of three sectors.
• NACE codes: The NACE codes make up an official European list of activity classifications. The NACE Rev. 1.1 is a revision of the NACE Rev. 1 and is imposed by regulation to all member states of the EU. The NACE Rev. 1.1 has been the official industrial classification in all EU member states as from 2003. From then onwards the European countries derived a national code. In 2008, the NACE Rev.2, a new version of the European industrial activity classification has come into use. The NACE Rev.2 classification incorporates significant changes from NACE Rev 1.1. The changes are occurring at every level of the classification and will introduce new sectors for 'Water Supply, Sewage, Waste Management and Remediation', 'Information and Communication', 'Arts, Entertainment and Recreation'. In order for a smooth transition both NACE Rev 1.1 and NACE Rev.2 are kept in parallel available on OSIRIS.
* Before 2009 we also used to have the ICB (Industry Classification Benchmark) classification set by Dow Jones and FTSE in which companies are classified by lines of businesses.
Core Code
Each company is assigned one core code which reflects the core activity of the company in each of the available industry classifications, a three-digit code for the US SIC and a four-digit code for the NACE rev. 1.1 and NAICS.
The primary and secondary codes go down to the lowest possible level in each classification four digits for the US SIC and NACE Rev.2 and 6 digits for the NAICS.
Cross Referencing

OSIRIS data in detail
23
In order to get the equivalent of the codes from different classification systems the Cross Referencing function can be used on OSIRIS. All the codes we receive and all codes derived from cross referencing are being validated by our activity classifications specialist at BvD.
Allocation of codes and quality control by BvD
Industry codes are assigned to companies in a few different ways.
• In most countries, companies are assigned one or more industry codes when they register with their appropriate government office. This is the case in France, Belgium, The Netherlands, Spain, and Italy for example.
• In other cases, the information providers assign industry codes to companies as they collect company data. These codes may be determined by contacting companies by telephone, personal visits, etc. Luxembourg and Japan are examples where the information providers assign the codes.
• In still other cases, the companies are required by law to correct or allocate their own industry codes.
• In addition BvD manually and automatically allocates industry codes for the companies present on OSIRIS.
The Industry codes assigned to companies are verified and added or corrected if necessary by a BvD activity codes specialist. The Business description as received from the IP and also information on the Internet is used to allocate or approve the industry codes.
If only general information about the company can be found, a general code will be allocated.
For a holding, if we know the business of the company, the primary code is the activity in which the company operates, and the holding appears as a secondary code.
For a company that manufactures and sells, we put manufacturing as primary code and the selling activity as secondary code.
On OSIRIS we present the most recent industry codes for the company, as apply for the current activities of the company. To track historical industry codes, the historical OSRIS DVD’s can be consulted.
Account Header
In the header of the financial accounts seven to nine types of information can be found:
• Consolidation
• Closing date
• Quarter number
• Number of months
• Audit status
• Currency of the statement and statement unit
• Source
• Exchange rate from local currency
• Accounting standard
Consolidation
All possible consolidation types in OSIRIS are listed below with the label they have in OSIRIS and their explanation:

OSIRIS Internet - Data Guide
24
OSIRIS Label
Explanation
Cons Consolidated accounts
Cons (C) Consolidated reclassified or corrected
Cons (R) Consolidated restated
Cons (S) Consolidated summary accounts
Prelim (C) Consolidated with preliminary data
Prelim (R) Consolidated with restated preliminary data
Prelim (U) Unconsolidated with preliminary data
Pro Forma Consolidated Pro Forma accounts
Unc Unconsolidated accounts
Unc (C) Unconsolidated reclassified
Unc (R) Unconsolidated restated
Unc (S) Unconsolidated summary accounts
• Pro Forma: sometimes a company has not yet released its official, completed annual figures but do already release some pro forma figures. A pro forma document is provided in advance of an actual transaction. Such a document serves as a model for the actual documents of the transactions. For example, when a new corporation is envisioned, its founders may prepare a business plan containing pro forma financial statements, such as projected cash flows and income statements.
• The difference between restated and reclassified accounts can be defined as follows:
- Reclassified: this can occur when, for instance, the company's auditor or accounting department discover that an item such as cost of revenue or accounts payable has been classified incorrectly. Reclassifications will generally change the breakdown within the major number, but leave the bottom lines, such as Net Income, Total Assets or Total Change in Cash unchanged.
- Restated: this can occur, when for instance: an acquisition is made using the pooling-of-interest method of accounting; a sale of a division or a business (which would be accounted for as discontinued operations); a change in the company's accounting policies; there were errors in reporting procedures or in previously reported financials. Restatements will result in a change in the bottom line numbers - revenue, net income, total assets, net change in cash, etc.
Please note reclassification and restatement of accounts are initiated by the company who changes the presentation and/or the content of its accounts. These are not operations carried out by Bureau van Dijk Electronic Publishing or the information providers contributing to OSIRIS.
Closing date
For annual accounts: the fiscal year end date is not always the same as the calendar year end and every company has determined its own closing date. Most common this is 31 December, 31 March, or 30 June. For details on annual report filing times by country for companies sourced by WVB please refer to the WVB Filing Times appendix.
For interim accounts: the closing dates of the interim accounts usually are 30 September, 31 March, 30 June, or 31 December as they depend on the fiscal year end.
Quarter number
For interim accounts the quarter number is also mentioned in the account header as 'Q' followed by the quarter number. Note that not every quarter number has the same closing date, since the sequence of the quarter closing dates is determined by the company's annual closing date.

OSIRIS data in detail
25
Beware, the quarter number can vary according to the time consistency settings chosen (fiscal or calendar mode). E.g. From a company with a fiscal year end date 30/06, the accounts dated 30/09 are considered Q1 in fiscal mode, while Q3 in calendar mode.
Number of months
The number of months over which the financial accounts report. Annual accounts usually report over twelve months, while interim accounts can report over three, six or nine months. The figures from interim accounts can be shown cumulative (i.e. as the sum of the latest quarter and the previous quarter(s)). The number of months helps identifying this.
Audit status
The audit status indicates the status of a statement with regard to its auditing. The different possibilities and their definitions are as follows:
Search keys Presented in the account header Insurances Industries Banks
Qualified Qualified Qual. Qual.
Unqualified Unqualified Unqual. Unqual.
Unaudited Unaudited Unaudited Unaudited
Adverse opinion Adverse Op.
No opinion Not discl. No opnion Audited
Qualification n.a. Qualif. n.a. Qualif n.a.
Definitions:
• Qualified: the statement has been audited and the report of the auditors presents the accounts with remarks.
• Unqualified: the statement has been audited and the accounts have been accepted by the auditors without any remark.
• Unaudited: the statement has not been audited.
• Adverse opinion: the financial statements are, in the view of the auditor, not in accordance with the stated accounting practice.
• No opinion: there has been no auditor's opinion disclosed or seen by the information provider.
• Qualification not available: there is no auditor's opinion available.
Currency of the statement and statement unit
The currency and the unit in which the financial accounts are expressed.
Note: For the years before the euro was implemented, the data are converted into euro using the official rate as at January 1999, with the IMF as source.
Source
All possible sources for financial accounts in OSIRIS are listed below with the label they have in OSIRIS and their explanation:
Label in the header
Source
REG Regulatory filing filed by the company with the regulatory body in the country
PR NEWS PR Newswire
OSIRIS Internet - Data Guide
26
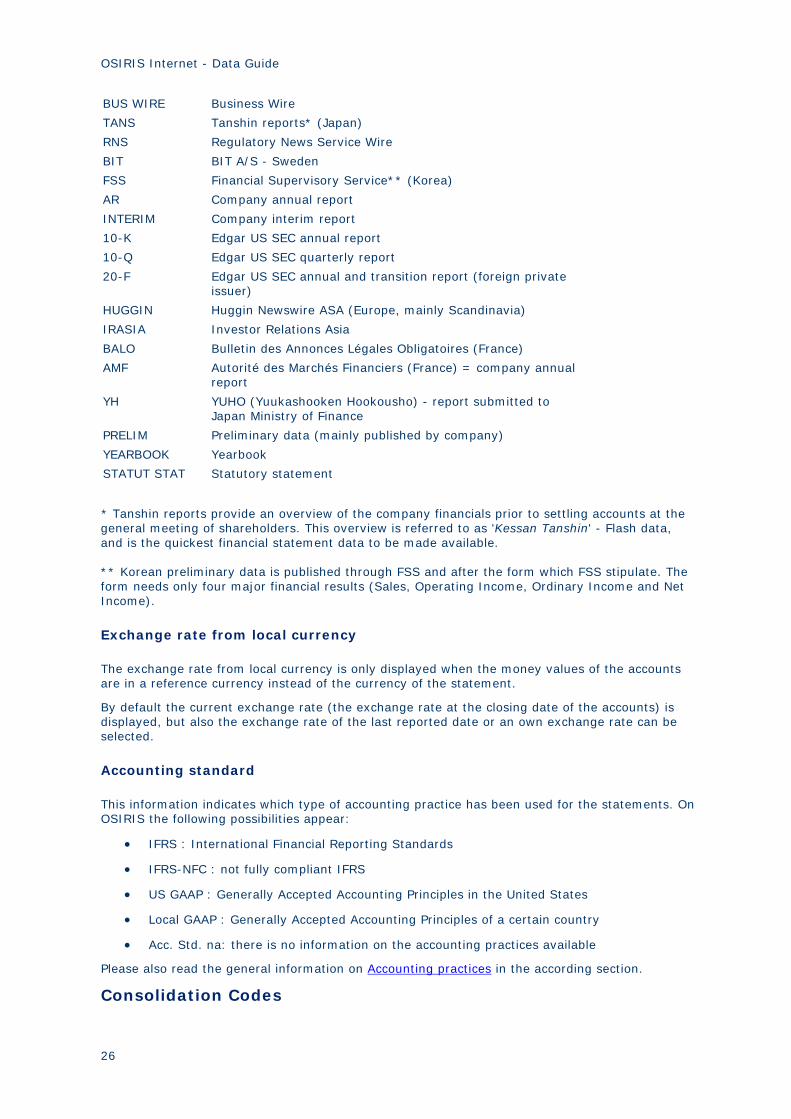
BUS WIRE Business Wire
TANS Tanshin reports* (Japan)
RNS Regulatory News Service Wire
BIT BIT A/S - Sweden
FSS Financial Supervisory Service** (Korea)
AR Company annual report
INTERIM Company interim report
10-K Edgar US SEC annual report
10-Q Edgar US SEC quarterly report
20-F Edgar US SEC annual and transition report (foreign private issuer)
HUGGIN Huggin Newswire ASA (Europe, mainly Scandinavia)
IRASIA Investor Relations Asia
BALO Bulletin des Annonces Légales Obligatoires (France)
AMF Autorité des Marchés Financiers (France) = company annual report
YH YUHO (Yuukashooken Hookousho) - report submitted to Japan Ministry of Finance
PRELIM Preliminary data (mainly published by company)
YEARBOOK Yearbook
STATUT STAT Statutory statement
* Tanshin reports provide an overview of the company financials prior to settling accounts at the general meeting of shareholders. This overview is referred to as 'Kessan Tanshin' - Flash data, and is the quickest financial statement data to be made available. ** Korean preliminary data is published through FSS and after the form which FSS stipulate. The form needs only four major financial results (Sales, Operating Income, Ordinary Income and Net Income).
Exchange rate from local currency
The exchange rate from local currency is only displayed when the money values of the accounts are in a reference currency instead of the currency of the statement.
By default the current exchange rate (the exchange rate at the closing date of the accounts) is displayed, but also the exchange rate of the last reported date or an own exchange rate can be selected.
Accounting standard
This information indicates which type of accounting practice has been used for the statements. On OSIRIS the following possibilities appear:
• IFRS : International Financial Reporting Standards
• IFRS-NFC : not fully compliant IFRS
• US GAAP : Generally Accepted Accounting Principles in the United States
• Local GAAP : Generally Accepted Accounting Principles of a certain country
• Acc. Std. na: there is no information on the accounting practices available
Please also read the general information on Accounting practices in the according section.
Consolidation Codes

OSIRIS data in detail
27
Consolidated Statement
A consolidated statement is the statement of a company integrating the statements of its subsidiaries; the method of integration varies according to the importance of the interest owned by the parent company in its subsidiaries. Such a statement has consolidation code C1 (no unconsolidated companion on OSIRIS) or C2 (there is an unconsolidated companion on OSIRIS).
Unconsolidated Statement
A statement not integrating the possible subsidiaries of the concerned company. Such a statement has a consolidation code U1 (no consolidation companion on OSIRIS) or U2 (there is a consolidated companion on OSIRIS).
Consolidation Codes
A code is assigned to indicate the type of statement available for a company on the database. Both the consolidated and unconsolidated statements can be used to screen the companies on OSIRIS. Four consolidation codes are used:
C1 Consolidated statement with no unconsolidated companion
C2 Consolidated statement with an unconsolidated companion
U1 Unconsolidated statement with no consolidated companion
U2 Unconsolidated statement with a consolidated companion
Accounting Practice
General information
IFRS, the International Financial Reporting Standards, is a set of rules on how companies have to present their annual report. Currently they are issued by the International Accounting Standards Board (IASB).
IAS were issued between 1973 and 2001 by the board of the International Accounting Standards Committe (IASC). In April 2001 the IASB adopted all IAS and continued their development, calling the new standards IFRS.
IFRS replace the IAS standards, which are still valid but have been further developed. A few IFRS standards have also been added. Although IAS are no longer produced, they are still in effect unless replaced by an IFRS, whether in its entirety or partially.
The basis of IFRS is the reporting on basis of 'Fair value', which means reporting on basis of actual values. Reporting on basis of 'Fair value' should give a better image of the actual value of the assets on the balance.
Also more uniformity because of the comparability of the companies is an advantage of IFRS.
All publicly traded EU companies were to prepare their consolidated accounts using IFRS from 1 January 2005 onwards. Prior to 2005 there were already around 350 publicly listed companies that used IFRS.
IFRS instead of local GAAP are used in many parts of the world, including the European Union, Russia, South Africa, Hong Kong, Australia, and Singapore.
The largest capital market remaining with its own standards is the US. The United States Securities and Exchange Commission requires all overseas companies listed in the US to prepare their results either under US GAAP or according to their local requirements with a footnote reconciling their local GAAP to US GAAP. This imposes considerable expense on companies which are listed on exchanges both in the US and another country.
(Source: Wikipedia encyclopedia)

OSIRIS Internet - Data Guide
28
Accounting practice on OSIRIS
The accounting practice displayed in the account header is done on the basis of the accounts released by the companies. On OSIRIS we privilege the IFRS accounts when available. However, IFRS accounts are possible not available for all years available for a company, and we have decided to display all years - regardless of the accounting practice - in one and the same report. This can lead to different accounting practices to appear for different years, but makes it also possible to keep the historical accounts available in the report.
For industrial companies the same model is used for IFRS accounts as for accounts with other accounting practices (Please note this is not so for banks and therefore in Raw Data format only IFRS account are displayed if available; in the more global formats historical accounts are available as well). It is the way the figures are coded in the model which can differ according the accounting practice used and will reflect the information from the source document.
Note: Information on the accounting practice of a statement can be found in the Account header or under 'Accounting practices' in the section 'Financials & Ratios' of the company report.
Geographic Location
Companies can be searched by selecting various regions and economic areas including. Two main types of regions can be distinguished:
1. Geographical world regions
North America, Western Europe, Eastern Europe, Middle East, Far East and Central Asia, South and Central America, Africa Oceania. These different groups are mutually exclusive i.e . one same country is assigned to one specific geographical region. In addition the following sub-geographical regions are also available: Scandinavia, Baltic States, Nordic States and Balkan States.
2. Political world regions
OECD, European Union, European union enlarged, Euro Area, G8, NAFTA, EFTA, ASEAN, GCC and MENA. These groups are not mutually exclusive, i.e. one same country can belong to more than one political region.
3. The different regions comprise the following countries:
Africa This region includes companies from the following 53 countries: Algeria, Angola, Benin, Botswana, Burkina Faso, Burundi, Cameroon, Cape Verde, Central African Republic, Chad, Comoros, Congo, The Democratic Republic of the Congo, Cote d'Ivoire, Djibouti, Egypt, Equatorial Guinea, Eritrea, Ethiopia, Gabon, Gambia, Ghana, Guinea, Guinea-Bissau, Kenya, Lesotho, Liberia, Libyan Arab Jamahiriya, Madagascar, Malawi, Mali, Mauritania, Mauritius, Morocco, Mozambique, Namibia, Niger, Nigeria, Rwanda, Sao Tome and Principe, Senegal, Seychelles, Sierra Leone, Somalia, South Africa, Sudan, Swaziland, Tanzania, Togo, Tunisia, Uganda, Zambia, and Zimbabwe.
ASEAN Region This region includes companies from the following 10 countries: Indonesia, Malaysia, Philippines, Singapore, Thailand, Brunei Darussalam, Vietnam, Laos, Myanmar and Cambodia.
Baltic States This region includes Latvia, Lithuania and Estonia

OSIRIS data in detail
29
Balkan States This region includes Greece, Albania, Bosnia and Herzegovina, Bulgaria, Croatia, Macedonia, Romania, Slovenia, Serbia and Montenegro.
Eastern Europe This is a region made up of the following 19 countries: Albania, Belarus, Bosnia and Herzegovina, Bulgaria, Croatia, Czech Republic, Estonia, Hungary, Latvia, Lithuania, Macedonia, Moldova, Poland, Romania, Russian Federation, Serbia and Montenegro, Slovakia, Slovenia, Ukraine.
EFTA The European Free Trade Association includes the following countries: Switzerland, Iceland, Liechtenstein and Norway
Euro Area This region includes 15 of the EU countries: Austria, Belgium, Cyprus, Ireland (Eire), Finland, France, Germany, Greece, Italy, Luxembourg, Malta, Slovenia, The Netherlands, Portugal and Spain.
Europe (Excl. Eastern Europe) also called Western Europe Europe includes the following 26 countries and non-sovereign territories on OSIRIS: the 15 EU countries, Andorra, Cyprus, Gibraltar, Iceland, Liechtenstein, Malta, Monaco, Norway, San Marino, Switzerland and Turkey.
European Union (EU - 15) The European Union, founded in 1957 between six countries and included till 2004 the following 15 countries: Austria, Belgium, Denmark, Ireland (Eire), Finland, France, Germany, Greece, Italy, Luxembourg, The Netherlands, Portugal, Spain, Sweden, and the United Kingdom.
European Union, enlarged (EU 27) The EU has grown in size with successive waves of accessions and includes at present the following countries: Austria, Belgium, Bulgaria, Denmark, Ireland (Eire), Finland, France, Germany, Greece, Italy, Luxembourg, The Netherlands, Portugal, Spain, Sweden, the United Kingdom, Cyprus, the Czech Republic, Estonia, Hungary, Latvia, Lithuania, Malta, Poland, Romania, Slovakia and Slovenia .
Far East and Central Asia This region is comprised of the following 34 countries and non-sovereign territories on OSIRIS : Afghanistan, Armenia, Azerbaijan, Bangladesh, Bhutan, Brunei Darussalam, Cambodia, China, Georgia, Hong Kong, India, Indonesia, Japan, Kazakhstan, Korea DPR, Republic of Korea, Kyrgyzstan, Laos, Macao, Malaysia, Maldives, Mongolia, Myanmar, Nepal, Pakistan, Philippines, Singapore, Sri Lanka, Taiwan, Tajikistan, Thailand, Turkmenistan, Uzbekistan and Vietnam.
Group of Seven (G8) The Group of eight includes the USA, Canada, Japan, UK, France, Italy, Germany and Russia Federation.
Gulf Cooperation Council (GCC) Made up of six countries: Saudi Arabia, Kuwait, Bahrain, Qatar, the United Arab Emirates, the Sultanate of Oman.
Middle East This region is made of the following 14 countries: Bahrain, Iran, Iraq, Israel, Jordan, Kuwait, Lebanon, Oman, Palestinian Territory, Qatar, Saudi Arabia, Syrian Arab Republic, United Arab Emirates and Yemen.
Middle East and North Africa (MENA) Includes 20 countries, according to the World Bank: Algeria, Bahrain, Djibouti, Egypt, Iran, Iraq, Israel, Jordan, Kuwait, Lebanon, Lybia, Morroco, Oman, Palestinian Territories, Qatar, Saudi Arabia, Syria, Tunisia, United Arab Emirates, and Yemen.
NAFTA The North America Free Trade Agreement (NAFTA) is a region made of the following countries: USA, Canada and Mexico.

OSIRIS Internet - Data Guide
30
Nordic states This region includes the following European countries: Denmark, Estonia, Finland, Iceland, Latvia, Lithuania, Norway and Sweden.
North America This region includes the USA and Canada.
Oceania The 15 countries in this region are Australia, Timor Leste, Fiji, Kiribati, Marshall Islands, Micronesia Federated States, Nauru, New Zealand, Palau, Papua New Guinea, Samoa, Solomon Islands, Tonga, Tuvalu and Vanuatu.
OECD This region includes the 34 members of the OECD: USA, Canada, Austria, Belgium, Chile, Denmark, Estonia, Finland, France, Germany, Greece, Iceland, Ireland, Israel, Italy, Luxembourg, Netherlands, Norway, Portugal, Spain, Sweden, Switzerland, Turkey, United Kingdom, Czech Republic, Hungary, Poland, Slovakia, Slovenia, Japan, Korea, Mexico, New Zealand and Australia.
Scandinavia This region includes the following European countries: Finland, Norway, Sweden and Denmark.
South and Central America This region contains the following 39 countries and non-sovereign territories: Bermuda, Cayman Islands, Anguilla, Antigua and Barbuda, Argentina, Aruba, Bahamas, Barbados, Belize, Bolivia, Brazil, British Virgin Islands, Chile, Colombia, Costa Rica, Cuba, Dominica, Dominican Republic, Ecuador, El Salvador, Grenada, Guatemala, Guyana, Haiti, Honduras, Jamaica, Mexico, Netherlands Antilles, Nicaragua, Panama, Paraguay, Peru, Saint Kitts and Nevis, Saint Lucia, Saint Vincent and the Grenadines, Suriname, Trinidad and Tobago, Uruguay, and Venezuela.
Western Europe also named Europe (excl. Eastern Europe) Western Europe includes the following 26 countries and non-sovereign territories on OSIRIS: the 15 EU countries, Andorra, Cyprus, Gibraltar, Iceland, Liechtenstein, Malta, Monaco, Norway, San Marino, Switzerland and Turkey.
Earnings Estimates - Additional Estimates
Earnings Estimates
The basic Earnings estimates data set includes Number of estimates (given weekly and monthly, including number of revisions and number of confirmed), estimates on Earnings per share (including mean and median figures) and P/E ratio estimates. Annual estimates are presented along with quarterly estimates (when available, primarily for US companies). Figures are updated weekly.
Additional Estimates
Additional estimates includes Recommendations and forecasts on Other variables.
The Recommendations indicate JCF’s presentation of the average of all the scores given by analysts, allowing for comparison across time for a given security, or across securities, whatever the number of analysts providing recommendations. They are not an evaluation made by JCF itself. The recommendations are not given on an exact date in time, but are given over a period of four to ten weeks. The recommendations are a score, like a rating. They have to be read as follows:
1= positive (buy)
1,5= overweight
2= neutral
2,5= underweight
3= negative (sell)

OSIRIS data in detail
31
Since the score is an average the scores are not limited to the scores mentioned above - though will always be between 1 and 3.
Forecasts are calculated based on the following seven Other Variables:
Net dividend per share
Cash flow per share
Net assets per share
Net profit
Sales
EBIT
EBITDA
This information is provided by JCF International. JCF calculates consensus using only those EPS estimates changed or actively validated within the last 75 days. P/E ratio data is updated weekly.
Access to the Additional estimates (including Other variables and Recommendations) is available to users who subscribe to the Detailed earnings estimates module.
Ratings
OSIRIS provides ratings collected from three leading rating agencies - Fitch Ratings, Moody's, and Standard and Poor’s. Each rating is an issuer credit rating, except the S&P Commercial Paper rating, which is issue related.
OSIRIS can be searched using any of these. For detailed definitions of each rating and related abbreviations, please refer to the Ratings Definitions appendix.
Fitch Ratings – including “Trend” Long Term Short Term Support Individual Insurer Financial Strength
Moody’s – including “Watchlist” indicator, date and reason Bank Deposits Long Term Bank Deposits Short Term Counterparty Short Term Counterparty Long Term Commercial Paper Derived Issuer Long Term Bank Financial Strength Insurer Financial Strength
Standard and Poor’s – including “Outlook” status and date Issuer Credit Rating: Standard Long Term Issuer Credit Rating: Foreign Currency Long Term Issuer Credit Rating Standard Short Term Issuer Credit Rating: Foreign Currency Short Term Insurer Financial Strength
WVB Ratings WVB Credit Risk rating WVB Business Risk score
All ratings are updated on OSIRIS on a weekly basis.

OSIRIS Internet - Data Guide
32
The Ratings module is a supplement to the standard OSIRIS subscription and is available for an additional fee.
Edgar Online Filings
Edgar Online provides filings from the US SEC. A history of filings as far back as 1999 is available on OSIRIS.
New filings are being updated on a weekly basis.
A list of the filings available through Edgar Online Service is presented in the appendices.
Access to the EOL filings is available to clients who have Internet access and subscribe to this module.
News
In the News section articles of Reuters, Financial Times and Zephyr can be found. For Financial Times we present articles from their Intelligence Wires. For Zephyr we present the articles from Zephyr News and Zephyr Editorial.
The history of the News articles available on OSIRIS differs per source:
• Reuters: up to 2 to 3 months
• FT: up to 2 years
• Zephyr: up to 3 years
The News section of a company report also includes headlines of all sources when available.
The headlines and/or full text can be screened using the News search module. This will allow users to target companies by specifying one or more criteria:
• Words
• Companies
• Time period
• Industry
• Topic
• World region
• Country
• Source publication
Access to the News articles is available to clients who have Internet access and subscribe to this module.
Copyright © 2011 Last updated September 2011
Company identification numbers
ID numbers for industrial companies on Osiris
General rules:
• For industrial companies preference is given to an official number when this is known; if not known the company has a WVB ID
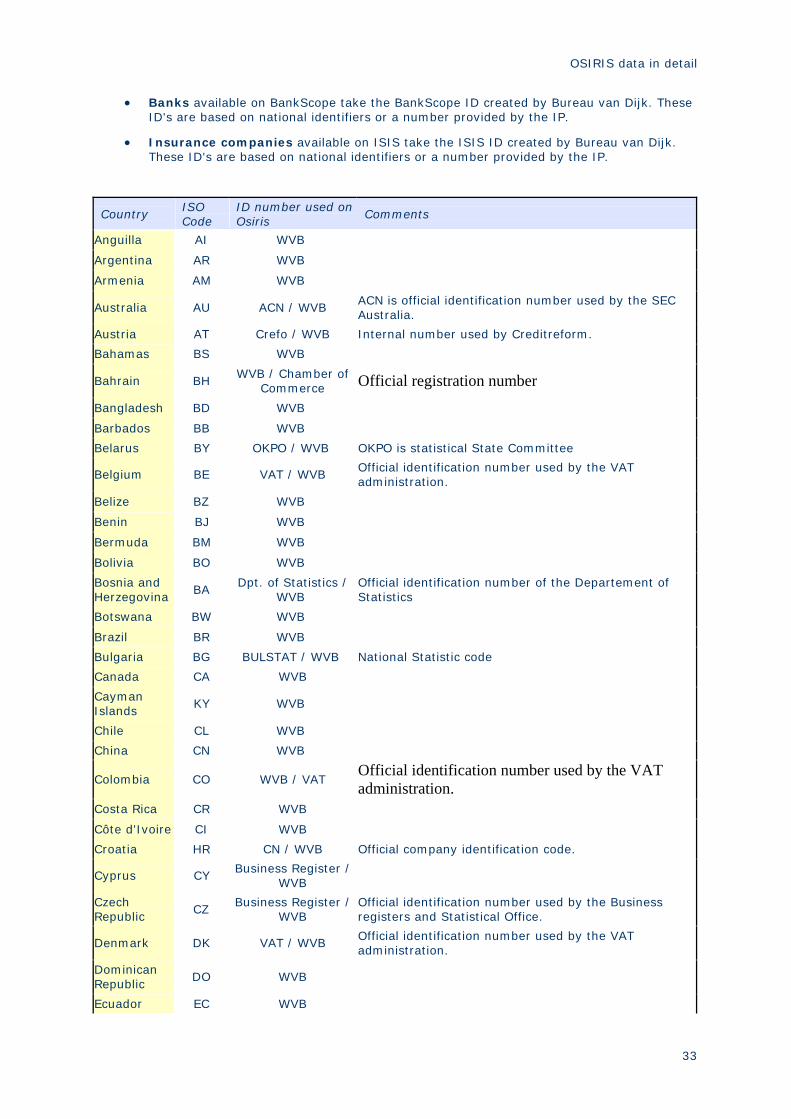
OSIRIS data in detail
33
• Banks available on BankScope take the BankScope ID created by Bureau van Dijk. These ID's are based on national identifiers or a number provided by the IP.
• Insurance companies available on ISIS take the ISIS ID created by Bureau van Dijk. These ID's are based on national identifiers or a number provided by the IP.
Country ISO Code
ID number used on Osiris
Comments
Anguilla AI WVB Argentina AR WVB Armenia AM WVB Australia AU ACN / WVB ACN is official identification number used by the SEC
Australia.
Austria AT Crefo / WVB Internal number used by Creditreform.
Bahamas BS WVB
Bahrain BH WVB / Chamber of Commerce Official registration number
Bangladesh BD WVB Barbados BB WVB Belarus BY OKPO / WVB OKPO is statistical State Committee
Belgium BE VAT / WVB Official identification number used by the VAT administration.
Belize BZ WVB Benin BJ WVB Bermuda BM WVB Bolivia BO WVB Bosnia and Herzegovina
BA Dpt. of Statistics / WVB
Official identification number of the Departement of Statistics
Botswana BW WVB Brazil BR WVB Bulgaria BG BULSTAT / WVB National Statistic code
Canada CA WVB Cayman Islands
KY WVB
Chile CL WVB China CN WVB
Colombia CO WVB / VAT Official identification number used by the VAT administration.
Costa Rica CR WVB Côte d'Ivoire CI WVB Croatia HR CN / WVB Official company identification code.
Cyprus CY Business Register / WVB
Czech Republic
CZ Business Register / WVB
Official identification number used by the Business registers and Statistical Office.
Denmark DK VAT / WVB Official identification number used by the VAT administration.
Dominican Republic
DO WVB
Ecuador EC WVB

OSIRIS Internet - Data Guide
34
Egypt EG WVB El Salvador SV WVB Estonia EE Registration / WVB Official identification number used by the Trade
register.
Finland FI Registration / WVB Official identification number used by the Trade register.
France FR SIRET / WVB Official identification number.
Gabon GA WVB Gambia GM WVB Georgia GE WVB Germany DE Crefo / WVB Internal number used by Creditreform.
Ghana GH WVB Gibraltar GI WVB Greece GR VAT / WVB Official identification number used by the VAT
administration.
Guatemala GT WVB Guyana GY WVB Honduras HN WVB Hong Kong HK WVB Hungary HU VAT / WVB Official identification number used by the Tax Office.
Iceland IS Registration / WVB Official identification number of Companies House.
India IN Registration / WVB Registration number (Cies Act 1956) is official identification number.
Indonesia ID WVB Iran (Islamic Republic of)
IR WVB Ireland IE Registration / WVB Official identification number of Companies House.
Israel IL WVB Italy IT CCIAA / WVB Official identification number of the Chambers of
Commerce.
Jamaica JM WVB Japan JP WVB
Jordan JO WVB Kzakhstan KZ WVB Kenya KE WVB Korea (Republic of)
KR Registration / WVB Tax number is official identification number.
Kuwait KW WVB Latvia LV Registration / WVB Official identification number of Companies' Registry.
Lebanon LB WVB Liberia LR WVB Liechtenstein LI WIN / WVB Worldbox Identification number
Lithuania LT Registration / WVB Official identification number of the central Company Register (Department of Statistics)
Luxembourg LU VAT / WVB Official identification number used by the VAT administration.
Macedonia (FYROM)
MK Dpt. of Statistics / WVB
Official identification number of the Department of Statistics
Malawi MW WVB

OSIRIS data in detail
35
Malaysia MY WVB
Malta MT Registration / WVB Official Identification Number used by the Registrar of Companies - Malta Financial Services Authority
Marshall Islands
MH WVB
Mauritius MU WVB Mexico MX WVB Moldova (Republic of)
MD IDNO / WVB Moldova State Chamber of Registration (part f the Ministry of Justice)
Monaco MC SIREN / WVB Official identification number.
Morocco MA WVB Mozambique MZ WVB Namibia NA WVB Nepal NP WVB
Netherlands NL Handelsregister / WVB
Official identification number of the Chambers of Commerce.
Netherlands Antilles
AN WVB
New Zealand NZ WVB Nicaragua NI WVB Niger NE WVB Nigeria NG WVB Norway NO Registration / WVB Official company identification code.
Oman OM WVB Pakistan PK WVB Palestinian Territory
PS WVB
Panama PA WVB Papua New Guinea
PG WVB
Paraguay PY WVB
Peru PE VAT / WVB Official identification number (RUC-Registro Unico de Contribuyente) used by the VAT administration.
Philippines PH WVB Poland PL REGON / WVB National Identification Number.
Portugal PT VAT / WVB Official identification number used by the VAT administration.
Qatar QA WVB / Chamber of Commerce Official registration number
Romania RO VAT / WVB Official identification number used by the VAT administration.
Russian Federation
RU OKPO / WVB Official identification number used by the Russian Statistical Committee.
Saint Kitts and Nevis
KN WVB
Saint Lucia LC WVB Saudi Arabia SA WVB Serbia and Montenegro
RS Dpt. of Statistics / WVB
Official identification number of the Department of Statistics
Singapore SG Registration / WVB Official identification number used by the Singapore

OSIRIS Internet - Data Guide
36
stock exchange.
Slovakia SK Business Register/WVB
Official identification number used by the Business registers and Statistical Office.
Slovenia SL Statistical Office / WVB
Official identification number of the Statistical Office.
South Africa ZA Registration / WVB Registration number is official identification number used by the South-Africa stock exchange.
Spain ES VAT / WVB Official identification number used by the VAT administration.
Sri Lanka LK WVB Sudan SD WVB Suriname SR
Swaziland SZ WVB Sweden SE Registration / WVB Official identification number of the National Patent and
Registration Office.
Switzerland CH WIN / WVB Worldbox Identification number
Taiwan TW Registration / WVB Official identification number used by the SEC Taiwan.
Tanzania (United Republic of)
TZ WVB
Thailand TH WVB Trinidad and Tobago
TT WVB
Tunisia TN WVB Turkey TR WVB Uganda UG
Ukraine UA OKPO / WVB National Statistic code
United Arab Emirates
AE WVB United Kingdom
GB Registration / WVB Official identification number of Companies House.
United States
US WVB
Uruguay UY WVB Uzbekistan UZ Vanuatu VU WVB Venezuela VE WVB Vietnam VN WVB Virgin Islands (British)
VG WVB
Zambia ZM WVB Zimbabwe ZW WVB * WVB = internal number used by World'Vestbase * No ID is mentioned when there are only banks and insurance companies on OSIRIS

37
OSIRIS software overview
2
OSIRIS Software Overview
Users of OSIRIS can do everything from accessing single company reports to performing comprehensive data analyses on global sets of companies. The following will provide a brief introduction to the main features of OSIRIS;
For additional user training, visit the OSIRIS Product Support Centre at www.bvdep.com/support or contact your account manager.
Copyright © 2011 Last updated September 2011
Accessing
2
Accessing
Data from OSIRIS can be accessed using Bureau van Dijk Electronic Publishing's proprietary software interface (on DVD, Internet, Intranet) or through an Addin with Excel or Access. If you are interested in learning about the Addins, please contact your account manager for information.
Copyright © 2011 Last updated September 2011
2
Search
Companies or groups of companies can be selected using a single search step or a combination of different criteria, each with multiple search options. The search criteria are listed below:
Company Name
Ticker and ID Numbers Ticker, WVB number, ISIN number, SEDOL number, Valor numbers, CIK number, BvD ID number
Geographic World Regions, Country (including State/ Province), City
Industry� Text search, Banks/ insurance/ industrial companies, International Classification Benchmark, Global Industry Classification Standard, US SIC code, UK SIC Code, US NAICS Code, NACE Code Rev 1.1, Business line (as reported)
Number of employees
Financials Key Financials, All Financials, Key Ratios, All Ratios

OSIRIS Internet - Data Guide
38
Ratings� Fitch Ratings, Moody’s, S&P, WVB: Select companies with at least one rating
Ownership data� Ownership status (independent/ dependent companies, ultimate owners, etc.), Shareholders, Subsidiaries, Affiliates of selected companies
Templates
Stock Data Stock exchange, Indices, Current stock data, Monthly stock data, Weekly stock data, Annual stock data, Annual stock performance, IPO date
Earnings Estimates� Buy/Sell recommendations, No. of EPS estimates, changes of EPS estimates, P/E ratio, ...
Listed/ Unlisted
Active/ Inactive
Auditors: select the companies with a given auditor report qualification for the Last Available Year.
Board members and officers
Miscellaneous Incorporation date, consolidation code, companies with a note, search by word in notes
Accounting years
Updated reports
Corporate events
Load a file
Load a search
Search logic can be altered by selecting “all ANDs” or “all ORs” or by implementing the Boolean search option. Boolean searching enables users to combine the numbered search steps with operators “AND”, “OR”, “AND NOT” in any order desired. Note, the use of brackets might have an influence on the search result.
Users can also remove or change individual search steps by selecting the step in the Search summary and clicking on Delete search step or Modify search step.
Copyright © 2011 Last updated September 2011
Text Search instructions
Here are some instructions which could be useful when doing a Text Search on OSIRIS:
• When you enter a word or part of a word, the search will select all words commencing with the string entered. (Please note there is no need to add an '*' to the string). For example, entering RETAIL will select Retail, but also Retailing, Retailer, etc.
• If you only want to select the exact same word as you have entered it and no derived words, you have to add ".." to the word. For example, entering "RETAIL" will only select the word Retail and not Retailing, Retailer, etc.

OSIRIS software overview
39
• If you enter two or more words or character strings, the search will select companies containing all the words or strings entered, whatever their order and proximity. For example, entering INTEG SYST will select Integrated circuits system, and also Systems integration, etc.
• If you want to select the words exactly how you have entered them, i.e. no derived words and to be treated as being one word, i.e. in that same order and proximity, you have to add ".." to the words. For example, entering "SUPPLY CHAIN" will select companies containing these two words in this form, order and proximity only.
• If you put and/2 between two words, the search will select companies containing these two words or their derived words, whatever their order, but within the proximity of maximum two words. For example, entering RETAIL and/2 MANUFACTURING will select Retail manufacturing, but also Manufacturing, merchanting, retailing, etc.
• Other variations of this function are also possible. For instance, you can also put and/3 between two words. This search will select companies containing these two words or their derived words, whatever their order, but within the proximity of maximum three words. For example, entering RETAIL and/3 MANUFACTURING will select Retail manufacturing, but also Manufacturing, merchanting, retailing, as well as Retail, healthcare, telecommunications, manufacturing.
• Please note in all the searches empty words such as and, or, for, the,... (except when ".." were used) and punctuation marks are not taken into account and might appear between the words. For example, entering RETAIL and/2 MANUFACTURING will also select Manufacturing, merchanting, and retailing.
• Avoid entering initials or words with only two characters.
• The system does not distinguish between upper and lower case; nor between accented and non-accented characters.
• Do not click on OK until you have specified all the criteria that you want to include in your search.
• The amount of words you can enter in the Text Search frame is limited. Please note you can use different search steps (in combination with the Boolean search) for long search specifications.
2
List
The List displays a table of information on the group of companies resulting from the search. List can be formatted in order to allow you to present the information of your choice. Virtually all information included in a company report can be included in a list ; financials can be included in single or multiple years.

OSIRIS Internet - Data Guide
40
The pre-constructed Standard list format includes:
Company name
Country code
International Classification Benchmark
Latest yearly report date
Template
Consolidation code
Operating revenue / Turnover (mil USD, latest available year)
Number of employees (latest available year)
BvD Independence Indicator
ISIN Number
In addition to this, icons appearing within a list indicate whether Reuters News and/or SEC Filings and/or Global Reports and/or Perfect Information Filings are available for the companies.
To create a user-defined list format, first select the appropriate template for the financial data (All templates, Industrial [All templates, Hybrid, Continental or Anglo], Banks, Insurance [Life, Non-Life, Composite]). Then the user can take variables from any section of the company statement, including data items from:
Header
Account header
Key financials
Key ratios & Number of employees
Ratings
Industry codes and descriptions
Segment data
Stock data
Earnings estimates
Additional estimates
Global Account Format
Global detailed Account Format
Spreadsheet Account Format
Ratios
Shareholders
Subsidiaries
Board Members and Officers
Advisor type
Notes
In addition, you can further customise the presentation of your list by sorting it or deleting specific companies that you do not want to keep in your search results.
• The Sort enables users to display results in a specified order based on Company name, US SIC code, ISO country code, Current market capitalization, Stock exchange, Net Income, Operating Revenue/ Turnover, Total Assets, or Number of employees. Lists can be sorted by simply clicking on the heading of any column.
• Using the Delete option, a range of companies or individually marked companies can easily be deleted from the set.
The List provides an excellent format for exporting a table of specified fields or exporting full company details.

OSIRIS software overview
41
Save a List format to share with others
• In the Format creation frame you have to choose 'Save to disk' and then choose where you want to save the List format you want to share with others. You then only have to let these persons know where and under which name you saved the format. (If desired you can also choose to put the format on a network.) Then, by using the option 'Load from disk' in the 'Available formats' of the List, these persons can use your List format.
Copyright © 2011 Last updated September 2011
2
Report
The Report display provides access to the full company details, including graphics options. The default presentation of a company report is the Standard format.
The Standard report format includes the following sections of information:
Header
Ratings
Industry (abridged)
Segment data
Key financials
Key ratios & No. of employees
Global
Security & Price information
Annual stock data
Earnings estimates
Shareholders
Subsidiaries
Board members & officers
Advisors
The user can define additional report formats using the full financial accounts and sections of information listed below:
Header Name, Address, Website, Identification numbers, Incorporation date, Type of statement available, most recent Sales, Number of employees, Market Capitalization, and Net Income figures, Main Exchange, published Statement currency, Status, Template, Ticker Symbol,
Ratings Fitch Ratings, Moody’s, Standard and Poor’s
Industry NAICS, NACE rev 1 and US SIC (Core, Primary and Secondary codes), Industrial Classification Benchmark, Financial Times Industry Class, WVB Industry Class, Description and history, Summary business description, Overview
Segment data Business Lines and Geographic Segments as provided in the company report

OSIRIS Internet - Data Guide
42
Key financials
Key ratios & No. of employees
Financial profile
Global
Global detailed
Spreadsheet
Raw data
Ratios
Cash flow statement
Analyst-WVB
Master-WVB
Ratios –WVB
Standard – Multex
Country Specific - Multex
Footnotes to financials
Accounting practices
User defined variables
Customers & competitors
Board members & Managers
Auditors & Advisors
Security and Price Information
Current stock data
Current stock valuation
Annual stock data
Annual stock valuation
Weekly Pricing Series
Monthly Pricing Series
Earnings estimates
Additional estimates
Mergers & Acquisitions (Internet version only)
Shareholders
Subsidiaries
News
The combination of sections included in the report can be adjusted by modifying the format. The format name highlighted in the list of formats indicates the current format presented on the screen. This can be change simply by clicking on an alternative format in the list.
The layout of the report can also be customized by selecting absolute or relative years of data, the currency of presentation, and variations from year to year.
It is possible to export from the Report window, allowing for basic single company transfer to [*.txt], [*.rtf], [*.xls], [*.doc], and [*.asc].
Copyright © 2011 Last updated September 2011
2

OSIRIS software overview
43
Save
Save the company set will save a file either on the user’s computer or on the BvD server with the specific companies resulting from your search. This file can only be accessed within OSIRIS using the Load a (company) file option.
Save the search strategy allows users to retain their ordered search criteria. Using this will reproduce the search, but may result in different individual companies whenever the data on OSIRIS is updated and as companies fall into or out of your search criteria. To access the saved search, select Load a search as the search step.
On OSIRIS Internet version the last performed search strategy is automatically saved and can be reloaded from the search strategy module by selecting "AutoSave".
File types
You can save data from OSIRIS to various file types:
Set of Companies: Saves a set of companies that has been constructed using any combination of search criteria. The corresponding file is created using one of many identifiers in the database. These files are indicated by [*.set], [*.tic] for ticker symbols, [*.isi] for ISIN numbers, [*.bvd] for BvD numbers, [*.wvb] for WVB numbers and [*.val] for Valor numbers. The files include all the financial data relating to the companies saved.
Peer Group: A group used for comparison purposes in the analysis and peer report options is saves as [*.gcp].
Search Strategies: Any search strategy can be saved in a file, which has the extension [*.srh].
Presenter: The Presenter files contain graphical templates with the extension [*.bcr]
Export or Transfer lists of companies, company reports or group reports into the most popular packages. Hereafter are the corresponding extensions:
Transfers to:
Excel [*.xls]
ASCII [*.txt] ASCII
(Delimited) [*.asc]
Rich Text Format
[*.rtf]
dBase [*.dbf] Lotus [*.wkf] Multiplan [*.slk] DIF [*.dif]
Copyright © 2011 Last updated September 2011
Upload companies
It is possible to upload a list of companies into OSIRIS using one of the company ID's. All you have to do is put all the ID's of the companies you wish to upload one per line, one below the other in a [*.tic] file if you are using the ticker symbol, [*.isi] file for ISIN numbers, [*.bvd] for BvD numbers, [*.wvb] for WVB numbers.
The easiest way is using Notepad, however it is also possible using Excel by saving the file as a text file and renaming with the corresponding extension.
Once the ID's are saved onto the right type of file it can be uploaded into OSIRIS.
Note: Uploading via the ticker may not result in the desired list of companies on OSIRIS as the same ticker can appear multiple times for different companies, which will all be selected.

OSIRIS Internet - Data Guide
44
Peer groups/Peer reports
2
Peer Groups
Peer Groups are used to compare a company (called Subject Company) to several companies considered by the user as "comparable".
OSIRIS offers the user three ways of constructing a Peer Group:
• using any set of companies selected within OSIRIS (by name or by use of any combination of the available search criteria) as a Peer Group; such peer groups are called Own Peer Groups (OPG) (see also the note hereunder);
• using the Industry Group to which belongs the Subject Company as the Peer Group. Such Industry Groups are based on the specific templates for banks (1 template) and insurance companies (3 templates) and on the GICS (before 2009 ICB) for the industrial companies;
• using a Standard Peer Group (SPG): a Standard Peer Group is a subset of an Industry Group including 4, 10 or 20 companies that are selected within the Industry Group by taking the companies that are the closest to the subject company on the basis of one selected key financial or key ratio, such as Turnover/Operating Revenue, Total Assets, Net Income, Number of Employees, Current Ratio, Solvency Ratio,....
The user can also specify the Industry Group or the SPG to be National, International or Regional. The national group is limited to companies domiciled in the country of the subject company. The regional group is limited to companies domiciled in the world region of the subject company (10 world regions). The international group has no limitations to the country or the region of the companies used for the comparison.
Please note that the Peer Groups that are used in the charts illustrating the balance sheet and the income statement that are attached to a displayed Company Report, are always the Industry Groups (if an OPG exists, it is used exclusively in the Peer Reports).
Note: There remain some banks and insurance firms coded as industrial companies. These are in the process of being spread into the relevant templates. Until then, they are not associated to a Standard Peer Group, but can be studied using Own Peer Groups.
Copyright © 2011 Last updated September 2011
2
Peer Reports
A Peer Report on OSIRIS is associated to a Subject Company and is a combination of a:
• Peer Group
• Set of variables
• Report Format
There are two ways of constructing a Peer Report:
• using the Standard Peer Report
• constructing the report through the Peer Analysis module (one of the 4 analyses offered by clicking on the Analysis tab in the upper tool-bar)
Standard Peer Report

OSIRIS software overview
45
• Peer Group: Either the Standard Peer Groups (4, 10, 20 companies; national, regional; international), Industry Groups or Own Peer Groups can be used as a Peer Group in the Standard Peer Report. (For more detail and the definition of these three categories see section Peer Group)
• Set of variables: These are pre-determined to be the key financials, the Number of employees figure, and the key ratios (the variables are dependent on the template used for the subject company).
• Format: there are 2 formats:
o Format 1: Displays the values of the 12 variables for each of the companies. This format is not available if the Peer Group includes more than 20 companies.
o Format 2: Displays the values of the 12 variables for the subject company and the median of the group.
The Standard Peer Report associated to any company can instantly be viewed by clicking on the appropriate icon when a list of companies or a Company Report is displayed.
Custom Peer Report
• Peer Group: Own Peer Groups are used.
• Set of variables: These variables can be selected by the user from all available items and ratios of the Global format.
• Format: Three formats are available:
o for each selected variables, values are shown individually for each company included in the PG (up to 20 companies)
o values are given for the subject company and the median of the Peer Group
o values are given for the subject company, 1 to 3 other companies and the median of the Peer Group.
Copyright © 2011 Last updated September 2011
2
Peer Analyses
A Peer Analysis compares the variables of any company in the set to the median, the average, the quartiles and the deciles of a given set of companies. The subject company may or may not belong to the specified Peer Group and the set of companies selected must not exceed 500.
The Peer Analysis is particularly useful for those wishing to individually select variables and companies for the peer group study, rather than using the semi-automatic process of the Standard Peer Report. For more detail about such distinction, please refer to section Peer Groups/Peer Reports.
The Peer Analysis button offers three analytical options, enables the user to construct an analysis by selecting individual companies and then specifying the variables of interest. The peer analyses are:
A company compared with 1 to 20 companies
A company compared with a set of companies
1 to 3 companies compared with a set of companies
In the first case, the user may select a comparison with the Standard Peer Group, the group of companies from the current search, or a saved set of companies. When selecting either of the

OSIRIS Internet - Data Guide
46
last two options, the user is presented with a search window in which to select the comparison companies.
Each type of Peer Analysis can be customized according to user-specified currency, variables and years. Information displayed can include median, average and standard deviation of the group, quartiles and deciles, ranking. Results may be presented in tables or graphs.
Copyright © 2011 Last updated September 2011
2
Presenting
Users can easily design presentation booklets by customizing and printing individual graphs, charts and reports directly from OSIRIS. In addition, it is possible to copy and paste graphics into word processing programs to accompany written analysis or other additional information.
For more advanced requirements, OSIRIS offers the integrated Presenter software. The Presenter is a powerful presentation interface that enables users to combine financial, graphical, and textual information with their own comments on the same page. This software is widely used for the creation of company briefs and credit reports based on information in many Bureau van Dijk Electronic Publishing products.
The Presenter software is available for a subscription upgrade.
For information and training on the Presenter, please contact your account manager.
Copyright © 2011 Last updated September 2011
47
Appendices
2
Glossary
Access Mode
This refers to the method used to access OSIRIS data. With no change to the user interface, subscribers to the DVD product can access data from the local DVD drive, a networked drive, or via an Internet or a corporate Intranet connection directly reading the OSIRIS server. The Access Mode feature can be used to retrieve newly updated information before the next update of the DVD is received.
Activity classifications
The main purpose of an activity classification is to classify productive economic activities. The main aim is to provide a set of activity categories that can be utilised when dissecting statistics according to such activities. There exist several activity classifications.
Addin Function (Definition)
This function enables you to design a spreadsheet or datasheet for directly importing data from the OSIRIS into Excel or Access.
Address of incorporation
This refers to the address where the company is incorporated under the law of a country. The address of incorporation can be different from the address where the company has its operations (for instance companies registered in Bermuda but operating in Hong Kong). Please see the definition of the trading address further below.
Advisors
Various types of advisors can be listed on OSIRIS for a given company. The Advisor Type field includes the following:
Auditor Banker Merchant bank Law firm Registrar Broker Trustee Investment manager Investment advisor Investor relations Brand name advisor Real Estate Appraiser Sponsor/ Underwriter Oil & Mining Engineers Bankruptcy Trustee Transfer Agent
Alert function
BvD financial and marketing company information web applications have a built-in alert system allowing you to stay informed on software or data updates via an e-mail notification.
Beta Values
The beta value is a measure of market risk that shows the relationship between the volatility of the stock compared to the volatility of a reference index over a given period. Please refer to Stock Data for more information.

OSIRIS Internet - Data Guide
48
Bulk Lists of Companies and Private Owners
A Shareholder Type referring to more than one shareholder, either containing a mixture of companies and individuals or multiple companies.
BvD account number
An identifier which varies depending on consolidation and type of the accounts of a company. For the BvD account number a suffix is added to the BvD number. A distinction between the BvD ID number and the BvD account number is introduced on OSIRIS in the beginning of 2009.
The possible structures of the BvD account number are:
Annual report - consolidated accounts
BvD ID number + IC
Annual report - unconsolidated accounts
BvD ID number + IU
Annual report - additional consolidated accounts
BvD ID number + IAC
Note: previously the additional accounts (sourced from Reuters) were identified with a suffix *
BvD ID number
A unique identifier for a company which is the same across the BvD databases and which is constant for all a company's companions. A distinction between the BvD ID number and the BvD account number is introduced on OSIRIS in the beginning of 2009.
Searches have to be made using the BvD ID number, thus without the BvD account number suffix. Previously saved searches or files based on the BvD number should still work.
Capital Expenditure
Abbreviated as Capex, is money spent to acquire or upgrade physical assets such as buildings and machinery. This tends to be a very large expense for companies with significant manufacturing facilities, and usually much less of an expense in the services sector. Also called "capital spending" or "capital expense".
CINS Module
A wizard that guides you through the process of searching company identification numbers for companies supplied by an external source. This module is only available on the DVD. To access it, simply choose the File menu, then option CINS module. To obtain a password for CINS, please contact your account manager.
Consolidated Statement
A consolidated statement is the statement of a company integrating the statements of its subsidiaries; the method of integration varies according to the importance of the interest owned by the parent company in its subsidiaries.
Because this definition can vary according to the sector analyzing the accounts, the accounts of WVB sourced companies without any subsidiaries are coded as consolidated. WVB follows the vision of analysts from the finance sector. When the company is without any subsidiaries, parent accounts are already seen as "full" and thus deemed as consolidated for data comparison.
Such a statement has consolidation code C1 (no unconsolidated companion on OSIRIS) or C2 (there is an unconsolidated companion on OSIRIS).
Consolidation Codes
A code is assigned to indicate the type of statement available for a company on the database. Both the consolidated and unconsolidated statements can be used to screen the companies on OSIRIS. Four consolidation codes are used:
C1 Consolidated statement with no unconsolidated companion

Appendices
49
C2 Consolidated statement with an unconsolidated companion
U1 Unconsolidated statement with no consolidated companion
U2 Unconsolidated statement with a consolidated companion
Core Code
Each company is assigned one core code which reflects the core activity of the company in each of the available industry classifications, a three-digit code for the US SIC and a four-digit code for the NACE rev. 1.1 and NAICS. The primary and secondary codes go down to the lowest possible level in each classification four digits for the US SIC and NACE Rev. 1.1 and 5 or 6 digits for the NAICS.
Cross Referencing
In order to get the equivalent of the codes from different classification systems the Cross Referencing function can be used on OSIRIS. All the codes we receive and all codes derived from cross referencing are being validated by our activity classifications specialist at BvD.
Customized Format (Definition)
Any combination of lines of the formats that you select to design a custom account presentation. You can specify your own headlines, create totals and subtotals, insert titles and sub-titles, etc.
When creating any customized format, if you switch back and forth between templates, it is important to choose as the last template the most detailed one from which you selected variables (even if you choose "Keep labels and definitions"). The saved model related to any customized format is always the last model chosen. So, if variables from the Raw data section are selected but are not part of the last template selected, then n.a. will be shown in the report for those variables
Cutoff dates
By default, the fiscal year-end cutoff date used for filings is March 31. However, users may specify their preferred fiscal year-end cutoff date to ensure time consistency in their searches and in the display of accounts.
Searches and displays on yearly data relating to Year t include companies with fiscal year ends through March 31 of Year t+1. For example, when the fiscal year-end is set to include the end of March, and a user searches on financials for the year 2000, the search will take into account all companies filing year-2000 statements from April 1st 2000 through March 2001.
In the searches and displays, if fiscal quarter-ends do not coincide with calendar quarter-ends, each fiscal quarter will be assimilated to the calendar quarter whose end is the nearest (by default). This can be changed so that the quarter-end coincides with the immediately preceding quarter or the next quarter.
Delisted
A delisted company on OSIRIS is defined as a company which has had its publicly listed equity removed from any stock exchange. Several circumstances can explain the delisting: the company becomes privately held or no longer meets listing conditions, or due to merger, acquisition by another company, liquidation, bankruptcy, or other reasons.
Note that a delisted company could still remain active, but is mostly no longer updated on OSIRIS and will therefore receive the status Active, no longer with accounts on OSIRIS.
Discontinued operations
When in the company report the figures for continued and discontinued operations are provided, then the sum of these figures will be presented in the accounts on OSIRIS.
Equity Price Volatility
The equity price volatility measures the volatility of the stock, not compared to a reference index as the beta value, but compared to the fluctuations of the stock price itself. Please refer to Stock Data for more information.

OSIRIS Internet - Data Guide
50
Exchange Rates
The exchange rates used on OSIRIS come per default from the IMF (International Monetary Fund) website and refer to the closing date of the statement. The exchange rates from the IMF are updated monthly and are at the closing date of the month. For more recent dates the exchange rates from the website www.xe.com are used until the monthly IMF exchange rates are available.
Per default the exchange rates at the closing date of the statement are used on OSIRIS (Market Rates - current), but also the exchange rates at the closing date of the last available accounts (Market Rates - last reported date) can be selected. Users may also enter their own exchange rates to replace those used in OSIRIS or to add a new period of exchange rate data. For the date in question, the rate used on OSIRIS is indicated, and the user may enter a new rate in the field "own rate".
Fiscal/Calendar mode
The user can choose to base the presentation of quarterly data according to the company's fiscal year-end dates or calendar quarter-end dates (regardless of the closing date of the accounts).
For example, if a company with a fiscal year-end of June 30 is set on Fiscal mode, its First Quarter will be that ending September 30, its Second Quarter will end December 31, and so on. If the same company is set on Calendar mode, its First Quarter will be that ending March 31, its Second Quarter will end June 30, etc.
Foreign Shareholder
It is possible to screen OSIRIS according to Foreign companies (or companies with Foreign shareholders). As the concept of foreign ownership varies from one user to the next, users can define their own preferred parameters in the search by Foreign shareholder according to the following criteria:
• Identify Foreign shareholders as being located in a specific country or All other countries.
• Specify the percentage of total ownership the foreign shareholders must have in the company to consider it foreign.
• Include or exclude foreign shareholders with an unknown stake.
• Exclude companies with national shareholders or only those with less than 50% ownership.)
Foreign Subsidiary
It is possible to screen OSIRIS according to companies with Foreign subsidiaries. As the concept of foreign ownership varies from one user to the next, users can define their own preferred parameters in the search by Foreign subsidiary according to the following criteria:
• Identify Foreign subsidiaries as being located in a specific country or All other countries.
• Specify the percentage of ownership required to consider the company a subsidiary
• Include or exclude companies with an unknown stake.
Format (Account)
This refers to the spread or presentation of the company's financial information. Formats on OSIRIS are specific to the type of template and include Global, Spreadsheet, Raw data and others. Report formats can be comprised of one or a combination of various sections including the above-mentioned financial formats.
Geographic classifications
Companies can be searched by selecting various regions and economic areas including. Two main types of regions can be distinguished. See Geographic Location for more information.
Group Report
A Group Report presents a table and graphics for a group of companies on selected variables and years without highlighting an individual company. See Group Report in the Data Guide or in the Help section of the product.

Appendices
51
Independence Indicator
The BvD Independence Indicator categorizes the degree of independence of a company; it is not a rating. The Indicator marks are as follows:
A: No recorded shareholder with more than 25% direct or total ownership.
B: No recorded shareholder with more than 50% direct or total ownership. And one or more shareholders are recorded with more than 25% direct or total ownership.
C: One recorded shareholder with more than 50% direct or total. Also given to a company when a source indicates that the company has an ultimate owner.
D: One recorded shareholder with a direct ownership of over 50%.
U: Unknown status of independence.
This indicator excludes the following owners from consideration when determining status of independence: Public, Mutual Funds, Private shareholders (more than one unnamed individual), and Bulk list of shareholders (more than one unnamed shareholder, but containing a mixture of companies and individuals).
Industry Group
Industry Groups are assigned according to template for banks and the three insurance templates (Life, Non-Life and Composite). For the industrial companies the Industry groups are based on the GICS (before 2009 on ICB). The user can specify that the Industry Group to be National, International or Regional (10 regions).
Layout
This refers to the arrangement of the columns presenting the data in a Report, including currency, units (thousands, millions, billions or default unit), and years (relative or absolute).
The following five options exist for the columns:
Money value in the currency of statement (one per year)
Money value in a reference currency (one per year)
Relative size (one per year)
Variation in the currency of the statement (one per couple of 2 successive years)
Variation in a reference currency (one per couple of 2 successive years)
When selecting a reference currency, users can specify different exchange rates:
Market rate (current): this is selected by default;
Market rate (last reported date;
Own rates.
List
A List refers to the presentation of a set of selected companies, with one line per company. A List presents several columns, each column being attached to a specific field of the company data.
Please refer to List for more information.
Listed
A listed company on OSIRIS is defined as a company with publicly listed equity. This definition could be different from other, broader definitions which might also include companies with listed bonds or other certificates.
This definition has an impact on the inclusion criteria for companies on OSIRIS.
List Format
This refers to the sequence and content of the columns of a List.
N.a. or n.s.
N.a. means the data is not available, while n.s. means not significant: all figures for the formula are available, but still the formula can not be calculated due to the nature of one of the figures (for instance when the denominator is 0 or when the result exceeds a set percentage).

OSIRIS Internet - Data Guide
52
Own Peer Group
This is a group of companies that the user considers as comparable to a Subject Company. It is designed by the user with a combination of search criteria (such as: name, activity, size, country, etc.). The user can alternatively select a Standard Peer Group (see this entry).
Path
A path is the way to access a file or a program that is stored on your hard-disc or on a diskette. It is made up of:
the letter designating the disc or diskette where the file or the program is stored (as in the following example the C drive);
the name of the directory where the file or the program is stored (as in the following example DIRNAME);
the name of the file or the program searched for (in the example FILENAME for a file; for a program, the name would have the form XYZ.EXE) using the usual separating signs : and \ of the MS-DOS language.
Example:
C:\DIRNAME\FILENAME
Note that the file or the program may be directly stored in the root directory.
In this case the path would be simply:
C:\FILENAME
You can also have the case where there is not only a directory name but also one or more sub-directory names. In this case, the path will look like:
C:\DIRNAME\SUBDIRNA\...\FILENAME
Peer Analysis
A Peer Analysis enables the user to compare a specific company (referred to as the Subject Company) to several companies (referred to as the Peer Group) that are considered "comparable". OSIRIS offers Standard peer analyses and Custom peer analyses. Standard peer analyses are using any Peer Group (Standard Peer Group, Industry Group or Own Peer Group) and a pre-defined set of variables. Custom peer analyses enable the user to distinctly select the members of the Peer Group as well as the variables used for the comparison.
Please refer to Peer Analyses for more information.
Peer Group
A Peer Group is defined as a group of companies used as a reference in a Peer Analysis for a comparison with a Subject Company. OSIRIS enables the user to design Own Peer Groups with any combination of search criteria or to use automatically constructed Peer Groups (referred to as Standard Peer Groups, see this entry). Industry Groups may also be used as Peer Groups.
Please refer to Peer Groups for more information.
Peer Report
A Peer Report refers to the presentation of a company compared with other companies of a Peer Group. It is made of the combination of a Peer Group, a set of comparison variables and a report format. Such Peer Reports can be customized or standard (see Standard Peer Report).
Please refer to Peer Reports for more information.
Penetration Indice
A penetration indice is a measurement that characterizes the relative importance of a cell according to other cells in a table.
Presenter (Definition)

Appendices
53
Presenter is presentation software enabling you to design (and save) a combined template and to display and print any report in these templates. Presenter templates may include financial data presented in any format and layout, analyses, graphical illustrations, and textual information.
Report
A Report refers to the presentation of a company. It is made up of any combination of Sections containing financial data and text.
Report Format
This refers to the presentation of a combination of Sections.
Section
A section refers to a part of a report. The sections that make up a Report are:
• Header • Ratings
• Master - WVB • Analyst - WVB • Ratios - WVB • Standard - Multex • Company specific
Multex
• Shareholders • The Corporate Group • Subsidiaries (roll-up
structure) • Subsidiaries (alph.
Order)
• Industry/Activities • Industry/Activities
(abridged) • Overview • Segment Data • Major customers • Major Competitors • Used Peer Group
• Security and Price information
• Current Stock Data • Annual Stock Data • Current Stock Valuation • Annual Stock Valuation • Weekly Pricing Series • Monthly Pricing Series
• Board members and Managers
• Advisors • Corporate actions
and Dividends • Future outlook • News Section • User Defined
Variables • Note
• Key financials and No. of employees
• Key ratios • Financial profile • Global format • Global detailed format • Spreadsheet format • Raw data format • Footnotes to
financials • Accounting practices • All ratios • Cash flow statement
• Earnings estimates • Additional estimates
Segment Data
The various business lines and geographic segments of a company, as mentioned in the annual report, are listed in the section Segment Data with figures per business line or geographic segment for:
• Sales
• Profit*

OSIRIS Internet - Data Guide
54
• Assets
• Depreciation (Depr.)
• Net Property, Plant & Equipment (PPE)
• Research & Development Expenses (R&D)
• Capital Expenditure (Capex)
Note: all of these items are not systematically available for each company.
*Turn to the footnotes of the Segment data to see to which profit of the accounts (operating, after tax, before tax) the 'Profit' of the Segment data refers to.
Segmentation Analysis
The segmentation analysis analyses the information for a group of companies according to selected variables on a two-dimensional axis and without highlighting any individual company. See Segmentation Analysis in the Data Guide or in the Help section of the product.
Shareholder and Subsidiary Information
The ownership information is presented in the Shareholder and Subsidiary sections of the company report. These sections contain the following:
Name of the shareholder or the subsidiary
Country of shareholder or subsidiary
The type of shareholder
Percentage held: direct and total
Source of the information (see Ownership Source Codes)
Date of the information
Operating Revenue/ Turnover, in USD (for companies included on OSIRIS )
BvD Independence Indicator
Ultimate owner status
In these sections, any institution with its statement in OSIRIS is in bold and underlined. Companies found on the BvD Suite are underlined. This enables the user to easily navigate from one company to its shareholders or subsidiaries: just click on the name to access the corresponding statement. Click on the Go back button to return to the studied company.
Shareholder Type
The shareholders listed for a company are broken into various types. These shareholder types can be screened in the search criteria:
Banks and financial companies
Insurance companies
Industrial companies
Public Authorities, States, Governments
Mutual & Pension Funds / Nominees / Trust / Trustees
Foundations (including research institutes)
One or more known individuals or families (shareholders known by name, including founders entries even when the founder name is not specified - rarely more than 3 entries of this type)
Unnamed private shareholders, aggregated
Employees / Managers / Directors
Public (is used only for publicly listed companies)
Other unnamed shareholders, aggregated (more than one shareholder, either containing a mixture of companies and individuals or multiple companies)

Appendices
55
Source Codes
Source codes are given at the heading of financial statements and when displaying the shareholders (or subsidiaries) section of a company report.
The source codes which appear in the heading of financial statements can be found in the data section 'Account header'.
The source codes which appear in the ownership section of a company report (some may also appear in the heading of the financial data) can be found in the ownership section 'Information Providers'.
Additional source codes are unique to banks on OSIRIS:
ABC Asociacion Bancaria de Colombia.
ABI Asociation of Italian Banks
ABP Asociacion Bancaria de Panama.
APB Associacao Portuguesa de Bancos.
BAT The Banks Association of Turkey
BAZ Bundesanzeiger. Germany
BCCR Banco Central de Costa Rica.
BCU Banco Central del Uruguay.
BFS Bankdata Financial Services. Lebanon .
BI Bank Indonesia. Tax & distributions not available
CB Commission Bancaire. Distributions not available. France - Monaco - Morocco
CECA Confederacion Espanola de Cajas de Ahorro. Tax & distributions not available
CG Supplement Canada Gazette. No Income Statement 1993
CNB Comision Nacional Bancaira. Mexico.
CNBS Comision Nacional de Bancos y Seguros. Honduras
CSB Consejo Superior Bancario. Tax & distributions not available. Spain.
FDIC Federal Deposit Insurance Corporation. USA.
FSS Financial Supervisory Service. Korea.
IBA Indian Bank Association
IBP Indice dos Balancetes Publicados. Brazil.
IF Informacion Financiera. Chile.
KTC Kinyu Tosho Consultant. Japan
Nikkei FQ Nikkei Financial Quest. Japan
OSFI Office of the Superintendent of Financial Institutions. Canada.
OTS Office of Thrift Supervision. USA.
SB Superintendencia de Bancos. Bolivia.
SBP Superintendencia de Bancos del Peru.
SBPA Superintendencia de Bancos - Paraguay
SBPN Superintendencia de Bancos - Panama
SBRE Superintendencia de Bancos Republica del Ecuador
SCMP South China Morning Post
SDB Superintendencia De Bancos
SEF Secretaria de Estado de Finanzas. Dominican Republic

OSIRIS Internet - Data Guide
56
SEFC BCRA - Superintendencia de Entidades Financieras y Cambiarias. Argentina.
SNL RD SNL Regulatory Data
SOC Statement of condition
SSF Superintendencia del Sistema Financiero. El Salvador
SZ Sparkassen Zeitung
RD Y-9 Regulatory data Y-9 filed with the FED. USA .
YH Yuukashooken Hookousho - Securities Report filed with the MOF and the stock exchanges Japan
Standard Peer Group
The Standard Peer Group is a set of 4, 10 or 20 companies that are a subset of the Industry Group of the Subject Company. The subset of companies is selected by taking the companies that are the closest to the Subject Company on the basis of Turnover/Operating Revenue, Total assets, Net income, Number of Employees and 8 more account items and ratios. The user can specify the SPG to be National, International or Regional (10 world regions). The user can alternatively use an Own Peer Group (see this entry).
Standard Peer Report
To each selected company, OSIRIS associates an automatically generated Standard Peer Report. This is the combination of any Peer Group (Standard Peer Group, Industry Group or Own Peer Group) associated to the Subject Company, 12 pre-defined variables and 2 report formats.
Statistical Analysis
A Statistical Analysis is a category of analytical options on OSIRIS that compares a selected company with a group of companies. It includes Distribution, Concentration and Linear regression analyses. With the Statistical Analysis, the user can select the type of study, specify the variable of interest, and interactively create tables and graphics comparing results for the company with the results of the peer group (the companies resulting from the search).
Template
There are seven templates that classify the presentation of accounts on OSIRIS:
Industrial Anglo
Industrial Continental
Industrial - Hybrid
Bank
Insurance Life
Insurance Non-Life
Insurance - Composite
Time Series Search
The time series search enables the user to search across several years (relative or absolute) for specified values, growth rates and rates of decline for financial variables and ratios. For example, with the Time Search it is possible to identify all companies with a growth rate of a given amount (or range) from one year to another year, for each specified year, or for any of the specified years.
Trading address
Next to the address of incorporation the trading address of companies is also available on OSIRIS. A distinction between a trading address and an address of incorporation is made if the company is incorporated under the law of a country which is not the country where it has its operations (this is for instance the case when companies chose Bermuda or Cayman Islands for fiscal reasons).
If on the corporate website or reports can be found that a (trading) address from where the company operates is different from the address of incorporation both addresses are provided on

Appendices
57
OSIRIS. If the company does not mention a particular trading address, both addresses are supposed to be the same.
There is always only one trading address displayed on OSIRIS.
Ultimate Owner
To define an Ultimate Owner, BvD analyses the shareholding structure of a company having a BvD Independence Indicator different from A+, A or A- (which means that the company is independent and consequently, has no Ultimate Owner).
It looks for the shareholder with the highest direct or total % of ownership. If this shareholder is independent, it is defined as the Ultimate Owner of the subject company and a UO link is created between the subject company. If the highest shareholder is not independent, the same process is repeated to him until BvD finds an Ultimate Owner.
This is the general process that is always applied. However BvD gives you the possibility to parameter some characteristics of the Ultimate Owner (minimum % of ownership in the path between the subject company and its UO and shareholding structure of the UO) and distinguishes the Global UO from the Domestic UO.
Ultimate Owners are qualified according to their relationship with each of their subsidiaries. An ultimate Owner is qualified as:
UO+ if all links found in the path have a percentage over 97.99% or are "UO links" indicated by a source;
UO if all links found in the path have a percentage over 50%, but one or more links are between 50.01 and 97.99%;
UO- if all links have a percentage over 25%, but one or more links are between 25.01% and 50%.
More information can be found in the data section 'Ownership database'.
Unconsolidated Statement
A statement not integrating the possible subsidiaries of the concerned company. See also Consolidated Statement definition for WVB treatment of companies without any subsidiaries.
Such a statement has a consolidation code U1 (no consolidation companion on OSIRIS) or U2 (there is a consolidated companion on OSIRIS).
User Defined Variables (UDV - Definition)
Users can create their own variables or ratios using the lines of any format. These User Defined Variables can be included in the Report, in the Presenter, in the List, in the Addin and within Peer and Statistical Analyses. The User Defined Variables can also be used as search criteria or sorting key in the lists.
Copyright © 2011 Last updated September 2011
2
Information Providers
Ownership Database
Bureau van Dijk Electronic Publishing, SA 250, Avenue Louise B-1050 Brussels BELGIUM Tel: +32 2 639 06 06 Fax: +32 2 648 82 30 Website: www.bvdinfo.com e-mail: [email protected]

OSIRIS Internet - Data Guide
58
Industry Groups
Dow Jones & Company, Inc. P.O. Box 300 Princeton, NJ 08543-0300 Tel: +1 609 520 4000 Website: www.djindexes.com
US Financials
EDGAR Online, Inc. 50 Washington Street 9th Floor Norwalk, CT 06854 Website: www.edgar-online.com e-mail: [email protected]
Stock Data
Exchange Data International Limited. Churchill House, 5th Floor 142-146 Old Street London EC1V 9BW UK Tel: +44(0)20 7269 9150 Fax: +44(0)20 7269 9151
Website: http://www.exchange-data.com
Bank & Insurance Financials, Ratings
Fitch Ratings Limited Eldon House 2 Eldon Street London EC2M 7UA UK Tel: +44 20 7417 4222 Fax: +44 20 7417 4242 Website: www.fitchratings.com
Earnings Estimates
601 Merritt 7 3rd Floor Norwalk, CT 06851 USA
Tel: +1.203.810.1000 Website: www.factset.com
Industrial Financials (Korea)
Korea Information Service 15-2 Youid-Dong Youngdeungpho-Gu Seoul KOREA Tel: +82 2 3771 1000 Fax : +82 2 3771 1259 Website: www.kisinfo.com

Appendices
59
Japanese Unconsolidated Industrial Financials
Dun & Bradstreet TSR Ltd. Head Office, Tokyo 7F Shiba Bldg. III, 1-7-17 Shiba, Minato-ku, Tokyo 105-0014 Japan Website: www.dnbtsr.com
Ratings
Moody’s Investors Service 99 Church Street New York, NY 10007 USA Tel: +1 212 553 1658 Fax: +1 212 553 0882 Website: www.moodys.com e-mail: [email protected]
News
Website: www.ft.com
Website: www.dowjones.com
Website: www.zephyr.bvdep.com
Website: http://thomsonreuters.com
Ratings
Standard & Poor’s Garden House 16 Finsbury Circus London, EC2M 7NJ UK Tel: +44 20 7826 3800 Website:www.standardpoor.com
Industrial Company Financials
World'Vest Base Inc . 11 East Adams Chicago, IL 60610 USA

OSIRIS Internet - Data Guide
60
Tel: +1 312 922 3155 Fax: +1 312 922 3277 Website: www.wvb.com e-mail: [email protected]
Copyright © 2011 Last updated September 2011
2
Industry Classification Benchmark
Industry Classification Benchmark - ICB is a new classification set by Dow Jones and FTSE in which companies are classified by lines of businesses. The transition started end 2004. Dow Jones now presents its indexes using the ICB classification and the old DJ classification is no longer used by DJ. ICB provides a framework for classifying stocks into 10 industries, 18 supersectors, 39 sectors and - at the most granular level - 104 subsectors. It is very similar to the DJGI classification system, with the most significant changes affecting the sector and subsector levels. ICB codes are numeric codes (4 digits) replacing the DJ alphabetic codes (3 letters).
The 104 sub-groups at the lowest level of the ICB classification are used in OSIRIS to determine the Standard Peer Groups and the Industry Groups associated to industrial companies.
The following is the list of the 104 ICB codes of the lowest level.
Codes Industry Codes Industry 0533 Exploration &
Production 3765 Footwear
0537 Integrated Oil & Gas 3767 Personal Products
0573 Oil Equipment & Services
3785 Tobacco
0577 Pipelines 4533 Health Care Providers
1353 Commodity Chemicals 4535 Medical Equipment
1357 Specialty Chemicals 4537 Medical Supplies
1733 Forestry 4573 Biotechnology
1737 Paper 4577 Pharmaceuticals
1753 Aluminium 5333 Drug Retailers
1755 Nonferrous Metals 5337 Food Retailers & Wholesalers
1757 Steel 5371 Apparel retailers
1771 Coal 5373 Broadline Retailers
1773 Diamonds & Gemstones
5375 Home Improvement Retailers
1775 General Mining 5377 Specialised Consumer Services
1777 Gold Mining 5379 Specialty Retailers
1779 Platinum & precious Metals
5553 Broadcasting & Entertainment
2353 Building Materials & Fixtures
5555 Media Agencies
2357 Heavy constructions 5557 Publishing
2713 Aerospace 5751 Airlines
2717 Defence 5752 Gambling

Appendices
61
2723 Containers & Packaging 5753 Hotels
2727 Diversified Industrials 5755 Recreational Services
2733 Electrical Components & Equipment
5757 Restaurants & Bars
2737 Electrical Equipment 5759 Travel & Tourism
2753 Commercial Vehicles & Trucks
6535 Fixed Line Telecommunications
2757 Industrial Machinery 6575 Mobile Telecommunications
2771 Delivery Services 7535 Electricity
2773 Marine Transportation 7573 Gas Distribution
2775 Railroads 7575 Multi-utilities
2777 Transportation Services 7577 Water
2779 Trucking 8355 Banks
2791 Business Support Services
8532 Full Line Insurance
2793 Business Training & Employment
8534 Insurance Brokers
2795 Financial Administration
8536 Property & Casualty Insurance
2797 Industrial Suppliers 8538 Reinsurance
2799 Waste & Disposal Services
8575 Life Insurance
3353 Automobiles 8733 Real Estate Holding & Development
3355 Auto Parts 8737 Real Estate Investment Trusts
3357 Tires 8771 Asset Managers
3533 Brewers 8773 Consumer Finance
3535 Distillers & Vintners 8775 Specialty Finance
3537 Soft Drinks 8777 Investment Services
3573 Farming & Fishing 8779 Mortgage Finance
3577 Food Products 8985 Equity Investment Instruments
3722 Durable Household Products
8998 Non-equity Investment Instruments
3724 Nondurable Household Products
9533 Computer Services
3726 Furnishings 9535 Internet
3728 Home Construction 9537 Software
3743 Consumer Electronics 9572 Computer Hardware
3745 Recreational Products 9574 Electronic Office Equipment
3747 Toys 9576 Semiconductors
3763 Clothing & Accessories 9578 Telecommunications Equipment
Copyright © 2011 Last updated September 2011

OSIRIS Internet - Data Guide
62
2
Data Definitions
For each definition, the statement in which the item appears and the relevant templates are noted with a corresponding line number. Templates for Global, Global detailed and Spreadsheet formats are included in the Appendices.
Statements: A = Assets, L = Liabilities, I = Income Statement Formats: G = Global, D = Global detailed, S = Spreadsheet, R = Raw data
L Accounts Payable Industrial Template D: 21020 + 21055 S: 21020 + 21055
Represents the claims of trade creditors for unpaid goods & services due during the normal operation of the company. Includes Trade Creditors and Other Current Liabilities.
A Accounts Receivable
Industrial Template D: 20040 S: 20040
Represents the amount due to the company resulting from the sale of goods and services on credit to customers net of applicable reserves.
A Accumulated Depreciation
Industrial Template S: 20255 This is a memo line within the Spreadsheet format.
Represents the depreciation expense taken to date related to the fixed assets still carried on the books of the company.
I Adjustments/ Excise Tax
Industrial Template D: 13001 S: 13001
Represents taxes that are levied on specific products and/or services. These taxes are generally a percentage of the price paid and are not part of the company's revenue. Generally found in statements of oil, gas, distillers and tobacco companies.
I Amortization & Depletion*
Industrial Template D: 13020 S: 13020
Represents the cost allocation for intangible assets such as patents, trademarks, goodwill, films, book titles. It is a non-cash charge. Includes depletion.
L Capital Industrial Template G: 30095 D: 21135 S: 21135
Includes Common Stock, Participation Shares, Preferred Shares and Redeemable Preferred Shares.

Appendices
63
Equivalent to Share Capital in the Global detailed and Spreadsheet formats.
A Cash & Cash Equivalent
Industrial Template G: 13025 D: 20070 S: 20070 Equivalent to Total Cash & Short Term Investment in the Global detailed and Spreadsheet formats.
This item of the Global format includes Cash or Equivalent (all immediate negotiable medium of exchange or instrument normally accepted by banks for deposits and immediate credit to a customer account) and Short Term Investment (quoted and unquoted) that can be realized on short notice.
A Cash or Equivalent Industrial Template D: 13050 S: 13050
This item represents the total of all immediate negotiable medium of exchange or instruments normally accepted by banks for deposit and immediate credit to a customer account; this item also represents funds that can be used to pay current invoices.
A Cash Flow Industrial Template G: 30295
Profit/loss for period + Depreciation & Amortization (note: sign to be inverted for depreciation & amortization in the calculation of the cash flow)
L Common Stock /Shares
Industrial Template D: 14027 S: 14027
Represents the total par/nominal value of all common/ordinary shares. In certain cases it also carries the common treasury shares.
I Cost of Goods Sold* Industrial Template G: 30215 D: 22199 S: 22199 (R: 10408)
The figure for COGS is kept as 'pure' as possible, for as far as the information and the details in the annual report allow this to. On OSIRIS it is preferred to display as much detail as possible (to a certain level as the accounts have to remain comparable). Therefore if detailed figures are available in the annual report, the analyst will usually choose to enter
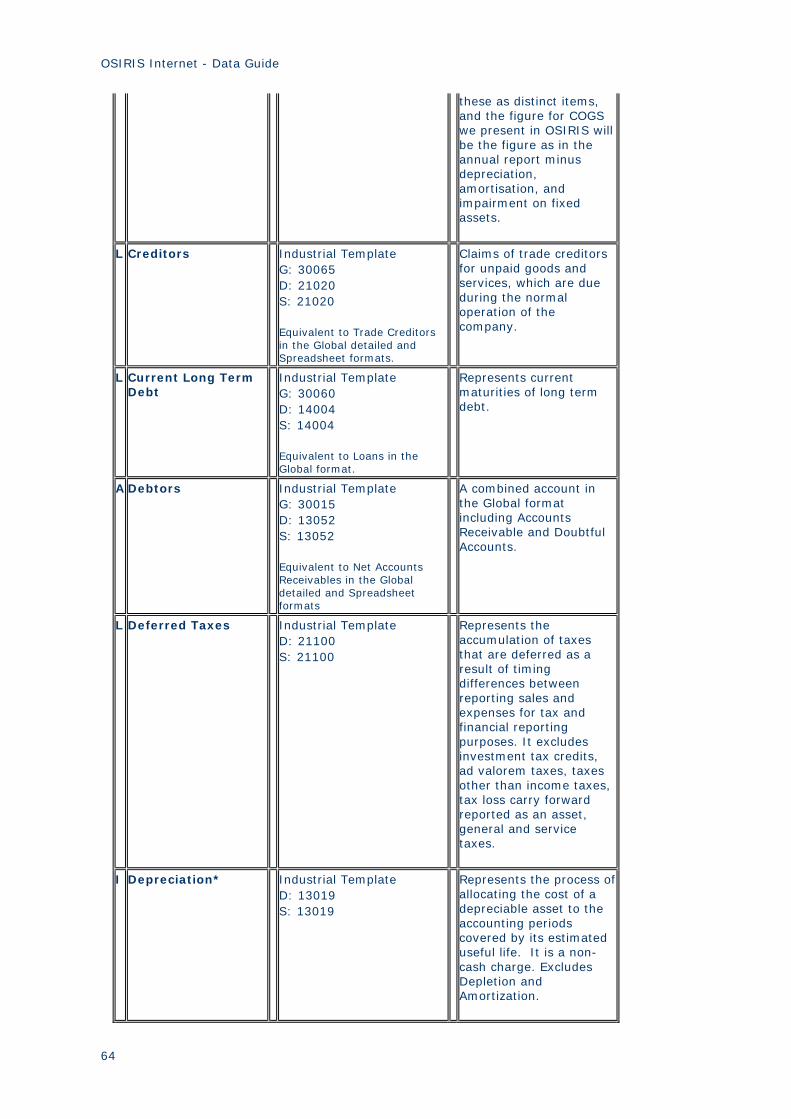
OSIRIS Internet - Data Guide
64
these as distinct items, and the figure for COGS we present in OSIRIS will be the figure as in the annual report minus depreciation, amortisation, and impairment on fixed assets.
L Creditors Industrial Template G: 30065 D: 21020 S: 21020 Equivalent to Trade Creditors in the Global detailed and Spreadsheet formats.
Claims of trade creditors for unpaid goods and services, which are due during the normal operation of the company.
L Current Long Term Debt
Industrial Template G: 30060 D: 14004 S: 14004 Equivalent to Loans in the Global format.
Represents current maturities of long term debt.
A Debtors Industrial Template G: 30015 D: 13052 S: 13052 Equivalent to Net Accounts Receivables in the Global detailed and Spreadsheet formats
A combined account in the Global format including Accounts Receivable and Doubtful Accounts.
L Deferred Taxes Industrial Template D: 21100 S: 21100
Represents the accumulation of taxes that are deferred as a result of timing differences between reporting sales and expenses for tax and financial reporting purposes. It excludes investment tax credits, ad valorem taxes, taxes other than income taxes, tax loss carry forward reported as an asset, general and service taxes.
I Depreciation* Industrial Template D: 13019 S: 13019
Represents the process of allocating the cost of a depreciable asset to the accounting periods covered by its estimated useful life. It is a non-cash charge. Excludes Depletion and Amortization.

Appendices
65
I Dividend Share Capital Other
Industrial Template D: 13047 S: 13047
Includes bonus paid in addition to the normal paid and proposed common stock/share dividend in the current year.
I Earnings after Tax Industrial Template G: 30270 (P/L after Tax) D: 13037 S: 13037
Income after corporation tax, depreciation and amortization, interest expenses and income, but before unusual/exceptional after tax items (including minority interests and preferred dividends)
I Earnings before Interest & Tax (EBIT)
Industrial Template G: 30310 D: 13024 S: 13024
Income before interest income, interest expense and income taxes, but after depreciation & amortization and after pre-tax unusual/exceptional items
I Earnings before Interest, Tax and Depreciation & Amortization (EBITDA)
Industrial Template G: 30320 D: 13018 S: 13018
Income before interest income, interest expense, income taxes, depreciation & amortization and unusual /exceptional items
I Earnings before Tax Industrial Template G: 30260 (P/L before Tax) D: 13034 S: 13034
Income before corporate tax and unusual/exceptional after tax items, but after depreciation and amortization, interest expenses and income.
L Enterprise value Industrial Template G: 30108 D: 21220 S: 21220 This is a memo line within the Spreadsheet format.
Defined as the sum of Market Capitalisation and Net Debt.
I Extraordinary Items after Tax
Industrial Template D: 13043 S: 13043
Represents any after tax extraordinary income (charge) which is infrequently included in the net income of the company. In France this item also includes depreciation of goodwill.
I Financial Expenses
Industrial Template G: 30245 D: 13026
This covers interest and investment expenses. Total periodic expense for using borrowed short and

OSIRIS Internet - Data Guide
66
S: 13026 long-term money. In certain countries this also includes debt discounts and foreign exchange losses.
I Financial Income Industrial Template G: 30240 D: 13025 S: 13025
This covers interest and investment income. Total periodic income for lending short and long term money. In certain countries this also includes debt Premium and foreign exchange gains.
A Goodwill Industrial Template D: 13070 S: 13070
The excess of cost over equity of an acquired company. The item is a component of Total Intangible Assets.
I Gross Sales Industrial Template D: 13000 S: 13000
Represents the gross sales/turnover before the reduction of cash discounts, trade discounts, returned sales, excise taxes, and allowances for which credit is given to customers.
I Income Taxes Industrial Template G: 30265 (Taxation) D: 13035 S: 13035
Corporate income taxes
A Intangibles Industrial Template G: 30040 (Intangible Fixed Assets) D: 20185 S: 20185
A combined account in the Global format including goodwill (book value of company's reputation and name) and other intangible fixed assets (e.g. patents, trademarks and customer lists)
L Lease Liabilities Industrial Template D: 14014 S: 14014
Debt related to assets leased by the company.
L Loans Industrial Template G: 30060 D: 14004 S: 14004
Current maturities of long-term debt; referred to as Current Long Term Debt in the Global detailed and Spreadsheet formats.
A
Long Term Associated
Industrial Template D: 20220
Investments in unconsolidated

Appendices
67
Companies S: 20220 subsidiaries and associated companies in which the company has a business relationship or exercises control. These investments are expected to be held for more than one year. It includes joint ventures.
L Long Term Debt Industrial Template G: 30080 D: 14016 S: 14016 Equivalent to Total Long Term Interest Bearing Debt in the Global detailed and Spreadsheet formats.
Includes Bank Loans, Debentures and Convertible Debt, Lease Liabilities, Other Long Term Interest Bearing Debt.
A Long Term Receivables
Industrial Template D: 20210 S: 20210
Represents investment in securities, long term loans that are expected to be held for more than one year.
I Marginal Business Income
Industrial Template R: 10462 This line is part of line 22080 Other non Oper./Financial Inc./Exp.
For Japanese companies for instance operating income items are seldom disclosed in most company reports. the income items which are non-operational and which can not be addressed to a specific income line on OSIRIS appear under this line.
I Minority Interest Industrial Template D: 13038 S: 13038
The portion of earnings/losses of a subsidiary pertaining to common stock not owned by the controlling company or other members of the consolidated group.
A Net Assets Industrial Template D: 21210 S: 21210 This is a memo line within the Spreadsheet format.
Represents the sum of Total Shareholders Equity and Minority Interests.
L Net Current Assets Industrial Template G: 30112
Defined as the difference between Total Current Assets and Total Current Liabilities.
L Net Debt Industrial Template D: 21215 S: 21215
Represents the difference between Total Debt and Cash & Equivalents.

OSIRIS Internet - Data Guide
68
This is a memo line within the Spreadsheet format.
I Net Interest Industrial Template G: 30250 (Financial P/L) D: 13027 S: 13027
Represents the difference between total interest income and total interest expense.
I Net Profit Industrial Template G: 30280 (P/L for Period) D: 13045 S: 13045
Profit (or loss) for period after preferred dividends and all other operating and non-operating expenses, but before ordinary dividends distribution. This is the bottom line of the Income Statement.
A Net Property, Plant & Equipment
Industrial Template G: 30035 (Tangible Fixed Assets) D: 13068 S: 13068 Equivalent to Tangible Fixed Assets in the Global format.
Net fixed assets after having deducted from the historical cost and revaluation of properties, the accumulated depreciation, amortization and depletion.
I Net Sales Industrial Template G: 30210 (Sales) D: 13002 S: 13002
Represents the sales/turnover after the deduction of cash discounts, trade discounts, returned sales, excise taxes, and allowances for which credit is given to customers
A Net Stated Inventory
Industrial Template G: 30010 (Stocks) D: 20010 S: 20010
Merchandise bought for resale, and materials and supplies purchased for manufacture for use in revenue production, less any allowances.
Number of Employees
Industrial Template G: 30120 D: 23000 S: 23000
Number of employees at the closing date of the year. This figure shows the total number of employees for the company.
I Operating Income after Depreciation & Amortization
Industrial Template G: 30235 (Operating P/L) D: 13022 S: 13022
Represents the difference between sales and total operating expenses and total depreciation and amortization.
I Ordinary Dividends Industrial Template D: 13046
Dividend to ordinary or common shares

Appendices
69
S: 13046
L Other Capital Industrial Template G: 30100
Global format account including Share Premium, Treasury Shares, Revaluation Shares, Retained Earnings, Other Shareholders Reserves. Includes all Shareholders Funds except Share Capital.
A Other Current Assets
Industrial Template G: 30020 D: 20050 S: 20050
Miscellaneous short-term assets, but not cash and equivalent, receivables, inventories and prepayments & advances. In the Global format it will also include the following line items which appear separately in the Global detailed and Spreadsheet formats: Prepaid Expenses & Advances, Deferred Charges, Total Cash & Short Term Investment.
L Other Current Liabilities
Industrial Template (Anglo) G: 30070 D: 21055 S: 21055
Miscellaneous other short-term liabilities, short term debt, and current portion of long term debt, or not otherwise disclosed among current liabilities. E.g. current provisions, deposits, customer advances, prepaid liabilities, uncalled capital,... In the Global format this item also includes the following line items which appear separately in the Global detailed and Spreadsheet formats: Other Short Term Debt, Other Creditors, Income Tax Payable, Social Expenditure Payable and Dividends Payable.
I Other Expenses Industrial Template (Anglo) R: 10460
Non disclosed expenses (before operating profit result), not considered as or included in Other Operating Expenses (line 10446). The item can often be found under this

OSIRIS Internet - Data Guide
70
name in the company report. Could be incidental expenses.
I Other Losses and Expenses
Industrial Template (Anglo and Continental) R: 10449 This line is part of line 22080 Other non Oper./Financial Inc./Exp.
This line is for all losses and expenses which are non-operational and whose nature might not be clearly identified in the source document, and/or can not be coded as financial expenses or as another sub-item of line 22080 - Other non Oper./Financial Inc./Exp.
L Other non Current Liabilities
Industrial Template G: 30085 D: 21090 S: 21090
Miscellaneous non-interest bearing debt, e.g. provisions, deferred taxes and minority interests
I Other Non-Operating/ Financial Items
Industrial Template G: 30255 D: 22080 S: 22080
Other non-operating/financial income & expenses, investment income, Forex (foreign exchange) adjustments, associated companies, gains and or loss sale of assets and other losses and expenses. In the Global format, this also includes unusual/exceptional items that appear separately in the Global detailed and Spreadsheet formats.
I Other Operating Expenses
Industrial Template (Anglo and Continental) R:10446
This item covers operational expenses whose nature might not be clearly identified in the source document, and/or can not be coded as Administrative, Maintenance,... Expenses which are all sub-items of 'Other Operating Items'. These miscellaneous other operating expenses could be Travel and training, Insurance, Rental and lease payments, Third party services,...
I Other Operating Items
Industrial Template D: 22035 S: 22035
This figure is a total of the sub-items which are displayed at the Raw Data level (or in the Data formula table)

Appendices
71
These sub-items are all operational items and can not be coded as COGS, Other revenue, R&D Expenses,... The sub-items can differ per template and company as not each company provides the same kind of information or level of detail in the annual report.
A Other Fixed Assets Industrial Template G: 30045
A combined account in the Global format including Exploration, Long Term Receivables, Investments, Long Term Associated Companies, Investment Properties and Other Long Term Assets.
A Other Intangibles Industrial Template D: 13071 S: 13071
Total of all intangibles, net, excluding Goodwill.
A Other Long Term Assets
Industrial Template D: 20230 S: 20230
Miscellaneous long-term assets, but not fixed assets, long term investments and intangibles.
I Other Revenues Industrial Template D: 13003 S: 13003
Refers to all operating income items other than sales income. Companies often disclose such item in their Income statement. When further detail is disclosed in the Income statement or the notes to the Income statement, the analyst checks in the operating character of each item and only includes so that only operating items are included in line 13003. If for instance 'Interest income' is also part of the total figure for Other revenue/income in the annual report, it is deducted from the total figure and can be found under a more suiting line number on OSIRIS i.e. line '13025 Financial revenue' in the case of 'Interest Income.

OSIRIS Internet - Data Guide
72
L Other Shareholders Reserves
Industrial Template D: 21185 S: 21185
Sum of legal, special, untaxed, monetary, exchange translation, capital redemption and goodwill reserves. The revaluation reserves appear separately in the Global detailed and Spreadsheet formats.
L Other Short Term Debt
Industrial Template D: 21030 S: 21030
Sum of short notes payable, current loans & overdraft, short commercial paper, bills of exchange, short-term discounted bills.
L Participation Shares Industrial Template D: 14029 S: 14029
Shares that generally have no voting rights. Mainly found in Switzerland and Scandinavian countries.
I Preferred Dividends Industrial Template D: 13044 S: 13044
Actual cash dividend payment on preferred stock or the provision for preferred dividends, if in arrears.
L Preferred Shares Industrial Template D: 14026 S: 14026
Represents shares that have a prior claim to the common stock on earnings of the company and to the assets in the event of liquidation. OSIRIS does not consider this item as part of long-term debt as is more common in the USA and Canada.
A Property, Plant & Equipment at Cost
Industrial Template S: 20245 This is a memo line.
Acquisition cost of the fixed assets. If available and allowed under local GAAP it excludes revaluation of assets.
L Provisions Industrial Template D: 21105 S: 21105
Found in non-US companies, it includes reserves for repair and maintenance, litigation, various types of claims. Provision for pension funds is entered as a separate item.
L Redeemable Preferred Shares
Industrial Template D: 14025 S: 14025
Equity shares that carry a higher dividend rate and can be callable by the company at a stated

Appendices
73
redemption price; these shares have priority over common/ordinary shares.
L Retained Earnings Industrial Template D: 14036 S: 14036
The accumulated after tax earnings of the company which have not been distributed as dividends to shareholders or allocated to a reserve. It also may include merger reserves, reserves for associated undertakings and goodwill written off.
A Revaluation of Property, Plant & Equipment
Industrial Template S: 20250 This is a memo line.
Where permitted under local GAAP the amount of re-appraised value of the fixed assets to current market value.
I Sales of Assets The figure for Sale of Assets from the annual report are processed in the following ways for companies which are sourced by WVB.
Annual report *Net profit/ (loss) from sale of assets *Proceeds from sale of assets *Cost of sale of assets *Both 'Proceeds for sale of assets' and 'Cost of sale of assets' are disclosed
OSIRIS - Raw Data *10409 Asset Disposal *10351 Other Income *10449 Other Losses and Expenses *The figures are netted to derive Net profit/ (loss) on disposal and the figure is captured in 10409 Asset Disposal
L Share Capital Industrial Template G: 30095 (Capital) D: 21135 S: 21135 Equivalent to Capital in the Global format.
All paid-up shares namely Redeemable Preferred shares, Preference shares, common stock and participation shares.
L
Shareholders Funds Industrial Template G: 30090 D: 14041 S: 14041
Represents the sum of share capital, shareholders' reserves, retained earnings, treasury stock and other equity.
A Short Term Investment
Industrial Template D: 13051 S: 13051
Represents all short-term investments (quoted and unquoted) that can be realized on short notice.
A Stock Industrial Template G: 30010
Also referred to as inventories in the Global

OSIRIS Internet - Data Guide
74
D: 20010 S: 20010
detailed and Spreadsheet formats, it includes Raw Materials, Work-in-Progress, Finished Goods and Inventory Prepayments.
A Total Assets Industrial Template G: 30050 D: 13077 S: 13077
The sum of total current assets, long term receivables, investments in unconsolidated companies, other investments, net property, plant and equipment and other assets, including intangibles.
A Total Cash & Short Term Investment
Industrial Template G: 30025 (Cash & Cash Equivalent) D: 20070 S: 20070
Cash and cash equivalent (all immediate negotiable medium of exchange or instrument normally accepted by banks for deposits and immediate credit to a customer account; this also represents funds that can be used to pay current invoices) and short-term investments (quoted and unquoted) that can be realized on short notice.
A Total Current Assets Industrial Template G: 30005 (Current Assets) D: 13061 S: 13061
All short term assets, namely: cash, short term investments, inventories, accounts receivables, prepayments, advances and other current assets.
L Total Current Liabilities
Industrial Template G: 30055 (Current Liabilities) D: 14011 S: 14011
All short term liabilities, namely: accounts payable, short-term debt, current portion of long term debt, and other current liabilities.
L Total Debt Industrial Template S: 22100 This is a memo line.
The sum of Total Long Term Debt and Total Short Term Debt.
A Total Depreciation, Amortization & Depletion
Industrial Template G: 30230 (Depreciation/Amortization) D: 13021 S: 13021
The sum of the process of allocating the cost of depreciation, amortization and depletion expenses.
L Total Liabilities & Debt
Industrial Template G: 30115
Includes total current liabilities, total long-term

Appendices
75
D: 14022 S: 14022
interest bearing debt, minority interest, deferred taxes, provisions and other long term liabilities.
L Total Liabilities & Equity
Industrial Template G: 30105 (Total Shareholders Funds and Liabilities) D: 14042 S: 14042
Includes total liabilities and debt and shareholders' equity.
L Total Long Term Debt
Industrial Template S: 22105 This is a memo line.
Equivalent to Long Term Debt in the Global format and Total Long Term Interest Bearing Debt in the Global Detailed and Spreadsheet formats.
L Total Short Term Debt
Industrial Template S: 22110 This is memo line.
Current portion of Long term Debt and Other Short Term Debt (current loans and overdraft, short term commercial paper, bills of exchange, short term notes payable,...).
I Total Operating Revenues
Industrial Template G: 30205 (Op. Rev./ Turnover) D: 13004 S: 13004
Sum of net sales and other revenues. The Turnover figure is always taken as per the financial statement of the company report. Most companies mention clearly this figure is excluding VAT. However, for some companies there is no information provided on VAT, or the figure is stated as after less indirect taxes or excluding sales related taxes.
I Transfer to Reserves/Provisions
Industrial Template (Anglo and Continental) R: 10450
This item covers all kind of reserves or provisions. It depends on the company's report what is the exact nature of this item. Mostly this is a non-operating item. For instance, provisions for doubtful or yet unpaid accounts, or allocations for provisions on inventory are coded under this item.

OSIRIS Internet - Data Guide
76
L Treasury Shares Industrial Template D: 14030 S: 14030
Represents the acquisition cost of a company's own shares held by the company. For non-US companies treasury stock may be carried at par value. This stock is not entitled to dividends, has no voting rights or claim upon liquidation.
I Unusual/ Exceptional items
Industrial Template D: 13023 S: 13023
Represents any pretax charge/income that is infrequent and/or unusual included in the net income of the company.
L Working Capital Industrial Template G: 30110
Defined as Debtors + Stocks - Creditors
* Even though in most cases the item is an expense and has a negative figure, positive amounts can be found for the following expense items: Amortisation & Depletion, Auditor renumeration, COGS, Depreciation, Impairments and Research & Development Expenses. The (net) figures on Osiris are presented as they appear in the company reports. Companies disclose the item in the same line, and by doing so it allows comparability of current and previous years figures. Copyright © 2011 Last updated September 2011
Ratios definitions
2
Industrial company ratios
Industrial company ratios on OSIRIS are available in two sets: those developed by Bureau van Dijk Electronic Publishing for the OSIRIS database and those developed by World'Vest Base for the WVB formats.
Industrial Ratios - Global Template
Profitability ratios
31010
Return on shareholders funds (%)
(P/L Before tax / Shareholders Funds) * 100 (30260 / 30090) * 100
31020
Return on capital employed (%)
(P/L Before tax Interest Expense) / (Shareholders Funds + Non-Current Liabilities) * 100 (30260 - 30245) / (30090 + 30075) * 100

Appendices
77
31015
Return on total assets (%)
(P/L Before tax / Total Assets) * 100 (30260 / 30050) * 100
31005 Profit margin (%) P/L Before tax / Operating Revenue (Turnover) * 100 (30260 / 30205) * 100
31050 Gross margin (%)
(Gross Profit / Operating Revenue) * 100 (30220 / 30205) * 100
31060
EBITDA margin (%)
(EBITDA / Operating Revenue) * 100 (30320 / 30205) * 100
31055 EBIT margin (%)
(EBIT / Operating Revenue) * 100 (30310 /30205) * 100
31045
Cash flow/ Operating revenue (%)
(Cash Flow / Operating Revenue) * 100 (30295 / 30205) * 100
31065
ROE (%) (P/L for period / Shareholders Funds) * 100 (30280 /30090) * 100
31070
ROA (%) (P/L for period / Total Assets) * 100 (30280 / 30050) * 100
31075
ROCE (%) [(P/L for period - Interest Expense) / (Shareholders Funds + Non-Current Liabilities)] * 100 [(30280 30245) / (30090 + 30075)] * 100
31080 Enterprise value / EBITDA
(Enterprise Value / EBITDA) * 100 31108 / 30320
31085 Market cap / Cash flow from operations
Market Cap/Cash Flow from Operations
Operational ratios
31225 Net assets turnover
Operating Revenue / (Shareholders Funds + Non-current Liabilities) 30205 / (30090 + 30075)
31115 Interest cover (Operating P/L / Interest Expense) * -1 (30235 / 30245) * -1
31220 Stock turnover
Operating Revenue / Stock 30205 / 30010
31120 Collection period (days)
(Debtors / Operating Revenue) * 360 (30015 / 30205) * 360
31125
Credit period (days) (Creditors / Operating Revenue) * 360 (30065 / 30205) * 360
31130 R&D expenses / Operating revenue (%)
(Research & Development Expenses / Operating revenue) * 100 (22020 / 30205) * 100
Structure ratios
31105
Current ratio
Current Assets / Current Liabilities 30005 / 30055
31110
Liquidity ratio (Current Assets Stocks) / Current Liabilities (30005-30010) / 30055
31305 Shareholders liquidity ratio Shareholders Funds / Non-current Liabilities 30090 / 30075
31310
Solvency ratio (%)
(Shareholders Funds / Total Assets) * 100 (30090 / 30050) * 100

OSIRIS Internet - Data Guide
78
31315
Gearing (%) (Non-current Liabilities + Loans) / Shareholders Funds (30075 + 30060) / 30090
Per employee ratios
31040 Profit per employee (th.)
P/L Before tax / Number of Employees 30260 / 30120
31030
Operating revenue per employee (th.)
Operating Revenue / Number of Employees 30205 / 30120
31025
Cost of employees / operating revenue (%)
(-Cost of Employees / Operating Revenue) *100 (-30290 / 30205) * 100
31035
Average cost of employee (th.)
-Cost of Employees / Number of Employees -30290 / 30120
31205
Shareholders funds per employee (th.)
Shareholders Funds / Number of Employees 30090 / 30120
31210 Working capital per employee (th.)
Working Capital / Number of Employees 30110 / 30120
31215
Total assets per employee (th.)
Total Assets / Number of Employees 30050 / 30120
Copyright © 2011 Last updated September 2011
2
Bank ratios
The 36 pre-calculated ratios are based on the Global format; please refer to that template for line item numbers.
Asset Quality Ratios
44001 Loan Loss Reserves/ Gross Loans
44002 Loan Loss Provisions/ Net Interest Rev.
44003 Loan Loss Reserves / Impaired Loans

Appendices
79
44004 Impaired Loans / Gross Loans
44005 Net Charge Offs / Average Gross Loans
44006 Net Charge Offs/ Net Income Before Loan Loss Provision
44037 Impaired Loans / Equity
44038 Unreserved Impaired Loans / Equity
Capital Ratios
44007 Tier 1 Ratio
44008 Capital Adequacy Ratio
44009 Equity / Total Assets
44010 Equity/ Net Loans
44011 Equity/ Deposits & Short Term Funding
44012 Equity/ Liabilities
44013 Capital Funds / Total Assets

OSIRIS Internet - Data Guide
80
44014 Capital Funds/ Net Loans
44015 Capital Funds/ Deposits & Short Term Funding
44016 Capital Funds/ Liabilities
44017 Subordinated Debt / Capital Funds
Operations Ratios
44018 Net Interest Margin
44019 Net Interest Income / Average Assets
44020 Other Operating Income/ Average Assets
44021 Non Interest Expenses / Average Assets
44022 Pre-tax Operating Income/ Avg. Assets
44023 Non Operating Items & Taxes/ Average Assets
44024 Return on Average Assets (ROAA)

Appendices
81
44025 Return on Average Equity (ROAE)
44026 Dividend Payout
44027 Income Net of Distribution/ Average Equity
44028 Non Operating Items/ Net Income
44029 Cost to Income Ratio
44030 Recurring Earning Power
Liquidity Ratios
44031 Interbank Ratio
44032 Net Loans / Total Assets
44033 Net Loans / Deposits & Short Term Funding
44034 Net Loans / Total Deposits & Borrowings
44035 Liquid Assets/ Deposits & Short Term Funding

OSIRIS Internet - Data Guide
82
44036 Liquid Assets/ Total Deposits & Borrowings
Different sets of ratios are used based on the three templates in the Global detailed formats. Please refer to the corresponding template for the line item numbers.
Copyright © 2011 Last updated September 2011
Insurance company ratios - Life Ratios
Different sets of ratios are used based on the three templates in the Global detailed formats. Please refer to the corresponding template for the line item numbers.
Profitability Ratios
35951 Return on Shareholders Funds (Profit before Tax/ Shareholders Funds)*100 (291113/35902)*100
35952 Profit Margin (Profit before Tax/ Operating Revenue)*100 (291113/35903)*100
35953 Return on Total Assets (Profit before Tax/ Total Assets)*100 (291113/35901)*100
290023 Net Premium Written / Total Gross Premiums
Net Premium Written / (Gross Single Premium Written + Gross Annual Premium Written + Gross Other Direct Premium) * 100 222700 / (220300+220400+220588) * 100
290024 Expense Ratio (Commission Expenses + Management Expenses) / Net Premium Written * 100 (228200+229200) / 222700 * 100
290028 Investment Return
Net Investment Income / (Liquid Assets + Unquoted Investments + Real Estate & Property + Loans & Mortgages) AVG * 100 230600 / (212600+216000+216500+217000) AVG * 100
290029 Investment Yield Net Investment Income + Realised Gains(losses) + Unrealised G/L Non Linked + Unrealised G/L Linked + Unrealised G/L Other) / Total Assets * 100 (230600+231000+231350+231650+231996) / 219900 * 100

Appendices
83
290026 Combined Ratio Net Claims + Commission Expenses+Management Expenses) / Net Premium Written * 100 (226000+228200+229200) / 222700 * 100
290033 Profitability Ratio Profit Before tax / Net Premium Written * 100 235500 / 222700 * 100
290034 Dividends/Profit before Tax Dividends / Profit Before Tax * 100 238100 / 235500 * 100
Liquidity Ratios
290030 Debtors Ratio (Insurance Debtors + Deposits With Ceding Companies) / (Surplus + Free Reserves within L/T Fund) * 100 (213300+213700) / (203000+206302) * 100
Structure Ratios
35955 Solvency Ratio Shareholders Funds/ Total Assets * 100 (35902/35901)*100
290022 Solvency Ratio - Life (Total Assets –Non-life Assets) / (Total Liabilities – Surplus-Free Reserves within LT Fund- Non-life Liabilities) * 100 (219900-215500) / (209900-203000-206302-204509)* 100
290021 Free Reserve Ratio Free Reserves within LT Fund + Surplus-Non-Life Shareholders Funds) / (Total Assets-Non-life Assets) *100 (206302+203000-201700) / (219900-215500) * 100
290025 Net Claims / Gross Claims Net Claims / Gross Claims * 100 226000 / 225000 * 100
290027 Net Premiums / Total Life Free Reserves
Net Premium Written / (Free Reserves within LT Fund + Surplus – Non-life Shareholders Funds) * 100 222700 / (206302+203000-201700) * 100

OSIRIS Internet - Data Guide
84
290031 Investments Ratio (Quoted Investments + Real Estate and Property) / (Surplus + Free Reserves within L/T Fund) * 100 (212100+216500) / (203000+206302) * 100
290032 Inter-Company Investments Ratio
Inter-Company Investments / (Surplus + Free Reserves within L/T Fund) * 100 217600 / (203000+206302) * 100
Insurance company ratios - Non-Life Ratios
Different sets of ratios are used based on the three templates in the Global detailed formats. Please refer to the corresponding template for the line item numbers.
Profitability Ratios
35951 Return on Shareholders Funds (Profit before Tax/ Shareholders Funds)*100 (291113/35902)*100
35952 Profit Margin (Profit before Tax/ Operating Revenue)*100 (291113/35903)*100
35953 Return on Total Assets (Profit before Tax/ Total Assets)*100 (291113/35901)*100
290008 Net Premiums / Gross Premiums
Net Premium Written / Gross Premium Written * 100 222700 / 220600 * 100
290011 Investment Yield Net Investment Income / (Liquid Assets + Unquoted Investments + Real Estate and Property + Loans & Mortgages + Inter-Company Investments) AVG * 100 230600 / (212600+216000+216500+217000+217600) AVG * 100
290012 Pre-Tax Profitability (Profit Before tax – Life Profits) / (Surplus – Life Estate) AVG * 100 (235500-234500) / (203000-201400) AVG * 100

Appendices
85
290049 Profit Before Tax / Net Premium Written
(Profit before Tax – Life Profits) / Net Premium Written * 100 (235500-234500) / 222700 * 100
290050 U/W Result / Net Investment Income
Underwriting Result / Net Investment Income * 100 229900 / 230600 * 100
290001 Net Premiums / Surplus
Net Premium Written / (Surplus – Life Estate) * 100 222700 / (203000-201400) * 100
290051 Gross Premiums / Surplus Gross Premium Written / (Surplus – Life Estate) * 100 220600 / (203000-201400) * 100
290054 Life Profits / Profit Before Tax
Life Profits / Profit Before Tax *100 234500 /235500 * 100
290055 Dividend / Profit After Tax Dividends / Profit After Tax *100 238100 / 236900 * 100
290010 Combined Ratios [Commission Expenses + Management Expenses) / Net Premium Written] * 100 + [(Net Claims + Movement in Insurance Funds / Net Premium Earned] * 100 [(228200 + 229200) / 222700] * 100 + [(226000 + 226900) / 223700] * 100
290096 Expense Ratio (Commission Expenses + Management Expenses) / Net Premium Written * 100 (228200 + 229200) / 222700 * 100
290097 Loss Ratio (Net Claims + Movement in Insurance Funds) / Net Premium Earned * 100 (226000 + 226900) / 223700 * 100
Liquidity Ratios
290009 Liquid Assets / Technical Reserves + Other Liabilities
Liquid Assets / ((Net Technical Reserves – Life Funds) + Other Liabilities) * 100 212600 / ((207100-204500)+209800) * 100

OSIRIS Internet - Data Guide
86
290045 Liquid Assets / Net Technical Reserves
Liquid Assets / Net Technical Reserves – Life Funds * 100 212600 / 207100-204500 * 100
290046 Liquid Assets + Insurance Debtors / Net Technical Reserves + Other Liabilities
(Liquid Assets + Insurance Debtors + Deposits with Ceding Companies + Financial Reinsurance ) / (Net Technical Reserves – Life Funds + Other Liabilities) * 100 (212600+213300+213700+214100) / (207100-204500+209800) * 100
290047 Liquid Assets + Deposits with Ceding Co / Net Technical Reserves + Other Liabilities
(Liquid Assets + Deposits with Ceding Companies) / (Net Technical Reserves – Life Funds + Other Liabilities) * 100 (212600+213700) / (207100-204500+209800) * 100
Structure Ratios
35955 Solvency Ratio Shareholders Funds / Total Assets * 100 (35902/35901)*100
290002 Technical Reserves / Net Premiums
(Net Technical Reserves – Life Funds) / Net Premium Written (207100-204500) / 222700 * 100
290003 Technical Reserves / Surplus (Net Technical Reserves – Life Funds) / (Surplus – Life Estate) * 100 (207100-204500) / (203000-201400) * 100
290004 Technical Reserves + Surplus / Net Premiums
((Net Technical Reserves – Life Funds) +(Surplus – Life Estate)) / Net Premium Written * 100 ((207100-204500)+(203000-201400)) / 222700 * 100
290048 Net Claims / Gross Claims Net Claims / Gross Claims * 100 226000 / 225000 * 100
290052 Insurance Debtors / Surplus (Insurance Debtors + Deposits with Ceding Companies + Financial Reinsurance ) / (Surplus – Life Estate) * 100 (213300+213700+214100) / (203000-201400) * 100

Appendices
87
290053 Life Estate / Surplus Life Estate / Surplus *100 201400 / 203000 * 100
Insurance company ratios - Composite Ratios
Different sets of ratios are used based on the three templates in the Global detailed formats. Please refer to the corresponding template for the line item numbers.
Profitability Ratios
35951 Return on Shareholders Funds (Profit before Tax/ Shareholders Funds)*100 (291113/35902)*100
35952 Profit Margin (Profit before Tax/ Operating Revenue)*100 (291113/35903)*100
35953 Return on Total Assets (Profit before Tax/ Total Assets)*100 (291113/35901)*100
290008 Net Premiums / Gross Premiums
Net Premium Written / Gross Premium Written *100 222700 / 220600 * 100
290013 Pre-Tax Profit/ Avg. Surplus Profit before Tax / (Surplus AVG) *100 235500/ 203000 *100
290014 Post-Tax Profit/ Avg. Surplus Profit after Tax / (Surplus AVG) *100 236900/ 203000 *100
290015 Investment Yield Net Investment Income / (Liquid Assets + Other Investments) AVG * 100 230600/(212600+217700) AVG * 100
290016 Dividend / Post-Tax Profit Dividends / Profit After Tax 238100 / 236900 * 100
Structure Ratios
35955 Solvency Ratio Shareholders Funds / Total Assets * 100 (35902/35901)*100

OSIRIS Internet - Data Guide
88
290005 Insurance Debtors/ Surplus Insurance Debtors / Surplus *100 (213300 + 213700) / 203000 * 100
290017 Liquid Assets / Liabilities Liquid Assets / (Net Technical Reserves + Other Liabilities) *100 212600 / (207100+209800) * 100
290018 Liquid Assets / Net Technical Reserves
Liquid Assets / Net Technical Reserves * 100 212600 / 207100 * 100
290019 Underwriting Result / Net Investment Income
Underwriting Results / Net Investment Income * 100 229900 / 230600 * 100
290200 Net Technical Reserve / Surplus Net Technical Reserves / Surplus *100 207100 / 203000 * 100
Stock Data Ratios
Formula for Stock Data Ratios
Industry Bank Insurance
Earnings per share (EPS)
35904 Net Income / 39205 No.
outstanding shares
35904 Net Income / 39205 No.
outstanding shares
35904 Net Income / 39205 No.
outstanding shares
Cash Flow per share
30295 Cash Flow / 39205 No.
outstanding shares
n.a. n.a.
Dividends per share
'13046' Ord. Dividends / 39205 No. outstanding
shares
46830 Dividends / 39205 No.
outstanding shares
n.a.
Book Value per share
35902 Shareh. Funds / 39205 No.
outstanding shares
35902 Shareh. Funds / 39205 No.
outstanding shares
35902 Shareh. Funds / 39205 No.
outstanding shares
Capex per share
(15515 Add. to Fixed Assets* / Asset disp.)
/ 39205 No. outstanding shares
n.a. n.a.
Op. Rev./Turnover per share
35903 Op. Rev./Turnover /
39205 No. outstanding shares
35903 Op. Rev./Turnover /
39205 No. outstanding shares
35903 Op. Rev/Turnover /
39205 No. outstanding shares
Op. Profit per share
30235 Operating P/L / 39205 No.
outstanding shares
(46640 Tot. operating Inc. -
46710 Tot. operating
291113 Profit before Tax / 39205 No.
outstanding shares

Appendices
89
Exp.) / 39205 No. outstanding shares
Tangible Book Value per share
(35902 Shareh. Funds - 30040
Intangible Fixed Assets) / 39205 No. outstanding shares
(35902 Shareh. Funds - 45600
Intangible Assets) / 39205 No.
outstanding shares
(35902 Shareh. Funds - 218600
Goodwill) / 39205 No. outstanding
shares
LT Liabilities per share
30075 Non Current Liab. / 39205 No.
outstanding shares
n.a. n.a.
Working capital per share
30110 Working Capital / 39205 No. outstanding shares
n.a. n.a.
P/E ratio 39202 Market price / 39209 Earnings per
share
39202 Market price / 39209 Earnings per
share
39202 Market price / 39209 Earnings per
share
Earnings yield ratio
39209 Earnings per share / 39202 Market
price
39209 Earnings per share / 39202 Market
price
39209 Earnings per share / 39202 Market
price
Price/Cash Flow ratio
39202 Market price / 39211 Cash Flow per
share
39202 Market price / 39211 Cash Flow per
share
39202 Market price / 39211 Cash Flow per
share
Dividend Yield (39216 Dividends per share / 39202 Market
price) * 100
(39216 Dividends per share / 39202 Market
price) * 100
(39216 Dividends per share / 39202 Market
price) * 100
Dividend Payout per share
(39216 Dividends per share / 39209
Earnings per share) * 100
(39216 Dividends per share / 39209
Earnings per share) * 100
(39216 Dividends per share / 39209
Earnings per share) * 100
Price/Book Value ratio
39202 Market price / 39217 Book Value
per share
39202 Market price / 39217 Book Value
per share
39202 Market price / 39217 Book Value
per share
*SCEX Capital Expenditure for US companies
** 39202 = Market price - Year End
2
WVB Ratios
Profitability Ratios
5020 Return on assets (ROA) Net income after preferred divided by average total assets for the year ( (3045) / (( (3077) + (y-1)(3077) ) / 2.0 )) * 100
5021 Return on net assets (RONA)
Net income after preferred divided by average net fixed assets for the year ( (3045) / (( (3068) + (y-1)(3068) ) / 2.0 )) * 100
5022 Return on gross assets (ROGA)
Net income after preferred divided by average gross fixed assets for the year ((3045) /( (( (3065) + (y-1)(3066)) / 2.0 ) + (( (3065) + (y-1)(3066)) / 2.0 ) )) * 100

OSIRIS Internet - Data Guide
90
5023 Return on gross investment (ROGI)
Net income after preferred divided by average gross investment assets for the year ((3045) / (( (5002) + (y-1)(5002) ) / 2.0) ) * 100
5024 Return on equity (ROE) Net income after preferred divided by average total equity for the year ((3045) / ( ( (4041) + (y-1)(4041) ) / 2.0) ) * 100
5025 Return on invested capital (ROIC)
NOPLAT divided by average invested capital for the year ((5007) / (( (5005) + (y-1)(5005) ) / 2.0) ) * 100
5026 Operating margin % EBIT/Net sales * 100 ((3024) / (3002)) * 100.0
5027 COGS/Sales, % Cost of gods and services/Net sales * 100 (-(3005) / (3002)) * 100.0
5028 Depreciation/Sales, % Depreciation to sales * 100 (-(3019) / (3002)) * 100.0
5029 SG & A /Sales, % Selling, general & administration expense to net sales * 100 (-(3016) / (3002)) * 100.0
5030 Net profit margin Net profit after preferred dividends/Net sales * 100 ((3045) / (3002)) * 100.0
Liquidity Ratios
5050 Quick ratio (equivalent to Acid ratio)
(Cash & equivalent + short term investments + accounts receivable)/current liabilities ( (3050) + (3051) + (3052) ) / (4011)
5051 Cash ratio (Cash & equivalent + short term investments)/current liabilities ( (3050) + (3051) ) / (4011)
5052 Current ratio Current assets / Current liabilities (3061) / (4011)

Appendices
91
5053 Gross cash flow to current liabilities
Gross cash flow/current liabilities (5008) / (4011)
5054 Free cash flow to current liabilities
Free cash flow/current liabilities (5009) / (4011)
5055 Interest coverage EBIT/(Interest expense + dividends on preferred stock) (3024) / ( (3026) + (3046) )
5056 Funded capital ratio Average operating working capital / average interest bearing debt (( (5000) + (y-1)(5000) ) * 0.5 ) / (( (4016) + (y-1)(4016) ) * 0.5 )
5057 Days in inventory Inventory/net sales*365 ( (3053) / (3002) ) * 365
5058 Days in accounts payable Accounts payable/net sales*365 ( (4000) / (3002) ) * 365
5059 Days in cash Cash and equivalent/net sales*365 ( (3050) / (3002) ) * 365
5060 Days in receivables Accounts receivables/net sales*365 ( (3052) / (3002) ) * 365
Asset Utilization Ratios
5075 R&D to sales(%) R&D expense divided by net sales ( (3006) / (3002) ) * 100
5076 Sales to cash Net sales divided by average cash and equivalent ( (3002) / (( (3050) + (y-1)(3050)) * 0.5))
5077 Sales to accounts receivable
Net sales divided by average accounts receivable ( (3002) / (( (3052) + (y-1)(3052)) * 0.5))

OSIRIS Internet - Data Guide
92
5078 Sales to inventories Net sales divided by average inventories ( (3002) / (( (3053) + (y-1)(3053)) * 0.5))
5079 Sales to working capital Net sales divided by average working capital ( (3002) / (( (5001) + (y-1)(5001)) * 0.5))
5080 Sales to fixed assets Net sales divided by average net property, plant and equipment ( (3002) / (( (3068) + (y-1)(3068)) * 0.5))
5081 Sales to total assets Net sales divided by average total assets ( (3002) / (( (3077) + (y-1)(3077)) * 0.5))
Structure Ratios
5040 Financial leverage at book (%)
(Interest bearing debt + Redeemable preferred shares plus preferred shares)/(total equity - redeemable preferred shares - preferred shares) ( (3012) + (4025) + (4026) ) / ( (4041) - (4025) - (4026) )
5041 Debt to capital at book Interest bearing debt divided by total assets (5012) / (3077)
5042 Payout ratio Cash dividends to common stocks divided by net profit (3046) / (3045)
5043 Retention ratio 1 minus payout ratio 1 - (5042)
5044 Z-Score (Working capital/total assets)*1.2+retained earnings/total assets)*1.4+(sales/total assets)+(EITHER (mkt value of equity/total liabilities)*.6 OR (net worth/total liabilities)*.6) ( (5001) / (3077) ) * 1.2 + ( (4036) / (3077) ) * 1.4 + ( (4041) / (4022) ) * 0.6
Memo Lines
5000 Operating working capital
Current assets - cash - marketable securities - (Current liabilities – non interest bearing current liabilities) (3061) - (3050) - (3051) - ( (4011) - (4002) - (4004) )

Appendices
93
5001 Net working capital Total current assets - total current liabilities (3061) - (4011)
5002 Gross investment Change in operating working capital plus capital expenditures plus net change in other assets ((y) (5000) - (y-1)(5000) ) + ((y) (3068) - (y-1)(3068) ) + ((y) (5003) - (y-1)(5003) ) + ((y) (5004) - (y-1)(5004) )
5003 Other assets Goodwill & intangibles + properties (3072) + (3073)
5004 Other liabilities Minority interest + deferred taxes + provisions + other long-term debt (4018) + (4019) + (4020) + (4021)
5005 Invested capital Operating working capital plus net property, plant and equipment plus other net assets (5001) + (3068) + (5003) - (5004)
5006 Enterprise value Sum of Market Cap and Net Debt
5007 NOPLAT EBIT, less taxes on EBIT (Deduced) plus change in deferred taxes. 5014+((y)4019-(y-1)4019)+5015
5008 Gross cash flow NOPLAT add back depreciation (3018) - (3019)
5009 Free cash flow before goodwill
Gross cash flow minus gross investment (5008) - (5002)
5010 Market capitalisation
5011 Operating current assets Current assets - cash - marketable securities (3061) - (3050) - (3051)

OSIRIS Internet - Data Guide
94
5012 Total interest bearing debt
Total long term interest bearing debt + short term debt + current portion of long term debt (4016) + (4002) + (4004)
5013 Change in Deferred Taxes
Deferred taxes current year minus deferred taxes previous year from balance sheet (4019) - (y-1)(4019)
5014 EBIT EBITDA less depreciation, note that amortization is not deducted in the concept of EBIT. (3018) + (3019)
5015 Taxes on EBIT Corporate taxes + tax shield on interest expense - tax shield on interest income - tax shield on non operating income (3035) - ((3035) / ((3034)*(3026))) - ((3035) / ((3034)*(3025))) - ((3035) /( (3034)*((3028+3029+3030))))
5016 Investment in goodwill Goodwill current year less goodwill previous year add back amortisation (y)(3070) - (y-1)(3070) - (3020)
5017 Free cash flow Free cash flow before goodwill less investment in goodwill (5009) - (5016)
5082
Capital (th)
4002+4004+4012+4013+4014+4016+4018+4021+4041
5083
Net operating profit before tax (NOPBT) (th)
3022+((1-(3037/3034))*3028)
5084 Net operating profit after tax (NOPAT) (th)
(5083+3035)
5085 Cash operating profit after tax (COPAT) (th)
(5084+3021)
5086 Total gross capital (TGC) (th)
(5082+3021)

Appendices
95
5178 3yr CAP average (th)
5179
3yr NOPBT average (th)
5180
3yr NOPAT average (th)
5181
3yr COPAT average (th)
5182
3yr TGC average (th)
5156 3yr average pre-tax return risk (th)
5157 3yr average after-tax return risk (th)
5158 3yr average total gross return risk (th)
5147 5yr CAP average (th)
5148 5yr NOPBT average (th)
5149 5yr NOPAT average (th)

OSIRIS Internet - Data Guide
96
5150 5yr COPAT average (th)
5151 5yr TGC average (th)
5192 5yr average pre-tax return risk
5193 5yr average after-tax return risk
5194 5yr average total gross return risk
Per share data
5065 Earnings per share (EPS) (th)
5066 Net sales per share (th)
5067 Free cash flow per share (th)
5068 Working capital per share (th)
5069 Dividend per share (th)
Growth rates
5100 Sustainable growth rate 1-(cost of ordinary dividends/net profit)*ROE 1 - ( (3046) / (3045) ) * (5024)

Appendices
97
5101
Growth in total assets (%)
((3077/[y-1]3077)-1)*100
5102
Growth in fixed assets (%)
((3068/[y-1]3068)-1)*100
5111
Growth in gross fixed assets (%)
((3065/[y-1]3065)-1)*100
5103
Growth in current assets (%)
((3061/[y-1]3061)-1)*100
5104
Growth in operating current assets (%)
((5011/[y-1]5011)-1)*100
5105
Growth in working capita (%)l
((5001/[y-1]5001)-1)*100
5106
Growth in operating working capita (%)l
((5000/[y-1]5000)-1)*100
5107
Growth in gross investment (%)
((5002/[y-1]5002)-1)*100
5108
Growth in total debt (%) ((5012/[y-1]5012)-1)*100
5109
Growth in net turnover (%)
((3002/[y-1]3002)-1)*100
5110
Growth in cash flow (%) ((5009/[y-1]5009)-1)*100
5112
Growth in EBITDA (%) ((3018/[y-1]3018)-1)*100

OSIRIS Internet - Data Guide
98
5113
Growth in EBIT (%)
((3024/[y-1]3024)-1)*100
5114
Growth in net profit (%) ((3045/[y-1]3045)-1)*100
5115
Growth in NOPLAT (%) ((5007/[y-1]5007)-1)*100
5116
Growth in shareholders' equity (%)
((4041/[y-1]4041)-1)*100
5177
3yr Sustainable growth rate (%)
5160
3yr Growth in total assets (%)
5163
3yr Growth in gross fixed assets (%)
5164
3yr Growth in fixed assets (%)
5161
3yr Growth in current assets (%)
5162
3yr Growth in operating current assets (%)
5166
3yr Growth in working capital (%)
5176
3yr Growth in operating working capital (%)

Appendices
99
5167
3yr Growth in gross investment (%)
5165
3yr Growth in total debt (%)
5168
3yr Growth in net turnover (%)
5169
3yr Growth in cash flow (%)
5171
3yr Growth in EBITDA (%)
5172
3yr Growth in EBIT (%)
5173
3yr Growth in net profit (%)
5174
3yr Growth in NOPLAT (%)
5175
3yr Growth in shareholders' equity (%)
5196
5yr Sustainable growth rate (%)
5132
5yr Growth in total assets (%)
5133
5yr Growth in gross assets (%)
5134
5yr Growth in fixed assets (%)

OSIRIS Internet - Data Guide
100
5123
5yr Growth in current assets (%)
5124
5yr Growth in operating current assets (%)
5125
5yr Growth in working capital (%)
5144
5yr Growth in operating working capital (%)
5127
5yr Growth in gross investment (%)
5128
5yr Growth in total debt (%)
5129
5yr Growth in net turnover (%)
5130
5yr Growth in cash flow (%)
5140
5yr Growth in EBITDA (%)
5141
5yr Growth in EBIT (%)
5142
5yr Growth in net profit (%)
5146
5yr Growth in NOPLAT (%)

Appendices
101
5143
5yr Growth in shareholders' equity (%)
Copyright © 2011 Last updated September 2011
Rating definitions
Ratings Definitions
Fitch Ratings
Standard and Poor’s
Moody’s
WVB Ratings
2
Fitch Ratings
Fitch ratings are presented by date of last change and include Record Action and Trend listings. The definitions and abbreviations used for these are noted below.
Record Action
Value Abbreviation
Affirmed Affirmed
Changed Changed
Watch on Watch on
Downgrade Downgrade
New rating New rating
Outlook Outlook
Upgrade Upgrade
Withdrawn Withdrawn
Revision Enhancement Rev. Enhan.
Expected Rating Exp. Rating
Revision Rating Rev. Rating
Trend Codes
Value Abbreviation
POS RW positive
NEG RW Negative
EVO RW Evolving
Off RW Off

OSIRIS Internet - Data Guide
102
RO:POS RO Positive
RO:NEG RO Negative
RO:EVO RO Evolving
RO:STA RO Stable
Fitch Credit Ratings (long Term & Short term)
Fitch credit ratings are an opinion on the ability of an entity or of a securities issue to meet financial commitments, such as interest, preferred dividends, or repayment of principal, on a timely basis. Fitch credit ratings apply to a variety of entities and issues, including but not limited to sovereigns, governments, structured financings, and corporations; debt, preferred/ preference stock, bank loans, and counterparties; as well as the financial strength of insurance companies and financial guarantors.
Fitch credit and other ratings are not recommendations to buy, sell, or hold any security. Ratings do not comment on the adequacy of market price, the suitability of any security for a particular investor, or the tax-exempt nature or taxability of any payments of any security. The ratings are based on information obtained from issuers, other obligors, underwriters, their experts, and other sources Fitch believes to be reliable. Fitch does not audit or verify the truth or accuracy of such information. Ratings may be changed or withdrawn as a result of changes in, or the unavailability of, information or for other reasons.
Credit ratings do not directly address any risk other than credit risk. In particular, these ratings do not deal with the risk of loss due to changes in market interest rates and other market considerations.
Long Term (Fitch)
The following ratings scale applies to foreign currency and local currency ratings.
AAA Highest credit quality. ‘AAA’ ratings denote the lowest expectation of credit risk. They are assigned only in cases of exceptionally strong capacity for timely payment of financial commitments. This capacity is highly unlikely to be adversely affected by foreseeable events.
AA Very high credit quality. ‘AA’ ratings denote a very low expectation of credit risk. They indicate very strong capacity for timely payment of financial commitments. This capacity is not significantly vulnerable to foreseeable events.
A High credit quality. ‘A’ rating denote a low expectation of credit risk. The capacity for timely payment of financial commitments is considered strong. This capacity may, nevertheless, be more vulnerable to changes in circumstances or in economic conditions than for higher ratings.
BBB Good credit quality. ‘BBB’ ratings indicate that there is currently a low expectation of credit risk. The capacity for timely payment of financial commitments is considered adequate, but adverse changes in circumstances and in economic conditions are more likely to impair this capacity. This is the lowest investment-grade category.
BB Speculative. ‘BB’ ratings indicate that there is a possibility of credit risk developing, particularly as the result of adverse economic change over time; however, business or financial alternatives may be available to allow financial commitments to be met. Securities in this category are not investment grade.
B Highly speculative. ‘B’ ratings indicate that significant credit risk is present, but a limited margin of safety remains. Financial commitments are currently being met; however, capacity for continued payment is contingent upon a sustained, favorable business and economic environment.
C, CC,
High default risk. Default is a real possibility. Capacity for meeting financial commitments are solely reliant upon sustained, favorable business or economic

Appendices
103
CCC developments. A ‘CC’ rating indicates that default of some kind appears probable. ‘C’ ratings signal imminent default.
D, DD, DDD
Default. Entities rated in this category have defaulted on some or all of their obligations. Entities rated 'DDD' have the highest prospect for resumption of performance or continued operation with or without a formal reorganization process (the potential for recovery estimated to be about 90% - 100% of outstanding amounts & accrued interest). Entities rated 'DD' and 'D' are generally undergoing a formal reorganization or liquidation process; those rated 'DD' are likely to satisfy a higher portion of their outstanding obligations (potential recoveries in the range of 50% - 90%), while entities rated ‘D’ have a poor prospect of repaying all obligations (below 50%). (While expected recovery values are highly speculative and cannot be estimated with any precision, the above percentages are meant to serve as general guidelines.)
Notes to Long-Term Ratings: • "+" or "-" may be appended to a rating to denote relative status within major rating
categories. Such suffixes are not added to the ‘AAA’ long-term rating category, to categories below ‘CCC’.
• ‘NR’ indicates that Fitch Ratings does not rate the issuer or issue in question. • ‘Withdrawn’: A rating is withdrawn when Fitch Ratings deems the amount of information
available to be inadequate for rating purposes, or when an obligation matures, is called, or refinanced.
• Rating Watch and Rating Outlook: Ratings are placed on Rating Watch or Rating Outlook to indicate that there is a reasonable likelihood of a rating change as well as the likely direction of such change. Rating Watch is typically resolved over a relatively shorter period (12 months), than Rating Outlook (beyond 1 to 2 years). Indicators are designated as “Positive”, indicating a potential upgrade, “Negative”, for a potential downgrade, or “Evolving”, if ratings may raised, lowered, or maintained.
Short Term (Fitch Ratings)
The following ratings scale applies to foreign currency and local currency ratings. A short-term rating has a time horizon of less than 12 months for most obligations, or up to three years for U.S. Public Finance securities, and thus places greater emphasis on the liquidity necessary to meet financial commitments in a timely manner.
F1 Highest credit quality. Indicates the strongest capacity for timely payment of financial commitments; may have an added “+” to denote any exceptionally strong credit feature.
F2 Good credit quality. A satisfactory capacity for timely payment of financial commitments, but the margin of safety is not as great as in the case of the higher ratings.
F3 Fair credit quality. The capacity for timely payment of financial commitments is adequate; however, near-term adverse changes could result in a reduction to non-investment grade.
B Speculative. Indicates minimal capacity for timely payment of financial commitments, plus vulnerability to near-term adverse changes in financial and economic conditions.
C High default risk. Default is a real possibility. Capacity for meeting financial commitments is solely reliant upon a sustained, favorable business and economic environment.
D Default. Denotes actual or imminent default on payment.
Notes to Short-Term Ratings: • "+" may be appended to a ‘F1’ rating to denote relative status within the category. • ‘NR’ indicates that Fitch Ratings does not rate the issuer or issue in question.

OSIRIS Internet - Data Guide
104
• ‘Withdrawn’: A rating is withdrawn when Fitch Ratings deems the amount of information available to be inadequate for rating purposes, or when an obligation matures, is called, or refinanced.
• Rating Watch and Rating Outlook: Ratings are placed on Rating Watch or Rating Outlook to indicate that there is a reasonable likelihood of a rating change as well as the likely direction of such change. Rating Watch is typically resolved over a relatively shorter period (12 months), than Rating Outlook (beyond 1 to 2 years). Indicators are designated as “Positive”, indicating a potential upgrade, “Negative”, for a potential downgrade, or “Evolving”, if ratings may raised, lowered, or maintained.
Individual (Fitch Ratings)
Fitch Individual Ratings, which are internationally comparable, attempt to assess how a bank would be viewed if it were entirely independent and could not rely on external support. These ratings are designed to assess a bank’s exposure to, appetite for, and management of risk, and thus represent Fitch Ratings’s view on the likelihood that it would run into significant difficulties such that it would require support.
The principal factors analysed to evaluate the bank and determine these ratings include profitability and balance sheet integrity, franchise, management, operating environment, and prospects. Consistency is also an important consideration.
A A very strong bank. Characteristics may include outstanding profitability and balance sheet integrity, franchise, management, operating environment, or prospects.
B A strong bank. There are no major concerns regarding the bank. Characteristics may include strong profitability and balance sheet integrity, franchise, management, operating environment, or prospects.
C An adequate bank which, however, possesses one or more troublesome aspects. There may be some concerns regarding its profitability and balance sheet integrity, franchise, management, operating environment or prospects.
D A bank which has weaknesses of internal and/or external origin. There are concerns regarding its profitability and balance sheet integrity, franchise, management, operating environment or prospects.
E A bank with very serious problems which either requires or is likely to require external support.
Notes to Individual Ratings: • Gradations: Gradations are used among these five Ratings, e.g. A/B, B/C, C/D, and D/E. • Rating Watch and Rating Outlook: Ratings are placed on Rating Watch or Rating
Outlook to indicate that there is a reasonable likelihood of a rating change as well as the likely direction of such change. Rating Watch is typically resolved over a relatively shorter period (12 months), than Rating Outlook (beyond 1 to 2 years). Indicators are designated as “Positive”, indicating a potential upgrade, “Negative”, for a potential downgrade, or “Evolving”, if ratings may raised, lowered, or maintained.
Copyright © 2011 Last updated September 2011
2
Moody’s
All Moody’s ratings indicate date of last change the direction and a Watchlist indicator, date and reason. The definitions and abbreviations used for these are noted below.

Appendices
105
Rating Direction
Value Description
DEF Rating change from Prospective to Definitive
DEL Deleted (for correction purposes only)
DNG Downgraded
MFD Modified Rating Notation (for example Aa to Aa2)
NEW New
NOT Notation Change (for example VMIG 1 to P-1)
RIN Reinstated
UPG Upgraded
WDR Withdrawn
Watchlist
• When Watchlist Indicator is ON:
Value Description
DNG On watch for possible downgrade
UNC On watch for possible upgrade or downgrade
UPG On watch for possible upgrade
• When Watchlist Indicator is OFF
Value Description
DNG Off watch because of a rating downgrade
UPG Off watch because of a rating upgrade
WDR Off watch because of a rating withdrawal
• When Watchlist Indicator is CFO or OFF
Value Description
CFM Rating Confirmation
Bank Deposits (Long Term and Short Term)
Moody’s Bank Deposit Ratings are opinions of a bank’s ability to repay punctually its foreign and/or domestic currency deposit obligations. Moody’s Bank Deposit Ratings are intended to

OSIRIS Internet - Data Guide
106
incorporate those aspects of credit risk that are relevant to the prospective payment performance of the rated bank with respect to its foreign and/or domestic currency deposit obligations. Included are factors such as intrinsic financial strength, sovereign transfer risk (for foreign currency deposits), and both implicit and explicit external support elements.
Moody’s Bank Deposit Ratings do not take into account the benefit of deposit insurance schemes that make payments to depositors, but they do recognize the potential support from schemes that may provide direct assistance to banks.
Long Term (Moody's)
Aaa Exceptional financial security with the smallest degree of risk. While the financial strength of these companies may change, such changes as can be visualized are most unlikely to impair the companies' strong positions.
Aa
Excellent financial security. These counterparties are rated lower than Aaa counterparties because long-term risks appear somewhat greater. The margins of protection may not be as great as with Aaa counterparties, or fluctuations of protective elements may be of greater amplitude.
A Good financial security. However, elements may be present that suggest a susceptibility to impairment at sometime in the future.
Baa Adequate financial security. However, certain protective elements may be lacking or may be characteristically unreliable over any great length of time
Ba Questionable financial security. Often the ability of these companies to meet counterparty obligations may be uncertain and thereby not well safeguarded in the future.
B Poor financial security. Assurance of punctual payment of obligations over any long period of time is small.
Caa Extremely poor financial security. Such counterparties may be in default, or there may be present elements of danger with regard to financial capacity.
Ca Usually in default on obligations.
C Usually in default and potential recovery values are low.
Note to Bank Deposits Long Term : Moody's applies numerical modifiers 1, 2, and 3 in each generic rating category from Aa to B. The modifier 1 indicates that the counterparty is in the higher end of its letter-rating category; the modifier 2 indicates a mid-range ranking; and the modifier 3 indicates that the counterparty is in the lower end of its letter- rating category
Short Term (Moody's)
Prime-1 Superior credit quality and a very strong capacity for timely payment of short-term deposit obligations.
Prime-2 Strong credit quality and a strong capacity for timely payment of short-term deposit obligations.
Prime-3 Acceptable credit quality and an adequate capacity for timely payment of short-term deposit obligations.
Not Prime
Questionable to poor credit quality and an uncertain capacity for timely payment of short-term deposit obligations.

Appendices
107
Long Term Debt (Moody’s)
Aaa Best Quality. They carry the smallest degree of investment risk and are generally referred to as "gilt edged". Interest payments are protected by a large or by an exceptionally stable margin and principal is secure. While the various protective elements are likely to change, such changes as can be visualized are most unlikely to impair the fundamentally strong position of such issues.
Aa High Quality by all standards. Together with the Aaa group they comprise what are generally known as high-grade bonds. They are rated lower than the best bonds because margins of protection may not be as large as in Aaa securities or fluctuation of protective elements may be of greater amplitude or there may be other elements present that make the long-term risk appear somewhat larger than the Aaa securities.
A Upper-medium-grade obligations. Factors giving security to principal and interest are considered adequate, but elements may be present which suggest a susceptibility to impairment some time in the future.
Baa Medium-grade obligations (i.e., they are neither highly protected nor poorly secured). Interest payments and principal security appear adequate for the present but certain protective elements may be lacking or may be characteristically unreliable over any great length of time. Such bonds lack outstanding investment characteristics and in fact have speculative characteristics as well. Ba Bonds which are rated
Ba Have speculative elements; their future cannot be considered as well assured. Often the protection of interest and principal payments may be very moderate, and thereby not well safeguarded during both good and bad times over the future. Uncertainty of position characterizes bonds in this class.
B Lack characteristics of the desirable investment. Assurance of interest and principal payments or of maintenance of other terms of the contract over any long period of time may be small. Caa Bonds which are rated
Caa Poor Standing. Such issues may be in default or there may be present elements of danger with respect to principal or interest.
Ca Speculative in a high degree. Such issues are often in default or have marked shortcomings.
C Extremely poor prospects of ever attaining any real investment standing.
Note: Moody’s applies numerical modifiers 1, 2, and 3 in each generic rating classification from Aa through Caa. The modifier 1 indicates that the obligation ranks in the higher end of its generic rating category; the modifier 2 indicates a mid-range ranking; and the modifier 3 indicates a ranking in the lower end of that generic rating category
Commercial Paper (Moody's)
Commercial paper is a security with an original term to maturity of no longer than 270 days. When commercial paper is identified as asset-backed, it means that the issuance has been structured so that its repayment is intended to be obtained from an identified pool of assets. There are two types of asset-backed commercial paper (ABCP) programs: fully supported and partially supported programs.
Fully supported ABCP is commercial paper whose repayment is supported by a financial guarantee (i.e. surety bond, letter of credit, third-party guarantee or irrevocable liquidity facility) and not by the cash flow from certain assets.

OSIRIS Internet - Data Guide
108
Partially supported ABCP is commercial paper whose repayment primarily depends on the cash flow expected to be realized on a pool of assets, as well as liquidity and credit enhancement provided by third parties.
Bank Financial Strength (Moody's)
Moody’s Bank Financial Strength Ratings represent Moody’s opinion of a bank’s intrinsic safety and soundness and, as such, exclude certain external credit risks and credit support elements that are addressed by Moody's Bank Deposit Ratings. Unlike Moody's Bank Deposit Ratings, Bank Financial Strength Ratings do not address the probability of timely payment. Instead, Bank Financial Strength Ratings can be understood as a measure of the likelihood that a bank will require assistance from third parties such as its owners, its industry group, or official institutions.
Factors considered in the assignment of Bank Financial Strength Ratings include bank-specific elements such as financial fundamentals, franchise value, and business and asset diversification. Although Bank Financial Strength Ratings exclude the external factors specified above, they do take into account other risk factors in the bank's operating environment, including the strength and prospective performance of the economy, the structure and relative fragility of the financial system and the quality of banking regulation and supervision.
The definitions for Moody’s Bank Financial Strength Ratings employ the alphabetic notation A through E as well as the symbol + (for those securities below A level) to indicate gradation. They are as follows:
A Exceptional intrinsic financial strength. Typically, they will be institutions with highly valuable and defensible business franchises, strong financial fundamentals, and a very attractive and stable operating environment.
B Strong intrinsic financial strength. Typically, they will be important institutions with valuable and defensible business franchises, good financial fundamentals, and an attractive and stable operating environment.
C Good intrinsic financial strength. Typically, they will be institutions with valuable and defensible business franchises. These banks will demonstrate either acceptable financial fundamentals within a stable operating environment, or better-than-average financial fundamentals within an unstable operating environment.
D Adequate financial strength, but may be limited by one or more of the following factors: a vulnerable or developing business franchise; weak financial fundamentals; or an unstable operating environment.
E Very weak intrinsic financial strength, requiring periodic outside support or suggesting an eventual need for outside assistance. Such institutions may be limited by one or more of the following factors: a business franchise of questionable value; financial fundamentals that are seriously deficient in one or more respects; or a highly unstable operating environment.
Intermediate Categories :Where appropriate, a "+" may be appended to ratings below the "A" category to distinguish those banks that fall into intermediate categories.
Insurance Financial Strength (Moody's)
Moody's Insurance Financial Strength Ratings are opinions on the ability of insurance companies to repay punctually senior policyholder claims and obligations. Specific obligations are considered un-rated unless they are individually rated because the standing of a particular insurance obligation would depend on an assessment of its relative standing under those laws governing both the obligation and the insurance company.
Insurance Financial Strength Ratings shown in connection with property/casualty groups represent the ratings of individual companies within those groups, as displayed in Moody's insurance industry ratings list. The rating of an individual property/casualty company may be based on the benefit of its participation in an inter-company pooling agreement. Pooling agreements may or

Appendices
109
may not provide for continuation of in-force policyholder obligations by pool members in the event that the property/casualty insurer is sold to a third party or otherwise removed from the pooling agreement.
Moody's assumes in these ratings that the pooling agreement will not be modified by the members of the pool to reduce the benefits of pool participating, and that the insurer will remain in the pool. Moody's makes no representation or warranty that such pooling agreement will not be modified over time, nor does Moody's opine on the probability that the rated entity may be sold or otherwise removed from the pooling agreement.
Derived Issuer Long Term
The Derived Issuer rating relates to industrial corporations and insurance firms only.
The Derived Issuer Long Term ratings on OSIRIS come from Moody's "Senior Unsecured Issuer Ratings".
Senior Unsecured Issuer Ratings are opinions of the ability of entities to honor senior unsecured financial obligations and contracts denominated in foreign and/or domestic currency. Foreign Currency Issuer Ratings are subject to Moody's Foreign Currency Country Ceilings.
When Moody's no longer rates an obligation or an issuer on which it previously maintained a rating, the symbol WR is employed. A withdrawn rating (WR) signifies the removal of a rating on either an obligation or an issuer. Withdrawn ratings reflect Moody's current view of the credit at the time of withdrawal.
Copyright © 2011 Last updated September 2011
2
Standard and Poor’s
Standard and Poor’s ratings are presented by date of last change and include the S&P Outlook value and date. The definitions and abbreviations used for these are noted below.
Outlook Values
Outlook values are presented as Negative, Stable and Positive.
Issuer Credit Ratings
A Standard & Poor's Issuer Credit Rating is a current opinion of an obligor's overall financial capacity (its creditworthiness) to pay its financial obligations. This opinion focuses on the obligor's capacity and willingness to meet its financial commitments as they come due. It does not apply to any specific financial obligation, as it does not take into account the nature of and provisions of the obligation, its standing in bankruptcy or liquidation, statutory preferences, or the legality and enforceability of the obligation. In addition, it does not take into account the creditworthiness of the guarantors, insurers, or other forms of credit enhancement on the obligation. The Issuer Credit Rating is not a recommendation to purchase, sell, or hold a financial obligation issued by an obligor, as it does not comment on market price or suitability for a particular investor.
Issuer Credit Ratings are based on current information furnished by obligors or obtained by Standard & Poor's from other sources it considers reliable. Standard & Poor's does not perform an audit in connection with any Issuer Credit Rating and may, on occasion, rely on unaudited financial information. Issuer Credit Ratings may be changed, suspended, or withdrawn as a result of changes in, or unavailability of, such information, or based on other circumstances. Issuer Credit Ratings can be either long-term or short-term. Short-Term Issuer Credit Ratings reflect the obligor's creditworthiness over a short-term time horizon.

OSIRIS Internet - Data Guide
110
Standard Short Term (Standard and Poor’s)
A-1
Strong capacity to meet its financial commitments. It is rated in the highest category by Standard & Poor's. Within this category, certain obligors are designated with a plus sign (+). This indicates that the obligor's capacity to meet its financial commitments is Extremely Strong.
A-1
Satisfactory capacity to meet its financial commitments. However, it is somewhat more susceptible to the adverse effects of changes in circumstances and economic conditions than obligors in the highest rating category.
A-3
Adequate capacity to meet its financial obligations. However, adverse economic conditions or changing circumstances are more likely to lead to a weakened capacity of the obligor to meet its financial commitments.
B Vulnerable and has significant speculative characteristics. The obligor currently has the capacity to meet its financial commitments; however, it faces major ongoing uncertainties that could lead to the obligor's inadequate capacity to meet its financial commitments.
Foreign Currency Risks (Short Term and Long Term) Country risk considerations are a standard part of Standard & Poor's analysis for credit ratings on any issuer or issue. Currency of repayment is a key factor in this analysis. An obligor's capacity to repay foreign currency obligations may be lower than its capacity to repay obligations in its local currency due to the sovereign government's own relatively lower capacity to repay external versus domestic debt. These sovereign risk considerations are incorporated in the debt ratings assigned to specific issues. Foreign currency issuer ratings are also distinguished from local currency issuer ratings to identify those instances where sovereign risks make them different for the same issuer.
Insurer Financial Strength (S&P)
This rating is a current opinion of the financial security characteristics of an insurance organization with respect to its ability to pay under its insurance policies and contracts in accordance with their terms. This opinion is not specific to any particular policy or contract, nor does it address the suitability of a particular policy or contract for a specific purpose or purchaser. The opinion does not take into account deductibles, surrender or cancellation penalties, timeliness of payment, or the likelihood of the use of a defence such as fraud to deny claims. For organizations with cross-border or multinational operations, including those conducted by subsidiaries or branch offices; the ratings do not take into account potential that may exist for foreign exchange restrictions to prevent financial obligations from being met.
AAA Extremely Strong financial security.
AA Very Strong financial security characteristics, differing only slightly from those rated higher.
A Strong financial security characteristics, but is somewhat more likely to be affected by adverse business conditions than are insurers with higher ratings.
BBB Good financial security characteristics, but is more likely to be affected by adverse business conditions than are higher rated insurers.
BB Marginal financial security characteristics. Positive attributes exist, but adverse business conditions could lead to insufficient ability to meet financial commitments.
B Weak financial security characteristics. Adverse business conditions will likely impair its ability to meet financial commitments.
CCC Very weak financial security characteristics, and is dependent on favorable business conditions to meet financial commitments.
CC Extremely weak financial security characteristics and is likely not to meet some of its financial commitments

Appendices
111
R Regulatory Action regarding solvency. The rating does not apply to insurers subject only to non-financial actions such as market conduct violations.
NR Not Rated, implying no opinion about the insurer's financial security
Differences between major rating agencies and local agencies
The global scale used by S&P and other major international rating agencies would not have a direct one-to-one correspondence with the national rating scale employed by domestic rating agencies. S&P and other major international rating agencies typically have three rating scales to address the various investor segments: global scale foreign currency ratings, global scale local currency ratings, and national scale ratings.
The global scale local currency and foreign currency ratings cater to the needs of transnational investors, with the former excluding the transfer and convertibility risks of changing the local currency into foreign currency (typically US dollars). Global scale ratings are comparable across countries; the peer group analysis features a comparison of all issuers across the globe.
The national scale ratings on the other hand, address the needs of specific national financial markets and are not directly comparable with either global scale ratings or the national scale ratings of other countries. The national scale ratings would be useful to benchmark entities operating in a particular country and would typically have the sovereign's credit quality at the highest rating level.
(information provided by S&P)
Copyright © 2011 Last updated September 2011
Templates - Industrial
2
Global (Industrial - All)
BALANCE SHEET
Assets
30005 Current Assets
30010 Stock
30015 Debtors
30020 Others
30025 Cash & Cash Equivalent
30030 Fixed Assets
30035 Tangible Fixed Assets

OSIRIS Internet - Data Guide
112
30040 Intangible Fixed Assets
30045 Other Fixed Assets
30050 Total Assets
Liabilities
30055 Current Liabilities
30060 Loans
30065 Creditors
30070 Other
30075 Non Current Liabilities
30080 Long Term Debt
30085 Other Non Current Liabilities
30090 Shareholders Funds
30095 Capital
30100 Other
30105 Total Shareholders Funds & Liabilities
30108 Enterprise Value
30110 Working Capital
30112 Net Current Assets
30115 Total Liabilities & Debt
30120 Number of Employees
INCOME STATEMENT
30205 Operating Revenue / Turnover

Appendices
113
30210 Sales
30215 Costs of Goods Sold
30220 Gross Profit
30225 Other Operating Items
30230 Depreciation/Amortization
30235 Operating P/L
30240 Financial Revenue
30245 Financial Expenses
30250 Financial P/L
30255 Other Non-Operating/ Financial Items
30260 P/L before Tax
30265 Taxation
30270 P/L after Tax
30275 Extraordinary & Other Items
30280 P/L for Period
30285 Material Costs
30290 Costs of Employees
30295 Cash Flow
30300 Added Value
30310 EBIT
30320 EBITDA
Copyright © 2011 Last updated September 2011

OSIRIS Internet - Data Guide
114
2
Global detailed (Industrial - Life)
BALANCE SHEET
Assets
13061 Total Current Assets
20010 Net Stated Inventory
20015 Raw Materials
20020 Work in Progress
20025 Finished Goods
20030 Inventory Prepayments
13052 Net Accounts Receivable
20040 Accounts Receivable
20045 Doubtful Accounts
20050 Others
20055 Other Current Assets
13054 Prepaid Expenses & Advances
20065 Deferred Charges
20070 Total Cash & Short Term Investment
13050 Cash or Equivalent
13051 Short Term Investment
20085 Fixed Assets
13068 Net Properly, Plant & Equipment
20095 Land
20100 Total Land Depreciation
20105 Net Stated land

Appendices
115
20110 Buildings
20115 Total Buildings Depreciation
20120 Net Buildings
20125 Plant & Machinery
20130 Plant & Machinery Depreciation
20135 Net Stated Plant & Machinery
20140 Transportation Equipment
20145 Transportation Equipment Depreciation
20150 Net Transportation Equipment
20155 Leased Assets
20160 Leased Assets Depreciation
20165 Net Leased Assets
20170 Other Property Plant & Equipment
20175 Other Property Plant & Equipment Depreciation
20180 Net Other Property Plant & Equipment
20185 Intangibles
13070 Goodwill
13071 Other Intangibles
20200 Other fixed assets
20205 Exploration
20210 Long Term Receivables
20215 Investments
20220 Long Term Associated Companies
20225 Investment Properties
20230 Other Long Term Assets

OSIRIS Internet - Data Guide
116
13077 Total Assets
Liabilities
14011 Total Current Liabilities
21010 Loans
14004 Current Long Term Debt
21020 Trade Creditors
21025 Other
21030 Other Short Term Debt
21035 Other Creditors
21040 Income Tax Payable
21045 Social Expenditure Payable
21050 Dividends Payable
21055 Other Current Liabilities
21060 Non Current Liabilities
14016 Total LT Interest Bearing Debt
21070 Bank Loans
21075 Debentures & Convertible Debt
14014 Lease Liabilities
21085 Other Long Term Interest Bearing Debt
21090 Other non-current liabilities
21095 Pension Fund Provisions
21100 Deferred Taxes
21105 Provisions
21110 Deferred Revenue
21115 Other LT Non-Interest Bearing Debt

Appendices
117
14018 Minority Interest
14022 Total Liabilities and Debt
14041 Total Shareholders Equity
21135 Share Capital
14027 Common Stock/Shares
14029 Participation Shares
14026 Preferred Shares
14025 Redeemable Preferred Shares
21160 Other
14032 Share Premium
14030 Treasury Shares
21175 Revaluation Reserves
14036 Retained Earnings
21185 Other Shareholders Reserves
14042 Total Liabilities and Equity
21210
Net Assets
21215
Net Debt
21220 Enterprise Value
23000 Number of Employees
INCOME STATEMENT
13004 Total revenues
13000 Gross sales
13001 Adjustments/excise tax
13002 Net sales

OSIRIS Internet - Data Guide
118
13003 Other revenues
22199 Cost of Goods Sold
22020 Research and Development Expenses
22035 Other Operating Items
13018 Earnings before Interest, Tax, Depreciation & Amortization
13021 Total Depreciation, Amortization & Depletion
13019 Depreciation
13020 Amortization & Depletion
13022 Operating Income after Depreciation & Amortization
13023 Unusual/Exceptional Items
13024 Earnings before Interest & Tax
13025 Financial revenue
13026 Financial expenses
13027 Financial P/L
22080 Other Non-Operating/ Financial Income/ Expenses
13034 Earnings before tax
13035 Income taxes
13037 Earnings after tax
13038 Minority interest
22115 Other
13043 Extraordinary items after tax
13044 Preferred dividends
13045 Net Profit
13046 Ordinary dividends
13047 Dividend share capital other

Appendices
119
Copyright © 2011 Last updated September 2011
3
Spreadsheet ( Industrial - Anglo )
BALANCE SHEET
Assets
13061 Total Current Assets
20010 Net Stated Inventory
20015 Raw Materials
20020 Work in Progress
20025 Finished Goods
20030 Inventory Prepayments
13052 Net Accounts Receivable
20040 Accounts Receivable
20045 Doubtful Accounts
20050 Others
20055 Other Current Assets
13054 Prepaid Expenses & Advances
20065 Deferred Charges
20070 Total Cash & Short Term Investment
13050 Cash or Equivalent
13051 Short Term Investment
20085 Fixed Assets
13068 Net Properly, Plant & Equipment
20095 Land
20100 Total Land Depreciation
20105 Net Stated land
20110 Buildings
20115 Total Buildings Depreciation
20120 Net Buildings
20125 Plant & Machinery

OSIRIS Internet - Data Guide
120
20130 Plant & Machinery Depreciation
20135 Net Stated Plant & Machinery
20140 Transportation Equipment
20145 Transportation Equipment Depreciation
20150 Net Transportation Equipment
20155 Leased Assets
20160 Leased Assets Depreciation
20165 Net Leased Assets
20170 Other Property Plant & Equipment
20175 Other Property Plant & Equipment Depreciation
20180 Net Other Property Plant & Equipment
20185 Intangibles
13070 Goodwill
13071 Other Intangibles
20200 Other fixed assets
20205 Exploration
20210 Long Term Receivables
20215 Investments
20220 Long Term Associated Companies
20225 Investment Properties
20230 Other Long Term Assets
13077 Total Assets
Memo Lines
20245 Property, plant & equipment at cost
20250 Revaluation of property, plant & equipment
20255 Accumulated depreciation
20260 Net property, plant & equipment
20265 Goodwill & intangibles
20270 Supplementary Data
Liabilities

Appendices
121
14011 Total Current Liabilities
21010 Loans
14004 Current Long Term Debt
21020 Trade Creditors
21025 Other
21030 Other Short Term Debt
21035 Other Creditors
21040 Income Tax Payable
21045 Social Expenditure Payable
21050 Dividends Payable
21055 Other Current Liabilities
21060 Non Current Liabilities
14016 Total LT Interest Bearing Debt
21070 Bank Loans
21075 Debentures & Convertible Debt
14014 Lease Liabilities
21085 Other Long Term Interest Bearing Debt
21090 Other non-current liabilities
21095 Pension Fund Provisions
21100 Deferred Taxes
21105 Provisions
21110 Deferred Revenue
21115 Other LT Non-Interest Bearing Debt
14018 Minority Interest
14022 Total Liabilities and Debt
14041 Total Shareholders Equity
21135 Share Capital
14027 Common Stock/Shares
14029 Participation Shares
14026 Preferred Shares
14025 Redeemable Preferred Shares
21160 Other
14032 Share Premium
14030 Treasury Shares
21175 Revaluation Reserves
14036 Retained Earnings
21185 Other Shareholders Reserves
14042 Total Liabilities and Equity
23000 Number of Employees
Memo Lines
22100 Total Debt
22105 Total Long Term Debt

OSIRIS Internet - Data Guide
122
22110 Total Short Term Debt
21210 Net Assets
21215 Net Debt
21220 Enterprise Value
21200 Supplementary Data
INCOME STATEMENT
13004 Total revenues
13000 Gross sales
13001 Adjustments/excise tax
13002 Net sales
13003 Other revenues
22199 Cost of Goods Sold
22020 Research and Development Expenses
22035 Other Operating Items
13018 Earnings Before Interest, Tax, Depreciation & Amortization
13021 Total Depreciation, Amortization & Depletion
13019 Depreciation
13020 Amortization & Depletion
13022 Operating Income After Depreciation & Amortization
13023 Unusual/Exceptional Items
13024 Earnings Before Interest & Tax
13025 Financial Revenue
13026 Financial Expenses
13027 Net interest
22080 Other Non-Operating/ Financial Income/Expenses
13034 Earnings before tax
13035 Income taxes
13037 Earnings after tax
13038 Minority interest
22115 Other
13043 Extraordinary items after tax
13044 Preferred dividends
13045 Net Profit
13046 Ordinary dividends
13047 Dividend share capital other
Memo Lines
22170 Amortization of Goodwill Pre-Tax
22180 Operating Profit Discontinued Op.
22185 Dividend Received

Appendices
123
22190 Order Backlog
22195 Monetary Correction
22200 Supplementary Data
Copyright © 2011 Last updated September 2011
3
Spreadsheet (Industrial - Continental)
BALANCE SHEET
Assets
13061 Total Current Assets
20010 Net Stated Inventory
20015 Raw Materials
20020 Work in Progress
20025 Finished Goods
20030 Inventory Prepayments
13052 Net Accounts Receivable
20040 Accounts Receivable
20045 Doubtful Accounts
20050 Others
20055 Other Current Assets
13054 Prepaid Expenses & Advances
20065 Deferred Charges
20070 Total Cash & Short Term Investment
13050 Cash or Equivalent
13051 Short Term Investment
20085 Fixed Assets

OSIRIS Internet - Data Guide
124
13068 Net Properly, Plant & Equipment
20095 Land
20100 Total Land Depreciation
20105 Net Stated land
20110 Buildings
20115 Total Buildings Depreciation
20120 Net Buildings
20125 Plant & Machinery
20130 Plant & Machinery Depreciation
20135 Net Stated Plant & Machinery
20140 Transportation Equipment
20145 Transportation Equipment Depreciation
20150 Net Transportation Equipment
20155 Leased Assets
20160 Leased Assets Depreciation
20165 Net Leased Assets
20170 Other Property Plant & Equipment
20175 Other Property Plant & Equipment Depreciation
20180 Net Other Property Plant & Equipment
20185 Intangibles
13070 Goodwill
13071 Other Intangibles
20200 Other fixed assets
20205 Exploration
20210 Long Term Receivables

Appendices
125
20215 Investments
20220 Long Term Associated Companies
20225 Investment Properties
20230 Other Long Term Assets
13077 Total Assets
Memo Lines
20245 Property, plant & equipment at cost
20250 Revaluation of property, plant & equipment
20255 Accumulated depreciation
20260 Net property, plant & equipment
20265 Goodwill & intangibles
20270 Supplementary Data
Liabilities
14011 Total Current Liabilities
21010 Loans
14004 Current Long Term Debt
21020 Trade Creditors
21025 Other
21030 Other Short Term Debt
21035 Other Creditors
21040 Income Tax Payable
21045 Social Expenditure Payable
21050 Dividends Payable
21055 Other Current Liabilities
21059
21060 Non Current Liabilities
14016 Total LT Interest Bearing Debt
21070 Bank Loans
21075 Debentures & Convertible Debt
14014 Lease Liabilities
21085 Other Long Term Interest Bearing Debt
21090 Other non-current liabilities
21095 Pension Fund Provisions
21100 Deferred Taxes
21105 Provisions
21110 Deferred Revenue
21115 Other LT Non-Interest Bearing Debt
14018 Minority Interest

OSIRIS Internet - Data Guide
126
14022 Total Liabilities and Debt
14041 Total Shareholders Equity
21135 Share Capital
14027 Common Stock/Shares
14029 Participation Shares
14026 Preferred Shares
14025 Redeemable Preferred Shares
21160 Other
14032 Share Premium
14030 Treasury Shares
21175 Revaluation Reserves
14036 Retained Earnings
21185 Other Shareholders Reserves
14042 Total Liabilities and Equity
23000 Number of Employees
Memo Lines
22100 Total Debt
22105 Total Long Term Debt
22110 Total Short Term Debt
21210 Net Assets
21215 Net Debt
21220 Enterprise Value
21200 Supplementary data
INCOME STATEMENT
13004 Total revenues
13000 Gross sales
13001 Adjustments/excise tax
13002 Net sales
13003 Other revenues
22199 Cost of Goods Sold
22020 Research and Development Expenses
22035 Other Operating Expenses
13018 Earnings Before Interest, Tax, Depreciation & Amortization
13021 Total Depreciation, Amortization & Depletion
13019 Depreciation

Appendices
127
13020 Amortization & Depletion
13022 Operating Income After Depreciation & Amortization
13023 Unusual/Exceptional Items
13024 Earnings Before Interest & Tax
13025 Financial Revenue
13026 Financial Expenses
13027 Net interest
22080 Other Non-Operating Financial/ Income/ Expenses
13034 Earnings before tax
13035 Income taxes
13037 Earnings after tax
13038 Minority interest
22115 Other
13043 Extraordinary items after tax
13044 Preferred dividends
13045 Net Profit
13046 Ordinary dividends
13047 Dividend share capital other
Memo Lines
22155 Cost of Material
22160 Capitalized Cost
22165 Personnel Expenses
22170 Amortization of Goodwill Pre-Tax
22175 Depreciation Goodwill after Taxation (France)
22180 Operating Profit Discontinued Op.
22185 Dividend Received
22190 Order Backlog
22195 Monetary Correction
22200 Supplementary Data
Copyright © 2011 Last updated September 2011
3
Spreadsheet (Industrial - Hybrid)
BALANCE SHEET
Assets

OSIRIS Internet - Data Guide
128
13061 Total Current Assets
20010 Net Stated Inventory
20015 Raw Materials
20020 Work in Progress
20025 Finished Goods
20030 Inventory Prepayments
13052 Net Accounts Receivable
20040 Accounts Receivable
20045 Doubtful Accounts
20050 Others
20055 Other Current Assets
13054 Prepaid Expenses & Advances
20065 Deferred Charges
20070 Total Cash & Short Term Investment
13050 Cash or Equivalent
13051 Short Term Investment
20085 Fixed Assets
13068 Net Properly, Plant & Equipment
20095 Land
20100 Total Land Depreciation
20105 Net Stated land
20110 Buildings
20115 Total Buildings Depreciation
20120 Net Buildings
20125 Plant & Machinery
20130 Plant & Machinery Depreciation
20135 Net Stated Plant & Machinery
20140 Transportation Equipment
20145 Transportation Equipment Depreciation
20150 Net Transportation Equipment
20155 Leased Assets
20160 Leased Assets Depreciation
20165 Net Leased Assets
20170 Other Property Plant & Equipment
20175 Other Property Plant & Equipment Depreciation
20180 Net Other Property Plant & Equipment
20185 Intangibles
13070 Goodwill
13071 Other Intangibles
20200 Other fixed assets
20205 Exploration
20210 Long Term Receivables
20215 Investments
20220 Long Term Associated Companies

Appendices
129
20225 Investment Properties
20230 Other Long Term Assets
13077 Total Assets
Memo Lines
20245 Property, plant & equipment at cost
20250 Revaluation of property, plant & equipment
20255 Accumulated depreciation
20260 Net property, plant & equipment
20265 Goodwill & intangibles
20270 Supplementary Data
Liabilities
14011 Total Current Liabilities
21010 Loans
14004 Current Long Term Debt
21020 Trade Creditors
21025 Other
21030 Other Short Term Debt
21035 Other Creditors
21040 Income Tax Payable
21045 Social Expenditure Payable
21050 Dividends Payable
21055 Other Current Liabilities
21059
21060 Non Current Liabilities
14016 Total LT Interest Bearing Debt
21070 Bank Loans
21075 Debentures & Convertible Debt
14014 Lease Liabilities
21085 Other Long Term Interest Bearing Debt
21090 Other non-current liabilities
21095 Pension Fund Provisions
21100 Deferred Taxes
21105 Provisions
21110 Deferred Revenue
21115 Other LT Non-Interest Bearing Debt
14018 Minority Interest
14022 Total Liabilities and Debt
14041 Total Shareholders Equity
21135 Share Capital
14027 Common Stock/Shares
14029 Participation Shares

OSIRIS Internet - Data Guide
130
14026 Preferred Shares
14025 Redeemable Preferred Shares
21160 Other
14032 Share Premium
14030 Treasury Shares
21175 Revaluation Reserves
14036 Retained Earnings
21185 Other Shareholders Reserves
14042 Total Liabilities and Equity
23000 Number of Employees
Memo Lines
22100 Total Debt
22105 Total Long Term Debt
22110 Total Short Term Debt
21210 Net Assets
21215 Net Debt
21220 Enterprise Value
21200 Supplementary Data
INCOME STATEMENT
13004 Total revenues
13000 Gross sales
13001 Adjustments/excise tax
13002 Net sales
13003 Other revenues
22199 Cost of Goods Sold
22020 Research and Development Expenses
22035 Other Operating Expenses
13018 Earnings Before Interest, Tax, Depreciation & Amortization
13021 Total Depreciation, Amortization & Depletion
13019 Depreciation
13020 Amortization & Depletion
13022 Operating Income After Depreciation & Amortization
13023 Unusual/Exceptional Items
13024 Earnings Before Interest & Tax
13025 Financial Revenue
13026 Financial Expenses
13027 Net interest
22080 Other Non-Operating/ Financial Income/ Expenses
13034 Earnings before tax
13035 Income taxes
13037 Earnings after tax
13038 Minority interest

Appendices
131
22115 Other
13043 Extraordinary items after tax
13044 Preferred dividends
13045 Net Profit
13046 Ordinary dividends
13047 Dividend share capital other
Memo Lines
22155 Cost of Material
22160 Capitalized Cost
22165 Personnel Expenses
22180 Operating Profit Discontinued Op.
22185 Dividend Received
22190 Order Backlog
22195 Monetary Correction
22200 Supplementary Data
Copyright © 2011 Last updated September 2011
3
Cash Flow Statement (Industrial – All)
CASH FLOWS FROM OPERATING ACTIVITIES
15550 Net Income / Starting Line
15501 Depreciation, Depletion, Amortization & Impairment
15502 Depreciation and Depletion
15503 Amortization of Intangible Assets
15504 Def. Inc. Taxes & Invest. Tax Credit
15505 Other Cash Flow
15506 Funds from Operations before WC Changes & Extra
15508 Dec/Inc in Receivables
15509 Dec/Inc in Inventories
15510 Inc/Dec in Accounts Payable

OSIRIS Internet - Data Guide
132
15511 Inc/Dec in Other Accruals
15512 Dec/Inc in Other Assets/Liabilities
15513 Extraordinary Items
15507 Funds from Other Op. Activities
15514 Net Cash from Operating Activities
CASH FLOWS FROM INVESTING ACTIVITIES
15515 Additions to Fixed Assets
15516 Increase/Decrease Other Long Term Assets
15517 Increase/Decrease in Investments
15518 Net Cash used by Investing Activities
CASH FLOWS FROM FINANCING ACTIVITIES
15519 Inc/Dec in ST Borrowing
15520 Inc/Dec in Long Term Borrowing
15521 Net Proceeds from Sale/Issue Com. & Pref. Stock
15522 Shareholders' Equity Reserve
15524 Common Dividends (Cash)
15525 Preferred Dividends (Cash)
15523 Cash Dividends Paid - Total
15526 Other Source/Use - Financing Activities
15528 Net Cash provided by/used in Financing Activities
BALANCE
15529 Effect of Exchange Rate on Cash and Other Adjustments
15530 Inc/Dec in Cash & ST Investments
15531 Cash & Equivalents at Beginning of Year
15532 Cash & Equivalents at End of Year
Copyright © 2011 Last updated September 2011
3
Cash flow Statement (US accounts)
OPERATING CASH FLOWS
ONET Net Income

Appendices
133
SDEP Depreciation
ODPL Depletion
SDED Depreciation/Depletion
OAMI Amortization of Intangibles
OAMA Amortization of Acquisition Costs
SAMT Amortization
OBDT Deferred Taxes
OACG Accounting Change
OIDO Discontinued Operations
OTRA Extraordinary Item
OUIE Unusual Items
OPRD Purchased R&D
OEIA Equity in Net Earnings/Loss
ONCI Other Non-Cash Items
SNCI Non-Cash Items
OCRC Cash Receipts
OCPD Cash Payments
OACR Accounts Receivable
OITL Inventories
OPPY Prepaid Expenses
OOAS Other Assets
OAPB Accounts Payable
OAEX Accrued Expenses
OPBA Payable/Accrued
OTXP Taxes Payable

OSIRIS Internet - Data Guide
134
OOLB Other Liabilities
OOAL Other Assets & Liabilities, Net
OOCF Other Operating Cash Flow
SOCF Changes in Working Capital
OTLO Total Cash from Operating Activities
INVESTING CASH FLOWS
ICEX Purchase of Fixed Assets
IIAQ Purchase/Acquisition of Intangibles
ISDC Software Development Costs
SCEX Capital Expenditures
IBAQ Acquisition of Business
ISOB Sale of Business
ISFA Sale of Fixed Assets
IINS Sale/Maturity of Investment
IIVN Investment, Net
IINP Purchase of Investments
ISOI Sale of Intangible
IIAN Intangible, Net
IICF Other Investing Cash Flow
SICF Other Investing Cash Flow Items, Total
ITLI Total Cash from Investing Activities
FINANCING CASH FLOWS
FFCF Other Financing Cash Flow
SFCF Financing Cash Flow Items

Appendices
135
FDPC Cash Dividends Paid - Common
FDPP Cash Dividends Paid - Preferred
FCDP Total Cash Dividends Paid
FSIC Sale/Issuance of Common
FRRC Repurchase/Retirement of Common
FCSN Common Stock, Net
FSIP Sale/Issuance of Preferred
FRRP Repurchase/Retirement of Preferred
FPSN Preferred Stock, Net
FSCP Sale/Issuance of Common/Preferred
FRCP Repurch./Retirement of Common/Preferred
FOPX Options Exercised
FWCV Warrants Converted
FTST Treasury Stock
FPSS Issuance (Retirement) of Stock, Net
FSDI Short Term Debt Issued
FSDR Short Term Debt Reduction
FSDN Short Term Debt, Net
FLDI Long Term Debt Issued
FLDR Long Term Debt Reduction
FLDN Long Term Debt, Net
FTDI Total Debt Issued
FTDR Total Debt Reduction
FPRD Issuance (Retirement) of Debt, Net
FTLF Total Cash from Financing Activities

OSIRIS Internet - Data Guide
136
BALANCE
SFEE Foreign Exchange Effects
SNCC Net Change in Cash
SNCB Net Cash - Beginning Balance
SNCE Net Cash - Ending Balance
SUPPLEMENTS
SDEP Depreciation, Supplemental
SCIP Cash Interest Paid, Supplemental
SCTP Cash Taxes Paid, Supplemental
Copyright © 2011 Last updated September 2011
3
Analyst-WVB (Industrial - All)
The Analyst-WVB template corresponds to the following World’Vest Base models. For further information on these templates, please contact your Bureau van Dijk Electronic Publishing account manager.
53 – Balance Sheet – Assets – Industrials
54 – Balance Sheet – Liabilities – Industrials
50 – Income Statement – Industrials – Anglo
51 – Income Statement – Industrials – Hybrid
52 – Income Statement – Industrials – Continental
Copyright © 2011 Last updated September 2011
3
Master-WVB (Industrial - All)
The Master-WVB format corresponds to the following World’Vest Base models. For further detail on these templates, please contact your account manager.
8 – Balance Sheet – Assets – Industrials
9 – Balance Sheet – Liabilities – Industrials
10 – Income Statement – Industrials – Hybrid
11 - Income Statement – Industrials – Hybrid
12 - Income Statement – Industrials – Hybrid
13 - Income Statement – Industrials – Hybrid
14 - Income Statement – Industrials – Continental
15 - Income Statement – Industrials – Anglo

Appendices
137
16 - Income Statement – Industrials – Anglo
17 - Income Statement – Industrials – Anglo
Copyright © 2011 Last updated September 2011
Templates - Bank
Banks Template
For the bank data on OSIRIS, accounts are available in three main formats: Global, Global detailed and Raw data.
Global format [*]
This is the most general bank format available on OSIRIS, enabling cross-border searching on a completely standardized account format. The Global format contains 37 line items, including 9 memo lines. The Global format can be used for searching all banks on OSIRIS.
Global detailed format [**]
This format provides more detail while retaining a globally comparable structure of 145 lines (51 lines for the Assets, 42 lines for the Liabilities & equity, 37 lines for the Income Statement and 15 lines of Notes) with more financials for searching and analysis compared with the Global format. The line items in Global detailed can be opened to show the related information from Raw data format.
Raw data format
The Raw data for banks on OSIRIS offers the complete detail from the bank’s annual report. This information is shown in one of multiple country-specific Raw data models used on OSIRIS; many countries are associated with more than one model reflecting varying account presentations. Each bank is presented in the model best corresponding to its annual report presentation. As with the Industrials template, Raw data items cannot be searched.
Access to the Raw data is available to premium subscribers.
The line numbers of the three formats are built up following the structure 4xxxx.

OSIRIS Internet - Data Guide
138
[*]This is equivalent to the Global Summary format on BANKSCOPE.
[**] This is equivalent to the Global Detailed format on BANKSCOPE.
3
Global (Bank)
BALANCE SHEET
Assets
42000 Loans
42005 Other Earning Assets
42010 Total Earning Assets
42015 Fixed Assets
42020 Non-Earning Assets
42025 Total Assets
Liabilities and Equity
42030 Customer & S-T Funding
42035 Other Funding
42040 Other (Non-Interest Bearing)
42045 Loan Loss Reserves
42050 Other Reserves
42055 Equity
42060 Total Liabilities & Equity
42065 Off Balance Sheet Items
42070 Loan Loss Reserves (Memo)
42075 Liquid Assets (Memo)
INCOME STATEMENT

Appendices
139
42080 Net Interest Revenue
42085 Other Operating Income
42090 Overheads
42095 Loan Loss Provisions
42100 Other
42105 Profit before Tax
42110 Tax
42115 Net Income
42120 Dividend Paid
42125 Total Capital Ratio
42130 Tier 1 Ratio
42135 Total Capital
42140 Tier 1 Capital
42150 Net-Charge Offs
Memo Lines
42160 Hybrid Capital (Memo)
42165 Subordinated Debts (Memo)
42180 Due from Banks (Memo)
42170 Non-Performing Loans (Memo)
42185 Due to Banks (Memo)
42195 Intangibles (Memo)
42190 Operating Income (Memo)
Copyright © 2011 Last updated September 2011
3
Global detailed (Bank)
BALANCE SHEET
Assets
Customer Loans
45020 Loans Sub 3 months
45030 Loans 3-6 months
45040 Loans 6 months-1 year
45060 Loans 1-5 years
45070 Loans 5 years +

OSIRIS Internet - Data Guide
140
45100 Loans to Municipalities / Government
45110 Mortgages
45120 HP / Lease
45130 Other Loans
45150 Loans to Group Companies / Associates
45160 Loans to Other Corporate
45170 Loans to Banks
45190 Total Customer Loans
Problem Loans memo
45210 Overdue Loans
45220 Restructured Loans
45230 Other non-performing Loans
45240 Total Problem Loans
Loan Loss Reserves
45260 General Loan Loss Reserves
45270 Specific Loan Loss Reserves
45280 Loan Loss Reserves
Other Lending
45300 Trust Account Lending
45310 Other Lending
45320 Total Other Lending
45330 Total Loans - Net
Other Earning Assets
45350 Deposits with banks
45360 Due from Central Banks

Appendices
141
45370 Due from Other Banks
45380 Due from Other Credit Institutions
45410 Government Securities
45420 Other Listed Securities
45430 Non-Listed Securities
45440 Other Securities
45450 Investment Securities
45460 Trading Securities
45470 Total Securities
45490 Treasury Bills
45500 Other Bills
45510 Bonds
45520 CDs
45530 Equity Investments
45540 Other Investments
45560 Total Other Earning Assets
Non-Earning Assets
45580 Cash and Due from Banks
45590 Deferred Tax Receivable
45600 Intangible Assets
45610 Other Non-Earning Assets
45620 Total Non Earning Assets
Fixed Assets
45640 Land and Buildings
45650 Other Tangible Assets

OSIRIS Internet - Data Guide
142
45660 Total Fixed Assets
45670 Total Assets
Liabilities
Deposits
45920 Deposits Demand
45925 Deposits Savings
45930 Deposits - Sub 3 months
45940 Deposits - 3-6 months
45950 Deposits - 6 months-1 year
45970 Deposits - 1-5 years
45980 Deposits - 5 years +
46000 Customer Deposits
46010 Municipalities / Government Deposits
46030 Other Deposits
46050 Commercial Deposits
46060 Banks Deposits
46080 Total Deposits
Money Market Funding
46100 Certificates of Deposit
46110 Commercial Paper
46120 Debt Securities
46130 Securities Loaned
46140 Other Securities
46150 Other Negotiable Instruments

Appendices
143
46160 Total Money Market Funding
Other Funding
46180 Convertible Bonds
46190 Mortgage Bonds
46200 Other Bonds
46210 Subordinated Debt
46220 Hybrid Capital
46230 Other Funding
46240 Total Other Funding
Loan Loss and Other Reserves
46260 General Loan Loss Reserves
46270 Other Non Equity Reserves
46280 Total Loan Loss & Other Reserves
Other Liabilities
46285 Other Liabilities
46290 Total Liabilities
Equity Reserves
46310 General Banking Risk
46320 Retained Earnings
46330 Other Equity Reserves
46340 Minority Interests
46350 Total Equity Reserves
Share Capital
46370 Preference Shares
46380 Common Shares

OSIRIS Internet - Data Guide
144
46390 Total Share Capital
46400 Total Equity
46410 Total Liabilities and Equity
INCOME STATEMENT
46510 Interest Income
46520 Interest Expense
46530 Net Interest Revenue
46540 Commission Income
46550 Commission Expense
46560 Net Commission Revenue
46570 Fee Income
46580 Fee Expense
46590 Net Fee Income
46600 Trading Income
46610 Trading Expense
46620 Net Trading Income
46630 Other Operating Income
46640 Total Operating Income
46650 Personnel Expenses
46660 Other Admin Expenses
46670 Other Operating Expenses
46680 Goodwill Write-off
46690 Loan Loss Provisions
46700 Other Provisions
46710 Total Operating Expense
46720 Non-Operating Income
46730 Non-Operating Expense
46740 Extraordinary Income
46750 Extraordinary Expense
46760 Exceptional Income
46770 Exceptional Expense
46780 Pre-Tax Profit
46790 Taxes
46800 Post Tax Profit
46810 Transfer to/(from) fund for general banking risks
46815 Published Net Income
46820 Preference Dividends
46830 Other Dividends
46840 Other Distributions
46850 Retained Income
46860 Minority Interest

Appendices
145
NOTES
Capital
47020 Tier 1 Capital
47030 Total Capital
47040 Tier 1 Capital Ratio
47050 Total Capital Ratio
Contingent Liabilities: Credit Equivalencies
47070 Acceptances
47080 Documentary Credits
47090 Guarantees
47100 Other
47110 Total Contingent Liabilities
Charge offs
47130 Gross Charge offs
47140 Write Offs
47150 Write backs
47160 Net Charge offs
47170 Number of Branches
47180 Number of Employees
Copyright © 2011 Last updated September 2011
Templates - Insurance
Insurance Template
There are three templates for insurance companies on OSIRIS: Life, Non-Life and Composite. Each insurance company is included only once in OSIRIS, in the template that corresponds to its primary insurance activity.

OSIRIS Internet - Data Guide
146
The insurance companies in each template are presented in three levels of format detail - Global, Global detailed and Raw data. The Global format has been developed for users interested in comprehensive insurance searching and screening. The Global detailed and Raw data formats provide more detailed data and reflect the differences in the three types of insuring entities according their associated templates.
Global Format
This is an international format relevant to all insurance companies, irrespective of the template. The Global format contains the key financials of the firm and provides a format for screening across all insurance companies on OSIRIS. The line items from the Global format can be opened up to reveal their Global detailed and Raw data components for a company.
Global detailed format [*]
This is a transnational format presented in standard Life, Non-Life and Composite templates. Each of the Global detailed formats offers more financial information than the Global format: a 76-line statement in Life template, 67 in the Non-Life and 77 lines in the Composite templates.
The Global detailed format also unfolds to reveal the more specific Raw data format items related to it.
Raw data format [**]
The Raw data format is the basic accounting format derived from the ‘as reported’ financial accounts of a company. Given this, the Raw data format is developed as a country specific format and is presented in models reflecting the accounting practices of the associated countries. There are approximately 30 models, each model being associated to one or several countries.
As in the Global detailed format, the user can expect to see each of these models presented in accordance with the three insurance templates.
The line numbers of the three formats are built up following the structure 2xxxxx.
[*] This is equivalent to the International format on ISIS. [**] This is equivalent to the National format on ISIS.

Appendices
147
3
Global (Insurance - All)
BALANCE SHEET
291005 Surplus
291006 Net Technical Reserves
291007 Total Other Liabilities
291008 Total Liabilities
291001 Total Investments
291002 Insurance Debtors
291003 Total Other Assets
291004 Total Assets
INCOME STATEMENT
291101 Gross Premium Written
291102 Net Premium Written
291103 Net Premium Earned
291104 Underwriting Expenses
291105 Other U/W Income/(Expenses)
291106 Underwriting Result
291107 Investment Return
291108 Increase in Long-Term Fund
291109 Shareholders Profit from LT Business
291110 Net Investment Income
291111 Other Gains/(Losses)
291112 Other Income/Expenses
291113 Profit Before Tax
236900 Profit After Tax
Copyright © 2011 Last updated September 2011
Global (Insurance - All)
BALANCE SHEET
Assets
210500 Cash & Deposits
212100 Quoted Investments
212500 Linked Assets
212600 Liquid Assets
213300 Insurance Debtors
213700 Deposits With Ceding Companies
214100 Financial Reinsurance

OSIRIS Internet - Data Guide
148
214600 Inter-Company Debtors
214700 Debtors
215500 Non-Life Assets
216000 Unquoted Investments
216500 Real Estate & Property
217000 Loans & Mortgages
217600 Inter-Company Investments
217700 Other Investments
218200 Non-Investment Fixed Assets
219300 Other Current Assets
219800 Other Long-Term Assets
219891 Other Assets
219900 Total Assets
Liabilities
200300 Capital
200800 Non Distributable Reserves
201100 Claims Equalisation Reserve
201700 Non-Life Shareholders Funds
202300 Other Reserves
202600 Distributable Reserves
202900 Profit & Loss
203000 Surplus
203300 Gross Technical Reserves
204509 Non-Life Liabilities
204800 Reserves for Linked Contracts
205800 Reserves for Non-Linked Contracts
206000 Surplus Distributed as Bonuses
206302 Free Reserves within LT Fund
207000 Other Technical Reserves
207100 Net Technical Reserves
207500 External Borrowings
208500 Other Current Liabilities
209000 Other Long-Term Liabilities
209700 Inter-Company Liabilities
209800 Other Liabilities
209900 Total Liabilities
200917 Employees
INCOME STATEMENT
220300 Gross Single Premium Written
220400 Gross Annual Premium Written
220588 Gross Other Direct Premium
220600 Gross Premium Written

Appendices
149
222600 Premium Ceded
222700 Net Premium Written
225000 Gross Claims
226000 Net Claims
228200 Commission Expenses
229200 Management Expenses
229202 Underwriting Expenses
229700 Other U/W Income/(Expenses)
229880 Portfolio Transfers
229900 Underwriting Result
230600 Net Investment Income
231000 Realised Gains/(Losses)
231350 Unrealised G/(L) Non-Linked
231650 Unrealised G/(L) Linked
231996 Unrealised G/(L) Other
232300 Tax Attributable to LT Fund (-)
233502 Increase in Long Term Fund (-)
234002 Shareholders Profits LT Fund
234800 Non-Life Profits
235400 Other Income/(Charges)
235500 Profit Before Tax
236000 Taxation
236900 Profit After Tax
237300 Extraordinary Items
238100 Dividends
238900 Transfers To Reserves
239300 Adjustments
239400 Retained Profit For The Year
239800 Retained Profit Brought Forward
239900 Retained Profit Carried Forward
3
Global detailed (Insurance – Non-Life)
BALANCE SHEET
Assets
210500 Cash & Deposits
212100 Quoted Investments
212600 Liquid Assets

OSIRIS Internet - Data Guide
150
213300 Insurance Debtors
213700 Deposits With Ceding Companies
214100 Financial Reinsurance
214600 Inter-Company Debtors
214700 Debtors
215100 Life Assets
216000 Unquoted Investments
216500 Real Estate & Property
217000 Loans & Mortgages
217600 Inter-Company Investments
217700 Other Investments
218200 Non-Investment Fixed Assets
219300 Other Current Assets
219800 Other Long-Term Assets
219891 Other Assets
219900 Total Assets
Liabilities
200300 Capital
200800 Non Distributable Reserves
201100 Claims Equalisation Reserve
201400 Life Estate
202300 Other Reserves
202600 Distributable Reserves
202900 Profit & Loss
203000 Surplus

Appendices
151
203300 Gross Technical Reserves
203800 Net Unpaid Losses
204100 Net Unearned Premium
204400 Insurance Funds
204500 Life Funds
207000 Other Technical Reserves
207100 Net Technical Reserves
207500 External Borrowings
208500 Other Current Liabilities
209000 Other Long-Term Liabilities
209700 Inter-Company Liabilities
209800 Other Liabilities
209900 Total Liabilities
200917 Employees
INCOME STATEMENT
220600 Gross Premium Written
222600 Premium Ceded
222700 Net Premium Written
223200 Movement In Unearned Premium
223700 Net Premium Earned
225000 Gross Claims
226000 Net Claims
226900 Movement In Insurance Funds
228200 Commission Expenses

OSIRIS Internet - Data Guide
152
229200 Management Expenses
229800 Underwriting Expenses
229900 Underwriting Result
230600 Net Investment Income
231000 Realised Gains/(Losses)
232000 Unrealised Gains/(Losses)
234500 Life Profits
235400 Other Income/(Charges)
235500 Profit Before Tax
236000 Taxation
236900 Profit After Tax
237300 Extraordinary Items
238100 Dividends
238900 Transfers To Reserves
239300 Adjustments
239400 Retained Profit For The Year
239800 Retained Profit Brought Forward
239900 Retained Profit Carried Forward
Copyright © 2011 Last updated September 2011
3
Global detailed (Insurance- Composite)
BALANCE SHEET
Assets
210500 Cash & Deposits

Appendices
153
211000 Bonds and Fixed Interest Sec.
211500 Equities
212500 Linked Assets
212600 Liquid Assets
213300 Insurance Debtors
213700 Deposits With Ceding Companies
214100 Financial Reinsurance
214600 Inter-Company Debtors
214700 Debtors
215100 Life Assets
215500 Non-Life Assets
216000 Unquoted Investments
216500 Real Estate & Property
217000 Loans & Mortgages
217600 Inter-Company Investments
217700 Other Investments
218200 Non-Investment Fixed Assets
218600 Goodwill
219300 Other Current Assets
219800 Other Long-Term Assets
219891 Other Assets
219900 Total Assets
Liabilities
200300 Capital
200800 Non Distributable Reserves

OSIRIS Internet - Data Guide
154
201100 Claims Equalisation Reserve
201400 Life Estate
201700 Non-Life Shareholders Funds
202300 Other Reserves
202600 Distributable Reserves
202900 Profit & Loss
203000 Surplus
203300 Gross Technical Reserves
203800 Net Unpaid Losses
204100 Net Unearned Premium
204400 Insurance Funds
204800 Reserves for Linked Contracts
206600 Other Life Funds
207000 Other Technical Reserves
207100 Net Technical Reserves
207500 External Borrowings
208500 Other Current Liabilities
209000 Other Long-Term Liabilities
209300 Minority Interests
209700 Inter-Company Liabilities
209800 Other Liabilities
209900 Total Liabilities
2200917 Employees
INCOME STATEMENT
220600 Gross Premium Written

Appendices
155
222600 Premium Ceded
222700 Net Premium Written
223200 Movement In Unearned Premium
223700 Net Premium Earned
225000 Gross Claims
226000 Net Claims
226900 Movement In Insurance Funds
228200 Commission Expenses
229200 Management Expenses
229202 Underwriting Expenses
229700 Other U/W Income/(Expenses)
229880 Portfolio Transfers
229900 Underwriting Result
230600 Net Investment Income
231000 Realised Gains/(Losses)
232000 Unrealised Gains/(Losses)
234500 Life Profits
234800 Non-Life Profits
235400 Other Income/(Charges)
235500 Profit Before Tax
236000 Taxation
236900 Profit After Tax
237300 Extraordinary Items
238100 Dividends
238900 Transfers To Reserves

OSIRIS Internet - Data Guide
156
239300 Adjustments
239400 Retained Profit For The Year
239800 Retained Profit Brought Forward
239900 Retained Profit Carried Forward
Copyright © 2011 Last updated September 2011
3
Edgar Online Filings
Form Type
Description
10-12B Registration Statement
10-12B/A Amended Registration Statement
10-12G Securities Registration (section 12(g))
10-12G/A Amended Securities Registration (section 12(g))
10-K Annual Report
10-K/A Amended Annual Report
10-K405 Annual Report (Regulation S-K, item 405)
10-K405/A Amended Annual Report (Regulation S-K, item 405)
10KSB Annual Report (Small Business Issuers)
10-KSB Annual Report (Small Business Issuers)
10KSB/A Annual Report (Small Business Issuers)
10-KSB/A Annual Report (Small Business Issuers)
10KSB40 Annual and Transition Reports
10KSB40/A Annual and Transition Reports
10-KT Annual Transition Report
10-KT/A Annual Transition Report
10KT405 Annual Transition Report
10KT405/A Annual Transition Report
10-Q Quarterly Report
10-Q/A Amended Quarterly Report
10QSB Quarterly Report of Financial Condition
10QSB/A Amended Quarterly Report of Financial Condition
10-QT Quarterly Transition Report
10-QT/A Amended Quarterly Transition Report
10-SB Registration of securities for small business issuers pursuant to section 12(b)
10-SB/A Amended Registration of securities for small business issuers pursuant to section 12(b)

Appendices
157
10SB12B Securities Registration (small business, section 12(b)
10SB12B/A Amended Securities Registration (small business, section 12(b))
10SB12G Securities Registration Statement (small business, section 12(g))
10SB12G/A Amended Securities Registration Statement (small business, section 12(g))
20-F Annual and Transition Report (foreign private issuer)
20-F/A Amended Annual and Transition Report (foreign private issuer)
20-FR Securities Registration (foreign issuer 12(b) or 12(g))
20-FR/A Amended Securities Registration (foreign issuer 12(b) or 12(g))
20FR12B Securities Registration (foreign issuer, sec 12(b))
20FR12B/A Amended Securities Registration (foreign issuer, sec 12(b))
20FR12G Securities Registration (foreign issuer, sec 12(g))
20FR12G/A Amended Securities Registration (foreign issuer, sec 12(g))
40-F Annual Report (foreign private issuer)
40-F/A Amended Annual Report (foreign private issuer)
40-FR Registration of a class of securities of certain Canadian issuers pursuant to Section 12(b) or 12(g) of the 1934 Act
40-FR/A Amended Registration of a class of securities of certain Canadian issuers pursuant to Section 12(b) or 12(g) of the 1934 Act
40FR12B Registration of a class of securities of certain Canadian issuers pursuant to Section 12(b) of the 1934 Act
40FR12B/A Amended Registration of a class of securities of certain Canadian issuers pursuant to Section 12(b) of the 1934 Act
40FR12G Registration of a class of securities of certain Canadian issuers pursuant to Section 12(g) of the 1934 Act
40FR12G/A Amended Registration of a class of securities of certain Canadian issuers pursuant to Section 12(g) of the 1934 Act
F-1 Securities Registration (foreign private issuer)
F-1/A Securities Registration (foreign private issuer)
F-10 Registration statement for securities of certain Canadian issuers under the Securities Act of 1933
F-10/A Amended Registration statement for securities of certain Canadian issuers under the Securities Act of 1933
F-10EF Auto-effective registration statement for securities of certain Canadian issuers under the Securities Act of 1933
F-10EF/A Amended auto-effective registration statement for securities of certain Canadian issuers under the Securities Act of 1933
F-10MEF Registration pursuant to Securities Act Rule 462(b) of up to an additional 20% of securities for an offering that was registered on a Form F-10
F-10POS Post-Effective Amendment to Registration statement for securities of certain Canadian issuers under the Securities Act of 1933
F-1MEF Registration of Additional Securities (up to 20%, foreign issuer)
F-1MEF/A Amended Registration of Additional Securities (up to 20%, foreign issuer)
F-3 Securities Registration (foreign private issuer)
F-3/A Securities Registration (foreign private issuer)
F-3D Securities Registration (dividends, foreign issuer)

OSIRIS Internet - Data Guide
158
F-3D/A Amended Securities Registration (dividends, foreign issuer)
F-3DPOS Amendment to a previously filed F-3D.
F-3MEF Registration pursuant to Securities Act Rule 462(b) of up to an additional 20% of securities for an offering that was registered on a Form F-3
F-4 Securities Registration (foreign private issuer)
F-4 POS Post-effective amendment to securities registration (foreign private issuer)
F-4/A Amended Securities Registration (foreign private issuer)
F-4EF Auto-effective Registration statement for securities issued by certain foreign private issuers in certain business combination transactions
F-4EF/A Amended Auto-Effective Registration statement for securities issued by certain foreign private issuers in certain business combination transactions
F-4MEF Registration pursuant to Securities Act Rule 462(b) of up to an additional 20% of securities for an offering that was registered on a Form F-4
NT 10-K Notification that Annual Report will be submitted late
NT 10-K/A Amended Notification that Annual Report will be submitted late
NT 10-Q Notification that Quarterly Report will be submitted late
NT 10-Q/A Amended Notification that Quarterly Report will be submitted late
NT 20-F Notification that Form 20-F will be submitted late
NT 20-F/A Amended Notification that Form 20-F will be submitted late
NTN 10K Notification that Annual Report will be submitted late
NTN 10K/A Amended Notification that Annual Report will be submitted late
NTN 10Q Notification that Quarterly Report will be submitted late
NTN 10Q/A Amended Notification that Quarterly Report will be submitted late
NTN 20F Notification that Form 20-F will be submitted late
S-1 Securities Registration Statement
S-1/A Securities Registration Statement
S-11 Securities Registration: Real Estate Company
S-11/A Securities Registration: Real Estate Company
S-11MEF Registration of Additional Securities (up to 20%)
S-1MEF Registration of Additional Securities (up to 20%)
S-3 Securities Registration Statement (simplified form)
S-3/A Securities Registration Statement (simplified form)
S-3D Registration of Securities Pursuant to Dividend
S-3D/A Amended Registration of Securities Pursuant to Dividend
S-3DPOS Post-Effective Amendment to an S-3D filing
S-3MEF Registration of Additional Securities (up to 20%)
S-4 Securities Registration: Business Combination
S-4 POS Post-Effective Amendment to an S-4EF filing
S-4/A Securities Registration: Business Combination
S-4EF Securities Registration: Bank, S&L, or Holding Company
S-4EF/A Post-effective amendment to Securities Registration: Bank, S&L, or Holding Company
S-4MEF Registration pursuant to Securities Act Rule 462(b) of up to an additional 20% of securities for an offering that was registered on a Form S-4

Appendices
159
SB-1 Securities Registration: Small Business
SB-1/A Securities Registration: Small Business
SB-1MEF Registration pursuant to additional 20% of securities for an offering that was registered on a Form SB-1.
SB-2 Securities Registration: Small Business
SB-2/A Securities Registration: Small Business
SB-2MEF Registration of Additional Securities (up to 20%)
8-K Unscheduled Material Events
8-K/A Amended Unscheduled Material Events
6-K Report of Foreign Issuer
6-K/A Amended Report of Foreign Issuer
Copyright © 2011 Last updated September 2011
3
Filing Times for Annual Reports – World’Vest Base
The following table provided by World’Vest Base, displays the legal or stock exchange required filing times for publicly traded industrial companies.
Country After end of Fiscal Year Majority of Year End Dates
ARGENTINA 110 DAYS 31-Dec AUSTRALIA 4 MONTHS 30-Jun AUSTRIA 5 MONTHS 31-Dec BELGIUM 7 MONTHS 31-Dec BRAZIL (RIO) 90 DAYS 31-Dec BRAZIL (SAO) 150 DAYS 31-Dec CANADA 140 DAYS 31-Dec CHILE 60 DAYS 31-Dec COLUMBIA 2 MONTHS 31-Dec DENMARK 5 MONTHS 31-Dec FINLAND 4 MONTHS 31-Dec FRANCE 6 MONTHS +45 DAYS 31-Dec GERMANY 9 MONTHS 31-Dec GREECE 6 MONTHS 31-Dec HONG KONG 6 MONTHS 30-Jun INDIA (BOMBAY) 6 MONTHS 31-Mar INDIA (DELHI & MADRAS)
3 MONTHS 31-Mar
INDONESIA 120 DAYS IRELAND 6 MONTHS 31-Dec ISRAEL 4 MONTHS 31-Dec ITALY 4 MONTHS 31-Dec JAPAN 3 MONTHS (7 if released outside
Japan) 31-Mar
KOREA 90 DAYS

OSIRIS Internet - Data Guide
160
LUXEMBOURG 3 MONTHS 31-Dec MALAYSIA 6 MONTHS 30-Jun MEXICO 45 DAYS 31-Dec NETHERLANDS 6 MONTHS + 8 DAYS 31-Dec NEW ZEALAND 3 MONTHS 30-Jun NIGERIA 6 WEEKS 31-Dec NORWAY 6 MONTHS 31-Dec PAKISTAN 6 MONTHS 31-Dec PHILIPPINES (MAKATI) 105 DAYS 31-Dec PHILIPPINES (MANILA) 150 DAYS 31-Dec PORTUGAL 7 MONTHS 31-Dec SINGAPORE 3 MONTHS 30-Jun SOUTH AFRICA 6 MONTHS 31-Dec SPAIN 6 MONTHS 31-Dec SRI LANKA 6 MONTHS 31-Mar SWEDEN 6 MONTHS 31-Dec SWITZERLAND 6 MONTHS 31-Dec TAIWAN NO REQUIREMENT 31-Dec THAILAND 60 DAYS TURKEY NO REQUIREMENT 31-Dec UNITED KINGDOM 6 MONTHS 31-Dec USA 90 DAYS 31-Dec
Copyright © 2011 Last updated September 2011
Corporate actions: event glossary and useful terms
AGM/EGM/CGM/SGM Annual General Meeting. Meeting of shareholders which a company must call once a year, usually soon after close of the financial year. See also EGM - Extraordinary General Meeting. CGM - Court-Ordered General Meeting. SGM - Special General Meeting Annual General Meeting see AGM Announcement Whereby a company informs of its intent to carry out an action which may affect its shareholders' value. Assimilation This occurs when securities with different characteristics, e.g. shares with different entitlements to dividend, become identical in all respects, i.e. pari-passu. The assimilation may be scheduled in advance, e.g. shares resulting from a bonus may become fungible after a pre-set period of time, or result from outside events, e.g. merger, reorganisation, issue of supplementary tranches, etc. Bankruptcy When a company's net worth goes below the country's stipulated guideline. There could be several stages in the Bankruptcy process. Hence, one sees several announcements over a period of time. The end result of Bankruptcy could be revival, sale, re-organisation, liquidation etc. as part of a court proceeding to handle the insolvent company's assets. Bonus Issue (Stock Split, Capitalisation) Issue of free shares to the company's existing shareholders. No money changes hands; the Bonus Issue is achieved by capitalising the reserves of the company and the share price falls pro rata. Also known as capitalisation or scrip issue. Bonus Rights A Bonus issue with Rights attached. Effectively a mixture of Bonus and Rights.

Appendices
161
Book-closure/Record Date The shareholders on the official list of the company on this date are entitled to receive the benefit. Books Closed Day Last date for registration of shares or bonds for the payment of the next dividend or interest payment, or for processing a Corporate Action. Buyback (Repurchase) Offer Offer by the company to purchase its own securities. Call Where the issue price of a security in a public offer (eg, Rights, IPO, further offerings) is split in such a way that the shareholders have to pay the issue price in installments. Until the full issue price is received by the company the security remains as Partly Paid. Certificate of Exchange Exchange of existing certificates for another set of certificates. This may be done in case of sub-division, lot change, name change, one type of security for another type of security. Compulsory Acquisition (Amalgamation) Merger of two or more companies by exchange of the old shares of one of the two companies with compulsory approval of shareholders. The offeree company ceases to exist Consolidation (Reverse Stock Split, Capital Reduction) Capital reorganisation of a company which results in the reduction of the Equity Capital. De-merger (Spin-off) De-concentration of the company into two or more companies by issuing the shares of one or more companies to the shareholders of the existing company. Divestment One or more Shareholders of a company offering whole or part of its holding to the existing shareholders of company. Entitlement see Open Offer Non-renounceable & non-tradable issue of shares. Is the right to purchase new shares at the specific price. The allotment of shares will usually be in the same company. This is an offer to existing shareholders to subscribe money to buy further shares, usually at a discount to the market price. Although set out on a pro rata basis, shareholders may subscribe for any amount of shares. Ex Indication that the seller retains the right to any benefits and entitlements; consequently the buyer does not receive them. Ex-Date A date after which benefits of a security is not available to the purchaser. The date specified by the local stock exchange to determine whether the buyer or the seller of the security is entitled to the benefit. (The seller of a security during the ex period will normally be entitled to the benefit). Financial Year Change Change in the accounting year-end of the company. Incorporation Change Change in the Country of Incorporation of the Issuer. International Code Change A change in any of the international codes in the system. Issuer An entity (company, organisation, institution etc.) that raises cash through issuing negotiable securities. Issuer Name Change

OSIRIS Internet - Data Guide
162
Change in the name of the Issuer. Lawsuits Only for the US. Disclosure by a company for any significant lawsuit filed against the company. Liquidation A process by which a bankrupt company is sold off as per the Liquidator's guidelines. The shareholders of the company may receive payment from the liquidation proceeds Listing Status Change Listing Status Change of a security, namely Suspension, Delisting or Resumption of trading. All securities are assumed to be traded unless the listing status is changed. Local Code Change Any changes in the local codes carried in the system. Lot Change Changes in Minimum trading lot/size of the security. Merger Coming together of two or more companies to form a new company. e.g. AOL & Time Warner merged to form AOL- Warner. New Listing A new listing is when a security lists onto an exchange for the first time. Preferential Offer Offer to the shareholders of Company A to buy securities of Company B on a preferential basis. Both companies are part of the same group. Purchase Offer Company A has managerial control of company B. Company A decides to increase its stake in Company B by offering to take the shares from the shareholders of company B. Company B will continue to exist. Registered Office Change Change in the Registered office address of the company. Rights Is an offer to existing shareholders to subscribe for further securities in proportion to their holding, at a fixed price, made by means of the issue of a renounceable letter which may be traded for a period before payment for securities is due. The allotment of shares will usually be in the same company. Rights Issue Rights issues are capital raising exercises by companies in which existing shareholders are given the right to buy the new shares normally at a discount to the market price for the existing shares. Scheme of Arrangement A scheme of Arrangement is a general term referring to any reorganisation of a company, its capital or a group of companies. Security An instrument issued by the Issuer to raise funds from the capital markets, eg, Shares, Warrants, Bonds etc. Security Exchange An offer to exchange securities of Company A with those of Company B. Security Name Change Change in the security name. Security Re-classification A Company reclassifying Security A as Security B, eg, Bearer Shares to Registered Shares. Class

Appendices
163
A to common stock. SEDOL Change Change in the SEDOL. Scrip Dividends To enable a company to save tax, it may offer its shareholders shares instead of a cash dividend. Scrip Issue See Bonus Issue Sub-division (Par Value Change, Currency Re-denomination) Change in either the Currency or Face/Nominal Value of the security or both. Takeover Company A taking over managerial control of Company B. Both companies continue to exist. Tender Offer (an embedded process) It is part of the process of some other event. The Offer price is not fixed by the offeror. The proceeds of the offer are through tender & the market forces will decide the price. This is not an event in it's own right however, it may be embedded within events like Buyback, Compulsory Acquisition, Divestment, Preferential Offer, Purchase Offer or Takeover.
Dividends: event glossary and useful terms
Cash Option The option to take up a dividend's payment in the form of cash. Cum Dividend Last day that the shares trade with the dividend. Distribution Date - See Pay Date. Dividend This is a payment declared by a company's board of directors and given to its shareholders out of the company's current or retained earnings. It can be given as cash (cash dividend), or stock (stock dividend). Also called a Payout. Dividend Arrears Accumulated dividends on cumulative preferred stock that are deemed payable to the current holder. Dividend Omitted Refers to the option that a company has not to pay any dividends to its shareholders. Dividend Payout Ratio Percentage of company earnings paid out as dividends Dividend Rate The fixed or floating rate paid on preferred stock based on par value. Dividend Reinvestment Plan Dividend Reinvestment Plans (DRIPs) are programs that allow current shareholders of a company to "reinvest" their dividends to purchase additional stock in the company through the plan's administrator A dividend that has been previously declared and subsequently cancelled. Dividend Rescinded A dividend that has been previously declared and subsequently cancelled. Ex Date The date specified by the local stock exchange used to determine whether the buyer or seller of the security is entitled to the benefit. The seller of a security during the Ex period will normally be entitled to the benefit

OSIRIS Internet - Data Guide
164
Ex-Dividend First day that the shares trade without the dividend. Franked Dividend A dividend paid out of income already taxed to the issuer. The dividend may be fully franked (i.e. entirely tax-free to the shareholder) or partially franked (and thus partially taxable). Pay Rate (Gross) The dividend amount to be paid to the shareholder before tax. Pay Rate (Net) The dividend amount to be paid to the shareholder after tax. Preference Shares Capital stock which provides a specific dividend that is paid before any dividends are paid to common stock holders, and which takes precedence over common stock in the event of liquidation. Usually does not carry voting rights. Also called Preferred Stock. Record Date The last date by which stockholders must be listed on a company's books in order to be eligible for the declaration of a dividend. Scrip Dividend An issuer allows holders of a share to opt to receive dividends in the form of further units of the security rather than just cash Stock Option The option to take up a dividend's payment in the form of further company shares. Withholding Tax A tax levied by a country of source on income paid.
ID numbers for industrial companies on Osiris
General rules:
• For industrial companies preference is given to an official number when this is known; if not known the company has a WVB ID
• Banks available on BankScope take the BankScope ID created by Bureau van Dijk. These ID's are based on national identifiers or a number provided by the IP.
• Insurance companies available on ISIS take the ISIS ID created by Bureau van Dijk. These ID's are based on national identifiers or a number provided by the IP.
Country ISO Code
ID number used on Osiris
Comments
Anguilla AI WVB Argentina AR WVB Armenia AM WVB Australia AU ACN / WVB ACN is official identification number used by the SEC
Australia.
Austria AT Crefo / WVB Internal number used by Creditreform.
Bahamas BS WVB Bahrain BH WVB / Chamber of
Commerce Official registration number
Bangladesh BD WVB Barbados BB WVB

Appendices
165
Belarus BY OKPO / WVB OKPO is statistical State Committee
Belgium BE VAT / WVB Official identification number used by the VAT administration.
Belize BZ WVB Benin BJ WVB Bermuda BM WVB Bolivia BO WVB Bosnia and Herzegovina
BA Dpt. of Statistics / WVB
Official identification number of the Departement of Statistics
Botswana BW WVB Brazil BR WVB Bulgaria BG BULSTAT / WVB National Statistic code
Canada CA WVB Cayman Islands
KY WVB
Chile CL WVB China CN WVB
Colombia CO WVB / VAT Official identification number used by the VAT administration.
Costa Rica CR WVB Côte d'Ivoire CI WVB Croatia HR CN / WVB Official company identification code.
Cyprus CY Business Register / WVB
Czech Republic
CZ Business Register / WVB
Official identification number used by the Business registers and Statistical Office.
Denmark DK VAT / WVB Official identification number used by the VAT administration.
Dominican Republic
DO WVB
Ecuador EC WVB Egypt EG WVB El Salvador SV WVB Estonia EE Registration / WVB Official identification number used by the Trade
register.
Finland FI Registration / WVB Official identification number used by the Trade register.
France FR SIRET / WVB Official identification number.
Gabon GA WVB Gambia GM WVB Georgia GE WVB Germany DE Crefo / WVB Internal number used by Creditreform.
Ghana GH WVB Gibraltar GI WVB Greece GR VAT / WVB Official identification number used by the VAT
administration.
Guatemala GT WVB Guyana GY WVB Honduras HN WVB

OSIRIS Internet - Data Guide
166
Hong Kong HK WVB Hungary HU VAT / WVB Official identification number used by the Tax Office.
Iceland IS Registration / WVB Official identification number of Companies House.
India IN Registration / WVB Registration number (Cies Act 1956) is official identification number.
Indonesia ID WVB Iran (Islamic Republic of)
IR WVB Ireland IE Registration / WVB Official identification number of Companies House.
Israel IL WVB Italy IT CCIAA / WVB Official identification number of the Chambers of
Commerce.
Jamaica JM WVB Japan JP WVB
Jordan JO WVB Kzakhstan KZ WVB Kenya KE WVB Korea (Republic of)
KR Registration / WVB Tax number is official identification number.
Kuwait KW WVB Latvia LV Registration / WVB Official identification number of Companies' Registry.
Lebanon LB WVB Liberia LR WVB Liechtenstein LI WIN / WVB Worldbox Identification number
Lithuania LT Registration / WVB Official identification number of the central Company Register (Department of Statistics)
Luxembourg LU VAT / WVB Official identification number used by the VAT administration.
Macedonia (FYROM)
MK Dpt. of Statistics / WVB
Official identification number of the Department of Statistics
Malawi MW WVB Malaysia MY WVB Malta MT Registration / WVB Official Identification Number used by the Registrar of
Companies - Malta Financial Services Authority
Marshall Islands
MH WVB
Mauritius MU WVB Mexico MX WVB Moldova (Republic of)
MD IDNO / WVB Moldova State Chamber of Registration (part f the Ministry of Justice)
Monaco MC SIREN / WVB Official identification number.
Morocco MA WVB Mozambique MZ WVB Namibia NA WVB Nepal NP WVB Netherlands NL Handelsregister /
WVB Official identification number of the Chambers of Commerce.
Netherlands Antilles
AN WVB
New Zealand NZ WVB

Appendices
167
Nicaragua NI WVB Niger NE WVB Nigeria NG WVB Norway NO Registration / WVB Official company identification code.
Oman OM WVB Pakistan PK WVB Palestinian Territory
PS WVB
Panama PA WVB Papua New Guinea
PG WVB
Paraguay PY WVB Peru PE VAT / WVB Official identification number (RUC-Registro Unico de
Contribuyente) used by the VAT administration.
Philippines PH WVB Poland PL REGON / WVB National Identification Number.
Portugal PT VAT / WVB Official identification number used by the VAT administration.
Qatar QA WVB / Chamber of Commerce Official registration number
Romania RO VAT / WVB Official identification number used by the VAT administration.
Russian Federation
RU OKPO / WVB Official identification number used by the Russian Statistical Committee.
Saint Kitts and Nevis
KN WVB
Saint Lucia LC WVB Saudi Arabia SA WVB Serbia and Montenegro
RS Dpt. of Statistics / WVB
Official identification number of the Department of Statistics
Singapore SG Registration / WVB Official identification number used by the Singapore stock exchange.
Slovakia SK Business Register/WVB
Official identification number used by the Business registers and Statistical Office.
Slovenia SL Statistical Office / WVB
Official identification number of the Statistical Office.
South Africa ZA Registration / WVB Registration number is official identification number used by the South-Africa stock exchange.
Spain ES VAT / WVB Official identification number used by the VAT administration.
Sri Lanka LK WVB Sudan SD WVB Suriname SR
Swaziland SZ WVB Sweden SE Registration / WVB Official identification number of the National Patent and
Registration Office.
Switzerland CH WIN / WVB Worldbox Identification number
Taiwan TW Registration / WVB Official identification number used by the SEC Taiwan.
Tanzania (United Republic of)
TZ WVB

OSIRIS Internet - Data Guide
168
Thailand TH WVB Trinidad and Tobago
TT WVB
Tunisia TN WVB Turkey TR WVB Uganda UG
Ukraine UA OKPO / WVB National Statistic code
United Arab Emirates
AE WVB United Kingdom
GB Registration / WVB Official identification number of Companies House.
United States
US WVB Uruguay UY WVB Uzbekistan UZ Vanuatu VU WVB Venezuela VE WVB Vietnam VN WVB Virgin Islands (British)
VG WVB
Zambia ZM WVB Zimbabwe ZW WVB * WVB = internal number used by World'Vestbase * No ID is mentioned when there are only banks and insurance companies on OSIRIS

169
Index
A
Accessing..............................................37
Account Formats ....................................15
Analyst-WVB (Industrial - All) ................ 136
Annual Report Collection .........................13
Applications of OSIRIS ............................. 3
B
Bank ratios............................................78
Banks Template ..............................19, 137
C
Cash Flow Statement (Industrial – All) .... 131
Cash flow Statement (US accounts) ........ 132
Composite Ratios ...................................87
Corporate actions
event glossary and useful terms .......... 160
D
Data Definitions - Industrial .....................61
Data Methodology ..................................11
Data Quality ..........................................12
Database Description............................... 1
Dividends
event glossary and useful terms .......... 163
E
Earnings Estimates.................................30
F
Filing Times for Annual Reports – World’Vest Base................................................ 159
Filings ..................................................32
Filings Available through Edgar Online Service......................................................156
Fitch Ratings ....................................... 101
G
Global (Bank) ...................................... 137
Global (Industrial - All) ......................... 111
Global (Insurance - All) ......................... 146
Global detailed (Bank) .......................... 139
Global detailed (Industrial - All).............. 113
Global detailed (Insurance - Life)............ 147
Global detailed (Insurance – Non-Life) .... 149
Global detailed (Insurance- Composite)... 152
Glossary ...............................................47
I
Industrial company ratios........................76
Industrials Template...............................16
Industry Groups – Industry Classification Benchmark.........................................60
Information Providers .............................57
Insurance company ratios - Life Ratios......82
Insurance company ratios - Non-Life Ratios84
Insurance Template.........................20, 145
Introduction to OSIRIS .............................1
L
List ......................................................39
M
Master-WVB (Industrial - All) ................. 136
Moody’s.............................................. 104
N
News....................................................32
O
OSIRIS Data in Detail .............................11
OSIRIS Software Overview......................37
P
Peer Analyses........................................45
Peer Groups ..........................................44
Peer Reports .........................................44
Presenting ............................................46
R
Ratings.................................................31
Report - Accessing .................................41
S
Save ....................................................42
Search .................................................37
Spreadsheet (Industrial - Anglo) ............ 118
Spreadsheet (Industrial - Continental) .... 122
Spreadsheet (Industrial - Hybrid) ........... 127

OSIRIS Internet - Data Guide
170
Standard and Poor’s ............................. 109
T
Text Search...........................................38
U
Upload companies ..................................43
User Support.........................................10
W
WVB Ratios ...........................................89