Performance database: capturing data for optimizing distributed streaming workflows
17
Phil. Trans. R. Soc. A (2011) 369, 3268–3284 doi:10.1098/rsta.2011.0134 Performance database: capturing data for optimizing distributed streaming workflows BY CHEE SUN LIEW 1,2, *, MALCOLM P. ATKINSON 1 ,RADOSL / AW OSTROWSKI 3 , MURRAY COLE 1 ,JANO I. VAN HEMERT 1,4 AND LIANGXIU HAN 5 1 School of Informatics, University of Edinburgh, 10 Crichton Street, Edinburgh EH8 9AB, UK 2 Faculty of Computer Science and Information Technology, University of Malaya, 50603 Kuala Lumpur, Malaysia 3 EPCC, University of Edinburgh, JCMB, The Kings Buildings, Mayfield Road, Edinburgh EH9 3JZ, UK 4 Optos, Queensferry House, Carnegie Campus, Enterprise Way, Dunfermline KY11 8GR, UK 5 School of Computing, Mathematics and Digital Technology, Manchester Metropolitan University, Chester Street, Manchester M1 5GD, UK The performance database (PDB) stores performance-related data gathered during workflow enactment. We argue that, by carefully understanding and manipulating these data, we can improve efficiency when enacting workflows. This paper describes the rationale behind the PDB, and proposes a systematic way to implement it. The prototype is built as part of the Advanced Data Mining and Integration Research for Europe project. We use workflows from real-world experiments to demonstrate the usage of PDB. Keywords: performance data; streaming workflows; measurement framework 1. Introduction It is evident that data-intensive research is transforming the research landscape, as recognized in The Fourth Paradigm [1]. We are facing the challenge of handling the deluge of data generated by sensors and modern instruments that are widely used in all domains. Owing to the scale, complexity and heterogeneity of data gathered in scientific experiments, it is difficult to extract useful information and knowledge through exhaustive and unstructured computations. To survive the data bonanza, we need to improve our apparatus for the exploration and exploitation of the growing wealth of data. In a previous paper [2], we have proposed optimization based on information on performance gathered in previous runs. This depends on an assumption that scientific users repeat similar requests over similar data as they iterate their understanding or process various samples in the exploration of variants and experimentation settings [3]. The performance database (PDB) is designed to *Author for correspondence ([email protected]). One contribution of 12 to a Theme Issue ‘e-Science: novel research, new science and enduring impact’. This journal is © 2011 The Royal Society 3268
-
Upload
independent -
Category
Documents
-
view
4 -
download
0
Transcript of Performance database: capturing data for optimizing distributed streaming workflows

Phil. Trans. R. Soc. A (2011) 369, 3268–3284doi:10.1098/rsta.2011.0134
Performance database: capturing data foroptimizing distributed streaming workflows
BY CHEE SUN LIEW1,2,*, MALCOLM P. ATKINSON1, RADOSL/ AW OSTROWSKI3,MURRAY COLE1, JANO I. VAN HEMERT1,4 AND LIANGXIU HAN5
1School of Informatics, University of Edinburgh, 10 Crichton Street,Edinburgh EH8 9AB, UK
2Faculty of Computer Science and Information Technology, Universityof Malaya, 50603 Kuala Lumpur, Malaysia
3EPCC, University of Edinburgh, JCMB, The Kings Buildings, Mayfield Road,Edinburgh EH9 3JZ, UK
4Optos, Queensferry House, Carnegie Campus, Enterprise Way,Dunfermline KY11 8GR, UK
5School of Computing, Mathematics and Digital Technology, ManchesterMetropolitan University, Chester Street, Manchester M1 5GD, UK
The performance database (PDB) stores performance-related data gathered duringworkflow enactment. We argue that, by carefully understanding and manipulating thesedata, we can improve efficiency when enacting workflows. This paper describes therationale behind the PDB, and proposes a systematic way to implement it. The prototypeis built as part of the Advanced Data Mining and Integration Research for Europe project.We use workflows from real-world experiments to demonstrate the usage of PDB.
Keywords: performance data; streaming workflows; measurement framework
1. Introduction
It is evident that data-intensive research is transforming the research landscape,as recognized in The Fourth Paradigm [1]. We are facing the challenge of handlingthe deluge of data generated by sensors and modern instruments that are widelyused in all domains. Owing to the scale, complexity and heterogeneity of datagathered in scientific experiments, it is difficult to extract useful informationand knowledge through exhaustive and unstructured computations. To survivethe data bonanza, we need to improve our apparatus for the exploration andexploitation of the growing wealth of data.
In a previous paper [2], we have proposed optimization based on informationon performance gathered in previous runs. This depends on an assumption thatscientific users repeat similar requests over similar data as they iterate theirunderstanding or process various samples in the exploration of variants andexperimentation settings [3]. The performance database (PDB) is designed to*Author for correspondence ([email protected]).
One contribution of 12 to a Theme Issue ‘e-Science: novel research, new science and enduringimpact’.
This journal is © 2011 The Royal Society3268

Performance database 3269
gather information at the level of processing element (PE) class instances, sothat we can determine how each class and data stream behaves. PEs are softwarecomponents that handle the distributed computation by processing and emittingstreams of values, and are connected via data streams to form a workflow.For instance, information collected from a previous enactment can tell whetherco-locating certain PEs within the same execution engine will result in poorperformance because PEs are competing for resources. To be able to predict theenactment performance in this scenario, we must first obtain information about(i) the performance of the class instances, e.g. processing time per unit of data(unit cost), (ii) the hardware configuration for the enactment platforms, (iii) thesoftware stack running on the enactment platforms, and (iv) the workload of theenactment platforms during the enactment. This requires a good understandingof where and how to collect such data, and how to transform the data into usefulinformation in the later stages.
This paper describes the rationale behind the PDB, and proposes a systematicway to implement it. In §2, we introduce a four-stage performance data life cycle—collect, organize, use and discard—to describe how the performance data arecollected and transformed into information. We propose a schema for the PDBand follow Gray’s Laws on approaching a large-scale scientific data engineeringchallenge [4], and identify important questions that our PDB should answer.Section 3 describes the PDB prototype. We have implemented a measurementframework (MF) using open grid services architecture data access and integration(OGSA-DAI) [5] and conducted experiments with a real-world life sciences usecase from the Advanced Data Mining and Integration Research for Europe(ADMIRE) project [6] to collect data into the PDB. Section 4 shows how weuse these data to test our hypothesis about optimization. The related work isdiscussed in §5. We conclude and discuss further research in §6.
2. Performance data life cycle
A typical scientific workflow comprises complex computation steps on hetero-geneous data, and enacts on distributed computing platforms. The performanceof enacting such a workflow relies on various factors, e.g. the selection of scattereddata sources in the workflow may trigger a high communication cost of movingdata to the computing platforms. However, workflows need to be mapped onto theappropriate platforms, in terms of workloads, computing paradigms and resourceavailability, in order to achieve maximum efficiency. By identifying these factorsand designing a structured system to capture relevant performance data, usefulinformation can be extracted to further improve the enactment. In the followingsections, we describe in detail how this information is captured and stored in thePDB, and how it can be used during workflow optimization in the four-stage lifecycle: collect, organize, use and discard.
(a) Collect stage: data sources and collecting mechanism
(i) Data sources
Figure 1a shows an overall picture of the data sources for a PDB. Thedata-intensive virtual machine (DIVM ) configuration and PE deployment andconnections data are harvested from system log files as they record the way the
Phil. Trans. R. Soc. A (2011)

3270 C. S. Liew et al.
PDBPE deploymentand connections
log
MFtiming of
enactments
DIVMconfigurations
EEk
PEIi
JVM
processor
softwarevirtual machine
PEIj
node (with multi-processors)
n-nodes cluster
...
...
...
...
network connecting clusters
...
hardware
EEk+1
DIVMm
...
(a) (b)
Figure 1. Data sources for a PDB. (a) Information flow into the PDB and (b) DIVM abstraction.
software was configured. The hardware configuration is currently obtained byhand but should be based on common information model data. The timings ofenactments are collected by an MF. We define a DIVM as an abstraction for thecomputational environment in which a PE instance (PEI) runs during enactment.Figure 1b shows a DIVMk which is an abstraction of the layers of software andhardware. As a typical operational environment is complex, deriving relevantinformation, e.g. whether two PEIs are competing for the same CPU, is difficult.The DIVM abstraction is used to reduce the complexity by suppressing detail, sothat queries on the PDB can discriminate such conflict criteria. This abstractionalso has to reflect locality so that relative costs of inter-PEI communication canbe estimated using the PDB.
The PEIs are executed in execution engines (EE), which are the highest layerof DIVMs. The mapping of a particular EE, e.g. EEk , onto a DIVM, e.g. DIVMm , iscaptured in the PDB from the log analysis described above. In order to optimizeenactment a system chooses where to deploy PEIs, i.e. on which EE they shouldrun. To interpret their behaviour it is necessary to record their identity andtheir host EE. This information is obtained by monitoring deployment duringthe preparation for enactment execution.
(ii) Collecting mechanisms
We use system logs and the MF to collect three types of data: configurationof DIVMs, deployment and interconnection of PEIs, and timing of the actualenactments. System logs keep track of the activities involved in managing DIVMlifetimes. The data gathered from the log files allow reconstruction of the softwareand hardware stack at a given time. Logs are also generated to track which PEIsare running on each DIVM at a given time.
PEIj is terminated on EE3 at t21
...PEIj is installed on EE3 at t15
...EE3 is installed on JVMx at t4JVMx is installed on Linuxy at t3
...
Phil. Trans. R. Soc. A (2011)

Performance database 3271
measurement parameter·tag, interval,...Ò
statistic·tag, time stamp, value count, unit, ...Ò
observera a PEj PEk PEi
PEy
rateobservertype
observer
(a) (b)rate
observerbuffer
observer
bufferobserver
Figure 2. The design and use of observer. (a) Design of observer and (b) types of observer.
Assume that the log above is generated by the system, and X is installed on Y attz indicates that a software component X is installed or instantiated on anothersoftware or hardware component Y at time tz . From the log, the software andhardware stack for the DIVM can be reconstructed, as illustrated in figure 1b.
The MF captures the enactment performance using a specific type of PE,named an observer. As illustrated in figure 2a, an observer receives data frominput streams from a previous PE, performs a time-stamping, and outputs thedata to the following PE without altering the content of the data. By placingobservers on the data streams, detailed enactment information can be capturedand used for making appropriate optimization decisions. We have designed threetypes of observer, each with minimum impact on performance and a capability tocapture performance data from a different perspective, as illustrated in figure 2b:
— Type observer is used to capture type information of the data flow onany given data stream. Together with the semantic information of theworkflows, the type information may be useful in estimating the datatransfer cost and determining the ability to split a data stream and processin parallel. The type information should be collected prior to enactment.In due course this will be superseded by capturing the equivalent datafrom the language parser.
— Rate observer measures the data-processing rate of data streams. Whenused in pairs, rate observers can capture the processing time per unit ofdata of a PEI. As shown in figure 2b, a rate observer is placed before PEkto capture its input data rate during the enactment. Together with theoutput data rate measured by another rate observer, we can know theprocessing rate of PEk .
— Buffer observer is used to observe the buffer implementation of datastreams. Buffers are used when there are variations in the data-processingrate of any connected PEs. In figure 2b, buffer observers on the two inputstreams of PEl determine the rates at which data arrive on each stream,from which we can infer the critical path of the workflow.
The results collected from observers are sent to a gatherer PE, which willinsert these data into the PDB after the enactment is finished. This reduces theoverhead incurred during enactment.
Phil. Trans. R. Soc. A (2011)

3272 C. S. Liew et al.
instance_idclass_id
PEInstanceinstance_idinstalled_ontimerequest_id
PEInstallation
instance_idtime
PETermination
stream_idsrc_instance_idsrc_output_namedest_instance_iddest_input_name
DataStream
stream_ideventtime
Events
workflow_idenactment_idsubmitted_totimeuser_id
EnactmentStart
enactment_idtimetermination_code
EnactmentEnd
instance_idstart_timeend_timeunit_processedtime_per_unitunit_type
PerfOfPEInstance
instance_idnamecategoryversion
DIVMInstance
InstanceIDInstalledOnTime
DIVMInstallation
InstanceIDTime
DIVMTermination
class_idnameversioncomplexitydominant_input_namedominant_output_nameregistry_class_id
Class
workflow_idworkflow_textuser_id
WorkflowSubmit
Figure 3. Logical content of PDB.
(b) Organize stage: organizing performance data in the performance database
The tables in the PDB are divided into three categories according to howtheir data are collected (figure 3). The first type of table stores data harnessedfrom log files, e.g. Installation, WorkflowSubmit, EnactmentStart, PEInstance andDIVMInstance. The second type of table stores data collected from the MF,e.g. DataStream, Events. These two types of data are considered raw data. Thefinal type of table stores data that are derived by analysing the raw data from theabove tables, e.g. PerfOfInstance. For instance, the table Events stores the eventsthat occur on each data stream. By processing these data, we can calculate theunit cost for any given PE on the enacted DIVM.
(c) Use stage: transforming performance database data into information
Figure 4 illustrates the stages of PDB use. For each stage, we formulatedifferent sets of queries to access the PDB. The PDB data allow us to understandand validate hypotheses about PEs and their enactment behaviour, such as thetype of data flow in the data stream and the processing rate of PEs on differentplatforms. Following Gray [4], we identify the most prevalent 20 questionscovering the three stages. An example is shown below, and two more appearin appendix A.
Question. What is the characteristic performance of instances of class PEa onDIVM1 compared with its performance on DIVM2?
Phil. Trans. R. Soc. A (2011)

Performance database 3273
PDB
log
MF
stage 1: understanding and validating PEand enactment behaviour
stage 2: providing parameters for cost models
stage 3: dynamic optimization
PE deploymentand connections
timing of enactments
DIVMconfigurations
Figure 4. Overall information flow in the PDB.
Usage. To find out the most suitable DIVM to enact a PEI. The query willretrieve all of the previous execution records of a PEI on all of the DIVM, filteredby DIVM1 and DIVM2.
SELECT AVG(PerfOfPEInstance.time_per_unit), MIN(PerfOfPEInstance.time_per_unit),
MAX(PerfOfPEInstance.time_per_unit), COUNT(DIVMInstance.instance_id),
DIVMInstance.instance_id
FROM PerfOfPEInstance, PEInstance, DIVMInstance, PEInstallation
WHERE PerfOfPEInstance.instance_id = PEInstance.instance_id
AND PEInstallation.instance_id = PEInstance.instance_id
AND PEInstallation.install_on = DIVMInstance.instance_id
AND PEInstance.class_id = ’PEa’
AND (DIVMInstance.instance_id = ’DIVM1’ OR DIVMInstance.instance_id = ’DIVM2’)
GROUP BY DIVMInstance.instance_id
This question focuses on the enactment behaviour of the PEIs and tries tovalidate the effect of DIVM selection on the enactment performance. The lastquestion in appendix A attempts to understand the cohabiting behaviour of PEIsas that should affect the mapping decisions. The information gained from thestudy of enactment behaviour of the PEs is crucial for constructing a cost model toanalyse the performance of previous enactments and to predict the performanceof future enactments. For instance, data from previous enactments show thatmapping PEIj and PEIk onto the same DIVM1 will result in low performance owingto central processing unit (CPU) cycle competition among PEIs. However, thedata also indicate that the transfer rate between DIVM1 and DIVM2 is low. To findthe optimum mapping of PEIs onto DIVMs, we must perform a cost analysis overthe potential mappings. The PDB can be used to estimate the parameters usedin the cost model for such analyses. Our ultimate goal is to dynamically optimizeenactment based on performance data gathered from previous runs.
(d) Discard stage: cleaning performance database data
The size of the PDB is expected to grow rapidly. The number of rows insertedinto the Events table is proportional to the number of input and output datastreams, and how frequently a time-stamping is performed. To sustain the
Phil. Trans. R. Soc. A (2011)

3274 C. S. Liew et al.
...
ODE
processor
VM
DIVMk
ODE
processor
VM
DIVMk+1
ODE
processor
VM
DIVM(k+n–1)
processor
VM
DIVMd
processor
VM
DIVMg
processor
VM
DIVMi
siteasiteb
PDB
PDB
registry
ODEk
PEIi
processor
softwarevirtual machine
PEIj PEIl ...
admiregateway
admiregateway
admiregateway
datasources
datasources
datasources
hardware
ODEk+1
DIVMm
(a) (b)
Figure 5. DIVM abstraction in the prototype implementation. (a) DIVM abstraction and(b) example set-up of two ADMIRE sites.
performance of the PDB, a cleaning process is needed to remove out dated orless important data. The PDB is cleaned in three ways: (i) by removing theraw data associated with derived data (e.g. clean up the Events table afterdata have been digested and added into PerfOfPEInstance), (ii) by removing dataassociated with deprecated versions of a class, and (iii) by removing data that areobsolete (e.g. pertaining to a discontinued DIVM or after a predefined numberof days).
3. Prototype implementation
The prototype has been implemented in the ADMIRE project (http://www.admire-project.eu/)—a European-funded project that is pioneering architectureand models that deliver a coherent, extensible and flexible framework to facilitateexploration and exploitation of data.
Figure 5a shows the DIVM abstraction in the prototype implementation. Wehave reduced the software and hardware stacks for the prototype to four layers.The only hardware layer in the current abstraction is the processor. We assumethat the layers below the processor, e.g. network, are kept in separate systems. Asfor the prototype, we consider that each processor is running a single operatingsystem on a single virtual machine, thus the virtual machine layer is immediatelyon top of the processor layer. The virtual machine encapsulates a packagingof hypervisor, operating system and Java virtual machine and in future themodel may need to characterize data-storage architecture and communicationarchitecture. Each virtual machine can run one or more services, e.g. OGSA-DAI engine (ODE), ADMIRE gateway or data source. Figure 5b illustrates anexample set-up of two ADMIRE sites. Sitea consists of DIVM, which servesas a gateway and hosts a data source. The gateway is connected to anothergateway running on DIVMg at a remote site, siteb. Siteb comprises a gateway(DIVMg), a data source (DIVMd) and n ODEs ([DIVMk1, DIVMk2, …, DIVMkn ]). TheRegistry hosted in Siteb keeps all the semantic information about the PEs anddata sources that are used for type validation and optimization [6,7]. The typeinformation includes the structure of the value streaming through a connection.Each sites has a PDB that keeps the performance data collected from thelocal enactments.
Phil. Trans. R. Soc. A (2011)

Performance database 3275
(a) Collecting data from configuration logs
There are three different types of services in the example shown in figure 5b,and the configuration logs are collected as follows:
— When an ADMIRE gateway is started, the gateway start-up script willdetect on which processor (machine) it is hosted, e.g. DIVMg .
— When an ODE is started, the ODE will determine which processor(machine) it is running on, e.g. DIVMk .
— To capture when a data source such as a MySQL daemon is launched, wehave to add additional commands to the start-up script to capture thedata, e.g. DIVMd .
(b) Collecting data from the measurement framework
In an earlier section, we proposed a logical design of the MF that uses threetypes of observer to collect performance data: type observer, rate observer andbuffer observer. The type observer is applied during the Data-Intensive SystemProcess Engineering Language (DISPEL) processing stage [7]. DISPEL is alanguage developed in the ADMIRE project which is processed to generate agraph for optimization and enactment. When the DISPEL language processorwalks the generated graph verifying that source assertions and destinationrequirements about the structure types of values in the data stream arecompatible. The input and output structural type of every PEI in the requestwill be recorded.
Both rate observer and buffer observer are implemented during the enactmentstage. We collect these data by observing the pipe buffer implementation in thedata stream. During the enactment, the data producer of a data stream writes(W) the data into the buffer, while the consumer reads (R) data from it. Bothoperations will trigger different events. Another two interesting events to recordare blockings from read and write (RB and WB). The MF collects data for thefollowing aspects of the enactment:
— Requests: a unique identifier for every workflow and a Unix time stampindicates when the workflow request is received.
— Activities: the PEs and the PEIs used in every workflow. In the prototype,PEs are implemented as OGSA-DAI activities and executed in ODEs, thus,the PEs’ names appear in this log as OGSA-DAI activities. Every PEI isgiven a unique identifier. PEIs are connected with data streams (OGSA-DAI pipes). The information about the sources and targets of every datastream are stored separately: pipes–sources and pipes–targets, which allowthe MF to store precisely when every buffer event occurs in both sourceand target of any given data stream.
— Activities–events: the states of every PEI i.e. PENDING (PEI is initiatedand is waiting for execution), STARTED (PEI has been picked up by one ofthe threads and execution has started) and COMPLETED (execution hasfinished).
— Pipes: the sources and the targets of data streams (outputs of PEIs) inevery workflow. Each data stream (pipe) is given a unique identifier.
Phil. Trans. R. Soc. A (2011)

3276 C. S. Liew et al.
Table 1. Information extracted from the events log.
information extracted operations for extracting information
total units of data flow in a datastream
count of W events of the pipe–source or count of R events ofthe pipe–target
time spent in reading from/writing to a data stream
the reading time is the average difference between successiveR events; writing time is similarly determined. An interveningWB or RB invalidates that particular interval
average data production time of asource PEI
the interval between first and last W event divided by numberof W events minus 1
data production rate of a sourcePEI
total units of dataPEI execution time
or1
average data production time
average data consumption time ofa target PEI
same as average data production time but observing R andRB events
data consumption rate of a targetPEI
same as above
compare the data productionrate of source PEI and dataconsumption rate of target PEI
observe the number of WB and RB events in the data stream.Faster data production rate of source PEI can be identifiedwhen more WB events are observed, and vice versa
— Pipes–events: the Unix time stamp for every buffer event on both pipes–sources and pipes–targets. Four types of events are recorded: W (pipe–source write data), R (pipe–target read data), WB (pipe–source is blockedfrom writing data) and RB (pipe–target is blocked from reading data).
PEIs and data stream identifiers are unique and never re-used so that instancesin successive requests are not conflated in queries against the PDB. From theseenactment data, we extract the information shown in table 1. We have automatedthe instrumentation by embedding the MF in the OGSA-DAI implementation.During the enactment, event listeners are running on separated threads to capturethe data stated above. There are two ways to organize these data: record in logfiles then load the records from these log files to populate the PDB after theenactment, or populate right away to the PDB hosted on a separate DIVM.The file-based logging was used first to decouple the PDB scheme design fromthe instrumentation design. Now these have stabilized direct updates to PDBhave been implemented. Our next architectural step is to automate the analysisprocess in which the gateway that handled the enactment request will trigger theprocessing of the performance data after each enactment.
4. Demonstration of performance database usage
The previous sections describe the overall design of the PDB and how theprototype is implemented in the ADMIRE project. We have deployed themeasurement probes in ADMIRE gateways and populated the PDB with
Phil. Trans. R. Soc. A (2011)

Performance database 3277
input
uk.org.ogsadai.WriteToDataSource
expression resource
uk.org.ogsadai.SQLQuery
data
data1 data2
uk.org.ogsadai.TupleMergeJoin
result
data
uk.org.ogsadai.TupleToWebRowSetCharArrays
result
data
uk.org.ogsadai.ByteArraysToTuple
result
literal
dispelProcessEPR transferID pollInterval
uk.org.ogsadai.GetGatewayDataResource
result
dataSourceResource
uk.org.ogsadai.ObtainFromDataSource
data
literalliteral literalliteral
ds01 ds02
ds03
ds04
ds05
ds06
Figure 6. Common data integration workflow.
performance data collected during the enactment of real-world workflows. Themain usage of the PDB is to bridge the gap between data collection andoptimization. In this section, we evaluate how performance data for two workflowsare used in extracting information for later optimization. The details about theoptimization algorithm for streaming workflows are outside the scope of this paperand will be presented in a separate publication.
The first workflow is a data integration and transformation workflow thatis frequently found across domains, as shown in figure 6. This workflow is atypical scientific workflow that involves: (i) retrieving data from distributedand heterogeneous data sources (retrieve data from a database using SQLQueryand streams of data from a remote data source using ObtainFromDataSource),(ii) merging two data streams (join two data streams using TupleMergeJoin),(iii) transforming the data streams (transforming the tuple output into XMLWebRowSet format using TupleToWebRowSetCharArrays), and (iv) deliveringresult (write the result into a data source using WriteToDataSource). The data fromthe log files are extracted and populated into tables: WorkflowSubmit, PEInstance,PEInstallation and DataStream. Graphs in figure 7 are the event trace during theenactment which is extracted from querying these tables (note that the verticalscale is logarithmic).
The first few RB events correspond to the period when the PEIs have startedand are trying to read data from their input data streams. Once SQLQuery hasexecuted it starts to write data into its output data stream which is read 2 mslater by TupleMergeJoin in input data1. After performing 20 writes, SQLQuery isblocked from writing (the default buffer size is 20 blocks of data). The blockingcontinues until TupleMergeJoin performs a read from the other input data2, andthen SQLQuery performs its 21st W.
The optimization challenge is to identify which branch in the graph (subDAG)is causing the delay. One of the ways to identify this problem is by looking at theblocked events. We executed the query below to count the events that occurredduring the enactment to plot the graph shown in figure 8 (note that the verticalscale is logarithmic).
Phil. Trans. R. Soc. A (2011)

3278 C. S. Liew et al.
1
10
102
103
0 1000 2000 3000 4000 5000 6000 0
no. u
nits
pro
cess
ed
time (ms)
ds01-Wds01-Rds02-Wds02-Rds03-Wds03-Rds04-Wds04-Rds05-Wds05-Rds06-Wds06-R
ds01-WBds01-RBds02-WBds02-RBds03-WBds03-RBds04-WBds04-RBds05-WBds05-RBds06-WBds06-RB
1000 2000 3000 4000 5000 6000time (ms)
(a) (b)
Figure 7. Events trace for data streams used in the workflow. (a) Write and read events and(b) WriteBlocked and ReadBlocked events.
1
10
102
103
104
ds01 ds02 ds03 ds04 ds05 ds06
even
ts c
ount
writeWriteBlockedreadReadBlocked
Figure 8. Events count for data streams used in the workflow.
SELECT PEInstance.class, Events.event, count(Events.event) AS NumOccurences
FROM PEInstance, Events WHERE stream_id IN
(SELECT DISTINCT DataStream.stream_id
FROM DataStream, PEInstance, PEInstallation
WHERE (DataStream.src_instance_id = PEInstance.instance_id
OR DataStream.dest_instance_id = PEInstance.instance_id)
AND PEInstance.instance_id = PEInstallation.instance_id
AND PEInstallation.request_id = ’request_id’)
GROUP BY Events.event;
When we traced the events that occur in all of the data streams, wefind that TupleMergeJoin received data from two input streams and there isclearly a long wait for the arrival of data from one of the streams. Observethat the two data streams into TupleMergeJoin suffer a large number of
Phil. Trans. R. Soc. A (2011)

Performance database 3279
results
name input
resulteu.admire.Results
118
height dbname width dblevel featurename filepath limit
eu.admire.ExpressionBuilder
expression
3 2190
parameters[0] parameters[1] data
eu.admire.ImageRescaleActivity
output
input
eu.admire.ImageToMatrixActivity
output
group indices data
eu.admire.FeatureExtractionArrayActivity
output
input
eu.admire.GroupSplitterActivity
output group
group image data
eu.admire.ClassificationActivity
output
desired classified
eu.admire.EvaluationActivity
result
file resource
uk.org.ogsadai.ReadFromFile
data
input
uk.org.ogsadai.Tee
output[0] output[1]
group features
eu.admire.StdDevPart1Activity
result
expression resource
uk.org.ogsadai.SQLQuery
data
input
uk.org.ogsadai.Split
output[0] output[1]
e
input
uk.org.ogsadai.ListRemove
output
group indices data
eu.admire.FeatureExtractionArrayActivity
output
input
eu.admire.MedianFilterActivity
output
parameters[0] parameters[1] data
eu.admire.FeatureGenerationArrayActivity
output
input
uk.org.ogsadai.Tee
output[0] output[1]
repeatedInput input
uk.org.ogsadai.ControlledRepeat
output repeatedOutput
input
uk.org.ogsadai.Tee
output[0] output[1]
repeatedInput input
uk.org.ogsadai.ControlledRepeat
output repeatedOutput
24number input
eu.admire.FisherRatioParallelActivity
output
input
uk.org.ogsadai.ListRemove
output
data
eu.admire.StandardDeviationCombineActivity
result
input
uk.org.ogsadai.ListRemove
output
parameters[0] parameters[1] data
eu.admire.FeatureGenerationArrayActivity
output
input
uk.org.ogsadai.ListRemove
output
input
eu.admire.ShowMatrixContentActivity
output
input
uk.org.ogsadai.ListRemove
output
input
uk.org.ogsadai.ListRemove
output
input
uk.org.ogsadai.ListRemove
output
file resource
uk.org.ogsadai.ReadFromFile
data
input
eu.admire.GroupSplitterActivity
output group
input
uk.org.ogsadai.ListRemove
output
data
uk.org.ogsadai.TupleSplit
result[5] result[0] result[2] result[1] result[3] result[4]
data
uk.org.ogsadai.TupleSplit
result[5] result[0] result[2] result[1] result[3] result[4]
input
uk.org.ogsadai.ListRemove
output
parameters[0] parameters[1] data
eu.admire.ImageRescaleActivity
output
input
uk.org.ogsadai.ListRemove
output
input
eu.admire.MedianFilterActivity
output
input
eu.admire.ImageToMatrixActivity
output
DbAdmire4Resource
input
uk.org.ogsadai.ListRemove
output
EuroExpressIIFileRes...
2
input
uk.org.ogsadai.ListRemove
output
EuroExpressIIFileRes...
embryo_limb_forelimb...
Figure 9. Classifier training in the EURExpressII workflow.
write blocks and that the remaining streams suffer negligible read blocks. Wecan conclude that TupleMergeJoin has a relatively large unit cost (time toprocess a unit of data) because of the WB events recorded by its predecessors(SQLQuery and ByteArraysToTuple) and the RB events recorded by its successor(TupleToWebRowSetCharArrays).
Phil. Trans. R. Soc. A (2011)
3280 C. S. Liew et al.
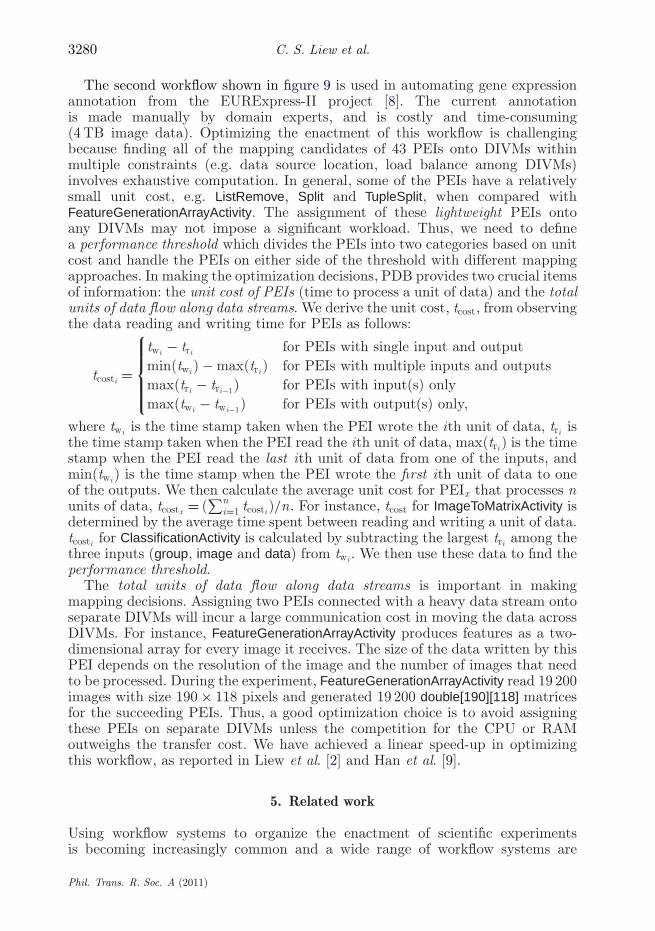
The second workflow shown in figure 9 is used in automating gene expressionannotation from the EURExpress-II project [8]. The current annotationis made manually by domain experts, and is costly and time-consuming(4 TB image data). Optimizing the enactment of this workflow is challengingbecause finding all of the mapping candidates of 43 PEIs onto DIVMs withinmultiple constraints (e.g. data source location, load balance among DIVMs)involves exhaustive computation. In general, some of the PEIs have a relativelysmall unit cost, e.g. ListRemove, Split and TupleSplit, when compared withFeatureGenerationArrayActivity. The assignment of these lightweight PEIs ontoany DIVMs may not impose a significant workload. Thus, we need to definea performance threshold which divides the PEIs into two categories based on unitcost and handle the PEIs on either side of the threshold with different mappingapproaches. In making the optimization decisions, PDB provides two crucial itemsof information: the unit cost of PEIs (time to process a unit of data) and the totalunits of data flow along data streams. We derive the unit cost, tcost, from observingthe data reading and writing time for PEIs as follows:
tcosti =
⎧⎪⎪⎪⎨⎪⎪⎪⎩
twi − tri for PEIs with single input and outputmin(twi ) − max(tri ) for PEIs with multiple inputs and outputsmax(tri − tri−1) for PEIs with input(s) onlymax(twi − twi−1) for PEIs with output(s) only,
where twi is the time stamp taken when the PEI wrote the ith unit of data, tri isthe time stamp taken when the PEI read the ith unit of data, max(tri ) is the timestamp when the PEI read the last ith unit of data from one of the inputs, andmin(twi ) is the time stamp when the PEI wrote the first ith unit of data to oneof the outputs. We then calculate the average unit cost for PEIx that processes nunits of data, tcostx = (
∑ni=1 tcosti )/n. For instance, tcost for ImageToMatrixActivity is
determined by the average time spent between reading and writing a unit of data.tcosti for ClassificationActivity is calculated by subtracting the largest tri among thethree inputs (group, image and data) from twi . We then use these data to find theperformance threshold.
The total units of data flow along data streams is important in makingmapping decisions. Assigning two PEIs connected with a heavy data stream ontoseparate DIVMs will incur a large communication cost in moving the data acrossDIVMs. For instance, FeatureGenerationArrayActivity produces features as a two-dimensional array for every image it receives. The size of the data written by thisPEI depends on the resolution of the image and the number of images that needto be processed. During the experiment, FeatureGenerationArrayActivity read 19 200images with size 190 × 118 pixels and generated 19 200 double[190][118] matricesfor the succeeding PEIs. Thus, a good optimization choice is to avoid assigningthese PEIs on separate DIVMs unless the competition for the CPU or RAMoutweighs the transfer cost. We have achieved a linear speed-up in optimizingthis workflow, as reported in Liew et al. [2] and Han et al. [9].
5. Related work
Using workflow systems to organize the enactment of scientific experimentsis becoming increasingly common and a wide range of workflow systems are
Phil. Trans. R. Soc. A (2011)

Performance database 3281
available. Deelman et al. [10] propose a taxonomy of workflow features andreview existing workflow systems. Some of the workflow systems, e.g. CondorDAGman [11] and Taverna [12], provide monitoring services to monitor eventscorresponding to the state transition of processing entities. This informationis mainly used for fault tolerance and not for optimization. Our work looksinto fine-grained performance monitoring of processing entities including timinginformation of every single unit of data in the data stream.
Similar to our work, ASKALON [13] monitors the status of executionand provides feedback for optimization. The execution engine allows users toobserve various metrics of the execution progress. ASKALON has developed aperformance analysis system and a formal overhead analysis model that is usefulin estimating task execution times and data transfer in a distributed environment.Instead, we focus on buffering analysis at data-stream level and performance datacollected from previous runs to estimate the enactment time.
ParaTrac [14] is a fine-grained profiler that provides an effortless way to extractlow-level input/output (I/O) profiles by looking deep into user-level file systemand process-tracing techniques. It provides a more accurate study of workflowcharacteristics and supports fine-grained and realistic scheduling of workflows.However, its file I/O profiling technique is not applicable to streaming workflows.In contrast, our proposed MF looks at the buffer implementations for datastreams and keeps track of every buffer event.
DIPAS [15] is a distributed performance analysis service that supports tracingexecution, analysing performance overheads and searching for performanceproblems of Web service-based workflows in the Grid. It can be easily integratedwith other Grid workflow middleware services through a loosely coupledWeb services resource framework (WSRF)-based interface. Again, the maindifferentiation is that our work focuses on streaming workflow.
6. Conclusion and future work
The data-streaming model allows overlapping execution of computing elements,which shortens the overall response time of workflow enactment. The datastreaming avoids writing intermediate values to disk except when buffersoverflow RAM. It therefore can process requests with large-scale data byan efficient implementation of buffering in the main memory where theprocessing speeds of memory access outperform the disk by a factor of morethan 105 [16]. Thus, the streaming model enables users to process large-scaledata with modest computing facilities. However, organizing the enactmentof streaming workflows is difficult because it needs to allocate the wholeworkflow at once, which requires a good understanding of each PEI’s enactmentbehaviour.
The present work aims to solve this problem by introducing a PDB, whereinformation is extracted from performance data gathered in previous runs. Weproposed the performance data life cycle and discussed the rationale for thePDB. We presented a systematic way to implement the PDB with a novelapproach to organizing performance data for streaming workflows. We presentedan initial design for its schema and illustrated its power with example queries.We built a prototype as part of the ADMIRE project and used it to collect
Phil. Trans. R. Soc. A (2011)

3282 C. S. Liew et al.
performance data for real-world use cases. We showed phenomena in the deriveddata that are highly relevant to understanding data streaming and to optimizingworkflows. We have then discussed how these data can be used in makingoptimization decisions.
The value of the PDB depends on two criteria: stability and recognition. Theformer is related to the consistency of the PDB behaviour across applicationdomains, users, scales and execution environments, while the latter is relatedto how the PDB identifies and supports numerical characterization of relevantperformance phenomena. The data to date are based on small-scale workflowsfrom a few domains and enacted on workstations. We will extend the rangeof experiments to a representative set of applications and scales. We will thenrefine the queries and the architecture to handle the new issues exposed. Wewould be pleased to cooperate in the extension of the PDB to serve any workflowsystems and optimization. Work is underway to use the PDB to validate modelsof streaming data performance and to use these models with parameters from thePDB to optionally deploy data-streaming enactments using distributed data onheterogeneous platforms.
The work presented in this paper is supported by the ADMIRE project (funded by EU FP7-ICT-215024) and the e-Science Core Programme Senior Research Fellow programme (funded by theUK EPSRC EP/D079829/1). We also acknowledge our very helpful colleagues in the OGSA-DAIteam.
Appendix A. Example questions
1. What is the performance of instances of PEa compared with instances ofPEb?Usage: To choose between two PEs with equivalent functionality.
SELECT AVG(PerfOfPEInstance.time_per_unit),
MIN(PerfOfPEInstance.time_per_unit),
MAX(PerfOfPEInstance.time_per_unit),
COUNT(PEInstance.class_id), PEInstance.class_id
FROM PerfOfPEInstance, PEInstance
WHERE PerfOfPEInstance.instance_id = PEInstance.instance_id
AND (PEInstance.class_id = ’PEa’ OR PEInstance.class_id = ’PEb’)
GROUP BY PEInstance.class_id
2. Compare the performance of instances of PEa depending on whether ornot there is an instance of PEb in the same DIVM.Usage: To find out whether co-locating two PE instances on the sameDIVM will result in loss of performance. This query can guide the decisionof whether to split the workflow across multiple DIVMs to speed up theperformance.If two instances are associated with the same request_id, then we can inferthat they coexist at the same time and potentially overlap in their use ofa DIVM. This is achieved with the following queries:Construct a view, PEIonDIVM that joins data from related tables.
Phil. Trans. R. Soc. A (2011)

Performance database 3283
CREATE VIEW PEIonDIVM ASSELECT Class.name AS pe, PEInstallation.instance_id AS pei,
PEInstallation.request_id, DIVMInstance.name AS divm,PerfOfPEInstance.time_per_unit
FROM PEInstance, PEInstallation, PerfOfPEInstance, Class, DIVMInstanceWHERE PEInstallation.instance_id = PEInstance.instance_id
AND DIVMInstance.instance_id = PEInstallation.install_onAND PEInstance.class_id = Class.class_id
AND PerfOfPEInstance.instance_id = PEInstance.instance_id;
Construct a view, Co_located to compute a subset of PEIonDIVM where therequest_id and divm are equal.
CREATE VIEW Co_located AS
SELECT DISTINCT a.pe, a.pei, a.time_per_unit, a.request_id,
a.divm, ’TRUE’ AS co_located
FROM PEIonDIVM a
INNER JOIN PEIonDIVM b
ON a.request_id=b.request_id AND a.divm=b.divm
WHERE (a.pe=’PEa’ AND b.pe=’PEb’) OR (a.pe=’PEb’ AND b.pe=’PEa’);
Construct another view, Not_co_located to compute a subset of PEIonDIVMwhere the request_id and divm are not equal.
CREATE VIEW Not_co_located AS
SELECT pe, pei, time_per_unit, request_id, divm, ’FALSE’ AS co_located
FROM PEIonDIVM
WHERE pe=’PEa’ AND pei NOT IN (SELECT pei from Co_located)
UNION
SELECT pe, pei, time_per_unit, request_id, divm, ’FALSE’ AS co_located
FROM PEIonDIVM
WHERE pe=’PEb’ AND pei NOT IN (SELECT pei from Co_located);
Finally, compute the performance from the UNION of both views above.
SELECT AVG(u.time_per_unit), MIN(u.time_per_unit), MAX(u.time_per_unit),
u.pe, u.co_located, COUNT(u.pe)
FROM (SELECT * FROM Co_located
UNION
SELECT * FROM Not_co_located) AS u
GROUP BY pe, co_located;
Phil. Trans. R. Soc. A (2011)

3284 C. S. Liew et al.
References
1 Gray, J. 2009 Jim Gray on eScience: a transformed scientific method. In The fourth paradigm:data-intensive scientific discovery (eds T. Hey, S. Tansley & K. Tolle), pp. xix–xxxiii. Redmond,WA: Microsoft Research.
2 Liew, C. S., Atkinson, M. P., van Hemert, J. I. & Han, L. 2010 Towards optimising distributeddata streaming graphs using parallel streams. In HPDC ’10: Proc. of the 19th ACM Int. Symp.on High Performance Distributed Computing (eds S. Hariri & K. Keahey), pp. 725–736. NewYork, NY: ACM. (doi:10.1145/1851476.1851583)
3 Gil, Y. et al. 2007 Examining the challenges of scientific workflows. Computer 40, 24–32.(doi:10.1109/MC.2007.421)
4 Szalay, A. S. & Blakeley, J. A. 2009 Gray’s Laws: database-centric computing in science. InThe fourth paradigm: data-intensive scientific discovery (eds T. Hey, S. Tansley & K. Tolle),pp. 5–11. Redmond, WA: Microsoft Research.
5 Dobrzelecki, B., Krause, A., Hume, A. C., Grant, A., Antonioletti, M., Alemu, T. Y., Atkinson,M., Jackson, M. & Theocharopoulos, E. 2010 Integrating distributed data sources with OGSA-DAI DQP and VIEWS. Phil. Trans. R. Soc. A 368, 4133–4145. (doi:10.1098/rsta.2010.0166)
6 Atkinson, M. P., van Hemert, J. I., Han, L., Hume, A. & Liew, C. S. 2009 A distributedarchitecture for data mining and integration. In DADC ’09: Proc. of the 2nd Int. Workshopon Data-Aware Distributed Computing, pp. 11–20. New York, NY: ACM. (doi:10.1145/1552280.1552282)
7 Yaikhom, G., Atkinson, M. P., van Hemert, J. I., Corcho, O. & Krause, A. 2011 Validationand mismatch repair of workflows through typed data streams. Phil. Trans. R. Soc. A 369,3285–3299. (doi:10.1098/rsta.2011.0135)
8 Han, L., van Hemert, J., Baldock, R. & Atkinson, M. 2009 Automating gene expressionannotation for mouse embryo. In Advanced data mining and applications (eds R. Huang,Q. Yang, J. Pei, J. Gama, X. Meng & X. Li). Lecture Notes in Computer Science, no. 5678,pp. 469–478. Berlin, Germany: Springer. (doi:10.1007/978-3-642-03348-3_46)
9 Han, L., Liew, C. S., van Hemert, J. & Atkinson, M. 2011 A generic parallelprocessing model for facilitating data mining and integration. Parallel Comp. 37, 157–171.(doi:10.1016/j.parco.2011.02.006)
10 Deelman, E., Gannon, D., Shields, M. & Taylor, I. 2009 Workflows and e-Science: anoverview of workflow system features and capabilities. Future Gener. Comp. Syst. 25, 528–540.(doi:10.1016/j.future.2008.06.012)
11 Couvares, P., Kosar, T., Roy, A., Weber, J. & Wenger, K. 2007 Workflow management incondor. In Workflows for e-Science (eds I. J. Taylor, E. Deelman, D. B. Gannon & M. Shields),pp. 357–375. London, UK: Springer. (doi:10.1007/978-1-84628-757-2_22)
12 Oinn, T. et al. 2007 Taverna/myGrid: aligning a workflow system with the life sciencescommunity. In Workflows for e-Science (eds I. J. Taylor, E. Deelman, D. B. Gannon &M. Shields), pp. 300–319. London, UK: Springer. (doi:10.1007/978-1-84628-757-2_19)
13 Fahringer, T. et al. 2007 ASKALON: a development and grid computing environment forscientific workflows. In Workflows for e-Science (eds I. J. Taylor, E. Deelman, D. B. Gannon &M. Shields), pp. 450–471. London, UK: Springer. (doi:10.1007/978-1-84628-757-2_27)
14 Dun, N., Taura, K. & Yonezawa, A. 2010 ParaTrac: a fine-grained profiler for data-intensiveworkflows. In HPDC ’10: Proc. of the 19th ACM Int. Symp. on High Performance DistributedComputing, pp. 37–48. New York, NY: ACM. (doi:10.1145/1851476.1851482)
15 Truong, H.-L., Brunner, P., Nae, V. & Fahringer, T. 2009 DIPAS: a distributed performanceanalysis service for grid service-based workflows. Future Gener. Comp. Syst. 25, 385–398.(doi:10.1016/j.future.2008.10.005)
16 Jacobs, A. 2009 The pathologies of big data. Commun. ACM 52, 36–44. (doi:10.1145/1536616.1536632)
Phil. Trans. R. Soc. A (2011)