Physiological mechanisms involved in water use efficiency in ...
149
Departament de Biologia Facultat de Ciències Grup de Recerca en Biologia de les Plantes en Condicions Mediterrànies Physiological mechanisms involved in water use efficiency in grapevines PhD Thesis Magdalena Tomás Mir IMEDEA-University of the Balearic Islands Palma de Mallorca, 2012 Supervisors: Dr. Jaume Flexas Sans & Dr.Hipólito Medrano Gil
-
Upload
khangminh22 -
Category
Documents
-
view
1 -
download
0
Transcript of Physiological mechanisms involved in water use efficiency in ...

Departament de Biologia
Facultat de Ciències
Grup de Recerca en Biologia de les Plantes en Condicions Mediterrànies
Physiological mechanisms involved in
water use efficiency in grapevines
PhD Thesis
Magdalena Tomás Mir
IMEDEA-University of the Balearic Islands
Palma de Mallorca, 2012
Supervisors:
Dr. Jaume Flexas Sans & Dr.Hipólito Medrano Gil


Nosaltres,
DR. JAUME FLEXAS SANS, Professor Titular de Fisiologia Vegetal
DR. HIPÓLITO MEDRANO GIL, Catedràtic de Fisiologia Vegetal, i
del Department de Biologia de la Facultat de Ciències de la Universitat de les Illes
Balears
CERTIFIQUEM :
Que el present treball titulat “Physiological mechanisms involved in water use
efficiency in grapevines”, presentat per Magdalena Tomás Mir per optar al TÍTOL
univesitari oficial de DOCTOR per la Universitat de les Illes Balears dins del
programa de doctorat en Biologia de les Plantes en Condicions Mediterrànies,
s’ha realitzat sota la nostra direcció al Departament de Biologia de la Facultat de
Ciències de la Universitat de las Illes Balears.
Revisat el present treball, autoritzem la seva presentació per què pugui ésser
jutjada pel tribunal corresponent.
Palma de Mallorca, 23 d’Abril del 2012
Director Director Autora Jaume Flexas Sans Hipólito Medrano Gil Magdalena Tomás Mir

Als meus pares,
Joan i Malena


Acknowledgements
i
AGRAÏMENTS - ACKNOWLEDGEMENTS No em pensava mai que algun dia arribes el moment d’escriure els
agraïments de la meva pròpia Tesi doctoral, però la vida ens prepara molts reptes
en els que cada vegada ens hem de superar. Vos puc assegurar que aquesta Tesi ha
estat un d’ells que amb molt d’esforç i voluntat, i l’ajuda de moltes persones ho he
pogut aconseguir. Per això, vos vull donar les gràcies a tots.
En primer lloc a tots els membres del grup de recerca de Biologia de les
plantes en condicions Mediterrànies, pel vostre suport en tot moment, i per donar-
me l’oportunitat de pertànyer en aquest gran grup que no tan sols m’ha enriquit
com a investigadora sinó també com a persona. En especial vull donar les gràcies
als meus directores de Tesi, al Dr.Hipólito Medrano i al Dr. Jaume Flexas, perquè
sense una bona direcció no hagués pogut arribar a port. A n’Hipólito pels seus
grans consells i per la confiança que va posar en jo des del començament donant-
me l’oportunitat d’introduir-me en el món de la investigació i la viticultura quan
tan sols era una estudiant de Biologia. A en Jaume, perquè malgrat tots els
contratemps sempre ha estat devora jo per ajudar-me a entendre el món de la
Fisiologia Vegetal i formar-me com a investigadora.
Als doctors Jeroni Galmés i Josefina Bota que em varen iniciar a la
recerca. Gràcies Jeroni per ensenyar-me a treballar amb precisió i eficàcia en el
laboratori, pels teus grans consells i pels bons moments que hem passat junts.
Gràcies Jose per haver-me recolzat ens els bons i no tan bon moments d’aquesta
Tesi i per ensenyar-me a valorar el que tenim més enllà de la investigació.
Als doctors Miquel Ribas (per fer de MacGyver quan sempre l’he
necessitat i ensenyar-me el per què de tantes coses), Pepe Escalona (per haver-me
ajudat tant aquest darrers anys de Tesi), Alex Gallé, Xavi Gulías, Miquel Àngel
Conesa, Pep Cifre i Joan Rosselló, pel vostre recolzament i bons consells.
A n’ Alícia i a en Tià per les rialles que hem compartit i per la seva ajuda
en el meu treball que sense ells no hagués estat possible. A totes les persones que
han passat per “ca’n Boom” des dels meus inicis: a na Ceci (por nuestros buenos
momentos), na Maite, na Belen (perquè sempre m’has ajudat amb el que he
necessitat), en Diego, n’Enrico, na Perla, na Cristineta, al catalanarro Igor, n’Ocho
(l’amo d’u pi de Ternelles), en Pere, n’Alejandro, n’Alfonso, na Hanan (por ser
como eres), n’Amani, na Carmen ,na Veriozka, en Xurxo, en JJ i n’Arantxa (por

Acknowledgements
ii
contagiarme tus ganas de vivir), perquè gràcies a voltros sempre hi hagut un bon
ambient de feina i heu estat al meu costat quan vos he necessitat. Gràcies a les
“chicas de ca’n boom” pels sopars i quedades que hem fet i que tant m’han ajudat
per oblidar els mals de cap de la feina. A en Miquel Truyols i Pep Sastre pel
suport que ens han donat a la nostra recerca tots aquests anys.
I would also like to state my gratitude to Dr. Enrico Brugnoli and his
research group from the consiglio nazionale delle ricerche (CNR; Porano, Italy),
and to Dr. Ülo Niinemets and his research group from Institute of Agricultural and
Environental Sciences, Estonia. Thank you for allowing me to be part of your
laboratories. I’m also very grateful to Miguel, Vivian, Lea, Tiina, Steffan and
Lucian for being so nice outside of the laboratory making funnier my stage
(saunas, summer parties, wine tasting…) in spite of the freezing weather of
Estonia.
A les meves amigues de ciutat, Pilar, Ivette, Ana, Elisa i Cristina, i a tota la
tropa esporlerina (que no anomen un per un perquè sinó no acabaria mai), pels
bons moments que hem passat junts que m’han permès desconnectar i gaudir del
temps lliure.
A tota la meva família banyalbufarina i ciutadana, que sense sabre molt bé
si estudiava, feia feina o què feia sempre m’han animat amb el que fos el que
estava fent. A la meva família esporlerina, especialment a na Margalida i en
Miquel que sempre m’han tractat com a una filla més. I de manera molt especial,
encara que mai serà suficient, vull donar les gràcies als meus pares i germans,
perquè ells han estat el pilar de la meva formació i els responsables de que hagi
arribat aquí a on soc, a voltros vos ho dec tot, el que tenc i el que soc. Gràcies a
mu mare perquè tan sols els seus consells han estat els que m’han calmat, consolat
i anima’t, i per ensenyar-me a valorar el que realment és important. Gràcies a mon
pare que m’ha ensenyat a ser feinera i precisa, i que amb la seva saviesa i la seva
experiència m’ha ajudat molt en el món de la viticultura. Gràcies als meus
germans Maria, Xesc, al meu quasi germà Marc i a la nouvinguda Rosa que mai
han entès molt bé el per què del sacrifici de tantes hores lliures però que sempre
han estat al meu costat i han cregut en mi. I com no, gràcies a les meves nines,
n’Aina i n’Irene, que cada dematí m’han contagiat la seva alegria i m’han donat la
força per continuar el dia a dia d’aquests quatre anys.

Acknowledgements
iii
Finalment i de manera molt especial vull donar les gràcies a la persona que
duc dins el meu cor, en Pere, per estar sempre al meu costat, entendre la meva
feina ajudant-me a qualsevol cosa i a qualsevol moment, i per escoltar-me i
animar-me quan més ho he necessitat. Gràcies de tot cor .
Gràcies a tots

iv

Symbols and Abbreviations List
v
SYMBOLS AND ABBREVIATIONS LIST Symbols Meaning ς diffusion path tortuosity α leaf absorptance ABA abcisic acid AN net CO2 assimilation rate AOP alternative oxidase pathway ATP adenosine triphosphate β fraction of absorbed light that reaches photosystem II Ca atmospheric CO2 concentration Cc chloroplastic CO2 concentration Ce CO2 concentration of air entering in the gas exchange chamber Ci sub-stomatal CO2 concentration Ci* apparent CO2 photocompensation point Co CO2 concentration of air leaving the gas exchange chamber COP cytochrome oxidase pathway Cs leaf surface CO2 concentration cw cell wall ∆13C carbon isotope discrimination ∆i carbon isotope discrimination predicted ∆Li diffusion path length ∆Lias half of mesophyll thickness ∆obs carbon isotope discrimination observed Da diffusion coefficient for CO2 in the gas-phase DL leaf density Dw aqueous phase diffusion coefficient for CO2 E leaf transpiration rate Enight leaf night transpiration ET0 Evapotranspiration ETR (Jflu) electron transport rate ФCO2 apparent quantum efficiency of CO2 fixation ФPSII maximum quantum efficiency of the PSII photochemistry F curvature correction factor F’m maximum fluorescence in light-adapted state F0 basal fluorescence of a dark adapted leaf fias volume fraction of intercellular air spaces Fm maximum fluorescence in dark-adapted state Fo basal fluorescence of the dark adapted leaf Ft steady state fluorescence emission Fv/Fm maximum quantum efficiency of PSII photochemistry Γ* CO2 compensation point in the absence of mitochondrial respiration gb boundary layer conductance gct cytosol conductance gcut cuticular conductance gcw cell wall conductance genv chloroplast envelope conductance gias intercellular air space conductance to CO2/ gas phase conductance glip lipid phase conductance gliq liquid phase conductance gm mesophyll conductance

Symbols and Abbreviations List
vi
Symbols Meaning gnight night conductance gpl plasmalemma conductance gs stomatal conductance to H2O gsc stomatal conductance to CO2 gstr chloroplast stroma conductance gtot total conductance IBA indolbutyric acid Ja linear electron transport rate by gas exchange Jf linear electron transport rate by chlorophyll fluorescence Jmax Maximum photosynthetic electron transport rate Kc Michaelis constant for the carboxylation activity of Rubisco Kcat in vivo specific activity of Rubisco per active sites Ko Michaelis constant for the oxygenation activity of Rubisco LA leaf area LAI leaf are index lb biochemical limitation Lchl length of chloroplasts exposed to intercellular air spaces li liquid and lipid phase limitation lias gas phase limitation Lm length of mesophyll cells exposed to intercellular airspaces lm mesophyll limitation ls stomatal limitation MA leaf mass per area NPQ non-photochemical quenching Oi leaf internal oxygen concentration PAR photosynthetic active radiation PB plant biomass PCB whole plant carbon balance PEPC phosphoenolpyruvate carboxylase pi effective porosity PPFD photosynthetic photon flux density PRD partial root drying QA quinone A Rd leaf dark respiration RDI regulated deficit irrigation RGR relative growth rate RL leaf light respiration Rleaf leaf respiratioin ROS reactive oxygen species Rroot root respiration Rstem stem respiration Rub Rubisco Sc/S chloroplast surface area exposed to intercellulare air spaces Sm/S mesophyll surface area exposed to intercellulare air spaces Ss cross sectional area of mesophyll cells SWC soil water content Τ Rubisco specificity factor Tcw cell wall thickness Tcyt cytoplasm thickness TL leaf thickness tmes mesophyll thickness TPU triose phosphate Tsoil soil temperature vc velocities of carboxylation of Rubisco

Symbols and Abbreviations List
vii
Symbols Meaning Vc,max maximum rates for the carboxylation activity of Rubisco vo velocities of oxygenation of Rubisco Vo,max maximum rates for the oxygenation activity of Rubisco VPD vapour pressure deficit VTPU velocity of triose-phosphate utilization rate w width of leaf anatomical section WUE water use efficiency WUEc crop water use efficiency WUEi (AN/gs) intrinsic water use efficiency WUEinst (AN/E) instantaneous water use efficiency WUEl leaf water use efficiency WUEWP whole plant water use efficiency WUEy yield water use efficiency δ
13C carbon isotope composition δe isotopic composition of CO2 entering in gas exchange chamber δo isotopic composition of CO2 leaving gas exchange chamber ΨMD midday leaf water potential ΨPD predawn leaf water potential

viii

Contents
ix
CONTENTS AGRAÏMENTS - ACKNOWLEDGEMENTS ...................................................................i
SYMBOLS AND ABBREVIATIONS LIST......................................................................v
CONTENTS.................................................................................................................................ix
Chapter 1. INTRODUCTION ............................................................................. 1 1.1. WATER STRESS AND MEDITERRANEAN CLIMATE.......................................................2
1.1.1. The importance of water stress in plants ..........................................................................2 1.1.2. The special interest of Mediterranean climate areas ........................................................2
1.2. GRAPEVINE: A CLASSIC MEDITERRANEAN CROP ........................................................4 1.3. WATER USE EFFICIENCY .....................................................................................................5
1.3.1. Concepts of water use efficiency .....................................................................................5 1.3.2. Methodologies to determine water use efficiency............................................................8 1.3.3. Improvement of water use efficiency.............................................................................10
1.3.3.1. Agronomical management practices.............................................................10 1.3.3.2. Genetic variability of water use efficiency ...................................................11 1.3.3.3. Potential physiological targets for plant breeding and biotechnology ..........12
1.4. PROMISING PHYSIOLOGICAL PARAMETERS TO IMPROVE WATER USE EFFICIENCY..................................................................................................................................16
1.4.1. Mesophyll conductance to CO2......................................................................................16 1.4.1.1. Variability of gm among species and responses of gm to environmental variables.....................................................................................................................18 1.4.1.2. Mechanisms that determine gm .....................................................................21 1.4.1.3. Mesophyll conductance (gm) in grapevines ..................................................23
1.4.2. Cuticular and night conductance ....................................................................................24 1.4.2.1. Variability and factors affecting night conductance (gnight) ..........................24 1.4.2.2. Cuticular and night conductance in grapevines ...........................................27
1.4.3. Plant respiration .............................................................................................................28 1.4.3.1. The importance of leaf respiration and its functions.....................................28 1.4.3.2. Respiration in grapevines..............................................................................31
Chapter 2. OBJECTIVES AND OUTLINE..................................................... 33
2.1. GENERAL OBJETIVES .........................................................................................................34 2.2. SPECIFIC OBJECTIVES ........................................................................................................34 2.3. OUTLINE OF THE THESIS ...................................................................................................35 2.4. PUBLICATIONS DERIVED FROM THE PRESENT THESIS.............................................37
Chapter 3. MATERIAL AND METHODS .......................................................39
3.1. PLANT MATERIAL ...............................................................................................................40 3.2. GROWTH CONDITIONS.......................................................................................................42 3.3. WATER STRESS TREATMENTS ........................................................................................43 3.4. MEASUREMENTS .................................................................................................................43
3.4.1. Plant and soil water status ..............................................................................................43 3.4.1.1. Leaf water potential..........................................................................................43 3.4.1.3. Soil water content .............................................................................................44
3.4.2. Chlorophyll fluorescence measurements........................................................................44

Contents
x
3.4.2.1. The Fluorescence parameters........................................................................... 45 3.4.3. Gas exchange measurements......................................................................................... 47
3.4.3.1. IRGA overview................................................................................................ 47 3.4.3.2. Leaf gas exchange measurements.................................................................... 50 3.4.3.2.1. Instantaneous gas exchange measurements ................................ 50 3.4.3.2.2. AN-Ci curves ............................................................................... 50 3.4.3.2.3. Respiration in the light and apparent CO2 photocompensation
point ............................................................................................................ 51 3.4.3.2.4. Cuticular conductance................................................................. 52 3.4.3.2.5. Leaks........................................................................................... 52 3.4.3.3. Respiration measurements ............................................................................... 53 3.4.3.3.1. Leaf respiration ........................................................................... 53 3.4.3.3.2. Root respiration .......................................................................... 54 3.4.3.3.3. Stem respiration .......................................................................... 55
3.4.4. On-line measurements of stable carbon isotope discrimination .................................... 57 3.4.5. Water use efficiency...................................................................................................... 58
3.4.5.1. Intrinsic (AN/gs) and instantaneous (AN/E) water use efficiency ..................... 58 3.4.5.2. Carbon isotope composition in leaf dry matter................................................ 58 3.4.5.3. Whole plant water use efficiency..................................................................... 59
3.4.6. Leaf anatomy................................................................................................................. 59 3.4.6.1. Light microscopy............................................................................................. 60 3.4.6.2. Electron microscopy ........................................................................................ 60
3.4.7. Leaf morphological parameters ..................................................................................... 61 3.4.7.1. Leaf mass per area and leaf density ................................................................. 61
3.4.8. Other measurements ...................................................................................................... 62 3.4.8.1. Leaf area .......................................................................................................... 62 3.4.8.2. Rubisco Content .............................................................................................. 62 3.4.8.3. Specific activity of Rubisco in vivo (kcat) ........................................................ 63 3.4.8.4. Extraction of leaf soluble sugars...................................................................... 63 3.4.8.5. Leaf absorptance.............................................................................................. 64
3.5. CALCULATIONS .................................................................................................................. 64 3.5.1. Estimation of mesophyll conductance (gm) to CO2 ....................................................... 64
3.5.1.1. Estimation of gm with gas exchange and chlorophyll fluorescence ................. 64 3.5.1.1.1. Parameters derived from AN-Cc curves........................................... 66 3.5.1.2. Estimation of gm with gas exchange only: the curve-fitting method ............... 67 3.5.1.3. Estimation of gm with gas exchange and 13C isotope discrimination............... 68 3.5.1.4. Estimation of gm from anatomical parameters ................................................. 70
3.5.2. Quantitative limitation analysis ..................................................................................... 72 3.5.2.1. Quantitative analysis of photosynthesis limitations......................................... 72 3.5.2.2. Quantitative analysis of limitations on mesophyll conductance ...................... 72
3.5.3. Plant carbon balance...................................................................................................... 73
Chapter 4. IMPROVEMENT OF WATER USE EFFICIENCY IN GRAPEVINES..................................................................................................... 75 4.1. IMPROVING WATER-USE-EFFICIENCY IN GRAPEVINES: POTENTIAL PHYSIOLOGICAL TARGETS FOR BIOTECHNOLOGICAL IMPROVEMENT ..................... 75

Contents
xi
Chapter 5. VARIABILITY OF MESOPHYLL CONDUCTANCE AND MECHANISTIC BASIS OF THESE VARIATIONS.......................................77 5.1. IMPORTANCE OF LEAF ANATOMY IN DETERMINING MESOPHYLL DIFFUSION CONDUCTANCE TO CO2 ACROSS SPECIES: QUANTITATIVE LIMITATIONS AND SCALING UP BY MODELS .........................................................................................................77 5.2. MESOPHYLL CONDUCTANCE VARIABILITY IN GRAPEVINE CULTIVARS IN RELATION TO LEAF ANATOMY AND WATER STRESS ......................................................77
Chapter 6. WATER USE EFFICIENCY AT LEAF AND WHOLE PLANT LEVEL ..................................................................................................................79 6.1. WATER USE EFFICIENCY IN GRAPEVINE CULTIVARS GROWN UNDER CONTROLLED CONDITIONS: EFFECTS OF WATER STRESS AT THE LEAF AND WHOLE PLANT LEVEL ..............................................................................................................................79 Chapter 7. IMPORTANCE OF PLANT RESPIRATION, CUTICULAR AND NIGHT TRANSPIRATION IN WHOLE PLANT WATER USE EFFICIENCY.......................................................................................................81 7.1. RESPONSES OF LEAF NIGHT TRANSPIRATION TO WATER STRESS IN VITIS
VINIFERA L....................................................................................................................................81 7.2. CARBON BALANCE IN GRAPEVINES UNDER DIFFERENT SOIL WATER SUPPLY: IMPORTANCE OF WHOLE PLANT RESPIRATION.................................................................81 Chapter 8. GENERAL DISCUSSION ...............................................................83
8.1. MECHANISMS THAT DETERMINE gm AND ITS EFFECTS ON LEAF WUE .................84 8.2. DOES LEAF WUE DETERMINE WHOLE PLANT WUE? ..................................................86 8.3. PHYSIOLOGICAL MECHANISMS THAT CAN AFFECT WHOLE PLANT WUE ...........88 8.4. GENERAL OVERVIEW.........................................................................................................90 Chapter 9. CONCLUSIONS ...............................................................................93 REFERENCES LIST...........................................................................................97

xii

Introduction
1
Chapter 1
INTRODUCTION
1.1. WATER STRESS AND MEDITERRANEAN CLIMATE.......................................................2 1.1.1. The importance of water stress in plants ............................................................ 2 1.1.2. The special interest of Mediterranean climate areas........................................... 2
1.2. GRAPEVINE: A CLASSIC MEDITERRANEAN CROP ........................................................4 1.3. WATER USE EFFICIENCY .....................................................................................................5
1.3.1. Concepts of water use efficiency........................................................................ 5 1.3.2. Methodologies to determine water use efficiency.............................................. 8 1.3.3. Improvement of water use efficiency ............................................................... 10
1.3.3.1. Agronomical management practices.................................................... 10 1.3.3.2. Genetic variability of water use efficiency .......................................... 11 1.3.3.3. Potential physiological targets for plant breeding and biotechnology. 12
1.4. PROMISING PHYSIOLOGICAL PARAMETERS TO IMPROVE WATER USE EFFICIENCY..................................................................................................................................16
1.4.1. Mesophyll conductance to CO2 ........................................................................ 16 1.4.1.1. Variability of gm among species and its response to environmental
variables ........................................................................................................ 18 1.4.1.2. Mechanisms that determine gm ............................................................ 21 1.4.1.3. Mesophyll conductance (gm) in grapevines ......................................... 23
1.4.2. Cuticular and night conductance ...................................................................... 24 1.4.2.1. Variability and factors affecting night conductance (gnight) ................. 24 1.4.2.2. Cuticular and night conductance in grapevines .................................. 27
1.4.3. Plant respiration................................................................................................ 28 1.4.3.1. The importance of leaf respiration and its functions ........................... 28 1.4.3.2. Respiration in grapevines .................................................................... 31

Chapter 1
2
1.1. WATER STRESS AND MEDITERRANEAN CLIMATE
1.1.1. The importance of water stress in plants Water is an essential component for the plants life owing to the crucial role
that water plays in all physiological processes. Water comprises 80 to 95% of the
fresh weight of most herbaceous plants and 50% of woody plants. The physical
and chemical properties of water make it essential for many functions in plants
such as: a constituent of most parts of plants, a solvent providing a good medium
for biochemical reactions and transport, a reactant in different processes such as
photosynthesis, respiration and other enzyme-mediated processes; and in the
maintenance of turgidity in plants.
Plant physiological processes are directly affected by the amount of water
that plants can extract from the soil. Water stress limits plant growth and crop
production more than any other single environmental factor (Boyer, 1982).
Stomatal closure, together with leaf growth inhibition, are among the first
processes affected in response to drought, protecting plants from extensive water
losses and reducing the source of assimilates (photosynthetic rate) and,
consequently, the resulting biomass. Therefore, many studies have focused their
attention on the importance of drought as one of the most important constrains
limiting growth in plants and crops and the ecosystem productivity worldwide
(Passioura, 1996). Furthermore, water is a key element determining vegetation
type, plant distribution and its survival which strongly depend on their ability to
adjust to environmental variations. Therefore, different genotypes have adapted to
a lack of water in the environment avoiding or tolerating drought. These strategies
can be observed in Mediterranean type vegetation where plants with predominant
drought-avoidance strategies, which die when they run out of water, coexist with
drought-tolerant sclerophylls. As a result, large variations among species in
photosynthetic response to water stress can be observed (Sullivan et al., 1974),
affecting the distribution of the species (Wuenscher & Kozlowski, 1971; Chaves
et al., 2007).
1.1.2. The special interest of Mediterranean climate areas There are five regions over the world that present Mediterranean climate.
They are located between 32º- 40º North and South of the Equator, in the west

Introduction
3
side of the continents (Aschmann, 1973). The Mediterranean Basin, surrounding
the Mediterranean Sea, is the largest area where this climate type is found. It also
prevails in coast of California, parts of Western and South Australia, the
southwest of South Africa, sections of Central Asia, and parts of the central coast
of Chile. All these areas combined represent between 1% and 4% of the land
surface (di Castri, 1981; Mooney, 1982). They are characterized by hot and dry
summers and cool and wet winters (Köppen, 1923). Winter temperatures are mild
(7-13ºC) with infrequent frosts and snow, whereas summers are hot with mean
temperatures of 14-25ºC (Paskoff, 1973). On the other hand, the annual
precipitation ranges from 275 to 900 mm/year (Conacher, 1995; Conacher & Sala,
1998). Most rainfall falls during winter months, and this is one of the key
elements that differentiate Mediterranean, Temperate and Subtropical climates.
According to Aschmann (1973) more than 65% of the annual rainfall generally
falls in winter, although in some areas this may variate (Köppen, 1923) with
important spring and autumn rains (Southern California and Southern Europe –
Miller, 1983). During summer, a drought period is present with variable length
and intensity between years. Thus, in these areas, progressive soil water deficits
and high leaf-to-air vapour pressure gradients, together with high irradiance and
temperatures, exert large constraints on plants, including crops yield and quality.
Moreover, in addition to water limiting conditions during the dry season, plant
growth is also constrained by cold temperatures during winter, since the growth of
many Mediterranean species is limited when daily mean temperatures are below
10ºC (Rambal, 2001), a common event in the Mediterranean Basin. Consequently,
the most important characteristic of this type of climate is the absence of a period
with both favourable temperatures and high soil water availability.
Most of the present Thesis research was developed in the Balearic Islands,
located in the Mediterranean Basin. This area is characterized by summer periods
with high irradiance, air temperature and high evaporative demand combined with
drought, limiting plant growth and productivity (Chaves et al., 2007). Moreover,
according to climate change predictions (IPCC 2007), soil moisture content could
decrease even more. It is expected that soil water availability could decrease from
20-30% for most of the Mediterranean areas and it can be down to 70% in the
Iberian Peninsula and the Balearic Islands, caused by increasing temperature
induced by a two-fold increase of the current levels of CO2 concentration

Chapter 1
4
expected during the next century (Schultz, 2000). This situation would imply the
need of irrigation and a more efficient use of water in agronomical practices, as
well as selecting plants more adapted to drought-prone areas.
A large part of the agricultural production in the Mediterranean Basin
comes from irrigated areas. Hence, agriculture consumes about 80% of water in
the region (Rijsberman, 2004). Increasing growing population and aridity in
Mediterranean areas, as suggested by climate change predictions, will convert
water into a scarce commodity. Thus, how to reduce agricultural water use and
make water resources more sustainable is an increasingly urgent need. Solving it
requires combined agronomic, physiological, biotechnological/genetic and
engineering approaches to save water.
1.2. GRAPEVINE: A CLASSIC MEDITERRANEAN CROP
Grapevines are one of the oldest cultivated plants that, along with the
process of making wine, have resulted in a rich geographical and cultural heritage
(Johnson, 1985; Penning-Roswell, 1989; Unwin, 1991). Grapevine is one of the
major horticultural crops produced on a worldwide basis and is mainly located in
Mediterranean areas (Mullins et al., 1992).
Vines can be cultivated from Temperate (from 30-50º North or South) to
Tropical climates, but most vineyards are planted in Temperate zones with high
variability of environmental conditions. Considering its large cultivation area, the
most significant grape-growing region is Europe, with 4.4 million hectares.
Among all countries, Spain accounts for the largest grape-producing areas
(1.082.000 Ha) with a prolific economy (1.200-1.900 M€), representing more than
10% of its total agricultural production, a socioeconomic profit (with about
400.000 wine producers) and an environmental-landscape profit (OIV,
Organisation Internationale de la Vigne et du Vin, 2011)
The range and magnitude of environmental factors (e.g., solar radiation,
heat accumulation, extreme temperatures, precipitation, wind, and extreme
weather events such as hail) differ considerably from region to region and are the
principal environmental constraints for grape production and wine quality. Water
shortage is probably the most dominant environmental constraint within the
production areas (Williams & Matthews, 1990). The combined effect of drought

Introduction
5
with periods of high air temperature and high evaporative demand during the
grapevine growing season limit grapevine yield as well as berry and wine quality
(Escalona et al., 1999a; Chaves et al., 2007; Costa et al., 2007). In addition, the
combined effect of these stress conditions may promote dramatic reductions in
plant carbon assimilation due to a severe decline of photosynthesis, as well as to a
partial loss of canopy leaf area (Flexas et al. 1998, 2002; Maroco et al., 2002;
Chaves et al., 2003, 2007; Santos et al., 2007).
In general, the grapevine crop areas in Spain are semi-arid (i.e
Mediterranean) and, consequently, although it is a typical dry land crop, irrigation
practices have been progressively adopted in this crop and they have become
common in modern Mediterranean viticulture. Moreover, it has been
demonstrated in different conditions that soil water availability regulates crop load
and fruit quality. Excess of water can reduce colour and sugar content of fruit and
produce imbalanced acidity wine (Matthews et al., 1990; Medrano et al., 2003;
Romero et al., 2010), while a drastic reduction of water will reduce crop yield and
frequently fruit quality. Therefore, the heterogeneity in grapevine responses to soil
water deficit and the difficulty to establish the optimum water dosage to be used
in a given environment and cultivar explain the need to study the physiological
responses to water stress in grapevines (Medrano et al., 2002, 2003; Flexas et al.
2002, 2006a).
1.3. WATER USE EFFICIENCY
1.3.1. Concepts of water use efficiency The term WUE reflects the balance between gains (kg of biomass produced
or mols of CO2 assimilated) and costs (m3 of water used or mols of water
transpired). This balance can be measured at different space scales (Medrano et
al., 2010) (Fig. 1.1) from leaves (the ratio of net assimilation vs leaf transpiration)
to whole plant or crop. Furthermore, this term can be studied at different time
scales from months (ie. biomass accumulation or yield) to minutes (instantaneous
exchange of water vapour for carbon dioxide).
At the leaf level, WUE can be measured at short (instantaneous gas
exchange measurements) or long term (carbon isotope ratio of leaf dry matter).
The carbon isotope ratio of leaf dry matter (δ13C) is determined by the gradient

Chapter 1
6
between CO2 concentration in the substomatal cavity (Ci) and the atmosphere (Ca),
established by the level of discrimination against 13C (∆13C), and is often regarded
as an integrative estimation of leaf WUE (WUEl) over the growth period
(Farquhar & Richards 1984). At shorter term, it is common to use single leaf gas
exchange measurements, relating net CO2 assimilation rate (AN) either to stomatal
conductance (gs), called intrinsic water use efficiency (WUEi), or AN to leaf
transpiration rate (E), defined as instantaneous water use efficiency (WUEinst)
(Fischer & Turner, 1978) (Fig. 1.1). WUEinst (AN/E) is influenced by the
environmental conditions, because E depends on the degree of stomatal opening
and vapour pressure deficit (VPD) of the atmosphere surrounding the leaf (E= gs ·
VPD). On the other hand, WUEi (AN/gs) excludes the effects of changing
evaporative demand on water flux out of the leaf depending only on the stomatal
opening (Bierhuizen & Slatyer, 1965). Therefore, it is of particular interest to
determine intrinsic differences in water use efficiency independent of specific
environmental conditions (Bota et al., 2001; Souza et al., 2005; Anyia et al.,
2007; Barbour et al., 2010; Gómez-Alonso et al., 2010; Galmés et al., 2011;
Zegada-Lizarazu et al., 2011).
WUEinst (AN/E) can also be used as daily estimation of WUE using the
daily integrals of AN and E (i.e., the accumulated carbon gain and water loss
during a whole day by a given leaf) (Medrano et al. 2003). In addition, when leaf
area is included in this daily estimation, WUEl could be scaled up to whole plant
WUE (WUEWP) (Medrano et al. 2012).
Whole plant WUE (WUEWP) is the balance between total plant dry matter
production and total water consumption by plant. In grapevines in particular,
transpired water depends on canopy structure and growth (leaf angle in relation to
the incoming irradiance and shoot positioning) determining the light interception
by the plant or the energy load by transpiration (Escalona et al., 2003; Medrano et
al., 2012) (Fig.1.1). Moreover, WUEWP depends on water losses during non-
assimilatory periods (cuticular and night transpiration) (Caird et al. 2007), and it
is also dependent on respiration in leaves, stems and roots during whole day.
These processes are not considered in the leaf gas exchange measurements to
estimate WUEl, therefore, these physiological processes could decrease WUEWP
and not influence WUEl estimates.

Introduction
7
For agronomic purposes it is more common to study WUE at yield level
(WUEy). Yield WUE (WUEy) is defined as the balance between the total
production of harvested yield, and total water consumption during the season by
the crop. In grapevines, bunches are the most active sink for photosynthates.
Grapes constitute only 20-30% of total plant dry biomass but up to 80-90% of
total photosynthesis assimilates obtained in one growing season are transported to
the fruits (Bota et al. 2004). Therefore, for practical purposes, in grapevines it is a
convenient procedure to take into account WUEy as an optimum target to improve
WUE.
At the crop level, WUE is defined as the amount of yield produced per unit
of water used (WUEc). This concept depends on crop water consumption during
the growing season. This is the sum of the amount of water lost not being used by
the plants (runoff, percolation and direct soil evaporation) plus the water
transpired by the plant (Fig. 1.1). The losses of water that are not directly
consumed by the crop can be avoided with agronomical practices (cover crops,
deficit irrigation, drip irrigation, night irrigation, etc.). Total irrigation joint with
yield can provide a rough estimate of WUEc and can help to develop a sustainable
crop.
The present Thesis focuses mainly in WUE at leaf and whole plant level.
Figure 1.1. Theoretical diagram of the components of WUE showing the dependency of crop water use efficiency (WUEc) on different processes and its links with leaf WUE (WUEl). LAI, leaf are index; VPD, vapour pressure deficit; gs, stomatal conductance; AN, net photosynthesis rate; E, transpiration rate; gm, mesophyll conductance; τ, Rubisco specificity for CO2. From Flexas et al. (2010)

Chapter 1
8
1.3.2. Methodologies to determine water use efficiency The methodologies for WUE measurements can be described on the basis
of time/space scale of its determinations; from instantaneous leaf measurements to
surrogate parameters such as δ13C for the whole growth season in a plant (see
Medrano et al., 2010) (Fig. 1.2).
As stated above, leaf WUE (WUEl) can be easily determined as the ratio
between net CO2 assimilation rate (AN) and transpiration rate (E) or stomatal
conductance (gs). AN/E and AN/gs are measured by gas exchange systems near
steady-state conditions in the field obtaining an instantaneous and non destructive
measurement that reflects the leaf capacity for WUEl. In addition, WUEl can be
measured by carbon isotope ratio of leaf dry matter (δ13C), often used as an
indicator of long-term WUE (Farquhar & Richards, 1984). Stable isotope
discrimination can be measured on-line to give instantaneous measurements of
WUE (Condon et al., 1990) or short-term WUE (1-2 days) by measuring the
isotopic composition of leaf soluble sugars (Brugnoli et al., 1988). However, the
major impact of the use of stable isotopes has been in the analysis of dry matter to
provide a simple and rapid screening method that integrates WUE over time,
given the fact that carbon isotope ratio of tissue carbohydrates depends on the
processes involved for their synthesis. This technique is based on the differential
use of carbon isotopes by the enzymes that fix CO2, RUBP carboxylase (Rubisco)
and PEP carboxylase, as well as on the physical differences of the isotopes that
induce different diffusivities (O’Leary et al., 1992). Carbon isotope discrimination
has generally been related to Ci/Ca according to the equation developed by
Farquhar et al. (1982a):
∆ = a + (b – a) Ci/Ca
where a is the fractionation occurring due to diffusion in air (4.4‰), b is
the net fractionation caused by RuBP2 and PEP carboxylation (between 27‰ –
30‰ ), and Ci/Ca is the ratio between CO2 concentration in intercellular spaces
(Ci) and ambient air (Ca). CO2 diffuses into leaves through stomata. During
diffusion, the heavier 13CO2 molecules diffuse more slowly. Thus, the air inside
the leaf pore space (Ci) is depleted in 13CO2. The concentration of CO2 inside the
leaf depends on the rate of photosynthesis and the opening of the stomatal pores,
which in turn influences isotopic discrimination (∆13C) – higher Ci/Ca results in
greater ∆13C, while lower Ci/Ca reduces ∆13C –. This implies that changes in AN

Introduction
9
and gs modify Ci/Ca ratio and, therefore, the carbon isotope composition of plant
tissues (δ13C) and WUE.
To determine WUEWP, soil water evaporation, percolation and runoff must
be minimized. Thus, to use gravimetric methods (or individual lysimeters) in
potted plants to measure plant water transpiration is a reasonable approach. In
addition, this method allows determining accurately the biomass production.
However, canopy of potted plants does not match properly with real canopies in
the crop, and the roots development is constrained which could modify plant
development. As an alternative for gravimetric estimates, the use of lysimeters or
sap flow meters (in the case of woody plants) are optional techniques to obtain
good measurements of plant water consumption in the field (Kostner et al., 1998;
Escalona et al., 2002; Netzer et al., 2005). However, these methods present other
limitations. In relation to sap flow meters, the accuracy of the method depends on
stem characteristics and fluxes rates of the plant studied. On the other hand,
lysimeters involve building a complex and expensive equipment in the middle of a
standard crop. Therefore, in spite of the limitations described for the gravimetric
method in potted plants, it seems to be the most adequate method to compare
environmental and genetic effects on WUEWP.
Crop WUE depends on the crop characteristics and environmental
variability. Canopy crop, water losses from the soil profile and the unknown root
system (length and depth) need to be considered to determine WUEc. Eddy
covariance has been proposed as the more suited technique to derive global
carbon and water fluxes at the local scale (Valentini et al., 2000; Trambouze et
al., 1998; Spano et al., 2004). Thus, it is a promising approach to provide gross
estimates of WUEc.
Chapter 1
10
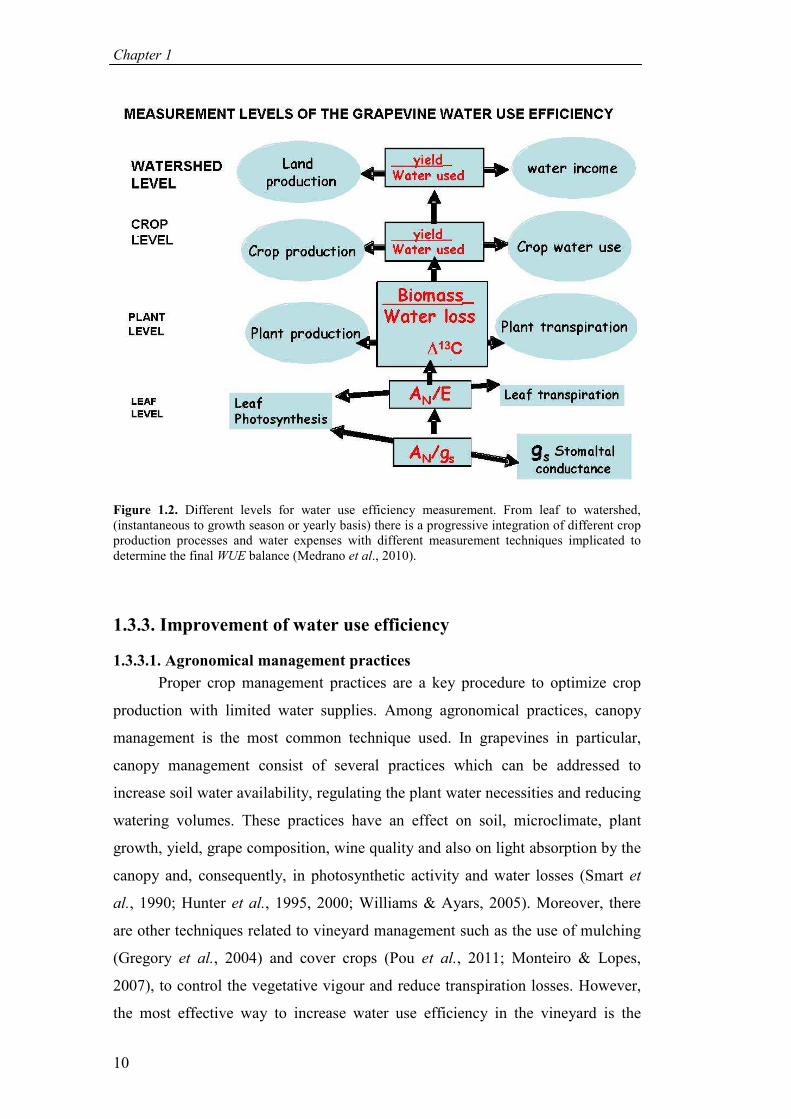
Figure 1.2. Different levels for water use efficiency measurement. From leaf to watershed, (instantaneous to growth season or yearly basis) there is a progressive integration of different crop production processes and water expenses with different measurement techniques implicated to determine the final WUE balance (Medrano et al., 2010).
1.3.3. Improvement of water use efficiency
1.3.3.1. Agronomical management practices
Proper crop management practices are a key procedure to optimize crop
production with limited water supplies. Among agronomical practices, canopy
management is the most common technique used. In grapevines in particular,
canopy management consist of several practices which can be addressed to
increase soil water availability, regulating the plant water necessities and reducing
watering volumes. These practices have an effect on soil, microclimate, plant
growth, yield, grape composition, wine quality and also on light absorption by the
canopy and, consequently, in photosynthetic activity and water losses (Smart et
al., 1990; Hunter et al., 1995, 2000; Williams & Ayars, 2005). Moreover, there
are other techniques related to vineyard management such as the use of mulching
(Gregory et al., 2004) and cover crops (Pou et al., 2011; Monteiro & Lopes,
2007), to control the vegetative vigour and reduce transpiration losses. However,
the most effective way to increase water use efficiency in the vineyard is the

Introduction
11
precise control of irrigation. Several systems to regulate irrigation have been
developed such as regulated deficit irrigation (RDI) and partial root drying (PRD),
which are often supported by plant-based water status indicators to adjust the
irrigation protocol (trunk diameter sensors, sap flow meters, infrared
thermometry, etc.). Under RDI method, water is supplied at levels below full crop
evaporation during the growing season optimizing the number of fruits, fruit size
and quality, and keeping grapevine vigour in balance with potential production
(Souza et al., 2005; Romero et al., 2010). PRD method involves the exposure of
about half of the roots in a drying state while the remaining root system is
irrigated, altering the irrigated roots in cycles of 2-3 weeks. Root zone exposed to
soil drying induces a root-to-shoot signalling mechanism, such as abcisic acid
(ABA) synthesis, that causes partial stomatal closure maintaining a good plant
water status due to the watered root side (Stoll et al., 2000; Santos et al., 2003; De
la Hera et al., 2007).
1.3.3.2. Genetic variability of water use efficiency
Inter-specific natural variations in WUE have been observed in many
species (Anyia et al., 2007; Medrano et al., 2009; Barbour et al., 2010; Shao et
al., 2010; Galmés et al., 2011; Daymond et al., 2011; Lelièvre et al., 2011)
including grapevines (Bota et al., 2001; Gaudillère et al., 2002; Schultz, 2003;
Souza et al., 2005; Pou et al., 2008; Koundouras et al., 2008; Zsofi et al., 2009;
Gómez-Alonso et al., 2010; Prieto et al., 2010; Rogiers, 2011; Costa et al., 2012).
Hence, besides the agronomical practices previously described the genetic
variability in WUE observed in many species has to be taken into account before
considering plant breeding and genetic engineering to improve leaf and whole
plant WUE (Condon et al., 2004). In grapevines in particular, it has been
demonstrated that there are significant differences in WUE among cultivars by
direct measurements of AN/gs, ranging from 25 to 100 mmol CO2 mol-1 H2O in
irrigated plants, and between 100 and 200 mmol CO2 mol-1 H2O under drought
conditions (Flexas et al. 2010). Moreover, interesting variability has also been
described in longer term measurements, δ13C, which values ranged between -31‰
and -27‰ under well-watered conditions and from -26‰ to -24.7‰ under water-
stress. However, less data are available in WUEWP in grapevines described in only
one study comparing 19 cultivars, where the values ranged between 2.5 and 3.2 g
dry matter/ kg H2O transpired (Gibberd et al., 2001). This variability observed at
Chapter 1
12
different levels indicates that genotype selection could be an effective way to gain
significant improvements in WUEl and WUEWP.
1.3.3.3. Potential physiological targets for plant breeding and biotechnology
The physiological level is relevant to understand and improve leaf and
whole plant WUE. Intrinsic water use efficiency (AN/gs) is a good basis to
summarise the potential targets for genetic improvement of WUEl (Parry et al.,
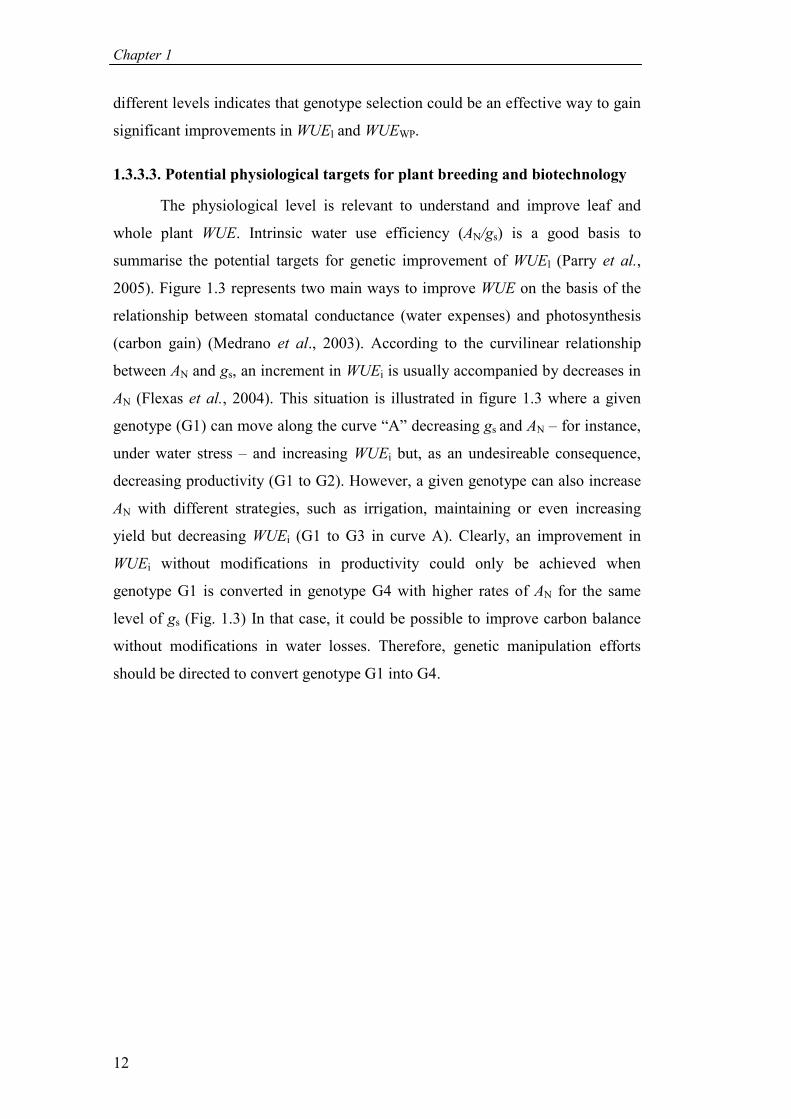
2005). Figure 1.3 represents two main ways to improve WUE on the basis of the
relationship between stomatal conductance (water expenses) and photosynthesis
(carbon gain) (Medrano et al., 2003). According to the curvilinear relationship
between AN and gs, an increment in WUEi is usually accompanied by decreases in
AN (Flexas et al., 2004). This situation is illustrated in figure 1.3 where a given
genotype (G1) can move along the curve “A” decreasing gs and AN – for instance,
under water stress – and increasing WUEi but, as an undesireable consequence,
decreasing productivity (G1 to G2). However, a given genotype can also increase
AN with different strategies, such as irrigation, maintaining or even increasing
yield but decreasing WUEi (G1 to G3 in curve A). Clearly, an improvement in
WUEi without modifications in productivity could only be achieved when
genotype G1 is converted in genotype G4 with higher rates of AN for the same
level of gs (Fig. 1.3) In that case, it could be possible to improve carbon balance
without modifications in water losses. Therefore, genetic manipulation efforts
should be directed to convert genotype G1 into G4.

Introduction
13
Figure 1.3. The relationship between photosynthesis and stomatal conductance in plants. This figure illustrates how WUE could be improved maintaining or even increasing yield at a given value of gs. From Parry et al. (2005).
To increase leaf photosynthetic activity at any given gs seems to be the
best option to improve WUEl. The genotypic modifications in AN-gs relationship
to improve leaf photosynthetic activity and convert the situation G1 to G4 could
be possible to achieve by different physiological mechanisms. These include
improving carboxylation efficiency, and/or improving CO2 diffusion in the
mesophyll increasing the CO2 concentration at the site of carboxylation inducing
C4 photosynthetic metabolism in C3 plants (Long et al., 2006), or increasing the
CO2 diffusion from sub-stomatal cavities to chloroplasts (i.e. mesophyll
conductance – gm) (Flexas et al., 2008).
Improvements in carboxylation efficiency could be achieved by increasing
the Ribulose-1,5- bisphosphate carboxylase/oxygenase (Rubisco) catalytic rate
(Parry et al., 2007) and/or specificity factor for CO2 (Galmés et al., 2005),
reducing or bypassing photorespiration (Long et al., 2006,; Kebeish et al., 2007),
increasing the capacity for RuBP regeneration (Feng et al., 2007; Peterhansel et
al., 2008) or reducing the photoprotective state upon high-to-low light transitions
(Long et al., 2006). Grapevine photosynthesis normally operates in the Rubisco-
limited region, particularly under drought conditions when stomatal and
mesophyll conductance (gs and gm) decrease and the CO2 availability in the
chloroplast is reduced (Cc) (Flexas et al., 2002, 2006a). Therefore, increasing
Rubisco specificity for CO2 (τ) could be more effective to improve WUE under
*
A
B
Stomatal conductance
Ph
oto
syn
thes
is
photosynthesis regardless of water use efficiency
No increase in
Decreasing photosynthesis Increasing water use efficiency
Increasing photosynthesis Decreasing WUE
Increasing photosynthesis Increasing water use efficiency
G2
G1 G3
G4

Chapter 1
14
Mediterranean conditions than increasing Rubisco concentration, catalytic
coefficient or activation state. Rubisco specificity for CO2 (τ) has been determined
in two grapevine cultivars, Tempranillo and Manto Negro, obtaining identical
values for both cultivars (100 mol mol-1; Bota et al., 2002). Although, τ does not
present substantial variability within C3 plants, higher values than those of
grapevines have been found in other species such as the Mediterranean species
Limonium gibertii (110.5 mol mol-1; Galmés et al., 2005), and the red algae
Galdieria partita (240 mol mol-1; Uemura et al., 1997). These differences in τ
have a clear genetic basis that could be used to improve the carboxylation
efficiency, and as a result WUEl.
Higher WUE has been found in C4 plants as compared to C3. The key trait
of C4 photosynthesis is the compartmentalization of activities into two specialized
cell and chloroplast types (Hatch, 1987). The C4 pathway reduces photorespiration
by elevating the CO2 concentration at the site of Rubisco using a biochemical CO2
pump. C4 plants have two chloroplast types, each found in a specialized cell type,
with different morphologies and functions (Kranz anatomy). Atmospheric CO2 is
fixed in the mesophyll cells by phosphoenolpyruvate carboxylase (PEPC) to form
the four-carbon dicarboxylic acid oxaloacetate (hence the name C4). Then, these
C4 acids are diffused into the bundle sheath cells where they are decarboxylated in
the chloroplasts. The CO2 produced is then refixed by Rubisco. In this way, CO2
is concentrated in chloroplasts of bundle sheath where Rubisco is located, thus
reducing oxygenase activity of Rubisco (photorespiration).
Another option to improve leaf photosynthetic activity is increasing the
diffusion of CO2 from sub-stomatal cavities to the carboxylation site through leaf
mesophyll (Flexas et al., 2008; Warren, 2008). The pathway of CO2 from the
atmosphere to the sub-stomatal cavities is regulated by stomatal conductance (gs),
which affects photosynthesis and transpiration. Then, the diffusion of CO2 from
sub-stomatal cavities to the carboxylation site is regulated by the so-called
mesophyll conductance (gm). Under water stressed conditions gs and gm decrease
and, as a result, the CO2 available in the chloroplasts (Cc) decreases as well.
Increasing gs increase water losses and decrease WUEl. However, increasing gm
would increase Cc, and, hence, AN without any effect of plant water status and,
consequently, it would increase WUEl displacing AN-gs relationship vertically
(from G1 to G4, Fig. 1.3.).

Introduction
15
The transfer of C4 metabolism to C3 plants and the improvement of τ could
be achieved by site-directed mutagenesis. In that way, chloroplast transformation
has been possible in tobacco plants replacing the native large Rubisco subunit by
other higher plants versions (Kanevski et al., 1999; Whitney & Andrews, 2001;
Sharwood et al., 2008; Whitney et al., 2011). However, transformed plants
presented low amount of Rubisco because of the lack of proper chaperons and
other molecules needed for correct transcription, translation and assembling of the
enzyme (Sharwood et al., 2008). This might suggest that genetic engineering in
grapevines could be an unachievable goal. Therefore, increasing the diffusion of
CO2 through the mesophyll needs to be explored, as has been suggested for
several authors (Warren & Adams, 2006; Aranda et al., 2007).
At the whole plant level, photosynthesis and respiration are the
physiological processes that directly affect to carbon balance, and transpiration to
water losses, making them good candidates to improve WUEWP. Photosynthesis
could be improved by increasing total leaf area (Sharma-Natu & Ghildiyal, 2005;
Long et al., 2006). Escalona et al. (2003) showed that leaves at the inner canopy
layers in grapevines, which represent 35-40% of total leaf area, contribute less
than 5% to total net carbon gain with a higher percentage of total water losses.
This suggests that increasing photosynthesis by increasing total leaf area would
only increase shaded leaves, thus reducing total WUE. Therefore, respiration and
transpiration remain as important physiological processes to be considered for
improving WUEWP. Substantial water losses that are not included in the opening
of the stomata pores and daytime gs can affect WUEWP. Significant transport of
water occurs through the cuticle and incomplete stomatal closure during night
without any carbon gain (cuticular and night conductance). Therefore, reducing
the night water losses by transpiration could be a way to improve WUEWP. In
addition, respiration occurs continuously in all plant organs through the entire
plant life. It implies that 30% to 90% of carbon fixed in photosynthesis is used for
growth and maintenance respiration (Amthor, 2000). Hence, reducing the
percentage of carbon lost in respiration could increase whole plant carbon gain.
Mitochondrial respiration can proceed via the alternative oxidase pathway (AOP)
and the cytochrome oxidase pathway (COP). A significant part of maintenance
respiration is sustained by AOP (Flórez-Sarasa et al. 2007). Considering AOP as a
futile pathway, a reduction in AOP respiration may resemble an opportunity to

Chapter 1
16
decrease overall respiration without significant consequences, improving carbon
balance and WUE.
Among all these potential targets to improve WUE, the present Thesis
focuses on three of them: (1) mesophyll conductance to CO2, (2) cuticular and
night conductance and (3) whole plant respiration.
1.4. PROMISING PHYSIOLOGICAL PARAMETERS TO
IMPROVE WATER USE EFFICIENCY
As stated above, to improve WUE is an unavoidable goal for grapevine
crop. Besides the agronomic methods, which could result in a more immediate
reduction of water needs, there is a general consensus on the necessity to explore
the capability to select grapevine cultivars with enhanced water use efficiency.
The use of physiological parameters as putative selection criteria is of major
interest for genetic improvement as well as for biotechnology approaches (Flexas
et al., 2010) and, in that way, this work intends to explore the interest of
mesophyll conductance, night transpiration and plant respiration for those
purposes. In the present work, we evaluate the environmental and genetic induced
variations on those parameters in order to offer a first assessment of their interest
as surrogate parameters for WUE improvement.
1.4.1. Mesophyll conductance to CO2
Photosynthesis depends on the diffusion of CO2 from the atmosphere
surrounding the leaf to the sub-stomatal internal cavities through the stomata, and
from there to the carboxylation site located inside the stroma through the leaf
mesophyll. Mesophyll is a complex structure that varies greatly between species
and growth conditions (Evans et al., 2009). The diffusion pathway of CO2 through
the mesophyll tissue can be separated in 3 phases, gas (intercellular air spaces),
liquid (cell walls, cytosol and chloroplast stroma) and lipid phase (plasma
membrane and chloroplast envelope membranes) (Fig. 1.4).

Introduction
17
Figure 1.4. (a) Light micrograph of the abaxial surface of an olive leaf, where the stomata can be seen (bottom side up), as well as the pathway of CO2 from ambient (Ca) through leaf surface (Cs) and intercellular air spaces (Ci) to the chloroplast (Cc). Boundary layer conductance (gb), stomatal conductance (gs) and mesophyll conductance (gm) are indicated. (b) Electron micrograph of a grapevine leaf where cell wall (cw), plasma membrane (pm), chloroplast envelope (ce) and stroma thylakoid (st) can be observed. The pathway of CO2 from Ci to chloroplastic CO2 (Cc) is characterized by intercellular air space conductance to CO2 (gias), through the liquid and lipid phase (gliq and glip) from intercellular airspaces to inside the cell. A grain of starch (s) and a plastoglobule (pg) can be also observed in the picture. From Flexas et al. (2008).
From first Fick law of diffusion, the net photosynthetic flux at steady state
(AN) can be expressed as: AN = gs (Ca - Ci) = gm (Ci - Cc); where gs and gm are the
stomatal and mesophyll conductance to CO2 diffusion, and Ca, Ci and Cc are the
CO2 concentrations in the atmosphere, in the sub-stomatal internal cavity and in
the chloroplast stroma, respectively (Long & Bernacchi, 2003). Then, decreases of
CO2 diffusion through the leaf depend on stomatal closure and mesophyll
conductance.
In Gaastra’s (1959) pioneer work on leaf photosynthesis, mesophyll
conductance was defined as a diffusion component of the photosynthesis pathway,
and it was confirmed by later works showing that gm could be variable and could
respond to environmental factors (Jones & Slatyer, 1972; Samsuddin & Impens,
1979). Thereafter, for decades, gas exchange studies assumed that Ci=Cc and
therefore, gm was constant and infinite. However, evidences that Cc was lower
than Ci were repeatedly demonstrated. There were several confirmations by
comparing online carbon isotope discrimination studies (Evans et al., 1986),
comparing the initial slope of AN- Ci curves with the activity of ribulose 1·5-
bisphosphate carboxylase/oxygenase (Rubisco) determined in vitro (Evans &
Terashima, 1988) and by comparison of chlorophyll fluorescence with gas
exchange measurements (Bongi & Loreto, 1989; Di Marco et al., 1990). In

Chapter 1
18
summary, there is now convincing evidence that gm is finite and not constant, Cc
is significantly less than Ci, and gm is a significant limitation to photosynthesis.
Several methods to estimate gm have been developed, which principles and
procedures are explained in detail by Warren (2006). Briefly, the used methods to
determine gm include (1) online carbon isotope discrimination ( Evans et al., 1986;
Sharkey et al., 1991; von Caemmerer & Evans, 1991; Loreto et al., 1992; Lloyd et
al., 1992), (2) the “constant and variable J” fluorescence method (Di Marco et al.,
1990; Harley et al., 1992; Epron et al., 1995), (4) “curve-fitting” (Ethier &
Livinsgton, 2004; Sharkey et al., 2007) and (5) anatomical analysis (Nobel, 1991;
Evans et al., 1994; Syversten et al., 1995; Tholen et al., 2011; Tosens et al.,
2011).
1.4.1.1. Variability of gm among species and its response to environmental
variables
Mesophyll conductance (gm) is a limitation of AN of similar magnitude
than gs (Evans & Loreto, 2000; Warren & Adams, 2006). Among species there is
a positive relationship between AN and gm, but there is a wide variation in this
relationship. For instance, for a given value of AN (10 µmol CO2 m-2 s-1), great
variations of gm can be found (from 0.06 to 0.31 mol CO2 m-2 s-1). Data on gm are
available in the literature for more than 100 species, varieties and forms. Mean
maximum values of gm (i.e. in the absence of stress conditions) ranged from 0.4
mol CO2 m-2 s-1 to values very close to zero (Flexas et al., 2012; Niinemets et al.,
2009a) (Fig. 1.5). The vast majority of gm estimates are made in Spermatophytes
(angiosperms and gymnosperms) (Niinemets et al., 2009a), with very few data for
liverworts and hornwort (Meyer et al., 2008), while there is no data available for
groups such as mosses, lycophytes, equisetophytes and ferns (Flexas et al., 2012).
In general, herbaceous annual and biannual plants present the largest mean values
of gm (around 0.4 mol CO2 m-2 s-1) being the group that also present fast-growing
strategies accompanied by high AN. Perennial herbs and woody deciduous and
semi-deciduous angiosperms show medium values (around 0.2 mol CO2 m-2 s-1).
Woody evergreen plants (angiosperms and gymnosperms) and succulent CAM
plants present lower values (below 0.1 mol CO2 m-2 s-1). On the other hand,
hornworts and liverworts present estimates of gm five orders of magnitude smaller
than for Spermatophytes (on average, 2.5 · 10-5 mol CO2 m-2 s-1), distinguished for

Introduction
19
lack of stomata and a low degree of cuticularization. Moreover, a large variability
of gm also is present within groups, genus and species (Lauteri et al., 1997;
Centritto et al., 2009; Barbour et al., 2010), suggesting that gm is likely to be
involved in the differences of AN found among species and cultivars.
Figure 1.5. Average ± S.E. values for gs and gm in different pooled groups of plants. Data obtained from Meyer et al. (2008) and Niinemets et al. (2009). (From Flexas et al. 2012)
It is known that gm is not only a constitutive property of leaf anatomy that
differs between species. Mesophyll conductance (gm) can change significantly in
response to environmental variables, external factors (abscisic acid, virus
infection, etc.) and internal factors (leaf ageing and development), in short
(minutes) and long term (days or weeks) (Warren, 2008; Flexas et al., 2008).
Most gm studies are focus on the variability of gm in response to environmental
factors, being mostly studied for water stress, salinity, temperature, CO2
concentration and light availability. Among them, gm can present long-term
responses (acclimation) or in some cases rapid changes (within few minutes after
applying the treatment), such as rapid leaf desiccation (cut petiole in air) or short-
term exposure to different temperatures, CO2 concentrations or light intensities. A
large number of studies show how water stress and salinity reduce gm in a similar
magnitude than gs (Scartazza et al., 1998; Delfine et al., 1999; Loreto et al., 2003;
Flexas et al., 2004; Ripley et al., 2007; Galmés et al., 2011; Duan et al., 2011;
Ferrio et al., 2012) with responses that range from several days to weeks or

Chapter 1
20
sometimes even in minutes in the case of leaf desiccation (Flexas et al., 2006b).
On the other hand, temperature is also a source of variation of gm. In general,
studies show that gm increases from 10 to 20ºC while at temperatures over 20ºC
changes of gm differ among species with responses that can go from minutes
(Warren & Dreyer, 2006; Scafaro et al., 2011) to months (Yamori et al., 2006;
Díaz-Espejo et al., 2007). Regarding to carbon dioxide concentration around
leaves more controversial results have been obtained. Long exposures to elevated
CO2 concentrations (months to years) causes reductions of gm in some species
(Singsaas et al., 2003) while in others it is unaffected (Eichelmann et al., 2004;
Bernacchi et al., 2005). Furthermore, there is still no consensus about rapid
changes in gm under short exposures to different CO2 concentrations. While, at
decreased CO2 concentration around leaves gm increases (Centritto et al., 2003;
Flexas et al., 2007a), at higher concentrations of CO2 gm decreases (Düring, 2003;
Flexas et al., 2007a; Hassiotou et al., 2009; Vrabl et al., 2009; Tazoe et al., 2011;
Douthe et al., 2011) or in other studies gm is maintained stable (Von Caemmerer
& Evans, 1991; Loreto et al., 1992; Tazoe et al., 2009). Concerning light
availability, in general gm responses are in the same direction as AN and gs, at
higher light intensities, higher values of AN, gs and gm are obtained (Piel et al.,
2002; Laisk et al., 2005; Warren et al., 2007; Bunce et al., 2010; Cano et al.,
2011). Few studies have tested rapid responses of gm to irradiance, while in some
studies gm increases with increasing light availability (Gorton et al., 2003; Flexas
et al., 2007a), in others no relation between gm and measuring light intensity was
observed (Tazoe et al., 2009; Yamori et al., 2011).
As for internal factors, gm increases during leaf development up to the
point of full leaf expansion, and then, gm declines as leaf ages and /or senescences
(Miyazawa & Terashima, 2001; Niinemets et al., 2006; Flexas et al., 2007b;
Whitehead D. et al., 2011). The causes of changes of gm with leaf age have been
associated with changes in anatomical traits (Hanba et al., 2001).
The results obtained from all gm studies present a large body of evidence to
conclude that gm is not finite, and it acclimates and responds to different factors
including environmental variables such as, water availability, temperature, light
and CO2, that can be important in regulating AN, especially in Mediterranean areas
where these environmental factors could be intensified according to climate
change predictions. Despite other external and internal factors have been studied

Introduction
21
(i.e. low nitrogen availability, high O3, high altitude, leaf porosity, etc.) the
environmental ones explained in this section are the most widely studied.
1.4.1.2. Mechanisms that determine gm
Large variability of gm has been described among species, genotypes and
for long-term and rapid responses to environmental factors. However, the
mechanisms that regulate these changes remain unclear.
The variability of maximum values of gm observed among species and
genotypes involved in adaptative and acclimation responses have been associated
to leaf structure and anatomical properties (Niinemets et al., 2009a; Terashima et
al., 2011). Leaf dry mass per area (MA), the simplest indicator of leaf structure
composed by leaf thickness and density, has been proposed as a limiting factor of
maximum gm. It has been observed that gm increases with leaf thickness, while it
is reduced with leaf density (Niinemets et al., 2009b; Poorter et al., 2009;
Hassiotou et al., 2010). Hence, it has been shown that MA strongly limits gm in
evergreen species (large MA) with lower photosynthetic rates due to large CO2
drawdown from sub-stomatal cavities (Ci) to chloroplasts (Cc) (Flexas et al.,
2008).
More specific leaf anatomical traits have been proposed as main
determinants of the variability of gm among species (Evans et al., 2009; Terashima
et al., 2011). The CO2 diffusion pathway consists of gas, liquid and lipid phase.
The rate of diffusion through the composite segments of the diffusion pathway
depends on the effective thickness and diffusivity of each anatomical component
(Flexas et al., 2012). Gas phase is assumed to have smaller effect on diffusion
limitations than the components of liquid and lipid phases (Evans et al., 2009).
This was confirmed in several studies comparing CO2 diffusion in air and helox –
air where helium replaces nitrogen to increase diffusivity – showing that liquid
and lipid conductance (gliq and glip) are the most limiting gm components (Genty et
al., 1998; Piel et al., 2002). Among the components of gliq and glip, cell walls and
chloroplast membranes have been proposed as the most important factors
affecting CO2 diffusion inside leaves (Terashima et al., 2011). Several reports
have shown that the surface area of chloroplasts exposed to intercellular air spaces
(Sc/S) correlates positively with gm (Evans et al., 1994; Evans & Loreto, 2000;
Terashima et al., 2006; Tosens et al., 2011). In addition, differences in cell wall
thickness (Tcw) have been shown to explain from 25% to 50% of the variability in

Chapter 1
22
gm (Evans et al., 2009; Terashima et al., 2011). Recent studies have presented
negative correlations between gm and Tcw when comparing Australian Banksia
species (Hassiotou et al., 2010), rice relatives (Scafaro et al., 2011) and
Mediterranean Abies species (Peguero-Pina et al., 2012). Furthermore, Terashima
et al. (2011) demonstrated, combining data from literature, a negative and highly
significant relationship between the ratio gm/(Sc/S) and Tcw. Therefore, the
variability of gm among species and even varieties could be related to differences
in Tcw. In addition, other traits have been proposed to affect gm, including leaf
porosity (Miyazawa & Terashima et al., 2001; Peña-Rojas et al., 2005),
mesophyll surface area exposed to intercellular air spaces (Sm/S)(Evans & Loreto,
2000) and chloroplast arrangements (Tholen et al., 2008) although not proven in
all cases (Kogami et al., 2001; Gorton et al., 2003; Hanba et al., 2004).
While anatomical traits correlate well with gm, the latter can change more
rapidly than leaf anatomy and morphology. The temperature dependency of gm
shows a Q10 of 2.2, suggesting that there must be an enzymatic or protein-
facilitator mechanism for the diffusion control of gm (Bernacchi et al. 2002). The
most likely candidates proposed for the most dynamic gm changes have been
carbonic anhydrase and aquaporins, involved in membrane permeabilities and
consequently in gliq and glip variations.
Carbonic anhydrases catalyse the dilution of CO2 in liquid phase, being it
converted in HCO3-. Three different classes of carbonic anhydrases have been
described in plants (α, β, γ) located in the plasma membrane, cytosol and
chloroplasts, being β class the most abundant form (Fabre et al., 2007). Several
studies performed with modifications of carbonic anhydrase in transgenic plants
shown little evidence of the involvement of the most abundant forms in gm and AN
(Price et al., 1994; Williams et al., 1996). However, Gillon & Yakir (2000)
showed that the contribution of carbonic anhydrase to gm is species dependent and
it may become more important when gm is low as in sclerophyllous species.
Aquaporins are membrane intrinsic proteins that facilitate the movement
of water, CO2 and other small neutral solutes across cellular membranes.
Aquaporins can be divided into five different subfamilies, which to some extent
reflect distinct subcellular localizations: the Plasma Membrane Intrinsic Proteins
(PIPs), Tonoplast Intrinsic Proteins (TIPs), Nodulin-like Intrinsic Proteins (NIPs),
the Small Intrinsic Proteins (SIPs) and X intrinsic proteins (XIPS) (Chamount et

Introduction
23
al., 2001; Johanson et al., 2001; Sakurai et al., 2005; Danielson & Johanson,
2008). The first evidence of the possible role of aquaporins in the diffusion of
CO2 was provided by Terashima and Ono (2002), showing that HgCl2, a non-
specific inhibitor of aquaporins, reduced gm. Later, it was confirmed by Uehlein et
al. (2003), who demonstrated that tobacco aquaporin NtAQP1 facilitates trans-
membrane CO2 transport by expression in Xenopus oocytes. Subsequent studies
with transgenic plants, rice, tobacco and Arabidopsis thaliana have reported the
role of some specific aquaporins (HvPIP2,1; NtAQP1 and AtPIP1,2 respectively)
in the regulation of gm (Hanba et al., 2004; Flexas et al., 2006c; Heckwolf et al.
2011). In addition, Uehlein et al. (2008) showed that NtAQP1 is also located in
the inner chloroplast membranes and it considerably affects leaf CO2 transport.
On the other hand, Miyazawa et al. (2008) studied the role of aquaporins in gm
under drought conditions in tobacco plants, however, the variations in gm were not
clearly explained by the total plasma membrane aquaporin (all PIP). Although the
regulation of aquaporin activity in the short term is not fully understood, several
mechanisms have been proposed, including direct phosphorylation of aquaporins
(Kjellbom et al., 1999), an osmotically driven cohesion/tension mechanism (Ye et
al., 2004), pH-dependent gating of aquaporins (Tournaire-Roux et al., 2003) and
transcriptional regulation and protein stability (Eckert et al., 1999).
1.4.1.3. Mesophyll conductance (gm) in grapevines
Studies about gm in grapevines are relatively scarce. Patakas et al. (2003)
described that gm in grapevines could have a genetic basis. In this study, important
differences in leaf anatomy traits among three different cultivars affecting internal
CO2 gas phase conductance (gias) were described, although gm was not determined.
Regarding to changes of gm in response to environmental conditions, Flexas et al.
(2002) showed that gm is progressively reduced under drought in the long term,
under field conditions; and Düring et al. (2003) showed that gm declined at high
CO2 supply in field-grown Riesling vines. Afterwards, several studies in
grapevines confirmed that gm decreases under increasing drought conditions
(Moutinho-Pereira et al., 2004; Ferrio et al., 2012), being restored after re-
watering (Flexas et al., 2009; Pou et al., 2012). In addition, Pérez-Martin et al.
(2009) studied the interaction of soil water deficit and VPD on gm, where drought
dominated the response of gs and gm.

Chapter 1
24
Altogether, data on gm are available for seven cultivars of Vitis, which
values range from 0.060 to 0.340 mol CO2 m-2 s-1 under irrigation conditions, and
from 0.010 to 0.200 mol CO2 m-2 s-1 under stressful conditions. More studies are
needed to extend our knowledge on genotypic variation of gm and to evaluate
whether this variability translate into variations of WUEl and WUEWP that could
open new opportunities for WUE improvements.
1.4.2. Cuticular and night conductance
1.4.2.1. Variability and factors affecting night conductance (gnight)
Transpiration is an unavoidable process occurring in parallel to
photosynthesis. However, during the night when photosynthesis stops, significant
transpiration can still occur uncoupled from any carbon gain, hence, contributing
negatively to WUEWP.
The amount of water transpired by leaves depends on cuticular and
stomatal conductance. Cuticular conductance (gcut) is not regulated by guard cells,
however, it decreases WUEl because this is almost totally impermeable to CO2,
and as a result no gain in photosynthesis is obtained while water losses are
maintained (Boyer et al., 1997). Generally, gcut is lower than gs, between 0.004
and 0.020 mol m2 s-1 (Rawson & Clarke, 1988; Nobel, 1991; Kerstiens, 1995;
Boyer et al., 1997; Burghardt & Riederer, 2003; Howard & Donovan, 2007).
Thus, most reported values of gnight are largely influenced by gs.
Incomplete stomatal closure during the night is observed in a diverse range
of C3 and C4 species. Stomatal conductance (gs) and transpiration (E) are
maintained during the nigh-time when no photosynthesis occurs and the need to
cool leaves is reduced or absent, constituting a significant source of water losses
and reduced WUEl (Caird et al., 2007). Several studies have demonstrated that
Enight can be an important fraction of daytime transpiration, from 5% to 30%
(Bucci et al., 2005; Daley & Philips, 2006; Cavender-Bares et al., 2007, Scholz et
al., 2007). Night conductance (gnight) has been studied in a large range of genera
and life forms (annuals and perennials; monocots, herbaceous dicots, shrubs, and
trees) native of different habitats (Fig. 1.6): e.g. wetland (Loftfield, 1921), desert
(Donovan et al., 2003; Snyder et al., 2003; Ludwig et al., 2006), neotropical
savanna (Bucci et al., 2004, 2005; Domec et al., 2006; Scholz et al., 2007),

Introduction
25
temperate deciduous and evergreen forests (Benyon, 1999; Oren et al., 2001;
Barbour et al., 2005; Daley & Phillips, 2006; Kavanagh et al., 2007), and
subalpine forest (Herzog et al., 1998). Among gnight values described in many life
forms and habitats, substantial gnight have been observed in many crops, such as
Distichlis spicata (C4; Snyder et al., 2003), wheat (Triticum aestivum; C3; Rawson
& Clarke, 1988), tomato (Lycopersicon esculentum, C3; Caird et al. 2007) and
Vicia faba (C3; Ealson & Richards, 2009). In addition, high variability among
species has been observed (Snyder et al., 2003; Bucci et al., 2004; Daley &
Phillips, 2006; Kavanagh et al., 2007), with values ranged from 0.003 mol H2O m-
2 s-1 in Pinus ponderosa to 0.450 mol H2O m-2 s-1 in Chrysothamnus nauseosus
(Caird et al., 2007). However, the relationship of species differences to source
environment or habitat remain unclear, therefore, more studies are required to
determine whether species differences in gnight are adaptive or a mechanistic
limitation (i.e inability to close at night). Among cultivars and accessions of single
species substantial variations in gnight have also been described (Caird et al.,
2007), indicating that genetic factors could influence gnight in plants.
Figure 1.6. Histogram with reported gnight values in species among different plant functional groups. For each species, gnight was averaged from all reported values (field and greenhouse studies) with units mol m-2 s-1. The black two-headed arrow at the top left of graph represents the range from reported cuticular conductance (gcut) taken from many species, and reported gnight within this range may be largely due to cuticular conductance (gcut) rather than stomatal conductance (gs). (From Caird et al. 2007).

Chapter 1
26
The variability of gnight observed among species and in some cultivars
suggests that gnight is a regulated character with a genetic basis. Although, in
addition, environmental conditions and, external and internal factors have been
proposed as sources of variations in gnight. Stomatal density among abaxial and
adaxial leaf surface and stomatal responses to different environmental conditions
can contribute to variations in gnight. It has been shown in some species such as in
cotton (Gossypium hirsutum, Sharpe, 1973) and fava bean (Vicia faba, Aben et
al., 1989), although further studies are needed to understand how these factors
affect gnight. Moreover, gnight is not stable during the night, increasing towards pre-
dawn. These changes during the night-time are associated to starch metabolism
and circadian rhythm, two internal factors that can affect stomatal opening, as
demonstrated in transformed Arabidopsis thaliana with disrupted circadian
rhythm (Dodd et al., 2004, 2005), and in starch deficient Arabidopsis mutants
(Lasceve et al., 1997).
Night conductance (gnight) responds to similar external factors as daytime
gs, including VPD, ABA, water stress and salinity (Chu et al., 2009; Ealson &
Richards, 2009; Zeppel et al., 2012). Different responses to VPD have been
observed. While increased VPD correlated with greater night transpiration (Enight)
in many tree species measured by sap flux (Herzog et al., 1998; Benyon, 1999;
Oren et al., 2001; Daley & Phillips, 2006; Kavanagh et al., 2007; Zeppel et al.,
2012), increasing VPD has been observed to lower gnight in some species
(Muchow et al., 1980; Oren et al., 2001; Bucci et al., 2004; Barbour & Buckley,
2007), or to leave gnight unaffected (Barbour et al., 2005). On the other hand, water
stress and salinity reduces gnight in field and greenhouse experiments in many
species, including Hibiscus cannabinus (Muchow et al., 1980), Pseudostuga
menziesii (Running, 1976; Blake & Ferrell, 1977), Helianthus anomalus (Ludwig
et al., 2006), shrubs (Donovan et al., 2003), wheat (Rawson & Clarke, 1988),
Helianthus species (Howard & Donovan, 2007) and in two evergreen temperate
woodlands species (Zeppel et al., 2010). Photoperiod length and light intensity
can affect the speed and degree to which stomata close in the dark. Short-day
induces incomplete stomatal closure as opposed to long-day photoperiod in
Chrysanthemum and Vicia faba (Schwabe, 1952; Ealson & Richards, 2009).
Furthermore, day time conditions (light intensity) also affect gnight (Lasceve et al.,
1997). High concentrations of exogenous ABA decrease gnight as well as ABA

Introduction
27
content of leaves in response to water stress (Leymarie et al., 1999; Blake &
Ferrell, 1977). On the other hand, the effects of mineral nutrition on gnight are
unclear (Ludwig et al., 2006; Scholz et al., 2007; Howard & Donovan, 2007).
The results obtained summarized in this section present a large evidence
that gnight is variable and somehow regulated, in many ways similar to daytime
stomatal regulation, however, the mechanisms that regulate gnight are poorly
understood. Moreover, in some species, night transpiration can result a relatively
important part of the total transpiration. Therefore, future research on plant
regulation of gnight is needed to understand such regulations as well as the possible
consequences on the leaf and plant WUE.
1.4.2.2. Cuticular and night conductance in grapevines
In spite of the variability described in gnight and Enight among species, data
in grapevines are scarce. Cuticular conductance (gcut) in grapevines is generally
quite low, around 0.005 mol H2O m-2 s-1 (Boyer et al., 1997; Flexas et al., 2009).
Hence, stomatal conductance maintained during night may represent the most
important source of water losses. Until now only two studies reported values of
gnight and Enight in grapevines. Caird et al. (2007) showed contrasting values for
gnight between 0.03 and 0.06 mol H2O m-2 s-1 in Vitis berlandieri and Vitis
rupestris, and values up to 0.205 mol H2O m-2 s-1 in Vitis riparia. Rogiers et al.
(2009) studied daytime and night-time gs across a wide range of VPD and soil
moistures in ten cultivars of grapevine. The results obtained showed the highest
values for anhysohidric cultivars such as Semillon and Cabernet Sauvignon,
between 0.015 and 0.025 mol H2O m-2 s-1 for gnight, and between 0.20 and 0.30
mmol H2O m-2 s-1 for Enight, respectively. On the other hand, the lowest values
were observed in Grenache, classified as isohydric cultivar, which values were
0.005 mol H2O m-2 s-1 for gnight (close to gcut values) and 0.08 mmol H2O m-2 s-1
for Enight.
The limited information in gnight and Enight in grapevines and the possible
reductions of WUEWP due to water losses during night, indicate that more efforts
are needed to determine the importance of gnight and Enight on the variation of leaf
and plant WUE.

Chapter 1
28
1.4.3. Plant respiration Plant respiration can be defined as the combination of metabolic reactions
where reduced carbon compounds are oxidized to CO2 and H2O, and the energy
released is used for the synthesis of adenosine triphosphate (ATP) and reducing
equivalents. The energy conserved as ATP and reducing equivalents together with
the intermediate carbon compounds produced during respiratory metabolism are
used for growth and maintenance processes of plants. Therefore, respiration is
crucial for growth and productivity and, together with photosynthesis, determines
the carbon balance of the plants (Amthor, 1989).
Part of respiration can proceed via non-phosphorylating alternative
pathway (AOP) that is cyanide-resistant and generates less ATP than cytochrome
pathway (COP).The types and rates of plant respiration depend on a combination
of energy demand, substrate availability and oxygen supply.
1.4.3.1. The importance of leaf respiration and its functions.
Carbon accumulation is the primary process for plant biomass production,
and depends on photosynthesis and respiration. Rates of respiration are lower than
photosynthesis rates; however, photosynthesis occurs only in leaves and during
daytime, whereas respiration is a process that occurs in all organs and during
whole day. This implies that 30% to 90% of the carbohydrates fixed in
photosynthetic processes are respired (Amthor, 2000). The balance between
photosynthesis and plant respiration is defined as the carbon balance (mols of CO2
incorporated per mols of CO2, O2 or CH2O consumed), and hence the capacity of
plants to produce new biomass for growing and developing reproductive
structures, as well as to maintain them (Poorter et al., 1992).
The fraction of carbohydrates produced in photosynthesis and consumed
by respiration is dependent on species (Galmés et al., 2007) and plant organs
(Laureano et al., 2008; Vivin et al., 2003). Root respiration accounts for 10% to
50% of the total carbon assimilated each day in photosynthesis. This percentage
includes the respiration of symbionts that can be up to 25% of total carbohydrates
(Lambers et al., 1998), or mychorrizal fungi (Bryla & Eisenstat, 2005). Root
respiration provides the driving energy for root maintenance and growth, ion
absorption and transport into the xylem. The large variation described in root
respiration is related to variations in nutrient supply and genotype (Lambers et al.,

Introduction
29
2008). Leaf respiration provides the energy for leaf growth and maintenance.
Respiration of other plant parts is largely associated with their growth, although
maintenance components also play a role.
Plant respiration can be divided in two different physiological processes,
growth and maintenance. This can be expressed mathematically as follows:
r = rG + rM = gR * RGR + mR
where r is the overall respiration rate per unit dry mass (mol ‘X’ g-1 s-1), rG and
rM are growth and maintenance respiration (mol ‘X’ g-1 s-1). RGR is the relative
growth rate (ggrowth g-1 s-1), gR represents the specific costs of tissue construction
(mol ‘X’ ggrowth -1) and mR are the specific costs of tissue maintenance (mol ‘X’ g-
1 s-1), with ‘X’ being either ATP, O2, CO2 or CH2O. In the case of roots, gR
includes the costs of nutrient uptake (Amthor et al., 2000; Bouma et al., 2005).
Growth respiration is the respiratory energy required to convert non-
structural carbohydrates into new plant constituents. In photosynthetically active
leaves, metabolic energy (ATP and NAD(P)H) may come directly from
photosynthesis, while, in heterotrophic tissues such as roots, stems, and leaves in
the dark, respiration provides the required energy. Different subprocesses of
growth that consume energy and/or C-skeletons have been identified: nitrate
reduction, active uptake of minerals and organic substrates into growing cells,
monomer synthesis from those substrates, polymerization, maintenance and
phloem loading (Penning de Vries et al. 1974). For most vegetative plant tissues
the construction costs or glucose requirements for growth are similar,
approximately 1.5 g glucose g-1 biomass (Lambers et al. 2008). Tissues of fast-
growing species have high investment in proteins (expensive constituents),
minerals and organic acids (cheap constituents) (Poorter, 1994; Villar et al.,
2006), while evergreen leaves present higher investment in costly structural and
defense compounds such as phenols or lignin (Miller & Stoner et al., 1979).
Despite the variability of composition structures between different species, the
overall construction cost of vegetative plant biomass is quite constant. This
similarity is mainly explained by the positive correlation between the
concentration of expensive and inexpensive fractions in fast and slow growth
plants (Poorter & Bergkotte, 1992; Villar & Merino, 2001). In contrast, seeds
have higher carbon costs than other plant tissues owing as lipids are primarily
stored energy (1.65 g glucose g-1 biomass).

Chapter 1
30
Maintenance respiration accounts for 20-60% of photosynthates produced
per day (3-6% of dry mass per day) in herbaceous (De Visser et al., 1992) and
woody species (Ryan et al., 1994), higher values being associated with slow
growth plants (Lambers et al., 2008). This process is defined as the respiratory
energy associated with protein turnover, maintenance of ion gradients across
membranes and operation of metabolic processes involved in physiological
adjustments to environmental changes. Protein turnover rates may vary among
plant organs, species and growth conditions. For example, in higher plants from
2% to 20% of proteins can be replaced daily (Bouma et al., 1994). Hence, the
maintenance requirement of protein turnover is quite substantial, being its total
cost from 3% to 5% of dry mass per day (Van der Werf et al., 1992). Besides
proteins, membranes and other macromolecules are also turned over, although
their costs are lower or unknown (most macromolecules) (Steer, 1988; Matile et
al., 1999). Active ion transport to counteract membrane leaks, regulate pH or
osmotic potential, are also an important maintenance process. Some estimates
suggest that costs of maintaining ion gradients are up to 30% of the respiratory
costs involved in ion uptake (Bouma & De Visser, 1993). Then, from
experimental values compiled in the literature is inferred that protein turnover and
ion gradients cause the largest costs of maintenance processes.
The costs of growth and maintenance respiration of plant organs are the
major components of individual carbon balance and ecosystem production.
Maintenance respiration is an essential process for plants; nevertheless, its costs
could be reduced in favor of growth respiration obtaining an increase of crop
production and WUEWP. Cyanide-resistant alternative pathway (AOP) has been
described as a constant process independent of the growth rate, and mostly
associated with maintenance respiration (30-40% of total maintenance respiration)
(Flórez-Sarasa et al., 2007). The major characteristic of AOP is that it does not
synthesize ATP, then this pathway consumes part of the carbon gain without
obtaining any benefit for the plant and consequently reducing WUEWP. However,
several studies have suggested that AOP has an important role under stress
situations by preventing over-reduction of the ubiquinone pool and the formation
of reactive oxygen species (ROS) in mitochondria (Purvis & Shewfelt, 1993;
Maxwell et al., 1999; Vanderberghe et al., 1995; Møller et al., 2001). Therefore,
more studies are needed to determine the functions of AOP and whether it could

Introduction
31
be a possible way to reduce the overall respiration and, consequently, improve
WUEWP.
1.4.3.2. Respiration in grapevines
Regarding respiration, most studies in grapevines are focused on leaf
respiration (Escalona et al., 1999b, 2003; Zufferey, 2000; Gómez-del-Campo et
al., 2004) although some studies about root respiration are also available (Comas
et al., 2000; Huang et al., 2005; Franck et al., 2011). Leaves and roots are the
organs that present the highest construction costs in grapevines, and consequently,
the highest respiration rates (Vivin et al., 2003). For leaves, no significant
differences have been observed between cultivars (Zufferey et al., 2000), while no
study about genetic variability in roots is available. Unlike photosynthesis, in
general respiration in grapevines does not present large variations in response to
changes of environmental conditions. Respiration rates are not as much affected
by drought as photosynthesis, so that photosynthesis rates under stress conditions
are low while respiration is maintained, thus, contributing to decrease WUEl
(Escalona et al., 1999b, 2003). However, leaf and root respiration are enhanced in
response to increases of leaf temperature (Zufferey et al., 2000; Weyand et al.,
2006; Franck et al., 2011).
Given that information about respiration in grapevines is limited and to
this process could be a possible target to improve WUEWP, further studies are
needed to characterize respiration and the carbon balance in grapevines.

32

Objectives and Outline
33
Chapter 2
OBJECTIVES AND OUTLINE 2.1. GENERAL OBJETIVES ................................................................................................................34 2.2. SPECIFIC OBJECTIVES ...............................................................................................................34 2.3. OUTLINE OF THE THESIS ..........................................................................................................35 2.4. PUBLICATIONS DERIVED FROM THE PRESENT THESIS....................................................37

Chapter 2
34
2.1. GENERAL OBJETIVES As previously presented in the Introduction, drought is one of the major
limitations to agriculture in general, and to grapevine growth and production in
particular. The major viticulture regions are located in semi-arid areas with a
seasonal drought that coincides with the grapevine growing season. This situation
according to climate change predictions could be accentuated, and it would imply
the need of irrigation. Therefore, to improve WUE in grapevines is necessary to
make viticulture sustainable.
The general objectives of the present work were: (1) to analyze the
mechanisms that could induce the variability of mesophyll conductance (gm) and
whether such variability can be linked to improvements of leaf WUE (AN/gs), (2)
to establish links between leaf and whole plant WUE, (3) to determine what
physiological processes could be a potential target to improve whole plant WUE.
These general aims are divided in several specific objectives
2.2. SPECIFIC OBJECTIVES
1. To study the genetic variability of gm in grapevines under irrigation and water
stress treatment.
2. To analyze the importance of different anatomical traits in the variability of gm
and leaf photosynthetic capacities between species with a wide range of
foliage architectures, and between different cultivars of grapevine.
3. To understand the interrelation between changes of AN/gs (leaf WUE) and gm.
4. To determine the genetic variability of WUEWP in grapevines and whether leaf
WUE estimates can be used as proxies for WUEWP
5. To determine the importance of cuticular and night time transpiration for daily
water losses and WUEWP in grapevines.
Objectives and Outline
35
6. To estimate the contribution of plant respiration (roots, leaves and stems) to
whole plant carbon balance of grapevines.
2.3. OUTLINE OF THE THESIS The Present Thesis is organised in 9 Chapters. Across these chapters, the
physiological processes that could improve water use efficiency at leaf and whole
plant level are presented. A study in different cultivars of grapevine (Vitis vinifera
L.) grown under water stress treatments is detailed, which is preceded by a leaf
anatomy study in different species characterised by contrasted leaf anatomical
properties.
Chapter 1: INTRODUCTION
This Chapter introduces the background and sets the contexts for this
Thesis. It includes a general overview of water use efficiency and the agronomical
practices, genetic variability and physiological mechanisms at leaf and whole
plant level that can be potential targets to improve water use efficiency.
Chapter 2: OBJECTIVES AND OUTLINE
In the present Chapter the general and specific objectives are presented as
well as a brief outline of the Thesis. Finally, a list of publications derived from
this Thesis is detailed.
Chapter 3: MATERIAL AND METHODS
This Chapter contains a detailed description of the plant material and
methodology used, as well as a basic explanation of the parameters calculated.
Chapter 4: IMPROVEMENT OF WATER USE EFFICIENCY IN
GRAPEVINES
This Chapter summarizes the general overview of WUE in grapevines at
different levels (crop, whole plant and leaf) with special focus on physiological
processes that can be considered to improve WUE at leaf and whole plant level.
Chapter 2
36
Chapter 5: VARIABILITY OF MESOPHYLL CONDUCTANCE AND
MECHANISTIC BASIS OF THESE VARIATIONS
This Chapter covers the variability of gm as a potential tool to improve leaf
WUE, and explores how such variability is related to key anatomical traits at the
broad (between species, section 5.1) and narrow scales (between cultivars of
grapevine, section 5.2 of genotypic variability).
Specific objectives 1, 2 and 3 are addressed in this chapter.
Chapter 6: WATER USE EFFICIENCY AT LEAF AND WHOLE PLANT
LEVEL
In this Chapter genetic variability of WUEWP between cultivars of
grapevines is studied, as well as the correlation between leaf and whole plant
WUE.
Specific objective 4
Chapter 7: IMPORTANCE OF PLANT RESPIRATION, CUTICULAR
AND NIGHT TRANSPIRATION IN WHOLE PLANT WATER USE
EFFICIENCY
This Chapter focuses on different physiological processes, cuticular and
night transpiration (section 7.1) and plant respiration (section 7.2), that can affect
whole plant carbon balance and consequently WUEWP.
Specific objectives 5 and 6 are addressed in this chapter
Chapter 8: GENERAL DISCUSSION
This Chapter contains a general discussion and overview of all the results
presented in Chapters 4, 5, 6 and 7.
Chapter 9: CONCLUSIONS
The last Chapter presents a list of the main conclusions derived from the
present Thesis in relation to the general objectives described in Chapter 2.

Objectives and Outline
37
2.4. PUBLICATIONS DERIVED FROM THE PRESENT THESIS
Chapter 4
Flexas J., Galmés J., Gallé A., Gulías J., Pou A., Ribas-Carbó M., Tomás M. &
Medrano H. (2010) Improving water use efficiency in grapevines: potential
physiological targets for biotechnological improvement. Australian of Grape
& Wine Research 16, 106-121_0
Chapter 5
Section 5.1.
Tomás M., Flexas J., Copolovici L., Galmés J., Hallik L., Medrano H., Tosens T.,
Vislap V. & Niinemets Ü. (2012). Importance of leaf anatomy in
determining mesophyll diffusion conductance to CO2 across species:
quantitative limitations and scaling up by models. Plant, Cell &
Environment (submitted).
Section 5.2.
Tomás M., Medrano H., Martorell S., Pou A., Escalona J.M., Ribas-Carbó M. &
Flexas J. (2012) Mesophyll conductance and leaf anatomy traits in different
cultivars of grapevine (in preparation).
Chapter 6
Tomás M., Medrano H., Pou A., Escalona J.M., Martorell S., Ribas-Carbó M. and
Flexas J. (2012) Water use efficiency in grapevine cultivars grown under
controlled conditions: effects of water stress at the leaf and whole plant
level. Australian Journal of Grape & Wine Research 18, 164-172
Chapter 7
Section 7.1.
Escalona JM., Fuentes S., Tomás M., Martorell S., Flexas J. & Medrano H.
(2012) Responses of leaf night transpiration to water stress in Vitis vinifera
L. Annals of Botany (submitted).

Chapter 2
38
Section 7.2.
Escalona J.M.*, Tomás M.*, Martorell S., Medrano H., Ribas-Carbó M. & Flexas
J. (2012). Carbon balance in grapevines under different soil water supply:
importance of whole plant respiration. Australian Journal of Grape & Wine
Research (in press)
*These authors contributed equally to the present study.

Material and Methods
39
Chapter 3
MATERIAL AND METHODS 3.1. PLANT MATERIAL ..........................................................................................................................40 3.2. GROWTH CONDITIONS ...................................................................................................................42 3.3. WATER STRESS TREATMENTS ......................................................................................................43 3.4. MEASUREMENTS ............................................................................................................................43
3.4.1. Plant and soil water status............................................................................................................................ 43 3.4.1.1. Leaf water potential ...................................................................................................................... 43 3.4.1.3. Soil water content ......................................................................................................................... 44
3.4.2. Chlorophyll fluorescence measurements .................................................................................................... 44 3.4.2.1. The Fluorescence parameters....................................................................................................... 45
3.4.3. Gas exchange measurements ....................................................................................................................... 47 3.4.3.1. IRGA overview............................................................................................................................. 47 3.4.3.2. Leaf gas exchange measurements................................................................................................ 50 3.4.3.2.1. Instantaneous gas exchange measurements......................................................... 50 3.4.3.2.2. AN-Ci curves .......................................................................................................... 50 3.4.3.2.3. Respiration in the light and apparent CO2 photocompensation point ............... 51 3.4.3.2.4. Cuticular conductance .......................................................................................... 52 3.4.3.2.5. Leaks...................................................................................................................... 52 3.4.3.3. Respiration measurements............................................................................................................ 53 3.4.3.3.1. Leaf respiration ..................................................................................................... 53 3.4.3.3.2. Root respiration..................................................................................................... 54 3.4.3.3.3. Stem respiration .................................................................................................... 55
3.4.4. On-line measurements of stable carbon isotope discrimination................................................................ 57 3.4.5. Water use efficiency..................................................................................................................................... 58
3.4.5.1. Intrinsic (AN/gs) and instantaneous (AN/E) water use efficiency............................................... 58 3.4.5.2. Carbon isotope composition in leaf dry matter........................................................................... 58 3.4.5.3. Whole plant water use efficiency................................................................................................. 59
3.4.6. Leaf anatomy ................................................................................................................................................ 59 3.4.6.1. Light microscopy .......................................................................................................................... 60 3.4.6.2. Electron microscopy ..................................................................................................................... 60
3.4.7. Leaf morphological parameters ................................................................................................................... 61 3.4.7.1. Leaf mass per area and leaf density............................................................................................. 61
3.4.8. Other measurements ..................................................................................................................................... 62 3.4.8.1. Leaf area ........................................................................................................................................ 62 3.4.8.2. Rubisco Content............................................................................................................................ 62 3.4.8.3. Specific activity of Rubisco in vivo (kcat) ................................................................................... 63 3.4.8.4. Extraction of leaf soluble sugars.................................................................................................. 63 3.4.8.5. Leaf absorptance ........................................................................................................................... 64
3.5. CALCULATIONS ..............................................................................................................................64 3.5.1. Estimation of mesophyll conductance (gm) to CO2 .................................................................................... 64
3.5.1.1. Estimation of gm with gas exchange and chlorophyll fluorescence........................................... 64 3.5.1.1.1. Parameters derived from AN-Cc curves ........................................................................ 66
3.5.1.2. Estimation of gm with gas exchange only: the curve-fitting method......................................... 67 3.5.1.3. Estimation of gm with gas exchange and 13C isotope discrimination ........................................ 68 3.5.1.4. Estimation of gm from anatomical parameters ............................................................................ 70
3.5.2. Quantitative limitation analysis ................................................................................................................... 72 3.5.2.1. Quantitative analysis of photosynthesis limitations ................................................................... 72 3.5.2.2. Quantitative analysis of limitations on mesophyll conductance................................................ 72
3.5.3. Plant carbon balance..................................................................................................................................... 73

Chapter 3
40
3.1. PLANT MATERIAL Experimentation of this Thesis is mainly focused on a single species (Vitis
vinifera L.), except for the experiment of section 5.1 that consisted of a survey of 15
species with a wide range of leaf forms and ecological niches (Table 3.1).
Experiments described in chapters 5 to 7 were performed in eight different
cultivars of Vitis vinifera L. Cabernet Sauvignon, Grenache, Pinot Noir, Tempranillo
(cultivars of widespread use), Callet, Malvasia of Banyalbufar, Manto Negro,
Escursac (Balearic cultivars) and one hybrid rootstock of Vitis, Richter-110 (Vitis
berlandieri x Vitis rupestris). (Fig. 3.1).
Figure 3.1. Grapevine cultivars used in this Thesis
Callet Cabernet Sauvignon Escursac
Grenache Malvasia of Banyalbufar Manto Negro
Pinot Noir Richter- 110 Tempranillo

Material and Methods
41
Table 3.1. Species selected in the experiment of section 5.1.
Species Family Life form Species origin (climate)
Capsicum annuum cv. Super Chilli F1 Solanaceae Herb Central America (tropics)
Helianthus annuus cv. Simple Giant Asteraceae Herb Central America (subtropics to tropics)
Ocimum basilicum Lamiaceae Herb South Asia (tropics to subtropics)
Phaseolus vulgaris cv. Neckargold Fabaceae Herb Central to South America (subtropics to tropics)
Spinacea oleracea cv. Matador Amaranthaceae Herb Central and Southwestern Asia (temperate to subtropics)
Acer negundo Sapindaceae Woody deciduous North America (temperate)
Alnus subcordata Betulaceae Woody deciduous West Asia and the Caucasus (warm temperate)
Betula pubescens Betulaceae Woody deciduous Europe and Asia (temperate)
Catalpa speciosa Bignoniaceae Woody deciduous North America (warm temperate)
Quercus brantii Fagaceae Woody semi-
deciduous West and South Asia (warm temperate)
Citrus reticulata Rutaceae Woody evergreen South-East Asia (subtropics to tropics)
Ficus elastica Moraceae Woody evergreen South Asia and South-East Asia (subtropics to tropics)
Pittosporum tobira Pittosporaceae Woody evergreen East Asia (warm temperate)
Quercus ilex Fagaceae Woody evergreen Europe (Mediterranean)
Washingtonia filifera Arecaceae Woody evergreen North America (warm temperate)

Chapter 3
42
3.2. GROWTH CONDITIONS In the experiment from section 5.1, species were grown from seeds, either
commercial or collected in the field (for more details see material and methods in
section 5.1), except for Ficus elastica that was obtained from rooted cuttings.
Plants were grown in pots of different sizes (1-5 L) depending on plant age and
size, in a growth chamber at the Department of Plant Physiology (Estonian
University of Life Sciences). Photoperiod was set to 10/14h with a constant
photon flux density of 350 µmol m−2 s−1 at plant level provided by Philips HPI-T
Plus 400 W metal halide lamps, corresponding to 30% of average daily light in
completely open location during the growing season. Temperatures during the
light and dark period were 24ºC and 18ºC, respectively. Air relative humidity was
maintained above 60%. Growth substrate was a 1:1 mix of quartz sand and
standard potting soil (Biolan Oy, Finland) including slow release NPK (3-1-2
ratio) fertilizer with microelements. Plants were irrigated daily to field capacity.
Herbs were used 1 month after seed germination, while woody species were
selected on the second growing year.
Plants of Vitis vinifera L. were obtained by direct rooting from 0.3 m
shoots collected from an experimental farm near Palma (Conselleria
d’Agricultura, Mediambient i Territori), except for the experiment of section 7.1.
Cuttings were hydrated for 24 hours and soaked in 0.3% Captan solution for 3
hours. Rooting was induced in cuttings with indolbutyric acid (IBA, 2g L-1) in a
growth chamber under controlled conditions. Soil temperature was 26-28ºC, air
temperature was 23ºC and air humidity about 80%. When cuttings presented 4-5
expanded leaves, they were transplanted into pots and grown outdoors in 15 L
pots filled with organic substrate and perlite mixture (3:1). They were irrigated
daily from May until the start of the experiment supplemented with organic-
mineral fertilizer NPK containing (%): N, 5; P2O5, 8; K2O, 15; MgO, 2; organic
C, 17.4, humic acid, 5; SO3, 15; Fe, 1; Zn 2x10⁻³; Mn 1x10⁻². A thick layer of
perlite was added to the surface of each pot to decrease soil evaporation. All
plants were maintained with one or two shoots and without fruits to compare only
the genetic variability of the physiological parameters. In the experiment of the
section 7.1 ten-years-old grapevine plants (cv.Tempranillo) grafted in 110-Richter

Material and Methods
43
rootstock were used. They were grown in 70 L containers filled with a mix of
sand, horticultural substrate and perlite (1:1:1).
Experiments with Vitis vinifera L. were conducted outdoors. Climate
conditions during the experiments were typical for Mediterranean regions with
mean maximum and minimum temperatures of 32ºC and 17ºC respectively,
integrated evapotranspiration (ET0) between 5.3 and 5.6 L m-2 day-1, and daily
mean vapour pressure deficit (VPD) above 1 KPa.
3.3. WATER STRESS TREATMENTS Plants of Vitis vinifera L. and the rootstock of Vitis, Richter-110, described
in the experiments of chapters 5 to 7 were subjected to water withholding until
leaf maximum daily gs dropped to 0.085-0.1 mol H2O m-2 s-1, considered as
moderate drought (Flexas et al. 2002). Once these values were achieved (typically
5-7 days after withholding water) pots were weighted daily in the evening and the
amount of water consumed was replenished to maintain the same level of drought
for three weeks. Control plants were maintained at field capacity throughout the
experiments.
In the experiment of the section 7.1, two levels of water stress were
imposed. Plants were subjected to water withholding during 4 and 7 days to
achieve moderate and severe water stress, respectively.
3.4. MEASUREMENTS
3.4.1. Plant and soil water status
3.4.1.1. Leaf water potential
Predawn (ΨPD) and midday leaf water potential (ΨMD) were measured in
fully expanded leaves with a Scholander pressure chamber (Soilmoisture
Equipment Corp., Santa Barbara, CA). In this technique, a leaf is excised from the
plant breaking the water column of the xylem under tension. The excision causes
a negative pressure in cells that pulls water towards the cells from the xylem. A
leaf is sealed in the chamber and an external pressure is added into the chamber
until water between surrounding living cells and the xylem returns to its initial
distribution. When the external pressure is raised to balance the tension, the xylem

Chapter 3
44
solution appears at the cut surface and remains steady without flow in or out of
the leaf.
3.4.1.3. Soil water content
Soil water content (SWC) was calculated as:
100 · )pot weight Minimum - pot weight (Maximum
)pot weight Minimum -t (Pot weigh (%) =SWC [1]
Minimum pot weight was considered at the wilting point. To determine
wilting point two pots were left without irrigation until constant weight value was
achieved. Maximum pot weight was obtained weighting the pots at field capacity.
3.4.2. Chlorophyll fluorescence measurements Chlorophyll fluorescence measurements were made with fluorescence
chamber head (Li-6400–40 leaf chamber fluorometer; Li-Cor, Inc. or PAM-
Fluorometer 3055-FL) integrated in an open gas exchange system (Li-6400; Li-Cor,
Inc., Nebraska, USA or GFS-3000, Walz, Effeltrich, Germany). The fluorescence
chambers are composed of three different light sources: modulated red and blue
actinic and saturating flash lights, and infrared light to excite PSI. The light-
emitting diode (LED) generates a pulsed light to induce a pulsed fluorescence in
the leaf that is electronically identified and amplified.
Quantum of light is absorbed by a molecule of chlorophyll. The excitation
energy of the quantum is transferred via excitons to reaction centers of
photosystems II (PSII) and I (PSI), raising them to an excited state. Electrons
return rapidly to their ground level, releasing the absorbed energy in one of these
three ways (Fig. 3.2): (a) converted into chemical energy to drive photosynthesis
(photochemistry), (b) emitted as heat (known as non-photochemical quenching) or
re-emitted as light (chlorophyll fluorescence). These three processes occur in
competition, such that any increased efficiency of one results in a decrease in the
yield of the other two.

Material and Methods
45
Figure 3.2. Outline representation of the three possible processes to dissipate the absorbed energy (from Li-6400XT v6.1 manual)
3.4.2.1. The Fluorescence parameters
Chlorophyll fluorescence parameters have been established as non-
invasive indicators of the functionality of the photosynthetic apparatus. Most of
these parameters are determined by the light-induced chlorophyll fluorescence
induction kinetics of dark-adapted state, known as Kautsky effect (Kautsky et al.
1960).
1) Dark adapted state
F0: It is the minimal yield of fluorescence determined in darkness by a
weak measuring beam (< 0.1 µmol photons m-2 s-1) where all reaction centres are
opened. In this level all molecules of quinone A (QA, first electron acceptor of the
photosynthetic pathway) are oxidized (Fig. 3.3).
Fm: It is the maximum fluorescence yield obtained after applying a
saturating flash from the ground state (F0) (Fig. 3.3). All reaction centres will
close and all molecules of QA will be reduced.
Fv/Fm: It is the intrinsic efficiency of the PSII (quantum efficiency if all
PSII centres were opened). This parameter is given by the equation:
-
/ m
0mmv
F
FFFF = [2]

Chapter 3
46
This parameter is used as an indicator of plant photosynthetic
performance, with optimal values around 0.83 (Björkman & Demmig 1987,
Johnson et al. 1993). Lower values indicate photoinhibition, so that plants have
been exposed to stressful conditions.
Figure 3.3. Sequence of a typical fluorescence trace. (From Gallé & Flexas 2010)
2) Illuminated state
Ft: It is the steady-state yield of fluorescence in the light adapted state
(Fig. 3.3).
Fm’: It is the maximum fluorescence in the light (Fig. 3.3). A decrease of
Fm’ as compared to Fm indicates the presence of non-photochemical quenching
(NPQ, energy is converted to heat).
∆F/Fm’ (ФPSII): It is the efficiency of the PSII photochemistry, calculated
after Genty et al. (1989) as:
'
- ' φ
m
tmPSII
F
FF= [3]
It measures the proportion of the light absorbed by chlorophyll associated
with PSII that is used in photochemistry.

Material and Methods
47
ETR (Jflu): As ΦPSII represents the number of electrons transferred per
photon absorbed by PSII, the electron transport rate (Jflu) can be calculated as:
· · PPFD · φ )s m µmol( PSII-1-2
flu βα=J [4]
where PPFD is the photosynthetically active quantum flux density, α is the
leaf absorbance and β reflects the partitioning of absorbed quanta between
photosystems II and I. In the experiment belonging to section 5.1 leaf absorptance
was calculated with spectrometer (AvaSpec-2048-2, Avantes, Apeldoorn, The
Netherlands) coupled to an integrating sphere (ISP-80-8-R, Ocean Optics,
Dunedin, FL, USA). β was assumed 0.5 (Laisk & Loreto 1996). In all other
experiments, the product α · β was determined as the slope of the relationship
between ФPSII and ФCO2 obtained by varying light intensity under non-
photorespiratory conditions in an atmosphere containing less than 1% of CO2
(Valentini et al . 1995).
NPQ: It is an indicative of the level of non-radiative energy dissipation in
the light-harvesting antenna of PSII. It is calculated as:
1'
NPQ m
m −
=
F
F [5]
The importance of this parameter results from the fact that it measures
changes in heat dissipation relative to the dark adapted state. This is thought to be
essential protecting the leaf from over-energizing of the thylakoid membranes
(photodamage).
3.4.3. Gas exchange measurements
3.4.3.1. IRGA overview
Leaf gas exchange measurements were performed with an open circuit
infrared gas analyzer (IRGA), Li-6400 or GFS-3000, depending on the
experiment (see specific Material and Methods section in each chapter) (Fig. 3.4).
The principles and parameters measured explained in this section are similar for
both instruments used.
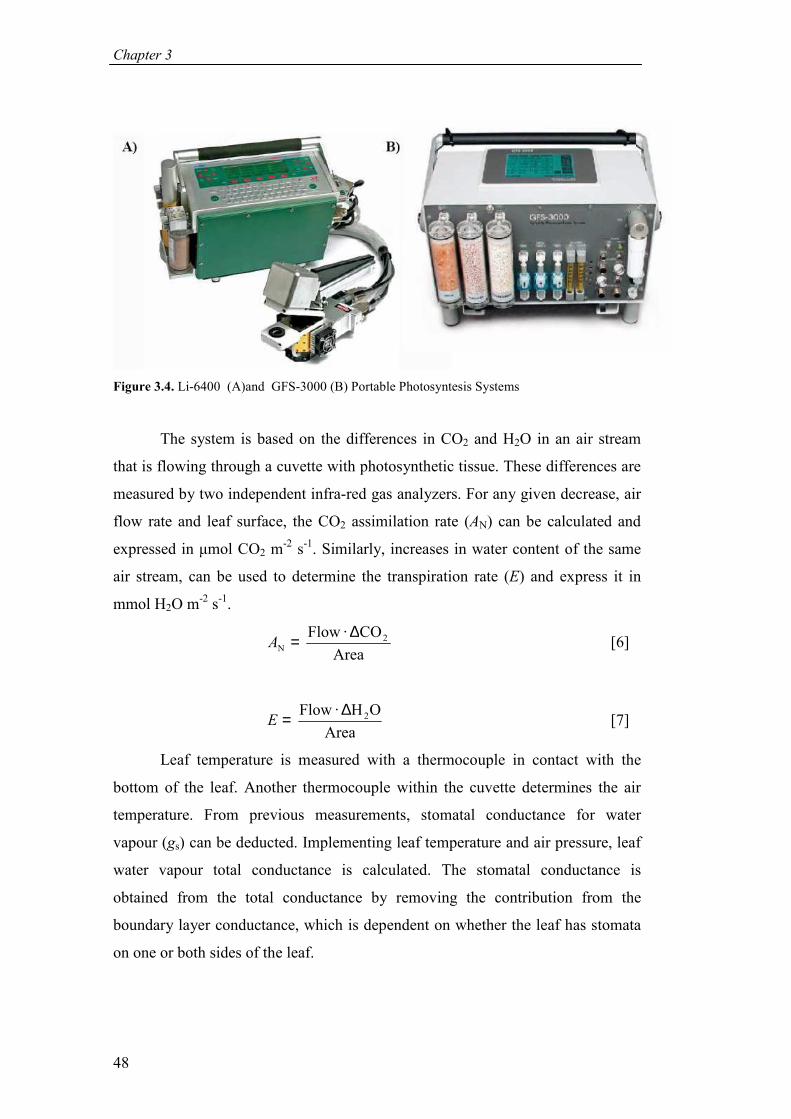
Chapter 3
48
Figure 3.4. Li-6400 (A)and GFS-3000 (B) Portable Photosyntesis Systems
The system is based on the differences in CO2 and H2O in an air stream
that is flowing through a cuvette with photosynthetic tissue. These differences are
measured by two independent infra-red gas analyzers. For any given decrease, air
flow rate and leaf surface, the CO2 assimilation rate (AN) can be calculated and
expressed in µmol CO2 m-2 s-1. Similarly, increases in water content of the same
air stream, can be used to determine the transpiration rate (E) and express it in
mmol H2O m-2 s-1.
Area
CO · Flow 2
N
∆=A [6]
Area
OH · Flow 2∆=E [7]
Leaf temperature is measured with a thermocouple in contact with the
bottom of the leaf. Another thermocouple within the cuvette determines the air
temperature. From previous measurements, stomatal conductance for water
vapour (gs) can be deducted. Implementing leaf temperature and air pressure, leaf
water vapour total conductance is calculated. The stomatal conductance is
obtained from the total conductance by removing the contribution from the
boundary layer conductance, which is dependent on whether the leaf has stomata
on one or both sides of the leaf.

Material and Methods
49
The internal or sub-stomatal conductance CO2 concentration (Ci) can be
derived from simultaneous measurements of AN and gs, according to Fick’s first
law of diffusion.
−=
s
Nai
g
ACC [8]
where Ca is the CO2 concentration around the leaf.
This system can control the environmental conditions in the leaf chamber,
such as the CO2 concentration, humidity and light intensity and quality. Both
instruments (Li-6400 and GFS -300) are provided with several types of leaf
chamber, one of them have incorporated the LED Light Source, which permits to
regulate the incident radiant flux density on the leaf, ranged from 0 to 2000 or
2500 µmol photon m-2 s-1 (GFS-3000 and Li-6400, respectively). Humidity is
controlled by two mechanisms, manually by adjusting the incoming air in the leaf
chamber which is routed through the drier or humidifier, and controlling the flow
rate of air through the chamber. CO2 Mixer allows control of the CO2
concentration, which is the basis of the photosynthetic CO2 response curves
(Flexas et al. 2007c) (Fig. 3.5).
Figure 3.5. Li-6400 flow schematic (from manual Li-6400XT v6.1)

Chapter 3
50
3.4.3.2. Leaf gas exchange measurements
3.4.3.2.1. Instantaneous gas exchange measurements
Instantaneous gas exchange measurements were made on fully expanded
apical leaves. Measurements of AN, gs, E and Ci were performed at saturating red
light (1500 µmol m-2 s-1) achieved with the red LED lamp of the system, with an
additional 10% blue light to maximize stomatal opening. CO2 concentration in the
leaf chamber (Ca) was set at 400 µmol CO2 mol -1air in the cuvette, and the
relative humidity of the incoming air ranged between 40 and 60%. Block
temperature was maintained at 30ºC, except the experiment of section 5.1 that was
maintained at 25ºC, while water vapour pressure deficit (VPD) was not controlled.
3.4.3.2.2. AN-Ci curves
Rapid variations of CO2 concentrations around the leaf (AN-Ci curves) are
used to determine photosynthesis limitations (Long & Bernachi, 2003; Sharkey et
al., 2007). These curves can be divided in three sections. At low Ci
concentrations, AN response is linear and it refers to (maximal) Rubisco activity.
The second section of the AN-Ci curves responds to the (maximal) electron
transport rate (RuBP-regeneration) while the last section AN response is constant
or decrease with an additional increase in Ci, being limited by the utilization of
triose-phosphate (TPU).
CO2 response curves were started at a CO2 concentration (Ca) of 400 µmol
CO2 mol -1air. After recording the steady-state AN value under saturating light, Ca
was lowered stepwise to 50 µmol mol -1, providing at least 2 minutes at each step
for stabilization. Then, Ca was raised again to 400 µmol mol -1 until reaching
steady-state value similar to that obtained at the beginning of the curve. In some
cases, Ca was increased stepwise from 400 to 1500 µmol mol -1 (Fig. 3.6).

Material and Methods
51
Figure 3.6. Idealized AN/Ci response. The rates of photosynthesis that would be achieved depending on whether Rubisco, RuBP or TPU are limiting are indicated. The actual photosynthetic rate (solid line) at any given Ci is the minimum of these three potential limitations. Parameters used: Vc,max=70 µmol m-2 s-1, Jmax=130 µmol m-2 s-1, VTPU=9.1 µmol m-2 s-1, , Rd=2 µmol m-2 s-1, (From Long & Bernacchi, 2003)
3.4.3.2.3. Respiration in the light and apparent CO2 photocompensation point
Light respiration (RL) and apparent CO2 photocompensation point (Ci*)
were calculated according to Laisk method (1977) as described in von Caemmerer
(2000) using a Li-6400 with the chamber of 6 cm2. The Laisk method analyzes the
rate of net CO2 exchange at low internal CO2 concentrations (Ci) at varying
irradiances. This rate is mathematically expressed as:
LocN 5.0 RvvA −−= [9]
where vc and vo are the rate of carboxylation and oxygenation,
respectively. Ci* is the CO2 concentration at which the photorespiratory efflux of
CO2 equals the rate of photosynthetic CO2 uptake (i.e. when vc = 0.5 vo).
Laisk curves were obtained from AN-Ci curves ranged from 400 to 50
µmol CO2 mol-1 air, under three different light intensities (i.e. 50, 150 and 300
µmol m-2 s-1). The intersection point of the three AN-Ci curves were used to
determine Ci* (x-axis) and RL (y-axis). Ci* was used as a proxy for the
chloroplastic CO2 photocompensation point (Γ*) according to Warren and Dreyer
(2006). The values of Ci* only were calculated for irrigated plants, because has
been demonstrated that the specificity of Rubisco does not change under water
stress treatment (Galmés et al., 2006).

Chapter 3
52
In the experiment of section 5.1 instead of measuring Ci* was used the
Rubisco specificity factor (τ) obtained from the bibliography (for more details see
the specific material and methods). Rubisco specificity factor is derived from
Rubisco kinetics as:
co
oc
KV
KV
·
·
max,
max,=τ [10]
where Vc,max and Vo,max are the maximal rates for carboxylation and
oxygenation activities of Rubisco, and Ko and Kc are the Michaelis constants for
these reactions (Laing et al., 1974).
3.4.3.2.4. Cuticular conductance
Cuticular properties affect gas exchange in leaves. Water conductance
(gcut) of leaf cuticle is higher than CO2, causing less photosynthesis per unit of
water used (Boyer et al., 1997). The effect of this discrimination is especially
important when stomata are completely closed, that is, when gcut is the main
determinant of leaf CO2 uptake and transpiration. Measurements of gs with an
IRGA system are the sum of stomatal and cuticular conductance. To determine
the importance of gcut in whole plant carbon and water balance, two different
methods were used in the experiment of section 7.1 to measure gcut. In the first
method, gcut was measured with the IRGA in leaves with the abaxial surface
covered with silicone grease and a polyethylene filter to prevent stomatal gas
exchange (Boyer et al., 1997). In the second method, gs was continuously
measured on a detached leaf until the decline of gs flattens out and its values
become stable. This end point represents the remaining conductance (gs) after
stomata were completely closed (Burghardt & Riederer, 2003).
3.4.3.2.5. Leaks
In gas exchange systems, chambers usually enclose a small leaf surface (2-
8 cm2) surrounded by gaskets. The illuminated photosynthesizing leaf area is
always surrounded by an area darkened by gaskets, which respires and thus
affects the measurement of the photosynthetic flux, especially at the two ends of
AN-Ci curves when large CO2 gradients between the chamber and the surrounding
air are present (Fig. 3.7).
In an attempt to correct for gradient between inside and outside CO2
concentrations and the inward diffusion of respiratory CO2 from darkened leaf

Material and Methods
53
material under the gasket, leakage corrections were performed in all the
experiments of this Thesis. To avoid large changes in leaf structure, leaves were
thermally killed by immersion in boiling water until no variable chlorophyll
fluorescence was detectable which was taken as evidence for total photosynthesis
impairment and leaf death (Schreiber et al., 1998). AN and Ci values of living
leaves were corrected by simple subtraction of the relationship between Ca and the
‘apparent’ photosynthesis of a chamber filled with a dead leaf (Flexas et al.,
2007c).
Figure 3.7. Diagram illustration of how CO2 diffuses from the surrounding atmosphere into the
leaf chamber, and how CO2 released from respiration by leaf under the gasket can diffuse inward
to the cuvette (Hurry V. et al., 2005).
3.4.3.3. Respiration measurements
Respiration measurements were performed in three different ways
depending on the tissue analyzed:
- Leaves: Li-6400 or GFS 3000 using the leaf chamber
- Roots: Li-6400 using the soil chamber
- Stems: oxygen electrode
3.4.3.3.1. Leaf respiration
Leaf dark respiration (Rd) was measured using Li-6400 or GFS-3000
depending on the experiment (for more details see material and methods of each
section) with a chamber of 6 or 8 cm2 (for Li-6400 and GFS-3000, respectively).
Measurements were performed at 25 or 30ºC, Ca of 400 µmol CO2 mol -1air and

Chapter 3
54
200-150 µmol s-1 flow rate after maintaining plants for at least 2 hours in
darkness.
In the experiment of section 7.2, leaf respiration was measured in a
controlled room temperature at 20, 25, 30 and 35ºC, after 8-10 h of dark period.
Furthermore, in order to complete the plant carbon balances and to measure night
transpiration (experiments 7.1 and 7.2), nocturnal night courses were made
measuring at 2 hour intervals from 20:00 to 5:00h (solar time). The conditions of
measurement were similar to those previously described.
3.4.3.3.2. Root respiration
Root respiration (Rroot) was measured using the soil chamber (6400-09)
attached to the Li-6400 sensor head.
The predominant processes that produce carbon dioxide in soil are
respiration of roots, soil organisms and the decomposition of organic matter. The
production of CO2 in the soil is strongly correlated with soil temperature and
moisture. (Norman et al., 1992). Therefore, soil temperature and moisture data
can be useful when interpreting soil CO2 flux measurements. Although the
primary mechanism for transport of CO2 from the soil to the atmosphere is
diffusion, transport may also be influenced by fluctuations in pressure, wind,
temperature, and displacement by precipitation.
The system is based on the increase of CO2 concentration inside the
chamber, which has been deployed on the soil surface for a short period of time
(measured soil area is 71.6 cm2). The air is circulated from the soil to the top of
the chamber by the mixing fan placed in the sensor head. Then, the air in the
chamber is withdrawn through the analyzer inlet duct and enters the optical path
of the gas analyzer. Air is returned from the gas analyzer outlet ducts to the
manifold near the soil surface (Fig. 3.8). Air temperature is measured with the
thermocouple within the soil chamber while soil temperature is determined with a
probe connected to the Li-6400 console. Soil CO2 flux measurements were made
using a soil collar inserted 3 to 4 cm into the soil as an interface between the
chamber and the soil to minimize environmental fluctuations.

Material and Methods
55
Figure 3.8. Schematic diagram of the soil chamber used in the Li-6400 (Welles et al., 2001)
Measurements were made at different substrate temperatures of 20, 25, 30
and 35ºC. All measurements were performed outdoors, considering natural
variations of soil temperature along the day, except at 20ºC in which case pots
were left overnight in a room under controlled temperature. Irrigated and non-
irrigated pots containing the same substrate than the other experimental pots but
without plant were measured at each temperature to measure respiration by soil
microorganisms. Finally, Rroot was estimated as the difference between CO2 efflux
in pots containing and not-containing plants under both water conditions (Koerber
et al., 2010).
3.4.3.3.3. Stem respiration
Stem respiration (Rstem) was measured using a liquid-phase Clark-type
oxygen electrode (Dual Digital Mod 20; Rank Brothers Ltd, England) at 25, 30
and 35ºC controlled with a water bath connected to the incubation chamber of the
cuvette. Apical and intermediate stem sections were collected during the light
period and incubated in a solution containing 30mM MES buffer and 0.2 mM
CaCl2 at pH 6.2, for 30 minutes in the dark. Stem samples were placed in the
closed electrode cuvette and depletion of the O2 concentration in the rapidly
stirred solution of the closed cuvette was linear with time.

Chapter 3
56
The oxygen electrode allows the measurement of oxygen evolution, uptake
and liberation in a closed system. The oxygen electrode works based on a
polarographic measurement of the electricity that flows between an anode and a
cathode. This electrode consists on a cell which contains platinum wire cathode
and a silver ring wire anode, linked by an electrolyte (potassium chloride
solution). On top of the electrode, a gas-permeable membrane (teflon or
polyethylene) is placed, sealed with a silicone rubber ‘O’ ring that surrounds the
electrodes (Fig. 3.9). The reaction mixture in the appropriate container is stirred
constantly with a small magnetic stirring rod. When a small voltage is applied
across the electrodes (-0.6V), the platinum electrode is negatively charged with
respect to the silver electrode. Oxygen diffuses through the membrane and is
reduced at the platinum surface. The electrical current generated is directly
proportional to the amount of oxygen that is reduced. The amount of oxygen that
is reduced depends on the diffusion through membrane, which is the limiting step
in the reaction. Any variation in the oxygen concentration due to gas-exchange of
the tissue analyzed is reflected in the electrolyte (potassium chloride solution). As
a consequence of this, the electric current between cathode and anode also
changes.
Figure 3.9. Photograph (left) and diagram (right) of the different components of the liquid-phase Clark-type oxygen electrode Dual Digital Model 20 (Rank Brothers LTD, Cambridge, England).

Material and Methods
57
3.4.4. On-line measurements of stable carbon isotope discrimination On-line measurements of stable carbon isotope discrimination were made
with a Cavity Ring-Down Spectrometer (CRDS) (Isotopic CO2 G1101-i analyzer,
Picarro, Inc., Santa Clara, California, USA) connected to the leaf chamber of the
GFS 3000 gas-exchange system.
The technique is based on absorption measurements using a near-infrared
laser. Gas sample is circulated in an optical measurement cavity (ring down
cavity) formed by two plane-concave mirrors. The mirrors are coated for an
optimum reflectivity in the visible and near UV range of the spectrum reflectivity.
Then, the optical absorbance of the sample is determined providing the
concentration or isotopic ratio measurements of CO2.
The instrument includes an inlet valve, pump, and pressure sensor to
automatically and continuously capture the gas sample. Diode laser emits a
directed beam of light energy through one partially reflecting mirror placed into
the cavity. The light intensity inside the cavity then builds up over time and is
monitored through a second partially reflecting mirror using a photo-detector
located outside the cavity. The “ring-down” measurement is made by rapidly
turning off the laser and measuring the light intensity in the cavity as it decays
exponentially with a time constant that depends on the losses due to the cavity
mirrors and the absorption and scattering of the sample being measured
(Fig.3.10). The instrument have a precision of δ13CO2 0.3 ‰ in five minutes and a
response time of 60 seconds.
Figure 3.10. Block diagram of the Cavity Ring-Down Spectrometer (Sumner et al. 2011).

Chapter 3
58
In our experiment (section 5.1), after recording the steady-state AN values
at each Ca, 12CO2 and 13CO2 concentrations entering and leaving the leaf chamber
of the GFS-3000 were measured by the Spectrometer connected in a bypass loop.
The values of δ13C were corrected for water vapor (White paper for water vapor
correction for the G2101-i Isotopic CO2 Analyzer, C. Rella, www.piccaro.com)
and methane (Isotopic carbon in CO2 methane detection flag, K. Cunningham,
www.piccaro.com) according to manufacturer’s recommendations.
3.4.5. Water use efficiency
3.4.5.1. Intrinsic (AN/gs) and instantaneous (AN/E) water use efficiency
At leaf level, instantaneous measurements of net assimilation of CO2 (AN),
transpiration rate (E) and stomatal conductance (gs) obtained by the open infrared
gas-exchange system (Li-6400; Li-Cor, Inc., Lincoln, NE, USA) allowed to
determine intrinsic and instantaneous water use efficiency from the ratio between
AN/gs and AN/E, respectively.
3.4.5.2. Carbon isotope composition in leaf dry matter
Two stable isotopes of CO2 exist and are naturally abundant: 13CO2 and 12CO2. The 13CO2 isotope has a heavier molecular mass than 12CO2. Due to its
molecular properties, 13CO2 is discriminated against along its pathway of diffusion
from the atmosphere up to the site of fixation. Moreover, carboxylating enzymes
(Rubisco and PEP carboxylase) discriminate against 13CO2 if the concentration of
CO2 is high. The concentration of CO2 inside the leaf (Ci) depends on the rate of
photosynthesis and the opening of the stomatal pores, which influences isotopic
discrimination (Eq 8).
Young leaves developed after the onset of the treatments were sampled for
carbon-isotope analysis. They were dried for 48h in an oven at 60ºC and ground
into powder. Subsamples of 2 mg were analyzed for isotope ratio (δ13C). Samples
were combusted in an elemental analyzer (Thermo Flash EA 1112 Series,
Bremen, Germany), CO2 was separated by chromatography and directly injected
into a continuous-flow isotope ratio mass spectrometer (Thermo Finnigan Delta
XP, Bremen, Germany). Peach leaf standards (NIST 1547) were run every eight

Material and Methods
59
samples. δ13C values were referred to a Pee Dee Belemnite standard, and was
calculated according to Farquhar & Richards 1984:
1000 · 1 C(‰) standard
sample13
−
=
R
Rδ [11]
3.4.5.3. Whole plant water use efficiency
Plants were harvested at the beginning and at the end of the experiments to
determine the whole plant biomass. Leaves, stems and roots were separated and
dried in an oven at 60ºC to obtain dry weight. Total biomass increment during the
experiment was estimated as the difference between whole plant dry weight at the
beginning and at the end of the experiment. Plant water consumed over the
experimental period was estimated from the sum of the daily water consumption
calculated as described in section 3.3.
Whole plant water use efficiency was determined as follows:
consumed water total
biomass) initial dry weight - biomass finalweight(dry )L (g WUE 1-
WP = [12]
3.4.6. Leaf anatomy Pieces of 1x1 mm were cut between the main veins of leaves. Leaf
material was quickly fixed under vacuum with 4% glutaraldehyde and 2%
paraformaldehyde in 0.1 M phosphate buffer (pH 7.2). After primary fixation, the
tissue was washed three times in the same buffer used in the previous step.
Afterwards, samples were fixed in 1% osmium tetroxide between 1-2 hours and
dehydrated in a graded ethanol series (from 30% to absolute ethanol). Then,
ethanol was replaced by propylene oxide, an intermediary solvent highly miscible
with the embedding media and washed three times. The solvent propylene oxide,
was mixed with Spurr’s resin (Monocomp Instrumentación, Madrid, Spain) and
placed into vials with the dehydrated segments. Gradually, the resin-solvent ratio
was increased until pure Spurr’s resin was used. The pure resin specimens were
transferred into molds and cured in an oven at 60 ºC during 48 h. The semi-thin

Chapter 3
60
(0.8 µm) and ultra-thin (90 nm) cross sections were cut with an ultramicrotome
(Reichert & Jung model Ultracut E).
3.4.6.1. Light microscopy
Semi-thin cross sections (0.8 µm) were stained with 1% toluidine blue and
viewed under Olympus light microscope BX60. Pictures were taken at 200x and
500x magnifications with a digital camera (U-TVO.5XC, Olympus) to measure
whole leaf thickness and the thickness of epidermal layers, palisade and spongy
mesophyll. The volume fraction of intercellular air spaces was calculated as:
wt
Sf
mes
sias 1
∑−= [13]
where ΣSs is the total cross sectional area of mesophyll cells, w is the
width of the section and tmes is the mesophyll thickness between the two
epidermises.
All images were analyzed with Image analysis software (Image J; Wayne
Rasband/NIH, Bethesda, MD, USA) in 4-6 different fields of view, making ten
measurements for spongy tissue and ten for palisade parenchyma cells for each
anatomical trait.
3.4.6.2. Electron microscopy
Ultra-thin cross sections (90 nm) for transmission electron microscopy
(TEM H600, Hitachi) were contrasted with uranyl acetate and lead citrate. Photos
were taken at 2000x magnification to measure the length of mesophyll cells and
chloroplasts adjacent to intercellular air spaces, cytoplasm thickness, chloroplast
width and thickness.
Mesophyll (Sm/S) and chloroplast (Sc/S) surface area exposed to
intercellular air spaces per leaf area were calculated separately for spongy and
palisade tissues as in Evans et al. (1994) and Syvertsen et al. (1995):
Ft
T
w
LSS ·
' ·
'/ Lm
m = [14]

Material and Methods
61
where Lm represents the length of mesophyll cells exposed to intercellular
airspace, TL the leaf thickness, w’· t’ the area of the electron micrograph and F the
curvature correction factor. To convert lengths in cross-section to surface area,
curvature correction factor was measured and calculated according to Thain
(1983). This factor accounts for the circumstance that the surface is not strictly
perpendicular to the section. It was obtained for palisade and spongy cells by
assuming that the cells are spheroids having different width to height ratios.
Chloroplast surface area (Sc/S) exposed to intercellular air spaces per leaf
area was calculated as:
SSL
LSS m
m
chlc / · / = [15]
where Lchl is the length of chloroplast exposed to intercellular airspace.
Mesophyll cell wall thickness was measured at 20000 – 40000x
magnifications. Micrographs were randomly selected in each section and cell wall
thickness was measured for 2-3 cells per micrograph.
All parameters were analyzed at least in four different fields of view. Ten
measurements for spongy and palisade cells were made for each anatomical trait.
All images were analyzed with Image analysis software (ImageJ; Wayne
Rasband/NIH, Bethesda, MD, USA).
3.4.7. Leaf morphological parameters
3.4.7.1. Leaf mass per area and leaf density
To determine leaf mass per area (MA), first the leaf area (LA) was
measured using a leaf area meter (AM-300 Area Meter, Analytical Development
Co. Hoddesdon, UK), or scanning the leaves to determine LA from the images
using Image J (ImageJ; Wayne Rasband/NIH, Bethesda, MD, USA). Then, the
dry mass of these leaves was determined after drying oven for 48h at 60ºC. MA
was calculated as:
area Leaf
massDry )m (g 2-
A =M [16]
Leaf density (DL) was determined from TL obtained from anatomical
measurements and MA. Then, leaf density was calculated as the ratio of leaf mass
per area to leaf thickness, expressed in g cm-3.
Chapter 3
62
3.4.8. Other measurements
3.4.8.1. Leaf area
Leaf area (LA) was measured using a leaf area meter (AM-300 Area
Meter), or scanning the leaves as described in section 3.4.7.1. Whole plant leaf
area was obtained from the leaf area of 20 to 30 leaves (subsample) and the dry
weight of all the leaves of a plant. Total LA was then calculated as follows:
subsample dry weight leaves
subsample) dry weight leaves (Total )(m Total 2 LAx
LA = [17]
3.4.8.2. Rubisco Content
First, leaf soluble proteins were extracted following the protocol described
by Pérez et al. (2011). Leaf discs of 3.4 cm2 were sampled and immediately
frozen in liquid N2. Samples were ground into powder in a mortar with liquid
nitrogen extraction buffer was added and grinding continued until the mixture was
thawed. The extraction buffer was composed of 4 ml of 100 mM N,N-bis (2-
hydroxyethyl) glycine (Bicine)-NaOH (pH 7.8), 10 mM MgCl2, 0.5 mM
dithiothreitol (DTT), 1 mM ethylenediaminetetraacetic acid (EDTA), 1 mM
ethylene glycol tetraacetic acid (EGTA), 1% (v/v) Triton X-100, 20% (v/v)
glycerol, 1 mM benzamidine, 1 mM e-aminocaproic acid, 10 µM leupeptin, and 1
mM phenylmethylsulphonyl fluoride (PMSF). Aliquots were centrifuged at
12000g, at 4ºC for 1.5 minutes.
Leaf soluble protein concentration was determined spectrophotometrically
according to Bradford (1976). This method is based in the absorbance shift
observed in an acidic solution of dye Coomassie Brilliant Blue G-250 (Bio-Read,
USA). When added to a solution of protein, the dye binds to the protein resulting
in a colour change from a reddish brown to blue. The peak absorbance of the
acidic dye solution changes from 465 to 595 nm when binding to protein occurs.
Therefore, measuring absorptance of the protein-dye complex at 595 nm allows an
accurate quantification. Aliquots from different samples containing 20 µg of leaf
soluble proteins were loaded in 12.5% SDS-polyacrylamide gel to determine the
amount of Rubisco by quantitative electrophoresis by densitometry. Total proteins
were separated by 0.75 mm thick of SDS-PAGE gel (12.5% resolving and 4%
stacking). The gels were fixed in a mixture with water, methanol and acetic acid

Material and Methods
63
for 1 hour, stained in EZ Blue Gel Staining (Sigma) solution for 1 hour, and
finally rinsed in water to remove excess stain. Gels were scanned (HP Scanjet
G3010) and images were analyzed by densitometry using an image analysis
software (TotalLab v2005, Nonlinear Dynamics, Durham, NC, USA).
3.4.8.3. Specific activity of Rubisco in vivo (kcat)
The in vivo specific activity of Rubisco per active site kcat, was calculated
according to Eichelmann et al. (2009):
[Rub] 8
550000 maxc,
cat
Vk = [18]
where [Rub] is the Rubisco content (g m-2), assuming that all the Rubisco
is active and its molecular weight is 550 000 Da, and Vc,max was obtained from
AN-Cc response curves (section 5.1.).
3.4.8.4. Extraction of leaf soluble sugars
Leaf soluble sugars were extracted as described by Brugnoli et al. (1988).
Leaf samples were ground into powder in a mortar with liquid nitrogen where 12
ml of water were added. The mixture was mixed for 30 minutes at room
temperature and boiled for 3 minutes. After centrifugation (25 minutes at
14.000g), the supernatants were purified using two exchange resins, Dowex-50
(H+) and Dowex-1 (Cl-), in sequence. The first exchange resin allows separating
aminoacids from organic acids and soluble sugars, while the second resin
separates organic acid from soluble sugars. The eluates obtained from the
chromatography containing the soluble sugars were freeze-dried. Subsamples of 1
mg were analysed for isotope ratio (δ13C) using an elemental analyzer continuous-
flow isotope ratio mass spectrometer (Thermo Finnigan Delta Plus, Bremen,
Germany) (section 3.4.5.2).

Chapter 3
64
3.4.8.5. Leaf absorptance
Leaf absorptance (α) was calculated as:
( )ance transmitt ereflectanc 1 +−=α [19]
Leaf transmittance and reflectance measurements were determined by
spectrometry (AvaSpec-2048-2, Avantes, Apeldoorn, The Netherlands) using an
integrating sphere (ISP-80-8-R, Ocean Optics, Dunedin, FL, USA). Average
absorptance across 400- 700 nm region was used to characterize the fraction of
incident photosynthetically active radiation absorbed by the leaf.
3.5. CALCULATIONS
3.5.1. Estimation of mesophyll conductance (gm) to CO2
3.5.1.1. Estimation of gm with gas exchange and chlorophyll fluorescence
Estimation of gm combining gas exchange and chlorophyll fluorescence,
known as variable J method, was described by Di Marco et al. (1990) and further
elaborated by Harley et al. (1992). The method relies on the basic relationship
between the rate of photosynthetic electron transport rate (J), net CO2 assimilation
(AN), and the CO2 concentration at the site of Rubisco (Cc). This relationship can
be modeled according to Farquhar et al. (1980):
( ) ( )*
* 2 · 4
ic
icLN
CC
CCRAJ
−+
+= [20]
where the factor 4 denotes the minimum electron requirement for
carboxylation. The variable J method has the problem that there are uncertainties
in the relationship between Jf (obtained from chlorophyll fluorescence, section
3.4.2.1.) and Ja (calculated by gas exchange measurements). Equation 20 assumes
that the linear electron transport calculated by gas exchange (Ja) is used in
photosynthesis and photorespiration, while alternative electron sinks are
negligible, and considers that chlorophyll fluorescence achieve the same cells that
contribute to the gas exchange measurements. Moreover, equation 20 assumes
there is no contribution of PSI to chlorophyll fluorescence at room temperature.
Hence, this method requires an accurate estimate of leaf absorptance (α) (Eq. 19)
or to measure the PSII optical cross-section (Eichelmann & Laisk, 1999) to

Material and Methods
65
determine the distribution of light between the two photosystems. However, even
taken these precautions there may not be a 1:1 relationship between Jf and Ja,
therefore a partial solution to these problems is to construct a “calibration curve”
under non-photorespiratory conditions varying the light intensities (section
3.4.2.1.). Under non-photorespiratory conditions linear electron transport is
associated with Rubisco carboxylation and alternative electron sinks. Therefore,
in this Thesis α and light curves under non-photorespiratory conditions were
measured to overcome the uncertainties linked with this method.
From Fick’s first law of diffusion, the relation between AN, Ci and Cc is
expressed as:
( )cimN CCgA −= [21]
Substituting Cc, equation 21 becomes:
( ) ( )( )( ) * /
* 2 / · 4
imNi
imNiLN
CgAC
CgACRAJ
−−+−
+= [22]
Rearranging equation 22:
( ))(4
)(8*
LNa
LNa
N
RAJ
RAJC
Ag
i
m
+−++Γ
−= [23]
where AN and Ci were obtained from gas exchange measurements at
saturating light. Ci* was used as a proxy for Γ* following Warren & Dreyer
(2006). Ci* and RL were determined according to the Laisk method (section
3.4.3.2.3). Alternatively, Rd was measured according to the section 3.4.3.3.1.
Mesophyll conductance (gm) was calculated using either Rd or RL. The results
showed only estimations corresponded to Rd measurements since the differences
between both respiration measurements are non-significant and measurements of
RL presented larger variability than Rd.
Determination of gm can be used to calculate Cc (Eq. 22). Using Cc instead
of Ci, it was possible to convert AN-Ci curves into AN-Cc curves and to obtain more
reliable results of in vivo photosynthetic activity.

Chapter 3
66
3.5.1.1.1. Parameters derived from AN-Cc curves
The model of Farquhar et al. (1980) has provided a tried and tested method
to partition quantitatively biochemical and stomatal limitations on photosynthesis,
from the response of CO2 uptake to intercellular mole fraction of CO2.
Simultaneous measurements of chlorophyll fluorescence provide a means to
determine the partitioning of energy between photosynthesis and photorespiration,
and therefore to convert Ci into Cc, as explained above.
In this model, the biochemical reactions of photosynthesis are considered
to be in two or sometimes three phases (according to von Caemmerer et al. 2000)
obtained from the response of AN to Cc. At low Cc, ∂ AN/ ∂ Cc is high and
determined by the Rubisco activity. When Cc is increased there is an inflection to
a lower ∂ AN/ ∂ Cc that approaches zero, where RuBP-regeneration is limiting. In
some cases, a further increase in Cc may result in another transition to plateau or a
decrease in AN with an additional increase in Cc ( ∂ AN/ ∂ Cc ≤ 0), if triose-
phosphate utilization (TPU) becomes limiting (Fig. 3.6). By fitting these phases,
key biochemical kinetic variables determining photosynthetic rate can be
determined in vivo: the maximum velocity of carboxylation (Vc,max), the capacity
for photosynthetic electron transport (J,max) and the triose-phosphate utilization
rate (VTPU). These model parameters on the basis of Cc are calculated using the
temperature dependence of kinetic parameters of Rubisco described by Bernacchi
et al. (2002), whereby net assimilation rate is given as:
AN = min {Ac, Aq, Ap} – RL [24]
With:
[ ])/(1
*
oiccmaxc,c
KOKC
ΓCVA c
++−
= [25]
*)Γ2(4
*)Γ(
c
cq +
−=C
CJA [26]
−
=
c
p*Γ
1
3
C
VA TPU [27]

Material and Methods
67
where Ac, Aq, Ap represent photosynthesis limited by carboxylation, RuBP
regeneration and TPU utilization, respectively, Kc and Ko are the Rubisco
Michaelis-Menten constants for carboxylation and oxygenation, respectively, Oi is
the leaf internal oxygen concentration (assumed equal to the external) and VTPU is
the rate of use of triose phosphates.
3.5.1.2. Estimation of gm with gas exchange only: the curve-fitting method
The curve-fitting method is based on measurements of AN and Ci in a wide
range of CO2 concentrations. The data are then fitted to the C3 photosynthesis
model of Farquhar et al. (1980), which was later modified by Ethier & Livingston
(2004) and Sharkey et al. (2007) to include gm. The fundamental premise of the
curve-fitting methods is that a finite gm reduces the curvature of an AN-Ci response
curve.
The Farquhar et al. model of C3 photosynthesis states that photosynthesis
is the minimum of rates limited by Rubisco carboxylation (Ac) or the rate of RuBP
regeneration (Aj):
AN = min {Ac, Aj}
The rates of Ac and Aj are conventionally given by non-linear equations
(e.g. Sharkey et al., 2007), but can also be formulated as quadratic equations
(Ethier & Livingston, 2004):
a
acbbAc 2
42 −+−= , where:
a = –1/ gm,
)/1( ocim
Lmaxc,KOKC
g
RVb +++
−= , and
c =RL[Ci+Kc(1+O/Ko)] – Vc,max(Ci – Γ*) [28]

Chapter 3
68
a
acbbAj 2
42 −+−=
a = –1/ gm,
b = (J/4 – RL)/ gm + Ci + 2Γ*, and
c = RL (Ci + 2Γ*) – J/4(Ci – Γ*) [29]
where J is the electron transport rate under RuBP-limited conditions and O is
oxygen concentration.
3.5.1.3. Estimation of gm with gas exchange and 13C isotope discrimination
This method is based on simultaneous measurements of leaf gas exchange
and carbon isotope discrimination. Discrimination occurs during photosynthetic
CO2 fixation. 13CO2 diffuses more slowly in the gaseous and the liquid phase, and
is carboxylated much more slowly than 12CO2 by Rubisco and PEP carboxylase
(Farquhar et al., 1982b; Evans et al., 1986).
In mathematical terms, carbon isotope discrimination (∆) is:
( )a
d
a
c
a
ciis
a
is
a
sab
C
fkeR
C
bC
C
CCae
C
CCa
C
CCa *)/()()()( Γ+−+−++−+−=∆ [30]
where Ca is the concentration of CO2 in air and Cs at the leaf surface; and ab
fractionation due to diffusion through the boundary layer (2.9‰), a diffusion
through stomata (4.4‰), es and ai are the fractionation occurring during the
dissolution (1.1‰ Mook et al., 1974) and diffusion of CO2 in the liquid phase
(0.7‰ O’Leary, 1981). Value of b is the fractionation associated with the
enzymatic fixation of CO2 which accounts for the fractionation of Rubisco (95%)
and PEP carboxylase (5%). Both enzymes operate in parallel affecting the isotopic
composition of C fixed (Brugnoli et al., 1998; Brugnoli & Farquhar, 2000).
Therefore, depending on the proportion of PEP carboxylations in C3 plants, the
value of b can ranged between 27–30‰. Value of e is the fractionation due to
mitochondrial respiration and f the fractionation due to photorespiration. Values
of e and f are subjected to uncertainty since different measurements have provided
different results (von Caemmerer & Evans 1991, Tcherkez et al. 2003, Gessler et

Material and Methods
69
al. 2009). In this Thesis to estimate gm, b value was considered -29‰ according to
Roeske & O`Leary (1984), Guy et al. (1993) and Evans et al. (1994) and, e and f
were taken as zero according to von Caemmerer and Evans (1991) and Scartazza
et al. (1998).
Το measure simultaneously carbon isotope discrimination and leaf gas
exchange, the air entering (Ce) and leaving (Co) the gas exchange chamber is
transferred to the mass spectrometer to determine δ13C. In that way, ∆obs can be
calculated according to Evans et al. (1986):
( )eoo
eoobs 1
)(
δδξδδδξ
−−+−=∆ [31]
withoe
e
CC
C
−=ξ
where δe and δo are the isotopic compositions of the CO2 in the air entering
and leaving the chamber.
According to Evans et al. (1986), the expected carbon isotope
discrimination (∆i) is obtained from gas exchange assuming that gm is infinite (i.e.
when Ci = Cc).
( )a
i
C
Cabai −+=∆ [32]
Substracting equation 31 from equation 32
( )a
d
a
cobsi
*)/(
C
fkeR
C
CCCaeb i
is
Γ++
−−=∆−∆ [33]
and substituting equation 21 (from fisrt Fick’s law) into equation 34 is
derived:
( )a
d
am
Nobsi
*)/()(
C
fkeR
Cg
Aaeb is
Γ++−−=∆−∆ [34]
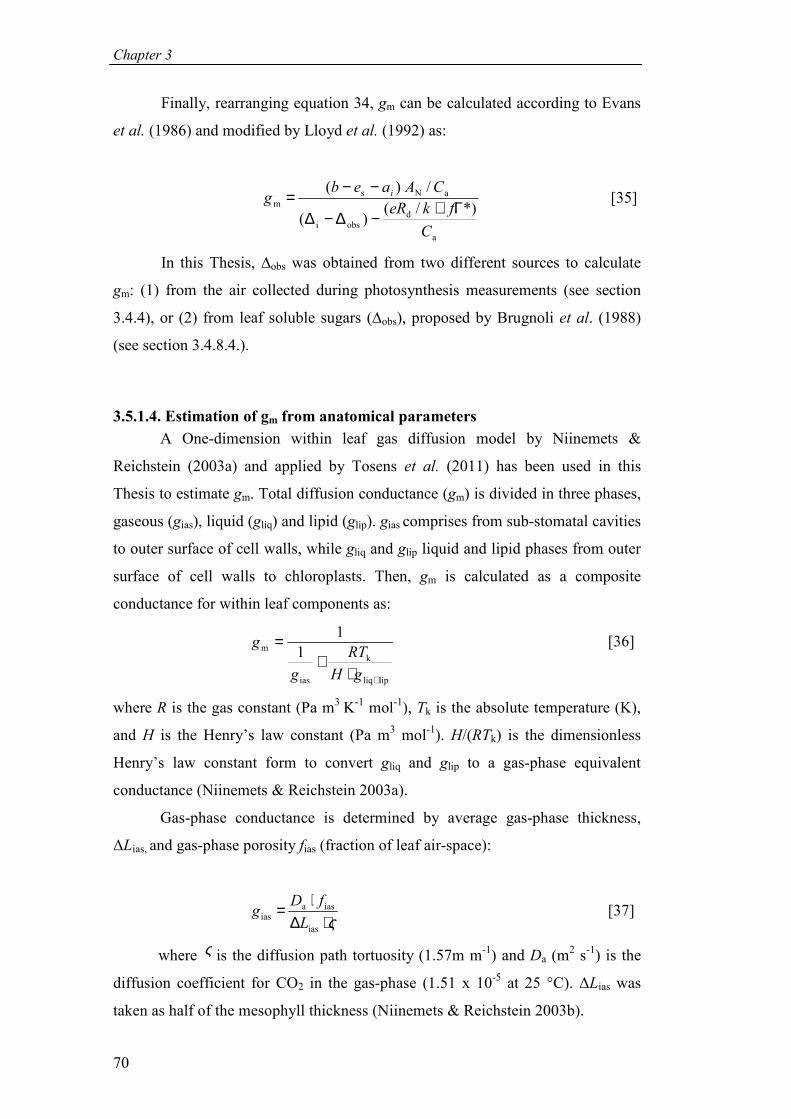
Chapter 3
70
Finally, rearranging equation 34, gm can be calculated according to Evans
et al. (1986) and modified by Lloyd et al. (1992) as:
a
dobsi
aNsm *)/(
) (
/ ) (
C
fkeR
CAaebg i
Γ+−∆−∆
−−= [35]
In this Thesis, ∆obs was obtained from two different sources to calculate
gm: (1) from the air collected during photosynthesis measurements (see section
3.4.4), or (2) from leaf soluble sugars (∆obs), proposed by Brugnoli et al. (1988)
(see section 3.4.8.4.).
3.5.1.4. Estimation of gm from anatomical parameters
A One-dimension within leaf gas diffusion model by Niinemets &
Reichstein (2003a) and applied by Tosens et al. (2011) has been used in this
Thesis to estimate gm. Total diffusion conductance (gm) is divided in three phases,
gaseous (gias), liquid (gliq) and lipid (glip). gias comprises from sub-stomatal cavities
to outer surface of cell walls, while gliq and glip liquid and lipid phases from outer
surface of cell walls to chloroplasts. Then, gm is calculated as a composite
conductance for within leaf components as:
lipliq
k
ias
m 11
+⋅+
=
gH
RT
g
g [36]
where R is the gas constant (Pa m3 K-1 mol-1), Tk is the absolute temperature (K),
and H is the Henry’s law constant (Pa m3 mol-1). H/(RTk) is the dimensionless
Henry’s law constant form to convert gliq and glip to a gas-phase equivalent
conductance (Niinemets & Reichstein 2003a).
Gas-phase conductance is determined by average gas-phase thickness,
∆Lias, and gas-phase porosity fias (fraction of leaf air-space):
ς⋅∆
⋅=ias
iasaias
L
fDg [37]
where ς is the diffusion path tortuosity (1.57m m-1) and Da (m2 s-1) is the
diffusion coefficient for CO2 in the gas-phase (1.51 x 10⁻⁵ at 25 °C). ∆Lias was
taken as half of the mesophyll thickness (Niinemets & Reichstein 2003b).

Material and Methods
71
The inverse of total liquid and lipid-phase conductance is expressed as the
sum of the inverse of serial conductances:
Sggggg
Sg
++++
=+
stenctplcw
clip liq
11111 [38]
where the partial conductances are: gcw for cell wall, gpl for plasmalemma,
gct for cytosol, gen for chloroplast envelope and gst for chloroplast stroma. The
partial determinants of liquid and lipid phase diffusion pathway (gi, where i stands
either for cell wall, cytosol or stroma conductance) were determined as:
i
iwif,i
L
pDrg
∆⋅⋅
= [39]
where ∆Li (m) is the diffusion path length in the corresponding component
of the diffusion pathway, pi (m3 m-3) is its effective porosity, and Dw is the
aqueous phase diffusion coefficient for CO2 (1.79.10-9 m2 s-1 at 25 °C). The
dimensionless factor rf,i accounts for the reduction of Dw compared with free
diffusion in water (Weisiger 1998), and was taken 1.0 for cell walls (Rondeau-
Mouro et al. 2008) and 0.3 for cytosol and stroma (Niinemets & Reichstein
2003b). pi was set 1.0 for cytosol and stroma (Nobel 1991), and from 0.02 to 0.3
for the thickest and the thinnest cell walls, respectively, in the section 5.1 (This
was the linear response of porosity to cell wall thickness that gave rise to highest
r2 for this relationship). In the experiment 5.2 a constant value of pi for cell wall
(0.1) was assumed (Nobel 1991). gpl and gen can not be estimated from anatomical
parameters, therefore a constant value described by Gutknecht et al. (1977) for
lipid bilayers was assumed (0.0035 m s-1).

Chapter 3
72
3.5.2. Quantitative limitation analysis
3.5.2.1. Quantitative analysis of photosynthesis limitations
To determine the limitations imposed on photosynthesis, a quantitative
limitation analysis of photosynthesis was calculated following the approach
proposed by Jones (1985) and implemented by Grassi and Magnani (2005). The
photosynthetic limitations were partitioned into their functional components
related to stomatal conductance (ls), mesophyll conductance (lm) and biochemical
characteristics (lb). From previous AN-Cc response curves, the absolute limitations
for each component were calculated as:
cN
cNstots /
/·/
CAg
CAggl
tot ∂∂+∂∂= [40]
cNtot
cNmtotm /
/·/
CAg
CAggl
∂∂+∂∂= [41]
cNtot
tot
b / CAg
gl
∂∂+= [42]
where gtot is the total conductance to CO2 from ambient air to chloroplasts
(gtot = 1/gs +1/gm) and ∂AN/∂Cc the slope obtained from AN-Cc response curves
ranged between 50 and 100 µmol mol-1.
3.5.2.2. Quantitative analysis of limitations on mesophyll conductance
Quantitative limitation analysis of gm was calculated for each component
of the diffusion pathway of CO2 (Eq. 37-39). The gas phase limitation (lias)
imposed on gm was calculated as:
m
iasias /1
/1
g
gl = [43]
The proportion of gm limited by liquid and lipid phase (li) conductance was
determined as:
mc
ii /
/
gS
gSl = [44]
where li is the limitation in either cell wall, cytosol, chloroplast stroma,
plasmalemma and chloroplast envelope and gi is the component diffusion
conductances of the corresponding diffusion pathways.

Material and Methods
73
3.5.3. Plant carbon balance Whole plant carbon balance (PCB) was calculated as:
PCB = AN leaf – Rleaf – Rstem – Rroot [45]
Photosynthesis and respiration of the different organs were measured as
previously described (sections 3.4.3.2.1. and 3.4.3.3., respectively).
Estimation of carbon gain by photosynthesis (AN) was obtained from the
sum of daily AN per total leaf area (LA), which increment was considered lineal
during the experiment. This parameter was considered separately, for irrigated and
non-irrigated plants because they present different dependency on light intensity.
In control plants, from three different daily cycles a single hyperbolic function of
the relationship between AN and the photosynthetic active radiation (PAR) was
derived for each cultivar and used for the integration of daily leaf photosynthesis.
The inclination of the leaf with respect to the horizontal was considered and
applied to the function as a correction factor of 30º. On the other hand, in water
stressed plants the major limiting factor in photosynthesis is gs (Flexas et al.
2002), therefore, AN was estimated from the daily carbon gain calculated as the
mean of the three daily cycles of leaf photosynthesis measured six times along the
day in three different days throughout the experiment for each cultivar.
Leaf respiration was calculated from nocturnal time courses and
measurements made at different temperatures in irrigation and non-irrigation
conditions (3.4.3.3.1.). Night-time leaf respiration was calculated as the integral of
the nigh-time course of Rleaf. Then, values obtained from leaf respiration at
different temperatures were used to develop calibration curves to estimate the
temperature response of night leaf respiration. Leaf carbon loses during diurnal
period were included in the measurements of AN, since this equals gross
photosynthesis minus the sum of photorespiration and mitochondrial respiration.
Total stem respiration (Rstem) was obtained from the measurements
performed in apical and intermediate segments of the main stem of irrigated and
water stressed plants at different temperatures. From these measurements a single
exponential function was obtained and used to calculate daily Rstem considering
hourly changes of Tair and a linear increase in stem biomass.

Chapter 3
74
Estimation of total root respiration (Rroot) was derived from a single
exponential function obtained from measurements of Rroot in irrigated and non-
irrigated plants at different temperatures. This function was used to calculate daily
Rroot considering hourly changes of Tsoil and daily linear increases along the
experiment.
Plant Biomass (PB) was calculated considering the N content and the ash
fraction of the different tissues (leaf, stem and roots) described by Vivin et al.
(2003) for grapevines.

Improvement of water use efficiency in grapevines
75
Chapter 4
IMPROVEMENT OF WATER
USE EFFICIENCY IN
GRAPEVINES
NOTE: this review paper presents many of the ideas explained in the Introduction
and some of the preliminary results obtained in the present Thesis
4.1. Flexas J., Galmés J., Gallé A., Gulías J., Pou A., Ribas-Carbó M., Tomás M.
& Medrano H. (2010) Improving water use efficiency in grapevines: potential
physiological targets for biotechnological improvement. Australian of Grape
& Wine Research 16, 106-121_

76

Variability of mesophyll conductance and its mechanistic basis
77
Chapter 5
VARIABILITY OF MESOPHYLL CONDUCTANCE AND MECHANISTIC BASIS OF
THESE VARIATIONS
5.1. Tomás M., Flexas J., Copolovici L., Galmés J., Hallik L., Medrano H.,
Tosens T., Vislap V. & Niinemets Ü. (2012). Importance of leaf anatomy in
determining mesophyll diffusion conductance to CO2 across species:
quantitative limitations and scaling up by models. Plant, Cell &
Environment (submitted).
5.2. Tomás M., Medrano H., Martorell S., Pou A., Escalona J.M., Ribas-Carbó
M. & Flexas J. (2012) Mesophyll conductance and leaf anatomy traits in
different cultivars of grapevine (in preparation).

78

Water use efficiency at leaf and whole plant level
79
Chapter 6
WATER USE EFFICIENCY AT LEAF AND WHOLE PLANT
LEVEL
6.1. Tomás M., Medrano H., Pou A., Escalona J.M., Martorell S., Ribas-Carbó
M. and Flexas J. (2012) Water use efficiency in grapevine cultivars grown
under controlled conditions: effects of water stress at the leaf and whole
plant level. Australian Journal of Grape & Wine Research 18, 164-172

80

Plant respiration, cuticular and night transpiration
81
Chapter 7
IMPORTANCE OF PLANT RESPIRATION, CUTICULAR
AND NIGHT TRANSPIRATION IN WHOLE PLANT WATER USE
EFFICIENCY
7.1. Escalona JM., Fuentes S., Tomás M., Martorell S., Flexas J. & Medrano H.
(2012) Responses of leaf night transpiration to water stress in Vitis vinifera
L. Annals of Botany (submitted).
7.2. Escalona J.M.*, Tomás M.*, Martorell S., Medrano H., Ribas-Carbó M. &
Flexas J. (2012). Carbon balance in grapevines under different soil water
supply: importance of whole plant respiration. Australian Journal of Grape
& Wine Research (in press)

82

General discussion
83
Chapter 8
GENERAL DISCUSSION
8.1. MESOPHYLL CONDUCTANCE (gm) EFFECTS ON LEAF WUE AND THE MECHANISMS THAT DETERMINE gm.............................................................................................84 8.2. DOES LEAF WUE DETERMINE WHOLE PLANT WUE?.........................................................86 8.3. PHYSIOLOGICAL MECHANISMS THAT CAN AFFECT WHOLE PLANT WUE ..................88 8.4. GENERAL OVERVIEW................................................................................................................90

Chapter 8
84
The results of this Thesis have been structured in four chapters (4, 5, 6,
and 7) corresponding to its publications. The relevance of the findings is profusely
discussed in each of these Chapters that deal with each general objectives.
Therefore, the present General Discussion chapter focuses only on broad and
integrated view of all physiological processes that can affect leaf and whole plant
WUE.
8.1. MECHANISMS THAT DETERMINE gm AND ITS
EFFECTS ON LEAF WUE.
The first broad objective of this Thesis was to analyze the mechanisms
involved in the variability of mesophyll conductance (gm) and whether such
variability was linked to improvements of leaf WUE (WUEl).
Mesophyll conductance (gm) has been proposed as a potential
physiological process to improve WUEl, as it would increase CO2 concentration at
the carboxylation site (Cc) and consequently AN without any effect on leaf
transpiration (Parry et al. 2005, Flexas et al. 2008). From Fick’s first law of
diffusion, a direct dependency is expected between WUEl (AN/gs) and the ratio
gm/gs.
The results obtained in the present Thesis confirm that gm/gs determines
WUEl in different cultivars of grapevines. Increases in gm/gs corresponded to
increases in AN/gs regardless of the water status of the plants. Recently, this
positive relationship between gm/gs and WUEl (AN/gs or δ13C) has been reported in
several species such as in Populus balsamifera (Soolanayakanahally et al., 2009),
barley (Barbour et al., 2010), Picea asperata (Duan et al., 2011) and tomato
(Galmés et al., 2011). Therefore, the positive correlation between gm/gs and AN/gs
observed in this Thesis and in other studies confirms gm as a potential target to
improve WUEl by increasing AN without increasing plant water losses.
Leaf structural traits and biochemical components have been considered
the major limitations of gm. CO2 diffuses through a gas phase in the intercellular
air spaces, through liquid phase in cell walls, cytosol and chloroplast stroma, and
through lipid phase in plasmalemma and chloroplast envelope. Moreover, CO2

General discussion
85
diffusion through membranes also depends on their permeability. Aquaporins and
carbonic anhydrases have been proposed as main components associated to the
membrane permeabilities and to rapid changes of gm (Gillon & Yakir, 2000;
Hanba et al., 2004; Flexas et al., 2006c; Heckwolf et al., 2011).
Recently, it has been shown that gm is highly determined by leaf
anatomical traits while the role of biochemical properties is still unclear. In
particular, the surface of chloroplasts exposed to intercellular air spaces (Sc/S) and
cell wall thickness (Tcw) have been suggested as the most important anatomical
traits limiting gm (Terashima et al., 2011). Accordingly, several reports
demonstrated positive relationships between gm and Sc/S (Evans et al., 1994;
Evans & Loreto, 2000; Terashima et al., 2006; Tholen et al., 2008; Tosens et al.,
2011). Moreover, it has been reported that Tcw could account for 25% or 50% of
the total internal resistance (Evans et al., 2009; Terashima et al., 2011). However,
several studies have also shown negative correlations between gm and Tcw in
different species (Hassiotou et al., 2010; Scafaro et al., 2011; Peguero-Pina et al.,
2012; Tosens et al., 2012) or between gm/(Sc/S) and Tcw when pooling data from
multiple studies (Terashima et al., 2011). Therefore, Sc/S and Tcw seem to be the
most important components involved in internal diffusion of CO2. In the present
Thesis the importance of the anatomical traits in gm is evaluated, in particular Sc/S
and Tcw, in a wide range of species with contrasted leaf structural properties, from
herbs to evergreen species with thick leaves (section 5.1). The inter-specific
differences in gm, and consequently in AN, were mainly explained by both Sc/S and
Tcw, although the importance of each in the diffusion of CO2 varied depending on
the leaf structure, being Tcw most important in species with high leaf dry mass per
area (MA). However, when studies are focused in a narrow range of species, as in
different Australian sclerophylls species (Tosens et al., 2012) or when different
species within the same genus are studied, Banksia (Hassiotou et al., 2010), Oryza
(Scafaro et al., 2011) or Abies (Peguero-Pina et al., 2012), smaller effects of leaf
anatomy are observed. In the present Thesis, where genotypic variability of gm has
been studied in grapevines (section 5.2) the role of the key anatomical traits, Sc/S
and Tcw, is not obvious. In the present case, membrane permeability to CO2 in the
liquid and lipid phase might play an important role in the genetic variability of gm.
Differences of several orders of magnitude have been reported for CO2
permeabilities for biological membranes (Evans et al., 2009). Moreover, it has

Chapter 8
86
been suggested that aquaporins constitute a key factor to regulate CO2 diffusion
through membranes (Martre et al., 2002; Terashima et al., 2011). Hence,
aquaporins could be involved in the genetic variability of gm observed in
grapevines, and they are potentially responsible of improvements of gm/gs.
Therefore, it is clear that leaf anatomy plays a dominant role in setting gm on a
broad scale, while on a smaller scale other factors become compelling to explain
gm differences, as it is the case for grapevine cultivars. Hence, further studies are
urged to determine the function of aquaporins in relation to variations of gm.
8.2. DOES LEAF WUE DETERMINE WHOLE PLANT WUE? The second goal of this Thesis faces the scale-up of WUEl to WUEWP with
the specific question of how significant is WUEl as a proxy for WUEWP.
Most studies about WUE are focused in WUEl, intrinsic WUE (AN/gs),
instantaneous WUE (AN/E) and/or carbon isotopic composition (δ13C) (Morison et
al. 2008). Leaf-level measurements of WUE are commonly used as proxy for
WUEWP, however, WUEl is not always a good parameter to predict WUEWP,
depending on the species studied and the experimental conditions. A negative and
strong correlation between δ13C and WUEWP has been observed in
monocotyledonous species such as wheat (Farquhar & Richards, 1984), crested
wheatgrass (Read et al., 1991), barley (Hubick & Farquhar, 1989) and Kentuchy
bluegrass (Ebdon et al., 1998), and in dicotyledonous species such as rice (Impa et
al. 2005), sunflower (Virgona et al. 1990) and peanuts (Craufurd et al. 1999).
However, no correlation between leaf (single-leaf or daily integrated
measurements of WUE) and whole plant WUE has been observed in other plants
with more complex canopies, such as in Vitis vinifera (Poni et al., 2009; Tarara et
al., 2011; Medrano et al, 2012) and western redcedar populations (Fan et al.,
2008). These studies are in agreement with the results obtained in Chapter 6,
where no consistent correlation was found between WUEl (AN/gs, AN/E, δ13C) and
WUEWP in spite of the significant variability observed among the different
cultivars of grapevine at both levels of WUE.
The possible causes of this lack of correlation could be partly associated to
the patterns of biomass accumulation in the different plant organs during the
growth season. Carbon isotope composition (δ13C) of plant tissues reflects the

General discussion
87
variation of the photosynthesis to stomatal conductance ratio over a considerable
time and under variable environmental conditions (Martinelli et al., 1998;
Buchmann et al., 1997, 1998). Fast growing plants (annual herbs) with short leaf
life spans, high photosynthesis and rapid carbon gain reduce the accumulation of
dry matter to the growing period. On the other hand, grapevines and other
evergreen/deciduous species present dry matter remaining from previous growth
seasons that could interfere in the carbon composition of the newly formed tissues
(Damesin et al., 1998; Hobbie et al., 2002). Therefore, these differences in the
patterns of carbon accumulation and allocation during the growing season could
explain why in fast growing species there is a good correspondence between δ13C
and whole-season WUE while in evergreen/deciduous woody species this
correlation is unexistent
Another limitation to predict WUEWP from WUEl is related to the canopy
architecture. In most studies, well-exposed leaves are used to determine WUEl,
minimizing the variability due to different locations on the canopy and interaction
with sun position. However, canopies are formed by heterogeneous leaves with
different irradiance directions. Open canopies with low leaf area index (LAI) or
vertically inclined leaves increase light penetration to lower leaves, allowing all
leaves to be well exposed and, consequently, presenting a good correspondence
between WUEl (leaf gas exchange measurements) and WUEWP (Terashima &
Hikosaka 1995, Xu et al., 2004). On the other hand, more complex canopies with
high LAI or flat leaves, such Vitis vinifera, present many shaded leaves either
temporally or permanently during the day. In this case, target leaves measured by
gas exchange measurements are not fully representative of the whole canopy
(Roux et al., 1996; Intrieri et al., 1997; Escalona et al., 2003; Petrie et al., 2009;
Poni et al., 2009).
However, the main limitation to the correspondence between WUEl and
WUEWP could be associated to the importance of carbon losses by plant
respiration. Whole plant water use efficiency depends on the balance between
assimilatory and respiratory processes. There is limited information on the spatial
and temporal variation of plant respiration rates to determine the final carbon
balance. Moreover, root temperature in potted plants and night temperatures
during summer can induce considerable increases in carbon losses which could
partially explain the lack of correlation between WUEl and WUEWP. Therefore,

Chapter 8
88
other physiological mechanisms not directly related to maximum leaf
photosynthesis of sun exposed leaves are involved in the regulation of WUEWP;
among them respiratory processes, less known than photosynthesis ones. This
observation led us to formulate the last general objective of the present Thesis,
which is to determine what physiological processes besides leaf photosynthesis
could be potential targets to improve WUEWP
8.3. PHYSIOLOGICAL MECHANISMS THAT CAN AFFECT
WHOLE PLANT WUE
Photosynthesis, transpiration and respiration are the physiological
mechanisms that directly affect carbon balance and water transpired. Therefore,
water losses uncoupled to any carbon gain (cuticular and night transpiration) and,
carbon losses by root, stem and leaf dark respiration have been proposed as
potential causes of the lack of correlation between leaf and whole plant WUE
(Flexas et al., 2010; Schultz & Stoll, 2010).
Significant water losses can occur during the night due to incomplete
stomatal closure and cuticular transpiration, thus increasing water losses without
any carbon gain (Caird et al., 2007) contributing to the discrepancy between leaf
and whole plant WUE. Night and cuticular transpiration have been studied in the
present Thesis in different cultivars of grapevine under irrigation and drought
conditions (section 7.1). Important water losses were observed during the night in
grapevines being reduced when progressive water stress was applied. The most
significant water losses were observed through the stomata, representing 70-90%
of total night transpiration, while water transpired by cuticle was of minor
importance. Night transpiration, and in particular gnight, showed variations in
response to VPDambient as observed in previous reports (Oren et al., 2001; Bucci et
al., 2004; Barbour & Buckley, 2007). Whole plant water losses were minor during
the night, particularly under water stress. This fact suggests that night
transpiration was compensated by dew deposition on the leaf or substrate surface
as a consequence of mild temperatures and high relative humidity in the area of
study, contributing to leaf hydration. These results indicate that water losses in
grapevines are not significantly relevant in setting WUEl under Mediterranean
conditions with high air relative humidity.

General discussion
89
The second physiological mechanism considered to cause the discrepancy
between WUEl and WUEWP is carbon loss by respiration. This Thesis studies
respiration in different organs of grapevine to determine the importance of this
process in the whole plant carbon balance and consequently in WUEWP (section
7.2). Most respiration studies at the whole plant level are performed in big
chambers; however, these chambers imply a modified environment as compared
to natural ambient (McCree, 1986; Norby et al., 1997; Petrie et al., 2003; Perez
Peña & Tarara, 2004; Tarara et al., 2011) and do not allow measurements of
respiration for each organ separately. In the experiment described in section 7.2,
respiration was determined at the ‘single organ level’ in different cultivars of
grapevine under well-watered and water stress conditions to determine the
importance of each organ in the plant carbon balance. At the whole plant level, a
large proportion of the carbon fixed by photosynthesis was consumed by
respiration under irrigated (30-50%) and non irrigated conditions (40-60%),
respectively. The most important carbon consumers by respiration were roots,
which accounted for 70-80% of the total plant carbon consumption by respiration
under irrigation. Under water stress root respiration was reduced, likely due to
reduced photosynthesis and carbohydrate transport to roots (Bota et al., 2004), but
it still accounted for up to 60-65% of the total plant carbon used. Leaves and
stems showed lower rates of respiration than roots, with a variable response to
drought, while leaf respiration decreased, as previously observed (Schultz & Stoll
2010), stem respiration slightly increased. Then, high variations among the
different organs were observed (Vivin et al., 2003), in addition to significant
intra-specific variability in root respiration. These results indicate the importance
of each organ respiration in the plant carbon balance being root respiration
responsible of most carbon losses. These results support the idea that reducing
respiration, especially in roots, could contribute to improve WUEWP. As described
in the Introduction, a decrease of maintenance respiration, a process which
significant part is sustained by the alternative oxidase pathway (AOP) described
as a futile process (Flórez-Sarasa et al., 2007), could be associated to an increase
of carbon gained by photosynthesis. Therefore, further studies in grapevine
respiration are needed to determine the possibility to use it as a potential tool to
improve WUEWP.

Chapter 8
90
8.4. GENERAL OVERVIEW Overall, the results of the present Thesis describe the importance of several
physiological mechanisms involved in water use efficiency in grapevines that
could be considered good candidates to improve WUEWP. Mesophyll conductance
and respiration have been described as important factors limiting WUE, for which
improving net plant carbon uptake (mesophyll conductance) or minimizing carbon
losses (respiration), are promising targets for the improvement of WUE. On the
other hand, night transpiration, studied as a mechanism that affects water balance
without any gain of carbon, showed significant water losses but largely
compensated by the dew deposition on leaf and substrate surfaces that allows the
leaf hydration, being this physiological process of minor importance in the
regulation of WUE under Mediterranean conditions.
The results of my experimental Thesis combined with previous data from
our research group (Escalona et al., 2003) are represented in a schematic diagram
(Fig. 8.1) to give a general overview on factors that can directly affect WUEWP and
that could be targeted for its improvement (Fig. 8.1). This general overview is
based on data from well-irrigated Tempranillo grafted on Richter-110 and grown
in the field (Escalona et al., 2003), and irrigated Tempranillo un-grafted and
grown in pots (experiments section 7.1 and 7.2). Potential maximum values of
photosynthesis (AN) and transpiration (E) are considered as those that would
achieve a plant if all its leaves were fully exposed to sun all the day. These values
are set to 100% with A/E ratio of 1. Escalona et al. (2003) showed that the
potential carbon gain can be reduced up to more than 50% due to the complexity
of the canopy structure, in which many leaves are shaded during the day
especially in the inner part of the canopy, hence displaying lower rates of
photosynthesis. Then, this reduces potential whole plant photosynthesis to 47%
(see graph). Regarding to the transpiration, Escalona et al. (2003) demonstrated
that 36% less water is lost when the canopy architecture is taken into account as
compared the potential maximum of leaf transpiration (100%). In this case, those
leaves shaded during the day present lower ratios of transpiration than leaves well
exposed to the sun, inducing that potential whole plant transpiration goes down to
64% (Fig. 8.1). Therefore, from Escalona et al. (2003) results we can conclude
that 27% of whole plant water use efficiency reduction is explained by canopy
structure. On the other hand, the experimental results of this Thesis (section 7.2)

General discussion
91
showed that 44% of carbon losses are owing to the plant respiration. This is
displayed in figure 8.1 as star marks where is represented the percentage of carbon
losses for each organ respiration, stems (2%), leaves (5%) and roots (37%). Then,
when it is applied to potential whole plant photosynthesis, net carbon gain
decreases from 47% to 26%. However, cuticular and night transpiration results of
experiment of section 7.1 demonstrate that these processes only imply slight
increments of total water losses (7%), incrementing potential whole plant
transpiration from 64% to 71%. Hence, 36% of potential whole plant water use
efficiency reduction is mainly explained by plant respiration.
Considering all above, we can conclude that canopy structure and whole
plant respiration are the two factors that account for most of the discrepancies
between WUEl and WUEWP.
Figure 8.1. Schematic diagram of carbon and water losses in Tempranillo under irrigation conditions that affect photosynthesis, transpiration and water use efficiency. Data obtained from Escalona et al. (2003) and experiments of sections 7.1 and 7.2.
Photosynthesis (A)
Transpiration (E)
A/E
100% 100% 1
Rstems
Rleaves
Rroots
gcut
Canopy structure
Canopy structure
47%
-53%
-5%
-2%
-37%
26%
gnight
+5%
+2%
64%
-36%
71%
0.73
0.37

Chapter 8
92
The results of this Thesis combined with data from Escalona et al. (2003)
represented in the schematic diagram (Fig. 8.1) shows an illustrative overview of
whole plant physiological processes that affect WUE under irrigation. However, it
is noteworthy that plants used in the experiments of this Thesis were plants
without fruits. Then, this observation led us to formulate the following questions:
what would happen in plants with fruits? Is the importance of each organ
respiration in WUEWP maintained?
There are evidences that grapevine fruits are the most active sink of
photosynthates. It has been shown that fruits import up to 70-80% of the total
assimilates obtained by photosynthesis although they constitute only 20-30% of
total plant dry matter (Bota et al. 2004). Therefore, further studies with fruiting
plants are needed to determine the importance of each tissue respiration, in
particular fruits and roots, to know in which organ is necessary to act to improve
WUEWP.

Conclusions
93
Chapter 9
CONCLUSIONS

Chapter 9
94
From the experimental research presented in this Thesis established from
its objectives, a series of conclusions have been reached.
1. To analyze the mechanisms that could induce the variability of mesophyll
conductance (gm), and whether such variability can be linked to improvements of
leaf WUE (WUEl)
1. In grapevines there was a large intra-specific variability in mesophyll
conductance (gm) under irrigation, while gm generally declined under water
stress.
2. The inter-specific variability of gm was mainly explained by anatomical
parameters. Surface of chloroplasts exposed to intercellular air spaces
(Sc/S) and cell wall thickness (Tcw) were the most important limitations in
internal CO2 diffusion.
3. The distribution of chloroplast along the exposed mesophyll cell wall
(Sc/S) was more determining in CO2 diffusion in species with thin leaves,
while Tcw was more limiting in thicker leaves with high leaf dry mass per
area (MA).
4. At smaller scale (among cultivars of a single species, grapevine), key
anatomical traits (Sc/S and Tcw) were not associated to intra-specific
variability of gm. The regulation of CO2 membrane permeability by
aquaporins is proposed as a possible candidate to explain the genetic
variability of gm in this case.
5. A good correlation between intrinsic WUE (AN/gs) and gm/gs was observed
in grapevines regardless of plant water status. Therefore, gm could be a
potential physiological target to improve leaf WUE, by means of
improving photosynthesis without increasing water losses.

Conclusions
95
2. To establish links between leaf and whole plant WUE.
6. Increases in leaf WUE (AN/gs or δ13C) did not always correspond to
increments in whole plant WUE. Hence, a lack of correlation between leaf
and whole plant WUE could be observed for certain experimental
conditions in Vitis vinifera cultivars.
3. To determine what physiological processes could be a potential target to
improve whole plant WUE (WUEWP).
7. A possible cause of the discrepancy observed in WUE at leaf and plant
level could be the water transpired by cuticular (gcut) and night
conductance (gnight). However, the water losses during the night were a
small proportion of daily ones and seemed to be of minor importance in
grapevines under Mediterranean conditions due to the dew deposition on
leaf and substrate surface that compensated water losses.
8. Carbon losses by plant respiration, in particular root respiration (Rroot),
explained the largest part of the lack of correlation between WUEl and
WUEWP observed in grapevines. Root respiration was identified as a
promising candidate target to improve WUE.
9. In order to improve WUEWP in grapevines, acting at different levels is
essential. Improving physiological processes like mesophyll conductance
(anatomical and biochemical properties), respiration and parameters
related to the plant structure (roots and canopy) is needed.

96

References List
97
REFERENCES LIST

References List
98
Aben J., Thiel F. & Boekestein A. (1989) Are the stomata of Vicia faba L. closed
in the dark? Ultramicroscopy 31, 457.
Amthor J.S. (1989) Respiration and crop productivity. Springer-Verlag, N.Y.
Amthor J.S. (2000) The McCree-de Wit-Penning de Vries-Thornley respiration
paradigms: 30 years later. Annals of Botany 86, 1-20.
Anyia A.O., Slaski J.J., Nyachiro J.M., Archambault D.J. & Juskiw P. (2007)
Relationship of carbon isotope discrimination to water use efficiency and
productivity of barley under field and greenhouse conditions. Journal
Agronomy & Crop Science 193, 313- 323.
Aranda I., Pardos M., Puértolas J., Jiménez M.D., Pardos J.A. 2007. Water-use
efficiency in cork oak (Quercus suber) is modified by the interaction of water
and light availabilities. Tree Physiology 27, 671-677.
Aschmann H. (1973) Distribution and peculiarity of Mediterranean Ecosystems.
In: Mediterranean Type Ecosistems: Origin and structure (eds Di Castri, F.
and Mooney, H. A.), pp. 405. SpringerVerlag, New York.
Barbour M.M. & Buckley T.N. (2007) The stomatal response to evaporative
demand persists at night in Ricinus communis plants with high nocturnal
conductance. Plant, Cell & Environment 30, 711-721.
Barbour M.M., Cernusak L.A., Whitehead D., Griffin K.L., Turnbull M.H., Tissue
D.T. & Farquhar G.D. (2005) Nocturnal stomatal conductance and
implications for modeling δ18O of leaf-respired CO2 in temperate tree species.
Functional Plant Biology 32, 1107-1121.
Barbour MM., Warren CR., Farquhar GD., Forrester G. & Brown H. (2010).
Variability in mesophyll conductance between barley genotypes, and effects
on transpiration efficiency and carbon isotope discrimination. Plant, Cell &
Environment 33, 1176-1185.
Benyon R. (1999) Nighttime water use in an irrigated Eucalyptus grandis
plantation. Tree Physiology 19, 853-859.
Bernacchi C.J., Morgan P.B., Ort D.R. & Long S.P. (2005) The growth of
soybean under free air [CO2] enrichment (FACE) stimulates photosynthesis
while decreasing in vivo Rubisco capacity. Planta 220, 434-446.
Bernacchi C.J., Portis A.R., Nakano H., von Caemmerer S. & Long S.P. (2002)
Temperature response of mesophyll conductance. Implications for the

References List
99
determination of Rubisco enzyme kinetics and for limitations to
photosynthesis in vivo. Plant Physiology 130, 1992-1998.
Bierhuizen J.F. & Slatyer R.O. (1965) Effect of atmospheric concentration of
water vapour and CO2 in determining transpiration– photosynthesis
relationships of cotton leaves. Agricultural Meteorology 2, 259-270.
Björkman O. & Demmig B. (1987) Photon yield of O2 evolution and chlorophyll
fluorescence characteristics at 77K among vascular plants of diverse origins.
Planta 170, 489-504.
Blake J. & Ferrell W.K. (1977) Association between soil and xylem water
potential, leaf resistance, and abscisic acid content in droughted seedlings of
Douglas fir (Pseudotsuga menziesii). Physiologia Plantarum 39, 106-109.
Bongi G. & Loreto F. (1989) Gas-exchange properties of saltstressed olive (Olea
europaea L.) leaves. Plant Physiology 90, 1408-1416.
Bota J., Flexas J. & Medrano H. (2001). Genetic variability of photosynthesis and
water use in Balearic grapevine cultivars. Annals of Applied Biology 138, 353-
365.
Bota J., Flexas J., Keys A.J., Loveland J., Parry M.A.J. & Medrano H. (2002)
CO2/O2 specificity factor of ribulose-1,5- bisphosphate carboxylase/oxygenase
in grapevines (Vitis vinifera L.): first in vitro determination and comparison to
in vivo estimations. Vitis 41, 163-168.
Bota, J., Stasyk, O., Flexas, J. & Medrano, H. (2004) Effect of water stress on
partitioning of 14C-labelled photosynthates in Vitis vinifera. Functional Plant
Biology 31, 697-708.
Bouma T. (2005) Understanding plant respiration: Separating respiratory
components versus a process-based approach. In: Plant respiration. From cell
to ecosystem, H. Lambers & M. Ribas-Carbó (eds.). Springer, Dordrecht, pp.
177-194.
Bouma T. & De Visser R. (1993) Energy requirements for maintenance of ion
concentrations in roots. Physiologia Plantarum 89, 133-142.
Boyer J.S. (1982) Plant productivity and environment. Science 218, 443-448.
Boyer J.S., Wong S.C. & Farquhar G.D. (1997) CO2 and water vapour exchange
across leaf cuticle (epidermis) at various water potentials. Plant Physiology
114, 185-191.

References List
100
Bradford M.M. (1976) A rapid and sensitive method for the quantification of
microgram quantities of protein utilizing the principle of protein dye binding.
Analytical Biochemistry 72, 248-254.
Brugnoli E. & Farquhar G.D. (2000). Photosynthetic fractionation of carbon
isotopes. In: Leegood RC, Sharkey TD, von Caemmerer S. eds.
Photosynthesis: physiology and metabolism. In: Advances in photosynthesis.
Dordrecht, The Netherlands: Kluwer Academic Publishers, 399-434.
Brugnoli E., Hubick T.H., von Caemmerer S., Wong S.C. & Farquhar G.D.
(1988) Correlation between the carbon isotope discrimination in leaf starch
and sugars of C3 plants and the ratio of intercellular and atmospheric partial
pressure of carbon dioxide. Plant Physiology 88, 1418-1424.
Bryla D.R. & Eissenstat D.M. (2005) Respiratory costs of mycorrhizal
associations. In: Plan Respiration: from cell to ecosystems. Eds Lambers H. &
Ribas-Carbó M. Springer, Netherlands 18, pp 207-224.
Bucci S.J., Goldstein G., Meinzer F.C., Franco A.C., Campanello P. & Scholz FG
(2005) Mechanisms contributing to seasonal homeostasis of minimum leaf
water potential and predawn disequilibrium between soil and plant water
potential in neotropical savanna trees. Trees 19, 296–304.
Bucci S.J., Scholz F.G., Goldstein G., Meinzer F.C., Hinojosa J.A., Hoffman
W.A. & Franco A.C. (2004) Processes preventing nocturnal equilibration
between leaf and soil water potential in tropical savanna woody species. Tree
Physiology 24, 1119-1127.
Buchmann N., Guehl J.M., Barigah T.S., & Ehleringer J.R. (1997) Interseasonal
comparison of CO2 concentrations, isotopic composition and carbon cycling in
an Amazonian rainforest (French Guiana). Oecologia 110, 120-131.
Buchmann N., Hinckley T.M., & Ehleringer J.R. (1998) Carbon isotope dynamics
in Abies amabilis stands in the Cascade. Canadian Journal of Forest Research
28, 808-819.
Bunce J.A. (2010). Variable responses of mesophyll conductance to sybstomatal
carbon dioxide concentration in common bean and soybean. Photosynthetica
48, 507-512.
References List
101
Burghardt M. & Riederer M. (2003) Ecophysiological relevance of cuticular
transpiration of deciduous and evergreen plants in relation to stomatal closure
and leaf water potential. Journal of Experimental Botany 54, 1941-1949.
Caird M.A., Richards J.H. & Donovan L.A. (2007) Nighttime Stomatal
Conductance and Transpiration in C3 and C4 Plants. Plant physiology 143, 4-
10.
Cano F.J., Sánchez-Gómez D., Gasco A., Rodriguez-Calcerrada J., Gil L., Warren
C.R. & Aranda I. Light acclimation at the end of the growing season in two
broadleaved oak species. Photosynthetica 49, 581-592.
Cavender-Bares J., Sack L. & Savage J. (2007) Atmospheric soil drought reduce
nocturnal conductance in live oaks. Tree Physiology 27, 611-620.
Centritto M., Lauteri M., Monteverdi M.C. & Serraj R. (2009) Leaf gas exchange,
carbon isotope discrimination, and grain yield in contrasting rice genotypes
subjected to water deficits during the reproductive stage. Journal
Experimental Botany 60, 2325-2339.
Centritto M., Loreto F. & Chartzoulakis K. (2003) The use of low [CO2] to
estimate diffusional and non-diffusional limitations of photosynthetic capacity
of salt-stressed olive saplings. Plant, Cell & Environment 26, 585-594.
Chaumont F., Barrieu F., Wojcik E., Chrispeels M.J. & Jung R. (2001)
Aquaporins constitute a large and highly divergent protein family in maize.
Plant Physiology 125, 1206-1215.
Chaves M.M., Maroco J.P. & Pereira J.S. (2003) Understanding plant responses to
drought: from genes to the whole plant. Functional Plant Biology 30, 239-264.
Chaves M.M., Santos, T., Souza, C.R., Ortuño, M.F., Rodrigues, M.L, lopes, C.,
Maroco, J. & Pereira, J.S. (2007) Deficit irrigation in grapevine improves
water-use efficiency while controlling vigour and production quality. Annals
of Aplied Biology 150, 237-252.
Chu C.R., Hsieh C.-I., Wu S.-Y. & Phillips N.G. (2009) Transient response of
sap flow to wind speed. Journal of Experimental Botany 60, 249-255.
Comas L.H., Eissenstat D.M. & Lakso A.N. (2000) Assessing root death and root
system dynamics in a study of grape canopy pruning. New Phytologist 147,
171–178.

References List
102
Conacher A.J. & Sala M. (1998) Land degradation in Mediterranean
environments of the world: Nature and extent cause and solutions. John Wiley
& Sons. pp 491.
Conacher A.J. (1995). Definition of Mediterranean climates. Geojournal 36, 298.
Condon A.G., Farquhar G.D., & Richards R.A. (1990) Genotypic variation in
carbon-isotope discrimination and transpiration efficiency in wheat: leaf gas
exchange and whole plant studies. Australian Journal of Plant Physiology 17,
9-22.
Condon A.G., Richards R.A., Rebetzke G.J. & Farquhar G.D. (2004) Breeding for
high water-use efficiency. Journal of Experimental Botany 55, 2447-2460.
Costa JM, Ortuño MF & Chaves MM. (2007) Deficit irrigation as strategy to save
water: physiology and potential application to horticulture. Journal of
Integrative Plant Biology 49, 1421-1434.
Costa J.M., Ortuño M.F., Lopes C.M. & Chaves M.M. (2012) Grapevine varieties
exhibiting differences in stomatal response to water deficit. Functional Plant
Biology http://dx.doi.org/10.1071/FP11156.
Craufurd, P.Q., Wheeler, T.R., Ellis, R.H., Summerfield, R.J. and Williams, J.H.
(1999). Effect of temperature and water deficit on the water-use efficiency,
carbon isotope discrimination and specific leaf area in peanut. Crop Science
39, 136-142.
Daley M.J. & Phillips N.G. (2006) Interspecific variation in nighttime
transpiration and stomatal conductance in a mixed New England deciduous
forest. Tree Physiology 26, 411-419.
Damesin C., Rambal S. & Joffre R. (1998) Seasonal and annual changes in leaf
δ13C in two co-ocurring Mediterranean oaks: relations to leaf growths and
drought progression. Functional Ecology 12, 778-785.
Danielson J.A.H. & Johanson U. (2008) Unexpected complexity of the aquaporin
gene family in the moss Physcomitrella patens. BMC Plant Biology 8, 45.
Daymond AJ., Tricker PJ. & Hadley P. (2011). Genotypic variation in
photosynthesis in cacao is correlated with stomatal conductance and leaf
nitrogen. Biologia Plantarum 55, 99-104.
De la Hera M.L., Romero P., Gómez-Plaza E. & Martínez A. (2007) Is partial
root-zone drying an effective irrigation technique to improve water use

References List
103
efficiency and fruit quality in field-grown wine grapes under semiarid
conditions? Agricultural Water Management 87, 261-274.
Delfine S., Alvino A., Villani M.C. & Loreto F. (1999) Restrictions to carbon
dioxide conductance and photosynthesis in spinach leaves recovering from
salt stress. Plant Physiology 119, 1101-1106.
De Visser R., Spitters C.J.T., & Bouma T. (1992) Energy costs of protein
turnover: theoretical calculation and experimental estimation from regression
of respiration on protein concentration of full-grown leaves. In: Molecular,
biochemical and physiological aspects of plant respiration, H. Lambers &
L.H.W. Van der Plas (eds.). SPB Academic Publishing, The Hague, pp. 493-
508.
Di Castri F. (1981). Mediterranean-type shrublands of the world. In: di Castri, F.;
Goodall, D. W. & Specht, R. L. Ecosystems of the world 11: Mediterranean-
Type Shrublands. Elsevier Scientific Publishing Company. 643 pp.
Di Marco G., Manes F., Tricoli D. & Vitale E. (1990) Fluorescence parameters
measured concurrently with net photosynthesis to investigate chloroplastic
CO2 concentration in leaves of Quercus ilex L. Journal of Plant Physiology
136, 538-543.
Diaz-Espejo A., Nicolás E. & Fernández J.E. (2007) Seasonal evolution of
diffusional limitations and photosynthetic capacity in olive under drought.
Plant, Cell & Environment 30, 922-933.
Dodd A.N., Parkinson K. & Webb A.A.R. (2004) Independent circadian
regulation of assimilation and stomatal conductance in the ztl-1 mutant of
Arabidopsis. New Phytologist 162, 63-70.
Dodd A.N., Salathia N.,Hall A., Kevei E., Toth R., Nagy F., Hibberd J.M., Millar
A.J. & Webb A.A.R. (2005) Plant circadian clocks increase photosynthesis,
growth, survival, and competitive advantage. Science 309, 630-633.
Domec J.C., Scholz F.G., Bucci S.J., Meinzer F.C., Goldstein G. & Villalobos-
Vega R. (2006) Diurnal and seasonal variation in root xylem embolism in
neotropical savanna woody species: impact on stomatal control of plant water
status. Plant, Cell & Environment 29, 26-35.
References List
104
Donovan L.A., Richards J.H. & Linton M.J. (2003) Magnitude and mechanisms
of disequilibrium between predawn plant and soil water potentials. Ecology
84, 463-470.
Douthe C., Dreyer E., Epron D. & Warren C.R. (2011) Mesophyll conductance to
CO2, assessed from online TDL-AS records of 13CO2 discrimination, displays
small but significant short-term responses to CO2 and irradiance in Eucalyptus
seedlings. Journal of Experimental Botany 62, 5335-5346.
Duan B., Ran F., Zhang X., Zhang Y., Korpelainen H. & Li C. (2011). Long-term
acclimation of mesophyll conductance, carbon isotope discrimination and
growth in two contrasting Picea asperata populations exposed to drought and
enhanced UV-B radiation for three years. Agricultural and Forest
Meteorology 151, 116-126.
Düring H. (2003) Stomatal and mesophyll conductances control CO2 transfer to
chloroplasts in leaves of grapevine (Vitis vinifera L.). Vitis 42, 65-68.
Ealson H.M. & Richards J.H. (2009). Photosynthesis affects following night leaf
conductance in Vicia faba. Plant, Cell & Environment 32, 58-63.
Ebdon J.S., Petrovic A.M. & Dawson T.E. (1998) Relationship between carbon
isotope discrimination, water use efficiency and evaporation in Kentucky
Bluegrass. Crop Science 38, 157-162.
EckertM., Biela A., Siefritz F. & Kaldenhoff R. (1999) New aspects of plant
aquaporin regulation and specificity. Journal of Experimental Botany 50,
1541-1545.
Eichelmann H. & Laisk A. (1999) Ribulose-1,5-bisphosphate
carboxylase/oxygenase content, assimilatory charge, and mesophyll
conductance in leaves. Plant Physiology 119, 179–-89.
Eichelmann H., Oja V., Rasulov B., Padu E., Bichele I., Pettai H., Möls T.,
Kasparova I., Vapaavuori E. & Laisk A. (2004) Photosynthetic parameters of
birch (Betula pendula Roth) leaves growing in normal and CO2- and O3
-
enriched atmospheres. Plant, Cell & Environment 27, 479-495.
Eichelmann H., Talts E., Oja V., Padu E. & Laisk A. (2009) Rubisco in planta kcat
is regulated in balance with photosynthetic electron transport. Journal of
Experimental Botany 60, 4077-4088.

References List
105
Epron D., Godard G., Cornic G. & Genty B. (1995) Limitation of net CO2
assimilation rate by internal resistances to CO2 transfer in the leaves of two
tree species (Fagus sylvatica and Castanea sativa Mill.) Plant, Cell &
Environment 18, 43-51.
Escalona J.M., Flexas J., Medrano H. (1999a) Stomatal and non-stomatal
limitations of photosynthesis under water stress in field-grown grapevines.
Australian Journal of Plant Physiology 26, 421-433.
Escalona J.M., Flexas J. & Medrano H. (1999b) Contribution of different levels of
plant canopy to total carbon assimilation and intrinsic water use efficiency of
Manto Negro and Tempranillo grapevines. Acta Hotriculturae 493, 141-148.
Escalona J.M., Flexas J. & Medrano H. (2002) Drought effects on water flow,
photosynthesis and growth of potted grapevines. Vitis 41, 57-62.
Escalona J.M., Flexas J., Bota J. & Medrano H. (2003) Distribution of leaf
photosynthesis and transpiration within grapevine canopies under different
drought conditions. Vitis 42, 57-64.
Ethier G.H. & Livingston N.J. (2004) On the need to incorporate sensitivity to
CO2 transfer conductance into the Farquhar-von Caemmerer-Berry leaf
photosynthesis model. Plant, Cell & Environment 27, 137-153.
Evans J.R. & Loreto F. (2000) Acquisition and diffusion of CO2 in higher plant
leaves. In Photosynthesis: Physiology and Metabolism (eds R.C. Leegood,
T.D. Sharkey & S. von Caemmerer), pp. 321-351. Kluwer Academic
Publishers, Dordrecht, the Netherlands.
Evans J.R. & Terashima I. (1988) Photosynthetic characteristics of spinach leaves
grown with different nitrogen treatments. Plant, and Cell Physiology 29, 157–
165.
Evans J.R., Kaldenhoff R., Genty B. & Terashima I. (2009) Resistances along the
CO2 diffusion pathway inside leaves. Journal of Experimental Botany 60,
2235-2248.
Evans J.R., Sharkey T.D., Berry J.A. & Farquhar G.D. (1986) Carbon isotope
discrimination measured concurrently with gas exchange to investigate CO2
diffusion in leaves of higher plants. Australian Journal of Plant Physiology
13, 281-292.
Evans J.R., von Caemmerer S., Setchell B.A. & Hudson G.S. (1994) The
relationship between CO2 transfer conductance and leaf anatomy in transgenic

References List
106
tobacco with a reduced content of Rubisco. Australian Journal of Plant
Physiology 21, 475-495.
Fabre N., Reiter I.M., Becuwe-Linka N., Genty B. & Rumeau D. (2007)
Characterization and expression analysis of genes encoding a and b carbonic
anhydrases in Arabidopsis. Plant, Cell & Environment 30, 617-629.
Fan S., Grossnickle S.C. & Russell J.H. (2008). Morphological and physiological
variation in western redcedar (Thuja plicata) populations under contrasting
soil water conditions. Trees 22, 671-683.
Farquhar G.D. & Richards R.A. (1984). Isotopic composition of plant carbon
correlates with WUE of wheat genotypes. Australian Journal Plant Physiology
11, 539-552.
Farquhar G.D. & Sharkey T.D. (1982b) Stomatal conductance and photosynthesis.
Annual Reviews of Plant Physiology 33, 317-5.
Farquhar G.D., O'leary M.H. & Berry J.A. (1982a) On the relationship between
carbon isotope discrimination and the intercellular carbon dioxide
concentration in leaves. Australian Journal of Plant Physiology 9, 121-137.
Farquhar G.D., von Caemmerer S. & Berry J.A. (1980) A biochemical model of
photosynthetic CO2 assimilation in leaves of C3 species. Planta 149, 78-90.
Feng L., Han Y., Liu G., An B., Yang J., Yang G., Li Y. & Zhu Y. (2007)
Overexpression of sedoheptulose-1,7-bisphosphate enhances photosynthesis
and growth under salt stress in transgenic rice plants. Functional Plant
Biology 34, 822-834.
Ferrio J.P., Pou A., Florez-Sarasa I., Gessler A., Kodama N., Flexas J. & Ribas-
Carbo M. (2012) The Peclet effect on leaf water enrichment correlates with
leaf hydraulic conductance and mesophyll conductance for CO2. Plant, Cell &
Environment 35, 611-625.
Fischer R.A. & Turner N.C. (1978) Plant productivity in arid and semiarid zones.
Annual Review of Plant Physiology 29, 277-317.
Flexas J., Barbour M., Brendel O., Cabrera H.M., Carriqui M., Díaz-Espejo A.,
Douthe C., Dreyer E., Ferrio J.P., Gallé A., Galmés J., Kodama N., Medrano
H., Niinemets Ü., Peguero-Pina J.J., Pou A., Ribas-Carbó M., Tomás M.,
Warren W. (2012) Mesophyll diffusion conductance to CO2: an unappreciated
central player in photosynthesis. Plant Science (submitted).

References List
107
Flexas J., Barón M., Bota J., Ducruet J.M., Gallé A., Galmés J., Jiménez M., Pou
A., Ribas-Carbó M., Sajnani C., Tomàs M. & Medrano M. (2009)
Photosynthesis limitations during water stress acclimation and recovery in the
drought adapted Vitis hybrid Richter-110 (V. berlandieri × V. rupestris).
Journal of Experimental Botany 60, 2361-2377.
Flexas J., Bota J., Escalona J.M., Sampol B & Medrano H. (2002) Effects of
drought on photosynthesis in grapevines under field conditions: an evaluation
of stomatal and mesophyll limitations. Functional and Plant Biology 29, 461-
71.
Flexas J., Bota J., Galmés J., Medrano H. & Ribas-Carbó M. (2006b) Keeping a
positive carbon balance under adverse conditions: responses of photosynthesis
and respiration to water stress. Physiologia Plantarum 127, 343-352.
Flexas J., Bota J., Loreto F., Cornic G. & Sharkey T.D. (2004) Diffusive and
metabolic limitations to photosynthesis under drought and salinity in C3
plants. Plant Biology 6, 269-279.
Flexas J., Díaz-Espejo A., Berry J.A., Galmés J., Cifre J., Kaldenhoff R., Medrano
H. & Ribas-Carbó M. (2007c) Leakage in leaf chambers in open gas exchange
systems: quantification and its effects in photosynthesis parameterization.
Journal of Experimental Botany 58, 1533-1543.
Flexas J., Díaz-Espejo A., Galmés J., Kaldenhoff R., Medrano H. & Ribas-Carbó
M. (2007a) Rapid variations of mesophyll conductance in response to changes
in CO2 concentration around leaves. Plant, Cell & Environment 30, 1284-
1298.
Flexas, J., Escalona, J.M. and Medrano, H. (1998) Down regulation of
photosynthesis by drought under field conditions in grapevine leaves.
Australian Journal of Plant Physiology 25, 893- 900.
Flexas J., Ortuño M.F., Ribas-Carbó M., Díaz-Espejo A., Florez- Sarasa I.D. &
Medrano H. (2007b) Mesophyll conductance to CO2 in Arabidopsis thaliana.
New Phytologist 175, 501-511.
Flexas J., Ribas-Carbo M., Diaz-Espejo A., Galmés J. and Medrano H. (2008)
Mesophyll conductance to CO2: current knowledge and future prospects.
Plant, Cell & Environment 31, 602-631.

References List
108
Flexas J., Ribas-Carbó M., Hanson D.T., Bota J., Otto B., Cifre J., McDowell N.,
Medrano H. & Kaldenhoff R. (2006c) Tobacco aquaporin NtAQP1 is involved
in mesophyll conductance to CO2 in vivo. The Plant Journal 48, 427-439.
Flexas J.,Ribas-CarbóM., Bota J., Galmés J., HenkleM., Martínez-Cañellas S. &
Medrano H. (2006a) Decreased Rubisco activity during water stress is not
induced by decreased relative water content but related to conditions of low
stomatal conductance and chloroplast CO2 concentration. New Phytologist
172, 73-82.
Flórez-Sarasa I.F., Bouma T.J., Medrano H., Azcon-Bieto J. & Ribas-Carbo M.
(2007) Contribution of the cytochrome and alternative pathways to growth
respiration and maintenance respiration in Arabidopsis thaliana. Physiologia
Plantarum 129, 143-151.
Franck F., Morales J.P., Arancibia-Avendanño D., García de Cortázar V., Perez-
Quezada J.F., Zurita-Silva A. & Pastenes, C. (2011). Seasonal fluctuations in
Vitis vinifera root respiration in the field. New Phytologist 192, 939-951.
Gaastra P. (1959) Photosynthesis of crop plants as influenced by light, carbon
dioxide, temperature, and stomatal diffusion resistance. Mededelingen van
Landbouwhogeschool te Wageningen, Nederland 59, 1-68.
Gallé A. & Flexas J. (2010) Gas exchange and chlorophyll fluorescence
measurements in grapevine leaves in the field. In: Methodologies and Results
in Grapevine Research. (Eds Serge Delrot, Hipóito Medrano, Etti Or, Luigi
Bavaresco, Stella Grando) pp. 107-121. Springer, Berlin.
Galmés J., Conesa M.A., Ochogavia J.M., Perdomo J.A., Francis D.M., Ribas-
Carbó M., Savé R., Flexas J., Medrano H. & Cifre J. (2011). Physiological and
morphological adaptations in relation to water use efficiency in Mediterranean
accessions of Solanum lycopersicum. Plant, Cell & Environment 34, 245-260.
Galmés J., Flexas J., Keys A.J., Cifre J., Mitchell R.A.C., Madgwick P.J., Haslam
R.P., Medrano H. and Parry M.A.J. (2005) Rubisco specificity factor tends to
be larger in plant species from drier habitats and in species with persistent
leaves. Plant, Cell & Environment 28, 571-579.
Galmés J., Medrano H. & Flexas J. (2006) Acclimation of Rubisco specificity
factor to drought in tobacco: discrepancies between in vitro and in vivo
estimations. Journal of Experimental Botany 57, 3659-3667.

References List
109
Galmés J., Ribas-Carbó M., Medrano H. & Flexas J. (2007). Response of leaf
respiration to water stress in Mediterranean species with different growth
forms. Journal of Arid Environments 68, 206-222.
Gaudillère J.P., van Leeuwen C. & Ollat N. (2002) Carbon isotope composition of
sugars in grapevine, and integrated indicator of vineyard water status. Journal
of Experimental Botany 53, 757-763.
Genty B., Briantais J.M. & Baker N.R. (1989) The relationship between the
quantum yield of photosynthetic electron transport and quenching of
chlorophyll fluorescence. Biochimica et Biophysica Acta 990, 87-92.
Genty B., Meyer S., Piel C., Badeck F. & Liozon R. (1998) CO2 diffusion inside
leaf mesophyll of ligneous plants. In Photosynthesis: Mechanisms and Effects
(ed.G. Garab). Kluwer Academic Publishers, Dordrecht, the Netherlands. pp.
3961-3967.
Gessler A., Tcherkez G., Karyanto O., Keitel C., Ferrio J.P., Ghashghaie J.,
Kreuzwieser J. & Farquhar G.D. (2009) On the metabolic origin of the carbon
isotope composition of CO2 evolved from darkened light-acclimated leaves in
Ricinus communis. The New Phytologist 181, 374-386.
Gibberd, M.R., Walker, R.R., Blackmore, D.H. and Condon, A.G. (2001).
Transpiration efficiency and carbon-isotope discrimination of grapevines
grown under well-watered conditions in either glasshouse or vineyard.
Australian Journal of Grape and Wine Research 7, 110-117.
Gillon J.S. & Yakir D. (2000) Internal conductance to CO2 diffusion and C18OO
discrimination in C3 leaves. Plant Physiology 123, 201-213.
Gómez-Alonso S. & García-Romero E. (2010). Effect of irrigation and variety on
oxygen (δ18O) and carbon (δ13C) stable isotope composition of grapes
cultivated in a warm climate. Australian Journal of Grape and Wine Research
16, 283-289.
Gómez-del-Campo M., Baeza P., Ruiz C. & Lissarrague J.R. (2004) Water-stress
induced physiological changes in leaves of four container-grown grapevine
cultivars (Vitis vinifera L.). Vitis 43, 99-105.
Gorton H.L., Herbert S.K. & Vogelmann T.C. (2003) Photoacoustic analysis
indicates that chloroplast movement does not alter liquid-phase CO2 diffusion
in leaves of Alocasia brisbanensis. Plant Physiology 132, 1529-1539.

References List
110
Grassi G. & Magnani F. (2005) Stomatal, mesophyll conductance and
biochemical limitations to photosynthesis as affected by drought and leaf
ontogeny in ash and oak trees. Plant, Cell & Environment 28, 834-849.
Gregory P.J. (2004) Agronomic approaches to increasing water use efficiency. In:
Water use efficiency in plant biology. Ed. M.A. Bacon (Blackwell Publishing
Ltd.: Oxford) pp. 142-167.
Gutknecht J., Bisson M.A. & Tosteson F.C. (1977) Diffusion of carbon dioxide
through lipid bilayer membranes. Journal of General Physiology 69, 779-794.
Guy R.D., Fogel M.L. & Berry J.A. (1993) Photosynthetic fractionation of the
stable isotopes of oxygen and carbon. Plant Physiology 101, 37-47.
Hanba Y.T., Miyazawa S.-I., Kogami H. & Terashima I. (2001) Effects of leaf
age on internal CO2 transfer conductance and photosynthesis in tree species
having different types of shoot phenology. Australian Journal Plant
Physiology 28, 1075-1084.
Hanba Y.T., Shibasaka M., Hayashi Y., Hayakawa T., Kasamo K., Terashima I. &
Katsuhara M. (2004) Overexpression of the barley aquaporin HvPIP2;1
increases internal CO2 conductance and CO2 assimilation in the leaves of
transgenic rice plants. Plant Cell Physiology 45, 521-529.
Harley P.C., Loreto F., Di Marco G. & Sharkey T.D. (1992) Theoretical
considerations when estimating the mesophyll conductance to CO2 flux by the
analysis of the response of photosynthesis to CO2. Plant Physiology 98, 1429-
1436.
Hassiotou F., Ludwig M., Renton M., Veneklaas E.J. & Evans J.R. (2009)
Influence of leaf dry mass per area, CO2, and irradiance on mesophyll
conductance in sclerophylls, Journal of Experimental Botany, 60 2303-2314.
Hassiotou F., Renton M., Ludwig M., Evans JR. & Veneklaas EJ. (2010).
Photosynthesis at an extreme end of the leaf trait spectrum: how does it relate
to high leaf dry mass per area and associated structural parameters?. Journal
of Experimental Botany 61, 3015-3028.
Hatch, M.D. (1987) C4 photosynthesis: A unique blend of modified biochemistry,
anatomy and ultrastructure. Biochimica et Biophysica Acta 895, 81-106.

References List
111
Heckwolf M., Pater D., Hanson D.T. & Kaldenhoff R. (2011) The Arabidopsis
thaliana aquaporin AtPIP1;2 is a physiologically relevant CO2 transport
facilitator. The Plant Journal 67, 795-804.
Herzog K.M., Thum R., Kronfub G., Heldstab H.J. & Hasler R. (1998) Patterns
and mechanisms of transpiration in a large subalpine Norway spruce (Picea
abies (L.) Karst.). Ecology Research 13, 105-116.
Hobbie E.A., Gregg J., Olszyk D.M., Rygiewicz P.T. & Tingey D.T. (2002)
Effects of climate change on labile and structural carbon in Douglas-fir
needles as estimated by 13C and Carea measurements. Global Change
Biology 8, 1072-1084.
Howard A.R. & Donovan L.A. (2007) Helianthus nighttime conductance and
transpiration respond to soil water but not nutrient availability. Plant
Physiology 143, 145-155.
Huang X., Lakso A. & Eissenstat D. (2005) Interactive effects of soil temperature
and moisture on Concord grape root respiration. Journal of Experimental
Botany 56, 2651-2660.
Hubick K.T. & Farquhar G.D. (1989) Carbon isotope discrimination and the ratio
of carbon gained to water lost in barley cultivars. Plant, Cell & Environment
12, 795-804.
Hunter J.J. (2000) Implications of seasonal management and growth
compensation in grapevine. South African Journal for Enology and
Viticulture 21, 81-91.
Hunter J.J., Ruffner H.P., Volschenk C.G. & Le Roux D.J. (1995) Partial
defoliation of Vitis vinifera L. cv. Cabernet Sauvignon/99 Richter: Effect on
root growth, canopy efficiency, grape composition and wine quality. American
Journal for Enology and Viticulture 46, 30.6-314.
Hurry V., Igamberdiev A.V., Keerberg O., Pärnik T., Atkin O.K., Zaragiza-
Castells J. & Gordeström P. (2005) Respiration in photosynthetic cells: gas
exchange components, interactions with photorespirationand the operation of
mitochondria in the light. In: Plant respiration: from cell to ecosystem.
Springer, Netherlands 18, 44-58.
Impa, SM., Nadaradjan, S., Boominathan, P., Shashidhar, G., Bindumadhava, H.
and Sheshshayee, MS. (2005). Carbon isotope discrimination accurately

References List
112
reflects variability in WUE measured at a whole plant level in rice. Crop
Science 45, 2517-2522.
Intrieri C., Poni S., Rebucci B. & Magnanini E (1997) Effects of canopy
manipulations on whole-vine photosynthesis: results from pot and field
experiments. Vitis 36, 167-173.
IPCC (2008) Climate change and water. In: IPCC Tech. Paper VI (Eds. B.C.
Bates, Z.W. Kundzewicz, S. Wu, J.P. Palutikof) (IPCC Secretariat, Geneva).
Johanson U., Karlsson M., Johansson I., Gutavsson S., Sjovall S., Frayss L., Weig
A.R., & Kjellbom P. (2001) The complete set of genes encoding major
intrinsic proteins in Arabidopsis provides a framework for a new
nomenclature for major intrinsic proteins in plants. Plant Physiology 126,
1358-69.
Johnson H. (1985). The World Atlas of Wine. 3rd ed., Simon and Schuster, New
York.
Johnson G.N., Young A.J., Scholes J.D. & Horton P. (1993) The dissipation of
excess excitation energy in British plant species. Plant, Cell & Environment
16, 673-679.
Jones H.G. & Slatyer R.O. (1972) Effects of intercellular resistances on estimates
of the intracellular resistance to CO2 uptake by plant leaves. Australian
Journal of Biological Sciences 25, 443-453.
Jones H.G. (1985) Partitioning stomatal and non-stomatal limitations to
photosynthesis. Plant and Cell Environment 8, 95-104.
Kanevski I., Maliga P., Rhoades D.F. & Gutteridge S. (1999) Plastome
engineering of ribulose-1,5-bisphosphate carboxylase/ oxygenase in tobacco
to form a sunflower large subunit and tobacco small subunit hybrid. Plant
Physiology 119, 133-141.
Kautsky H., Appel W. & Amann H. (1960) Chlorophyll fluorescenz und
Kohlensaure assimilation .13. Die Fluorescenzkurve und die Photochemie der
Pflanze. Biochemische Zeitschrift 332, 277-292.
Kavanagh K.L., Pangle R. & Schotzko A. (2007) Nocturnal transpirationcausing
disequilibrium between soil and stem predawn water potential in mixed
conifer forests of Idaho. Tree Physiology 4, 621-629.

References List
113
Kebeish R., Niessen M., Thiruveedhi K., Bari R., Hirsch H.J., Rosenkranz R.,
Stäbler N., Schönfeld B., Kreuzaler F. & Peterhänsel C. (2007) Chloroplastic
photorespiratory bypass increases photosynthesis and biomass production in
Arabidopsis thaliana. Nature Biotechnology 25, 593-599.
Kerstiens G. (1995) Cuticular water permeance of European trees and shrubs
grown in polluted and unpolluted atmospheres, and its relation to stomatal
response to humidity in beech (Fagus sylvatica L.). New Phytologyst 129,
495-503.
Kjellbom P., Larsson C., Johansson I.I. , Karlsson M. & Johanson U. (1999)
Aquaporins and water homeostasis in plants. Trends in Plant Science 308-314.
Koerber G.R., Hill P.W., Jones G.E. & Jones D.L. (2010) Estimating the
component of soil respiration not dependent on living plant roots: Comparison
of the indirect y-intercept regression approach and direct bare plot approach.
Soil Biology and Biochemistry 42, 1835-1841.
Kogami H., Hanba Y.T., Kibe T., Terashima I. & Mazusawa T. (2001) CO2
transfer conductance, leaf structure and carbon isotope composition of
Polygonum cuspidatum leaves from low and high altitudes. Plant, Cell &
Environment 24, 529-538.
Köppen W. (1923). De klimate der Erde. Bornträger, Berlin. 369 pp.
Kostner B., Granier A. & Cermak J. (1998) Sapflow measurement in forest
stands: methods and uncertainties. Annals of Forest Science 55, 13-27.
Koundouras S., Tsialtas LT., Zioziou E. & Nikolaou N. (2008) Rootstock effects
on the adaptive strategies of grapevine (Vitis vinifera L. cv. Cabernet
Sauvignon) under contrasting water status: Leaf physiological and structural
responses. Agriculture, Ecosystems and Environment 128, 86-96.
Laing W.A., Ögren W.L. & Hageman R.H. (1974). Regulation of soybean net
photosynthetic CO2 fixation by the interaction of CO2, O2 and ribulose-1,5-
bisphosphate carboxylase. Plant Physiology 54, 678-685.
Laisk A., Eichelmann H., Oja V., Rasulov B., Padu E., Bichele I., Pettai H. &
Kull O. (2005) Adjustment of leaf photosynthesis to shade in a natural
canopy: rate parameters. Plant, Cell & Environment 28, 375-388.
Laisk, A.K. (1977). Kinetics of photosynthesis and photorespiration in C3-plants.
[In Russian] Nauka, Moscow.

References List
114
Laisk A. & Loreto F. (1996) Determining photosynthetic parameters from leaf
CO2 exchange and chlorophyll fluorescence. Plant Physiology 110, 903-912.
Lambers H., Chapin F.S.III & Pons T.L. (1998) Plant Physiological Ecology.
Springer-Verlag, New York.
Lambers H., Pons T.L., Chapin III F.S. (2008) Respiration. In: Plant
Physiological Ecology. 2nd edition. Springer, New York.
Lasceve G., Leymarie J. & Vavasseur A. (1997) Alterations in light-induced
stomatal opening in a starch-deficient mutant of Arabidopsis thaliana L.
deficient in chloroplast phosphoglucomutase activity. Plant, Cell &
Environment 20, 350-358.
Laureano R.G., Lazo Y.O., Linares J.C., Luque A., Martínez F., Seco J.I. &
Merino J. (2008). The cost of stress resistance: construction and maintenance
costs of leaves and roots in two population of Quercus ilex. Tree Physiology
28, 1721-1728.
Lauteri M., Scartazza A., Guido M.C. & Brugnoli E. (1997) Genetic variation in
photosynthetic capacity, carbon isotope discrimination and mesophyll
conductance in provenances of Castanea sativa adapted to different
environments. Functional Ecology 11, 675-683.
Lelièvre F., Seddaiu G., Ledda L., Porqueddu C. & Volaire F. (2011). Water use
efficiency and drought survival in Mediterranean perennial forage grasses.
Field Crops Research 121, 333-342.
Leymarie J., Lasceve G. & Vavasseur A. (1999) Elevated CO2 enhances stomatal
responses to osmotic stress and abscisic acid in Arabidopsis thaliana. Plant,
Cell & Environment 22, 301-308.
Lloyd J., Syvertsen J.P., Kriedeman P.E. & Farquhar G.D. (1992) Low
conductances for CO2 diffusion from stomata to the sites of carboxylation in
leaves of woody species. Plant, Cell & Environment 15, 873-899.
Loftfield J.V.G. (1921) The Behavior of Stomata, Vol 314. Carnegie Institution,
Washington, DC.
Long S.P. & Bernachi C.J. (2003) Gas exchange measurement, what can they tell
us about underlying limitations to photosynthesis? Procedures and sources of
error. Journal Experimental Botany 54, 2393-2401.

References List
115
Long S.P., Zhu X.G., Naidu S.L. & Ort D.R. (2006) Can improvement in
photosynthesis increase crop yields? Plant, Cell & Environment 29, 315-330.
Loreto F., Centritto M. & Chartzoulakis K. (2003) Photosynthetic limitations in
olive cultivars with different sensitivity to salt stress. Plant, Cell &
Environment 26, 595-601.
Loreto F., Harley P.C., Di Marco G. & Sharkey T.D. (1992) Estimation of
mesophyll conductance to CO2 flux by three different methods. Plant
Physiology 98, 1437-1443.
Ludwig F., Jewitt R.A. & Donovan L.A. (2006) Nutrient and water addition
effects on day- and night-time conductance and transpiration in a C3 desert
annual. Oecologia 148, 219-225.
Maroco J.P., Rodrígues M.L., Lopes C. & Chaves M.M. (2002) Limitations to
leaf photosynthesis in field-grown grapevine under drought –metabolic and
modelling approaches. Functional Plant Biology 29, 451-459.
Martinelli L.A., Almeida S., Brown I.F., Moreira M.Z., Victoria R.L., Sternberg
L.S.L., Ferreira C.A.C. & Thomas W.W. (1998) Stable carbon isotope ratio of
tree leaves, boles and fine litter in a tropical forest in Rondonia, Brazil.
Oecologia 114, 170-179.
Martre P., Morillon R., Barrieu F., North G. B., Nobel P. S. & Chrispeels M. J.
(2002) Plasma membrane aquaporins play a significant role during recovery
from water deficit. Plant Physiology 130, 2101-2110.
Matile P., Hörtensteiner S. & Thomas H. (1999) Chlorophyll degradation. Annual
Review of Plant Physiology and Plant Molecular Biology 50, 67-95.
Matthews M.A., Ishii, R., Anderson, M.M. & O'Mahony, M. (1990) Dependence
of wine sensory attributes on vine water status. Journal of the Science of Food
and Agriculture 51, 321-335.
Maxwell D.P., Wang Y. & McIntosh L. (1999) The alternative oxidase lowers
mitochondrial reactive oxygen production in plant cells. Proceedings of the
National Academy of Sciences, USA 96, 8271-8276.
McCree K.J. (1986). Measuring the whole-plant daily carbon balance.
Photosynthetica 20, 82–93.
Medrano H., Escalona J.M., Cifre J., Bota J. & Flexas J. (2003) A ten-year study
on the physiology of two Spanish grapevine cultivars under field conditions:

References List
116
effects of water availability from leaf photosynthesis to grape yield and
quality. Functional Plant Biology 30, 607-619.
Medrano H., Flexas J. & Galmés J. (2009). Variability in water use efficiency at
the leaf level among Mediterranean plants with different growth forms. Plant
& Soil 317, 17-29.
Medrano H., Flexas J., Ribas-Carbó M. & Gulías J. (2010) Measuring water use
efficiency in grapevines. In: Methodologies and Results in Grapevine Research. (Eds
Serge Delrot, Hipóito Medrano, Etti Or, Luigi Bavaresco, Stella Grando) pp. 57-
70. Springer, Berlin.
Medrano H., Pou A., Tomás M., Martorell S., Gulías J., Flexas J. & Escalona J.M.
(2012) Average daily light interception determines leaf water use efficiency
among different canopy locations in grapevine. Agricultural water
management (submitted).
Meyer M., Seibt U. & Griffiths H. (2008) To concentrate or ventilate? Carbon
acquisition, isotope discrimination and physiological ecology of early land
plant life forms. Philosophical Transactions of the Royal Society B: Biological
Sciences 363, 2767-2778.
Miller P.C. & Stoner W.A. (1979) Canopy structure and environmental
interactions. In: Topics in plant population biology. Solbrig O.T., Jain S.,
Johnson G.B. & Raven P.H. (eds.). Columbia University Press, New York, pp.
428 - 458.
Miller P.C. (1983) Canopy structure of Mediterranean-type shrubs in relation to
heat and moisture. In: Kruger, F. J.; Mitchell, D. T. & Jarvis, J. U. M. (eds.).
Mediterranean-type Ecosystems. The Role of Nutrients. Springer-Verlag,
Berlin.
Miyazawa S.I. & Terashima I. (2001) Slow development of leaf photosynthesis in
an evergreen broad-leaved tree, Castanopsis sieboldii: relationships between
leaf anatomical characteristics and photosynthetic rate. Plant, Cell &
Environment 24, 279- 291.
Miyazawa S.I., Yoshimura S., Shinzaki Y., Masaypshi M. & Miyake C. (2008)
Deactivation of aquaporins decreases internal conductance to CO2 diffusion in
tobacco leaves grown Ander long-term drought. Functional Plant Biology 35,
553-564.

References List
117
Møller I.M. (2001) Plant mitochondria and oxidative stress: Electron transport,
NADPH turnover, and metabolism of reactive oxygen species. Annual Review
of Plant Physiology and Plant Molecular Biology 52, 561-591.
Monteiro A. & Lopes C.M. (2007) Influence of cover crop water use and
performance of vineyard in Maditerranean Portugal. Agriculture, Ecosystems
and Environment 121, 336-342.
Mook W.G., Bommerson J.C.& Staverman W.H. (1974) Carbon isotope
fractionation between dissolved bicarbonate and gaseous carbon dioxide.
Earth and Planetary Science Letters 22, 169-176.
Mooney H.A. (1982) Mediterranean-type Ecosystems: Research progress and
opportunities. South African Journal of Science 78, 5-7.
Morison, J.I.L., Baker, N.R., Mullineaux, P.M. and Davies, W.J. (2008).
Improving water use in crop production. Philosophical Transactions of the
Royal Society of London Series B 363, 639-658.
Moutinho-Pereira J.M., Correia C.M., Gonçalves B.M., Bacelar E.A. & Torres-
Pereira J.M. (2004) Leaf gas exchange and water relations of grapevines
grown in three different conditions. Photosynthetica 42, 81-86.
Muchow R.C., Ludlow M.M., Fisher M.J. & Myers R.J.K. (1980) Stomatal
behaviour of kenaf and sorghum in a semiarid tropical environment. I. During
the night. Australian Journal of Plant Physiology 7, 609-619.
Mullins M.G., Bouquet A. & Williams L.E. (1992) Biology of the Grapevine.
Cambridge University Press, Cambridge.
Netzer Y., Yao C., Shenker M., Bravdo B., Schwartz A., & Cohen S. (2005)
Water consumption of ‘Superior’ Grapevines Grown in a Semiarid Region.
Acta Horticulturae 689, ISHS 2005.
Niinemets Ü. & Reichstein M. (2003a) Controls on the emission of plant volatiles
through stomata: sensitivity or insensitivity of the emission rates to stomatal
closure explained. Journal of Geophysical Research 108, 4208.
doi:4210.1029/2002JD002620.
Niinemets Ü. & Reichstein M. (2003b) Controls on the emission of plant volatiles
through stomata: a sensitivity analysis. Journal of Geophysical Research 108,
4211. doi:4210.1029/2002JD002626.
Niinemets U., Cescatti A., Rodeghiero M. & Tosens T. (2006) Complex
adjustments of photosynthetic potentials and internal diffusion conductance to

References List
118
current and previous light availabilities and leaf age in Mediterranean
evergreen species Quercus ilex. Plant, Cell & Environment 28, 1552-1566.
Niinemets Ü., Diaz-Espejo A., Flexas J., Galmes J. & Warren C.R. (2009a) Role
of mesophyll diffusion conductance in constraining potential photosynthetic
productivity in the field. Journal of Experimental Botany 60, 2249-2270.
Niinemets Ü., Wright I.J. & Evans J.R. (2009b) Leaf mesophyll diffusion
conductance in 35 Australian sclerophylls covering a broad range of foliage
structural and physiological variation. Journal of Experimental Botany 60,
2433-2449.
Nobel P.S. (1991) Physicochemical and Environmental Plant Physiology 4th edn.
Academic Press, Inc., San Diego, CA, USA.
Norby R.J., Edwards N.T., Riggs J.S., Abner C.H., Wullschleger S.D. &
Gunderson C.A. (1997). Temperature-controlled open-top chambers for global
change research. Global Change Biology 3, 259-267.
Norman J.M., Garcia R. & Verma S.B. (1992) Soil surface CO2 fluxes and the
carbon budget of a grassland. Journal of Geophysical Research 97, 18845-
18853.
O'Leary M.H. (1981) Carbon isotope fractionation in plants. Phytochemistry 20,
553-567.
O’Leary M.H., Madhavan S. & Apneth P. (1992) Physical and chemical basis of
carbon isotope fractionation in plants. Plant, Cell & Environment 15, 1099-
1104.
OIV, Organisation Internationale de la Vigne et du Vin. (2011) Balance sobre la
situación de la vitivinicultura mundial en 2010. 34° Congreso Mundial de la
Viña y el Vino, Oporto (Portugal).
Oren R., Sperry J.S., Ewers B.E., Pataki D.E., Phillips N. & Megonigal J.P.
(2001) Sensitivity of mean canopy stomatal conductance to vapor pressure
deficit in flooded Taxodium distichum L. forest: hydraulic and nonhydraulic
effects. Oecologia 126, 21-29.
Parry M.A.J., Flexas J. and Medrano H. (2005) Prospects for crop production
under drought: research priorities and futures directions. Annals of Applied
Biology 147, 211-226.

References List
119
Parry M.A.J., Madgwick P.J., Carvalho J.F.C. & Andralojc P. J. (2007) Prospects
for increasing photosynthesis by overcoming the limitations of Rubisco.
Journal of Agricultural Science 145, 31-43.
Paskoff R. P. (1973) Geomorphological processes and characteristics land-forms
in the Mediterranean Regions of the World. In: Di Castri, F. & Mooney, H. A.
(eds). Mediterranean Type Ecosistems: Origin and structure. Springer-Verlag,
New York. pp 405.
Passioura J.B. (1996) Drought and drought tolerance. Plant Growth Regulation
20, 79-83.
Patakas A., Kofidis G. & Bosabalidis A.M. (2003) The relationship between CO2
transfer mesophyll resistance and photosynthetic efficiency in grapevine
cultivars. Scientia Horticulturae 97, 255- 263.
Peguero-Pina J.J., Flexas J., Galmés J., Sancho-Knapik D., Barredo G., Villarroya
D., Gil-Pelegrín E. (2012) Leaf anatomical properties in relation to
differences in mesophyll conductance to CO2 and photosynthesis in two
related Mediterranean Abies species. Plant, Cell & Environment (accepted)
Peña-Rojas K., Aranda X., Joffre R. & Fleck I. (2005) Leaf morphology,
photochemistry and water status changes in resprousting Quercus ilex during
drought. Functional Plant Biology 32, 117-130.
Penning de Vries F.W.T., Brunsting A.H.M., & Van Laar H. H. (1974) Products,
requirements and efficiency of biosynthesis: a quantitative approach. Journal
of Theoretical Biology 45, 339-377.
Penning de Vries F.W.T., Jansen D.M., ten Berge H.F.M. & Bakema A. (1989)
Simulation of ecophysiological processes of growth in several annual crops.
Wageningen, The Netherlands: Centre for Agricultural Publishing and
Documentation.
Pérez-Martín A., Flexas J., Ribas-Carbó M., Bota J., Infante J.M. & Díaz-Espejo
A (2009) Interactive effects of soil water deficit and air vapour pressure deficit
on mesophyll conductance to CO2 in Vitis vinifera and Olea europaea.
Journal of Experimental Botany 60, 2391-2405.
Pérez P., Rabnecz G., Laufer Z., Gutiérrez D., Tuba Z. & Martínez-Carrasco R.
(2011) Restoration of photosystem II photochemistry and carbon assimilation
and related changes in chlorophyll and protein contents during the rehydration

References List
120
of desiccated Xerophyta scabrida leaves. Journal of Experimental Botany 62,
895-905.
Perez Peña, J.E., Tarara, J. (2004). A portable whole canopy gas exchange system
for several mature field-grown grapevines. Vitis 43, 7-14.
Peterhansel C., Niessen M. & Kebeish R.M. (2008) Metabolic engineering
towards the enhancement of photosynthesis. Photochemistry and
Photobiology 84, 1317-1323.
Petrie, P.R., Trought, M.C.T., Howell, G.S., Buchan, G.D. (2003). The effect of
leaf removal and canopy height on whole-vine gas exchange and fruit
development of Vitis vinifera L. Sauvignon Blanc Functional Plant Biology
30, 711-717.
Petrie P.R., Trought M.C.T., Howell G.S., Buchan G.D.& Palmer J.W. (2009)
Whole-canopy gas exchange and light interception of vertically trained Vitis
vinifera L. under direct and diffuse light. American Journal of Enology and
Viticulture 60, 173-182.
Piel C., Frak E., Le Roux X. & Genty B. (2002) Effect of local irradiance on CO2
transfer conductance of mesophyll in walnut. Journal of Experimental Botany
53, 2423-2430.
Poni, S., Bernizzoni, F., Civardi, S., Gatti, M., Porro, D. and Camin, F.(2009).
Performance and water-use efficiency (single-leaf vs. whole-canopy) of well-
watered and half-stressed split-root Lambrusco grapevines grown in Po Valley
(Italy). Agriculture, Ecosystems & Environment 129, 97-106.
Poorter H. & Bergkotte M. (1992) Chemical composition of 24 wild species
differing in relative growth rate. Plant, Cell & Environment 15, 221-229.
Poorter H., Gifford R.M., Kriedemann P.E. & Wong S.C. (1992) A quantitative
analysis of dark respiration and carbon content as factors in the growth
response of plants to elevated CO2. Australian Journal of Botany 40, 501-513.
Poorter H., Niinemets Ü., Poorter L., Wright IJ. & Villar R. (2009) Causes and
consequences of variation in leaf mass per area (LMA): a meta-analysis. New
Phytologist 182, 565-588.
Poorter, H. (1994) Construction costs and payback time of biomass: A whole
plant perspective. In: A whole plant perspective on carbon-nitrogen

References List
121
interactions, J. Roy & E. Garnier (eds.). SPB Academic Publishing, The
Hague, pp. 111 - 127.
Pou A., Flexas J., Alsina M.M., Bota J., Carambula C., de Herralde F., Galmés J.,
Lovisolo C., Jiménez M., Ribas-Carbo M., Rusjan D., Secchi F., Tomàs M.,
Zsófi Z. & Medrano H. (2008) Adjustments of water-use efficiency by
stomatal regulation during drought and recovery in the drought-adapted Vitis
hybrid Richter-110 (V. berlandieri x V. rupestris). Physiologia Plantarum
134, 313-323.
Pou A., Gulias J., Moreno M., Tomás M., Medrano H. & Cifre J. (2011) The use
of cover crops on Vitis vinifera L. cv. Manto Negro under Mediterranean
conditions: effects on plant vigour, grape productions and quality. Journal
International Des Sciences de la Vigne Et Du Vin 4, 223-234.
Pou A., Medrano H., Tomás M., Martorell S., Ribas-Carbó M & Flexas J. (2012)
An anisohydric grapevine variety performs better under moderate water stress
and recovery than isohydric varieties. Plant & Soil, DOI: 10.1007/s11104-
012-1206-7.
Price D., von Caemmerer S., Evans J.R., Yu J.W., Lloyd J., Oja V., Kell P.,
Harrison K., Gallagher A. & Badger M. (1994) Specific reduction of
chloroplast carbonic anhydrase activity by antisense RNA in transgenic
tobacco plants has a minor effect on photosynthetic CO2 assimilation. Planta
193, 331-340.
Prieto J.A., Lebon E. & Ojeda H. (2010) Stomatal behavior of different grapevine
cultivars in response to soil water status and air water vapor pressure deficit.
Journal International des Sciences de la Vigne et du Vin 44, 9-20.
Purvis A.C. & Shewfelt R.L. (1993) Does the alternative pathway ameliorate
chilling injury in sensitive plant tissues? Physiologia Plantarum 88, 712-718.
Rambal S. (2001) Hierarchy and productivity of Mediterranean-type ecosystems.
In: Global terrestrial productivity (eds J. Roy, B. Saugier and H.A. Mooney),
pp. 315-344. Academic Press, San Diego.
Rawson H.M. & Clarke J.M. (1988) Nocturnal transpiration in wheat. Australian
Journal of Plant Physiology 15, 397-406.
Read J.J., Johnson D.A., Asay K.H. & Tieszen L.L. (1991) Carbon isotope
discrimination, gas exchange, and water-use efficiency in Creasted
Wheatgrass clones. Crop Science 31, 1203-1208.

References List
122
Rijsberman F. (2004) Water scarcity–fact or fiction? In New Directions for a
Diverse Planet. 4th International Crop Science Congress, Brisbane, Australia,
26 September–11October, 2004 (eds R. A. Fischer, N. Turner, J. Angus, L.
McIntyre, M. Robertson, A. Borrell & D. Lloyd).
Ripley B.S., Gilbert M.E., Ibrahim D.G. & Osborne C.P. (2007) Drought
constraints on C4 photosynthesis: stomatal and metabolic limitations in C3
and C4 subspecies of Alloteropsis semialata. Journal of Experimental Botany
58, 1351-1363.
Roeske C.A. & O’Leary M.H. (1984) Carbon isotope effects on the enzyme-
catalyzed carboxylation of ribulose bisphosphate. Biochemistry 23, 6275-
6284.
Rogiers S., Greer D.H., Hutton R.J. & Clarke S.J. (2011) Transpiration efficiency
of the grapevine cv. Semillon is tied to VPD in warm climates. Annals of
Applied Biology 158, 106-114.
Rogiers S.Y., Greer D.-H., Hutton R.J. & Landsberg J.J. (2009) Does night-time
transpiration contribute to anisohydric behaviour in a Vitis vinifera cultivar?.
Journal of Experimental Botany 60, 3751-3763.
Romero P., Fernández-Fernández J.I. & Martinez-Cutillas A. (2010)
Physiological Thresholds for Efficient Regulated Deficit-Irrigation
Management in Wine grapes Grown under Semiarid Conditions. American
Journal of Enology and Viticulture 61, 300-312.
Rondeau-Mouro C., Defer D., Leboeuf E. & Lahaye M. (2008) Assessment of cell
wall porosity in Arabidopsis thaliana by NMR spectroscopy. International
Journal of Biological Macromolecules 42, 83-92.
Roux D.L., Stock W.D., Bond W.J. & Maphanga D. (1996) Dry mass allocation,
water use efficiency and d13C in clones of Eucalyptus grandis, E. grandis x
camaldulensis and E. grandis x nitens grown under two irrigation regimes.
Tree Physiology 16, 497-502.
Running S.W. (1976) Environmental control of leaf water conductance in
conifers. Journal of Forest Research 6, 104-112.
Ryan, M.G., Binkley, D., & Fownes, J.H. (1997) Age-related decline in forest
productivity: pattern and process. Advances in Ecological Research 27, 213-
262.

References List
123
Sakurai J., Ishikawa F., Yamaguchi T., Uemura M., & Maeshima M. (2005)
Identification of 33 rice aquaporin genes and analysis of their expression and
function. Plant and Cell Physiology 46, 1568-1577.
Samsuddin Z. & Impens I. (1979) Photosynthesis and difusión resistances to
carbon dioxide in Hevea brasiliensis muel. agr. clones. Oecologia 37, 361-
363.
Santos T.P., Lopes C.M., Rodrigues M.L., de Souza C.R., Maroco J.P., Pereira
J.S., Silva J.R. & Chaves M.M. (2003) Partial rootzone drying: effects on
growth and fruit quality of field-grown grapevines (Vitis vinifera). Functional
Plant Biology 30, 663-671.
Santos T., Lopes C.M., Rodrigues M.L., Souza, C.R., Maroco J., Pereira J.S.,
Silva J.R., Chaves M.M (2007) Partial rootzone drying irrigation affects
cluster microclimate improving fruit composition of ‘Moscatel’ field-grown
grapevines. Scientia Horticulturae 112, 321-330.
Scafaro A.P., Von Caemmerer S., Evans J.R. & Atwell B. (2011) Temperature
response of mesophyll conductance in cultivated and wild Oryza species with
contrasting mesophyll cell wall thickness. Plant, Cell and Environment 34,
1999-2008.
Scartazza A.,Lauteri M., Guido M.C. & Brugnoli E. (1998) Carbon isotope
discrimination in leaf and stem sugars, water-use efficiency and mesophyll
conductance during different developmental stages in rice subjected to
drought.Australian Journal of Plant Physiology 25, 489-498.
Scholz F.G., Bucci S.J., Goldstein G., Meinzer F.C., Franco A.C. & Miralles-
Wilhelm F. (2007) Removal of nutrient limitations by long-term fertilization
decreases nocturnal water loss in savanna trees. Tree Physiology 27, 551-559.
Schreiber U., Bilger W., Hormann H. & Neubauer C. (1998) Chlorophyll
fluorescence as a diagnostic tool: basics and some aspects of practical
rellevance. In: Raghavendra AS, ed. Photosynthesis. A comprehensive
treatise. Cambridge University Press, 320-336.
Schultz H.R. (2000) Climate Change and viticulture: A European perspective on
climatology, carbon dioxide and UV-B effects. Australian Journal of Grape
and Wine Research 6, 2-112.

References List
124
Schultz H.R. (2003). Differences in hydraulic architecture account for near-
isohydric and anisohydric behaviour of two field-grown Vitis vinifera L.
cultivars during drought. Plant, Cell & Environment 26, 1393-1405.
Schultz, H.R. & Stoll M. (2010). Some critical issues in environmental physiology
of grapevines: future challenges and current limitations. Australian Journal of
Grape and Wine Research 16, 4-24.
Schwabe W.W. (1952) Effects of photoperiodic treatment on stomatal movement.
Nature 169, 1053-1054.
Shao G.C., Liu N., Zhang Z.Y., Yu S.E. & Chen C.R. (2010). Growth, yield and
water use efficiency response of greenhouse-grown hot pepper under Time-
Space deficit irrigation. Scientia Horticulturae 126, 172-179.
Sharkey T.D., Bernachi C.J., Farquhar G.D. & Singsaas E.L. (2007) Fotting
photosynthetic carbon dioxide response curves for C3 leaves. Plant Cell and
Environment 30, 1035-1040.
Sharkey T.D., Vassey T.L., Vanderveer P.J. & Vierstra R.D. (1991) Carbon
metabolism enzymes and photosynthesis in transgenic tobacco (Nicotiana
tabaccum L.) having excess phytochrome. Planta 185, 287-296.
Sharma-Natu P. & Ghildiyal M.C. (2005) Potential targets for improving
photosynthesis and crop yield. Current Science 88, 1918-1928.
Sharpe P.J.H. (1973) Adaxial and abaxial stomatal resistance of cotton in the
field. Agronomy Journal 65, 570-574.
Sharwood R.E., von Caemmerer S., Maliga P. & Whitney S.M. (2008) The
catalytic properties of hybrid Rubisco comprising tobacco small and
sunflower large Subunits mirror the kinetically equivalent source Rubiscos
and can support tobacco growth. Plant Physiology 146, 83-96.
Singsaas E.L., Ort D.R. & De Lucia E.H. (2003) Elevated CO2 effects on
mesophyll conductance and its consequences for interpreting photosynthetic
physiology. Plant, Cell & Environment 27, 41-50.
Smart R.E., Dick J.K., Gravett I.M. & Fisher B.M. (1990) Canopy management to
improve grape yield and wine quality- principles and practices. South African
Journal for Enology and Viticulture 11, 3-17.

References List
125
Snyder K.A., Richards J.H. & Donovan L.A. (2003) Night-time conductance in C3
and C4 species: do plants lose water at night? Journal of Experimental Botany
54, 861-865.
Soolanayakanahally R.Y., Guy R.D., Silim S.N., Drewes E.C. & Schroeder W.R.
(2009) Enhanced assimilation rate and water use efficiency with latitude
through increased photosynthetic capacity and internal conductance in balsam
poplar (Populus balsamifera L.). Plant, Cell & Environment 32, 1821- 1832.
Souza C.R., Maroco J.P., dos Santos T.P., Rogrigues M.L., Lopes C., Pereira J.S.
& Chaves M.M. (2005) Control of stomatal aperture and carbon uptake by
déficit irrigation in two grapevine cultivars. Agricultural, Ecosystems &
Environment 106, 261-274.
Spano D., Duce P. & Snyder R.L. (2004) Estimate of Mass and energy fluxes over
Grapevine Using Eddy Covariance Technique. Acta Horticulturae 664, 631-
638.
Steer M.W. (1988) Plasma membrane turnover in plant cells. Journal of
Experimental Botany 39, 987-996.
Stoll M., Loveys B. & Dry P. (2000) Hormonal changes induced by partial
rootzone drying of irrigated grapevine. Journal of Experimental Botany 51,
1627-1634.
Sullivan C.Y. & Eastin J.D. (1974) Plant physiological responses to water stress.
Agricultural Meteorology 14, 113-127.
Sumner A.L., Hanft E., Dindal A. & Battelle J.M. (2011) Isotopic carbon
dioxideanalyzers for carbon sequestration monitoring picarro cavity ring-
down spectroscopy analyzer for isotopic CO2 - model g1101-i. In:
Environmental Technology Verification.
Syvertsen J.P., Lloyd J., McConchie C., Kriedemann P.E. & Farquhar G.D.
(1995) On the relationship between leaf anatomy and CO2 diffusion through
the mesophyll of hypostomatous leaves. Plant, Cell & Environment 18, 149-
157.
Tarara J.M., Perez Peña J.E., Schreiner R.P., Keller M. & Smithyman P. (2011).
Net carbon exchange in grapevine canopies responds rapidly to timing and
extent of regulated deficit irrigation. Functional Plant Biology 38, 386-400.

References List
126
Tazoe Y., Von Caemmerer S., Badger M.R. & Evans J.R. (2009) Light and CO2
do not affect the mesophyll conductance to CO2 diffusion in wheat leaves.
Journal of Experimental Botany 60, 2291-2301.
Tazoe Y., Von Caemmerer S., Estavillo G.M. & Evans J.R. (2011) Using tunable
diode laser spectroscopy to measure carbon isotope discrimination and
mesophyll conductance to CO2 diffusion dynamically at different CO2
concentrations. Plant, Cell & Environment 34, 580-591.
Tcherkez G., Noguues S., Bleton J., Cornic G., Badeck F. & Ghashghaie J. (2003)
Metabolic origin of carbon isotope composition of leaf dark-respired CO2 in
French bean. Plant Physiology 131, 237-244.
Terashima I. & Ono K. (2002) Effects of HgCl2 on CO2 dependence of leaf
photosynthesis: Evidence indicating involvement of aquaporins in CO2
diffusion across the plasma membrane. Plant and Cell Physiology 43, 70-78.
Terashima I., Hanba Y.T., Tazoe Y., Vyas P. & Yano S. (2006) Irradiance and
phenotype: comparative eco-development of sun and shade leaves in relation
to photosynthetic CO2 diffusion. Journal Experimental Botany 57, 343-354.
Terashima I., Hanba Y.T., Tholen D. & Niinemets Ü. (2011) Leaf functional
anatomy in relation to photosynthesis. Plant Physiology 155, 108-116.
Terashima, I. & Hikosaka, K. (1995) Comparative ecophysiology of leaf and
canopy photosynthesis. Plant Cell & Environment. 18, 1111-1128.
Thain J.F. (1983) Curvature correlation factors in the measurements of cell
surface areas in plant tissues. Journal of Experimental Botany 34, 87-94.
Tholen D. & Zhu X.G,(2011) The mechanistic basis of internal conductance: A
theoretical analysis of mesophyll cell photosynthesis and CO2 diffusion. Plant
Physiology 156, 90-105.
Tholen D., Boom C., Noguchi K., Ueda S., Katase T. & Terashima I. (2008) The
chloroplast avoidance response decreases internal conductance to CO2
diffusion in Arabidopsis thaliana leaves. Plant, Cell & Environment 31, 1688–
1700.
Tosens T., Niinemets Ü., Vislap V., Eichelmann H. & Castro-Díez P. (2011)
Developmental changes in mesophyll diffusion conductance and
photosynthetic capacity under different light and water availabilities in

References List
127
Populus tremula: how structure constrains function. Plant, Cell &
Environment 35, 839-856.
Tosens T., Niinemets Ü., Westoby M. & Wright I.J. (2012) Anatomical basis of
variation in mesophyll 1 resistance in eastern Australian sclerophylls: news of
a long and winding path. Journal of Experimental Botany (accepted)
Tournaire-Roux C., Sutka M., Javot H., Gout E., Gerbeau P., Luu D.-T., Bligny
R. & Maurel C. (2003) Cytosolic pH regulates root water transport during
anoxic stress through gating of aquaporins. Nature 425, 393-397.
Trambouze W. P. Bertuzzi M. & Voltz (1998) Comparison of methods for
estimating actual evapotranspiration in a row–cropped vineyard. Agricultural
and Forest Meteorology 91, 193-208.
Uehlein N. & Kaldenhoff R. (2008)Aquaporins and Plant Leaf Movements.
Annals of Botany 101, 1-4.
Uehlein N., Lovisolo C., Siefritz F. & Kaldenhoff R. (2003) The tobacco
aquaporin NtAQP1 is a membrane CO2 pore with physiological functions.
Nature 425, 734-737.
Uemura K., Anwaruzzaman Miyachi S. and Yokota A. (1997) Ribulose-1,5-
bisphosphate carboxylase/oxygenase from thermophilic red algae with a
strong specificity for CO2 fixation. Biochemical and Biophysical Research
Communications 233, 568-571.
Unwin T. (1991) Wine and the Vine: An Historical Geography of Viticulture and
the Wine Trade. Routledge, London and New York.
Valentini R., Epron D., De Angelis P., Matteucci G. & Dreyer E. (1995) In situ
estimation of net CO2 assimilation, photosynthetic electron flow and
photorespiration in Turkey oak (Quercus cerris L.) leaves: diurnal cycles
under different levels of water supply. Plant, Cell & Environment 18, 631-
640.
Valentini R., Matteucci G., Dolman A. J., Schulze E. D., Rebmann C., Moors E.,
Granier A., Gross P., Jensen N. O., Pilegaard K., Lindroth A., Grelle A.,
Bernhofer C., Grünwald T., Aubinet M., Ceulemans R., Kowalski A. S.,
Vesala T., Rannik U., Berbigier P., Loustau 15 D., Guomundsson J.,
Thorgeirsson H., Ibrom A., Morgenstern K., Clement R., Moncrieff J.,
Montagnani L., Minerbi S., and Jarvis P. G. (2000) Respiration as the main
determinant of carbon balance in European forests. Nature, 404, 861-865.

References List
128
Van der Werf A., Van den Berg G., Ravenstein H.J.L., Lambers H. & Eising R.
(1992) Protein turnover: A significant component of maintenance respiration
in roots? In: Molecular, biochemical and physiological aspects of plant
respiration. Lambers H. & Van der Plas L.H.W. (eds). SPB Academic
Publishing, The Hague, pp 483-492.
Vanlerberghe G.C., Day D.A., Wiskich J.T., Vanlerberghe A.E. & McIntosh L.
(1995) Alternative oxidase activity in tobacco leaf mitochondria. Plant
Physiology 109, 353-361.
Villar R. & Merino J. (2001) Comparison of leaf construction costs in woody
species with differing leaf life-spans in contrasting ecosystems. New
Phytologist 151, 213-226.
Villar R., Robleto J.R., De Jong Y., & Poorter H. (2006) Differences in
construction costs and chemical composition between deciduous and
evergreen woody species are small as compared to differences among
families. Plant, Cell & Environment 29, 1629 - 1643.
Virgona, J.M., Hubick, K.T., Rawson, H.M., Farquhar, G.D. and Downes R.W.
(1990). Genotypic variation in transpiration efficiency, carbon-isotope
discrimination and carbon allocation during early growth of sunflower.
Australian Journal of Plant Physiology 17, 207-214.
Vivin, P., Castelan-Estrada, M. and Gaudillere, J.P. (2003). Seasonal changes in
chemical composition and construction costs of grapevine tissues. Vitis 42, 5-
12.
Von Caemmerer S. & Evans J.R. (1991) Determination of the average partial
pressure of CO2 in chloroplasts from leaves of several C3 plants. Australian
Journal of Plant Physiology 18, 287-305.
Von Caemmerer S. & Evans J.R. (1991) Determination of the average partial
pressure of CO2 in chloroplasts of several C3 species. Australian Journal of
Plant Physiology 18, 287-305.
Von Caemmerer S. (2000) Biochemical Model of Leaf Photosynthesis, pp 165.
CSIRO Publishing, Canberra.
Vrabl D., Vaskov M., Hronkova M., Flexas J. & ŠantrČek J. (2009) Mesophyll
conductance to CO2 transport estimated by two independent methods: Effect

References List
129
of variable CO2 concentration and abscisic acid. Journal of Experimental
Botany 60, 2315-2323.
Warren C.R. (2006) Estimating the internal conductance to CO2 movement.
Functional Plant Biology 33, 431-442.
Warren C.R. & Adams M.A. (2006) Internal conductance does not scale with
photosynthetic capacity: implications for carbon isotope discrimination and
the economics of water and nitrogen use in photosynthesis. Plant, Cell &
Environment 29, 192-201.
Warren C.R. & Dreyer E. (2006) Temperature response of photosynthesis and
internal conductance to CO2: results from two independent approaches.
Journal of Experimental Botany 57, 3057-3067.
Warren C.R. (2008) Soil water deficits decrease the internal conductance to CO2
transfer but atmospheric water deficits do not. Journal of Experimental Botany
59, 327-334.
Warren C.R., Löw M., Matyssek R. & Tausz M. (2007) Internal conductance to
CO2 transfer of adult Fagus sylvatica: variation between sun and shade leaves
and due to free-air ozone fumigation. Environmental and Experimental Botany
59, 130- 138.
Weisiger R.A. (1998) Impact of extracellular and intracellular diffusion barriers
on transport. In: Whole Organ Approach to Cellular Metabolism (eds J.B.
Bassingthwaighte, C.A. Goresky & J.H. Linehan), pp. 389-423. Springer
Verlag, New York, USA.
Welles J.M., Demetriades-Shah T.H. & McDermitt D.K. (2001) Considerations
for measuring ground CO2 effluxes with chambers. Chemical Geology 177, 3-
13.
Weyand K. & Schultz H. (2006) Long-term dynamics of nitrogen and
carbohydrate reserves in woody parts of minimally and severely pruned
Riesling vines in a cool climate. American Journal of Enology and Viticulture
57, 172-182.
Whitehead D., Barbour M.M., Griffin K.L., Turnbull M.H. & Tissue D.T. (2011)
Effects of leaf age and tree size on stomatal and mesophyll limitations to
photosynthesis in mountain beech (Nothofagus solandri var. cliffortiodes).
Tree Physiology 31, 985-996.

References List
130
Whitney S.M. & Andrews T.J. (2001) The gene for the ribulose-1,5-bisphosphate
carboxylase/oxygenase (Rubisco) small subunit relocated to the plastid
genome of tobacco directs the synthesis of small subunits that assemble into
Rubisco. Plant Cell 13, 193-205.
Whitney S.M., Sharwood R.E., Orr D., White S.J., Alonso H. & Galmés J. (2011)
Isoleucine 309 acts as a C4 catalytic switch that increases ribulose-1,5-
bisphosphate carboxylase/ oxygenase (rubisco) carboxylation rate in Flaveria.
PNAS 108, 14688-15693.
Williams L.E. & Ayars J.E. (2005) Grapevine water use and the crop coefficient
are linear functions of the shaded area measured beneath the canopy.
Agricultural and Forest Meteorology 132, 201-211.
Williams T.G., Flanagan L.B. & Coleman J.R. (1996) Photosynthetic gas
exchange and discrimination against 13CO2, and C18O16O in tobacco plants
modified by an antisense construct to have low chloroplastic carbonic
anhydrase. Plant Physiology 112, 319-326.
Williams L.E., Matthews M.A. (1990) Grapevine. In: Irrigation of Agricultural
Crops-Agronomy (Monograph nor. 30, ASA-CSSA-SSSA) 1019-1055.
Wuenscher J.E. & Kozlowski T.T. (1971) Relationship of gas-exchange resistance
to tree seedling ecology. Ecology 52, 1056-1023.
Wyers J.B.D. & Johansen L.G. (1985) Accurate estimation of stomatal aperture
from silicone rubbers impressions. The New Phytologist 101, 109-115.
Xu L.K. & Hsiao T. (2004) Predicted versus measured photosynthetic water-use
efficiency of crop stands under dynamically changing field environments.
Journal of Experimental Botany 55, 2395-2411.
Yamori W., Evans J.R. & Von Caemmerer S. (2011). Effects of growth and
measurement light intensities on temperature dependence of CO2 assimilation
rate in tobacco leaves. Plant, Cell & Environment 33, 332-343.pce_206
Yamori W., Noguchi K., Hanba Y.T. & Terashima I. (2006) Effects of internal
conductance on the temperature dependence of the photosynthetic rate in
spinach leaves from contrasting growth temperatures. Plant and Cell
Physiology 47, 1069-1080.

References List
131
Ye Q., Wiera B. & Steudle E. (2004) A cohesion/tension mechanism explains the
gating of water channels (aquaporins) in Chara internodes by high
concentration. Journal of Experimental Botany 55, 449-461.
Zegada-Lizarazu, W. and Berliner, PR. (2011). Inter-row Mulch Increase the
Water Use Efficiency of Furrow-Irrigated Maize in an Arid Environment.
Journal of Agronomy and Crop Science 197, 237-248.
Zeppel M.J.B., Lewis J.D., Chaszar B., Smiths R.A., Medlyn B.E., Huxman T.E.
& Tissue D.T. (2012) Nocturnal stomatal conductance responses to rising
[CO2], temperature and drought. New Phytologist 193, 929-938.
Zeppel M.J.B., Tissue D., Taylor D.T., Macinnis-Ng C. & Eamus D. (2010) Rates
of nocturnal transpiration in two evergreen temperate woodland species with
differing water-use strategies. Tree Physiology 30, 988-1000.
Zufferey V., Murisier F. & Schultz H.R. (2000). A model analysis of the
photosynthetic response of Vitis vinifera L. cvs. Riesling and Chasselas leaves
in the field: I. Interaction of age, light and temperature. Vitis 39, 19-26.
Zsófi Z., Gál L., Szilágy Z., Szücs E., Marschall M., Nagy Z. & Bálo B. (2009).
Use of stomatal conductance and pre-dawn water potential to classify terroir
for the grape variety Kékfrankos. Australian Journal of Grape and Wine
Research 15, 36-47.