Physical vulnerability assessment for alpine hazards: state of the art and future needs
36
ORIGINAL PAPER Physical vulnerability assessment for alpine hazards: state of the art and future needs M. Papathoma-Ko ¨hle • M. Kappes • M. Keiler • T. Glade Received: 11 November 2009 / Accepted: 21 September 2010 / Published online: 6 October 2010 Ó Springer Science+Business Media B.V. 2010 Abstract Mountain hazards such as landslides, floods and avalanches pose a serious threat to human lives and development and can cause considerable damage to lifelines, critical infrastructure, agricultural lands, housing, public and private infrastructure and assets. The assessment of the vulnerability of the built environment to these hazards is a topic that is growing in importance due to climate change impacts. A proper understanding of vulnerability will lead to more effective risk assessment, emergency management and to the development of mitigation and preparedness activities all of which are designed to reduce the loss of life and economic costs. In this study, we are reviewing existing methods for vulnerability assessment related to mountain hazards. By analysing the existing approaches, we identify difficulties in their implementation (data availability, time con- sumption) and differences between them regarding their scale, the consideration of the hazardous phenomenon and its properties, the consideration of important vulnerability indicators and the use of technology such as GIS and remote sensing. Finally, based on these observations, we identify the future needs in the field of vulnerability assessment that include the user-friendliness of the method, the selection of all the relevant indicators, the transferability of the method, the inclusion of information concerning the hazard itself, the use of technology (GIS) and the provision of products such as vulnerability maps and the consideration of the temporal pattern of vulnerability. Keywords Vulnerability Landslides Avalanches Debris flows Rock falls Floods 1 Introduction The alpine communities have long suffered from natural hazards that have often caused loss of life, agricultural land, infrastructure and buildings in the past. Although alpine communities are threatened by a significant number of hazards, in this study, the focus is on avalanches, floods and landslides including debris flows and rock falls. M. Papathoma-Ko ¨hle (&) M. Kappes M. Keiler T. Glade Institute of Geography and Regional Research, University of Vienna, Austria, Universita ¨tsstrasse 7, 1010 Vienna, Austria e-mail: [email protected] 123 Nat Hazards (2011) 58:645–680 DOI 10.1007/s11069-010-9632-4
Transcript of Physical vulnerability assessment for alpine hazards: state of the art and future needs
ORI GIN AL PA PER
Physical vulnerability assessment for alpine hazards:state of the art and future needs
M. Papathoma-Kohle • M. Kappes • M. Keiler • T. Glade
Received: 11 November 2009 / Accepted: 21 September 2010 / Published online: 6 October 2010� Springer Science+Business Media B.V. 2010
Abstract Mountain hazards such as landslides, floods and avalanches pose a serious
threat to human lives and development and can cause considerable damage to lifelines,
critical infrastructure, agricultural lands, housing, public and private infrastructure and
assets. The assessment of the vulnerability of the built environment to these hazards is a
topic that is growing in importance due to climate change impacts. A proper understanding
of vulnerability will lead to more effective risk assessment, emergency management and to
the development of mitigation and preparedness activities all of which are designed to
reduce the loss of life and economic costs. In this study, we are reviewing existing methods
for vulnerability assessment related to mountain hazards. By analysing the existing
approaches, we identify difficulties in their implementation (data availability, time con-
sumption) and differences between them regarding their scale, the consideration of the
hazardous phenomenon and its properties, the consideration of important vulnerability
indicators and the use of technology such as GIS and remote sensing. Finally, based on
these observations, we identify the future needs in the field of vulnerability assessment that
include the user-friendliness of the method, the selection of all the relevant indicators,
the transferability of the method, the inclusion of information concerning the hazard itself,
the use of technology (GIS) and the provision of products such as vulnerability maps and
the consideration of the temporal pattern of vulnerability.
Keywords Vulnerability � Landslides � Avalanches � Debris flows � Rock falls � Floods
1 Introduction
The alpine communities have long suffered from natural hazards that have often caused
loss of life, agricultural land, infrastructure and buildings in the past. Although alpine
communities are threatened by a significant number of hazards, in this study, the focus is
on avalanches, floods and landslides including debris flows and rock falls.
M. Papathoma-Kohle (&) � M. Kappes � M. Keiler � T. GladeInstitute of Geography and Regional Research, University of Vienna, Austria,Universitatsstrasse 7, 1010 Vienna, Austriae-mail: [email protected]
123
Nat Hazards (2011) 58:645–680DOI 10.1007/s11069-010-9632-4
The vast majority of the studies concerning alpine hazards focus on hazard assessment
(zoning), hazard modelling, hazard monitoring and risk management. Vulnerability
assessment of alpine hazards is a relative new field of research which eventually brings
together scientists from different disciplines (Fuchs 2009). As there is no universal defi-
nition for vulnerability, all these scientists from different background give their own
definition, showing clearly that there is a lack of common language that hinders vulner-
ability research to move forward (Brooks 2003). In social science, vulnerability is related
only to the social context whereas, engineers and natural scientists try to define thresholds
in order to determine the acceptable risk and the point from which a society should take
measures against a hazard (Bohle and Glade 2007).
In this paper, the physical vulnerability is investigated without taking into consideration
the social, legal or cultural setting. The focus is on the physical environment and, par-
ticularly, on the impact of natural hazards on the built environment.
In most studies concerning physical vulnerability, assessment vulnerability is perceived
as ‘‘The degree of loss to a given element, or set of elements, within the area affected by a
hazard. It is expressed on a scale of 0 (no loss) to 1 (total loss)’’ (UNDRO 1984). In this
study, vulnerability is considered a pre-existing condition that is related to those charac-
teristics and properties of the elements at risk that increase their susceptibility to the impact
of hazards. In a wider sense, ‘‘vulnerability is a characteristic of human behaviour, social
and physical environments, describing the degree of susceptibility (or resistance) to the
impact of e.g. natural hazards’’ (CENAT 2004). Proper understanding of vulnerability and
its assessment is very important since it can lead to more effective emergency management
and to the development of mitigation and preparedness activities all of which are designed
to reduce the loss of life and economic costs.
The objective of the present study is to identify the gaps and difficulties of existing
methodologies and to point out the future needs for vulnerability assessment to alpine
hazards, which can serve as a tool for effective emergency and disaster management.
2 The impact of alpine hazards on the built environment
The impacts of natural hazards on elements at risk vary according to their characteristics
and properties. In the following section, the natural phenomena and their properties that
make them hazardous to the alpine communities are described.
2.1 Landslides, including debris flows and rock falls
Landslides can be defined as the downslope movement of soil, rock, or debris due to
gravitational forces that can be triggered by heavy rainfall, rapid snow melting, slope
undercutting, etc. (Crozier 1999; Glade and Crozier 2005). In this paper, we categorise
the methodologies in three groups according to the type of phenomenon: landslides in a
general meaning, debris flow and rock falls. The impact of landslides on the built
environment ranges from null or minimum (landslides in remote regions away from
inhabited areas or infrastructure) to maximum (collapse or burial of buildings and
infrastructure, loss of life and loss of agricultural land). Although large magnitude
landslides have a low probability to result in significant loss of human life in Europe, the
concentration of property on steep slopes, high standard of living and high population
density makes society vulnerable to even small magnitude landslide events (Blochl and
Braun 2005).
646 Nat Hazards (2011) 58:645–680
123
Debris flows are rapid gravity-induced mass movements that consist of sediment sat-
urated with water that owe their destructive power to the interaction of solid and fluid
forces (Iverson 1997). They can cause extensive damage to buildings, infrastructure,
lifelines and critical infrastructure. As far as buildings are concerned, debris flows do not
only influence their stability, as most of the mass movements do, but they also enter the
building through doors or windows and damage its interior (Holub and Fuchs 2009).
Rock falls pose a continuous threat to the inhabitants of alpine areas. The rolling,
bouncing, or falling from rocks put in danger not only the stability of the building but also
its interior (Holub and Hubl 2008). Potential hazardous zones can be identified by mapping
the presence of detached rock blocks or the presence of unstable rock masses resting on the
cliff face (Corominas et al. 2005).
2.2 Avalanches
Avalanches are fast moving mass movements that can contain, apart from snow, rocks, soil and
vegetation, or ice (Brundl et al. 2010). Avalanches occur due to topographical (inclination,
aspect and roughness of ground surface), meteorological (temperature, precipitation, wind
speed and direction) and snowpack factors (snowpack structure, depth and water content)
(McClung and Schaerer 1993). The impact on the objects that are located in the disposition area
can be very high. Only in Austria, since 1950 avalanches have claimed more than 1,600 lives,
which are 30 fatalities on an annual basis (Holler 2007). The elements at risk are influenced by
two major processes: the air pressure plume in front of the avalanche and the high impact
pressure of the snow in motion. The debris or vegetation that can be transported within an
avalanche increases its impact on buildings, infrastructure and individuals (Brundl et al. 2010).
2.3 Floods
River and flash floods pose a serious threat to Alpine communities. They are caused by heavy
or prolonged rainfall and rapid snowmelt, ice jams or ice break-up, damming of river valleys
by landslides or avalanches, and failure of natural or man-made dams (WMO 1999).
BWW et al. (1997) suggest two categories of river flooding: static and dynamic. Static
flooding occurs in areas with relatively plane topography. Water level is rising slowly and
flow velocity is very slow if the water is moving at all. The damage they cause is attributed to
the influence of the water on the building structure. In dynamic floods the water movement is
higher and affects the elements at risk due to erosion or direct impact (Hollenstein et al. 2002).
On the other hand, flash floods originate in steep basins and show an extremely sudden onset
(Barredo 2007). They are not always connected with bodies of water since also ditches can
turn into torrents where water may reach high flow velocities. UNDHA (1992) defines this
phenomenon as floods ‘‘of short duration with a relatively high peak discharge’’.
The frequent occurrence of natural hazards in Alpine regions leads to a high impact
potential to the exposed societies. Therefore, the role of vulnerability assessment needs to
be addressed. A working report from PLANAT (Swiss National Platform for Natural
Hazards) provides a thorough list of national and international efforts from scientists or
projects to assess vulnerability to alpine hazards having a focus on vulnerability functions
(Spichtig and Brundl 2008). Moreover, vulnerability studies regarding landslides are
reviewed by Glade (2003). Various methods to assess vulnerability are compared and some
examples of applications are given (Glade 2003). The present review expands the analysis
to more recent studies concerning not only landslides but also snow avalanches and floods
focusing on Alpine regions.
Nat Hazards (2011) 58:645–680 647
123
3 Literature review of existing vulnerability assessment methodsfor alpine natural hazards
After conducting a review of existing vulnerability assessment methods regarding various
disaster types, Hollenstein (2005) suggests that vulnerability assessment studies concerning
mass-movements related disasters are limited. The difference to other types of disaster is
striking: Hollenstein (2005) recorded more than 100 studies about earthquake vulnerability
models, more than 100 studies regarding wind-related vulnerability models and less than
20 vulnerability models involving gravitational hazards (landslides, debris flows, snow
avalanches) and floods. He assumes that a potential reason for this is that gravitational
processes are usually accurately delimited and the most common strategy of the authorities
and other stakeholders is to simply avoid the potentially affected areas. Another potential
reason is that the institutions that are responsible for the management of these risks have
enough empirical knowledge and they do not need theoretical models.
Each study addresses vulnerability in a different way and the result is a wide range of
different vulnerability assessment methods. Engineers focus on the reaction of individual
buildings to the impact of a natural process (e.g. landslide, snow avalanche). Some scientists
design vulnerability curves showing the relationship of the vulnerability and the phenomenon
intensity as well as others, having a disaster management or emergency planning background,
provide vulnerability maps in order to support the local authorities with a decision-making
tool. Some studies focus exclusively on vulnerability assessment, whereas others deal with
vulnerability as part of a risk assessment. A review of some vulnerability assessment methods
regarding alpine hazards is given in the following paragraphs without claiming completeness.
3.1 Landslides
One of the first studies dealing with the vulnerability assessment of geological hazards was
the one of Mejia-Navarro et al. (1994), which assessed the vulnerability and risk of
geological hazards (subsidence, rock falls, debris flows and floods) in the Glenwood
Springs area, Colorado. In this vulnerability analysis, the following aspects were consid-
ered: ecosystem, economic and social structure vulnerability. The result was a map with 14
land use suitability classes, which incorporated hazards, vulnerability and risk parameters.
The first seven classes are, or may become, suitable for urban infrastructure while the last
seven classes are reserved for environmental protection, contingency occasions, or avoided
because of a high hazard level (Mejia-Navarro et al. 1994). According to the same study,
vulnerability is a function of population density, land use and lifelines. This function is
expressed by the following equation.
Vuln ¼ Density� 10þ Lusevuln� 7þ Lifelines� 2ð Þ=19:
with:
Vuln Vulnerability
Density Population density (higher weight to higher human concentration per hectare)
Lusevuln Land use vulnerability (schools have the highest score (10) and farms the
lowest)
Lifelines Highways, city roads, service lines such as phone and electricity
Leone et al. (1996) also worked on the vulnerability assessment of elements exposed to
mass movements, by investigating the interaction between landslides and exposed
648 Nat Hazards (2011) 58:645–680
123
elements. They produced damage matrices for elements exposed to mass movements that
provide a correlation, in terms of loss rate, between the landslides and the exposed ele-
ments. Finally, they developed a classification of the types and levels of damage of
the main elements exposed to mass movements, without linking them to the intensity of the
phenomenon based on historic data. Zezere et al. (2008), on the other hand, connect the
vulnerability values of the elements at risk to the types of landslide that the element is
exposed to (shallow translational landslides, translational landslides and rotational slides).
Through a case study in Portugal, they assessed the vulnerability of buildings and roads,
based on the age and material of buildings, their use and the number of floors. As far as
roads were concerned, they used data concerning the type of road (motorway, national
road, county road, rural road).
A number of vulnerability indicators, as far as the buildings were concerned, were also
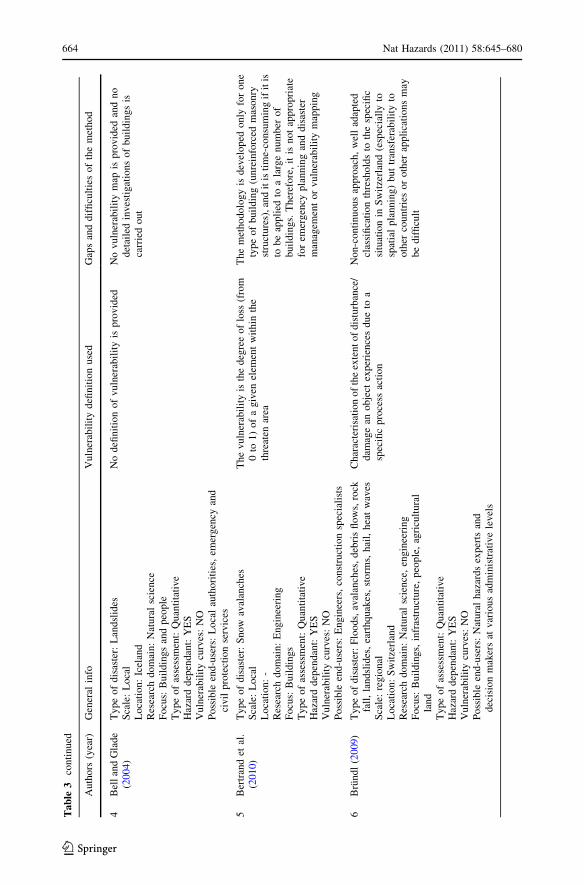
used by Bell and Glade (2004). They recognised the gap in vulnerability assessment of
elements at risk subject to landslides and made an attempt to assess vulnerability to
landslides in Iceland using a heuristic approach within the framework of a quantitative risk
analysis. In this effort, they used general information on houses within the endangered
areas, based on expert judgement, noting that some of the houses were made of timber and
had large windows built towards the mountain slope. The vulnerability of the people in
buildings is expressed as the product of the vulnerability of buildings and the vulnerability
of people. The vulnerability of buildings and people is determined depending on the
process and its magnitude. As final product, they provided an ‘‘elements at risk map’’ based
on number of residents and employees and a ‘‘risk map’’ as a function of hazard and
consequences including elements at risk, damage potential and vulnerability.
Some studies aim at the production of a final map that demonstrates the spatial pattern
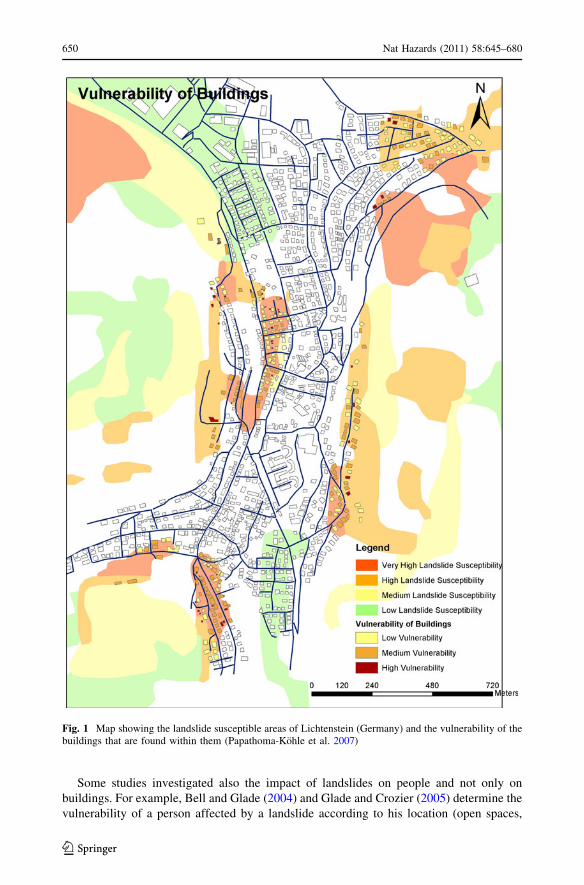
of vulnerability. For example, Papathoma-Kohle et al. (2007) introduce a framework to
undertake an assessment of the vulnerability of buildings to landslide, based on the
development of an ‘‘elements at risk database’’ that takes into consideration the charac-
teristics and use of the buildings, their importance for the local economy and the char-
acteristics of the inhabitants (population density, age, etc.). The established GIS database
contains attributes that affect vulnerability, and it is used for the visualisation of physical,
human and economic vulnerability (Fig. 1). The vulnerability assessment is based on a
landslide susceptibility map demonstrating the probability of landslide occurrence; how-
ever, it does not take into consideration the frequency, magnitude and run out of potential
landslides. The result of the study can contribute to effective disaster management and
emergency planning and the database produced may be used by various end-users and
stakeholders, such as insurance companies, emergency planners, local authorities.
Apart from Papathoma-Kohle et al. (2007), GIS and remote sensing data were also used
in a study of Macquarie et al. (2004). The main idea of the approach of Macquarie et al.
(2004) is to identify vulnerable zones for landslide risk assessment at large scales (1:5,000
to 1:10,000) through the aggregation of elements at risk sharing identical attributes. Based
on aerial photography, statistical analysis and GIS technology, the urban fabric is divided
in three vulnerability categories (low, medium and high) according to criteria such as
number of inhabitants, type of buildings, type of activities, land use and lifelines.
Vulnerability maps were also produced by Uzielli et al. (2008) and Kaynia et al. (2008).
Uzielli et al. (2008) used a method for scenario-based, quantitative estimation of physical
vulnerability of the built environment to landslides and introduced a methodology of
probabilistic estimation for vulnerability to landslides. Based on a first-order second-
moment approach, they estimate the vulnerability for susceptible categories of structures
and people for prescribed study areas, finally quantifying the uncertainties.
Nat Hazards (2011) 58:645–680 649
123
Some studies investigated also the impact of landslides on people and not only on
buildings. For example, Bell and Glade (2004) and Glade and Crozier (2005) determine the
vulnerability of a person affected by a landslide according to his location (open spaces,
Fig. 1 Map showing the landslide susceptible areas of Lichtenstein (Germany) and the vulnerability of thebuildings that are found within them (Papathoma-Kohle et al. 2007)
650 Nat Hazards (2011) 58:645–680
123
vehicles, buildings). Santos (2003) has included a vulnerability assessment study for
landslides within a QRA (quantitative risk analysis), which is based on a weighting of
elements at risk giving the highest priority to the human life. In this study, the criteria used
included presence, frequency and absolute number of human lives, infrastructures (public,
residential, etc.) and productive function and activities (industry, agriculture, etc.). How-
ever, the construction type or the condition of the buildings in the study area are not taken
into consideration. The vulnerability assessment was used for the production of a risk map.
There was no map demonstrating the vulnerability pattern (Santos 2003).
Another study has been carried out by the Department of Hydrology and Meteorology
for Nepal for the Advance Institute on Vulnerability to Global Environmental Change
(Shrestha 2005). This study includes physical and social vulnerability for both landslides
and floods. Total vulnerability is also assessed based on hazard, physical exposure and
adaptive capacity. In parts of the study area, although the hazard has decreased, the total
vulnerability has risen due to higher physical exposure and the lower adaptive capabilities
of the community (Shrestha 2005). Similar findings have been reported in New Zealand
(Hufschmidt et al. 2005).
Galli and Guzzetti (2007) map vulnerability of buildings and roads to landslides, in
Umbria (Italy) by using the existing landslide inventory and established vulnerability
curves. Based on information on the damage caused by 103 landslides, they establish
dependencies between the area of the landslide and the vulnerability of buildings and roads.
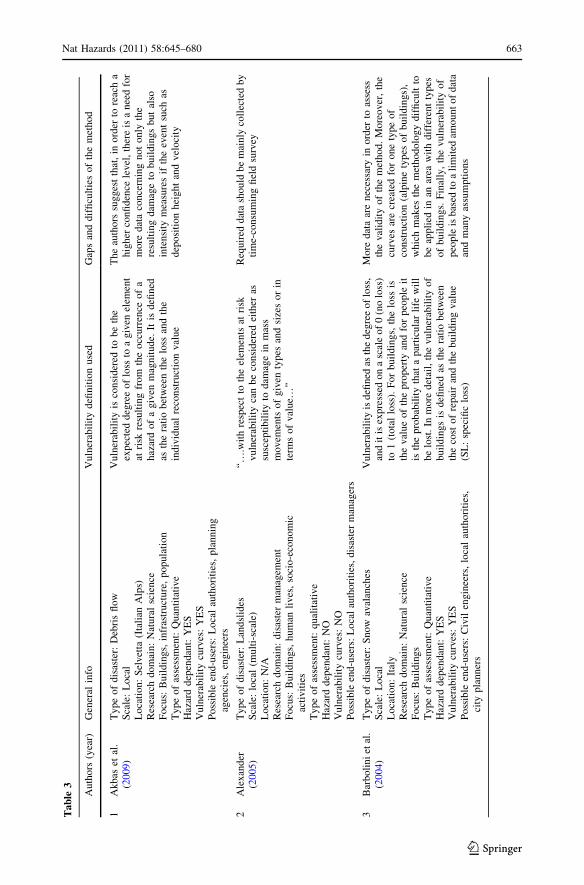
Finally, a vulnerability assessment method for landslides was introduced by Alexander
(2005) based on the vulnerability of buildings and structures, human lives and socio-
economic activities. The methodology can be used in three scales: single asset method
(vulnerability is assessed for each element at risk of the area), summed asset method
(vulnerability is assessed as an average vulnerability of assets in a hazard area) and
generalised asset method (a general level of vulnerability for all assets in the hazard area is
estimated). The vulnerability classes of the assets are assigned on the basis of the likely
degree of loss. Vulnerability estimated in this way can be mapped, and, in combination
with a hazard map, can lead to the production of a risk map.
3.2 Debris flow
In the study of debris flow vulnerability, there are significantly more efforts in the pro-
duction of vulnerability curves. BUWAL (1999a), focusing on gravitational mass move-
ments in Switzerland, presents vulnerability curves that are integrated in a 3-step
methodology for the vulnerability of communities at risk.
1. Step 1: By combining a hazard and a land use map and comparing with the protection
objectives potential ‘protection deficits’ are deducted.
2. Step 2: The vulnerability of object categories is quantified by taking into consideration
the loss of life, assets and agricultural land, and rebuilding and clean-up costs.
3. Step 3: The vulnerability of each object is assessed using vulnerability curves and
detailed information on elements at risk to estimate the death risk in buildings, on the
street and in the train, as well as the monetary loss as far as buildings, business
interruption and loss of farm animals are concerned.
The methodology is illustrated by case studies from Switzerland for debris flow, rock
falls, landslides and avalanches. It is based on vulnerability curves related to the intensity
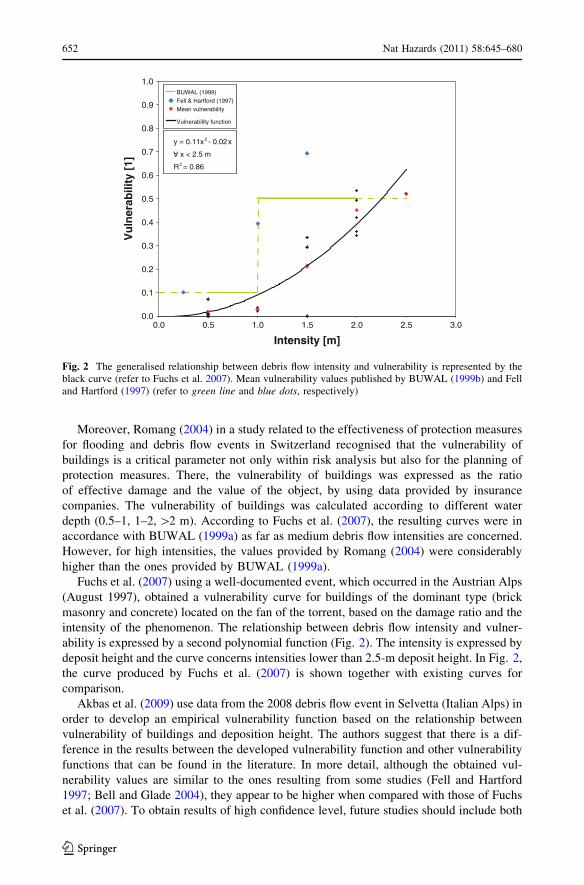
of the phenomenon and its impact (degree of loss) on the buildings (green line in Fig. 2 for
debris flow).
Nat Hazards (2011) 58:645–680 651
123
Moreover, Romang (2004) in a study related to the effectiveness of protection measures
for flooding and debris flow events in Switzerland recognised that the vulnerability of
buildings is a critical parameter not only within risk analysis but also for the planning of
protection measures. There, the vulnerability of buildings was expressed as the ratio
of effective damage and the value of the object, by using data provided by insurance
companies. The vulnerability of buildings was calculated according to different water
depth (0.5–1, 1–2, [2 m). According to Fuchs et al. (2007), the resulting curves were in
accordance with BUWAL (1999a) as far as medium debris flow intensities are concerned.
However, for high intensities, the values provided by Romang (2004) were considerably
higher than the ones provided by BUWAL (1999a).
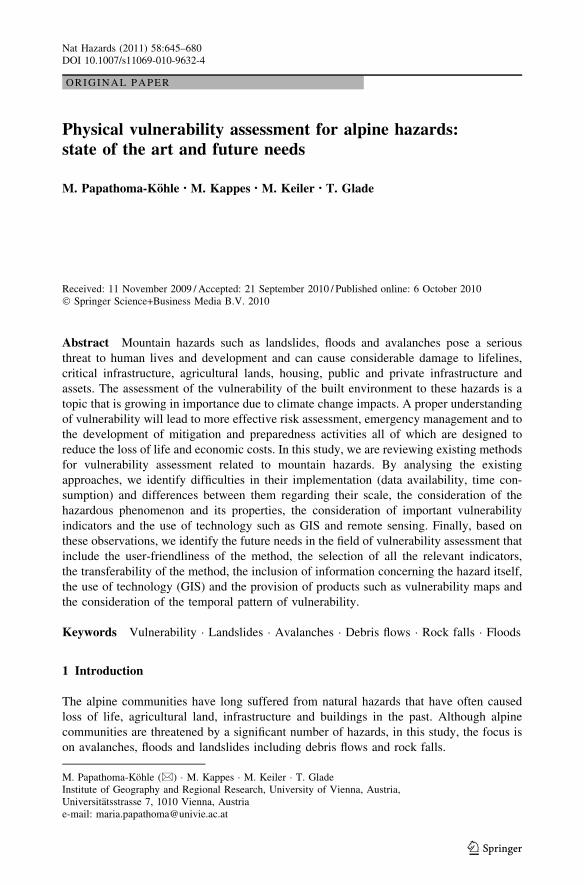
Fuchs et al. (2007) using a well-documented event, which occurred in the Austrian Alps
(August 1997), obtained a vulnerability curve for buildings of the dominant type (brick
masonry and concrete) located on the fan of the torrent, based on the damage ratio and the
intensity of the phenomenon. The relationship between debris flow intensity and vulner-
ability is expressed by a second polynomial function (Fig. 2). The intensity is expressed by
deposit height and the curve concerns intensities lower than 2.5-m deposit height. In Fig. 2,
the curve produced by Fuchs et al. (2007) is shown together with existing curves for
comparison.
Akbas et al. (2009) use data from the 2008 debris flow event in Selvetta (Italian Alps) in
order to develop an empirical vulnerability function based on the relationship between
vulnerability of buildings and deposition height. The authors suggest that there is a dif-
ference in the results between the developed vulnerability function and other vulnerability
functions that can be found in the literature. In more detail, although the obtained vul-
nerability values are similar to the ones resulting from some studies (Fell and Hartford
1997; Bell and Glade 2004), they appear to be higher when compared with those of Fuchs
et al. (2007). To obtain results of high confidence level, future studies should include both
0.0
0.1
0.2
0.3
0.4
0.5
0.6
0.7
0.8
0.9
1.0
0.0 0.5 1.0 1.5 2.0 2.5 3.0
Intensity [m]
Vu
lner
abili
ty [
1]
BUWAL (1999)Fell & Hartford (1997)Mean vulnerability
Vulnerability function
y = 0.11x - 0.02 x
A x < 2.5 m
2
2
R = 0.86
A
Fig. 2 The generalised relationship between debris flow intensity and vulnerability is represented by theblack curve (refer to Fuchs et al. 2007). Mean vulnerability values published by BUWAL (1999b) and Felland Hartford (1997) (refer to green line and blue dots, respectively)
652 Nat Hazards (2011) 58:645–680
123
characteristics related to the intensity of the event (velocity, deposition height) and
description of outcoming damage.
Cardinali et al. (2002) have also discussed the issue of vulnerability through a risk
assessment. In order to conduct a landslide risk assessment, they provided a table with the
vulnerability of the elements at risk, expressed as expected damage (superficial, functional
and structural) caused by different types of landslides having different intensities, but they
never went any further by mapping this vulnerability. Michael-Leiba et al. (2003) assessed
the vulnerability of elements as risk (people, buildings and roads), as part of a landslide
risk assessment for the community of Cairns, Australia. They consider vulnerability as the
probability of an element at risk to be destroyed by a landslide and produced a table
showing how the vulnerability of the elements at risk can change according to the type of
slide.
Other studies show a wider focus, not being limited to the assessment of the vulnera-
bility of buildings. Liu and Lei (2003) presented a vulnerability assessment model through
the assessment of debris flow risk in China, based on a more holistic approach taking into
consideration all the factors that influence vulnerability. According to the authors, vul-
nerability depends on physical, economic, environmental and social factors. In order to
assess vulnerability on a regional scale, the following characteristics were taking into
consideration:
• Physical vulnerability, defined by fixed asset values;
• Economic vulnerability, assessed through Gross Domestic Product (GDP);
• Environmental vulnerability, including baseline prices of different types of land;
• Social vulnerability, based on size, density, age, education and wealth of people.
Sterlacchini et al. (2007) include a vulnerability assessment of an Italian community
susceptible to debris flow within a multi-disciplinary landslide risk analysis. The vulner-
ability assessment of the elements at risk is based on the physical effects that the elements
could suffer because of the disastrous event, assessed basing on damage scenarios of
similar past events. Finally, the authors estimate the social and economic consequences by
producing a vulnerability scenario for built-up areas and infrastructure (buildings, road
network and waterlines and penstocks) described in terms of aesthetical, functional and
structural damage.
3.3 Rock falls
As far as rock falls are concerned, attempts for vulnerability assessment of elements at risk
of rock falls are limited, perhaps due to the limited impact of the phenomenon (it can affect
individual buildings rather than settlements, and rarely it causes casualties). BUWAL
(1999b) proposed vulnerability curves for rock falls as far as five building categories are
concerned. The curves express the relationship between the vulnerability of the buildings
and the intensity of the rock fall (kJ). Corominas et al. (2005) worked within the frame-
work of a quantitative risk assessment (QRA) in Andorra. Although they suggest that the
intensity of the event and the nature of the element are the two factors controlling the
amount of damage that can be produced by the rock fall in order to assign vulnerability
values to elements at risk, they only take into account the intensity of the event. Mavrouli
and Corominas (2008) make a step further, by analysing the vulnerability of buildings to
rock falls for three representative structural typologies: (1) reinforced concrete structure
with column and beam frames, (2) reinforced concrete structure with additional reinforced
concrete walls on the exposed facade and (3) bearing brick masonry. Finally, other
Nat Hazards (2011) 58:645–680 653
123
landslide vulnerability studies included vulnerability to rock falls as part of a wider vul-
nerability assessment focused on landslides (Bell and Glade 2004).
3.4 Avalanches
Studies focusing on the vulnerability assessment of communities and buildings to avalanches
are significantly less than similar studies regarding other disaster types, probably due to lack
of sufficient data on avalanche damages to exposed elements (Cappabianca et al. 2008).
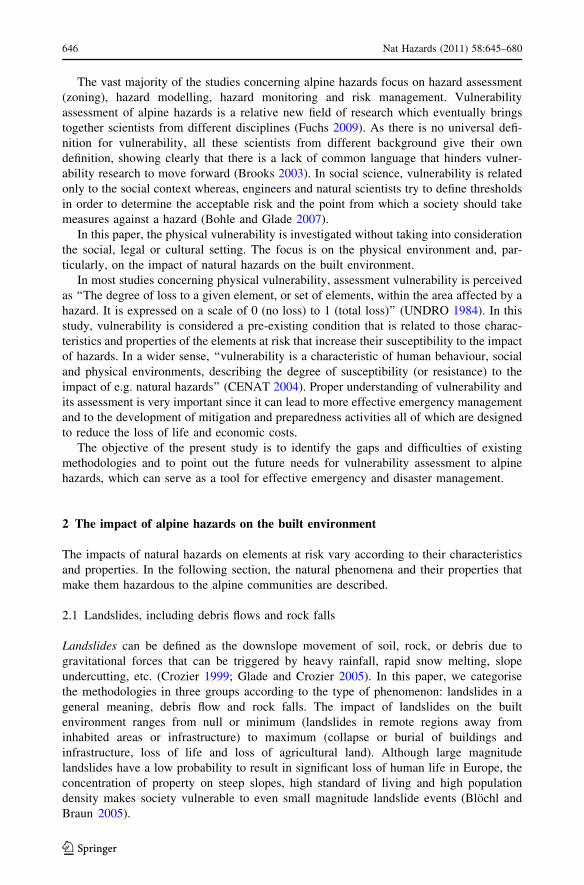
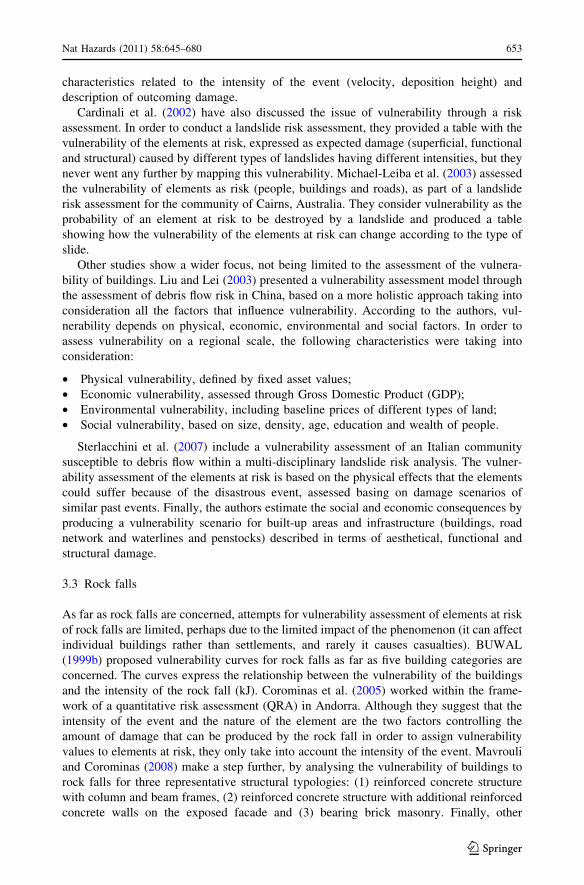
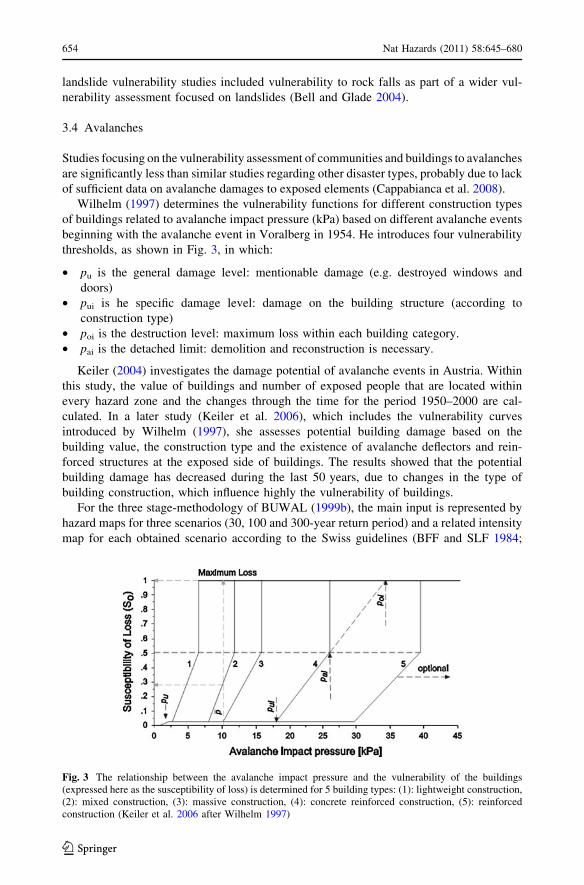
Wilhelm (1997) determines the vulnerability functions for different construction types
of buildings related to avalanche impact pressure (kPa) based on different avalanche events
beginning with the avalanche event in Voralberg in 1954. He introduces four vulnerability
thresholds, as shown in Fig. 3, in which:
• pu is the general damage level: mentionable damage (e.g. destroyed windows and
doors)
• pui is he specific damage level: damage on the building structure (according to
construction type)
• poi is the destruction level: maximum loss within each building category.
• pai is the detached limit: demolition and reconstruction is necessary.
Keiler (2004) investigates the damage potential of avalanche events in Austria. Within
this study, the value of buildings and number of exposed people that are located within
every hazard zone and the changes through the time for the period 1950–2000 are cal-
culated. In a later study (Keiler et al. 2006), which includes the vulnerability curves
introduced by Wilhelm (1997), she assesses potential building damage based on the
building value, the construction type and the existence of avalanche deflectors and rein-
forced structures at the exposed side of buildings. The results showed that the potential
building damage has decreased during the last 50 years, due to changes in the type of
building construction, which influence highly the vulnerability of buildings.
For the three stage-methodology of BUWAL (1999b), the main input is represented by
hazard maps for three scenarios (30, 100 and 300-year return period) and a related intensity
map for each obtained scenario according to the Swiss guidelines (BFF and SLF 1984;
Fig. 3 The relationship between the avalanche impact pressure and the vulnerability of the buildings(expressed here as the susceptibility of loss) is determined for 5 building types: (1): lightweight construction,(2): mixed construction, (3): massive construction, (4): concrete reinforced construction, (5): reinforcedconstruction (Keiler et al. 2006 after Wilhelm 1997)
654 Nat Hazards (2011) 58:645–680
123
BWW et al. 1997; BUWAL et al. 1997). The intensity classification is derived as an
example for avalanches from impact pressure on large obstacles, and divided into low
(\3 kPa), medium (3 kPa \ 30 kPa) and high ([30 kPa). For the first two stages, the
vulnerability of elements at risk is neglected or included as general assumptions with
regard to the probability of lethality according to the intensity class and the land use
category (e.g. settlement area, industrial area, dense developed area). In the third stage, the
potential damage for buildings and infrastructure is calculated depending on the value of
the element at risk and the degree (or susceptibility) of loss related to the impact pressure
and intensity classes, respectively (BUWAL 1999b). The latter includes the construction
type of the buildings and the related resistance, the building height and the presence of
local structural protection. Furthermore, a degree of loss is estimated for traffic lines,
infrastructure and different agricultural uses. Also the vulnerability curve of BUWAL
(1999b) is strongly related to the approach of Wilhelm (1997) but differs because the
degree of loss is only given for three aggregated intensity classes and the related impact
pressure and no general damage level (pu) is included.
Keylock and Barbolini (2001) studied the impact of snow avalanches on buildings,
introducing a methodology for deriving vulnerability values as a function of position
downslope for a range of avalanche sizes. The same concept was used later by Barbolini
et al. (2004) in order to assess the vulnerability of buildings and people. Barbolini et al.
(2004) suggest that for buildings this loss is the value of the property and for people the
loss can be expressed as the probability that a particular life will be lost. Based on data
from two well-documented events in Tyrol (Austria) for different impact pressure they
produced three vulnerability curves for: buildings, people inside buildings and people
outside buildings. The vulnerability is expressed as a function of avalanche dynamical
parameters (impact pressure and flow depth). The vulnerability of buildings is defined in
this study by Barbolini et al. (2004) as the ratio between the cost of repair and the building
value. On the other hand, the vulnerability of people inside buildings is defined as the
probability of being killed by an avalanche if one stays inside a building when the ava-
lanche occurs. Moreover, the vulnerability of people outside buildings is defined as the
degree of burial, which depends on the flow depth of the avalanche.
Bertrand et al. (2010) presented a methodology for vulnerability assessment
of unreinforced masonry buildings exposed to snow avalanches. They accept that vulnerabil-
ity is the degree of loss of a given element at risk within the threatened area. Therefore,
the vulnerability of the structures is expressed as damage level. In more detail, they use a
numerical approach in order to simulate the displacements of blocks that constitute the struc-
ture under threat. The damage of the structure is estimated by the number of broken joints.
Finally, one of the most recent studies on vulnerability for snow avalanches is the one of
Cappabianca et al. (2008) who are proposing a vulnerability curve for people inside buildings
affected by dense avalanches based on Wilhelm (1997) making possible the inclusion of
these vulnerable elements in the calculation of the total risk at the valley bottom. In a similar
way, Jonasson et al. (1999) related the probability of people surviving an avalanche to the
avalanche velocity based on data from Iceland. The results concern Icelandic type of
housing, thus, the method is not transferable to other parts of the world without adaptation.
3.5 Floods
Most of the current state-of-the-art flood loss analyses focus on the estimation of direct,
tangible damages (Messner and Meyer 2005). The most frequently applied approach con-
cerns the linkage of inundation depth to estimated damages. Hooijer et al. (2001) developed
Nat Hazards (2011) 58:645–680 655
123
classes of severity of flood and for each class (serious (\1.5 m), disastrous (1.5–4 m) and
catastrophic ([4 m)) the percentage of total potential damage for households, industrial
assets, infrastructure, etc. and number of inhabitants, respectively, is determined.
The stage-damage curves are widely used, tracing back to White (1945), who linked
inundation depth to expected losses expressed as percentage or total damage (monetary
value). The use of stage-damage curves is restricted to gently flowing water (\1 m/s) since
faster flows cause with increasing likelihood damages due to the dynamic load (Greenaway
and Smith 1983 in Middelmann-Fernandes 2010). NZIER (2004) limit their applicability
even further to slow-rising, low-silt and low-flow floods. Kang et al. (2005), for example,
developed curves for single and multiple family dwellings interrelating flow depth with
total damage, while Grunthal et al. (2006) worked with relative stage-damage curves
estimating the damage ratio of buildings and contents for various economic sectors as
private housing, commerce, services, public infrastructure. The total economic value per
grid cell was assessed according to the economic sector to which it belonged based on unit
values per land area and after linkage to the stage-damage curves total losses were derived
for various flood scenarios. Meyer et al. (2009) used relative stage-damage curves for
potential damage assessment for various asset categories as residential, agriculture,
industry or service for the river Mulde in Saxony (Germany). Apart from the economic
assessment, Meyer et al. (2009) considered also ecological (erosion, accumulation and
inundation of oligotrophic biotopes) and social (spatial distribution of affected population,
location of social hot spots as hospitals, schools, etc. and inundation) consequences. By
means of multi-criteria analysis, the single sub-criteria and criteria were combined and the
spatial allocation of these monetary and non-monetary consequences was visualised in
separate maps or as final standardised multi-criteria risk.
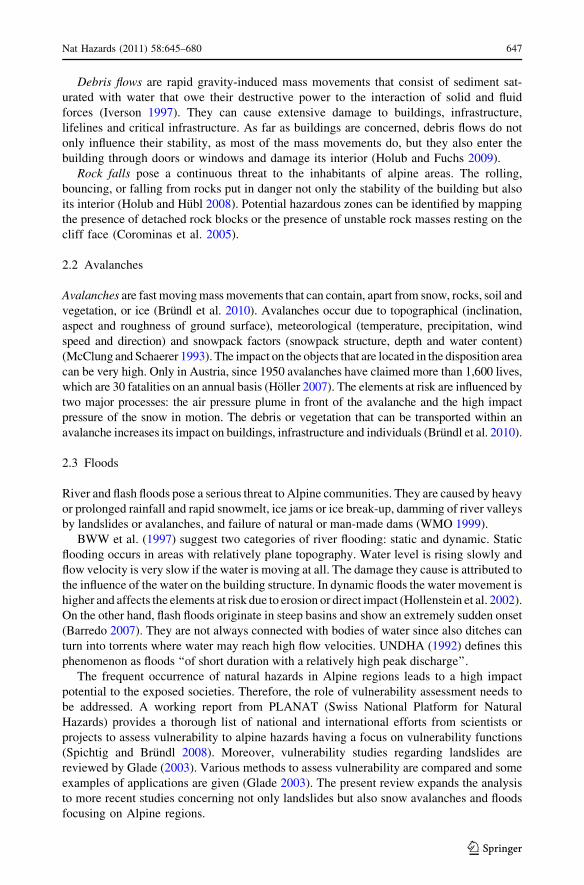
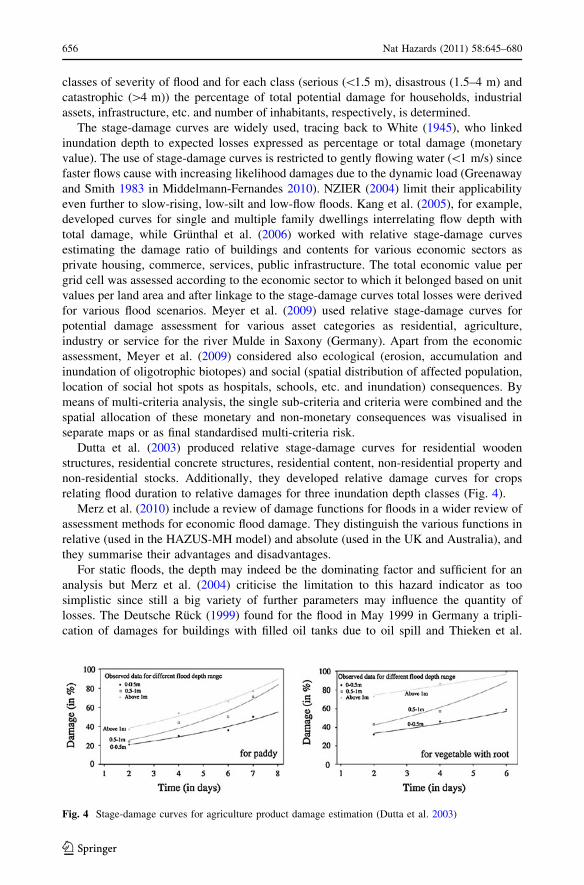
Dutta et al. (2003) produced relative stage-damage curves for residential wooden
structures, residential concrete structures, residential content, non-residential property and
non-residential stocks. Additionally, they developed relative damage curves for crops
relating flood duration to relative damages for three inundation depth classes (Fig. 4).
Merz et al. (2010) include a review of damage functions for floods in a wider review of
assessment methods for economic flood damage. They distinguish the various functions in
relative (used in the HAZUS-MH model) and absolute (used in the UK and Australia), and
they summarise their advantages and disadvantages.
For static floods, the depth may indeed be the dominating factor and sufficient for an
analysis but Merz et al. (2004) criticise the limitation to this hazard indicator as too
simplistic since still a big variety of further parameters may influence the quantity of
losses. The Deutsche Ruck (1999) found for the flood in May 1999 in Germany a tripli-
cation of damages for buildings with filled oil tanks due to oil spill and Thieken et al.
Fig. 4 Stage-damage curves for agriculture product damage estimation (Dutta et al. 2003)
656 Nat Hazards (2011) 58:645–680
123

(2005) identified for the Elbe flood of 2002 contamination and flood duration as important
factors. Buchele et al. (2006) identified contamination and the application of precautionary
measures as important variables in their study. They complemented the stage-damage
curve by these two parameters by means of so-called loading factors (Table 1), which are
multiplied with the damage predicted by the stage-damage curve.
Buchele et al. (2006) collected a list of further influencing factors as ‘‘duration of
inundation, sediment concentration, availability and information content of flood warning
and the quality of external response in a flood situation’’, but very few studies consider
them quantitatively.
For dynamic floods flow velocity is an important parameter, but still only few studies
are available which include it into damage estimations. De Lotto and Testa (2000) analysed
the effect of dam-break at a test site in an alpine valley basing their analysis on water depth
and flow velocity. By that time no velocity-damage function could be found thus, they
adopted the pressure used as threshold of complete destruction of structures due to snow
avalanches (30 kN/m2). Since for the elements at risk (1 storey, 2 storey and 3 storey
houses and the content) two damage values were obtained—one for depth and one for
velocity, always the highest value was used and interactions were not taken into account. In
HAZUS-MH (FEMA 2007) a velocity–depth function is included indicating whether
building collapse has to be assumed. If the threshold for collapse is reached or exceeded,
the damage is set to 100% while below this threshold the damage is estimated based on
inundation levels only. Furthermore, the effect of warning and associated damage reduc-
tion can be considered and assessed by a so-called day curve. Based on the time of the
warning before the event a maximum percentage of 35% damage reduction can be
achieved if a public response rate of 100% can be assumed.
The Swiss risk concept from PLANAT (Nationale Plattform Naturgefahren) defines
three intensity classes for an effect analysis, based on flood depth and velocity (Table 2),
which are used as basis for spatial planning regulations (BWW et al. 1997; Brundl 2009).
The intensity classes are established according to their effect on human beings and
buildings (BWW et al. 1997):
• High: persons inside and outside of buildings are at risk and the destruction of buildings
is possible or events with a lower intensity occur but with higher frequency and persons
outside of buildings are at risk.
• Middle: persons outside of buildings are at risk and damage to buildings can occur while
persons in buildings are quite safe and sudden destruction of buildings is improbable.
Table 1 Loading factors for different levels of contamination and precautionary measures (Buchele et al.2006)
Consequence and measures Loading factors for damage ratios
Buildings Contents
No contamination and no precautionary measures 0.92 0.90
No contamination and medium precautionary measures 0.64 0.85
No contamination and very good precautionary measures 0.41 0.64
Medium contamination and no precautionary measures 1.20 1.11
Medium contamination and medium precautionary measures 0.86 0.99
Medium contamination and very good precautionary measures 0.71 0.73
High contamination and no precautionary measures 1.58 1.44
Nat Hazards (2011) 58:645–680 657
123
• Low: persons are barely at risk and only low damages at buildings or disruptions have
to be expected.
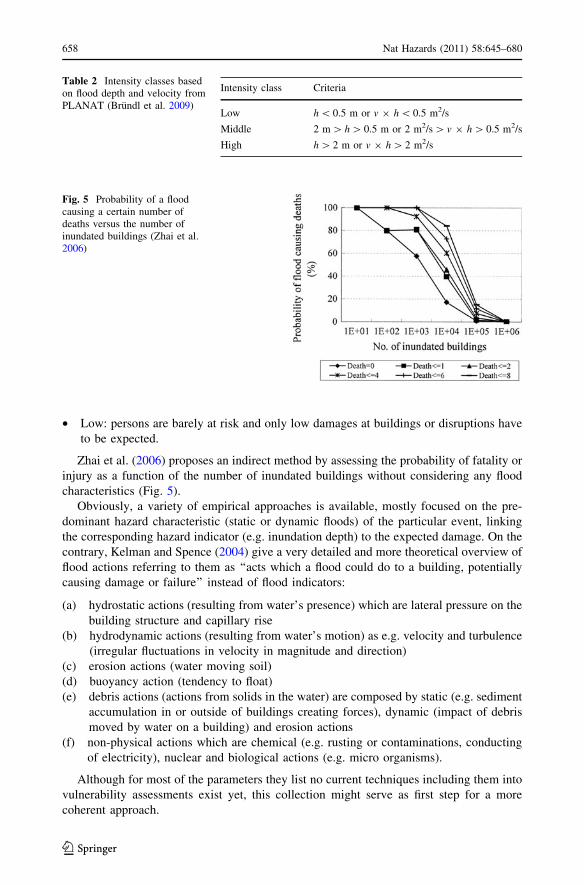
Zhai et al. (2006) proposes an indirect method by assessing the probability of fatality or
injury as a function of the number of inundated buildings without considering any flood
characteristics (Fig. 5).
Obviously, a variety of empirical approaches is available, mostly focused on the pre-
dominant hazard characteristic (static or dynamic floods) of the particular event, linking
the corresponding hazard indicator (e.g. inundation depth) to the expected damage. On the
contrary, Kelman and Spence (2004) give a very detailed and more theoretical overview of
flood actions referring to them as ‘‘acts which a flood could do to a building, potentially
causing damage or failure’’ instead of flood indicators:
(a) hydrostatic actions (resulting from water’s presence) which are lateral pressure on the
building structure and capillary rise
(b) hydrodynamic actions (resulting from water’s motion) as e.g. velocity and turbulence
(irregular fluctuations in velocity in magnitude and direction)
(c) erosion actions (water moving soil)
(d) buoyancy action (tendency to float)
(e) debris actions (actions from solids in the water) are composed by static (e.g. sediment
accumulation in or outside of buildings creating forces), dynamic (impact of debris
moved by water on a building) and erosion actions
(f) non-physical actions which are chemical (e.g. rusting or contaminations, conducting
of electricity), nuclear and biological actions (e.g. micro organisms).
Although for most of the parameters they list no current techniques including them into
vulnerability assessments exist yet, this collection might serve as first step for a more
coherent approach.
Table 2 Intensity classes basedon flood depth and velocity fromPLANAT (Brundl et al. 2009)
Intensity class Criteria
Low h \ 0.5 m or v 9 h \ 0.5 m2/s
Middle 2 m [ h [ 0.5 m or 2 m2/s [ v 9 h [ 0.5 m2/s
High h [ 2 m or v 9 h [ 2 m2/s
Fig. 5 Probability of a floodcausing a certain number ofdeaths versus the number ofinundated buildings (Zhai et al.2006)
658 Nat Hazards (2011) 58:645–680
123
In order to address the various concepts of vulnerability assessment and to determine the
similarities and the differences between them, a project funded by the European Com-
mission has been launched. In the MOVE project (Methodologies for Vulnerability
Assessment in Europe), existing vulnerability assessment methods were reviewed based on
a series of criteria. Information such as, the location of the study, the type of hazard and the
research domain of the scientific team that undertook the study are important for the
review. However, information regarding the way vulnerability is perceived by each author,
the gaps and difficulties of the methods and the potential end-users that can also demon-
strate the applicability of each method is considered as essential. Moreover, by scale we do
not mean the extend of the case study area but the units that have been used for the
vulnerability assessment that, for example, in the case of ‘‘local’’ are the individual houses.
The reviewed vulnerability assessment methods and their scores according to the MOVE
criteria are listed in the Appendix.
4 Discussion: Identifications of gaps
In this paper, 41 vulnerability assessment methods for alpine hazards are reviewed (some
of them referring to more than one type of hazard). As far as the landslide-related
hazards are concerned, the majority of vulnerability assessment methodologies have been
designed for earth flow and debris flow-related hazards, whereas for rock fall hazards we
have the smallest number of methodologies. Most of the reviewed methods consider
vulnerability to be ‘‘the degree of loss of a specific element at risk to a hazard of a given
magnitude’’. The vast majority of the vulnerability assessment methods are quantitative,
assigning vulnerability values from 0 to 1 to the elements at risk (e.g. Michael-Leiba
et al. 2003; Fuchs et al. 2007), whereas, only a small percentage of them are qualitative
describing vulnerability as low, medium and high (e.g. Cardinali et al. 2002; Santos
2003; Macquarie et al. 2004; Sterlacchini et al. 2007). This ‘‘degree of loss’’ is often
expressed as monetary loss (reconstruction costs, building value, etc.) (e.g. Barbolini
et al. 2004; Keylock and Barbolini 2001; Romang 2004; Fuchs et al. 2007; Cappabianca
et al. 2008), in other cases it is expressed as damages (aesthetic, functional, structural,
etc.) (e.g. Corominas et al. 2005; Sterlacchini et al. 2007; Mavrouli and Corominas
2008). Finally, in some studies (e.g. Mejia-Navarro et al. 1994; Liu and Lei 2003;
Papathoma-Kohle et al. 2007; Sterlacchini et al. 2007), vulnerability is a combination of
all these factors that contribute to the susceptibility of the building or the given element
at risk. Moreover, for studies with a focus on human life, vulnerability is the probability
of a life to be lost (e.g. Jonasson et al. 1999; Santos 2003; Barbolini et al. 2004; Keylock
and Barbolini 2001; Zhai et al. 2006).
From the 41 reviewed methods, 21 use existing (12) or introduce new vulnerability
curves (9). In the case of floods, almost all of the studies are based on vulnerability curves
which holds only for a few studies related to gravitational hazards. As Douglas (2007)
suggests, there are more vulnerability curves for other geohazards, such as earthquakes,
rather than for landslides and snow avalanches. Moreover, in the cases where vulnerability
curves are used the expected damages to the built environment are not always expressed in
relationship to the same characteristic of the hazardous phenomenon. For example, in the
case of debris flows, vulnerability is presented in relationship to the intensity of the debris
flow, which is expressed as deposit height. Other properties of the phenomenon (e.g. flow
velocity) are not taken into consideration (Fuchs et al. 2007). For snow avalanches, the
vulnerability curves that are available express the relationship between potential loss and
Nat Hazards (2011) 58:645–680 659
123
the impact pressure of the snow avalanche, expressed as kPa, without taking into con-
sideration other avalanche characteristics such as flow density (Wilhelm 1997; Keiler et al.
2006). On the other hand, for floods there is a variety of vulnerability curves available in
the literature. The majority of the studies use vulnerability curves that demonstrate the
relationship between expected damage and inundation depth. The large number of vul-
nerability curves in flood studies can be explained by the fact that floods (just like
earthquakes and storms which are also hazards with very well developed vulnerability
curves) damage more buildings in a single event than other hazard types (Douglas 2007).
Additionally, these hazards occur frequently and are in society’s recent memory. Finally,
most of the methodologies have been applied in Europe or in countries with similar level of
development, such as America and Australia. However, the curves that are produced are
mostly for a specific construction type that is common in the study area. Therefore, they
cannot be used in another part of the world where the dominant construction type is
different or where there is diversity in the quality or types of buildings.
The focus of the methodologies varies significantly. The majority of the methodologies
focus on buildings, whereas, others include also potential victims, infrastructure and
lifelines such as the road network. Very few studies focus on the vulnerability of the
environment or the agricultural land, or the economic vulnerability of the affected com-
munity that can include the vulnerability of businesses, employment, tourism, etc. A very
limited number of the reviewed studies address the multi-dimensional nature of vulnera-
bility (Leone et al. 1996; Liu and Lei 2003; Sterlacchini et al. 2007). As far as the scale of
the study is concerned, the majority of the studies, especially the ones involving landslides,
concern methodologies designed to be applied only on a local level, whereas only a few
(Liu and Lei 2003; Galli and Guzzetti 2007) are applied on a regional scale. In the case of
studies concerning floods, the majority of them are carried out on a regional scale (Hooijer
et al. 2001; Grunthal et al. 2006; Meyer et al. 2009; Zhai et al. 2006, etc.). The regional
vulnerability assessment is important for the central or the regional government in order to
make decisions regarding funding allocations. However, as far as on-site emergency
management and disaster planning is concerned in particular local vulnerability assessment
can provide the decision makers with useful information.
There are many difficulties in implementing the methodologies. The most common
setback is the data availability (Barbolini et al. 2004; Buchele et al. 2006; Papathoma-
Kohle et al. 2007; Kaynia et al. 2008; Uzielli et al. 2008; Akbas et al. 2009) and the fact
that some methods are time-consuming (Papathoma-Kohle et al. 2007; Kaynia et al. 2008;
Uzielli et al. 2008) due to extensive field work and the detailed data that are required.
Many studies focus only on the vulnerability of individual buildings (Corominas et al.
2005; Bertrand et al. 2010; Mavrouli and Corominas 2008). In the case of rock falls
(Corominas et al. 2005; Mavrouli and Corominas 2008), this is widely understood since the
specific type of disaster affects individual buildings rather than settlements. As far as other
alpine hazards are concerned, usually the studies focus on settlements rather than indi-
vidual buildings. Vulnerability maps, which could give an overview of the vulnerability
pattern, are often not provided (Leone et al. 1996; Sterlacchini et al. 2007; Zezere et al.
2008). Although due to the goal of the study vulnerability maps are not always necessary,
they may be a valuable tool for emergency planning and decision making in disaster
management. In many cases the authors provide an inventory of the elements at risk but
they do not provide information regarding their properties which is essential for a vul-
nerability assessment (Fuchs et al. 2007). In other cases, the indicators of vulnerability are
explicitly explained (Sterlacchini et al. 2007) and in many cases, only one vulnerability
indicator is taken into consideration, e.g. building type (Keylock and Barbolini 2001;
660 Nat Hazards (2011) 58:645–680
123
Buchele et al. 2006; Fuchs et al. 2007; Zezere et al. 2008). Moreover, vulnerability in most
cases is considered hazard dependant, in other words, characteristics of the hazardous
phenomenon, such as its intensity or magnitude, are also taken into consideration
(Mejia-Navarro et al. 1994; Macquarie et al. 2004; Keiler et al. 2006; Fuchs et al. 2007;
Brundl 2009; Kaynia et al. 2008; Brundl et al. 2009). However, some studies do not take
into consideration the hazardous phenomenon (Leone et al. 1996; Liu and Lei 2003;
Papathoma-Kohle et al. 2007). In general, most of the vulnerability assessment methods
reviewed here are static: they refer to a state of vulnerability for given elements at risk
within a certain time period. However, vulnerability is a dynamic phenomenon which is
changing through time. Therefore, the temporal evolution of vulnerability should be taken
into consideration in future vulnerability assessment studies.
5 Conclusion: future needs
The diversity in the way physical vulnerability to alpine hazards is assessed by different
scientists is remarkable. It is understood that a common vulnerability assessment method
that satisfies all would be impossible. However, following this detailed review of the
existing vulnerability assessment methods for alpine hazards, a series of aspects regarding
future needs in the field of vulnerability assessment are outlined.
The absence of a common definition and conceptual framework of vulnerability can
obstruct efficient risk reduction. Sometimes, the different approaches confuse potential
end-users, leading to the exclusion of vulnerability assessment from the decision-making
process. For this reason, a common language not only between scientists of different
disciplines but also between scientists sharing a similar background is essential. Since
vulnerability can have many dimensions (physical, economic, social, etc.) a multi-
dimensional approach is necessary which would enable the collaboration between scien-
tists from various disciplines. Even if we focus on one dimension only in the respective
research, the other dimensions are still there and they might influence unintentionally the
results of the specific research. According to Fuchs (2009), integrating the contributions of
the different disciplines in a holistic way would not result in an individual integral method
which would be generally applicable; however, they could be combined in a concept
offering complementary results that can lead to a deeper understanding of hazard and risk.
In order to improve the physical vulnerability assessment, as a part of a future multi-
dimensional vulnerability assessment method, we would like to outline the following:
1. The aim of the vulnerability assessment and its end-users should be identified before
the development of the methodology. This holds not just for vulnerability assessment
but our analysis of existing methods shows that this is mostly missing. A vulnerability
assessment which will be used as a tool for decision making or emergency planning
will take into consideration different parameters than a vulnerability assessment that
will be used for funding allocation in national or international level. In case the
method is targeting a number of end-users then it should be user friendly and
comprehensible for a wide range of people and not only for specialists. The end-users
will also influence the scale of the assessment (local/regional/national).
2. All the relevant vulnerability indicators should be considered. Indicators can be
identified by looking at records of previous events, as far as every different type of
disaster is concerned. The construction type is a very important indicator of
vulnerability but there are other indicators that play a major role in the interaction
Nat Hazards (2011) 58:645–680 661
123

between a building and a hazardous phenomenon such as the design and shape of the
building, its foundation, its surrounding, the existence of vegetation or protection
measures, and the static characteristics of the building. As far as floods and torrent
processes are concerned the opening of the buildings and the use of the ground floor
are also very important indicators. Birkmann (2006) suggests a number of steps for
such an indicator development, and a series of quality criteria.
3. It would be of great value if a vulnerability assessment method could be transferred to
other places of the world. However, due to the different housing materials and
architecture this is very difficult. Although the transferability of a method is hard to be
secured it should not be neglected where possible. For example, more than one
building type could be considered. These would eventually lead to more than one
vulnerability curve for the study area that could also enable the transferability of the
method to other parts of the world with a diversity of building and construction types.
Moreover, the uncertainties of the vulnerability functions should be also considered.
4. It can be of great use when vulnerability assessment is accompanied by a product (e.g.
a map or a GIS database) that shows its spatial pattern. Weichselgartner (2001) also
points out the importance of mapping vulnerability as a result of a series of hazard,
exposure, preparedness and prevention maps. Available technology such as remote
sensing and GIS should be used not only for the provision of quality maps but also in
order to reduce time-consuming fieldwork as much as possible. Although the necessity
of such technology (remote sensing and GIS) is highly dependent on the goal and scale
of the study, recent remote sensing data can provide the most up to date picture of the
study area and the inventory of the elements at risk together with their properties
avoiding time-consuming field work. Following, the up to date information can be
contained in a GIS database for fast data retrieval, easy weight allocation for the
various vulnerability indicators, better visualisation (understanding of the spatial
pattern of vulnerability) of the results and continuous updating.
5. The fact that vulnerability is hazard dependant should not be ignored. Information
regarding the properties of the hazardous phenomenon should be collected as well as
information regarding the impact of past events on the built environment. Moreover,
the vulnerability assessment method differs with the type of disaster as characteristics
regarding its frequency and extend should be taken into consideration.
6. A static vulnerability assessment method does not cover the needs of the end-users and
the development of risk management strategies under the consideration of complex
interaction between natural systems and social systems (global change) (Keiler et al.
2006, 2010). Vulnerability is a dynamic phenomenon that changes through time,
especially as much as people are concerned. A dynamic perspective of vulnerability
and the resulting consequents should be also taken into consideration in the
development of new methodologies.
Acknowledgments The authors would like to thank the two anonymous referees for their valuablecomments in the earlier version of this paper. Part of the research for this article was supported by EU-projects of the 6th (Mountain Risks, MRTN-CT-2006-035798) and 7th framework programme (MOVE,211590).
Appendix
See Table 3.
662 Nat Hazards (2011) 58:645–680
123
Ta
ble
3
Au
tho
rs(y
ear)
Gen
eral
info
Vu
lner
abil
ity
defi
nit
ion
use
dG
aps
and
dif
ficu
ltie
so
fth
em
eth
od
1A
kb
aset
al.
(20
09)
Ty
pe
of
dis
aste
r:D
ebri
sfl
ow
Sca
le:
Lo
cal
Lo
cati
on
:S
elv
etta
(Ita
lian
Alp
s)R
esea
rch
do
mai
n:
Nat
ura
lsc
ien
ceF
ocu
s:B
uil
din
gs,
infr
astr
uct
ure
,p
op
ula
tio
nT
yp
eo
fas
sess
men
t:Q
uan
tita
tiv
eH
azar
dd
epen
dan
t:Y
ES
Vu
lner
abil
ity
curv
es:
YE
SP
oss
ible
end-u
sers
:L
oca
lau
thori
ties
,pla
nnin
gag
enci
es,
engin
eers
Vuln
erab
ilit
yis
consi
der
edto
be
the
exp
ecte
dd
egre
eo
flo
ssto
ag
iven
elem
ent
atri
skre
sult
ing
fro
mth
eo
ccu
rren
ceo
fa
haz
ard
of
ag
iven
mag
nit
ud
e.It
isd
efin
edas
the
rati
ob
etw
een
the
loss
and
the
indiv
idu
alre
con
stru
ctio
nv
alue
Th
eau
tho
rssu
gges
tth
at,
ino
rder
tore
ach
ah
igh
erco
nfi
den
cele
vel
,th
ere
isa
nee
dfo
rm
ore
dat
aco
nce
rnin
gn
ot
on
lyth
ere
sult
ing
dam
age
tob
uil
din
gs
bu
tal
soin
ten
sity
mea
sure
sif
the
even
tsu
chas
dep
osi
tio
nh
eig
ht
and
vel
oci
ty
2A
lex
and
er(2
00
5)
Ty
pe
of
dis
aste
r:L
and
slid
esS
cale
:lo
cal
(mu
lti-
scal
e)L
oca
tio
n:
N/A
Res
earc
hd
om
ain
:d
isas
ter
man
agem
ent
Fo
cus:
Bu
ild
ing
s,h
um
anli
ves
,so
cio
-eco
no
mic
acti
vit
ies
Ty
pe
of
asse
ssm
ent:
qu
alit
ativ
eH
azar
dd
epen
dan
t:N
OV
uln
erab
ilit
ycu
rves
:N
OP
oss
ible
end
-use
rs:
Lo
cal
auth
ori
ties
,d
isas
ter
man
ager
s
‘‘…
.wit
hre
spec
tto
the
elem
ents
atri
skvuln
erab
ilit
yca
nbe
consi
der
edei
ther
assu
scep
tib
ilit
yto
dam
age
inm
ass
mov
emen
tso
fg
iven
typ
esan
dsi
zes
or
inte
rms
of
val
ue…
’’
Req
uir
edd
ata
sho
uld
be
mai
nly
coll
ecte
db
yti
me-
consu
min
gfi
eld
surv
ey
3B
arb
oli
ni
etal
.(2
00
4)
Type
of
dis
aste
r:S
now
aval
anch
esS
cale
:L
oca
lL
oca
tio
n:
Ital
yR
esea
rch
do
mai
n:
Nat
ura
lsc
ien
ceF
ocu
s:B
uil
din
gs
Ty
pe
of
asse
ssm
ent:
Qu
anti
tati
ve
Haz
ard
dep
endan
t:Y
ES
Vu
lner
abil
ity
curv
es:
YE
SP
oss
ible
end
-use
rs:
Civ
ilen
gin
eers
,lo
cal
auth
ori
ties
,ci
typ
lann
ers
Vuln
erab
ilit
yis
defi
ned
asth
edeg
ree
of
loss
,an
dit
isex
pre
ssed
on
asc
ale
of
0(n
olo
ss)
to1
(to
tal
loss
).F
or
bu
ild
ings,
the
loss
isth
ev
alu
eo
fth
ep
rop
erty
and
for
peo
ple
itis
the
pro
bab
ilit
yth
ata
par
ticu
lar
life
wil
lb
elo
st.
Inm
ore
det
ail,
the
vu
lner
abil
ity
of
bu
ild
ing
sis
defi
ned
asth
era
tio
bet
wee
nth
eco
sto
fre
pai
ran
dth
eb
uil
din
gv
alue
(SL
:sp
ecifi
clo
ss)
Mo
red
ata
are
nec
essa
ryin
ord
erto
asse
ssth
ev
alid
ity
of
the
met
ho
d.
Mo
reo
ver
,th
ecu
rves
are
crea
ted
for
on
ety
pe
of
con
stru
ctio
n(a
lpin
ety
pes
of
bu
ild
ings)
,w
hic
hm
akes
the
met
ho
do
log
yd
iffi
cult
tob
eap
pli
edin
anar
eaw
ith
dif
fere
nt
types
of
bu
ild
ing
s.F
inal
ly,
the
vu
lner
abil
ity
of
peo
ple
isb
ased
toa
lim
ited
amo
un
to
fd
ata
and
man
yas
sum
pti
on
s
Nat Hazards (2011) 58:645–680 663
123
Ta
ble
3co
nti
nu
ed
Au
tho
rs(y
ear)
Gen
eral
info
Vu
lner
abil
ity
defi
nit
ion
use
dG
aps
and
dif
ficu
ltie
so
fth
em
eth
od
4B
ell
and
Gla
de
(20
04)
Ty
pe
of
dis
aste
r:L
and
slid
esS
cale
:L
oca
lL
oca
tio
n:
Icel
and
Res
earc
hd
om
ain
:N
atu
ral
scie
nce
Fo
cus:
Bu
ild
ing
san
dp
eop
leT
yp
eo
fas
sess
men
t:Q
uan
tita
tiv
eH
azar
dd
epen
dan
t:Y
ES
Vu
lner
abil
ity
curv
es:
NO
Poss
ible
end-u
sers
:L
oca
lau
thori
ties
,em
ergen
cyan
dci
vil
pro
tect
ion
serv
ices
No
defi
nit
ion
of
vu
lner
abil
ity
isp
rov
ided
No
vu
lner
abil
ity
map
isp
rov
ided
and
no
det
aile
din
ves
tigat
ions
of
buil
din
gs
isca
rrie
dout
5B
ertr
and
etal
.(2
01
0)
Type
of
dis
aste
r:S
now
aval
anch
esS
cale
:L
oca
lL
oca
tio
n:
-R
esea
rch
do
mai
n:
En
gin
eeri
ng
Fo
cus:
Bu
ild
ing
sT
yp
eo
fas
sess
men
t:Q
uan
tita
tiv
eH
azar
dd
epen
dan
t:Y
ES
Vu
lner
abil
ity
curv
es:
NO
Poss
ible
end-u
sers
:E
ngin
eers
,co
nst
ruct
ion
spec
iali
sts
The
vuln
erab
ilit
yis
the
deg
ree
of
loss
(fro
m0
to1
)o
fa
giv
enel
emen
tw
ith
inth
eth
reat
enar
ea
Th
em
eth
od
olo
gy
isd
evel
op
edo
nly
for
on
ety
pe
of
bu
ild
ing
(un
rein
forc
edm
ason
ryst
ruct
ure
s),an
dit
isti
me-
consu
min
gif
itis
tob
eap
pli
edto
ala
rge
nu
mb
ero
fb
uil
din
gs.
Th
eref
ore
,it
isn
ot
app
ropri
ate
for
emer
gen
cyp
lann
ing
and
dis
aste
rm
anag
emen
tor
vuln
erab
ilit
ym
appin
g
6B
run
dl
(20
09)
Type
of
dis
aste
r:F
loods,
aval
anch
es,
deb
ris
flow
s,ro
ckfa
ll,
lan
dsl
ides
,ea
rth
quak
es,
sto
rms,
hai
l,h
eat
wav
esS
cale
:re
gio
nal
Loca
tion:
Sw
itze
rlan
dR
esea
rch
do
mai
n:
Nat
ura
lsc
ien
ce,
eng
inee
rin
gF
ocu
s:B
uil
din
gs,
infr
astr
uct
ure
,peo
ple
,ag
ricu
ltura
lla
nd
Ty
pe
of
asse
ssm
ent:
Qu
anti
tati
ve
Haz
ard
dep
endan
t:Y
ES
Vu
lner
abil
ity
curv
es:
NO
Poss
ible
end-u
sers
:N
atura
lhaz
ards
exper
tsan
dd
ecis
ion
mak
ers
atv
ario
us
adm
inis
trat
ive
lev
els
Ch
arac
teri
sati
on
of
the
exte
nt
of
dis
turb
ance
/d
amag
ean
ob
ject
exp
erie
nce
sd
ue
toa
spec
ific
pro
cess
acti
on
No
n-c
onti
nu
ous
app
roac
h,
wel
lad
apte
dcl
assi
fica
tion
thre
shold
sto
the
spec
ific
situ
atio
nin
Sw
itze
rlan
d(e
spec
iall
yto
spat
ial
pla
nn
ing
)b
ut
tran
sfer
abil
ity
too
ther
cou
ntr
ies
or
oth
erap
pli
cati
ons
may
be
dif
ficu
lt
664 Nat Hazards (2011) 58:645–680
123
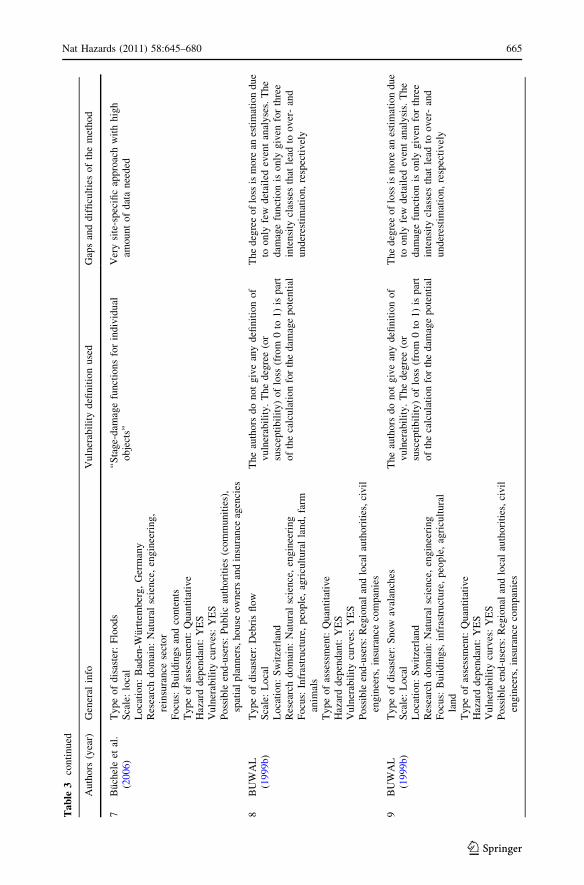
Ta
ble
3co
nti
nu
ed
Au
tho
rs(y
ear)
Gen
eral
info
Vu
lner
abil
ity
defi
nit
ion
use
dG
aps
and
dif
ficu
ltie
so
fth
em
eth
od
7B
uch
ele
etal
.(2
00
6)
Ty
pe
of
dis
aste
r:F
loo
ds
Sca
le:
loca
lL
oca
tio
n:
Bad
en-W
urt
tem
ber
g,
Ger
man
yR
esea
rch
do
mai
n:
Nat
ura
lsc
ien
ce,
eng
inee
rin
g,
rein
sura
nce
sect
or
Fo
cus:
Bu
ild
ing
san
dco
nte
nts
Ty
pe
of
asse
ssm
ent:
Qu
anti
tati
ve
Haz
ard
dep
endan
t:Y
ES
Vu
lner
abil
ity
curv
es:
YE
SP
oss
ible
end
-use
rs:
Pu
bli
cau
tho
riti
es(c
om
mu
nit
ies)
,sp
atia
lpla
nner
s,house
ow
ner
san
din
sura
nce
agen
cies
‘‘S
tage-
dam
age
fun
ctio
ns
for
indiv
idu
alo
bje
cts’
’V
ery
site
-sp
ecifi
cap
pro
ach
wit
hh
igh
amou
nt
of
dat
an
eed
ed
8B
UW
AL
(19
99b)
Ty
pe
of
dis
aste
r:D
ebri
sfl
ow
Sca
le:
Lo
cal
Loca
tion:
Sw
itze
rlan
dR
esea
rch
do
mai
n:
Nat
ura
lsc
ien
ce,
eng
inee
rin
gF
ocu
s:In
fras
truct
ure
,peo
ple
,ag
ricu
ltura
lla
nd,
farm
anim
als
Ty
pe
of
asse
ssm
ent:
Qu
anti
tati
ve
Haz
ard
dep
endan
t:Y
ES
Vu
lner
abil
ity
curv
es:
YE
SP
oss
ible
end
-use
rs:
Reg
ional
and
loca
lau
tho
riti
es,
civ
ilen
gin
eers
,in
sura
nce
com
pan
ies
Th
eau
tho
rsd
on
ot
giv
ean
yd
efinit
ion
of
vuln
erab
ilit
y.
The
deg
ree
(or
susc
epti
bil
ity)
of
loss
(fro
m0
to1
)is
par
to
fth
eca
lcu
lati
on
for
the
dam
age
po
ten
tial
Th
ed
egre
eo
flo
ssis
more
anes
tim
atio
nd
ue
too
nly
few
det
aile
dev
ent
anal
yse
s.T
he
dam
age
fun
ctio
nis
on
lyg
iven
for
thre
ein
ten
sity
clas
ses
that
lead
too
ver
-an
dunder
esti
mat
ion,
resp
ecti
vel
y
9B
UW
AL
(19
99b)
Type
of
dis
aste
r:S
now
aval
anch
esS
cale
:L
oca
lL
oca
tion:
Sw
itze
rlan
dR
esea
rch
do
mai
n:
Nat
ura
lsc
ien
ce,
eng
inee
rin
gF
ocu
s:B
uil
din
gs,
infr
astr
uct
ure
,peo
ple
,ag
ricu
ltura
lla
nd
Ty
pe
of
asse
ssm
ent:
Qu
anti
tati
ve
Haz
ard
dep
endan
t:Y
ES
Vu
lner
abil
ity
curv
es:
YE
SP
oss
ible
end
-use
rs:
Reg
ional
and
loca
lau
tho
riti
es,
civ
ilen
gin
eers
,in
sura
nce
com
pan
ies
Th
eau
tho
rsd
on
ot
giv
ean
yd
efinit
ion
of
vuln
erab
ilit
y.
The
deg
ree
(or
susc
epti
bil
ity)
of
loss
(fro
m0
to1
)is
par
to
fth
eca
lcu
lati
on
for
the
dam
age
po
ten
tial
Th
ed
egre
eo
flo
ssis
more
anes
tim
atio
nd
ue
too
nly
few
det
aile
dev
ent
anal
ysi
s.T
he
dam
age
fun
ctio
nis
on
lyg
iven
for
thre
ein
ten
sity
clas
ses
that
lead
too
ver
-an
dunder
esti
mat
ion,
resp
ecti
vel
y
Nat Hazards (2011) 58:645–680 665
123
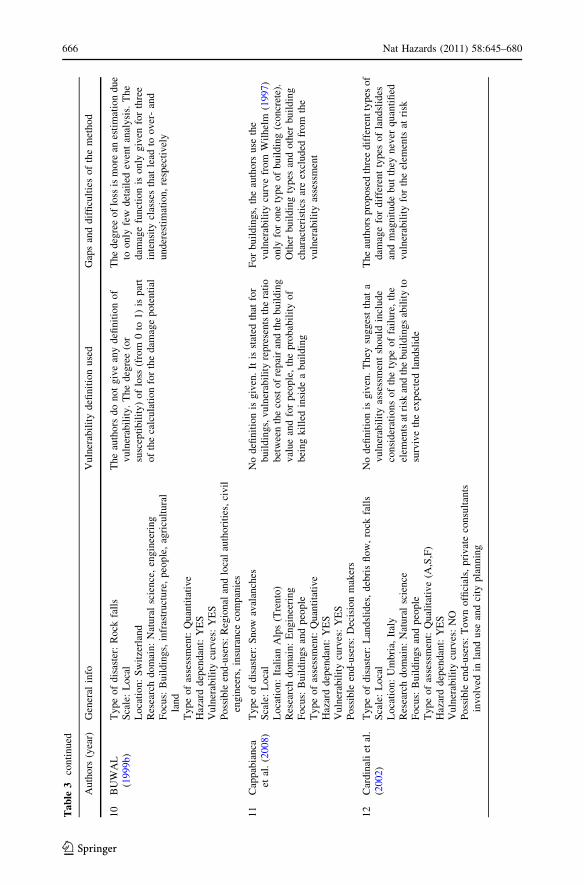
Ta
ble
3co
nti
nu
ed
Au
tho
rs(y
ear)
Gen
eral
info
Vu
lner
abil
ity
defi
nit
ion
use
dG
aps
and
dif
ficu
ltie
so
fth
em
eth
od
10
BU
WA
L(1
99
9b)
Ty
pe
of
dis
aste
r:R
ock
fall
sS
cale
:L
oca
lL
oca
tion:
Sw
itze
rlan
dR
esea
rch
do
mai
n:
Nat
ura
lsc
ien
ce,
eng
inee
rin
gF
ocu
s:B
uil
din
gs,
infr
astr
uct
ure
,p
eop
le,
agri
cult
ura
lla
nd
Ty
pe
of
asse
ssm
ent:
Qu
anti
tati
ve
Haz
ard
dep
endan
t:Y
ES
Vu
lner
abil
ity
curv
es:
YE
SP
oss
ible
end
-use
rs:
Reg
ion
alan
dlo
cal
auth
ori
ties
,ci
vil
eng
inee
rs,
insu
ran
ceco
mp
anie
s
Th
eau
tho
rsd
on
ot
giv
ean
yd
efin
itio
no
fv
uln
erab
ilit
y.
Th
ed
egre
e(o
rsu
scep
tib
ilit
y)
of
loss
(fro
m0
to1
)is
par
to
fth
eca
lcu
lati
on
for
the
dam
age
po
ten
tial
Th
ed
egre
eo
flo
ssis
mo
rean
esti
mat
ion
du
eto
on
lyfe
wd
etai
led
even
tan
aly
sis.
Th
ed
amag
efu
nct
ion
iso
nly
giv
enfo
rth
ree
inte
nsi
tycl
asse
sth
atle
adto
ov
er-
and
un
der
esti
mat
ion
,re
spec
tiv
ely
11
Cap
pab
ianca
etal
.(2
00
8)
Type
of
dis
aste
r:S
now
aval
anch
esS
cale
:L
oca
lL
oca
tion:
Ital
ian
Alp
s(T
rento
)R
esea
rch
do
mai
n:
En
gin
eeri
ng
Fo
cus:
Bu
ild
ing
san
dp
eop
leT
yp
eo
fas
sess
men
t:Q
uan
tita
tive
Haz
ard
dep
endan
t:Y
ES
Vu
lner
abil
ity
curv
es:
YE
SP
oss
ible
end
-use
rs:
Dec
isio
nm
aker
s
No
defi
nit
ion
isg
iven
.It
isst
ated
that
for
bu
ild
ings,
vu
lner
abil
ity
rep
rese
nts
the
rati
ob
etw
een
the
cost
of
rep
air
and
the
bu
ild
ing
val
ue
and
for
peo
ple
,th
ep
rob
abil
ity
of
bei
ng
kil
led
insi
de
ab
uil
din
g
Fo
rb
uil
din
gs,
the
auth
ors
use
the
vuln
erab
ilit
ycu
rve
from
Wil
hel
m(1
99
7)
on
lyfo
ro
ne
typ
eo
fb
uil
din
g(c
on
cret
e).
Oth
erb
uil
din
gty
pes
and
oth
erb
uil
din
gch
arac
teri
stic
sar
eex
clu
ded
from
the
vuln
erab
ilit
yas
sess
men
t
12
Car
din
ali
etal
.(2
00
2)
Ty
pe
of
dis
aste
r:L
and
slid
es,
deb
ris
flo
w,
rock
fall
sS
cale
:L
oca
lL
oca
tion:
Um
bri
a,It
aly
Res
earc
hd
om
ain
:N
atu
ral
scie
nce
Fo
cus:
Bu
ild
ing
san
dp
eop
leT
yp
eo
fas
sess
men
t:Q
ual
itat
ive
(A,S
,F)
Haz
ard
dep
endan
t:Y
ES
Vu
lner
abil
ity
curv
es:
NO
Po
ssib
leen
d-u
sers
:T
ow
no
ffici
als,
pri
vat
eco
nsu
ltan
tsin
vo
lved
inla
nd
use
and
city
pla
nn
ing
No
defi
nit
ion
isg
iven
.T
hey
sug
ges
tth
ata
vu
lner
abil
ity
asse
ssm
ent
sho
uld
incl
ud
eco
nsi
der
atio
ns
of
the
type
of
fail
ure
,th
eel
emen
tsat
risk
and
the
bu
ild
ings
abil
ity
tosu
rviv
eth
eex
pec
ted
landsl
ide
Th
eau
tho
rsp
rop
ose
dth
ree
dif
fere
nt
typ
eso
fd
amag
efo
rd
iffe
ren
tty
pes
of
lan
dsl
ides
and
mag
nit
ud
eb
ut
they
nev
erq
uan
tifi
edvuln
erab
ilit
yfo
rth
eel
emen
tsat
risk
666 Nat Hazards (2011) 58:645–680
123
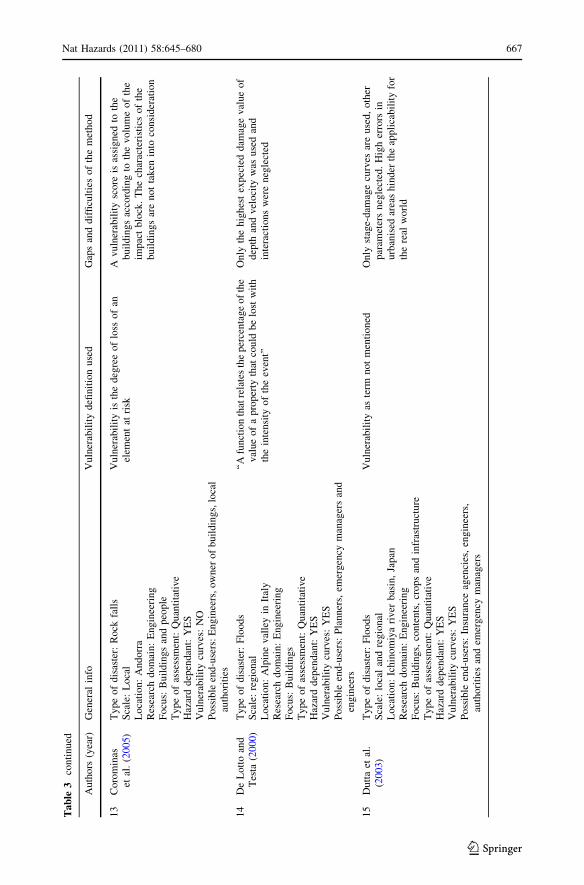
Ta
ble
3co
nti
nu
ed
Au
tho
rs(y
ear)
Gen
eral
info
Vu
lner
abil
ity
defi
nit
ion
use
dG
aps
and
dif
ficu
ltie
so
fth
em
eth
od
13
Coro
min
aset
al.
(20
05)
Ty
pe
of
dis
aste
r:R
ock
fall
sS
cale
:L
oca
lL
oca
tion:
Andorr
aR
esea
rch
do
mai
n:
En
gin
eeri
ng
Fo
cus:
Bu
ild
ing
san
dp
eop
leT
yp
eo
fas
sess
men
t:Q
uan
tita
tive
Haz
ard
dep
endan
t:Y
ES
Vu
lner
abil
ity
curv
es:
NO
Po
ssib
leen
d-u
sers
:E
ng
inee
rs,
ow
ner
of
bu
ild
ing
s,lo
cal
auth
ori
ties
Vu
lner
abil
ity
isth
ed
egre
eo
flo
sso
fan
elem
ent
atri
skA
vuln
erab
ilit
ysc
ore
isas
signed
toth
eb
uil
din
gs
acco
rdin
gto
the
vo
lum
eo
fth
eim
pac
tblo
ck.
The
char
acte
rist
ics
of
the
bu
ild
ing
sar
en
ot
tak
enin
toco
nsi
der
atio
n
14
De
Lo
tto
and
Tes
ta(2
00
0)
Ty
pe
of
dis
aste
r:F
loo
ds
Sca
le:
regio
nal
Loca
tion:
Alp
ine
val
ley
inIt
aly
Res
earc
hd
om
ain
:E
ng
inee
rin
gF
ocu
s:B
uil
din
gs
Ty
pe
of
asse
ssm
ent:
Qu
anti
tati
ve
Haz
ard
dep
endan
t:Y
ES
Vu
lner
abil
ity
curv
es:
YE
SP
oss
ible
end
-use
rs:
Pla
nn
ers,
emer
gen
cym
anag
ers
and
eng
inee
rs
‘‘A
funct
ion
that
rela
tes
the
per
centa
ge
of
the
val
ue
of
ap
rop
erty
that
cou
ldb
elo
stw
ith
the
inte
nsi
tyo
fth
eev
ent’’
Only
the
hig
hes
tex
pec
ted
dam
age
val
ue
of
dep
than
dv
eloci
tyw
asu
sed
and
inte
ract
ion
sw
ere
neg
lect
ed
15
Du
tta
etal
.(2
00
3)
Ty
pe
of
dis
aste
r:F
loo
ds
Sca
le:
loca
lan
dre
gio
nal
Loca
tion:
Ichin
om
iya
river
bas
in,
Japan
Res
earc
hd
om
ain
:E
ng
inee
rin
gF
ocu
s:B
uil
din
gs,
con
ten
ts,
crop
san
din
fras
tru
ctu
reT
yp
eo
fas
sess
men
t:Q
uan
tita
tive
Haz
ard
dep
endan
t:Y
ES
Vu
lner
abil
ity
curv
es:
YE
SP
oss
ible
end-u
sers
:In
sura
nce
agen
cies
,en
gin
eers
,au
tho
riti
esan
dem
erg
ency
man
ager
s
Vu
lner
abil
ity
aste
rmn
ot
men
tio
ned
On
lyst
age-
dam
age
curv
esar
eu
sed
,o
ther
par
amet
ers
neg
lect
ed.
Hig
her
rors
inu
rban
ised
area
sh
ind
erth
eap
pli
cab
ilit
yfo
rth
ere
alw
orl
d
Nat Hazards (2011) 58:645–680 667
123
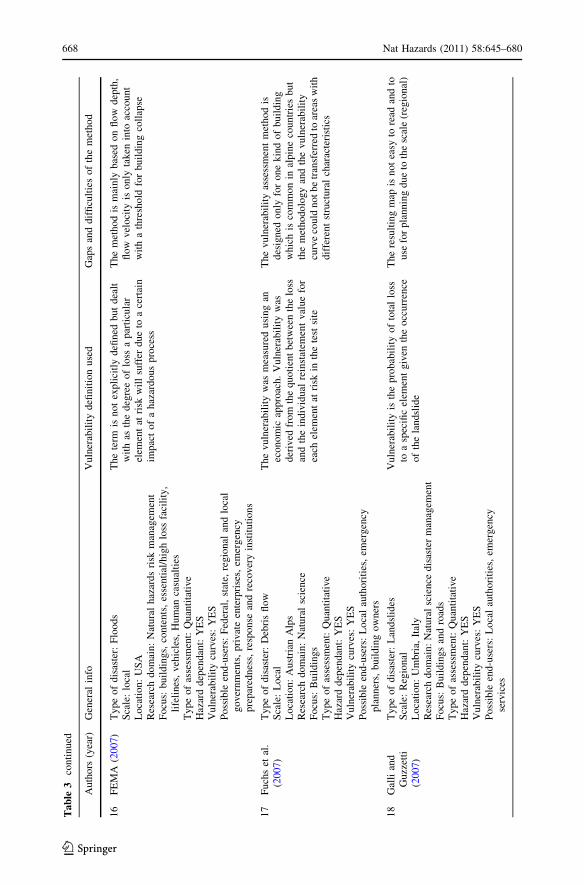
Ta
ble
3co
nti
nu
ed
Au
tho
rs(y
ear)
Gen
eral
info
Vu
lner
abil
ity
defi
nit
ion
use
dG
aps
and
dif
ficu
ltie
so
fth
em
eth
od
16
FE
MA
(20
07)
Ty
pe
of
dis
aste
r:F
loo
ds
Sca
le:
loca
lL
oca
tion:
US
AR
esea
rch
dom
ain:
Nat
ura
lhaz
ards
risk
man
agem
ent
Fo
cus:
bu
ild
ings,
con
ten
ts,
esse
nti
al/h
igh
loss
faci
lity
,li
feli
nes
,veh
icle
s,H
um
anca
sual
ties
Ty
pe
of
asse
ssm
ent:
Qu
anti
tati
ve
Haz
ard
dep
endan
t:Y
ES
Vu
lner
abil
ity
curv
es:
YE
SP
oss
ible
end
-use
rs:
Fed
eral
,st
ate,
reg
ion
alan
dlo
cal
go
ver
nm
ents
,p
riv
ate
ente
rpri
ses,
emer
gen
cypre
par
ednes
s,re
sponse
and
reco
ver
yin
stit
uti
ons
Th
ete
rmis
no
tex
pli
citl
yd
efin
edb
ut
dea
ltw
ith
asth
edeg
ree
of
loss
apar
ticu
lar
elem
ent
atri
skw
ill
suff
erd
ue
toa
cert
ain
impac
tof
ahaz
ardous
pro
cess
Th
em
eth
od
ism
ain
lyb
ased
on
flo
wd
epth
,fl
ow
vel
oci
tyis
on
lyta
ken
into
acco
un
tw
ith
ath
resh
old
for
bu
ild
ing
coll
apse
17
Fu
chs
etal
.(2
00
7)
Ty
pe
of
dis
aste
r:D
ebri
sfl
ow
Sca
le:
Lo
cal
Loca
tion:
Aust
rian
Alp
sR
esea
rch
do
mai
n:
Nat
ura
lsc
ien
ceF
ocu
s:B
uil
din
gs
Ty
pe
of
asse
ssm
ent:
Qu
anti
tati
ve
Haz
ard
dep
endan
t:Y
ES
Vu
lner
abil
ity
curv
es:
YE
SP
oss
ible
end
-use
rs:
Lo
cal
auth
ori
ties
,em
erg
ency
pla
nn
ers,
bu
ild
ing
ow
ner
s
Th
ev
uln
erab
ilit
yw
asm
easu
red
usi
ng
anec
on
om
icap
pro
ach
.V
uln
erab
ilit
yw
asd
eriv
edfr
om
the
qu
oti
ent
bet
wee
nth
elo
ssan
dth
ein
div
idual
rein
stat
emen
tv
alue
for
each
elem
ent
atri
skin
the
test
site
Th
ev
uln
erab
ilit
yas
sess
men
tm
eth
od
isd
esig
ned
on
lyfo
ro
ne
kin
do
fb
uil
din
gw
hic
his
com
mo
nin
alp
ine
cou
ntr
ies
bu
tth
em
eth
odo
log
yan
dth
ev
uln
erab
ilit
ycu
rve
could
not
be
tran
sfer
red
toar
eas
wit
hd
iffe
ren
tst
ruct
ura
lch
arac
teri
stic
s
18
Gal
lian
dG
uzz
etti
(20
07)
Ty
pe
of
dis
aste
r:L
and
slid
esS
cale
:R
egio
nal
Loca
tion:
Um
bri
a,It
aly
Res
earc
hdom
ain:
Nat
ura
lsc
ience
dis
aste
rm
anag
emen
tF
ocu
s:B
uil
din
gs
and
road
sT
yp
eo
fas
sess
men
t:Q
uan
tita
tive
Haz
ard
dep
endan
t:Y
ES
Vu
lner
abil
ity
curv
es:
YE
SP
oss
ible
end
-use
rs:
Lo
cal
auth
ori
ties
,em
erg
ency
serv
ices
Vu
lner
abil
ity
isth
ep
rob
abil
ity
of
tota
llo
ssto
asp
ecifi
cel
emen
tg
iven
the
occ
urr
ence
of
the
lan
dsl
ide
Th
ere
sult
ing
map
isn
ot
easy
tore
adan
dto
use
for
pla
nn
ing
du
eto
the
scal
e(r
egio
nal
)
668 Nat Hazards (2011) 58:645–680
123

Ta
ble
3co
nti
nu
ed
Au
tho
rs(y
ear)
Gen
eral
info
Vu
lner
abil
ity
defi
nit
ion
use
dG
aps
and
dif
ficu
ltie
so
fth
em
eth
od
19
Gru
nth
alet
al.
(20
06)
Ty
pe
of
dis
aste
r:F
loo
ds,
storm
s,ea
rth
quak
esS
cale
:re
gio
nal
Loca
tion:
Colo
gne,
Ger
man
yR
esea
rch
do
mai
n:
Nat
ura
lsc
ien
ce,
eng
inee
rin
g,
rein
sura
nce
Fo
cus:
Bu
ild
ing
san
dco
nte
nts
Ty
pe
of
asse
ssm
ent:
Qu
anti
tati
ve
Haz
ard
dep
endan
t:Y
ES
Vu
lner
abil
ity
curv
es:
YE
SP
oss
ible
end
-use
rs:
Dis
aste
rm
anag
ers,
urb
anp
lan
ner
s,in
sure
rs,
regio
nal
and
loca
lau
tho
riti
es,
etc.
Vu
lner
abil
ity
asse
ssm
ent:
‘‘ev
alu
atio
nh
ow
exp
ose
das
sets
wil
lsu
ffer
by
var
iou
shaz
ard
even
ts’’
On
lyin
un
dat
ion
dep
this
tak
enin
toac
cou
nt.
For
concr
ete
pla
nnin
gdec
isio
ns
and
emer
gen
cyst
rate
gie
sst
ill
more
det
aile
dan
aly
ses
mig
ht
be
nee
ded
20
Ho
oij
eret
al.
(20
01)
Ty
pe
of
dis
aste
r:F
loo
ds
Sca
le:
regio
nal
Loca
tion:
Hai
Riv
erB
asin
,C
hin
aR
esea
rch
do
mai
n:
En
gin
eeri
ng
Focu
s:A
gri
cult
ura
l/in
dust
rial
pro
duct
ion,
indust
rial
fixed
asse
ts,
house
hold
san
dpeo
ple
.T
yp
eo
fas
sess
men
t:Q
uan
tita
tive
Haz
ard
dep
endan
t:Y
ES
Vu
lner
abil
ity
curv
es:
NO
Po
ssib
leen
d-u
sers
:D
ecis
ion
mak
ers
for
pla
nn
ing
of
mit
igat
ion
mea
sure
s
Inst
ead
of
vu
lner
abil
ity
the
term
‘‘lo
ssra
te’’
isu
sed
wh
ich
isd
efin
edas
the
‘‘p
erce
nta
ge
of
tota
lp
ote
nti
ald
amag
ean
dn
um
ber
of
inh
abit
ants
’’
No
n-c
onti
nu
ous
app
roac
h,
on
lyco
nsi
der
ing
flood
dep
th.
The
dat
aav
aila
bil
ity
was
too
low
for
the
pro
pose
dm
eth
odo
log
yan
dth
us
the
resu
lts
are
no
tsu
ffici
ent
for
flo
od
man
agem
ent
cost
-ben
efit
anal
yse
s
21
Jon
asso
net
al.
(19
99)
Type
of
dis
aste
r:S
now
aval
anch
esS
cale
:lo
cal
Loca
tion:
Icel
and
Res
earc
hd
om
ain
:N
atu
ral
scie
nce
Fo
cus:
peo
ple
Ty
pe
of
asse
ssm
ent:
Qu
anti
tati
ve
Haz
ard
dep
endan
t:Y
ES
Vu
lner
abil
ity
curv
es:
NO
Po
ssib
leen
d-u
sers
:E
mer
gen
cyse
rvic
es
Th
ete
rm‘‘
vu
lner
abil
ity
’’is
no
tin
clu
ded
inth
isst
ud
y;
ho
wev
er,
the
surv
ival
pro
bab
ilit
y(w
hic
his
calc
ula
ted
inth
isst
ud
y)
cou
ldb
eu
sed
asa
com
po
nen
to
fa
vu
lner
abil
ity
asse
ssm
ent
tosn
ow
aval
anch
es
Th
em
eth
od
con
cern
so
nly
Icel
and
icty
pe
of
bu
ild
ing
san
dit
can
no
tb
etr
ansf
erre
del
sew
her
e
Nat Hazards (2011) 58:645–680 669
123
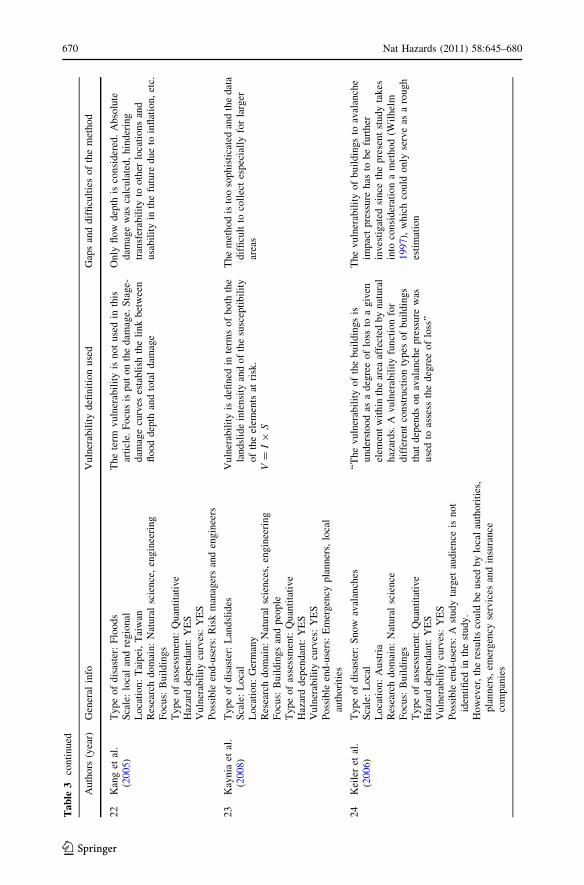
Ta
ble
3co
nti
nu
ed
Au
tho
rs(y
ear)
Gen
eral
info
Vu
lner
abil
ity
defi
nit
ion
use
dG
aps
and
dif
ficu
ltie
so
fth
em
eth
od
22
Kan
get
al.
(20
05)
Ty
pe
of
dis
aste
r:F
loo
ds
Sca
le:
loca
lan
dre
gio
nal
Loca
tion:
Tai
pei
,T
aiw
anR
esea
rch
do
mai
n:
Nat
ura
lsc
ien
ce,
eng
inee
rin
gF
ocu
s:B
uil
din
gs
Ty
pe
of
asse
ssm
ent:
Qu
anti
tati
ve
Haz
ard
dep
endan
t:Y
ES
Vu
lner
abil
ity
curv
es:
YE
SP
oss
ible
end
-use
rs:
Ris
km
anag
ers
and
eng
inee
rs
The
term
vuln
erab
ilit
yis
not
use
din
this
arti
cle.
Fo
cus
isp
ut
on
the
dam
age.
Sta
ge-
dam
age
curv
eses
tabli
shth
eli
nk
bet
wee
nfl
oo
dd
epth
and
tota
ld
amag
e
On
lyfl
ow
dep
this
con
sid
ered
.A
bso
lute
dam
age
was
calc
ula
ted
,h
ind
erin
gtr
ansf
erab
ilit
yto
oth
erlo
cati
on
san
du
sab
ilit
yin
the
futu
red
ue
toin
flat
ion
,et
c.
23
Kay
nia
etal
.(2
00
8)
Ty
pe
of
dis
aste
r:L
and
slid
esS
cale
:L
oca
lL
oca
tion:
Ger
man
yR
esea
rch
do
mai
n:
Nat
ura
lsc
ien
ces,
eng
inee
rin
gF
ocu
s:B
uil
din
gs
and
peo
ple
Ty
pe
of
asse
ssm
ent:
Qu
anti
tati
ve
Haz
ard
dep
endan
t:Y
ES
Vu
lner
abil
ity
curv
es:
YE
SP
oss
ible
end
-use
rs:
Em
erg
ency
pla
nn
ers,
loca
lau
tho
riti
es
Vu
lner
abil
ity
isd
efined
inte
rms
of
bo
thth
ela
ndsl
ide
inte
nsi
tyan
do
fth
esu
scep
tib
ilit
yo
fth
eel
emen
tsat
risk
.V
=I
9S
Th
em
eth
od
isto
oso
ph
isti
cate
dan
dth
ed
ata
dif
ficu
ltto
coll
ect
esp
ecia
lly
for
larg
erar
eas
24
Kei
ler
etal
.(2
00
6)
Type
of
dis
aste
r:S
now
aval
anch
esS
cale
:L
oca
lL
oca
tion:
Aust
ria
Res
earc
hd
om
ain
:N
atu
ral
scie
nce
Fo
cus:
Bu
ild
ing
sT
yp
eo
fas
sess
men
t:Q
uan
tita
tive
Haz
ard
dep
endan
t:Y
ES
Vu
lner
abil
ity
curv
es:
YE
SP
oss
ible
end
-use
rs:
Ast
ud
yta
rget
aud
ien
ceis
no
tid
enti
fied
inth
est
ud
y.
Ho
wev
er,
the
resu
lts
cou
ldb
eu
sed
by
loca
lau
tho
riti
es,
pla
nn
ers,
emer
gen
cyse
rvic
esan
din
sura
nce
com
pan
ies
‘‘T
he
vuln
erab
ilit
yof
the
buil
din
gs
isu
nd
erst
oo
das
ad
egre
eo
flo
ssto
ag
iven
elem
ent
wit
hin
the
area
affe
cted
by
nat
ura
lhaz
ards.
Avuln
erab
ilit
yfu
nct
ion
for
dif
fere
nt
con
stru
ctio
nty
pes
of
bu
ild
ing
sth
atdep
ends
on
aval
anch
epre
ssure
was
use
dto
asse
ssth
ed
egre
eo
flo
ss’’
The
vuln
erab
ilit
yof
buil
din
gs
toav
alan
che
imp
act
pre
ssu
reh
asto
be
furt
her
inves
tigat
edsi
nce
the
pre
sent
study
takes
into
con
sid
erat
ion
am
eth
od
(Wil
hel
m1
99
7),
wh
ich
cou
ldo
nly
serv
eas
aro
ug
hes
tim
atio
n
670 Nat Hazards (2011) 58:645–680
123

Ta
ble
3co
nti
nu
ed
Au
tho
rs(y
ear)
Gen
eral
info
Vu
lner
abil
ity
defi
nit
ion
use
dG
aps
and
dif
ficu
ltie
so
fth
em
eth
od
25
Key
lock
and
Bar
boli
ni
(20
01)
Type
of
dis
aste
r:S
now
aval
anch
esS
cale
:L
oca
lL
oca
tion:
Icel
and
Res
earc
hd
om
ain
:N
atu
ral
scie
nce
Fo
cus:
Bu
ild
ing
sT
yp
eo
fas
sess
men
t:Q
uan
tita
tive
Haz
ard
dep
endan
t:Y
ES
Vu
lner
abil
ity
curv
es:
NO
Po
ssib
leen
d-u
sers
:A
val
anch
eex
per
ts,
eng
inee
rs,
pla
nn
ers,
dec
isio
nm
aker
s
Vu
lner
abil
ity
isd
efined
asth
ed
egre
eo
flo
ss,
and
itis
exp
ress
edo
na
scal
eo
f0
(no
loss
)to
1(t
ota
llo
ss).
Fo
rp
rop
erty
,th
elo
ssw
ill
be
the
val
ue
of
the
pro
per
tyan
dfo
rp
erso
ns
the
pro
bab
ilit
yth
ata
par
ticu
lar
life
cou
ldb
elo
st
Ver
ysi
mp
lere
lati
on
for
the
esti
mat
ion
of
the
vuln
erab
ilit
y(d
eriv
edfr
om
one
even
t).
Dif
fere
nt
bu
ild
ings
types
are
no
tre
gar
ded
26
Leo
ne
etal
.(1
99
6)
Ty
pe
of
dis
aste
r:L
and
slid
esS
cale
:R
egio
nal
/lo
cal
Loca
tion:
-R
esea
rch
do
mai
n:
Nat
ura
lsc
ien
ces
Fo
cus:
Mu
lti-
dim
ensi
onal
Ty
pe
of
asse
ssm
ent:
Qu
anti
tati
ve
Haz
ard
dep
endan
t:Y
ES
Vu
lner
abil
ity
curv
es:
NO
Po
ssib
leen
d-u
sers
:E
nd
-use
rsar
en
ot
defi
ned
bu
tlo
cal
auth
ori
ties
and
emer
gen
cyp
lan
ner
sco
uld
use
the
ou
tco
mes
of
this
stud
y
Vu
lner
abil
ity
isd
efin
edas
the
lev
elo
fp
ote
nti
ald
amag
e(0
–1
)to
ag
iven
exp
ose
del
emen
tw
hic
his
sub
ject
toa
po
ssib
leo
rre
alp
hen
om
eno
no
fa
giv
enin
ten
sity
Th
ep
ote
nti
ald
amag
ele
vel
for
dif
fere
nt
elem
ents
atri
skis
giv
enin
ata
ble
wit
ho
ut
bei
ng
exp
lain
edo
rco
nn
ecte
dw
ith
dif
fere
nt
pro
cess
inte
nsi
ties
27
Liu
and
Lei
(20
03)
Ty
pe
of
dis
aste
r:D
ebri
sfl
ow
Sca
le:
Reg
ional
Loca
tion:
Chin
aR
esea
rch
do
mai
n:
Nat
ura
lsc
ien
ce,
Dis
aste
rm
anag
emen
tF
ocu
s:M
ult
i-d
imen
sio
nal
physi
cal,
econom
ic,
envir
onm
enta
lT
yp
eo
fas
sess
men
t:Q
uan
tita
tive
Haz
ard
dep
endan
t:N
OV
uln
erab
ilit
ycu
rves
:Y
ES
Po
ssib
leen
d-u
sers
:R
egio
nal
or
centr
alg
ov
ern
men
t
Vu
lner
abil
ity
isd
efin
edas
the
po
ten
tial
tota
lm
axim
um
loss
du
eto
ap
ote
nti
ald
amag
ing
ph
enom
eno
nfo
ra
spec
ific
area
and
for
are
fere
nce
per
iod
Th
eap
pro
ach
can
be
use
dfo
rfu
nd
ing
allo
cati
on
bu
td
ue
toit
sre
gio
nal
scal
ean
dth
ed
iffi
cult
yo
fth
ed
ata
tob
eco
llec
ted
on
alo
cal
scal
e,ca
nn
ot
be
use
din
alo
cal
scal
e
Nat Hazards (2011) 58:645–680 671
123
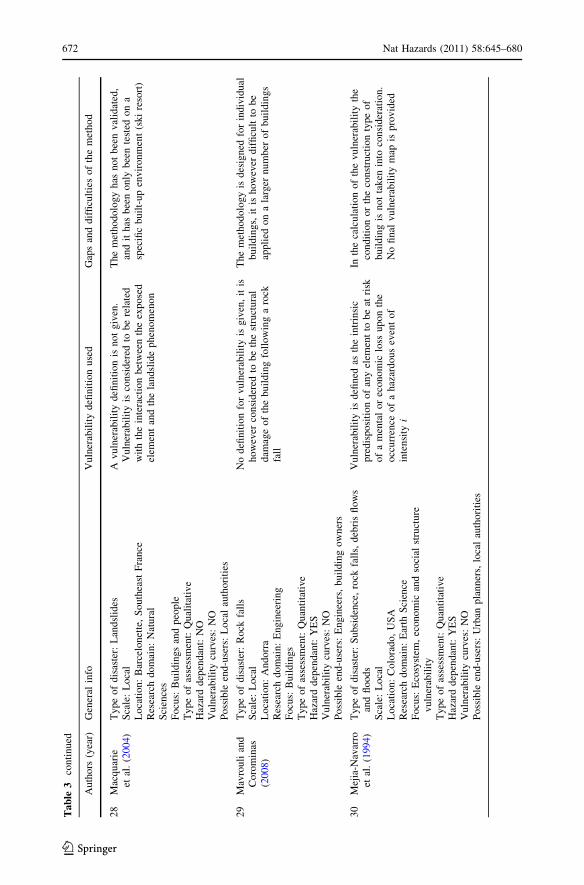
Ta
ble
3co
nti
nu
ed
Au
tho
rs(y
ear)
Gen
eral
info
Vu
lner
abil
ity
defi
nit
ion
use
dG
aps
and
dif
ficu
ltie
so
fth
em
eth
od
28
Mac
qu
arie
etal
.(2
00
4)
Ty
pe
of
dis
aste
r:L
and
slid
esS
cale
:L
oca
lL
oca
tion:
Bar
celo
net
te,
South
east
Fra
nce
Res
earc
hd
om
ain
:N
atu
ral
Sci
ence
sF
ocu
s:B
uil
din
gs
and
peo
ple
Ty
pe
of
asse
ssm
ent:
Qu
alit
ativ
eH
azar
dd
epen
dan
t:N
OV
uln
erab
ilit
ycu
rves
:N
OP
oss
ible
end
-use
rs:
Lo
cal
auth
ori
ties
Av
uln
erab
ilit
yd
efinit
ion
isn
ot
giv
en.
Vu
lner
abil
ity
isco
nsi
der
edto
be
rela
ted
wit
hth
ein
tera
ctio
nbet
wee
nth
eex
pose
del
emen
tan
dth
ela
ndsl
ide
ph
enom
eno
n
Th
em
eth
odo
log
yh
asn
ot
bee
nv
alid
ated
,an
dit
has
bee
no
nly
bee
nte
sted
on
asp
ecifi
cb
uil
t-u
pen
vir
on
men
t(s
ki
reso
rt)
29
Mav
rou
lian
dC
oro
min
as(2
00
8)
Ty
pe
of
dis
aste
r:R
ock
fall
sS
cale
:L
oca
lL
oca
tion:
Andorr
aR
esea
rch
do
mai
n:
En
gin
eeri
ng
Fo
cus:
Bu
ild
ing
sT
yp
eo
fas
sess
men
t:Q
uan
tita
tive
Haz
ard
dep
endan
t:Y
ES
Vu
lner
abil
ity
curv
es:
NO
Po
ssib
leen
d-u
sers
:E
ng
inee
rs,
bu
ild
ing
ow
ner
s
No
defi
nit
ion
for
vu
lner
abil
ity
isg
iven
,it
ish
ow
ever
con
sid
ered
tob
eth
est
ruct
ura
ld
amag
eo
fth
eb
uil
din
gfo
llo
win
ga
rock
fall
Th
em
eth
odo
log
yis
des
ign
edfo
rin
div
idu
alb
uil
din
gs,
itis
ho
wev
erd
iffi
cult
tob
eap
pli
edo
na
larg
ern
um
ber
of
bu
ild
ings
30
Mej
ia-N
avar
roet
al.
(19
94)
Ty
pe
of
dis
aste
r:S
ubsi
den
ce,
rock
fall
s,d
ebri
sfl
ow
san
dfl
ood
sS
cale
:L
oca
lL
oca
tion:
Colo
rado,
US
AR
esea
rch
do
mai
n:
Ear
thS
cien
ceF
ocu
s:E
cosy
stem
,ec
on
om
ican
dso
cial
stru
ctu
revuln
erab
ilit
yT
yp
eo
fas
sess
men
t:Q
uan
tita
tive
Haz
ard
dep
endan
t:Y
ES
Vu
lner
abil
ity
curv
es:
NO
Po
ssib
leen
d-u
sers
:U
rban
pla
nn
ers,
loca
lau
tho
riti
es
Vu
lner
abil
ity
isd
efin
edas
the
intr
insi
cp
red
isp
osi
tio
no
fan
yel
emen
tto
be
atri
sko
fa
men
tal
or
eco
no
mic
loss
up
on
the
occ
urr
ence
of
ah
azar
do
us
even
to
fin
ten
sity
i
Inth
eca
lcu
lati
on
of
the
vu
lner
abil
ity
the
con
dit
ion
or
the
con
stru
ctio
nty
pe
of
bu
ild
ing
isn
ot
tak
enin
toco
nsi
der
atio
n.
No
fin
alv
uln
erab
ilit
ym
apis
pro
vid
ed
672 Nat Hazards (2011) 58:645–680
123
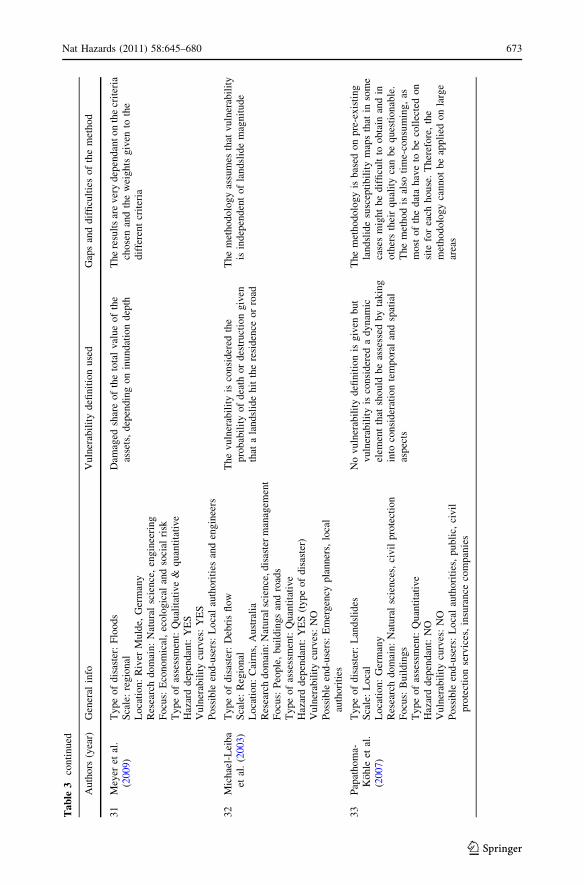
Ta
ble
3co
nti
nu
ed
Au
tho
rs(y
ear)
Gen
eral
info
Vu
lner
abil
ity
defi
nit
ion
use
dG
aps
and
dif
ficu
ltie
so
fth
em
eth
od
31
Mey
eret
al.
(20
09)
Ty
pe
of
dis
aste
r:F
loo
ds
Sca
le:
regio
nal
Loca
tion:
Riv
erM
uld
e,G
erm
any
Res
earc
hd
om
ain
:N
atu
ral
scie
nce
,en
gin
eeri
ng
Fo
cus:
Eco
nom
ical
,ec
olo
gic
alan
dso
cial
risk
Ty
pe
of
asse
ssm
ent:
Qu
alit
ativ
e&
qu
anti
tati
ve
Haz
ard
dep
endan
t:Y
ES
Vu
lner
abil
ity
curv
es:
YE
SP
oss
ible
end
-use
rs:
Lo
cal
auth
ori
ties
and
eng
inee
rs
Dam
aged
shar
eof
the
tota
lval
ue
of
the
asse
ts,
dep
endin
gon
inundat
ion
dep
thT
he
resu
lts
are
ver
yd
epen
dan
to
nth
ecr
iter
iach
ose
nan
dth
ew
eig
hts
giv
ento
the
dif
fere
nt
crit
eria
32
Mic
hae
l-L
eiba
etal
.(2
00
3)
Ty
pe
of
dis
aste
r:D
ebri
sfl
ow
Sca
le:
Reg
ional
Loca
tion:
Cai
rns,
Aust
rali
aR
esea
rch
dom
ain:
Nat
ura
lsc
ience
,dis
aste
rm
anag
emen
tF
ocu
s:P
eople
,b
uil
din
gs
and
road
sT
yp
eo
fas
sess
men
t:Q
uan
tita
tive
Haz
ard
dep
endan
t:Y
ES
(ty
pe
of
dis
aste
r)V
uln
erab
ilit
ycu
rves
:N
OP
oss
ible
end
-use
rs:
Em
erg
ency
pla
nn
ers,
loca
lau
tho
riti
es
Th
ev
uln
erab
ilit
yis
con
sid
ered
the
pro
bab
ilit
yo
fd
eath
or
des
truct
ion
giv
enth
ata
lan
dsl
ide
hit
the
resi
den
ceo
rro
ad
Th
em
eth
odo
log
yas
sum
esth
atv
uln
erab
ilit
yis
ind
epen
den
to
fla
nd
slid
em
agn
itu
de
33
Pap
ath
om
a-K
oh
leet
al.
(20
07)
Ty
pe
of
dis
aste
r:L
and
slid
esS
cale
:L
oca
lL
oca
tion:
Ger
man
yR
esea
rch
dom
ain:
Nat
ura
lsc
ience
s,ci
vil
pro
tect
ion
Fo
cus:
Bu
ild
ing
sT
yp
eo
fas
sess
men
t:Q
uan
tita
tive
Haz
ard
dep
endan
t:N
OV
uln
erab
ilit
ycu
rves
:N
OP
oss
ible
end
-use
rs:
Lo
cal
auth
ori
ties
,p
ub
lic,
civ
ilp
rote
ctio
nse
rvic
es,
insu
ran
ceco
mp
anie
s
No
vu
lner
abil
ity
defi
nit
ion
isg
iven
bu
tv
uln
erab
ilit
yis
con
sid
ered
ad
yn
amic
elem
ent
that
sho
uld
be
asse
ssed
by
tak
ing
into
con
sid
erat
ion
tem
po
ral
and
spat
ial
asp
ects
Th
em
eth
odo
log
yis
bas
edo
np
re-e
xis
ting
lan
dsl
ide
susc
epti
bil
ity
map
sth
atin
som
eca
ses
mig
ht
be
dif
ficu
ltto
ob
tain
and
ino
ther
sth
eir
qu
alit
yca
nb
eq
ues
tion
able
.T
he
met
hod
isal
soti
me-
consu
min
g,
asm
ost
of
the
dat
ah
ave
tob
eco
llec
ted
on
site
for
each
ho
use
.T
her
efo
re,
the
met
ho
do
log
yca
nn
ot
be
app
lied
on
larg
ear
eas
Nat Hazards (2011) 58:645–680 673
123
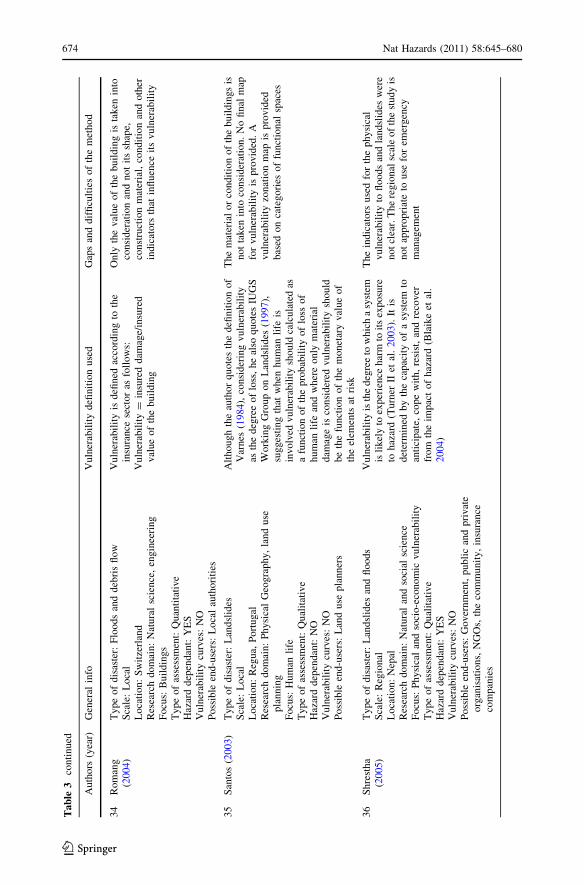
Ta
ble
3co
nti
nu
ed
Au
tho
rs(y
ear)
Gen
eral
info
Vu
lner
abil
ity
defi
nit
ion
use
dG
aps
and
dif
ficu
ltie
so
fth
em
eth
od
34
Rom
ang
(20
04)
Ty
pe
of
dis
aste
r:F
loo
ds
and
deb
ris
flo
wS
cale
:L
oca
lL
oca
tion:
Sw
itze
rlan
dR
esea
rch
do
mai
n:
Nat
ura
lsc
ien
ce,
eng
inee
rin
gF
ocu
s:B
uil
din
gs
Ty
pe
of
asse
ssm
ent:
Qu
anti
tati
ve
Haz
ard
dep
endan
t:Y
ES
Vu
lner
abil
ity
curv
es:
NO
Po
ssib
leen
d-u
sers
:L
oca
lau
tho
riti
es
Vu
lner
abil
ity
isd
efin
edac
cord
ing
toth
ein
sura
nce
sect
or
asfo
llo
ws:
Vu
lner
abil
ity
=in
sure
dd
amag
e/in
sure
dv
alue
of
the
bu
ild
ing
On
lyth
ev
alue
of
the
bu
ild
ing
ista
ken
into
con
sid
erat
ion
and
no
tit
ssh
ape,
con
stru
ctio
nm
ater
ial,
con
dit
ion
and
oth
erin
dic
ato
rsth
atin
flu
ence
its
vu
lner
abil
ity
35
San
tos
(20
03)
Ty
pe
of
dis
aste
r:L
and
slid
esS
cale
:L
oca
lL
oca
tion:
Reg
ua,
Port
ugal
Res
earc
hd
om
ain
:P
hysi
cal
Geo
gra
phy
,la
nd
use
pla
nn
ing
Fo
cus:
Hu
man
life
Ty
pe
of
asse
ssm
ent:
Qu
alit
ativ
eH
azar
dd
epen
dan
t:N
OV
uln
erab
ilit
ycu
rves
:N
OP
oss
ible
end
-use
rs:
Lan
du
sep
lann
ers
Alt
ho
ug
hth
eau
tho
rq
uo
tes
the
defi
nit
ion
of
Var
nes
(19
84),
con
sid
erin
gv
uln
erab
ilit
yas
the
deg
ree
of
loss
,h
eal
soq
uo
tes
IUG
SW
ork
ing
Gro
up
on
Lan
dsl
ides
(19
97),
sug
ges
tin
gth
atw
hen
hu
man
life
isin
vo
lved
vu
lner
abil
ity
sho
uld
calc
ula
ted
asa
fun
ctio
no
fth
ep
rob
abil
ity
of
loss
of
hu
man
life
and
wh
ere
on
lym
ater
ial
dam
age
isco
nsi
der
edv
uln
erab
ilit
ysh
ould
be
the
fun
ctio
no
fth
em
on
etar
yv
alue
of
the
elem
ents
atri
sk
Th
em
ater
ial
or
con
dit
ion
of
the
bu
ild
ings
isn
ot
tak
enin
toco
nsi
der
atio
n.
No
fin
alm
apfo
rv
uln
erab
ilit
yis
pro
vid
ed.
Avuln
erab
ilit
yzo
nat
ion
map
ispro
vid
edbas
edo
nca
tegori
esof
funct
ional
spac
es
36
Sh
rest
ha
(20
05)
Ty
pe
of
dis
aste
r:L
and
slid
esan
dfl
oo
ds
Sca
le:
Reg
ional
Loca
tion:
Nep
alR
esea
rch
do
mai
n:
Nat
ura
lan
dso
cial
scie
nce
Fo
cus:
Ph
ysi
cal
and
soci
o-e
con
om
icv
uln
erab
ilit
yT
yp
eo
fas
sess
men
t:Q
ual
itat
ive
Haz
ard
dep
endan
t:Y
ES
Vu
lner
abil
ity
curv
es:
NO
Po
ssib
leen
d-u
sers
:G
ov
ern
men
t,p
ub
lic
and
pri
vat
eo
rgan
isat
ion
s,N
GO
s,th
eco
mm
un
ity
,in
sura
nce
com
pan
ies
Vu
lner
abil
ity
isth
ed
egre
eto
wh
ich
asy
stem
isli
kel
yto
exp
erie
nce
har
mto
its
exp
osu
reto
haz
ard
(Tu
rner
IIet
al.
20
03).
Itis
det
erm
ined
by
the
cap
acit
yo
fa
syst
emto
anti
cipat
e,co
pe
wit
h,
resi
st,
and
reco
ver
fro
mth
eim
pac
to
fh
azar
d(B
laik
eet
al.
20
04)
Th
ein
dic
ato
rsu
sed
for
the
ph
ysi
cal
vuln
erab
ilit
yto
floods
and
landsl
ides
wer
en
ot
clea
r.T
he
reg
ion
alsc
ale
of
the
stu
dy
isn
ot
app
ropri
ate
tou
sefo
rem
erg
ency
man
agem
ent
674 Nat Hazards (2011) 58:645–680
123
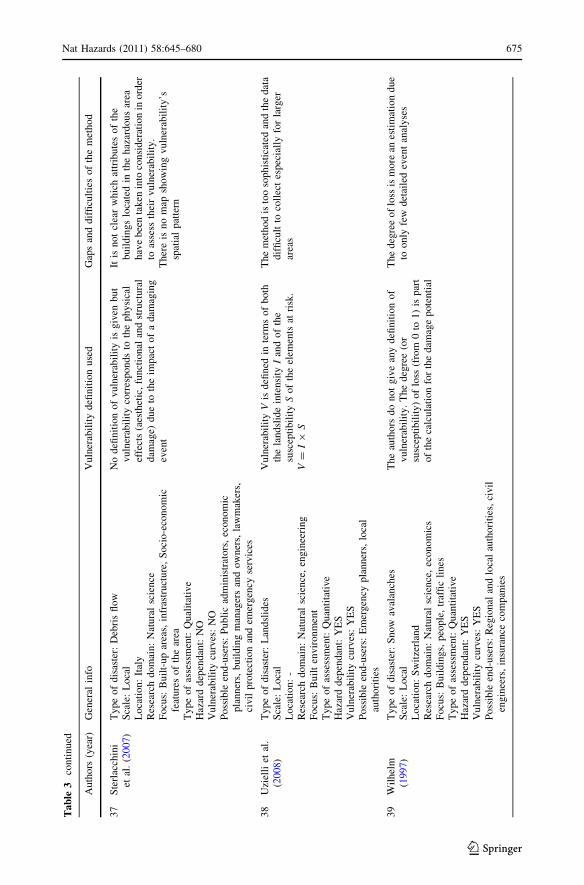
Ta
ble
3co
nti
nu
ed
Au
tho
rs(y
ear)
Gen
eral
info
Vu
lner
abil
ity
defi
nit
ion
use
dG
aps
and
dif
ficu
ltie
so
fth
em
eth
od
37
Ste
rlac
chin
iet
al.
(20
07)
Ty
pe
of
dis
aste
r:D
ebri
sfl
ow
Sca
le:
Lo
cal
Loca
tion:
Ital
yR
esea
rch
do
mai
n:
Nat
ura
lsc
ien
ceF
ocu
s:B
uil
t-u
par
eas,
infr
astr
uct
ure
,S
oci
o-e
con
om
icfe
atu
res
of
the
area
Ty
pe
of
asse
ssm
ent:
Qu
alit
ativ
eH
azar
dd
epen
dan
t:N
OV
uln
erab
ilit
ycu
rves
:N
OP
oss
ible
end
-use
rs:
Pu
bli
cad
min
istr
ato
rs,
econ
om
icp
lann
ers,
bu
ild
ing
man
ager
san
do
wn
ers,
law
mak
ers,
civ
ilp
rote
ctio
nan
dem
erg
ency
serv
ices
No
defi
nit
ion
of
vuln
erab
ilit
yis
giv
enbut
vu
lner
abil
ity
corr
esp
on
ds
toth
ep
hy
sica
lef
fect
s(a
esth
etic
,fu
nct
ional
and
stru
ctura
ld
amag
e)d
ue
toth
eim
pac
to
fa
dam
agin
gev
ent
Itis
no
tcl
ear
wh
ich
attr
ibute
so
fth
ebuil
din
gs
loca
ted
inth
ehaz
ardous
area
hav
eb
een
tak
enin
toco
nsi
der
atio
nin
ord
erto
asse
ssth
eir
vu
lner
abil
ity
.T
her
eis
no
map
show
ing
vuln
erab
ilit
y’s
spat
ial
pat
tern
38
Uzi
elli
etal
.(2
00
8)
Ty
pe
of
dis
aste
r:L
and
slid
esS
cale
:L
oca
lL
oca
tion:
-R
esea
rch
do
mai
n:
Nat
ura
lsc
ien
ce,
eng
inee
rin
gF
ocu
s:B
uil
ten
vir
on
men
tT
yp
eo
fas
sess
men
t:Q
uan
tita
tive
Haz
ard
dep
endan
t:Y
ES
Vu
lner
abil
ity
curv
es:
YE
SP
oss
ible
end
-use
rs:
Em
erg
ency
pla
nn
ers,
loca
lau
tho
riti
es
Vu
lner
abil
ity
Vis
defi
ned
inte
rms
of
bo
thth
ela
nd
slid
ein
ten
sity
Ian
do
fth
esu
scep
tib
ilit
yS
of
the
elem
ents
atri
sk.
V=
I9
S
Th
em
eth
od
isto
oso
ph
isti
cate
dan
dth
ed
ata
dif
ficu
ltto
coll
ect
esp
ecia
lly
for
larg
erar
eas
39
Wil
hel
m(1
99
7)
Type
of
dis
aste
r:S
now
aval
anch
esS
cale
:L
oca
lL
oca
tion:
Sw
itze
rlan
dR
esea
rch
do
mai
n:
Nat
ura
lsc
ien
ce,
eco
no
mic
sF
ocu
s:B
uil
din
gs,
peo
ple
,tr
affi
cli
nes
Ty
pe
of
asse
ssm
ent:
Qu
anti
tati
ve
Haz
ard
dep
endan
t:Y
ES
Vu
lner
abil
ity
curv
es:
YE
SP
oss
ible
end
-use
rs:
Reg
ion
alan
dlo
cal
auth
ori
ties
,ci
vil
eng
inee
rs,
insu
ran
ceco
mp
anie
s
Th
eau
tho
rsd
on
ot
giv
ean
yd
efin
itio
no
fv
uln
erab
ilit
y.
Th
ed
egre
e(o
rsu
scep
tib
ilit
y)
of
loss
(fro
m0
to1
)is
par
to
fth
eca
lcu
lati
on
for
the
dam
age
po
ten
tial
Th
ed
egre
eo
flo
ssis
mo
rean
esti
mat
ion
du
eto
on
lyfe
wd
etai
led
even
tan
aly
ses
Nat Hazards (2011) 58:645–680 675
123
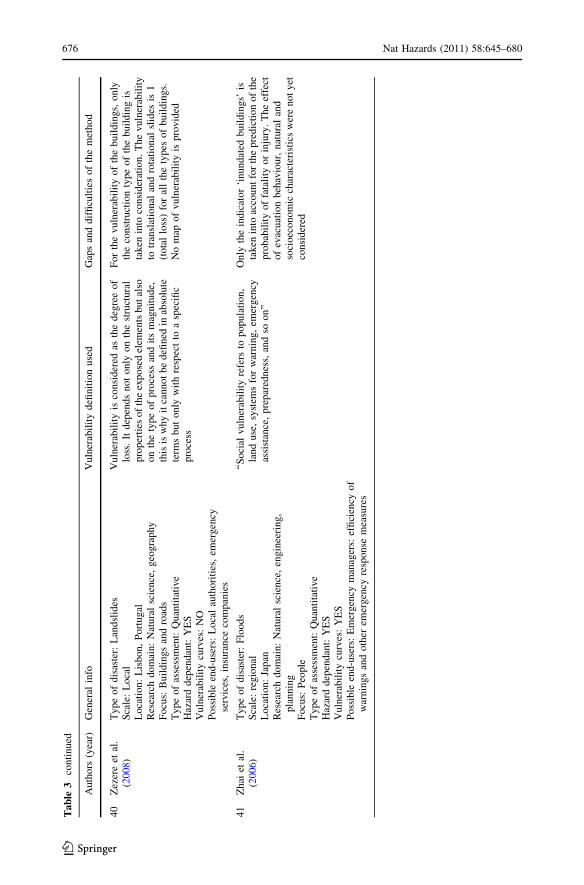
Ta
ble
3co
nti
nu
ed
Au
tho
rs(y
ear)
Gen
eral
info
Vu
lner
abil
ity
defi
nit
ion
use
dG
aps
and
dif
ficu
ltie
so
fth
em
eth
od
40
Zez
ere
etal
.(2
00
8)
Ty
pe
of
dis
aste
r:L
and
slid
esS
cale
:L
oca
lL
oca
tion:
Lis
bon,
Port
ugal
Res
earc
hd
om
ain
:N
atu
ral
scie
nce
,g
eog
rap
hy
Fo
cus:
Bu
ild
ing
san
dro
ads
Ty
pe
of
asse
ssm
ent:
Qu
anti
tati
ve
Haz
ard
dep
endan
t:Y
ES
Vu
lner
abil
ity
curv
es:
NO
Po
ssib
leen
d-u
sers
:L
oca
lau
tho
riti
es,
emer
gen
cyse
rvic
es,
insu
ran
ceco
mp
anie
s
Vu
lner
abil
ity
isco
nsi
der
edas
the
deg
ree
of
loss
.It
dep
end
sn
ot
on
lyo
nth
est
ruct
ura
lp
rop
erti
eso
fth
eex
po
sed
elem
ents
bu
tal
soo
nth
ety
pe
of
pro
cess
and
its
mag
nit
ud
e,th
isis
wh
yit
cann
ot
be
defi
ned
inab
solu
tete
rms
bu
to
nly
wit
hre
spec
tto
asp
ecifi
cp
roce
ss
Fo
rth
ev
uln
erab
ilit
yo
fth
eb
uil
din
gs,
on
lyth
eco
nst
ruct
ion
type
of
the
bu
ild
ing
ista
ken
into
con
sid
erat
ion
.T
he
vu
lner
abil
ity
totr
ansl
atio
nal
and
rota
tion
alsl
ides
is1
(to
tal
loss
)fo
ral
lth
ety
pes
of
bu
ild
ing
s.N
om
apo
fv
uln
erab
ilit
yis
pro
vid
ed
41
Zh
aiet
al.
(20
06)
Ty
pe
of
dis
aste
r:F
loo
ds
Sca
le:
regio
nal
Loca
tion:
Japan
Res
earc
hd
om
ain
:N
atu
ral
scie
nce
,en
gin
eeri
ng
,p
lann
ing
Fo
cus:
Peo
ple
Ty
pe
of
asse
ssm
ent:
Qu
anti
tati
ve
Haz
ard
dep
endan
t:Y
ES
Vu
lner
abil
ity
curv
es:
YE
SP
oss
ible
end
-use
rs:
Em
erg
ency
man
ager
s:ef
fici
ency
of
war
nin
gs
and
oth
erem
ergen
cyre
sponse
mea
sure
s
‘‘S
oci
alvuln
erab
ilit
yre
fers
topopula
tion,
land
use
,sy
stem
sfo
rw
arnin
g,
emer
gen
cyas
sist
ance
,p
rep
ared
nes
s,an
dso
on
’’
On
lyth
ein
dic
ato
r‘i
nu
nd
ated
bu
ild
ing
s’is
tak
enin
toac
cou
nt
for
the
pre
dic
tio
no
fth
ep
rob
abil
ity
of
fata
lity
or
inju
ry.
Th
eef
fect
of
evac
uat
ion
beh
avio
ur,
nat
ura
lan
dso
cioec
onom
icch
arac
teri
stic
sw
ere
not
yet
con
sid
ered
676 Nat Hazards (2011) 58:645–680
123
References
Akbas SO, Blahut J, Sterlacchini S (2009) Critical assessment of existing physical vulnerability estimationapproaches for debris flows. In: Malet JP, Remaitre A, Bogaard T (eds) Proceedings of landslideprocesses: from geomorphologic mapping to dynamic modelling. Strasburg, France, 6–7 February2009, pp 229–233
Alexander D (2005) Vulnerability to landslides. In: Glade T, Anderson M, Crozier M (eds) Landslide hazardand risk. Wiley, Chichester, UK, pp 175–198
Barbolini M, Cappabianca F, Sailer R (2004) Empirical estimate of vulnerability relations for use in snowavalanche risk assessment. In: Brebbia CA (ed) Risk analysis, IV. WIT Press, Southampton,pp 533–542
Barredo J (2007) Major flood disasters in Europe: 1950–2005. Nat Hazards 42:125–148Bell R, Glade T (2004) Quantitative risk analysis for landslides - Examples from Bildudalur, NW-Iceland.
Nat Hazards Earth Syst Sci 4:117–131Bertrand D, Naaim M, Brun M (2010) Physical vulnerability of reinforced concrete buildings impacted by
snow avalanches. Nat Hazards Earth Syst Sci 10:1531–1545BFF, SLF (Bundesamt fur Forstwesen, Eidgenossisches Institut fur Schnee- und Lawinenforschung) (1984)
Richtlinien zur Berucksichtigung der Lawinengefahr bei raumwirksamen Tatigkeiten. Bundesamt furForstwesen, Eidgenossisches Institut fur Schnee- und Lawinenforschung, Davos und Bern
Birkmann J (2006) Indicators and criteria for measuring vulnerability: Theoretical bases and requirements.In: Birkmann J (ed) Measuring Vulnerability to Natural Hazards. United Nations University Press,pp 55–77
Blaikie P, Cannon T, Davis I, Wisner B (1994) At Risk, Natural Hazards, People’s Vulnerability andDisasters. Routledge Press, London, p 284
Blochl A, Braun B (2005) Economic assessment of landslide risks in the Schwabian Alb, Germany -researchframework and first results of homeowners and experts surveys. Nat Hazards Earth Syst Sci 5:389–396
Bohle HG, Glade T (2007) Vulnerabilitatskonzepte in Sozial- und Naturwissenschaften. In: Felgentreff C,Glade T (eds) Naturrisiken und Sozialkatastrophen, pp 99–119
Brooks N (2003) Vulnerability risk and adaptation: a conceptual framework, Tyndall Centre for ClimateChange Research. Working paper 38:1–16
Brundl, M. (Editor), 2009. Risikokonzept fur Naturgefahren. Einzelprojekt A1.1: Leitfaden. NationalePlattform Naturgefahren PLANAT, Bern, p 420. http://www.planat.ch/ressources/planat_product_de_1110.pdf)
Brundl M, Romang HE, Bischof N, Rheinberger CM (2009) The risk concept and its application in naturalhazard risk management in Switzerland. Nat Hazards Earth Syst Sci 9(3):801–813
Brundl M, Bartelt P, Schweizer J, Keiler M, Glade T (2010) Snow avalanche risk analysis—review andfuture challenges. In: Alcantara-Ayla I, Goudie A (eds) Geomorphological hazards and disaster pre-vention. Cambridge University Press, Cambridge, pp 49–61
Buchele B, Kreibich H, Kron A, Thieken A, Ihringer J, Oberle P, Merz B, Nestmann F (2006) Flood-riskmapping: contributions towards and enhanced assessment of extreme events and associated risks. NatHazards Earth Syst Sci 6:485–503
BUWAL (Bundesamt fur Umwelt, Wald und Landschaft) (1999a) Risikoanalyse bei gravitative Naturge-fahren: Methode, Umweltmaterialen No 107/1 Naturgefahren, p 115
BUWAL (Bundesamt fur Umwelt, Wald und Landschaft) (1999b) Risikoanalyse bei gravitative Naturge-fahren: Fallbeispiele und Daten, Umweltmaterialen No 107/2 Naturgefahren, p 129
BUWAL, BWW, BRP (Bundesamt fur Umwelt, Wald und Landschaft, Bundesamt fur Wasserwirtschaft,Bundesamt fur Raumplanung) (1997) Berucksichtigung der Massenbewegungsgefahren bei raumw-irksamen Tatigkeiten. Bundesamt fur Umwelt, Wald und Landschaft, Bundesamt fur Wasserwirtschaft,Bundesamt fur Raumplanung, Bern und Biel
BWW, BRP, BUWAL (Bundesamt fur Wasserwirtschaft, Bundesamt fur Raumplanung, Bundesamt furUmwelt, Wald und Landschaft) (1997) Berucksichtigung der Hochwassergefahren bei raumwirksamenTatigkeiten. Bundesamt fur Wasserwirtschaft, Bundesamt fur Raumplanung, Bundesamt fur Umwelt,Wald und Landschaft, Biel und Bern
Cappabianca F, Barbolini M, Natale L (2008) Snow avalanche risk and mapping: a new method based on acombination of statistical analysis, avalanche dynamics simulation and empirically based vulnerabilityrelations integrated in a GIS platform. Cold Reg Sci Technol 54:193–205
Cardinali M, Reinbach P, Guzzetti F, Ardizzone F, Antonini G, Galli M, Cacciano M, Castellani M, SalvatiP (2002) A geomorphological approach to the estimation of landslide hazards and risks in Umbria,Central Italy. Nat Hazards Earth Syst Sci 2:57–72
Nat Hazards (2011) 58:645–680 677
123
CENAT (2004) Monte Verita Workshop 2004, Coping with Risks due to Natural Hazards in the 21stCentury, 28 November 2004–03 December 2004, GLOSSARY, http://www.cenat.ch/index.php?navID=824&userhash=41529&I=e
Corominas J, Copons R, Moya J, Vilaplana JM, Altimir J, Amigo J (2005) Quantitative assessment of theresidual risk in a rockfall protected area. Landslides 2:343–357
Crozier MJ (1999) Slope instability: landslides. In: Alexander D, Fairbridge RW (eds) Encyclopaedia ofenvironmental science. Dordrecht, pp 561–562
De Lotto P, Testa G (2000) Risk assessment: a simplified approach of flood damage evaluation with the useof GIS. Interpraevent 2:281–291
Deutsche Ruck (1999) Das Pfingsthochwasser im Mai 1999. Deutsche Ruckversicherung AGDouglas J (2007) Physical vulnerability modelling in natural hazard risk assessment. Nat Hazards Earth Syst
Sci 7:283–288Dutta D, Herath S, Musiake K (2003) A mathematical model for flood loss estimation. J Hydrol 277:24–49ER NZI (2004) Economic impacts on New Zealand of climate change-related extreme events. Focus on
fresh-water floods. New Zealand Climate Change Office, New ZealandFell R, Hartford D (1997) Landslide risk management. In: Dikau R, Brunsden D, Schrott L, Ibsen M-L (eds)
Landslide recognition. Identification, movement and causes. Wiley, Chichester p. 251FEMA (2007) Multi-hazard loss estimation methodology: flood model. HAZUS-MH MR3. Department of
Homeland Security, Federal Emergency Management Agency, USAFuchs S (2009) Susceptibility versus resilience to mountain hazards in Austria—paradigms of vulnerability
revisited. Nat Hazards Earth Syst Sci 9:337–352Fuchs S, Heiss K, Hubl J (2007) Towards an empirical vulnerability function for use in debris flow risk
assessment. Nat Hazards Earth Syst Sci 7:495–506Galli M, Guzzetti F (2007) Landslide vulnerability criteria: a case study from Umbria, Central Italy. Environ
Manage 40:649–664Glade T (2003) Vulnerability assessment in landslide risk analysis. Die Erde 134:123–146Glade T, Crozier M (2005) The nature of landslide hazard impact. In: Glade T, Anderson M, Crozier M
(eds) Landslide hazard and risk. Wiley, Chichester, pp 43–74Greenaway MA, Smith DI (1983) ANUFLOOD field guide. Centre of Resource and Environmental Studies,
Australian National University, CanberraGrunthal G, Thieken A, Schwarz J, Radtke K, Smolka A, Merz B (2006) Comparative risk assessment for
the city of Cologne—storms, floods, earthquakes. Nat Hazards 38:21–44Hollenstein K (2005) Reconsidering the risk assessment concept: standardizing the impact description as a
building block for vulnerability assessment. Nat Hazards Earth Syst Sci 5:301–307Hollenstein K, Bieri O, Stuckelberger J (2002) Modellierung der Vulnerabilitat von Schadobjekten
gegenuber Naturgefahrenprozessen. ETH Zurich, Forstliches IngenieurwesenHoller P (2007) Avalanche hazards and mitigation in Austria: a review. Nat Hazards 43:81–101Holub M, Fuchs S (2009) Mitigating mountain hazards in Austria—legislation, risk transfer, and awareness
building. Nat Hazard Earth Syst Sci 9:523–537Holub M, Hubl J (2008) Local protection against mountain hazards—state of the art and future needs. Nat
Hazard Earth Syst Sci 8:81–99Hooijer A, Li Y, Kerssens P, Van der Vat M, Zhang J (2001) Risk assessment as a basis for sustainable flood
management. 29th Annual congress of the international-association-of-hydraulic-engineering-and-research (IAHR), Bejing, China, pp 442–449
Hufschmidt G, Crozier M, Glade T (2005) Evolution of natural risk: research framework and perspectives.Nat Hazard Earth Syst Sci 5:375–387
IUGS (1997) Quantitative risk assessment for slopes and landslides-the state of the art. In: Cruden DM, FellR (eds) Landslide risk assessment. Roterdam, Balkema, pp 3–12
Iverson MR (1997) The physics of debris flows. Rev Geophys 35(3):245–296Jonasson K, Sigurosson S, Arnalds P (1999) Estimation of avalanche risk. Vedurstofu Islands n. R99001-
ur01, p 44Kang JL, Su MD, Chang LF (2005) Loss functions and framework for regional flood damage estimation in
residential area. J Mar Sci Technol 13:193–199Kaynia AM, Papathoma-Kohle M, Neuhauser B, Ratzinger K, Wenzel H, Medina-Cetina Z (2008) Prob-
abilistic assessment of vulnerability to landslide: application to the village of Lichtenstein, Baden-Wurttemberg, Germany. Eng Geol 101:33–48
Keiler M (2004) Development of the damage potential resulting from the avalanche risk in the period1950–2000, case study, Galtur. Nat Hazard Earth Syst Sci 4:249–256
Keiler M, Sailer R, Jorg P, Weber C, Fuchs S, Zischg A, Sauermoser S (2006) Avalanche risk assessment—a multi-temporal approach, results from Galtur, Austria. Nat Hazard Earth Syst Sci 6:637–651
678 Nat Hazards (2011) 58:645–680
123
Keiler M, Knight J, Harrison S (2010) Climate change and geomorphological hazards in the easternEuropean Alps. Philos Trans R Soc A 368:2461–2479
Kelman I, Spence R (2004) An overview of flood actions on buildings. Eng Geol 73:297–309Keylock CJ, Barbolini M (2001) Snow avalanche impact pressure-vulnerability relations for use in risk
assessment. Can Geotech J 38:227–238Leone F, Aste JP, Leroi E (1996) Vulnerability assessment of elements exposed to mass-movement:
working toward a better risk perception. In: Senneset K (ed) Landslides. Balkema, Rotterdam,pp 263–270
Liu X, Lei J (2003) A method for assessing regional debris flow risk: an application in Zhaotong of Yunnanprovince (SW China). Geomorphology 52:181–191
Macquarie O, Thiery Y, Malet JP, Weber C, Puissant A, Wania A (2004) Current practices and assessmenttools of landslide vulnerability in mountainous basins-identification of exposed elements with a semi-automatic procedure. In: Lacerda WA, Ehrlich M, Fontoura SAB, Sayao ASF (eds) Landslides:evaluation and stabilisation. Taylor and Francis Group, London, pp 171–176
Mavrouli O, Corominas J (2008) Structural response and vulnerability assessment of buildings in front of therock fall impact, Geophysical Research Abstract 10
McClung D, Schaerer P (1993) The avalanche handbook. The Mountaineers, Seattle, p 271Mejia-Navarro M, Wohl LEE, Oaks SD (1994) Geological hazards, vulnerability, and risk assessment using
GIS: model for Glenwood Springs, Colorado. Geomorphology 10:331–354Merz B, Kreibich H, Thieken A, Schmidtke R (2004) Estimation uncertainty of direct monetary flood
damage to buildings. Nat Hazards Earth Syst Sci 4:153–163Merz B, Kreibich H, Schwarze R, Thieken A (2010) Review article ‘‘Assessment of economic flood
damage’’. Nat Hazards Earth Syst Sci 10:1697–1724Messner F, Meyer V (2005) Flood damage, vulnerability and risk perception—challenges for flood damage
research. UFZ Discussion Paper. Umweltforschungszentrum Leipzig, HalleMeyer V, Scheuer S, Haase D (2009) A multicriteria approach for flood risk mapping exemplified at the
Mulde river, Germany. Nat Hazards 48:17–39Michael-Leiba, Baynes F, Scott G, Granger K (2003) Regional landslide risk to the cairns community. Nat
Hazards 30:233–249Middelmann-Fernandes M (2010) Flood damage estimation beyond stage-damage functions: an Australian
example. J Flood Risk Manage 3:88–96Papathoma-Kohle M, Neuhauser B, Ratzinger K, Wenzel H, Dominey-Howes D (2007) Elements at risk as a
framework for assessing the vulnerability of communities to landslides. Nat Hazards Earth Syst Sci7:765–779
Romang H (2004) Wirksamkeit und Kosten von Wildbach-Schutzmassnahmen.Verlag des GeographischenInstituts der Universitat Bern, p 212
Santos JG (2003) Landslide susceptibility and risk maps of Regua (Douro basin, NE Portugal). In:Proceeding of the IAG and IGU-C12 Regional Conference ‘‘Geomorphic hazards; towards theprevention of disasters’’, Mexico City, Mexico
Shrestha A (2005) Vulnerability assessment of weather disasters in Syangja District, Nepal: a case study inPutalibazaar Municipality, Advances Institute on Vulnerability to Global Environmental Change
Spichtig S, Brundl M (2008) Verletzlichkeit bei gravitativen Naturgefahren—eine Situationsanalyse. ProjektB5. Schlussbericht. Nationale Plattform Naturgefahren PLANAT, Bern
Sterlacchini S, Frigerio S, Giacomelli P, Brambilla M (2007) Landslide risk analysis: a multi-disciplinarymethodological approach. Nat Hazards Earth Syst Sci 7:657–675
Thieken A, Merz B, Grunthal G, Schwarz J, Radtke K, Smolka A, Gocht M (2005) A comparison of storm,flood and earthquake risk for the city of Cologne, Germany. In: Proceedings of the 1st ARMONIAconference, Barcelona, Spain
Turner II BL, Kasperson RE, Matson PA, McCarthy JJ, Corell RW, Christensen L, Eckley N, Kasperson JX,Luers A, Martello ML, Polsky C, Pulsipher A, Schiller A (2003) A framework for vulnerabilityanalysis in sustainability science. In: Proceedings of the national academy of sciences, 100(14)
UNDHA (1992) Internationally agreed glossary of basic terms related to disaster management. UnitedNations Department of Humanitarian Affairs
UNDRO (1984) Disaster prevention and mitigation—a compendium of current knowledge, vol 11. Pre-paredness Aspects, New York
Uzielli M, Nadim F, Lacasse S, Kaynia AM (2008) A conceptual framework for quantitative estimation ofphysical vulnerability to landslides. Eng Geol 102:251–256
Varnes D J (1984) Landslide hazard zonation: a review of principles and practice. Natural Hazards, 3, Paris,UNESCO, p 63
Nat Hazards (2011) 58:645–680 679
123
Weichselgartner J (2001) Disaster mitigation: the concept of vulnerability revisited. Disaster PreventManage 10(2):85–94
White G (1945) Human adjustment to floods—a geographical approach to the flood problem in the UnitedStates. Research Paper No. 29. University of Chicago, USA
Wilhelm C (1997) Wirtschaftlichkeit im Lawinenschutz, Mitteilungen des Eidgenossisches Institut furSchnee- und Lawinenforschung, 54, Davos
WMO (1999) Comprehensive risk assessment for natural hazards. Technical document, no. 955. WorldMeteorological Organisation
Zezere JL, Garcia RAC, Oliveira SC, Reis E (2008) Probabilistic landslide risk analysis considering directcosts in the area north of Lisbon (Portugal). Geomorphology 94:467–495
Zhai G, Fukozono T, Ikeda S (2006) An empirical model of fatalities and injuries due to floods in Japan.J Am Water Resour As 42:863–875
680 Nat Hazards (2011) 58:645–680
123